rochester climate vulnerability assessment
TRANSCRIPT

ROCHESTER CLIMATE VULNERABILITY ASSESSMENT
STAKEHOLDER ENGAGEMENT WORKSHOPMarch 14, 2018

Workshop AgendaI. WelcomeII. IntroductionsIII. Overview of the Rochester Climate Vulnerability Assessment
ProjectIV. Presentation of climate change data & open discussion on
potential climate impactsV. Presentation & open discussion on the recommendations of
planning focus areas, systems, and critical assets/resourcesVI. Wrap up & next steps

Introductions

Project Team Anne E. Spaulding, Manager of Environmental Quality, Division of Environmental Quality
Melissa Chanthalangsy, Energy and Sustainability Analyst, Division of Environmental Quality
Susan R. Hopkins, Project Manager
M. André Primus, Planner
Kari Hewitt, Director of Sustainability
Van H. Du, Sustainability Planner

Role of the Stakeholder Committee
I. Provide guidance, technical expertise, and feedback on the CVA
II. Connect the Project Team with key stakeholder groups III. Participate in two workshopsIV. Participate in Project outreach

Overview

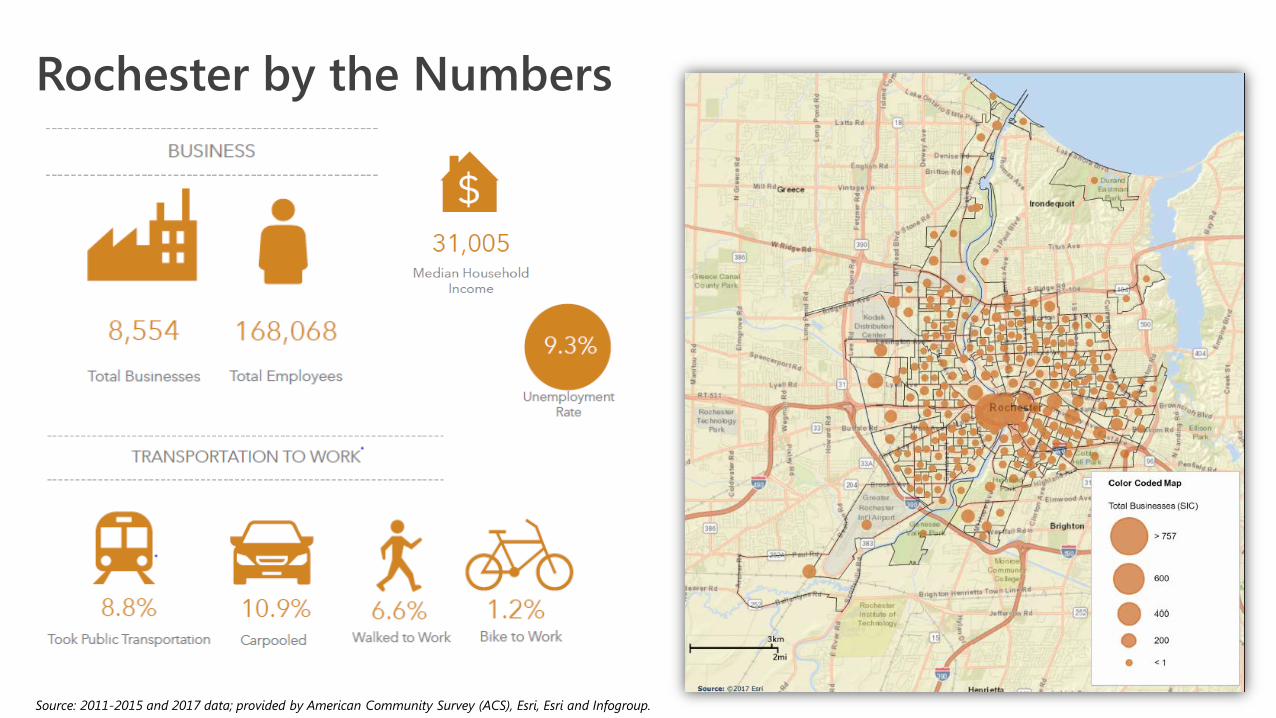
Rochester by the Numbers
Source: 2011-2015 and 2017 data; provided by American Community Survey (ACS), Esri, Esri and Infogroup.
Rochester by the Numbers
Source: 2011-2015 and 2017 data; provided by American Community Survey (ACS), Esri, Esri and Infogroup.

Rochester by the Numbers
Source: 2011-2015 and 2017 data; provided by American Community Survey (ACS), Esri, Esri and Infogroup.
Rochester City, NY Monroe County, NY Syracuse City, NY Buffalo City, NY
Total Population 210,249 755,765 146,839 260,428Households with Population Age 65+ 6,746 40,160 4,903 10,610
Households with Disability 26,494 71,963 16,369 33,891Households Below the Poverty Level 25,478 42,178 16,463 31,881
Total Businesses 8,554 27,188 6,022 8,041Total Employees 168,068 472,159 126,743 181,7392017 Median Household Income $31,005 $54,939 $30,979 $31,6742017 Unemployment Rate 9.3% 5.3% 7.7% 8.8%
Households with No Vehicles 1,855 5,601 1,511 5,175% of Workers Took Public Transportation 8.8% 2.9% 9.4% 11.7%% of Workers Carpooled 10.9% 7.7% 9.4% 11.0%% of Workers Biked 1.2% 0.5% 1.1% 1.1%% of Workers Walked 6.6% 3.2% 11.1% 6.1%

Rochester Climate Vulnerability Assessment (CVA)• Continuation of the City of Rochester’s
climate planning efforts• Supporting the adaptation and resiliency
component of the Community-wide Climate Action Plan
• Better understanding of the City’s vulnerabilities and adaptive capacity
• Serving as guide to the City’s capital project planning
• Making sure Rochester is a resilient city

Rochester CVA Approach
Investigate Identify & Assess Prioritize for Action
Understanding of baseline and projected climate
conditions
Identifying critical systems and assets
Determining level of exposure, sensitivity, and
adaptive capacity of these systems & assets due to
potential climate impacts
Setting a stage for prioritization of adaptation
actions
Stakeholder Engagement

Stakeholder Engagement & Schedule
Pre-Engagement Interviews – February • Technical Advisory Committee Workshop #1 – March• Targeted Focus Groups (3-5) – March/April • Technical Advisory Committee Workshop #2 – May • Public Meeting – August/September • Final CVA Report – September

Climate Trends & Projections

Regional and Local Climate Trends• Increase in average annual temperature
observed in all regions across the state of New York.
• Statewide average annual temperature has increased approximately 2.4°F since 1970, with winter warming exceeding 4.4°F.
• Spring has been starting earlier and winter snow cover is decreasing compared to a few decades ago.
• The average freeze-free season length during 1991-2010 was approximately 10 days longer than during 1961-1990.
• Since 2006, Lake Ontario has remained below 30% ice-cover (except during the cold 2013–2014 winter).
Observed Winter Temperature
Observed Summer Temperature
Source: CICS-NC and NOAA NCEI

Regional and Local Climate Projections
Source: NYSERDA ClimAID 2014 ReportNOAA NCA 3
Baseline(1971 – 2000)
Mid-Century(2050 – 2079)
End of Century(2080 – 2100)
Average Annual Temperature 47.7°F 52°F to 54°F 54°F to 59.4°F
Number of Days ≥ 90°F 8 days 22 to 34 days 27 to 57 daysNumber of Days ≤ 32°F 133 days 86 to 96 days 68 to 88 daysNumber of Heatwaves ≤ 1 event 3 to 4 events 3 to 8 eventsDuration of Heatwaves 4 days 4 to 5 days 4 to 6 days
• Increase in temperatures
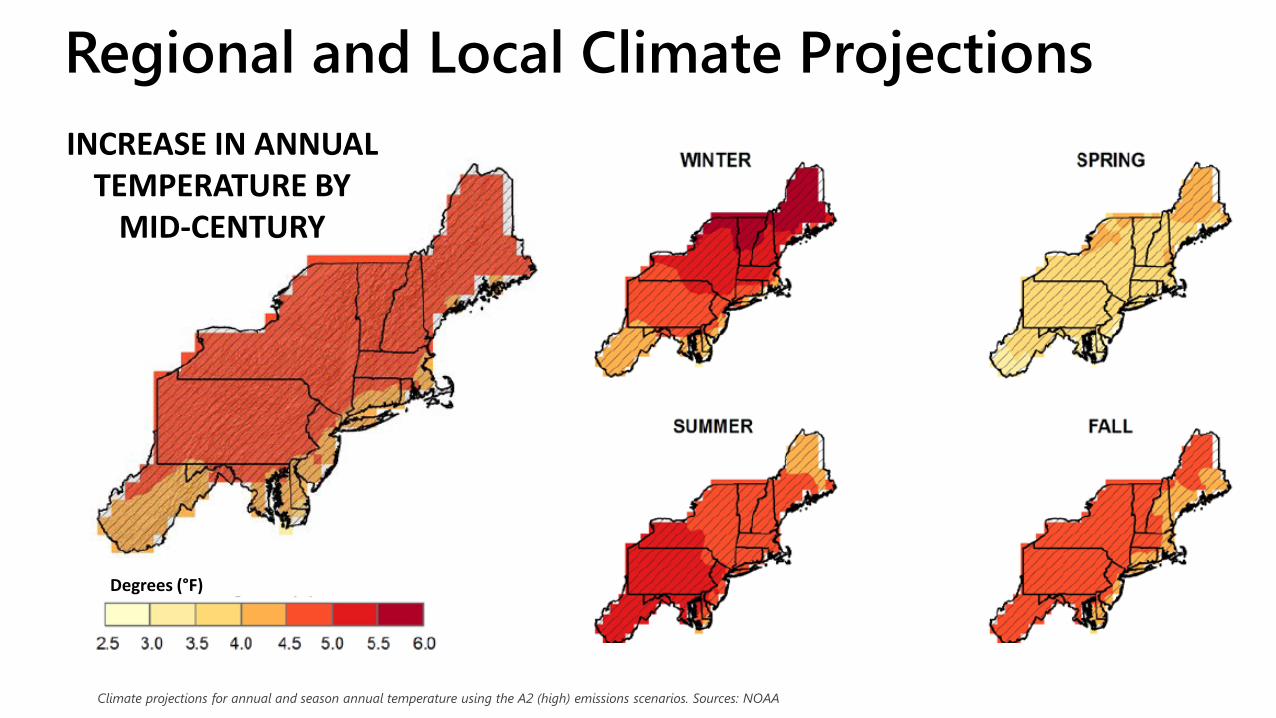
Regional and Local Climate Projections
Degrees (°F)
Climate projections for annual and season annual temperature using the A2 (high) emissions scenarios. Sources: NOAA
INCREASE IN ANNUAL TEMPERATURE BY
MID-CENTURY

Potential Climate Impacts from Increased Temperature Days & Duration
• Increase in pollen production which may exacerbate asthma, allergies, and other respiratory conditions
• Changes or loss of ecosystems and biodiversity (especially in nearby Lake Ontario)• Quality of soil and crop yields reduced• Increased demand for water for irrigation • Depletion of water supply• Increase in public health and safety risks, particularly for the elderly, children, and pregnant
women populations• Urban heat island effects • Increase in growing season, but potential shift in crop production and livestock areas due to
climate shift• Reduced demand for heating (reduced energy consumption), but at the same time, energy
demand for cooling may increase• More frost heaves and potholes on road and bridge surfaces due to more freeze-thaw conditions

Regional and Local Climate Trends• Statewide annual precipitation has ranged
from a low 31.6 inches in 1964 to a high of 55.7 inches in 2011.
• Increase in average annual precipitation since 1900, at a rate of 0.4 inches per decade during 1895-2011.
• The wettest multi-year period was 2007-2011 with an average of 46.04 inches, compared to the statewide annual average of 40 inches.
• More extreme precipitation and more frequent flooding (including from rivers) being experienced.
• While Rochester was not in the direct path of Hurricane Irene in August 2011, the City experienced flooding from remnants of the storm (and other tropical systems).
Observed Annual Precipitation
Observed Number of Extreme Precipitation Events
Source: CICS-NC and NOAA NCEI

Regional and Local Climate Projections
Baseline(1971 – 2000)
Mid-Century(2050 – 2079)
End of Century(2080 – 2100)
Average Annual Precipitation 34 inches 4% to 10% increase 4% to 19% increase
Days per Year with Over 1” Rainfall 5 days 5 days 5 to 6 days
Extreme weather events 2-3 times more frequent by end of centuryAnnual snowfall Less frequent snowfall, shorter snow seasonDrought Increase in short-duration drought during summer season by end of
century
• Changes in precipitation
Source: NYSERDA ClimAID 2014 ReportNOAANCA 3

Regional and Local Climate ProjectionsCHANGES IN ANNUAL
PRECIPITATION BY MID-CENTURY
Climate projections for annual and season annual temperature using the A2 (high) emissions scenarios. Sources: NOAA

Potential Climate Impacts from Changing Frequency and Intensity of Precipitation
• Increase in sediment and contaminants in water bodies• Increase in soil erosion and runoff due to greater flood or flash flood risk • Potential sanitary sewers and stormwater management systems overflow, pollutant run-
offs, and therefore putting water quality and recreational activities at risk• Increase in mold problems in homes and businesses• Increase in travel delays • Potential damage to power plants, rail lines, trees, during extreme weather events

Pre-Engagement Interviews:What we heard

How is Rochester most vulnerable?
FloodingIncreased temperaturesEnergy grid Disruptions to agriculture Influx of people who have been impacted due to impacts of climate
change in other locations (i.e. Puerto Rico) Already strained services become even more strained during a crisis
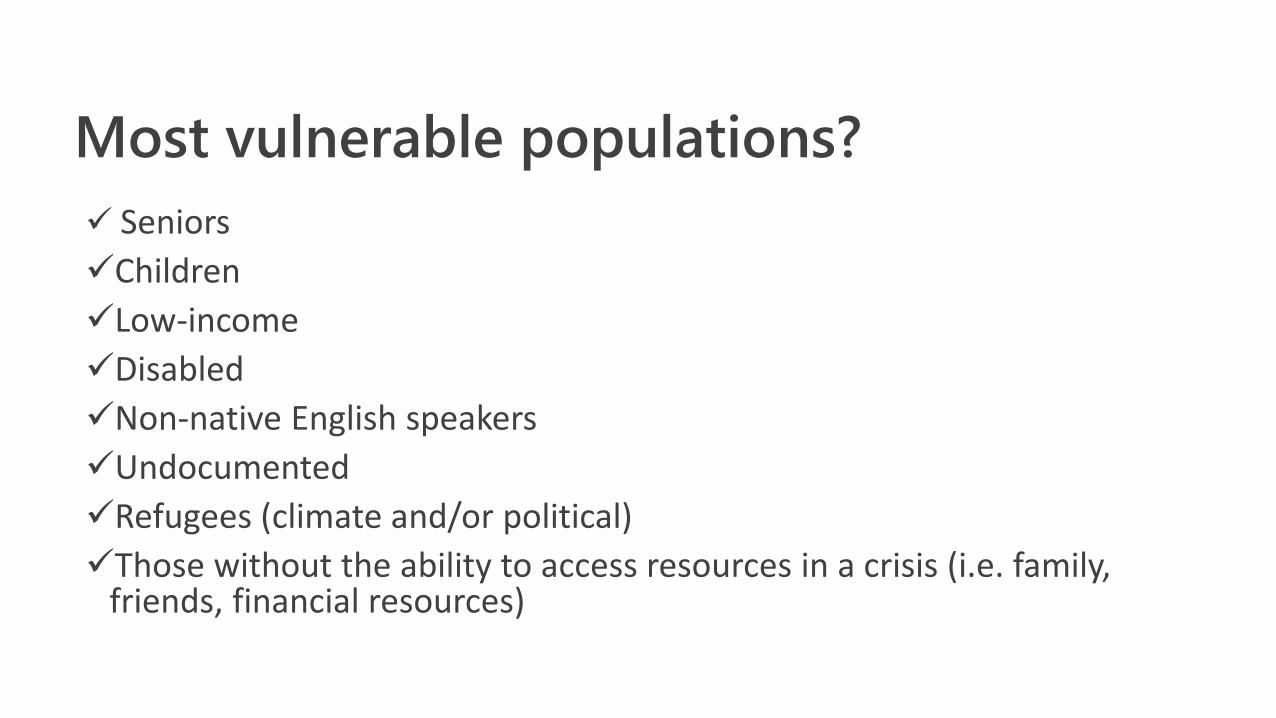
Most vulnerable populations? SeniorsChildrenLow-incomeDisabledNon-native English speakersUndocumented Refugees (climate and/or political) Those without the ability to access resources in a crisis (i.e. family,
friends, financial resources)
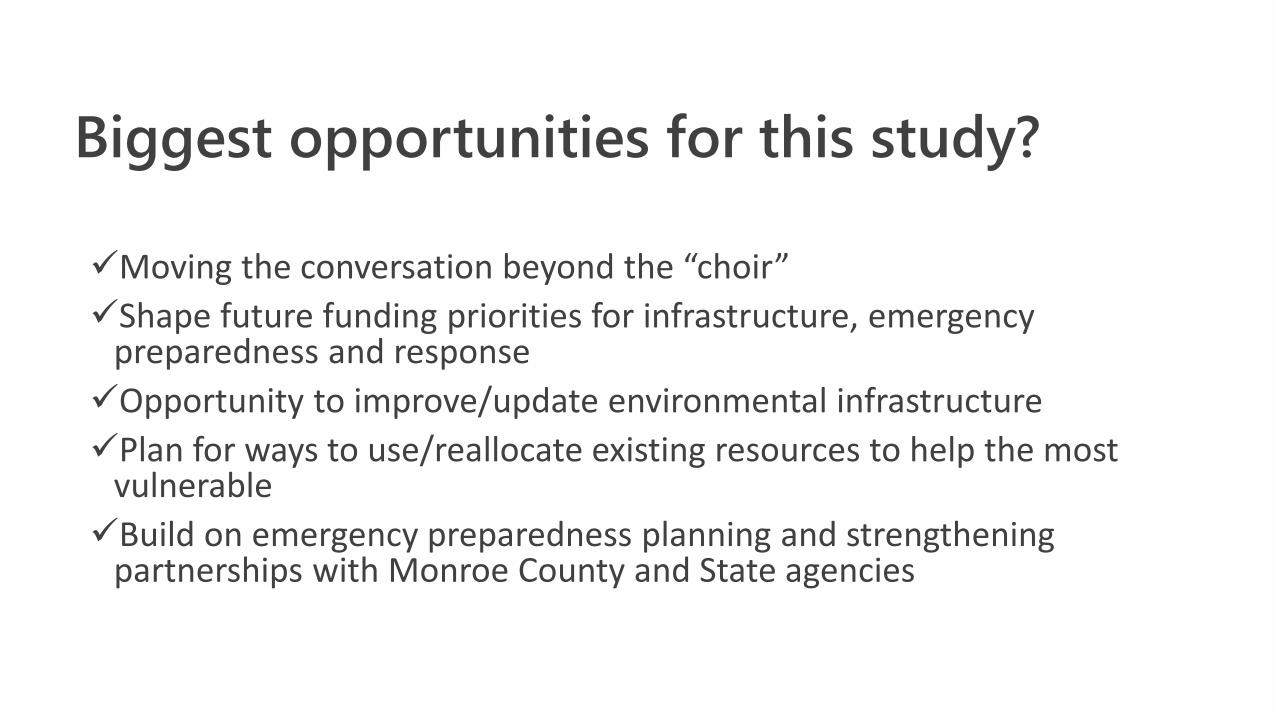
Biggest opportunities for this study?
Moving the conversation beyond the “choir”Shape future funding priorities for infrastructure, emergency
preparedness and responseOpportunity to improve/update environmental infrastructure Plan for ways to use/reallocate existing resources to help the most
vulnerable Build on emergency preparedness planning and strengthening
partnerships with Monroe County and State agencies

Open Discussion
• Which other present and potential implications of climate change impacts do we need to consider for Rochester?
• Who are the most vulnerable populations?
• What do you find most surprising from this climate data overview?
Recommendations of Planning Subject Areas,
Systems and Sub-systems

Rochester CVA - Planning Subject AreasPLANNING SUBJECT AREAS
INFRASTRUCTURE NATURAL RESOURCES SOCIOECONOMIC
SYSTEMS
Transportation Environmental Resources Public HealthUtilities Natural Habitat EconomyWater Recreational & Open Spaces Cultural Resources
Building & Facilities Social System/Human Services

System Sub-System / Sector Key Assets
TRANSPORTATION
Road and bridges • Major roadways:• NY State Routes• Major arterials in the City
• Bridges
Public transportation
• Regional Transit Service (RTS) – Monroe routes• RTS Transit Center
Highway • I-390, I-490, I-590• New York State Thruway
Bike/pedestrian network
• Genesee Riverway Trail
Airport & port • Greater Rochester International Airport (ROC)• Port of Rochester• Amtrak Rochester Station• Greyhound/Trailways Bus Station
Railways • CSX railroad

System Sub-System / Sector Key Assets
UTILITIES
Energy • RG&E Transmission and Distribution Infrastructure
• RG&E hydropower plants• Eastman Business Park energy generation
systems• Rochester District Heating Cooperative
(RDH) infrastructure• University of Rochester cogeneration
facility
Telecommunications • Emergency Response & Communication Systems

System Sub-System / Sector Key Assets
WATER
Water Supply • Cobbs Hill, Highland Park, and Rush Reservoirs (and Hemlock and Canadice Lakes)
• Hemlock Water Filtration Plant• Pump stations
Wastewater • Northwest Quadrant and VanLare WWTF• Sanitary sewer system*
Stormwater • Storm drains• Storm sewer system*• Outfalls
Dam • Mount Morris Dam

System Sub-System / Sector Key Assets
BUILDING & CRITICAL FACILITIES
Commercial • Eastman Business Park• Major businesses• Commercial corridors and districts
Residential • Senior centers• Homeless shelters
Industrial • Eastman Business Park• Gleason Works• RF Harris Communications• Delphi
Institutional • University of Rochester• Rochester Institute of Technology• Monroe Community College• K-12 Schools
Critical Facilities • UR-Strong Memorial Hospital• Rochester General Hospital• Highland Hospital• Emergency Response Facilities (Fire stations, police stations, designated community centers, cooling centers)
Municipal / Public Facilities • Neighborhoods• Community centers

System Sub-System / Sector Key Assets
ENVIRONMENTAL RESOURCES
Waterway • Genesee River• Irondequoit Bay• Lake Ontario• Erie Canal
Wetlands • State regulated freshwater wetlands
Urban forest • Street trees• Park trees
Conservation land • Conkey Corner Park• El Camino• Local Waterfront Revitalization Program (LWRP) designated areas
System Sub-System / Sector Key Assets
NATURAL HABITAT Sensitive and Rare Habitats
System Sub-System / Sector Key Assets
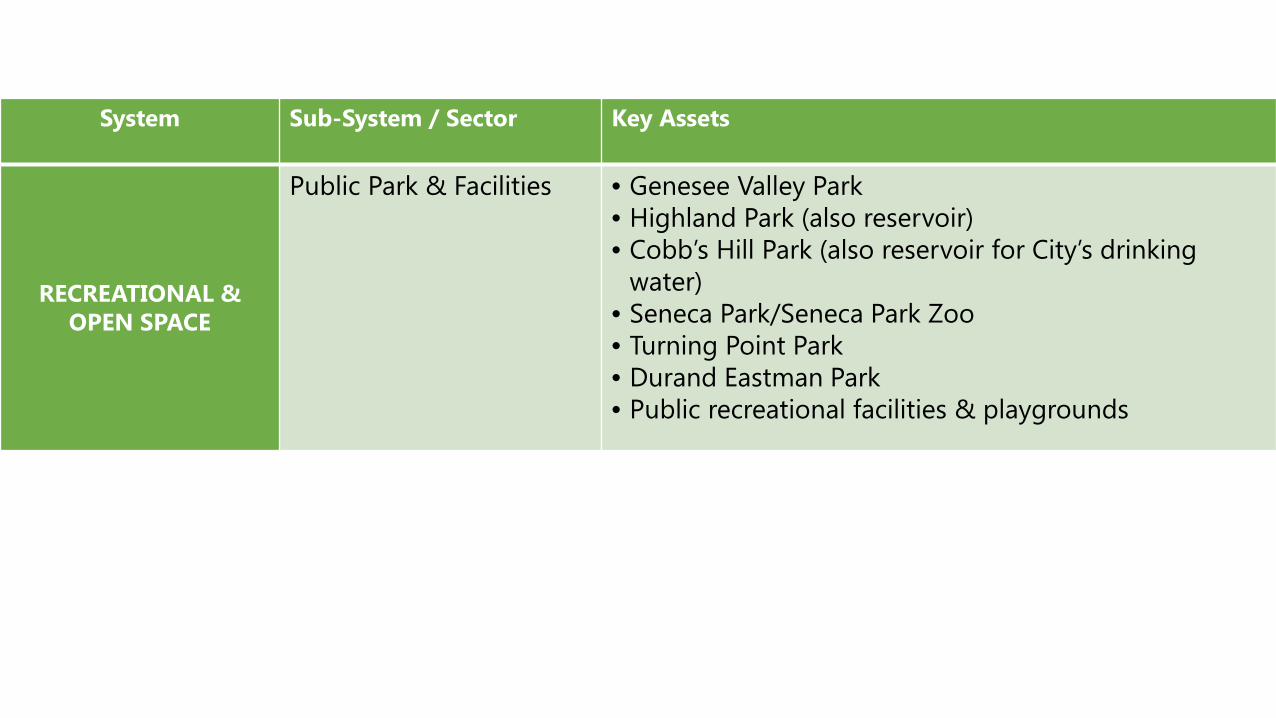
RECREATIONAL & OPEN SPACE
Public Park & Facilities • Genesee Valley Park • Highland Park (also reservoir)• Cobb’s Hill Park (also reservoir for City’s drinking
water)• Seneca Park/Seneca Park Zoo• Turning Point Park• Durand Eastman Park• Public recreational facilities & playgrounds

System Sub-System / Sector Key Assets
PUBLIC HEALTH
Health services • Health care providers• Health clinics• Monroe County Department of Public Health
Emergency services • Public safety, fire and police officers/volunteers• Community Emergency Response Team (CERT)• Emergency Communications Center (911 facility)
Air quality • N/A
System Sub-System / Sector Key Assets
SOCIAL SYSTEM/HUMAN
SERVICES
Food systems • Community gardens• Food pantries / Emergency food pantries, soup
kitchens• Rochester Public Market • Local farmer’s markets

System Sub-System / Sector Key Assets
CULTURAL RESOURCES
• The Strong Museum• Rochester Museum and Science Center• Memorial Art Gallery• Preservation Districts: Designated buildings of
historic values (DBHV)• Heritage Trail
System Sub-System / Sector Key Assets
ECONOMY
Access to services • Community gardens• Food pantries / Emergency food pantries, soup
kitchensJobs/Workforce
Key industries / employers

Next Steps
I. Conducting focus group discussionsII. Conducting sensitivity and adaptive capacity analysis
(Stakeholder Engagement Workshop #2)III. Preparing a Draft Final ReportIV. Hosting an public open house/workshop to solicit community
feedbackV. Developing Final CVA Report