romania eu funding
TRANSCRIPT

8/13/2019 Romania EU Funding
http://slidepdf.com/reader/full/romania-eu-funding 1/32
1
The Impact of EU Funds on Romanian
Finances
By Laurian Lungu
June 2012
The views expressed herein are those of the author. I would like to thank Ella Kallai and Valentin Lazea for
their useful comments on an earlier draft of the paper. All remaining errors are the author’s alone.

8/13/2019 Romania EU Funding
http://slidepdf.com/reader/full/romania-eu-funding 2/32

8/13/2019 Romania EU Funding
http://slidepdf.com/reader/full/romania-eu-funding 3/32
3
List of Abbreviations Used in the Text
CAP Common Agricultural Policy
CF Cohesion FundsEAGF European Agricultural Guarantee Fund
EAFRD European Agricultural Fund for Rural Development
EFF European Fund for Fisheries
EC European Commission
EU European Union
GNI Gross National Income
MEA Ministry of European Affairs
MFF Multiannual Financial Framework
NDP National Development Plan
NMS New Member StatesTOR Traditional own resources
VAT Value Added Tax

8/13/2019 Romania EU Funding
http://slidepdf.com/reader/full/romania-eu-funding 4/32

8/13/2019 Romania EU Funding
http://slidepdf.com/reader/full/romania-eu-funding 5/32
5
Another issue addressed is the impact of the EU funds on Romanian GDP and employment.
After more than five years this impact appears to be modest and below initial expectations.
Part of the reason the full potential of EU funds has remained unfulfilled for so long relates to
issues of domestic governance. Sorting out this problem should constitute a priority for the
Romanian authorities. Thus, maximising the impact of the EU funds by markedly improvingthe administrative capacity to control projects and ensuring efficient project allocation and
implementation should get pre-eminence. It makes little sense to advocate an increase in the
size of the EU budget if there was a high probability that domestic constraints to funds
absorption would lead, anyway, to a disengagement of future EU funds2.
The paper is structured as follows. Section 2 provides an overview of the current state of EU
funds absorption and lists some of the main causes which hindered the absorption process.
Section 3 highlights the proposed changes to the next MFF and describes briefly the proposed
changes in the management of the EU Funding. Section 4 addresses the fiscal implications of
the EU Funds on Romania’s budget over the 2014-2020 period. It quantifies the direct coststo the Romania’s budget and assesses the implications for the budget deficit under different
scenarios by varying the size of the EU budget, Romanian GDP growth and co-financing
rates. Section 5 looks at the impact of the EU funds on Romania’s economic growth and
employment. The final section concludes and puts forward several policy implications.
2. Romania’s EU Funds Absorption in the Current Fiscal Exercise
This section provides a brief overview on Romania’s net financial position with the EU and
the current state of implementation of EU Funds by Romania. Over the 2007-2013 period
Romania was allocated EUR 19.67 Bn in structural and cohesion funds and, after more than
five years, Romania’s payment ratio3 is one of the lowest among the 10 Central and Eastern
European (CEE) countries while the contracting ratio stands below CEE average.
Regarding the latter however, there is a large asymmetry among different operational
programmes. According to the data from the Ministry of European Affairs, at the end of
March 2012 the contracting ratio for ‘Human Resource Development’ programme stood at
84% while that for the ‘Transport’ sector was only 40%.
Although Romania is a net beneficiary of EU funds, the current absorption rate of the EU
funds is low4. Section 2.3 below lists some of the determinants which have impeded the
realisation of a higher absorption rate. To avoid losing EU funds, Romania would need to
absorb around EUR 16.5 Bn. for the Cohesion Policy and EUR 5.7 Bn for the Pillar 2 of CAP
by the end of 2015, when disbursements to the current financial exercise end.
2 There is also a broader question often asked in empirical analyses, namely to what extent the EU funds have
helped achieving their stated objective of fostering economic growth and promoting convergence. This aspect
is not addressed here. 3
The ratio between the amount actually paid by the EC and the total allocated for the current fiscal exercise.4 For comparison of the state of EU funds absorption across 10 CEE countries see for instance KPMG (2010)

8/13/2019 Romania EU Funding
http://slidepdf.com/reader/full/romania-eu-funding 6/32

8/13/2019 Romania EU Funding
http://slidepdf.com/reader/full/romania-eu-funding 7/32
7
Romania’s total contributions to the EU budget for the period 2007-2013 should average a
little over EUR 1.2 Bn. annually, representing on average, the equivalent of approximately
0.95% of GDP. The nominal amount of VAT resource paid would depend, indirectly, on
economic growth, and the level of domestic VAT.
Romania’s payments from the EU together with the net balance data are presented in Table
2.2 below. Forecasts for Structural and Cohesion Funds for the years 2012 and 2013 assume a
significant increase in the nominal amounts, compared to previous years. This would only be
possible if the existing systematic irregularities found by the EC in a series of public
acquisitions processes were swiftly addressed. In nominal terms, net payments had been on a
rising trend until 2009. Sums received from the EU were marginally higher in 2011 but,
given the ‘n+2’ rule, representing the years by which funds must be spent, the amounts
absorbed should have been much higher 7. The EU payments of structural and cohesion funds
in both 2010 and 2011 was a little over EUR 550 Mill., lower than in the two preceding
years. Direct payments to farmers (Pillar 1 of CAP) are expected to increase over the 2011-2013 period when compared to the previous three years.
Table 2.2 Romania’s Payments from the EU and the Net Balance, Mill EUR, current prices
2007 2008 2009 2010 2011e
2012*
2013*
Pre-
accession
funds
789.1 744.8 618.9 277.8 201.7 0 0
Structural
and
CohesionFunds
451 684.8 965.2 566.8 579.7 1,669.3 2,948.9
CAP
Payments,
of which:
6.9 1,620.7 2,098.9 2087 2,749.0 2,812.0 2,628.0
EAGF(a) 6.9 474 596.2 670.8 1,720.0 1,605.0 1,241.0
EAFRD
and
EFF(b)
1,146.7 1,502.7 1,401.6 771.8 905.3 1,040.3
Total EU
payments
1,602.4 2,666.2 2,951.2 2,317.4 3,273.2 4,179.5 5,230.1
Net EU
Payments(d)
Mill EUR 513.0 1,448.6 1,608.9 1,174.3 1,981.9 2,855.7 3,872.5
% of GDP 0.4 1.0 1.4 0.9 1.5 2.0 2.6
* - forecast, author’s calculations and data from the Budget Report 2011;. e – estimated.
a – European Agricultural Guarantee Fund (EAGF)
b – European Agricultural Fund for Rural Development (EAFRD) and European Fund for Fisheries (EFF)
d – Obtained by subtracting total own resources (Table 2.1) from total payments from the EU.
7 It is well acknowledged that programmes rarely start in full flow at the beginning of the year they were
budgeted. In general, programmes’ expenditure in the early months tends to be slow and this generates morepressure on programmes to perform in subsequent years, in order to avoid the loss of funds through the n+2
rule.
8/13/2019 Romania EU Funding
http://slidepdf.com/reader/full/romania-eu-funding 8/32
8
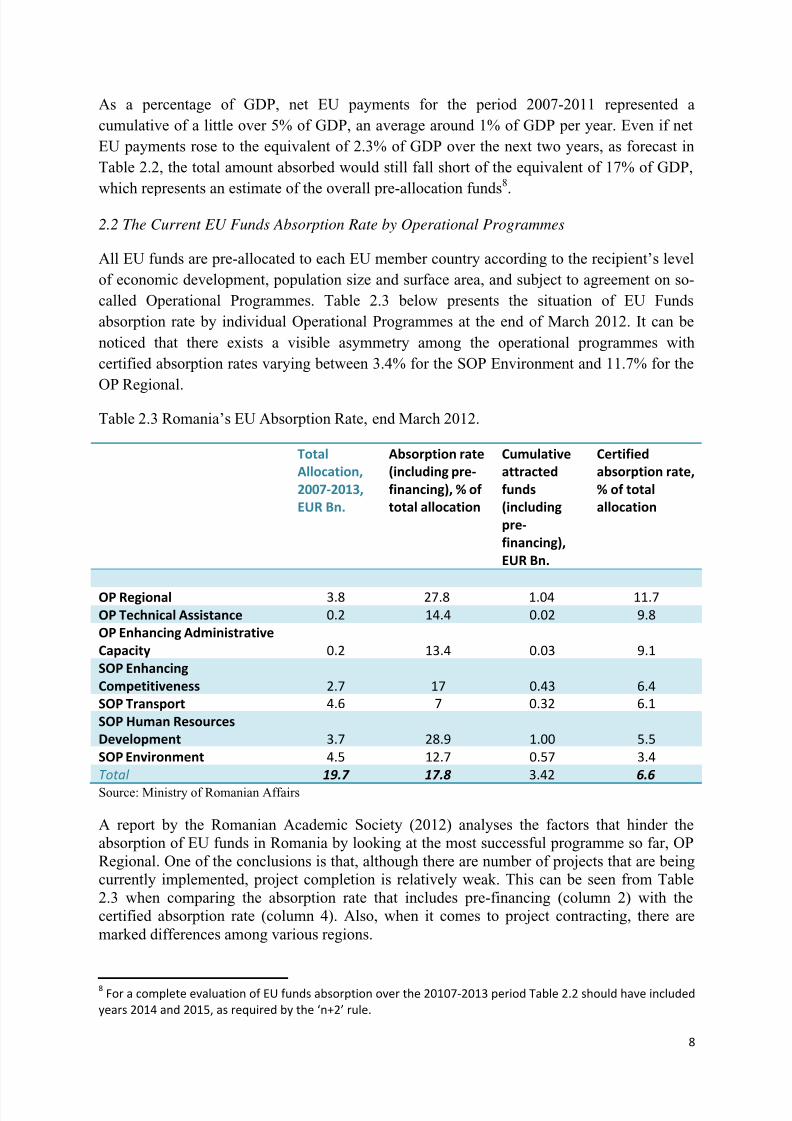
As a percentage of GDP, net EU payments for the period 2007-2011 represented a
cumulative of a little over 5% of GDP, an average around 1% of GDP per year. Even if net
EU payments rose to the equivalent of 2.3% of GDP over the next two years, as forecast in
Table 2.2, the total amount absorbed would still fall short of the equivalent of 17% of GDP,
which represents an estimate of the overall pre-allocation funds
8
.
2.2 The Current EU Funds Absorption Rate by Operational Programmes
All EU funds are pre-allocated to each EU member country according to the recipient’s level
of economic development, population size and surface area, and subject to agreement on so-
called Operational Programmes. Table 2.3 below presents the situation of EU Funds
absorption rate by individual Operational Programmes at the end of March 2012. It can be
noticed that there exists a visible asymmetry among the operational programmes with
certified absorption rates varying between 3.4% for the SOP Environment and 11.7% for the
OP Regional.
Table 2.3 Romania’s EU Absorption Rate, end March 2012.
Total
Allocation,
2007-2013,
EUR Bn.
Absorption rate
(including pre-
financing), % of
total allocation
Cumulative
attracted
funds
(including
pre-
financing),
EUR Bn.
Certified
absorption rate,
% of total
allocation
OP Regional 3.8 27.8 1.04 11.7
OP Technical Assistance 0.2 14.4 0.02 9.8
OP Enhancing Administrative
Capacity 0.2 13.4 0.03 9.1
SOP Enhancing
Competitiveness 2.7 17 0.43 6.4
SOP Transport 4.6 7 0.32 6.1
SOP Human Resources
Development 3.7 28.9 1.00 5.5
SOP Environment 4.5 12.7 0.57 3.4
Total 19.7 17.8 3.42 6.6
Source: Ministry of Romanian Affairs
A report by the Romanian Academic Society (2012) analyses the factors that hinder the
absorption of EU funds in Romania by looking at the most successful programme so far, OP
Regional. One of the conclusions is that, although there are number of projects that are being
currently implemented, project completion is relatively weak. This can be seen from Table
2.3 when comparing the absorption rate that includes pre-financing (column 2) with the
certified absorption rate (column 4). Also, when it comes to project contracting, there are
marked differences among various regions.
8 For a complete evaluation of EU funds absorption over the 20107-2013 period Table 2.2 should have included
years 2014 and 2015, as required by the ‘n+2’ rule.

8/13/2019 Romania EU Funding
http://slidepdf.com/reader/full/romania-eu-funding 9/32
9
At the end of 2011 Romania had the weakest cohesion funds absorption performance among
EU countries with an absorption rate of just 16.5% compared to an average EU rate of
33.4%9.
2.3 Obstacles to the EU Funds Absorption Process
Although the absorption of EU funds has improved gradually over the last year, the certified
absorption rate by the EC continues to remain weak. In September 2011 the Romanian
Parliament approved the creation of the Ministry of European Affairs (MEA), with the aim of
accelerating the absorption of EU funds. This decision highlighted the dire state of affairs in
the EU funds absorption process and the urgent necessity to address the existing flaws, which
hampered the increase in Romania’s effective absorption rate10. However, the existing
structural deficiencies in the institutional architecture of EU management funds rendered
MEA’s role to one in which it exerted an influence focused more on control and coordination.
A measure which could have had a positive impact on the absorption rate was thecentralisation of activities from the existing seven management authorities. The main obstacle
in achieving this objective however, was the requirement to obtain new accreditation from the
EU for the newly set-up authorities. Such an option was not feasible due to the length of time
required to obtain new EU accreditation11. Nevertheless this option should be seriously
considered as a structural measure to improve EU funds absorption during the EU’s next
financial exercise 2014-2020.
The causes of a weak utilisation of EU funds are various and Romania is, on almost all
accounts, a relatively poor performer having difficulties at all levels of programme
implementation, starting with the evaluation and selection of the projects. There are a number
of papers which identify the causes of the weak EU absorption. (see for instance Socol et. all
2009, Georgescu G. 2009 or Zaman G. and Cristea A. 2011) The lack of administrative
capacity has also been one of the main reasons for the poor EU funds absorption12. Among
the most relevant causes for the observed dismal rate of EU funds disbursement are:
Poor strategic planning and uncorrelated objectives. One reason for the low absorption
funds rate has been the initial poor planning and setting of strategic objectives in the National
Development Plan 2007-2013. These failed to meet, in a satisfactory manner, the objectives
laid down in the Operational Programmes. This resulted in a funds allocation mismatch,which the authorities have recently addressed by negotiating with the EC a reallocation of EU
9 http://ec.europa.eu/regional_policy/newsroom/detail.cfm?id=165 (accessed at 29 April 2012). Including claims
pending at the end of 2011 and aimed at being paid on 2012 credits.10
The Ministry of Romanian Affairs was set up at a time when payments from the Regional Operational
Programme were suspended by the EC due to systematic irregularities found in the public acquisitions
processes. Subsequently, the financing of Human Resource Development Operational Programme was
interrupted by the EC on concerns about costs misallocation. 11
SOP Transport, for instance, was accredited in August 2009, more than two years and a half after Romania’s
EU accession.12 Romania has a specially designed Operational Programme, designed to improve administrative capacity, with
an EU allocation of EUR 0.2 billion where the absorption is somewhat better.

8/13/2019 Romania EU Funding
http://slidepdf.com/reader/full/romania-eu-funding 10/32
10
funds between operational programmes13. Such actions would support the finance of
additional needs that occurred and were not envisaged for financing within the current 2007-
2013 programming period.
Insufficient administrative capacity. The local authorities’ capacity to implement EU
project varies greatly across regions and operational programmes14. There were long delays
in the setting-up of inter-community development associations, an institutional prerequisite at
the project application stage, for water/waste management projects. In many cases local
authorities failed to provide timely guidelines and the necessary supporting methodology to
the applicants.
Limited expertise capacity at central and local administration. There is a lack of qualified
personnel, especially at the local level of public authorities. This issue is compounded by the
poor quality of strategic planning and designing and enforcement of multi-annual budgets.
Limited accountability of public procurement agencies in the tendering process. Theresponsibility of state structures dealing with public acquisitions in the EU funds managing
mechanism was notoriously absent. This led to a string of contested tenders and long delays
in project implementation. An inquiry by the EC has found that errors in the public
acquisitions mechanism were systematic. Recently, authorities’ efforts have focused on
improving monitoring and increased accountability of public procurement agencies in the
tendering process while also developing standard bidding documents.
The lack of project experience of both management authorities and beneficiaries . There
are noticeable differences among state institutions which managed funds prior to Romania’s
EU accession and those which have not. Beneficiaries have often run into difficulties at the
project preparation and implementation stages due to procedural complications. Moreover,
modifications in the national legislation often were not reflected in the applicants’ guides.
This generated a significant delay in the launch of project applications.
Financing constraints. The on-going economic crisis and the need for bank restructuring
made access to credit for co-financing EU projects more difficult. In addition, the applicants
are reluctant to commit own funds to co-finance projects even though the individual
financing shares are small. Such reluctance to shoulder any risk by the applicants could
render bank financing more difficult.
Long periods of time for project evaluation, selection and contracting processes. The
timeframe used to be up to ten months from the submission until notification of the results.
Payment disbursements to beneficiaries were also taking more than 60 days. A recent
Government Ordinance shortened this period of time to a maximum of 45 days.
Project evaluation and prioritisation. The limited absorption rate and administrative
resources put a strain on the effectiveness of project implementation. Recently, the authorities
13 Envisaged financing resources failed to cover adequately important areas, such as transport infrastructure of
both national and European interest. 14 For instance, at the beginning of 2012 in the Water Management there were 38 priority projects. In 10 of these
cases the implementation level varied among 37-70% while in remaining cases it stood at between 0- 5%.

8/13/2019 Romania EU Funding
http://slidepdf.com/reader/full/romania-eu-funding 11/32
11
set up a database of all government projects and approved a list of EU-funded priority
projects. Evaluation procedures would select those projects where funding can be fully
secured within a medium-term horizon.
A relatively poor level of qualification from the part of the consultants involved in
preparing projects. Often, the projects fail to get financing due to the fact that they are
poorly prepared. The consultants employed to write these projects are often
Funds misallocation and procedural irregularities. The investigations into the use of EU
funds by the Romanian authorities, undertaken by the EU representatives in 2012, have
revealed procedural irregularities in a number of projects under various operational
programmes. The suspension and/or interruption of some of the operational programmes have
hampered significantly the absorption of EU funds, especially throughout 2012. This
situation, however, is likely to continue even in 2013. Moreover, the audit procedures have
exposed flaws in spending EU funds with part of the funds being improperly spent. As a
consequence, Romania will have to pay back a share of the EU funds it received. This is
likely to create additional financial problems for both Romanian authorities and the recipients
of EU funds.
Addressing the issues that constrain the pace of EU funds adoption is paramount not only for
the current EU fiscal exercise, where the risk of funds being lost increases, but also for the
2014-2020 programming exercise, in which the management of the EU funds would need to
be much better managed.
3. The 2014-2020 EU’s Multiannual Financial Framework (MFF)
3.1 Proposed Changes to the next MFF
In June 2011 (EC, 2011b) the EC laid out its budget proposal for the next financial
framework. But, current discussions among the EU member countries go beyond the debate
on the size of the 2014-2020 budget and attempt to address also the design of the EU’s
financial framework as well as the objectives and management of the EU funds for the period
2014-2020.
The financing structure of the EU budget has been repeatedly called into question over the
recent years. In the current 2007-2013 MFF more than 85% of EU financing is based on
national contributions derived from gross national income and VAT. Both these sources are
widely perceived to be minimised by individual member states. To this end the EC has
proposed a gradual change in the EU’s financing structure, aiming to increase the size of its
new own resources. Under the existing plans, these new own resources would account for an
increasing share of financing the EU budget and are expected to replace, eventually, the
current VAT-based own resource while reducing the scale of the GNI-based resource.
Although this approach is intended to diminish the amount of direct contributions frommember state budgets it would inevitably mean the introduction of new financial mechanisms

8/13/2019 Romania EU Funding
http://slidepdf.com/reader/full/romania-eu-funding 12/32
12
which could collect revenues at the EU level 15. A report prepared for the European
Parliament (EP 2006a) lists several options for potential revenues to be raised at the EU level.
For instance, these could come from the taxation of the financial sector, auctioning under the
greenhouse gas Emissions Trading System, charges related to air transport, VAT, energy tax
or corporate income tax, all applied at the EU-level. The EC argues that the purpose ofidentifying new own resources is ‘not to increase the overall EU budget but to move away
from the "my money back" attitude and to introduce more transparency into the system’. It
remains to be seen which of these financing means will be eventually adopted. Nevertheless,
the prevailing view among EU countries is that there is an increasing need to modernise EU
finances by simplifying Member States' contributions, introducing new own resources and
gradually phasing-out all correction mechanisms.
3.2 Changes in the Management of the EU Funding
Beyond the envisaged changes in the financing structure of the EU budget, the management
of EU funding is also due to change from 2014 onwards. Thus, prior to the new financial
exercise, in 2013, each Member State would need to prepare a Partnership Contract (PC) with
the EC. The role of the PC would be to assess national development needs and define
priorities for the use of EU funds so that the latter could be used more efficient in meeting the
Europe 2020 targets. Thus, each Member State would need to commit itself to a set of
investment priority plans which would need to be in line with its economic growth objectives.
The EC remains committed to continue supporting less developed regions, which will remain
an important priority for cohesion policy. Given the fact that all Romanian regions, exceptBucharest, record GDP per capita which is less than 75 % of the average GDP of the EU-27,
Romania will continue to qualify for EU cohesion funds (see Annex 1).
For the 2014-2020 fiscal framework the management of EU funds would fall under two
categories16. The first category would see the EU funds management shared between the EU
and the Member States. Structural and Cohesion Funds as well as the EMFF and the EAFRD
would fall under this category. These would account for a large share of the EU budget, more
than three quarters of the budget being allocated to shared funds. In contrast, the EU funding
of research activities, environment and external action funds would fall under the second
category, in which the funds management would be controlled at the central level, by the EC.
Agricultural expenditure will continue to be financed by two funds, namely the European
Agricultural Guarantee Fund (EAGF), or pillar I of the Common Agriculture Policy (CAP)
and the European Agricultural Fund for Rural Development (EAFRD), or pillar II of the
CAP. The former is expected to have allocated around €317.2 and to finance direct payments
15 The EC (EC 2011b) lists a series of criteria such mechanisms would need to meet. Thus, they should be
based on a system covering the whole internal market, have a harmonised base and the proceeds of any potential
new resource should be collected directly by the EU, outside national budgets. Such changes would inevitably
lead to an increased level of fiscal centralisation at the EU-level, an outcome which, at the moment, is notsupported by all EU member states.16
EC2011b
8/13/2019 Romania EU Funding
http://slidepdf.com/reader/full/romania-eu-funding 13/32
13
to farmers and measures to regulate agricultural markets such as intervention and export
refunds while the later would be around a third less and would finance rural development
programmes of the individual EU members. But, the CAP reform proposals17, envisage a new
design of direct payments in order to enhance synergies with Pillar II. The latter would be
placed under a Common Strategic Framework in order to achieve a better coordination withother EU shared management funds.
3.3 Negotiating Positions of the EU Members
At the end of June 2011 the European Commission presented its budget proposal for the
2014-2020 period in its report ‘A budget for Europe 2020’. The EU member countries are
split into two groups over the size of the budget. One group, comprised by Austria, Czech
Republic, Finland, Germany, Netherlands, Sweden and United Kingdom are in favour of a
decrease in the proposed overall amount for the EU budget. The other group of countries,
made of by Belgium, Bulgaria, Croatia, Cyprus, Estonia, Hungary, Lithuania, Poland,
Romania and Slovakia support the EC’s proposed overall amount. The majority of those
arguing for a reduction are net contributors of the EU budget while the majority of those
arguing for the proposals are net recipients.
Cohesion Policy, which represents 36.7% of the EU budget under the current EC proposal,
would most likely suffer if the overall budget was reduced. Among countries which stated
that Cohesion Policy is among their priorities are Croatia, Czech Republic, Estonia,
Lithuania, Romania and Slovenia18. Those looking to keep the Cohesion policy at the same
level as proposed by the EC are likely to argue for the cuts to be made elsewhere. Romania,
along with Lithuania and Slovenia also declared CAP as their priority. The EU objective is toreach an agreement by the end of 2012 on the overall MFF framework to ensure a timely
implementation of the 2014 annual budget.
4. Implications of the EU Funds for Romania’s Budget over the 2014-
2020 Period
4.1 Introduction
The economic implications of EU transfers are significant. An EU-member country could
attract EU-related inflows equivalent to up to 4% of its GDP. This is a large amount which
could have profound macroeconomic repercussions. However, assessing the exact effects on
the economy is notoriously difficult. Usually first round effects are followed by subsequent
rounds effects which would impact domestic demand to different degrees, through various
channels, depending on the initial source of funding, the actual amounts disbursed and funds’
destination. Timing issues could further complicate the economic assessment results as the
effective release of EU funds occurs with a time lag, after the required documentation is
17
A detailed explanation of the reform proposals are in European Commission (2011c) and EuropeanParliament (2011)18
See Annex 1 for a map of countries which would benefit the most from the Cohesion Policy programmes.

8/13/2019 Romania EU Funding
http://slidepdf.com/reader/full/romania-eu-funding 14/32
14
approved by the EC. The existence of time lags in impact evaluation exercises implies that
EU funds could end up reflecting past economic activity.
Overall however, the EU transfers are expected to represent a significant injection of capital
into the Romanian economy so that the medium and long term fiscal effects of the EU
financial flows should be marginally favourable. A controversial issue is whether EU funds
crowd out or augment domestic public spending. Although the EC imposes the principle of
additionality, which implies that the EU funds should not replace the national or equivalent
expenditure by a Member State, in practice this is difficult to verify. This additionality
principle is extremely relevant as the economy’s dependence on EU funding could raise
competitiveness issues once the EU funds are phased out.
The fiscal implications of EU funds are rather complex. On estimating the budgetary effects
of EU funds, several issues need to be borne in mind:
The distinction between projected and committed flow of funds. This will affect how
these funds are recorded in centralised government balances due to existing differences in the
accounting rules19. Three year ahead forecasts of government expenditure on EU-related
costs are presented in Romania’s Convergence Programmes but the ex-post assessments of
these show discrepancies between the amounts budgeted and those which were subsequently
spent.
Co-financing. The EU requirement of EU projects co-financing from national sources raises
the issue of who is the final beneficiary of the funds in practice. Usually, agricultural funds
are directed towards the private sector while cohesion funds are directed to the public sector.Regarding the latter however, the end-user private – public distinction is rather difficult to
make in practice.
Estimating the net budgetary effect of EU funds. The initial direct effect on government
finances is negative as there are costs associated with the national contributions towards the
EU budget (although there are offsetting elements), domestic public expenditure to co-
finance EU funds as well as advance EU payments to farmers and insufficient absorption
capacity of the allocated EU transfers. Subsequently, there might be a marginal positive
effect on government revenues via the expected increase in tax revenues generated by higherfuture output if the EU funds were efficiently used. But such effects could only be evaluated
on a longer time period.
One can argue that part of the EU budget transactions could be treated as direct payments
between the rest of the world and domestic residents without affecting national budgets. On
the revenue side the direct agricultural subsidies fall into the direct payments category. In
contrast, on the expenditure side there are the traditional own resources such as import duties
and agricultural levies and the VAT resource. On average these flows cancel each other out.
19 The cash-based rule, used in practice by most national governments, including Romania, and the accrual
based ESA95 rule, used by the EC. The later is employed to examine compliance with EU deficit limits.

8/13/2019 Romania EU Funding
http://slidepdf.com/reader/full/romania-eu-funding 15/32
15
This line of argument would stand if the EC’s principle of additionality were to be respected
in full. In practice, however this is rather difficult to verify.
4.2 Direct Costs to the Romania’s Budget for the 2014-2020 Period
This section estimates the direct costs to the Romanian budget of EU funds - related
expenditure for the 2014-2020 period. There are two main sources of public expenditure
which are considered in the current analysis: Romania’s contribution to the EU budget and
public sector’s co-financing contribution to the EU projects. Inherently, there is a significant
amount of uncertainty regarding the estimation of these expenditure flows. This uncertainty
relates to both the pace of Romania’s economic growth and its absorption rate.
The forecasting process is further complicated by the fact that, at the time of writing, the
overall 2014-2020 EU budget figure has not yet been agreed by member states. In order to
mitigate this shortcoming the analysis takes into consideration two main scenarios, one inwhich there is a freeze20 in the EU budget and a second scenario which assumes the current’s
EU proposal on the budget (European Commission 2011b) 21. In order to have a broader
picture of the outcome distribution of budgetary costs, uncertainties pertaining to both the
pace of Romania’s economic growth and project co-financing rates have also been
considered.
It thus results eight scenarios which are summarised in Table 4.1 below:
Table 4.1 Overview of the Scenario Assumptions
Freeze in
the EU
Budget
Increase
in the EU
Budget
High GDP
Growth
Low GDP
Growth
Maximum
EU co-
financing
rates
Increased
EU co-
financing
rates
Scenario 1 x x x
Scenario 2 x x x
Scenario 3 x x x
Scenario 4 x x x
Scenario 5 x x x
Scenario 6 x x x
Scenario 7 x x xScenario 8 x x xSource: Author’s Selection
For instance, under Scenario 1 the 2014-2020 EU budget is frozen, Romanian GDP growth is
low and average co-financing rate for cohesion funds is set to 85%, the maximum allowed at
this moment.
20
A budget freeze implies that the 2014-2020 EU budget remains unchanged in nominal terms whencompared to the 2007-2013 period. Effectively, this implies a reduction of the budget in real terms.21
See Annex 2 for details regarding the EU’s 2014-2020 budget proposal.

8/13/2019 Romania EU Funding
http://slidepdf.com/reader/full/romania-eu-funding 16/32
16
Estimation on budgetary implications for the 2014-2020 period requires further assumptions
on a few macroeconomic variables. Details of these together with the main working
assumptions used in the eight scenarios are listed below:
• Romanian GDP Growth is assumed to grow at an annual rate of 3% under the
‘High GDP Growth’ scenario and by 2% in the ‘Low GDP Growth’ scenario.
• Inflation and the Exchange Rate. The GDP deflator, used as a measure of
inflation, is set at 4.5% for 2014 and 4% from there onwards. The RON/EUR
nominal exchange rate is set at 4.3 for the whole 2014-2020 period 22.
• Romania’s annual contribution to the EU budget is assumed to be the
equivalent of 0.95% of GDP. Arguably, this is a simplifying assumption. However
it is closer to the average estimate Romania is expected to pay over the period
2007-2013.
• The maximum EU co-financing rate scenario assumes an average co-financing
rate of 15% for Cohesion Funds and an average co-financing rate of 30% forEAFRD related projects. However, as the majority of the latter is directed towards
the private sector it is assumed that public financing is needed for only 25% of all
EAFRD funds. The EU Funds absorption rate is taken to be 100% since assuming
a lower rate would bias downwards the estimates of budgetary effects. In the
increased EU-financing scenario average co-financing rate is assumed to be
higher, 30% for Cohesion Funds and 45% for the EAFRD related projects.
The pattern of EU funds allocation to Romania across the 2014-2020 period is assumed to be
the same as for the period 2007-201323. Although revisions of domestic sector strategies
financial ‘needs’ could see subsequent changes in EU funds’ portfolio allocations, the impact
of these changes on the overall EU-related budget expenditure is likely to be relatively
small24.
The summary of results assessing Romania’s budgetary costs of EU-related contributions and
projects co-financing is presented in Table 4.2 below. The budgetary costs for each of the
eight scenarios are expressed both in EUR terms as well as in percentages of GDP. A more
detailed analysis regarding the expenditure sources that make of these budgetary costs is
presented in the tables of Annex 3.
22 The benchmark RON/EUR exchange rate chosen might seem too strong in the light of recent exchange rate
developments. However, in the medium and long term the RON should appreciate against the EUR, as implied
by the economic theory, bringing back the RON/EUR forecast period average to 4.3 from the current rate of
4.5. Even the IMF implicit RON/EUR forecast for 2017 is slightly below 4 (see Romania Country Report 12/73,
April 2012).23
The computation of the annual EUR amount estimates for both Cohesion Funds and EAFRD was done in two
steps. The first step involved the calculation of the corresponding annual percentages for each category
spending. These were obtained by dividing the annual amount allocated to Romania by the overall EU budget
amount for each expenditure category. In the second step, the process was reversed. The percentages were
used to determine estimates of annual allocation funds to Romania for both Cohesion Funds and EAFRD for
the 2014-2020 period, conditional on each of the two EU budget scenarios.24 To a certain extent large reallocations of funds among different budget headings are constrained by the
requirement to fulfil the assumed 2020 targets.

8/13/2019 Romania EU Funding
http://slidepdf.com/reader/full/romania-eu-funding 17/32
17
Table 4.2 Summary of Romania’s Annual Budgetary Costs, EU Contributions and Projects
Co-financing, Forecasts, Current Prices
2014 2015 2016 2017 2018 2019 2020 Cum.
2014-
2020*Scenario 1 Bn. EUR 1.82 2.01 2.20 2.39 2.53 2.69 2.85 16.49
As % of GDP 1.13 1.17 1.21 1.23 1.24 1.24 1.24 8.46
Scenario 2 Bn. EUR 2.02 2.29 2.59 2.85 3.03 3.23 3.43 19.44
As % of GDP 1.25 1.34 1.42 1.47 1.48 1.48 1.49 9.93
Scenario 3 Bn. EUR 1.85 2.05 2.27 2.48 2.65 2.83 3.03 17.16
As % of GDP 1.12 1.16 1.20 1.22 1.22 1.22 1.22 8.36
Scenario 4 Bn. EUR 2.05 2.34 2.66 2.94 3.15 3.37 3.61 20.12
As % of GDP 1.24 1.33 1.40 1.45 1.45 1.45 1.45 9.77
Scenario 5 Bn. EUR 1.86 2.07 2.29 2.50 2.67 2.84 3.02 17.25
As % of GDP 1.15 1.20 1.26 1.29 1.30 1.31 1.31 8.82
Scenario 6 Bn. EUR 2.10 2.41 2.75 3.07 3.30 3.52 3.76 20.91As % of GDP 1.30 1.41 1.51 1.59 1.61 1.62 1.63 10.67
Scenario 7 Bn. EUR 1.89 2.12 2.36 2.59 2.78 2.98 3.20 17.92
As % of GDP 1.15 1.20 1.24 1.28 1.28 1.28 1.28 8.71
Scenario 8 Bn. EUR 2.13 2.46 2.82 3.16 3.41 3.67 3.94 21.59
As % of GDP 1.29 1.39 1.49 1.56 1.57 1.58 1.58 10.46
Source: Author’s Calculations. * - figures are indicative only as they are expressed in current prices. The last
column presents the cumulative effects.
Several remarks could be made by inspecting the figures in the table above:
• The annual direct EU-related costs to the Romanian budget vary between 1.13% and1.63% of GDP depending on the scenario employed. Given that, on average, the
equivalent of 0.95% of GDP represents Romania’s EU contribution, the remaining
differences account for variations in budget expenditure brought about by changes in
Romania’s GDP growth rates, differences in project co-financing rates and the size
of the overall EU budget.
• An increase in the EU budget would automatically trigger an increase in Romania’s
financial commitments. These would mainly come from two sources: increased
contributions towards the EU budget and higher amounts needed to co-finance EU
projects. The two figures below depict projections of budgetary costs under theassumption of the EU-budget freeze/increase and Maximum/Increased EU co-
financing rates. Ceteris paribus the increase in the EU budget, as it is implied by the
current EU proposal, would raise annual domestic budgetary costs by between 0.1-
0.2% of GDP.

8/13/2019 Romania EU Funding
http://slidepdf.com/reader/full/romania-eu-funding 18/32
18
• Annual budgetary costs could even go above 1.6% of GDP if the EU budget is passed
in its current form25, which would represent a significant budgetary effort required on
a consistent basis.
• Relatively small differences in GDP growth rates would have a relatively limited
impact on the budget deficit figure. However, larger variations in the forecast GDP
growth rates would have a bigger impact on budgetary costs. The hypothesis of a
prolonged period of lower GDP growth should not be discounted. The convergence
process of the Romanian economy could run at a slower pace, when compared to the
pre-2007 period, given the tensions in financial markets and higher borrowing costs.
4.3 Implications for the Structural Deficit
The conditions laid down in the Fiscal Pact 26 sets stricter limits for the EU members’ budget
deficits27. The Fiscal Pact is expected to enter into force in 2013. Although Romania
endorsed the Fiscal Pact, at the time of writing the Romanian Parliament has yet to decide the
date from when it would abide to its rules. Given that the Fiscal Pact envisages a ceiling of
25 As it is presented in Annex 2.
26 The official label is “ Treaty on Stability, Coordination and Governance in the Economic and Monetary
Union”. To be approved the Fiscal Pact requires the support of a minimum of 12 Eurozone member countries.27 Apart from setting limits on budget deficits, the Fiscal pact would also allow EU member states to coordinate
their budget policies in a closer manner and impose penalties on rule-breakers.
1.1
1.15
1.2
1.25
1.3
1.35
2014 2015 2016 2017 2018 2019 2020
% of GDPBudgetary Cost Forecasts, Max EU Co-financing Rate
Freeze EU Budget (Scenario 1) Increase EU Budget (Scenario 5)
1.1
1.2
1.3
1.4
1.5
1.6
1.7
2014 2015 2016 2017 2018 2019 2020
% of GDPBudgetary Cost Forecasts, Increased EU-cofinancing Rate
Freeze EU Budget (Scenario 2) Increase EU Budget (Scenario 6)

8/13/2019 Romania EU Funding
http://slidepdf.com/reader/full/romania-eu-funding 19/32
19
0.5% for member states’ structural budget deficit28, the full compliance with the Fiscal Pact
rules from 2013 onwards would put an additional pressure on Romanian public finances.
The calculation of the structural deficit is based on the estimated gap between the so-called
‘potential output’ (when the economy works at full capacity and inflation is non-accelerating)
and the actual output. However, in practice an exact estimate of ‘potential output’ is rather
difficult to assess29, thus the margin of error for measuring the structural deficit is quite large.
As a consequence, the fiscal policy implications of estimation errors could be quite large as
the Fiscal Pact’s 0.5% budget deficit ceiling would necessarily imply a far greater precision
measurement in practice. The figure below shows historical data for Romania’s structural
deficit, expressed in percentages of GDP, as computed by the EC. Two things stand out. First,
there is a discrepancy between the structural deficits figures which comes from the
methodology employed. Although the differences appear to be small, the implication of these
would be much larger in practice if the structural budget deficit ceiling was 0.5% of GDP.
Source: Eurostat
Second, Romania’s structural budget deficit was consistently larger than 1% of GDP over the
last 12 years. The structural deficit widened from 2006 onwards, partly due to higher
expenditures in the economic boom years. But, payment contributions to the EU budget and
public sector funds aimed at project co-financing played also a role in extending the budget
deficit gap. This could lead to emergence of the so-called ‘fiscal drag’. Although the EU
funds could provide an opportunity to increase investment spending this will widen the
budget deficit. The requirement to meet the Fiscal Pact budget deficit criteria would prevent
fiscal loosening. Thus, co-financing would need to be provided through reduced spending
elsewhere30.
Bringing the structural deficit below -0.5% of GDP might be achieved sometime after 2014
but maintaining the deficit at that level on a permanent basis, would be utterly challenging
28 Under certain circumstances the medium term objective of structural budget deficit could reach -1% of GDP.
29 The estimates of potential output are usually available with a time lag.
30 In a presentation made by the Fiscal Council (2012) it was argued that the EU funds absorption could provide
an enormous stimulus for the economy and that for ‘each 1 RON of own resources (budgetary deficit), publicexpenditure amounting 20 lei can be made’. This overlooked the implications of co-financing on budget
deficit.
-12
-10
-8
-6
-4
-2
0
Romania - Structural Deficit, % of GDP
Production Function Approach Trend GDP

8/13/2019 Romania EU Funding
http://slidepdf.com/reader/full/romania-eu-funding 20/32
20
given the current structure of government spending. Future financial commitments to social
security as well as the required financial outlays towards investments in physical
infrastructure, health care and education would require more flexibility in running fiscal
policy, unless one accepts a permanent level of lower economic growth.
Given these circumstances, any gains obtained through the reducing of the structural deficit
would matter. According to the data in Table 4.2 above, an increase in the EU budget would
impose a direct cost on Romania’s public sector budget equivalent to between 0.1- 0.2% of
GDP per year. That represents a significant amount if the structural deficit target is set to -
0.5% of GDP. The medium and long-term budgetary effects are less clear due to the fact that
an expected increase in government revenues, via higher expected output, could actually
lower the budget deficit marginally31. But this still leaves open the question to what extent
Romania would benefit from a potential increase in the EU budget given the additional short
term costs to the budget, the need to meet the Fiscal Pact structural constraints and the dismal
rate of EU funds absorption.
5. The Impact of EU Funds on Romania’s Economic Growth and
Employment
The assessment of the impact of EU funds on economic growth would depend to a great
extent on the actual flows to the economy as a whole, the efficiency to which these funds are
employed and the methodology employed to analyse their impact on the economy. Although
the overall impact of EU funds in the economy should be positive, since, as Table 2.2 shows,these represent a net inflow of capital into the economy, there are a number of factors to be
considered. First, there is the issue of timeframe under which the analysis is performed. For
certain funds such as those aimed at building both human as well as physical capital, like
enhancing infrastructure, there is a spillover effect in the economy which would be felt over
time. Second, there is the issue of spending efficiency which is rather difficult to assess.
Third, the use of an economic model in a dynamic setting which would capture the relevant
interconnections among the economic variables of interest is desirable but difficult to build.
There is a relatively large empirical literature which studies the economic impact of EU
Funds and the results are mixed. Boldrin and Canova (2001) for instance find that these arelargely ineffective. On the other hand Checherita et al (2009) argue that although EU funds
help to reduce, to some extent, income disparities their effect on output growth fails to be
observed. In another study, Ederveen et al (2006) conclude that EU funds become effective
only when they are accompanied by an appropriate institutional framework. By and large, the
evidence that regions receiving structural and cohesion funds are behaving any differently
from the remaining ones still needs to be validated in practice. Spain for instance, has been a
31 A report by the ECFIN (2005) calculates that the fiscal impact of the EU financial flows in the medium-term
should be favourable. However, the report acknowledges the challenges in restructuring budgetary andadministrative procedures, to be able to absorb the projected payments, which could have an adverse effect
on the expected outcome.

8/13/2019 Romania EU Funding
http://slidepdf.com/reader/full/romania-eu-funding 21/32
21
large recipient of structural and cohesion funds, nevertheless its competitiveness failed to
improve to the extent that unemployment is expected to rise to over 24% in 2012.
For Romania the analyses which estimate the impact of EU funds on economic growth are
scarce. These are usually considered as direct effects on aggregate demand. The methodology
employed here is based on the multipliers method. Arguably, this way of estimation has its
limitations. The GDP estimates are obtained by using a static framework so that dynamic
effects are not considered. Moreover, the crowding out effect cannot be assessed. This is an
important consideration for policy analysis as, at the aggregate level of the economy, the net
and redistribution effects would matter. The implications of increased spending sometimes
overlook the effect of the economy once this spending ceases. Thus, while the EU funds
could provide a small stimulus to the economy in the short term, their medium and long term
effects on the economy, from the point of view of the efficient allocation of resources, could
be doubtful.
Another drawback of this methodology, which applies particularly to Romania, is the fact
that the multipliers might overstate the economic effects of EU funds on the economy due to
the observed systematic irregularities in spending EU funds as well as the existing cost
misallocation under various operational programmes. There is also the issue of ‘leakages’.
The EC estimates from input-output (I/O) tables suggest that around a quarter of EU funds
expenditure returns to the rest of the EU in the form of increased exports, on machinery and
equipment in particular, as GDP and investment grow. This ‘leakage’ seems to be particularly
large for countries which have lower production capacities, for Greece it represents 42% of
structural aid and while for Portugal it is 35%. Given Romania’s production capacity
similarities with Greece and Portugal the ‘leakage’ is thus likely to be relatively high inRomania as well, and the multiplier methodology would overstate domestic economic effects
of the EU funds. When interpreting the results, one needs to bear in mind all the above
mentioned shortcomings.
The multipliers methodology uses data from the Romania’s I/O table for the year 2008. It
considers several sub-sectors which are deemed to be a proxy for EU funds spending under
various operational programmes. The multipliers are presented in Table 5.1 below 32.
Essentially they could be interpreted as representing the GDP change in value that results
from a 1 RON change in output delivered to a final user by the buying sectors on the left
column. These sectors are proxied to represent spending undertaken under the seven
operational programmes from Table 2.3. The I/O multipliers link the direct impact on an
industry from a policy or investment decision to the indirect impact on its suppliers, suppliers
of those suppliers, and so on and so forth. Multipliers can also reflect induced effects on the
industrial economy from increased earnings, and thus spending, from wage earners in the
directly and indirectly affected industries.
32 It can be observed that the cumulative impact using the multipliers method is higher than the size of the
initial spending. It is worthwhile remembering that the methodology overlooks issues related to the crowdingout effects, substituted spending, disequilibrium effects or medium and long-term economic implications.

8/13/2019 Romania EU Funding
http://slidepdf.com/reader/full/romania-eu-funding 22/32
22
Table 5.1 Romania GDP Multipliers for Selected Sectors
GDPDirect Indirect Induced
Natural water; water treatment and supply services 0.64 0.29 0.88
Sewerage; waste collection, treatment and disposalactivities; materials recovery; remediation activit ies andother waste management services
0.71 0.25 0.69
Constructions and construction works 0.69 0.26 0.51Consultancy and related services; information services 0.8 0.16 0.4Education services 0.83 0.14 0.87
Source: Author’s Calculations
The GDP effects of EU funds can be approximated using the multipliers above and the EUR
amounts attracted under each operational programme. Results are presented in Table 5.2:
Table 5.2 Estimated GDP Effects of the EU Funds for the period 2007-2012/Q1
Cumulative attracted
fundsa, 2007-2012/Q1
GDP GDPDirect Indirect Induced Total
EUR Bn. EUR Mill. EUR Mill. EUR Mill. EUR Mill.
OP Regional 1.04 718 270 530 1518
OP Technical
Assistance
0.02 17 3 23 42
OP Enhancing
Admin. Capacity
0.03 25 4 26 55
SOP EnhancingCompetitiveness
0.43 344 69 172 585
SOP Transport 0.32 221 83 163 467
SOP HR
Development
1 830 140 870 1840
SOP Environment 0.57 385 154 447 986
Total 3.42 2539 723 2232 5494
Source: Author’s Calculations; a - including pre-financing
Thus, while the cumulative attracted funds over the 2007-2012/Q1 period amounted to EUR
3.4 Bn. the overall impact of the Romanian economy could have been close to EUR 5.5 Bn. if
both the indirect and induced effects were factored in. Table 5.3 below presents the summary
of results, including the employment effects33. Interval estimates have been used, with the
lower bound of the interval being the nominal value of the cumulative attracted funds
(column 1 in Table 5.2) and the upper bound being set at the total multiplier value (last
column in Table 5.2). The cumulative GDP effects range between EUR 3.4 and 5.5 Bn.
which represent between 0.5 – 0.8% of GDP34.
33 These were computed using the production function approach.
34
The GDP and employment analyses consider the effects of Operational Programmes alone. As shown inTable 2.2, net EU payments averaged to close to 1% of GDP over the 2007-2011 period. The latter estimate
includes the effects of CAP subsidies.

8/13/2019 Romania EU Funding
http://slidepdf.com/reader/full/romania-eu-funding 23/32
23
Table 5.3 Summary of GDP and Employment Effects
GDP Employment
Cumulative, 2007-2012/Q1 Yearly Avg. Cumulative,
2007-
2012/Q1
Yearly Avg.
Bn EUR % of GDP. Bn EUR % of GDP Thous. Thous.
3.4 – 5.5 0.5 – 0.8 0.65 – 1.05 0.5 – 0.8 100 - 185 19 - 35Source: Author’s Calculations
The cumulative employment effects for the period 2007 – end of March 2012, which measure
the number of full time equivalent jobs maintained in the economy, range from 100 to 185
thousands. This implies a yearly average of between 19 and 35 thousand jobs.
The GDP effects are not far from estimates observed in other New Member States (NMS).
Rosenberg and Sierhej (2007) estimate demand effects of the EU funds in these countries and
show that the demand impact ranges from 0.5% of GDP in Central European countries to up
to 1% of GDP in the Baltic States, where EU commitments and absorption have been high. It
is worthwhile mentioning that the authors estimated a larger demand impact for Romania,
which, in hindsight, failed to materialise.
The results in Table 5.3 show that GDP and employment effects of the EU funds on the
Romanian economy have been modest so far. This raises another question, namely to what
extent the EU funds help achieving their stated objective, namely fostering economic growth
and promoting convergence. On the other hand it could be argued that Cohesion policy funds
make it possible for Romania
35
to finance projects which would help it achieve 2020 targetsin areas such as environment, climate change or renewable sources. The financing of such
actions might not be undertaken without external support and thus could have an adverse
impact on domestic economic growth perspectives.
6. Concluding Remarks and Policy Implications
The current EU budget negotiations for the 2014-2020 period are of great importance as they
set political priorities for future years. As it often happened during past negotiations, each EU
member country will very likely attempt to pursue its own interests as much as it can. In thesetimes of fiscal austerity net contributor countries tend to support a freeze in the EU budget
rather that an increase. The former stance is more consistent to the general direction followed
by fiscal policies in the EU member countries that pursued fiscal stabilisation programmes. It
may appear inconsequent that countries which adopted austerity policies in order to reduce
their budget deficits would support an increase in the EU budget. One line of argument in
favour of this approach could stress the importance of EU Funds in supporting economic
growth. However, this may work for countries which have exceptionally high absorption
rates and face serious financing constraints. But this is hardly the case for any EU member
country, and in particular for those who benefit the most from Structural and Cohesion funds.
35 See Annex 1.

8/13/2019 Romania EU Funding
http://slidepdf.com/reader/full/romania-eu-funding 24/32
24
The current negotiating position of Romanian authorities is one which supports an increase in
the EU budget, favouring the proposal put forward by the EC. This stance is less surprising
given that Romania is a net beneficiary of EU funds. However, it is at odds with the country’s
poor track record of EU funds absorption. Given these circumstances there are a number of
issues which need to be carefully considered.
In the first place, there are important fiscal implications for the Romanian budget. An
increase in the EU budget would lead to an increase in Romania’s financial commitments.
These would come mainly from two sources: increased contributions towards the EU budget
and higher amounts needed to co-finance EU projects. If the EU budget was approved in the
current form, i.e. as it was put forward by the EC in 2011, it could raise annual domestic
budgetary costs by between 0.1- 0.2% of GDP, as the analysis in this paper has shown. This
increase does not include the advance payments from the budget. Due to the fact that there is
a time lag between the moment the advance payments are paid and the moment in which the
EU funds are actually disbursed, the budget deficit gap could widen, temporarily, evenfurther.
As one would expect, changes in Romania’s GDP growth rates or the EU funds co-financing
rates could have important budgetary effects. The Fiscal Pact, to which Romania is a
signatory, sets a ceiling for the structural budget deficit at -0.5% of GDP. The Romanian
authorities may be able to bring its structural deficit below the Fiscal Pacts ceiling sometime
after 2014 but, given the current structure of government spending, they could face serious
challenges in maintaining the deficit at that level on a permanent basis. Future financial
commitments to social security as well as the required financial outlays towards investments
in physical infrastructure, health care and education would constrain the budgetary policy.
Advocating an increase in the EU budget would make little sense unless the absorption rate
increased at such an impressive pace over the coming years that it would get close to 100% 36.
In the light of the recent country’s experience this looks unlikely. The whole EU absorption
funds process has come to an almost standstill in 2012 as audit exercises performed by the
EU revealed numerous irregularities, notably over spending EU funds. Some of the current
obstacles in the EU funds absorption are likely to persist as there are constraints which relate,
for instance, to human capital development or the institutional set-up. Both would require
substantial changes – which are bound to take time – if the process of the EU funds is to
become much more efficent.
Improving substantially the absorption capacity should be paramount. This relates to
Romania’s ability to spend its allocated structural funds in an effective and efficient way. The
absorption capacity can be thought along three components: macroeconomic, administrative
and financial. Among the three, administrative absorption capacity is clearly the most flawed
and could be subject to marked improvement. The Romanian authorities have taken a number
of measures recently. There have been defined priority action plans in the areas of project
36
Of course, one could argue that, by simply asking for a larger EU budget Romania follows in fact anegotiating strategy which would give the country more bargaining power. But again, this strategy might work
if the EU funds absorption rate was close to 90-100%. What matters in the end is the effective absorption rate.

8/13/2019 Romania EU Funding
http://slidepdf.com/reader/full/romania-eu-funding 25/32
25
management and financing and public procurement. Standard bidding documents in key
sectors have also been developed. However, as mentioned before, there are issues which
would take a longer time to sort out, such as enhancing the expertise capacity at central and
local administration. The scarcity of qualified personnel at the local level of public authorities
also impacts negatively on the quality of strategic planning, designing and enforcement ofmulti-annual budgets. This aspect is strongly related to the financial absorption capacity,
which defines the extent to which the supported regions are able to co-finance the projects.
The higher the share of EU payments in GDP, the higher co-financing requirements would
be.
The management of EU funding is due to change from 2014 onwards. This would have
important implications for the overall process of EU funds absorption. Romania would need
to prepare a Partnership Contract with the EC, where it would assess its national development
needs and define its priorities for the use of EU funds so that the latter could be used more
efficient in meeting the Europe 2020 targets. Thus, Romania would need to commit itself to aset of investment priority plans which would need to be in line with its economic growth
objectives. The quantification of these investment needs would be an invaluable input in the
evaluation of the country’s EU-funding needs. However, the whole process may prove to be a
challenging exercise unless sustained efforts are made to improve the whole assessment
process. Poor planning and the setting of uncorrelated strategic objectives in the National
Development Plan (NDP) 2007-2013 were one of the main causes of the poor absorption of
EU funds. They often differed from the objectives laid down in the Operational Programmes
leading to a funds allocation mismatch.
Higher effective EU funds absorption alone is not sufficient. These should be directedtowards the appropriate projects and be successful in meeting the objectives for which have
been designed. According to the estimates in this analysis, the impact of EU funds on
Romanian GDP and employment appear to have been below initial expectations. Part of the
reason is the low rate of absorption rate. But their efficient use matters considerably.

8/13/2019 Romania EU Funding
http://slidepdf.com/reader/full/romania-eu-funding 26/32
26
References:
Boldrin, M. and F. Canova (2001) – ‘Inequality and Convergence: Reconsidering European
Regional Policies’, Economic Policy, 32, 205-253.
Checherita, C., Nickel, C., Rother, P., (2009) - ‘The role of fiscal transfers for regionaleconomic convergence in Europe’. Working Paper 1029, European Central Bank.
Council of European Union (2005) - Financial Perspectives 2007-2013, CADREFIN 268,
15915/05
ECFIN Country Focus (2005) – ‘Economic analysis from the European Commission’s
Directorate-General for Economic and Financial Affairs’, Volume 2, Issue 2.
Ederveen, S., de Groot, H. L., Nahuis, R., (2006) – ‘Fertile soil for structural funds? A panel
data analysis of the conditional effectiveness of European cohesion policy’. Kyklos 59 (1),
17–42.
European Union (2011a) – ‘Cohesion Policy 2014 -2020 investing in growth and jobs’, ISBN
978-92-79-21490-5. Available at http://ec.europa.eu/inforegio. Accessed 29 April 2012.
European Commission (2012a) – ‘Commission proposals for the Multiannual Financial
Framework 2014-2020’. Available at: http://ec.europa.eu/budget/reform/commission-
proposals-for-the-multiannual-financial-framework-2014-2020/index_en.htm. Accessed 29
April 2012.
European Central Bank (2004) – ‘Transactions involving the EU budget’, Monthly Bulletin,Box 3, August.
European Commission (2011b) - COM (2011) 500 final, A Budget for Europe 2020,
Brussels.
European Parliament (2006a) - Report on the future of the European Union's own resources,
2205(INI) Rapporteur A. Lamassoure.
European Parliament (2011) – ‘The CAP in the EU Budget: New Objectives and Financial
Principles for the Review of the Agricultural Budget After 2013’.
European Commission (2011c) – ‘Establishing rules for direct payments to farmers under
support schemes within the framework of the common agricultural policy’, COM (2011) 625
2011/0280 (COD)
European Commission (2008) - European Union Public Finance, Fourth edition.
Georgescu G. (2009) – ‘Determinants of Increasing EU Funds Absorption Capacity in
Romania’ Institute of National Economy.
KPMG (2010) - EU Funds in Central and Eastern Europe. Progress Report 2007–10

8/13/2019 Romania EU Funding
http://slidepdf.com/reader/full/romania-eu-funding 27/32
27
Romanian Academic Society (2012) - ‘Cu ce ne alegem din fondurile europene pentru
dezvoltare regională şi de ce?’ Available at: http://www.sar.org.ro/wp-
content/uploads/2012/04/SAR-25-461.pdf . Accessed 29 April 2012.
Rosenberg B. Christoph and Sierhej, Robert (2007) – ‘Interpreting EU Funds Data for
Macroeconomic Analysis in the New Member States’ IMF Working Paper WP/07/77
Romanian Fiscal Council (2012) – ‘The European fiscal compact. Implications for Romania’
presentation, available at: http://www.fiscalcouncil.ro/Prezentare_en-8-02-2012.pdf .
Accessed 29 April 2012.
Socol, C, Socol G. and Marinas M. (2009) – ‘Romania’s Absorption of European Funds.
Diagnosis and Solutions’ in Recent Researches in Tourism and Economic Development.
Zaman G., and Cristea A. (2011) - ‘EU Structural Funds Absorption in Romania: Obstacles
and Issues’. Romanian Journal of Economics. Vol 32, pg 60-77.

8/13/2019 Romania EU Funding
http://slidepdf.com/reader/full/romania-eu-funding 28/32

8/13/2019 Romania EU Funding
http://slidepdf.com/reader/full/romania-eu-funding 29/32
29
Annex 2. The EU Budget for the current and next MFF (2011 prices, EUR Billion)
Table A 2.1. The EU Budget for the 2007-2013 Period 37
2007 2008 2009 2010 2011 2012 2013
Total
2007-
2013
Sustainable Growth , of which: 58.22 59.43 60.77 61.54 62.61 64.25 65.91 432.75
Competitiveness 9.40 10.10 10.84 11.62 12.48 13.39 14.36 82.19
Cohesion 48.82 49.33 49.94 49.92 50.14 50.86 51.56 350.56
Preservation
and Managm.
of Natural
Resources
62.65 61.89 61.14 60.42 59.70 58.99 58.28 423.07
Citizenship,
freedom,
security and
justice
1.28 1.38 1.49 1.63 1.79 1.96 2.18 11.70
EU as a global
player
7.16 7.46 7.78 8.11 8.46 8.82 9.20 56.99
Administration 7.66 7.86 8.03 8.18 8.34 8.49 8.75 57.32
Total
appropriations
(commitments)
137.44 138.24 139.44 139.89 140.90 142.51 144.32 982.74
as % of GNI 1.10 1.08 1.06 1.04 1.03 1.02 1.00 1.05
Source: Adapted from the Council of European Union (2005)
Table A 2.2. The EC Proposed Budget for the 2014-2020 Period
2014 2015 2016 2017 2018 2019 2020
Total
2014-
2020
Sustainable and Inclusive
Growth , of which: 64.70 66.58 68.13 69.96 71.60 73.77 76.18 490.91
Cohesion 50.46 51.54 52.54 53.61 54.80 55.96 57.11 376.02
Sustainable
Growth:
Natural
Resources57.39 56.53 56.53 54.86 53.84 52.83 51.78 382.93
Security andCitizenship 2.53 2.57 2.61 2.65 2.69 2.73 2.76 18.54
Global Europe 9.40 9.65 9.85 9.96 10.15 10.38 10.62 70.00
Administration 8.54 8.68 8.80 8.94 9.07 9.23 9.37 62.63
Total
appropriations
(commitments)142.56 144.00 145.09 146.37 147.34 148.93 150.72 1025.0
as % of
GNI 1.08 1.07 1.06 1.06 1.05 1.04 1.03 1.05
Source: European Commission 2011b
37
Originally, amounts in Table A2.1 were expressed in 2004 prices. To obtain figures which could be directlycompared across the two tables, the amounts from the initial document have been converted into 2011 prices
using the cumulative inflation coefficient for the 2005-2011 period of 14% (given by the GDP deflator)

8/13/2019 Romania EU Funding
http://slidepdf.com/reader/full/romania-eu-funding 30/32
30
Annex 3. Romania’s Budgetary Implications of EU Contributions and Projects Co-financing
Scenario 1 assumes a freeze in the EU budget, implying that the EU budget remains
unchanged compared to the 2007-2013 period. It also assumes a lower GDP growth for the
Romanian economy, averaging 2% per year and maximum co-financing rates.
In all scenarios EAFRD co-financing rate is kept at 30% but assumes that public financing is
needed to co-finance only 25% of all funds earmarked for EAFRD. Also, the EU Funds
absorption rate is assumed to be 100%.
Table A 3.1 Scenario 1, EU Budget Freeze, Low GDP Growth, Max. EU Co-financing Rate
2014 2015 2016 2017 2018 2019 2020
GDP Bn EUR 161.8 171.7 182.1 193.2 204.9 217.4 230.6
Contribution to the EU Bn EUR 1.5 1.6 1.7 1.8 1.9 2.1 2.2
Cohesion Funds
Contributiona
Bn EUR 0.20 0.29 0.39 0.46 0.50 0.54 0.58
EAFRD contributionb Bn EUR 0.09 0.09 0.09 0.09 0.09 0.09 0.09
Budgetary Cost, Cohesion &
EAFRD only
Bn EUR 0.29 0.38 0.47 0.55 0.59 0.62 0.66
As % of
GDP 0.18 0.22 0.26 0.28 0.29 0.29 0.29
Overall budgetary cost,
including EU contribution
Bn EUR 1.82 2.01 2.20 2.39 2.53 2.69 2.85
As % of
GDP 1.13 1.17 1.21 1.23 1.24 1.24 1.24
Source: Author’s Calculations
a - Cohesion Funds co-financing rate = 15%, b - EAFRD co-financing rate = 30% but assuming that public
financing is needed for only 25% of all EAFRD funds; EU Funds absorption rate = 100%.
Scenario 2 assumes a freeze in the EU budget, implying that the EU budget remains
unchanged compared to the 2007-2013 period. GDP growth is also low, averaging 2% per
year but co-financing rates are increased as follows, for CF the co-financing rate is set to 30%
and for EAFRD to 45%.
Table A 3.2 Scenario 2, EU Budget Freeze, Low GDP Growth, Lower EU Co-financing Rate
2014 2015 2016 2017 2018 2019 2020
GDP Bn EUR 161.8 171.7 182.1 193.2 204.9 217.4 230.6Contribution to the EU Bn EUR 1.5 1.6 1.7 1.8 1.9 2.1 2.2
Cohesion Funds
Contributiona
Bn EUR
0.40 0.58 0.77 0.93 1.00 1.07 1.15
EAFRD contribution Bn EUR 0.09 0.09 0.09 0.09 0.09 0.09 0.09
Budgetary Cost, Cohesion &
EAFRD only
Bn EUR 0.49 0.66 0.86 1.01 1.09 1.16 1.24
As % of
GDP 0.30 0.39 0.47 0.52 0.53 0.53 0.54
Overall budgetary cost,
including EU contribution
Bn EUR 2.02 2.29 2.59 2.85 3.03 3.23 3.43
As % of
GDP 1.25 1.34 1.42 1.47 1.48 1.48 1.49
Source: Author’s Calculations; a - Cohesion Funds co-financing rate = 30%

8/13/2019 Romania EU Funding
http://slidepdf.com/reader/full/romania-eu-funding 31/32
31
Table A 3.3 Scenario 3, EU Budget Freeze, High GDP Growth, Max. EU Co-financing Rate
2014 2015 2016 2017 2018 2019 2020
GDP Bn EUR 165.0 176.8 189.3 202.8 217.3 232.7 249.3
Contribution to the EU Bn EUR 1.6 1.7 1.8 1.9 2.1 2.2 2.4
Cohesion FundsContribution
Bn EUR0.20 0.29 0.39 0.46 0.50 0.54 0.58
EAFRD contribution Bn EUR 0.09 0.09 0.09 0.09 0.09 0.09 0.09
Budgetary Cost, Cohesion &
EAFRD only
Bn EUR 0.29 0.38 0.47 0.55 0.59 0.62 0.66
As % of
GDP 0.17 0.21 0.25 0.27 0.27 0.27 0.27
Overall budgetary cost,
including EU contribution
Bn EUR 1.85 2.05 2.27 2.48 2.65 2.83 3.03
As % of
GDP 1.12 1.16 1.20 1.22 1.22 1.22 1.22
Source: Author’s Calculations
Table A 3.4 Scenario 4, EU Budget Freeze, High GDP Growth, Lower EU Co-financing Rate
2014 2015 2016 2017 2018 2019 2020
GDP Bn EUR 165.0 176.8 189.3 202.8 217.3 232.7 249.3
Contribution to the EU Bn EUR 1.6 1.7 1.8 1.9 2.1 2.2 2.4
Cohesion Funds
Contribution
Bn EUR
0.40 0.58 0.77 0.93 1.00 1.07 1.15
EAFRD contribution Bn EUR 0.09 0.09 0.09 0.09 0.09 0.09 0.09
Budgetary Cost, Cohesion &
EAFRD only
Bn EUR 0.49 0.66 0.86 1.01 1.09 1.16 1.24
As % of
GDP 0.29 0.38 0.45 0.50 0.50 0.50 0.50
Overall budgetary cost,including EU contribution Bn EUR 2.05 2.34 2.66 2.94 3.15 3.37 3.61As % of
GDP 1.24 1.33 1.40 1.45 1.45 1.45 1.45
Source: Author’s Calculations
Table A 3.5 Scenario 5, EU Budget Increase, Low GDP Growth, Max. EU Co-financing Rate
2014 2015 2016 2017 2018 2019 2020
GDP Bn EUR 161.8 171.7 182.1 193.2 204.9 217.4 230.6
Contribution to the EU Bn EUR 1.5 1.6 1.7 1.8 1.9 2.1 2.2
Cohesion Funds
Contribution
Bn EUR
0.24 0.34 0.47 0.57 0.63 0.68 0.74
EAFRD contribution Bn EUR 0.09 0.09 0.09 0.09 0.09 0.09 0.09
Budgetary Cost, Cohesion &
EAFRD only
Bn EUR 0.33 0.44 0.56 0.66 0.72 0.77 0.83
As % of
GDP 0.20 0.25 0.31 0.34 0.35 0.36 0.36
Overall budgetary cost,
including EU contribution
Bn EUR 1.86 2.07 2.29 2.50 2.67 2.84 3.02
As % of
GDP 1.15 1.20 1.26 1.29 1.30 1.31 1.31
Source: Author’s Calculations

8/13/2019 Romania EU Funding
http://slidepdf.com/reader/full/romania-eu-funding 32/32
Table A 3.6 Scenario 6, EU Budget Increase, Low GDP Growth, Lower EU Co-financing
Rate
2014 2015 2016 2017 2018 2019 2020
GDP Bn EUR 161.8 171.7 182.1 193.2 204.9 217.4 230.6
Contribution to the EU Bn EUR 1.5 1.6 1.7 1.8 1.9 2.1 2.2Cohesion Funds
Contribution
Bn EUR
0.47 0.69 0.93 1.15 1.26 1.37 1.48
EAFRD contribution Bn EUR 0.09 0.09 0.09 0.09 0.09 0.09 0.09
Budgetary Cost, Cohesion &
EAFRD only
Bn EUR 0.56 0.78 1.02 1.24 1.35 1.46 1.57
As % of
GDP 0.35 0.46 0.56 0.64 0.66 0.67 0.68
Overall budgetary cost,
including EU contribution
Bn EUR 2.10 2.41 2.75 3.07 3.30 3.52 3.76
As % of
GDP 1.30 1.41 1.51 1.59 1.61 1.62 1.63
Source: Author’s Calculations
Table A 3.7 Scenario 7, EU Budget Increase, High GDP Growth, Max. EU Co-financing
Rate
2014 2015 2016 2017 2018 2019 2020
GDP Bn EUR 165.0 176.8 189.3 202.8 217.3 232.7 249.3
Contribution to the EU Bn EUR 1.6 1.7 1.8 1.9 2.1 2.2 2.4
Cohesion Funds
Contribution
Bn EUR
0.24 0.34 0.47 0.57 0.63 0.68 0.74
EAFRD contribution Bn EUR 0.09 0.09 0.09 0.09 0.09 0.09 0.09
Budgetary Cost, Cohesion &
EAFRD only
Bn EUR 0.33 0.44 0.56 0.66 0.72 0.77 0.83
As % ofGDP 0.20 0.25 0.29 0.33 0.33 0.33 0.33
Overall budgetary cost,
including EU contribution
Bn EUR 1.89 2.12 2.36 2.59 2.78 2.98 3.20
As % of
GDP 1.15 1.20 1.24 1.28 1.28 1.28 1.28
Source: Author’s Calculations
Table A 3.8 Scenario 8, EU Budget Increase, High GDP Growth, Lower EU Co-financing
Rate
2014 2015 2016 2017 2018 2019 2020
GDP Bn EUR 165.0 176.8 189.3 202.8 217.3 232.7 249.3Contribution to the EU Bn EUR 1.6 1.7 1.8 1.9 2.1 2.2 2.4
Cohesion Funds
Contribution
Bn EUR
0.47 0.69 0.93 1.15 1.26 1.37 1.48
EAFRD contribution Bn EUR 0.09 0.09 0.09 0.09 0.09 0.09 0.09
Budgetary Cost, Cohesion &
EAFRD only
Bn EUR 0.56 0.78 1.02 1.24 1.35 1.46 1.57
As % of
GDP 0.34 0.44 0.54 0.61 0.62 0.63 0.63
Overall budgetary cost,
including EU contribution
Bn EUR 2.13 2.46 2.82 3.16 3.41 3.67 3.94
As % of
GDP 1.29 1.39 1.49 1.56 1.57 1.58 1.58
Source: Author’s Calculations