rr-378 - 1974 national transportation study - narrative … · ann arbor bay city detroit flint...
TRANSCRIPT
Ann Arbor
Bay City
Detroit
flint
Grand Rapids
Jackson
Kalamazoo
lansinq ~
Muskegon
Saginaw
South Bend
Toledo ·.Sub-Total
Sma 11 Urban .ll.
Sma H Urban 8
" ~ Rest of State -~
---~---
~ Total I --- ----
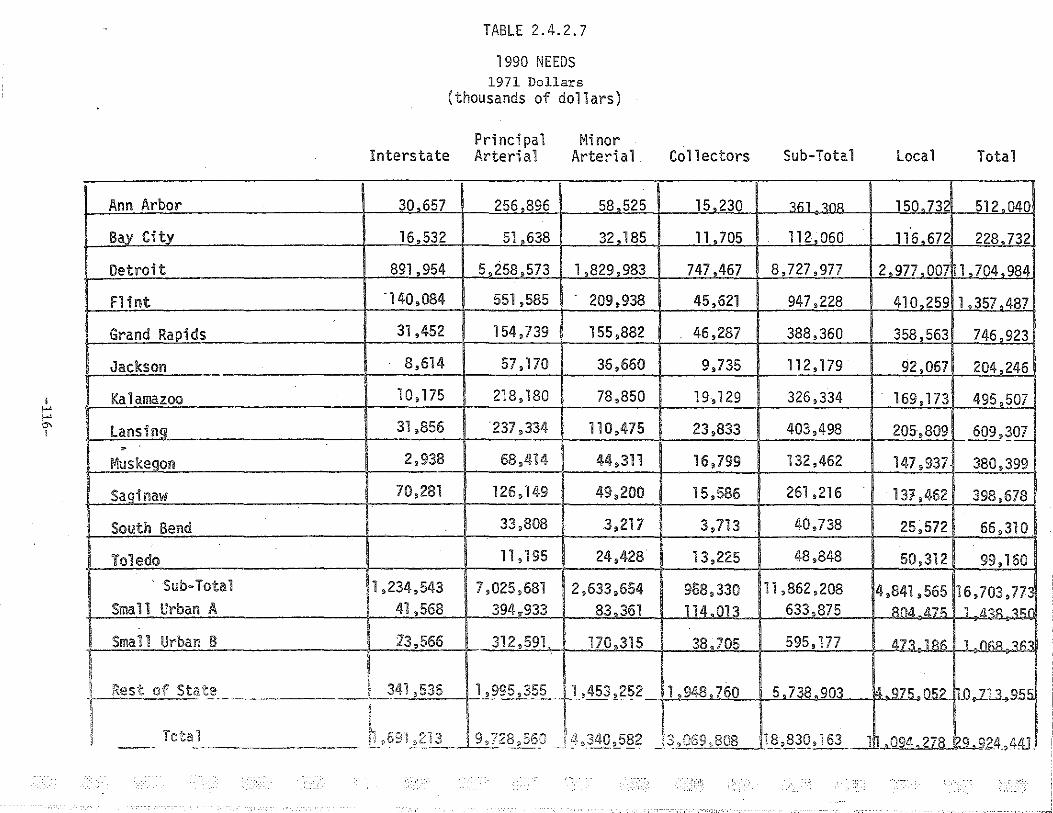
TABLE 2.4.2.7
1990 NEEDS 1971 Dollars
(thousands of dollars)
Principal Minor Interstate Arterial Arterial
30 657 256 896 58 525
16,532 51,638 32,185
891,954 5_,258 ,573 1,829,983
-140,084 551,585 209,938
31,452 154,739 155,882
8,614 57' 170 36,660
10,175 218,180 78,850
31,856 237,334 110,475
2,938 68,414 44,311
70,281 126,149 49,200
33,808 3,217
n, 195 24,428
1 ,234,543 7,025,681 2,633,654 41 ,568 394,933 83 361
13,566 312,591 170 315
! ' 341,536 1,_995,~_5§_ t-1,453,2~2 t ,,
h ~213 " 9 7~8 A "'40 582 1~--" . ·I 9 E £. __ , _ _ __ 7 s-_,)_2.... __ --~---
Collectors Sub-Total local Total
15,230 _3fil.3flR ~50 732 512 040
11,705 112_,060 116672 228 732
747,467 8,727,977 2_,_977_,007 1 704 984
45,621 947,228 41 0_,_259 1_,_357 487
46,287 388,360 358,563 746 923
9,735 112,179 92,067 204,246
19 '129 326,334 169,173 495,507
23,833 403,498 205,809 609,~QZ_
16,799 132,462 147,937 380,399
15,586 261 ,216 13i',462 398,678
3,713 40,738 25,572 66,310
13,225 48,848 50,312 99,160
968,330 11 ,862,208 4,841,565 16,703,773 114 013 63h875 801L47f'i 1 A":lQ ~<;r
3l.h705 595,177 _All._l_86_ ~ .!!_6.8_,.3.6.3
1 948,760 5 738 90_3_ l4_ ,.9_7 5_, Q52_ _OJ.U.9.55
~ '5 f'l~Q nns _i; ~ :7 'J.-··J; ..,. C; CU 1_~,8~Q. 163__] 1_,_094 228_ !a.9.24,44J_
Ann Arbor
Bay City
Detroit
Flint
Grand Rapids
oi-ltlLE <::.<t.2.b
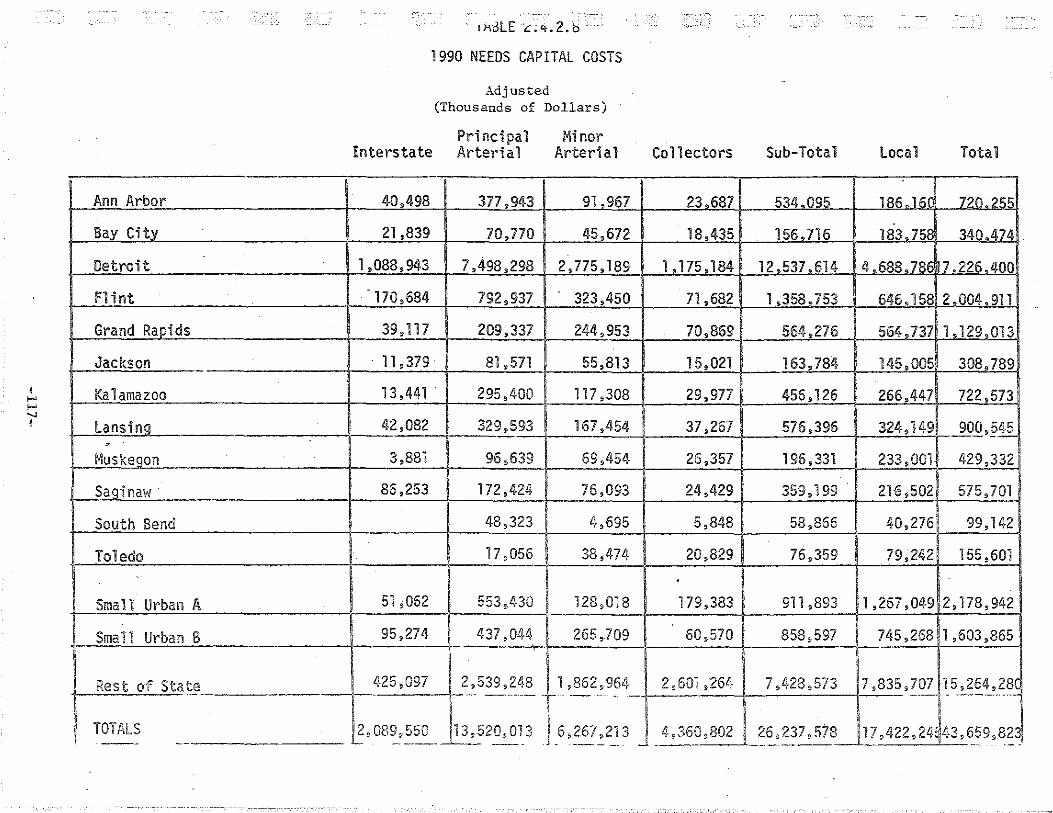
1990 NEEDS CAPITAL COSTS
Adjusted (Thousands of Dollars)
Principal Minor Interstate Arterial Arterial
40,498 377,943 91__,_967
21,839 70,770 45,672
1,088,943 7,498,298 2,775,189
170,684 792,937 323,450
39,117 209,337 244,953
Collectors Sub-Total local Total
23_,_687 534 095 186.16( 720.:?<;<;
18,435 156 716
1,175,184 12537614 468878€7226400
71,682 1,358 753 646 158 2 004 911
70,869 564,276 564 737 1 129 013
Jackson · 11,379 81,571 55,813 15,021 163,784 145,005 308 789 ~~~~----------------+-~~~~--~~~--~~~~--~~{---~~~t-~~~~~~q
Kalamazoo 13,441 295,400 117,308 29,977 456,126 266,447 722,573
~-=l~an"""s'-'-i :.:..ng,_ __________ +-__ 4_2_ '-' 0_8_2 --+--329, 593 167,454- 37,267 57 6, 396 324, 149 900, §_I]§_
Muskegon 3,881 96,639 69,454 26,357 196,331 233,001 429,332
Saqinaw 86,253 172,424 76,093 24,429 359,199 216,502 575,701 !
South Bend 48,323 4,695 5,848 58,866 40,2761 99,142
Toledo 17,056 i 38,474 20,829 76,359 79,2421 155,601
Sma11 Urban A 51,062 553,430 128,018 179,383 911,893 1,267,049 2,178,942
Sma 11 Urban B 95,274 437,044 265,709 60,570 858,597 745,268 1,603,865
1 I T_OTA_L~
Rest of sta.te 4-25,097 2,539,248 1,862,964 2,601,264 7,428,573 7,835,707 15,264,28( ~- r- --~-------1
----------- ~ 1,08~~-~-- 13~_5:;-01~ - 6,-~~67~2}3 J __ 4_,3_6_0_,8_0_2__,_ ___ 2_6_~237 ,578_117 ,422,24~43,_659,8~~
1 ,_. ..... 00
'
' I l I ' ' ' l I ' ~
Ann Arbor
Bay City
Detroit
Flint
Grand Rapids
Jackson
Kaiamazoo
Lansing
r'1Usl<egon
Saginaw
South Bend
Toledo
Small Urban A
Small Urban B
Rest of State ~=.- .. --,~~~--
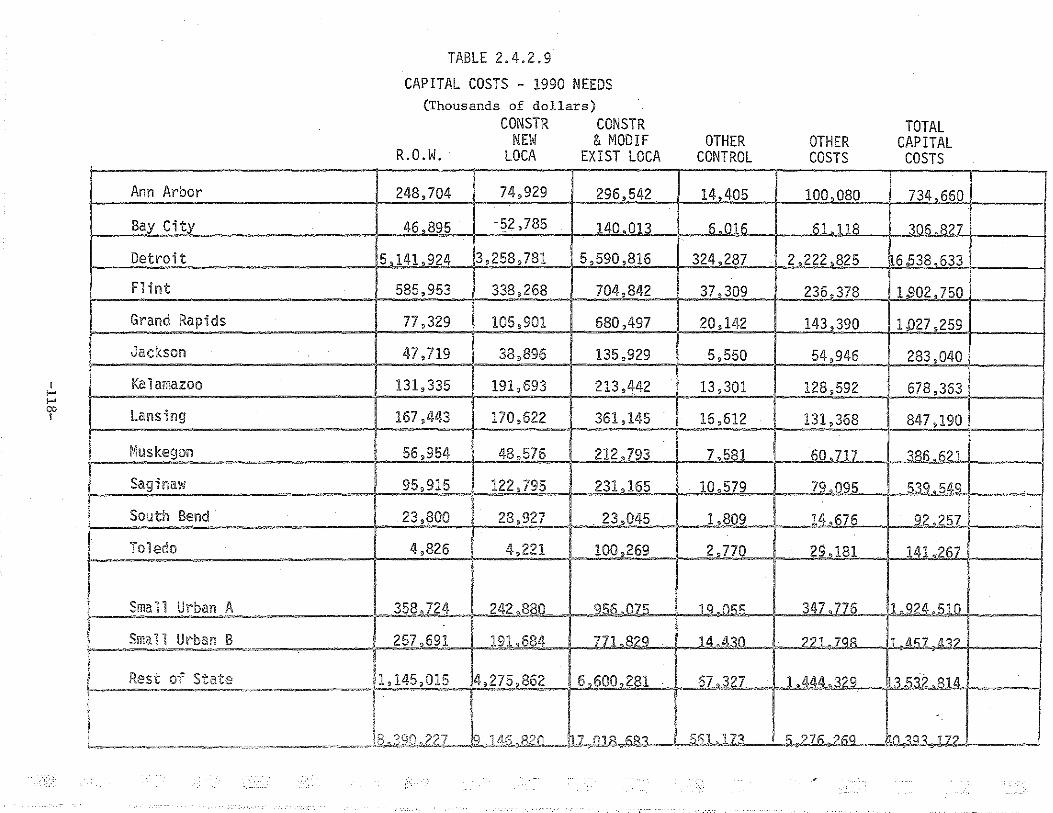
TABLE 2.4.2.9
CAPITAL COSTS - 1990 NEEDS (Thousands of dollars)
CONSTR CONSTR NEW & MODIF
R.O.W. LOCA EXIST LOCA
248,704 74,929 296,542
46,895 -52,785 140 013
5 141 924 3,258,781 5,590,816
585,953 338,268 704,842
77,329 105,901 680,497
47,719 38,896 135,929
131,335 191 '693 213,442
167,443 170,622 361,145
56,954 48,576 212 793
95,915 122,795 231,165
23,800 28,927 . 23,045 .
4,826 4,221 100,269
358 724 ?42 •. 880 956._.075 -257,691 191.684 771.829
b, 145,015 .
4,275,862 6_.,600_,_281
I J:-: .-.,,.-"n • ?_, In "fir ·'"~ '7 f'lHLhA-::t __ . JO -.o.dH2.-L-..J.;t_. I ··-~-b{J,_,.~--- -1 ,
=-7>''<'"-=----=-~·-r.~ . ..-"'~-~=~------~==-=""·- -~~- •
.
.
OTHER CONTROL
14,405
6.016
324 287
37,309
20,142
5,550
13,301
16,612
7 581
. 10 579
1,809
2,770
10 n~~
111,1!311
67 3?7
I
-
OTHER COSTS
100~080
61.118
2,222,825
236 378
143,390
54,946
128,592
131,368
60.717
79.095
14 676
. 29~181
347 776
??1. 7QA
.. 1 .1!44 329
5.6.1,,1_~
TOTAL CAPITAL
COSTS
734 660
306.827
6.538 633
~02_,750
1 f)27 ,259
283,040
678,363
847,190
386.621
5~ 549
92.257
lAJ 26i'
L9?LJ. .510
11 ll~7 ll'l?
13 !'i::l2 814
-
EILN3. 172

-
TABLE 2.4.2.10
CAPITAL COST PER CAPITA - 1990 NEEDS (Thousands of dollars)
Ann Arbor
Bav Citv
Detroit
Flint .
Grand Rapids
Jackson
Kalamazoo
Lansing
Muskegon
Saginaw
South Bend
Toledo
Small Urban A
Sma 11 Urban B
Rest of State I
TOTAL CAP COSTS/
CAPITA
3 113
2 950
3 051
3 447
2,122
2,748
3,443
2,575
2,762
2,916
2,428
3,139
3 525
3_,_260
8,453
l
TOTAL CAP COSTS/
VMT
0.49
0.59
0.46
0.53
0.40
0.41
0.51
0.37
0.43
0.50
0.63
0.88
0_. 94
0.57
0.39 - I
TOTAL CAP/COSTS
PMT
_l:U_5
0 35
0.33
0.35
0.27
0.27
0.42
0.26
0.28
0.33
0.39
0.49
0.55
0.34
0.18
I
I
!
I
I I
I !
J
' 1-' N 0 I
I i l I
Ann Arbor
Bay City
Detroit
F1 int
Grand Rapids
Jackson
Kalamazoo
l..ansinq ,
Muskeqon
Saginaw
South Bend
Toledo
Small Urban A
Small Urban 8
Rest of State - _____ _, ____
TOT,~LS --· -
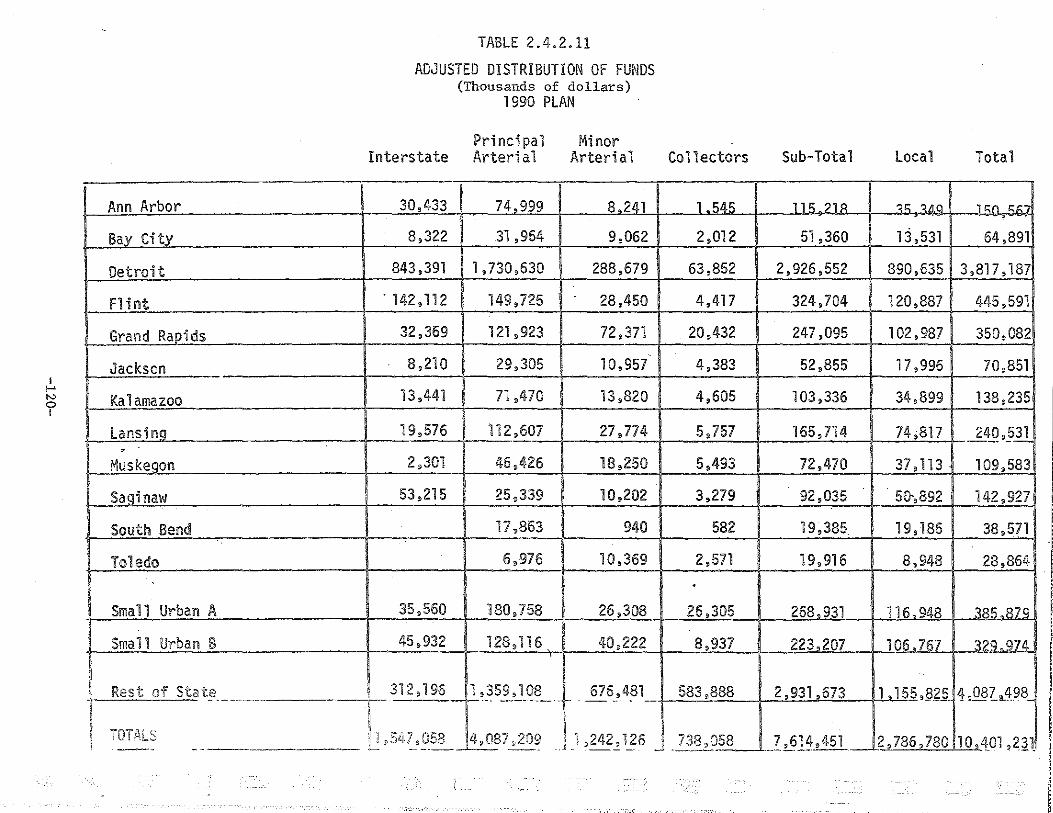
TABLE 2.4.2.11
ADJUSTED DISTRIBUTION OF FUNDS (Thousands of dollars)
1990 PLAN
Principal Minor Interstate Arterial Arterial
30,433 74,999 8 241
8,322 31 ,964 9,062
843,391 1,730,630 288,679
. 142,112 149,725 28,450
32,369 121 ,923 72,371
8,210 29,305 10,957
13,441 71 ,470 13,820
19,576 112,607 27,774
2,301 46,426 18,250
53,215 25,339 10,202
17,863 940
6,976 10,369 .
35,560 180,758 26,308
45,932 128,116 40,222
I 312,196 1,359,108 676,481
Collectors
1 545
2,012
63,852
4,417
20,432
4,383
4,605
5,757
5,493
3,279
582
2,571
'
26,305
8,937
583,888 1-- ·-· --------
11 ,242~1_26 -. 738,q58 I
14,087,209 l n 9058 ' .• !l ··- -----· -·
Sub-Total local
115.2lil 3'i 3L!Q
51,360 1 j '531
2,926,552 890,635
324,704 120,887
247,095 102,987
52,855 17,996
103,336 34,899
165,714 74;817
72,470 37' 113
92,035 5&,892
19,385 19' 186
19,916 8,948
26a,931 116 94R
223_.207 1 06,1J57
2,931,673 1, 155,11?~.
_z,6l~,451 2,786,780
Total
1 ~(l ~h7
64,891
3,817,187
445,591
350,082
70,851
138,235
240,_?1!
109,583
142,927
38,571
28,864
3R5.R7CJ
32CJ.CJ74
4 ,08£.._11:98_
10,4_01 ,2J1
' !: ., l: ' :-1 ' i I
I I I ! ! I I I
i I I
I I I
I " ' ,. (i
!

-,-_----- ·TAr 2.4- .2
SUMMARY OF NEEDS RETIRED
1990 PLAN
(thousands of dollars)
Principal Minor Interstate Arterial Arterial Collectors Sub-Total Local Total
Ann Arbor 23,038 53 809 6 745 1 224 84.B16 26.QQQ 111 .R15
Bay City 6,299 24,456 6,975 1,660 39,_390 10 319 49 709
Detroit 630,641 1,272,597 224,797 52,501 2 180,536 681,394 2 861 930 -
Flint 84,527 109,564 22,587 3,626 220,304 92 485 312 789
Grand Ri'lpids 26,128 100,694 . 59,561 16,496 202,879 78 821 281 700
Jackson 6,215 22,070 8,732 3,541 40,558 13,700 54,258
Kalamazoo 11 ,469 54,420 11 , 019 3,785 80,693 26,663 107,356
Lansing 14,819 85,833 22,049 4,712 127,413 57,271 184,684 --. Muskegon 1,742 34,840 14,956 4,507 56,045 28,395 84,440
Saginaw 43,517 19,550 8,292 2,695 74,054 38,930 112,984
South Bend 13,346 m 479 14,536 15,184 29,720
Toledo 5,812 8,548 2,120 16,480 6,843 23,323
Sma 11 Urban A 29,018 135 171 21 018 21 657 206 864 89.253 296.117_
Sma 11 Urban B 35,530 96,466 32,758 7,307 172 061 81 606 253 66l
Rest of State 342' 785 1 ,O"Z_'0_?13~ L533 '~96 ! 464,091 2,414 558 924,ZJ6 ~.,31~33~-
Total I - I J _590,491 5 '~1, 18? __ jg, 172' 6391,103 ,82§.._ --- ]_,255_,_~28 ___ .:5,10g_,_914 j_ 982,1_4fl
' ,_. "' "' '
! I
Ann Arbor
Bay City
Detroit
F1 int
Grand Ri!Jlids
Jackson
Kalamazoo
lansing '
Muskegon
Saginaw
South Bend
Toledo
Small Urban A
Sman Urban B
Rest of State ---~-~~
--- -
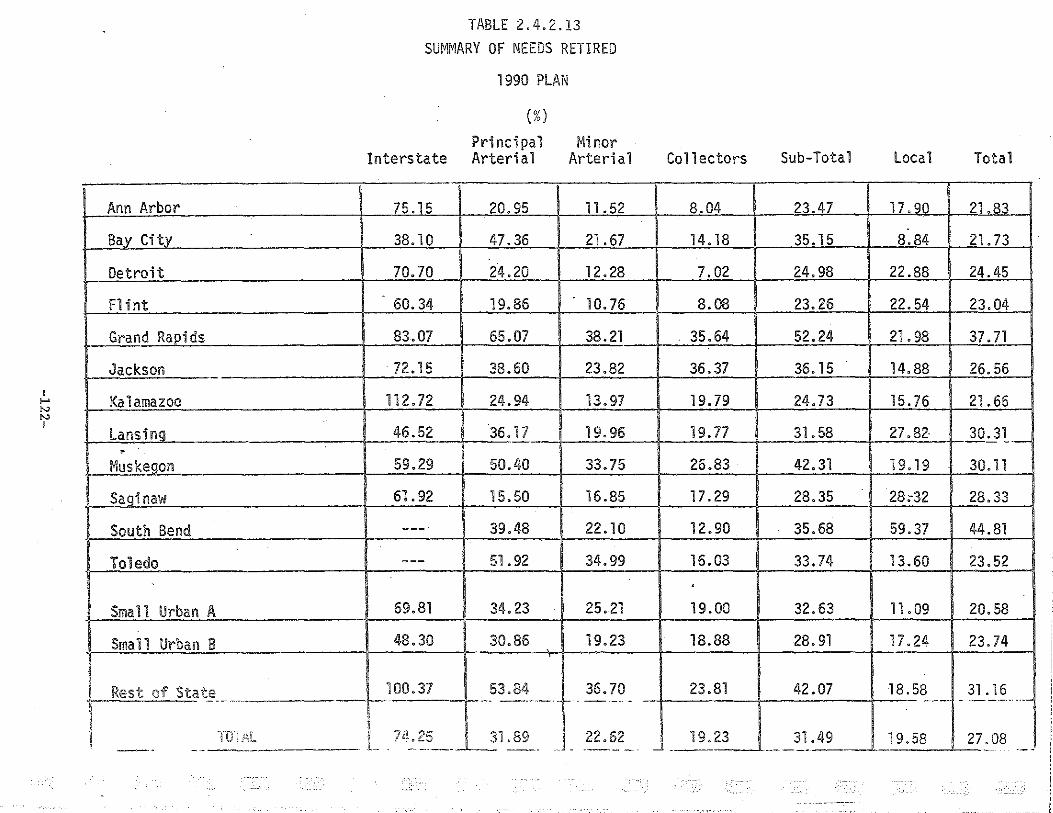
TABLE 2.4.2.13 SUMMARY OF NEEDS RETIRED
1990 PLAN
(%) Principal Minor
Interstate Arterial Arterial
75.15 20.95 11.52
38.10 47.36 21.67
70.70 24.20 12.28
60.34 19.86 10.76
83.07 65.07 38.21
72.15 38.60 23.82
112.72 24.94 13.97
46.52 36.17 19.96
59.29 50.40 33.75
61.92 15.50 16.85
--- 39.48 22.10
--- 51.92 34.99
69.81 34.23 25.21
48.30 30.86 19.23
100.37 53.84 36.70 ------- +----
~25 31.89 22.62 '-- . ------'---- -- -- - -----
Collectors Sub-Total Local Total
.
8.04 23.47 17.qo 21.83
14. 18 35.15 8.84 21.73
7.02 24.98 22.88 24.45
8.08 23.26 22.54 23.04
35.64 52.24 21.98 37.71
36.37 36.15 14.88 26.56
19.79 24.73 15.76 21.66
19.77 31.58 27.82- 30.~l-
26.83 42.31 19.19 30.11
17.29 28.35 28~32 28.33
12.90 35.68 59.37 44.81
16.03 33.74 13.60 23.52 .
.
19.00 32.63 11.09 20.58
18.88 28.91 17.24 23.74
23.81 42.07 18.58 31 . 16 ---- - ·---------
19.23 31.49 19 0 58 27.08 ___I _!_ ----- ---· -
-- --------·. -- "'

constraints assumed for the 1990 Plan, that only 27% of Michigan's highway
Needs can be met. As this table shows, the percent of needs met for the lower
functional classifications for most geographic areas is considerably smaller.
For example, local roads would have only 19.6% of the needs met. As was
previously mentioned, it was assumed that 100% of the local roads new construc
tion costs would be met by private funding sources, however, the very small
amount of funds available for widening, resurfacing and reconstruction required
during the time period led to the small total percent of needs met. It will be
noticed in this table that two of the geographic areas show needs met of some
what over 100%. This apparent anomaly is due to the fact that this table
reflects the prelimihary allocation of funds presented in the preceding tables,
and does not reflect minor adjustments which were made in succeeding steps of
the Plan development as wi 11 be discussed in the succeeding section.
-123-

- - ---... ---~-. -- ---. ____________ _.,. --------- --------------- ---------------- ------ ----~~--~ ~---~~----------~----~---=-~-~~==-.,_,._..,...-..,-.-__,._.,.,._,_,_,.,-_,._.._""""--·-,_,--.=.,..,--~-...~
2.4.2.3 1990 Plan Development Summary - Highways
In order to finalize development of the 1990 Plan, it was thus
necessary to constrain highway needs by available funds, in order that
physical state data and performance measures reported for the 1990 Plan
for the 1974 NTS correspond to those which would be realized via the
expenditure of available funding rather than the funding levels which
would be necessary to achieve 1990 Needs as reported in the 1972 NTNS.
The starting point for this analysis was, because of time and resource
limitations, the 1990 Needs. The first step was the determination of 1990
needs, by improvement type and by 1990 functional classification, for
each urban area, small urban aggregates, and the rest of state. The major
improvement types considered were: 1) new location construction and right
of-way, 2) major widening, 3) minor widening, 4) resurfacing with shoulder,
5) resurfacing, 6} structures, and 7) reconstruction. For each cell in
this matrix, needs costs estimates were adjusted to account for increases
in the FHWA construction cost index and historical increases in right-of
way acquisition costs in order to update the status as of January 1, 1972.
Adjustments were also made to reflect project completion up to this point.
After these needs had been updated, percent needs represented by each
improvement type for each functional classification for each urban area
were determined. Based upon this distribution of reported needs, funds
were allocated by improvement type, in accordance with its relationship to
other needs by improvement type, and final funding allocations by
functional classification thus developed.
The 1974 NTS requires that construction costs reported reflect the
effects of differential changes between consumer price index increases
-124-
::-
! .. ;!
J_'
and construction and right-of-way cost increases. Data furnished by DOT
for study purposes indicated that this rate was 2% per year increase for
construction related expenditures. Data developed from Michigan right-of
way acquisition cost data indicated that right-of-way costs have increased
historically at a rate of 7% per year, or for projection purposes, a 4.6%
per year increase relative to study general inflation assumptions.
The inclusion of these cost adjustment factors necessarily requires
that some assumptions be made with respect to project implementation
schedules for each improvement. Clearly study time and resource limitations
did not permit an assessment of each improvement on a project by project
basis, and the subsequent scheduling of each project. In light of this, it
seemed that the most reasonable approach available was to segment the
eighteen year study span and develop several spending profiles which would
be reflective of improvement spending profiles during each segment. These
profiles thus developed inherently assume equal rates of activity completion,
e.g. equal number of miles of new construction annually for a given
improvement type/functional classification combination. The three segments
selected are for 1972-1981, 1981-1990 and 1972-1990 time periods. Principal
project activities were allocated to the appropriate study segment. For
example, all interstate new construction was assumed to occur during the
first segment. The assumption of equal annual levels of project activity
results in a non-linear pattern of annual expenditures, thus compensating
for the increasing receipt of funds from Federal, Motor Vehicle Highway
Fund, and local sources.
The resulting construction profiles were used to adjust expenditures
based upon funding allocations by improvement type and functional classifi
cation. These adjustments have the net effect of reducing allocated funds
-125-

--------~-----------------------~------~~-~~-·-~'TI
to 1971 dollars and 1971 construction cost index values. Thus they are
directly comparable with the 1971 dollar stated needs, since they reflect
project costs which would have been incurred were the project completed in
1971.
Percent needs met were again recomputed in a manner which reflects
the true percentage of stated needs which are met by projected funding
availability in the 1972-1990 time period.
Adjustments to physical state data have been made on the basis of
the percentage of change between the needs and the 1972 Inventory which
can be met by available funding, and thus all 1990 Plan inputs reflect
the status of the Michigan highway system which would result from
expenditure of projected funds as stipulated by DOT study requirements.
-126-

PLAN REFINEMENT
The Plan developed in the first step of this process was reviewed
with Transportation Planning Directors or their representatives for each
of the urban areas. During this series of meetings several anomalies
were noted and subsequently used as a basis for refinement of the Plan.
Funding was reallocated, primarily within a given urban area, in
order to reflect two key considerations. First of all, funds were real
located in order to insure the completion of Michigan's portion of the
Interstate system. Secondly, from the meetings with the urban areas,
it was observed that the reduced levels of funding available would
require considerably more resources for projects of a "stop-gap" nature,
primarily resurfacing. Funds were thus reallocated, primarily from
reconstruction, to cover the cost of requisite measures of this type.
The first step in the reallocation of funds for the Interstate system was
a calculation of Interstate new construction completion costs based upon
study assumptions regarding relative price changes in construction and
right of way acquisition costs. If sufficient funds for Interstate had
already been allocated to a given urban area and the new location allo
cation was not sufficient, funds were taken from other Interstate improve
ment types and allocated to new location. If this was still not sufficient
to ensure Interstate completion, the required difference was reallocated
from other urban or rural areas out of funds allocated for non-new location
Interstate projects.
.-127-
Thus the reallocation of funds for resurfacing activities allowed
for meeting an even lower percentage of construction needs which would be
necessary to adding both mileage and capacity to the system. It was
therefore necessary to make adjustments in the majority of the physical
state and design type information by functional classification for each of
the urban areas as well as the calculation of resulting changes in
performance measures and capital costs.
The starting point for the determination of the physical state which
would be realized in the 1990 Plan was the determination of total mileages
by 1990 functional classification, and by 1990 design type for non-local
classifications. The basis of the procedure used for these adjustments
was first of all a calculation of construction costs on a per mile basis,
and secondly, information avai 1 able on the needs printout by improvement
type. The needs printout for new location was assumed to have two
principal components: (1) the needs required for new location which would
add mileage to the system, and (2) the needs for major construction
projects of a relocation nature which would not add mileage to the system.
Based upon the reallocation of funds to the new location improvement type
by functional classification, the number of miles which could be added to
the system based on the needs per mile cost, as adjusted for differential
price changes, was computed. If the resulting new mileage was greater
than the new mileage reflected in the difference beb1een the 1972 Inventm"y
and the 1990 Needs, only that portion of the mileage reported for the
Needs was added to the system. The remaining funds were assumed to be
relocation improvements which would add capacity and design type upgrades
without new mileage.
-128-
'--, T:- --\
The next step in the adjustment of the physical state was the
adjustment of capacity miles for Interstate, principal arterials and
minor arterials. There are four basic improvement types which added
capacity for the Needs. These are new locat·ion, relocation, major
widening and reconstruction. Based upon the funding reallocation and the
assumption that equal construction dollars for each improvement type will
add equal capacity, the capacity miles were recomputed. Capacity miles
added by 1990 for the Needs were determined by taking the capacity miles
for the Needs and subtracting Inventory capacity miles for each of these
functional classifications. The capacity miles which could be added with
available funds were determined by factoring these capacity miles by the
percent of needs met for each improvement type which adds capacity.
Capacity mile increases due to new location construction were determined
separately based on standard capacity mile per mile ratios and added to
capacity mile additions from major widening, etc.
The next adjustment to be made in the physical state was the deter
mination of annual vehicle hours to be reported for the 1990 Plan. The
starting point for this analysis was the determination of average speed
and volume capacity relationships for each functional classification.
Average speed, by functional classification, was determined for the
Inventory and for the Needs by dividing annual vehicle miles by annual
vehicle hours reported. In addition, volume capacity ratio estimates
were derived for (a) the Inventory, (b) the Needs, (c) an assumption of
no capacity improvement, and (d) the 1990 Plan. These ratios were
obtained by dividing annual vehicle miles by capacity miles. While
this ratio does not represent the actual volume capacity ratio since it
~129~
------------- - - --- ---------------------------------- ------------- ---<~ -~~~~~-~~~--~~~~~~-~-~"'""''
is not based on one way peak hour estimates of vehicle miles and directional
splits, it is nevertheless indicative of relative percentage changes in the
volume capacity ratio based upon a constant relationship between the per
centage of annual vehicle miles and peak hour one way vehicle miles.
It was assumed that vehicle mile assignments by functional classifi
cation (but not by design type) would remain valid for both the Needs and
the 1990 Plan since vehicle mile estimates were presumably based upon an
assignment of projected 1990 trips in each urban area and the resulting
assignment of these trips to a highway network which was substantially the
same in terms of location for both the Needs and the Plan.
A comparison of the volume capacity estimates was made and resulting
average speeds by functional classif·ication was determined. For example,
if the volume capacity estimate for the Plan was substantially the same
as that for the Needs, the average speed as determined from the Needs was
used for the Plan. If the volume capacity relationship for the Plan was
closer to that reported in the Inventory, the average speed as determined
from the Inventory was used for the Plan. If the volume capacity estimate
for the Plan approached the serious degradation represented by no capacity
improvements by 1990 (i.e. 1990 projected vehicle miles/1972 capacity), a
downward adjustment in the average speed was made for the given functional
classification. Volume capacity estimates could not be made for collectors
and local roads with information available in the Plan and the Needs.
Since the majority of all new local road mileage was assumed to be completed
by 1990 amd there was very 1 i ttl e capacity related improvement reported in
the Needs for local roads, average local road speeds remained constant from
the Needs to the Plan.
-130-
Average speed for collectors for the 1990 Plan were based upon a
comparison of average speeds in the Inventory and in the Needs vis a vis
average percent completion of collector Needs which were related to capacity
improvements for this functional classification.
After the determination of average speeds by functional classification
for the 1990 Plan, vehicle hours for the plan were calculated by dividing
the annual vehicle miles by the adjusted average speed for each functional
classification.
The next step in the refinement of the 1990 Plan was to make all
requisite changes necessary for reporting mileage, vehicle miles, vehicle
hours and capacity miles by 1990 design type for non-local functional
classifications. The starting point for this analysis was the reporting
by design type for the 1972 Inventory. New mileages added by functional
classification in the Plan as previously determined were assigned to the
appropriate 1990 design type. It was assumed that, if possible, all
freeway mileage would be completed. Thus, all Interstate new location
was assigned to freeways and remaining freeway mileage obtained from
principal arterials. The remaining new location arterials were assigned
to the four or more lane category. Collectors were assigned to the less
than four lane category. In addition to design type changes resulting
from new construction, it was recognized that many of the projects reported
in the Needs were oriented toward upgrading existing principal and minor
arterials from less than four lanes to four or more lanes. The starting
point for the determination of these upgraded mileages was the printout
of Needs by improvement type. From this printout it was possible to
determine upgrading reflected in the Needs by design type for reconstruction,
~131-
major widening and relocation improvements. The number of miles to be
upgraded to four or more lanes from relocation projects, if any, was
calculated by using average per mile costs reported in the Needs and
assigning the remainder of new location funds after all new location was
completed to retiring relocation Needs. The number of miles to be upgraded
in major widening and reconstruction projects for principal and minor
arterials was determined from the number of miles of upgrading represented
in the Needs factored by the needs which could be met with the allocation
of available funding for these functional classifications .and improvement
types. The 1990 Plan mileage by design type was then computed by taking
the net additions since 1972 for freeways and other four or more lane
roads and subtracting from the less than four lane category upgraded
mileage.
Vehicle mile assignments by 1990 design type were determined by
factoring 1990 vehicle mile projections by the ratio of 1990 Plan to 1990
Needs mileages. Vehicle hours by design type for the Plan were determined
by assigning all Interstate vehicle hours to freeways and by determining
the number of other principal arterial vehicle hours assignable to freeways.
Vehicle hours for other four or more lanes roads were determined by
dividing the number of vehicle miles assigned to this design type by the
average speed for other principal arterials which was determined in a
manner previously discussed. Remaining vehicle hours for non-local
functional classifications were assigned to the less than four lane categm''
Freeway capacity miles were determined by adding Interstate capacity miles
for the Plan to the number of capacity miles of other principal arterials
included in the freeway category. It was assumed that all principal
-132-
arterial capacity improvements were made with freeway capacity improvements
receiving the highest priority. Thus, in most cases where 1990 Needs
freeway mileage could be completed with available funding, the funding was
also sufficient to cover capacity additions on other principal arterial
freeways. Therefore, the majority of capacity miles which could not be
added in the 1990. Plan were due to unavailability of funding for projects
such as Interstate major widening.
1990 Plan Performance Measures
The adjustments in the physical state data to be reported for the 1990
Plan required that the many of the performance measures (Items 7-20} be
recalculated to reflect the Plan physical state rather than the 1990 Needs.
It was assumed that the changes for the Plan would not result in any changes
in car occupancy factors, average trip lengths, or passenger trips since --------~~-- ---~-
these were based upon 0-D trip assignments and other studies performed
for each urbanized area and the rest of the state.
Items which were recomputed for the Plan include freeway capacity miles
per capita, freeway capacity miles per square mile, freeway vehicle miles
per capita, vehicle miles/vehicle hours and percent arterial vehicle miles
on freeways. Each of these items was recomputed per DOT instructions
contained in Manual II. It was also necessary to recompute freeway vehicle
miles/freeway capacity miles for each of the urban areas and for the rest
of state. This was done by assuming that there would be no change between
the peak hour one way vehicle miles and total annual vehicle miles between
the Needs and the Plan. The computational procedure was as follows:
-133-
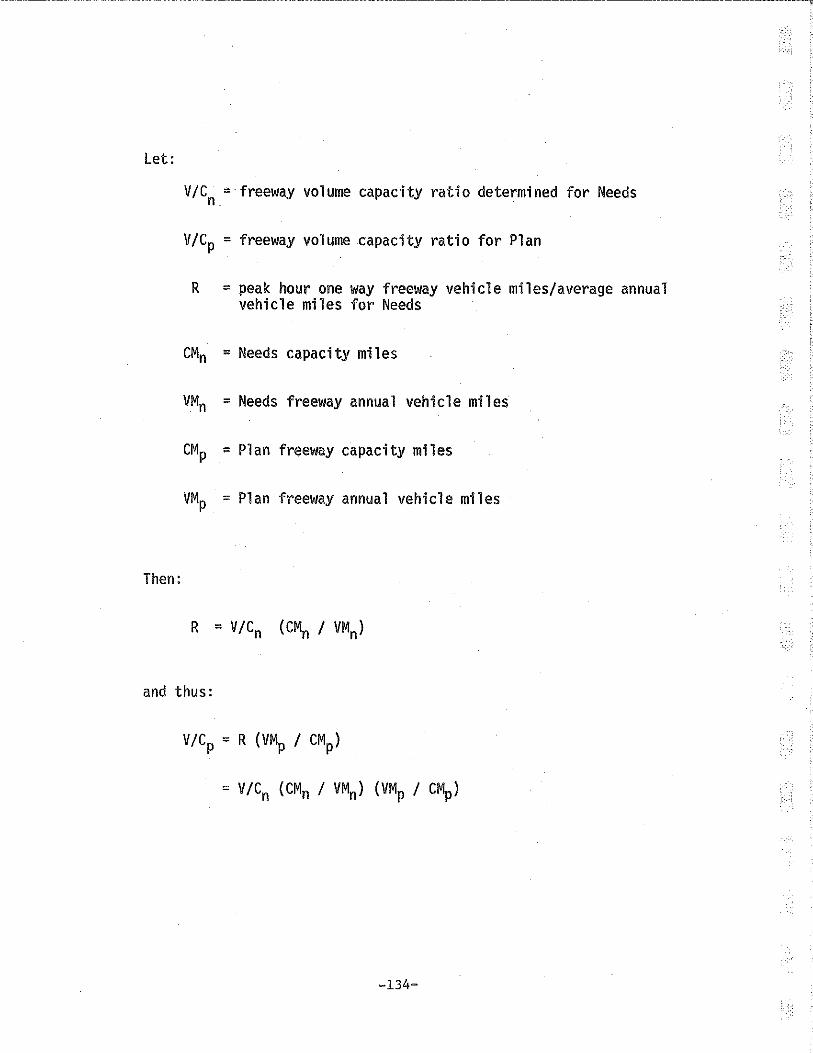
Let:
Then:
V/C = freeway volume capacity ratio determined for Needs n.
V/Cp = freeway volume capacity ratio for Plan
R = peak hour one way freeway vehicle miles/average annual vehicle miles for Needs
CMn = Needs capacity miles
VMn = Needs freeway annual vehicle miles
CMp = Plan freeway capacity miles
VMP = Plan freeway annual vehicle miles
and thus:
-134-

i-:.
i--
The resulting 1990 Plan volume capacity ratios for the urban areas
in many cases shows a serious degradation of highway system performance
occurring between 1972 and 1990. This is due predominantly, of course,
to the lack of capability to fund projects which would add needed
capacity to the arterial functional classification.
Because of the increased congestion resulting from the 1990 Plan, it
was assumed that annual injury and fatality rates per 100 million vehicle
miles would be increased by 5% over the rates projected for the 1990 Needs.
Because of the nature of the 1974 NTS reporting requirements for pollutants
(CO, NOx, HC), it was decided that the primary parameters for pollutant
calculations were vehicle age distributions and other factors related to
annual vehicle miles. Effects due to slight variations in average vehicle
speed would not significantly affect pollutant calculations. Hence,
pollutants reported for the 1990 Needs as developed by procedures
documented elsewhere, were used for the Plan.
Capital Costs
Capital costs were reported as a total for each of the five functional
classifications. These capital costs are exactly equal to the funding
allocation by functional classification, since it is assumed that each
dollar allocated will be spent. Federal aid eligible costs for the Plan
were assumed to be all costs for non-local functional classifications
which would be incurred for all improvements except resurfacing. It is to
be noted that this NTS data item does not represent Federal Aid which
would be received but rather the total of all projects whose costs would
be eligible for some form of Federal Aid.
---- -----11

In addition, capital costs were to be reported for the total capital
costs over all functional classifications broken into five categories:
right of way, new location construction, existing location construction
modification, and other existing location capital costs. In addition,
traffic control capital costs were to be reported separately, however, data
on traffic control costs for non-local functional classifications was not
available. Right of way capital costs were developed as previously
discussed, taking into account relative changes between right of way
acquisition costs and the consumer price index. New location construction
costs were obtained from previously described funding allocations to new
location construction less right of way acquisition costs. Existing
location improvements were split between construction and modification and
other costs in the same manner that these costs were distributed for the
1990 Needs.
Maintenance and administrative costs were developed for non-local
functional classifications on a per mile cost basis for the 1990 Needs.
These costs were adjusted to account for three factors. First of all,
they were adjusted to account for the increase in maintenance costs in
1971 dollars from the 1969 dollar figure developed for the Needs.
Secondly, they were adjusted for differential increases in maintenance costs
of 0.9% per year as described in Manual II. Thirdly, they were adjusted fm·
Needs mileages which could not be funded under the 1990 Plan. Local roarl
maintenance costs were developed based upon 1971 per mile local road main
tenance expenditures as reported in the annual report. These per mile
costs were then extended to a total by using the 1990 Plan local road
mileages. The resulting total local road maintenance and administrative
-136-
! j
costs were then adjusted for differential maintenance cost/CPI changes
for the year 1989. For each urban area local and non-local functional
classification maintenance and administrative costs were added. As described
in a previous section, it was recognized that the reduced funding available
for the 1990 Plan would result in increases in required maintenance
activity. Consistent wHh the assumption used in the projection of funds
available for capital costs fl'1om state and local sources, resulting
maintenance and administrative costs were increased by 10% for each urban
area. The state total for maintenance and administration costs for all
functional classifications amounted to approximately 1/16 of the total
projected state funds for 1972 to 1990 available for covering administrative
and maintenance costs. With the assumed year by year profile of gas tax
revenues, this amount is almost exactly the projected figure for 1989, and
thus the reasonableness of 1989 maintenance and administration costs for
highways is totally consistent with 1990 Plan funding projections.
Capital cost ratios (Items 40-42) were computed per Manual II instructions.
Appendix S shows the detailed set of calculations utilized in the
development of the 1990 Plan for each of the individual urban areas, small
urban aggregates and rest of state.
-137-
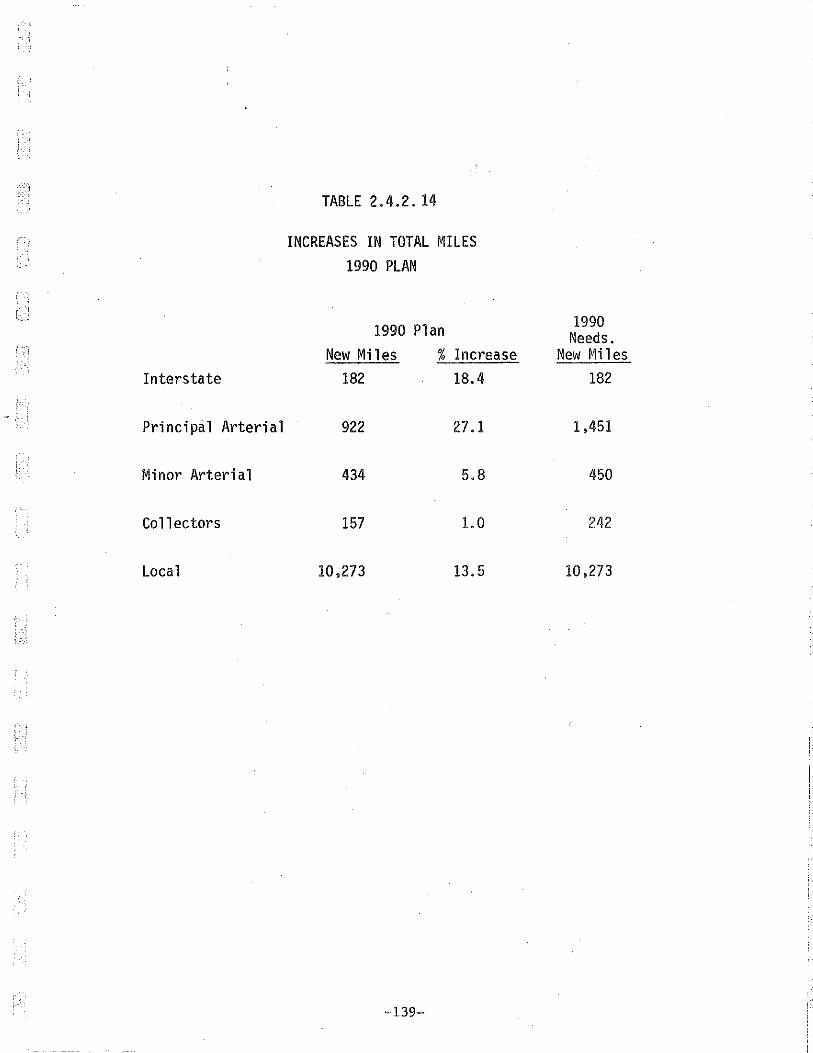
2-4.2.4 1990 Highway Plan Cost, Physical State and Performance
Table 2-4.2.14 shows the mileages which would be added to Michigan's
highway system with implementation of the 1990 Plan and a comparison of these
new mileages in terms of the percentage increase in mileage and in terms of
a comparison with the 1990 Needs. As this table shows, the reduced funding
available for highway construction during the period results in a considerable
short-fall with respect to needed new mileage for arterials and collectors.
Table 2-4.2.15 shows capacity miles which would be added to the State's
highway system for the arterial functional classifications upon implementation
of the 1990 Plan. This table depicts these increases in capacity miles resulting
from Plan implementation for both urban areas and for the rest of state. While
these.percentage increases would appear to be fairly substantial during the
time period, they fall far short of projected percentage increases in vehicle
miles for 1990 as shown in Table 2-4.2.'16.
Table 2-4.2.16 summarizes projected 1990 vehicle miles for each functional
classification and shows the distribution of these projected increases between
urban areas and the rest of state. Comparisons between this table and the
preceding table highlight the possibility of reduced system performance in 1990
under the funding constraints imposed on the development of the 1990 Plan.
Thus for example, in urban areas, Interstate volume is projected to increase
by·126%, while the capacity for the Interstate system would be increased only
approximately 30% under the 1990 Plan. Another area of potentially great shor·t>,
fall with respect to capacity could be on principal arterials utilized fo>"
intercity traffic. For this functional classification, funding available per~
mitted only a 46% increase in capacity, while extremely large increases are
anticipated in traffic volumes on these roads. It is to be noted here that
the capacity mile projections shown in Table 2-4.2.15 includes capacity to
be added to the system through new highway construction during the period.
-138-
Interstate
_, :-
Principal Arterial
Minor Arterial
Collectors
Local
TABLE 2.4.2. 14
INCREASES IN TOTAL MILES 1990 PLAN
1990 Plan New Miles % Increase
182 18.4
922 27.1
434 5.8
157 1.0
10,273 13.5
-139-
'
1990 Needs.
New Miles 182
1,451
450
242
10,273
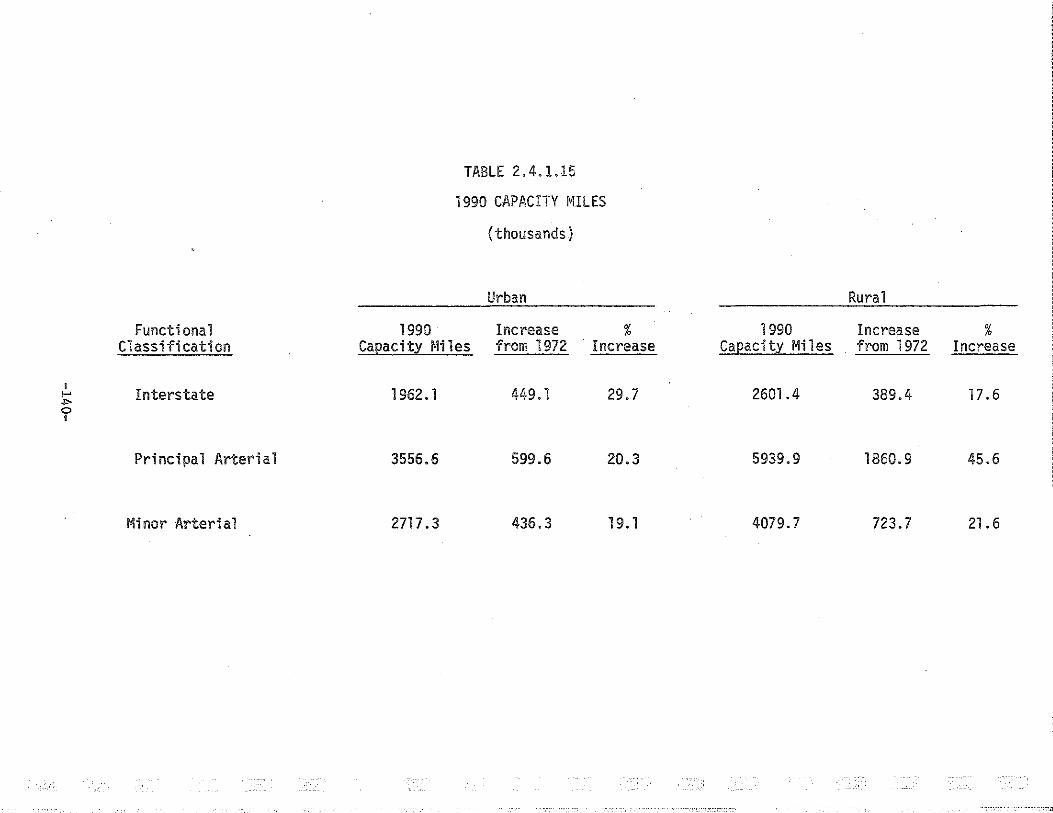
TABLE 2. 4.1.15
1990 CAPACITY MILES
(thousands)
Urban Rural
Functional 1990 Increase % 1990 Increase % Classification Capacity Miles from 1972 · Increase Capacity Miles from 1972 Increase
I Interstate 1962.1 449.1 29.7 2601.4 389.4 17.6 ,_. ..,.
0 •
Principal Arterial 3556.6 599.6 20.3 5939.9 1860.9 45.6
Minor Arterial 2717.3 436.3 19. l 4079.7 723.7 21.6
; i
--~
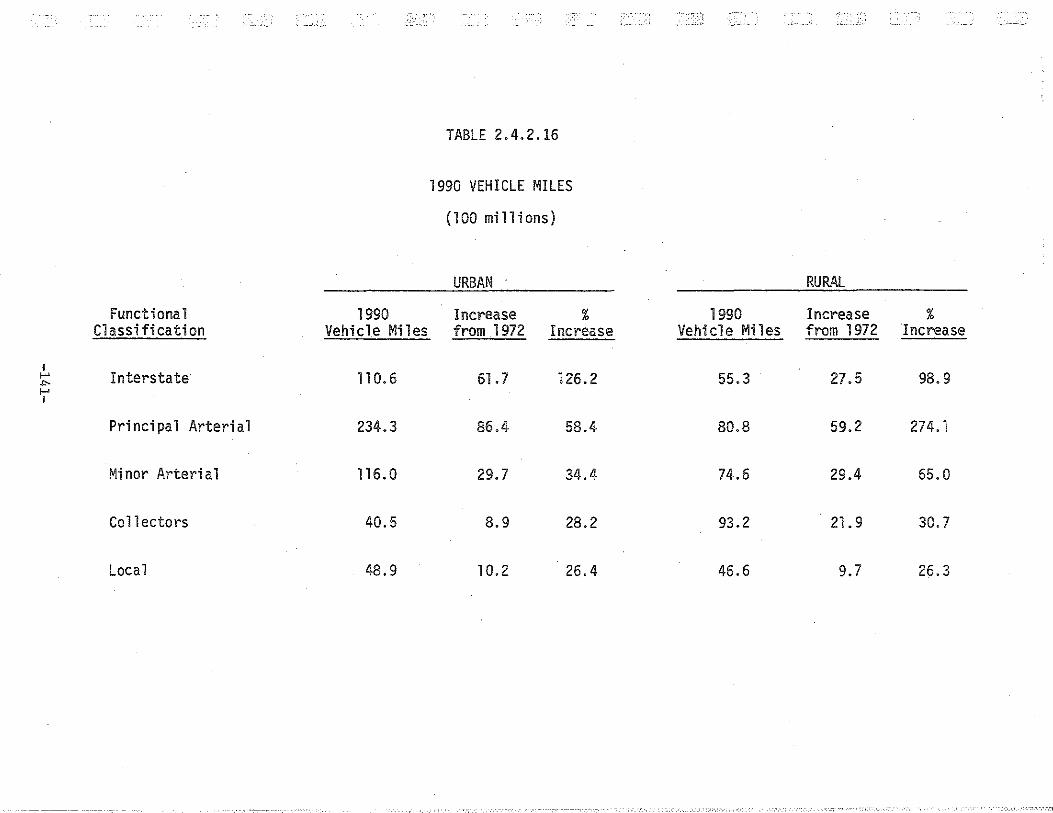
TABLE 2.4.2.16
1990 VEHICLE MILES
( 1 00 mi 11 i ons)
URBAN RURAl
Functional 1990 Increase % 1990 Increase % Classification Vehicle Miles from 1972 Increase Vehicle Miles from 1972 Increase
l >-' Interstate 110.6 61.7 126.2 55.3 27.5 98.9 ..,. >-' I
Principal Arterial 234.3 86.4 58.4 80.8 59.2 274.1
Minor Arterial 116.0 29.7 34.4 74.6 29.4 65.0
Collectors 40.5 8.9 28.2 93.2 21.9 30.7
Local 48.9 10.2 26.4 46.6 9.7 26.3

Table 2.4.2.17 summarizes highway related pollutants developed for
the 1990 Plan. These pollutant levels are considerably reduced in all respects
from those levels of the 1972 Inventory. These effects are primarily due to
anticipated decreases in vehicle exhaust emissions on a vehicle mile basis for
later model year cars and trucks.
Table 2.4.2.18 summarizes anticipated highway related fatalities and
injuries for the 1990 Plan. Increases are noted in total fatalities and
injuries, due primarily to projected increases in total annual vehicle miles
for the State's highway system. Reduction in per vehicle mile statistics
are noted due to anticipated safety features of newer model cars and benefits
of State highway safety programs.
Total annual costs for the 1990 Plan for maintenance and operation of the
State Highway System during calendar year 1989 were 486 million dollars.
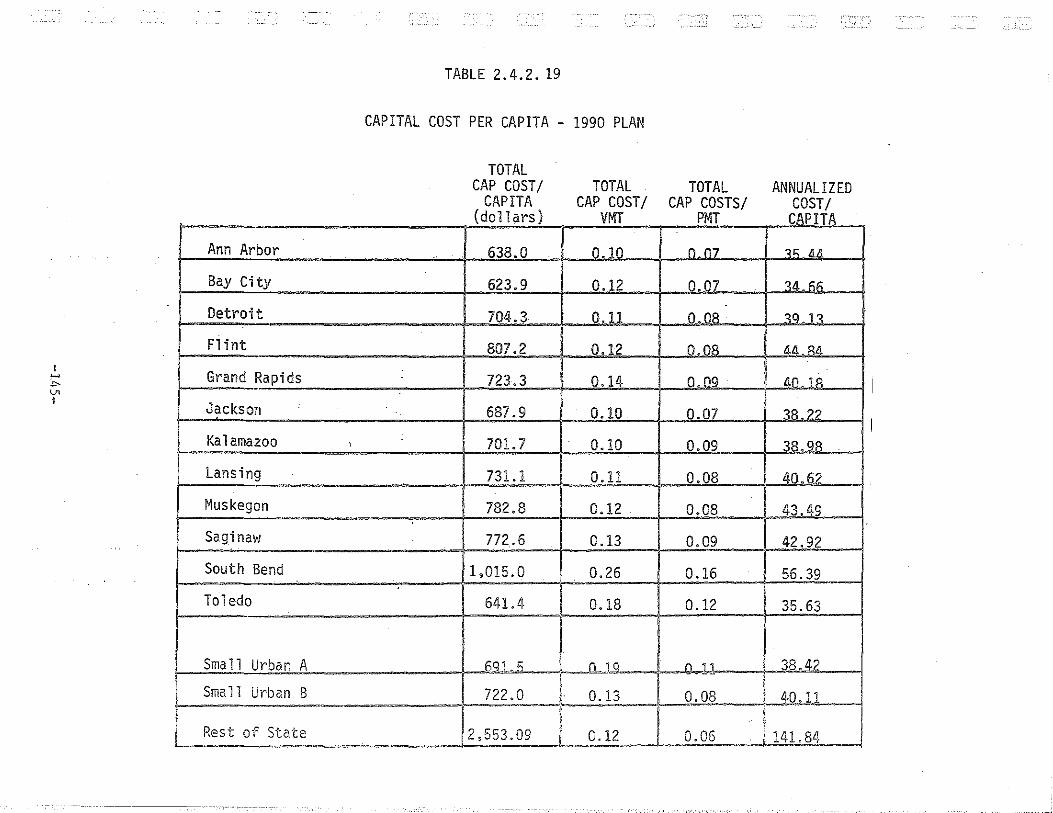
Table 2.4.2.19 shows the total capital costs on a per capita, per vehicle
mile, and per passenger mile basis for each geographic area in the State, as
well as an annualized value for these per capita capital costs.
-142-

I Oxides of Nitrogen ,_. ..,. w I
Hydrocarbons
Carbon Monoxide
TABLE 2. 4. 2. 17
SUMMARY OF HIGHHAY RELATED POLLUTANTS
1990 PLAN
Pounds Pounds/ (millions) vr-rr
517 .0057
166 .0018
933 .0104
Pounds/ Pounds/ PMT Capita
.0040 49.7
• 0012 16.0
.0070 89.7
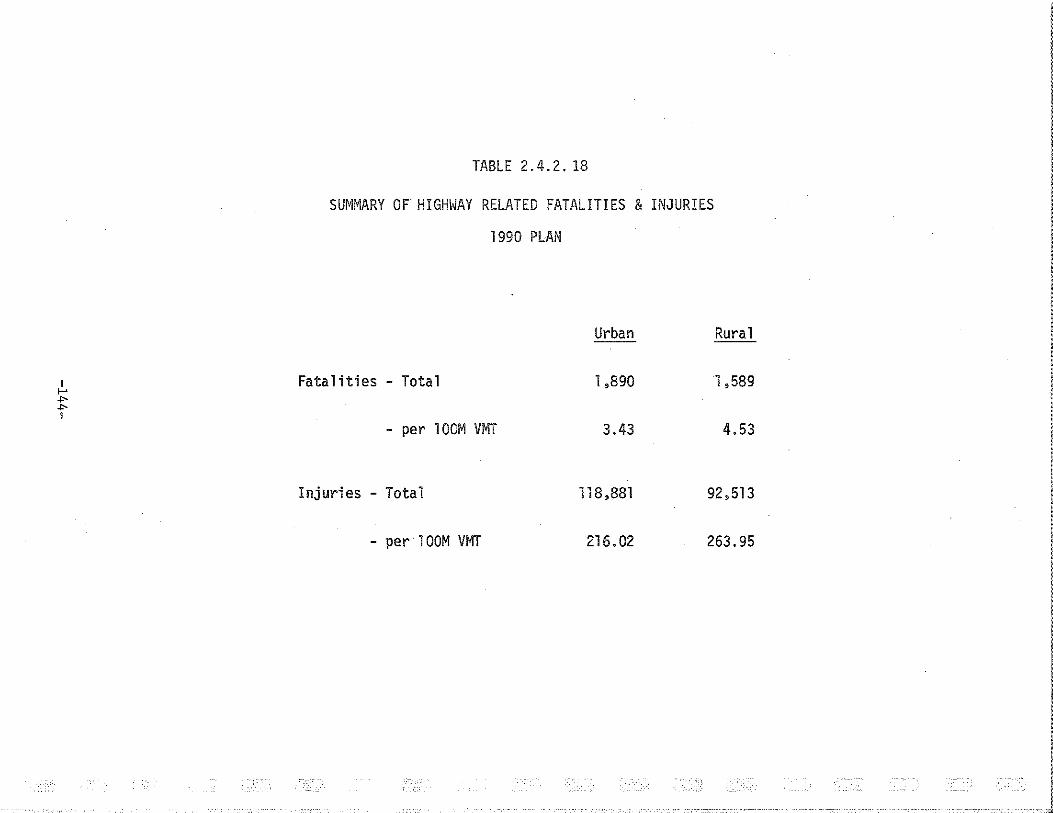
TABLE 2.4.2. 18
SUMMARY OF. HIGHWAY RELATED FATALITIES & INJURIES
1990 PLAN
Urban Rural
I Fatalities >-'
- Tota 1 1,890 1 ,589 ..,_ .,. I
- per 1OOM VMT 3.43 4.53
Injuries - Total 118,881 92,513
- per lOOM VMT 216.02 263.95
Ann Arbor
Bay City
Detroit
Flint
Grand Rapids
Jackson
Kalamazoo '
Lansing .
Muskegon
Saginaw
South Bend
Toledo
Sma 11 Urban A
Small Urban B
Rest of State
TABLE 2.4.2. 19
CAPITAL COST PER CAPITA - 1990 PLAN
.
TOTAL CAP COST/
CAPITA (dollars)
638.0
623.9
704.3
807.2
723.3
687.9
701.7
731.1
782.8
772.6
1,015.0
64l.Ll
69l,.S
722.0
2,553.09 I
TOTAL TOTAL ANNUALIZED CAP COST/ CAP COSTS/ COST/
VMT PMT CAPITA
0.10 0.07 <<; Ill!
0.12 0.07 <II e;e;
0.11 0.08 <Q .1<
0.12 0.08 44.R4
0.14 _o_._og 11.n 1l'!
0.10 0.07 <~.??
0.10 0.09 38.98
0.11 0.08 40.62
0.12 0.08 43.49
0.13 0.09 42.92
0.26 0.16 56.39
0.18 0.12 35.63
__Q,J q _n ~! 38.4/
0.13 0.08 40.11 !
0.12 0.06 1141.84
I
I
2-4.3 URBAN PUBLIC TRANSPORTATION
This section describes the transit systems in the 10 major urban areas
in Michigan and those portions of the State which are included in urban
areas of other states, namely:
o South Bend, Indiana o Toledo, Ohio .
It is not possible to discuss this as a State Urban Transit System,
but rather as a set of individual systems operating within the State.
Thus, each urban area will be dealt with separately. Exhibit 2-4.3.1 pre
sents those physical and performance measures of each urban area which best
describe the system in operational terms.
o Ann Arbor: Two kinds of service will be provided:
o Fixed Route - Fixed Schedule Express Service o Demand Responsive Feeder and Local Service
(see 2.4.5 for description)
The Express Service will have 25 medium sized buses on 250 route miles.
About 90% of the population and 70% of the jobs will have access to the en-
tire DAR-Line haul service. Line service will operate on 15-minute head
ways. The Dial~A-Ride buses will provide the collector-distributor service.
Trip cost will be 25 cents, with free transfers between DAR and Li n.e Service.
o Bay City: The system will have 19 medium sized buses operating
on 30 miles of street. During the peak, the buses will operate on 30-min
ute headways and provide access to about 90% of the jobs. About 3/4 of
the population will have access to bus service.
o Detroit: The 7,100 miles of bus routes will be augmented by
225 miles of rapid rail service. Between the bus and rail service, nearly
the entire Detroit area will have good access to both jobs and residences;
-146-
'
both will be operating on short headways. The average fare will be about
30 cents for bus and about 45 cents for rail.
o Flint: Service will be provided to about 60% of the population
and 2/3 of the jobs with 142 buses operating at about 17-minute headways.
Street miles covered will be 260. Average fare will be 50 cents.
o Grand Rapids: In order to increase transit usage, 615 buses
l', (40-passenger) will operate on 400 street miles and 1,000 route miles.
Almost the entire population and job market will have access. The buses
will operate on 5-minute headways. Fare will be 35 cents.
o Jackson: Transit rerouting will increase access for the popu-
lation. Otherwise, the levels of service will be the same as 1972.
o Kalamazoo: The level of service will be increased to provide
access to nearly 100% of the area. The service will include 122 large
buses operating on about 120 street miles and 400 route miles with 20-
minute headways. Average fare will be 25 cents.
o Lansing: Service will be provided by 173 buses on 465 miles of
street and road. During peak hours, headways will be 10 minutes. About
80% of the population and jobs will have access. Fare will be 25 cents.
o Muskegon-Muskegon Heights: Service will be provided with 50 small
(20-passenger) buses on about 40 miles of street. Access will be available
to about 40% of the population and 85% of the jobs. The average fare will
be 35 cents.
o Saginaw: The City will have 16 medium buses operating on 30 street
miles serving about 90% of the population and 95% of the jobs at headway
of about 20 minutes during the peak. Average fare will be 30 cents.
-147-
-·-~ ~-~~"~=-~·=.-.~.~--~~-~~-~-~~=~---------~------·~-~~--=~..,...--,.."""--"""'--""'"""' .... --=-- ....._ • .,._.,..._~_... ....... ,.._~_ ... ~--~-"-~-- ....... ,. _,.__..._~,.--~"'-·-·-· ~ ......... _~-"-~---· ~--"""~_ ........... ~ .. -.,.. ... ,.,,,,,,,_ ... -~---.-.... -.---.,...·-----.-.,.-.-.-.... -• .,.-..................... _....,.~-..-.-.... -..,..-.-.-........ ,_ ..... __,_._r
o South Bend: The Niles, Michigan, area will have 16 vehicles
operating on 20 street miles providing service to almost the entire popu
lation and about 1/2 of the jobs. Average fare will be 35 cents.
o Toledo: The Toledo area, including those parts in Michigan,
will have a dual mode transit system operating on fixed guideways and local
streets. Length of the Michigan service will be 22 miles of route. Ser
vice will be provided by ninety, 40-passenger vehicles at 7-minute peak-
hour headways. The average trip length will be about 15 miles at a
15 cents fare.
-148-
!

: __ i
EXHIBIT 2-4.3.1 1990 PLAN - URBAN PUBLIC TRANSPORTATION - BUS TRANSIT
Annual Transit Ac- Average ' Pas- cessibi1 it:[ Peak Hour
senger % Within 1/4 Performance Mile Mile of Route Oper- Aver-
Miles Miles Vehicles Per Pop- Em- ating Head- age of of Avg Avg Seat u1a- ploy- S[!eed wa* Fare
AREA NAME Route Line .No. Age Seats Mi1e tion ment MPH MI Cents '
ANN ARBOR 250 250 25 7 30 0.10 90 70 15 15.0 25
BAY CITY 72 30 14 HL 28 0.16 75 90 15 30.0 55
DETROIT 7,105 3,400 3,000 6 46 0.20 89 94 15 10.3 28
FLINT 531 260 142 5 34 0.30 58 78 14 17.0 50
GRAND RAPIDS 1,020 400 615 8 40 0.05 I 90 95 15 5.0 35 I
JACKSON 36 18 12 7 33 0.13 75 75 12 30.0 30
KALAMAZOO 410 118 122 6 45 0.14 95 90 15 20.0 25
LANSING 930 465 173 7 39 0.34 80 80 12 10.0 25
MUSKEGON Musk/Heights 82 40 50 7 20 0.05 40 85 15 30.0 35
SAGINAW 120 30 16 4 31 0.33 87 95 15 20.0 30
SOUTH BEND 32 20 16 5 18 0.42 95 50 20 30.0 35
TOLEDO - - - - - - - - - - -STATE TOTAL 10 588 5.031 4,185 I 6 43 0,14 82 89 14 11.0 29

c~-~--------·----·-------~---~---·-~'•-•-~,;--~~~--•·---~-~---~~~~~·---.---"',_.,.~--~-~~,"-"-"'~--~~,;]
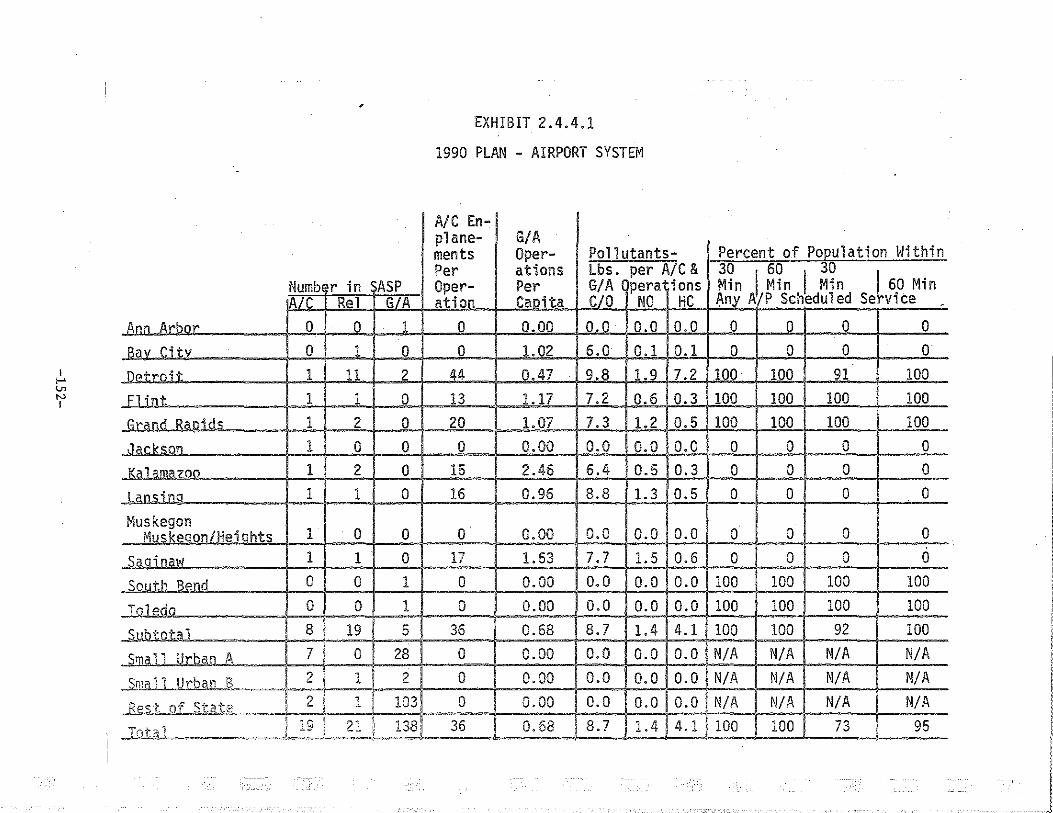
2-4.4 AIRPORTS
The projections of aviation activity and development criteria used in
the 1990 Plan correspond with the Long Range development period in the Mich
igan Airport System Plan. As this Long Range period uses 1990 as a base,
the data is homogeneous with requirements for the 1990 Plan. Exhibit 2-4.4.1
presents a tabulation of significant parameters with respect to the 1990 Air
port Plan.
Operations
In 1990, total aviation operations are projected to reach 12.7 million
(Exhibit 2-6.3.1). This represents an increase of 148 percent as compared to
recorded operations for the 1971 Inventory. General aviation accounts for
12 million or 94 percent of total operations and is an increase of 150 percent.
Air carrier operations are projected to reach approximately .7 million in 1990,
which is an increase of 107 percent over the Inventory data.
Examining state-wide distribution of operations, it is noted that over
half the general aviation operation will originate from urban areas.
Additionally, the urban areas will generate 81 percent of total state
air carrier operations. The projected operations for the Detroit area account
for 58 percent of the total for the state and 72 percent of those originating
in the urban areas.
Enplaned Passengers
By 1990, enplaned passengers are projected to reach approximately 22.6
million, an increase of 255 percent (Exhibit 2-6.3.2). Of this total, air
carrier enplanements will represent 67 percent equaling 15 million.
-150-
'i
A review of the state-wide distribution of enplanements is as follows:
the urban areas are projected to generate 14 million or 93 percent of air
carrier enplanements. Detroit is projected to generate 12 million enplane
ments, which is 80 percent of the state total and 86 percent of the urban
total. Although Small Urban areas and the Rest of State area represent a
small portion of the total enplanements, an increase of 373 percent in air
carrier enplanements is forecast.
Based Aircraft
The based aircraft in Michigan is projected to increase to 14,710 by 1990
(Exhibit 2-6.3.3). This is an increase of 139 percent when compared with data
in the Inventory. Approximately 55 percent of the based aircraft will be in
the urban areas. While the Detroit area will represent 28 percent of the state
total and 51 percent of those in the urban areas.
Operating and Maintenance Costs
The large increase in operating and maintenance costs for 1990 is attributed
to the same factor discussed in the 1980 Program.
Capital Costs
For the 1990 Airport Plan, projected development costs over the 18 year
period is $522,169,000 in 1971 dollars. Total projected revenues for this
period is $430,805,000, which is equivalent to 30.58 percent of the above
projected costs.
Of the three (3) funding sources comprising the subject revenue (Federal,
State and Local contributions), the Federal portion is $215,400,000 or half of
the total projected revenues. On a yearly basis, this represents $12 million
-151-
I f-' l..n N I
,
Numb r in ASP AIC Rel G/A
Ann • -• 0 0 1 Bav r.;t.v 0 1 0 l)pt,.nit 1 11 2
Flint 1 1 0
.Jil::pnd Raoid.s 1 2 0
"~"~on 1 0 0
KA1ilm~700 1 2 0
Lansino 1 1 0
Muskegon Muskeaon/Heiohts 1 0 0
Saoinaw 1 1 0
Srlllth BPnd 0 0 1
..lfi1Pdn 0 0 1
...5.JJbtota1 8 19 c -J .
.2'lli' 1' llrhan A 7 0 28
2n.m.J 1 Urb©J:t.Jl I 2 I
1 2 •
Be~t of Stat2. ----~~~ 1 I 103 ' '
...IQta 1 l 19 ) 21 l 138 ••""''o~,-==,~~~· -~~·--.--==
EXHIBIT 2. 4.4.1
1990 PLAN - AIRPORT SYSTEM
A/C En-plane- G/A ments Oper- Po 11 utan ts- Percent of PoEulation Within Per ations Lbs. per A!C & 30 60 30 Oper- Per G/A peraiions Min I Min I Min I 60 Min at ion Call ita C/0 NO HC ~ny A/P Scheduled Service .
0 0.00 0.0 0.0 0.0 0 0 0 0
0 1.02 6.0 0.1 0.1 0 0 0 0 l!.4 0.47 9.8 1.9 7.2 100 100 91 100
13 1.17 7.2 0.6 0.3 100 100 100 100
20 1.07 7.3 1.2 0.5 100 100 100 100
0 0.00 0.0 0.0 0.0 0 0 0 0
15 2.46 6.4 0.5 0.3 0 0 0 0
16 0.96 8.8 1.3 0.5 0 0 0 0
0 0.00 0.0 0.0 0.0 0 0 0 0 -
17 1.63 7.7 1.5 0.6 0 0 0 0
0 0.00 0.0 0.0 0.0 100 100 100 100
0 0.00 0.0 0.0 0.0 100 100 100 100
36 0.68 8.7 1.4 4.1 100 100 92 100
0 0.00 0.0 0.0 0.0 N/A N/A N/A N/A 0 0.00 0.0 0.0 0.0 N/A N/A N/A N/A 0 0.00 1 o.o 0.0 0.0 N/A N/A N/A N/A
36 0.68 l 8. 7 1.4 4.1 100 100 73 95
: I !
I i
'-'\
i ;- ·;
with exception of the 1972 allocation, included in this amount, which totaled
$11.4 million. Total Federal funding is based on the level of appropriat·ions
Michigan has received over the past several years.
Discretionary funding has been an important source of additional revenue
for Michigan Aviation. While a certain portion of the subject fund is allo
cated to each of the 50 states, many states fail to meet criteria distribution
standards--that of programmed projects and matching state and local monies.
In view of this, excess funds, so derived, become availab-le for reallocation
to states such as Michigan who meet the criteria of programmed development and
available matching state and local funds. Based on past history, the Michigan
Aeronautics Commission anticipates continued utilization of allocated discre-
tionary funding, plus additional amounts from the fund over· and above the
a 11 ocati on.
The revenues from the State of Michigan will be derived from a portion
of the Aviation Fuel Tax. With projected increases in operations in the
future, the revenues from this source will continue to increase and provide
additional monies for development, therefore, reducing the burden on local
governmental sources of revenue.
2-4.5 TERMINALS (Not Applicable)
-153-

2-4.6 OTHER TRANSPORTATION
0 Ann Arbor Dial-A-Ride: This demand responsive service will act
as a feeder to the proposed all express bus sytem. All other local service
will be provided by th'is Dial-A-Ride. The system will consist of seventy-
five, 10-passenger vans. Some estimate of service measures are:
Passenger Trips: Average Weekday 10,000 Annual 3,000,000
Passenger Miles: Average Weekday 40,000 Annual 12,000,000
The average trip length is estimated to be 4 miles in 16 minutes. The
fare will be 25 cents/tr·ip.
o Bay_Ci1L_Speci a 1 Transportation Service: Integrated into area
transit system.
-154·-
,-.. 1
i:.:
2-5 STATE TRANSPORTATION PROGRAM
2-5.1 EVALUATION OF THE 1980 HIGHWAY PROGRAM
The purpose of this section is to present an evaluation of the 1980 Highway
Program for Michigan. The evaluation discussed in this section is based upon
the 1980 Highway Program data forms prepared by the Michigan Department of
State Highways and Transportation and the study consultant.
This section will present a summary of the approach used in the develop
ment of the 1980 Program, as well as present an evaluation of the Program
from the standpoint of the 1980 highway Needs, capital costs, physical state
of the system as of 1980, performance of the system, and other aspects of the
highway system reported on the highway data forms. _;I
Section 2.7.1 documents the analyses performed with respect to projection
of available funding from Federal, State, Local and private sources for the
1980 Program. This projection of funding, based upon the DOT study require-
ments, formed the initial basis for the development of the 1980 Program.
After these initial funding projections had been made, it was determined
that the only realistic basis for the development of the 1980 Program would be
the existing plans,as developed through the 3C process in urban areas and the
existing State Highway Department program.
A Short Range Improvement Program for highways had been prepared for each
of the urbanized areas, except for the Michigan portions of Toledo and South
Bend. In some cases, for example, with Detroit and Ann Arbor, the Short Range
Improvement Programs were somewhat incomplete. Nevertheless, an examination
of these programs showed that in total they could reasonably be used as the
basis for developing Michigan's 1980 Program for the National Transportation
Study.
-155-
The Short Range Improvement Programs developed as part of the 3C process
for the urban areas, and in most cases approved by appropriate authorities,
presented the list of projects to be implemented during the time period covered
by the 1980 Program. In most cases, this covered fiscal year 1973 through
fiscal year 1979. Projects were identified, using the 1990 functional classi
fication maps, with respect to their inclusion or exclusion from the 1990
boundaries required for 1974 NTS reporting. A determination was made for each
project of the 1990 functional classification of the road on which the improve
ment was to be made. In addition, those projects which added mileage to the
system via new construction, were identified. 1990 design type for each project
was also identified in order to facilitate required reporting of this data. In
most cases, the year of improvement was noted in the short range improvement
program. In those cases where it was not, improvements were assumed to occur
linearly over the. time span.
Associated with each improvement was the capital cost which would be
required. These cost estimates had been made by responsible county and city
engineers, and thus, reflected revised estimates from those available with the
Needs Study. The next step in the process was to revise these cost estimates,
on a project by project basis, in accordance with DOT instructions for factor··in[l
capital costs, to account for anticipated differential changes between the
appropriate construction cost index and the consumer price index.
Each of the Short Range Improvement Programs also identified the agency
responsible for implementing the project - State Highway Department, County
Road Commissions, or the appropriate cities or villages. Capital costs were
thus accumulated on this basis in order to be comparable with the mechanism
used for the projection of the source of funds for the 1980 Program as provided
by applicable Michigan legislation.
-156~
., I

f'"'
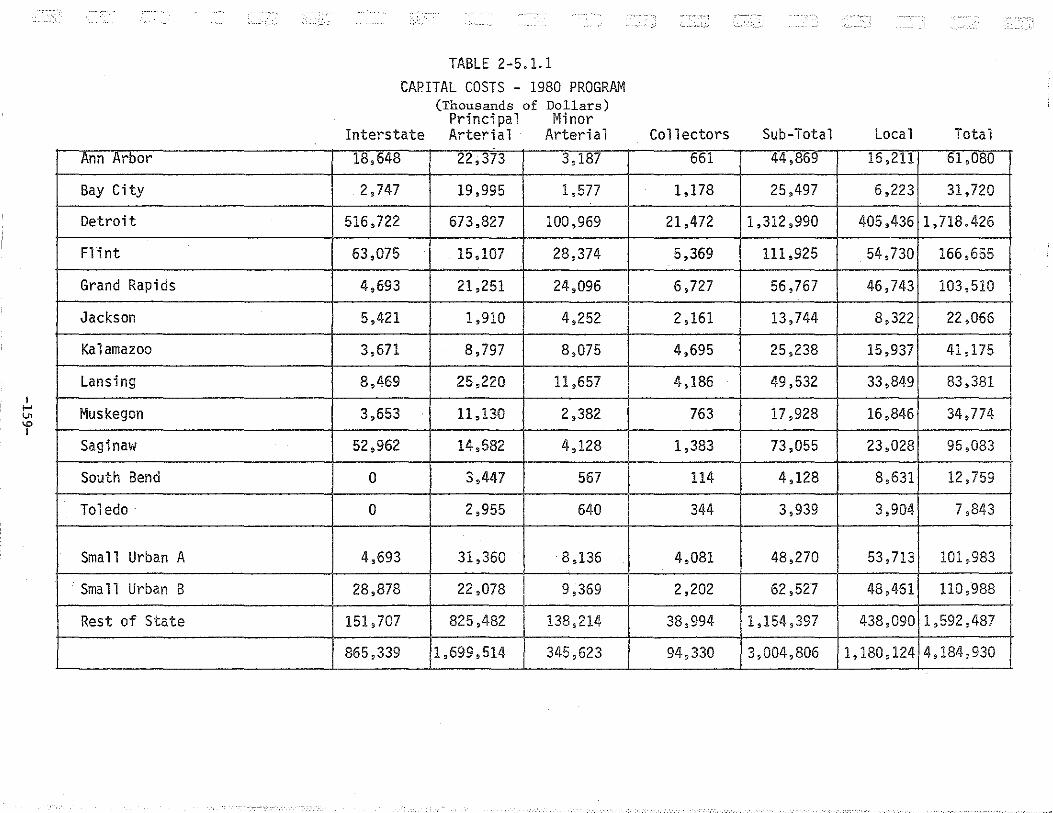
Table 2.5.1 .1 presents a summary of the capital costs for implementation
of the 1980 Program for each of the geographic areas by 1990 functional class
ification. These capital costs represent essentially a full implementation of
all of the Short Range Improvement Programs and the majority of projects in
the State Highway Program.
In addition to the development of the 1980 Program based upon these
existing plans, a computer run was made to determine those portions of the
State's Needs which were required during the 1972-1990 time period. Table
2.5.1 .2 summarizes these Needs for the non-local functional classifications.
A comparison of the capital costs for the 1980 Program and the 1980 Needs
shows that there are approximately 13.9 billion dollars of Needs which will
not be met during the 1972-1980 time period, based upon adjusted l9TI dorlars.
This short-fall is particularly acute for the arterial system.
This low percentage of needs met under assumed available funding sources
raises serious questions with respect to the adequacy of the available funds.
With the assumed funding levels upon which the Program was developed, many
projects reported in the Needs which are oriented toward adding capacity to
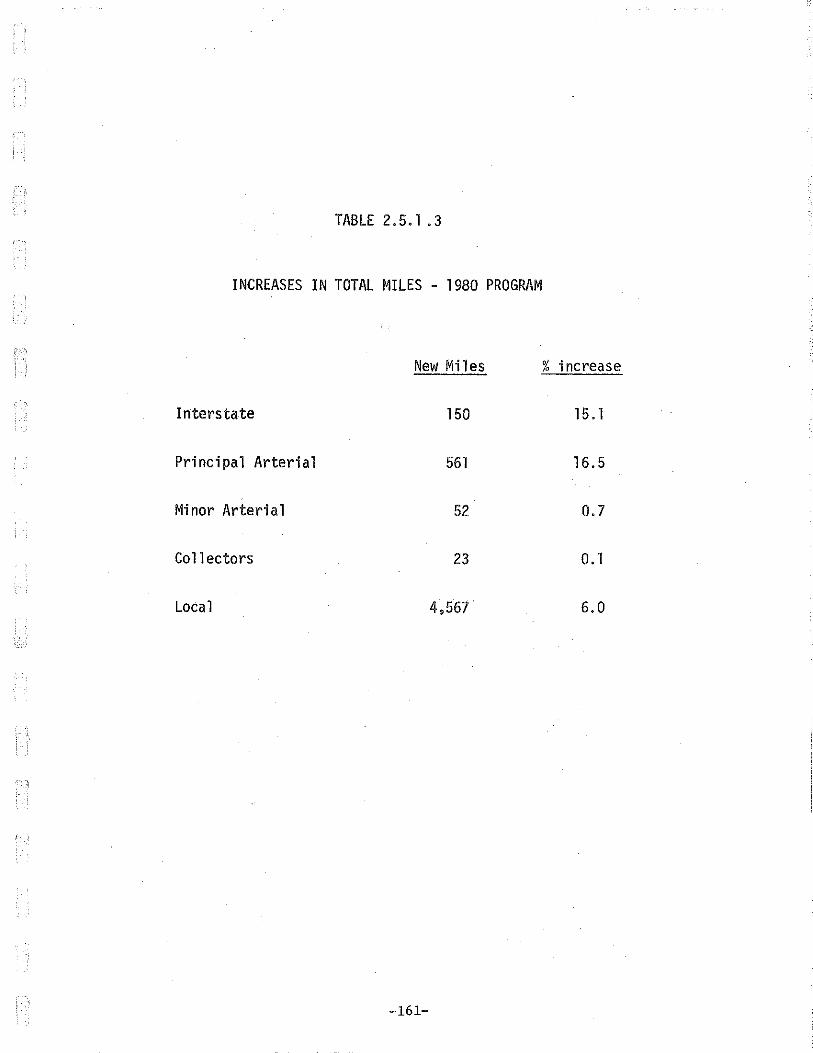
the highway system cannot ·be undertaken. Table 2.5.1.3 shows the new mileages
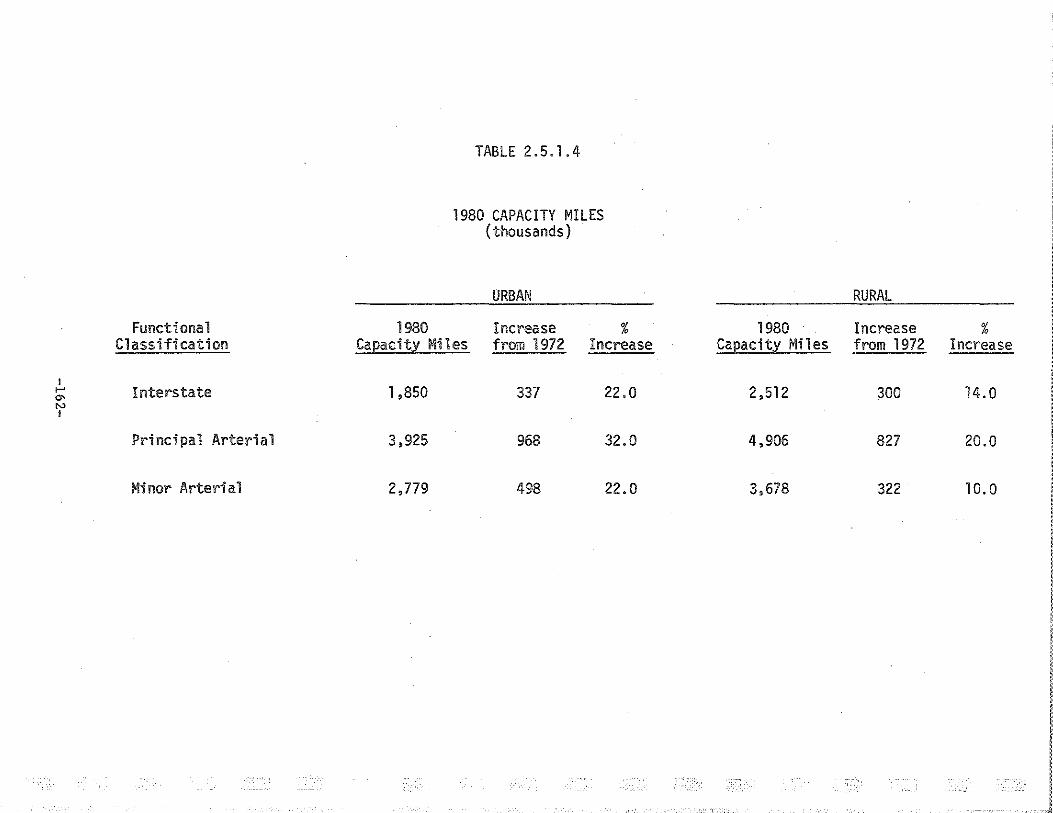
which will be added to the system with the 1980 Program, and Table 2.5.1.4
shows the capacity miles which would be added after implementation of the
Program. Capacity miles to be added and the percentage increase in the highway
capacity for the major functional classifications are shown in this table.
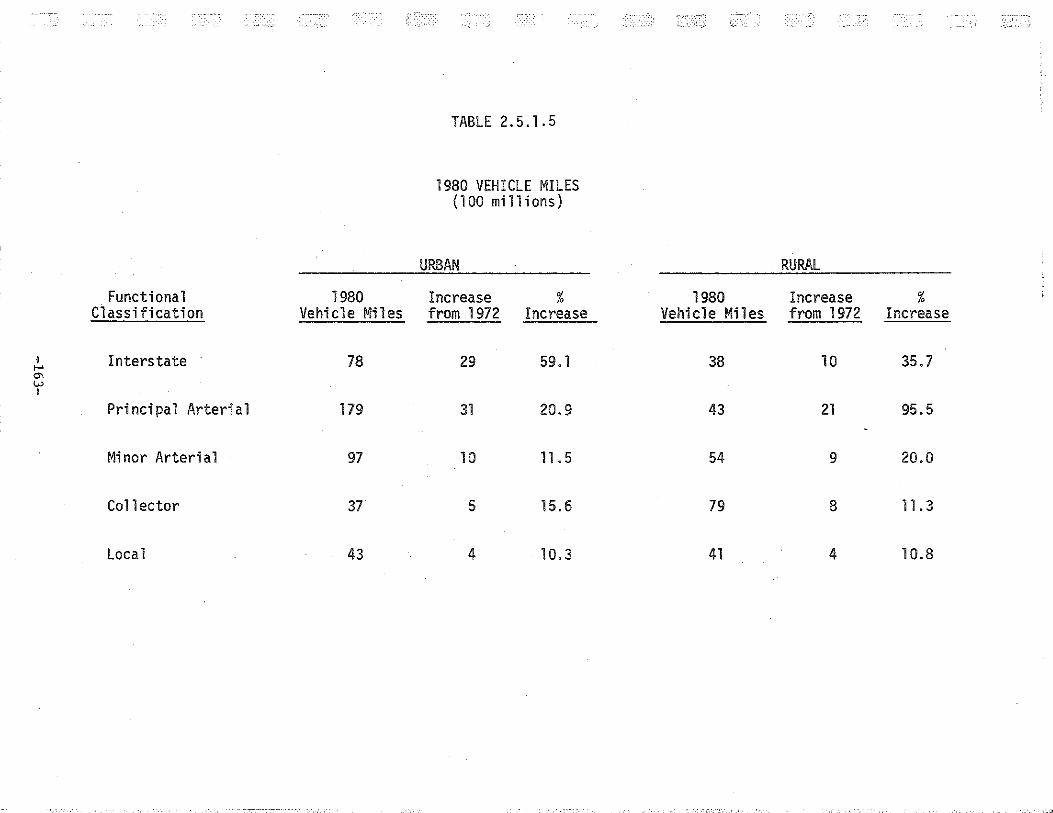
Table 2.5.1.5 depicts the 1980 vehicle miles projected for the 1974 NTS
Program, as well as the percentage increases in vehicle miles between 1972
and 1980. A cnMnarison of this table with the preceding table shows that
there are disparities between projected capacity increases and projected
volume increases for the 1980 Program, particularly for intercity trips.
-157-
"

In order to analyze the contribution of the State Highway Program to
the 1980 Program for NTS reporting purposes, a detailed evaluation of the
projects program by the Michigan Department of State Highways and Transpor
tation was performed. Here again, the 1990 functional classification maps
were used to identify the specific location of each State Highway project.
Cost estimates for projects were again factored for construction cost index
changes per DOT study requirements, utilizing the year of improvement iden
tified in the State Highway Program and the relevant cost estimate.
For both the evaluation of the urban areas, Short Range Improvement
Programs and the State Highway Program. estimates were made of capacity
changes resulting from project implementation. In no case were estimates of
capacity changes indicated in either the State or local plans. Estimates for
these capacity changes were derived from consideration of the number of miles
of improvement and the number of lanes added in the improvement by functional
classification.
Thus, the result of this examination of State and local plans resulted
in a Table for each urban area which contained required capital costs for
implementation of existing plans by functional classification and by improve
ment type. These resulting capital costs were then compared to the funding
available to the geographic area based upon considerations discussed in sect·ion I
2-7.1. Adjustments were made to the capital costs in order to reflect projects
completed between January 1, 1972 and the starting point for the State or local
plan. Also, at this point estimates were made for some data items missins;
local plans; for example, for the Detroit and Ann Arbor urbanized areas, plans
of city and township highway agencies were not complete. As will be discussed
in Section 2-7.1, it was assumed that differences between local plans and
available funding would be met by locally raised revenues. In each case, this
appeared to be a reasonable assumption, since observed short-falls were generally
aligned with revenues historically raised at the local level.
., '
Ann Arbor
Bay City
Detroit
Flint
Grand Rapids
Jackson
Kalamazoo
Lansing
Muskegon
Saginaw
South Bend
Toledo·
Small Urban A
Small Urban B
Rest of State
TABLE 2-5.1.1 CAPITAL COSTS - 1980 PROGRAM
(Thousands of Dollars) Principal Minor
Interstate Arterial Arterial 18,648 22,373 3,187
2,747 19,995 1,577
516,722 673,827 100,969
63,075 15,107 28,374
4,693 21,251 24,096
5,421 1,910 4,252
3,671 8,797 8,075
8,469 25,220 11 ,657
3,653 11,130 2,382
52,962 14,582 4,128
0 3,447 567
0 2,955 640
4,693 31,360 8,136
28,878 22,078 I 9,369
151,707 825,482 138,214
865,339 1,699,514 345,623
Collectors Sub-Total Local Total
661 44,869 16,211 61,080
1,178 25,497 6,223 31 '720
21,472 1,312,990 405,436 1,718.426
5,369 111,925 54,730 166,655
6,727 56,767 46,743 103,510
2,161 13,744 8,322 22,066
4,695 25,238 15,937 41,175
4,186 49,532 33,849 83,381
763 17,928 16,846 34,774
1,383 73,055 23,028 96,083
114 4,128 8,631 12,759
344 3,939 3,904 7,843
4,081 48,270 53' 713 101,983
2,202 62,527 48,461 110,988
38,994 1,154,397 438,090 1,592,487
94,330 3,004,806 1,180,124 4,184,930

TABLE 2-5.1.2
1980 NEEDS - ADJUSTED FOR 1971 DOLLARS (Thou~andq ot Dollars)
Principal Minor Interstate Arterial Arterial Collectors Total
Ann Arbor 7,660 222,014 48,085 12,400 290,159
Bay City 15,098 48,492 30,358 11 '695 105,643
Detroit 1,300,776 4,955,296 1, 701 ,235 681,161 8,638,468
F1 int 243,469 368,086 172,470 39,995 824,020
Grand Rapids 14 '162 119,274 143,737 40,392 317,565 I Jackson 617 59,073 30,616 6,448 96,754 1-'
"' 0 I Kalamazoo 238 97 '714 63,388 14 '705 176,045
Lansing 163,035 85,903 14,066 263,004
Muskegon 55,979 47,659 18,518 122 '156
Saginaw 68,063 78,399 .50,117 15,422 212,001
South Bend 32,077 2,978 4,156 39,211
Toledo 11 ,542 15,379 13,312 40,233
Sub Total 1,650,083 6,210,981 2,391,925 872,270 11 '125,259
Small Urban A 12 '767 356,914 92,418 1 01 '319 563,418 : i
Small Urban B 17,172 256 '1 02 130,938 34,518 438,730 I Rest State 235,519 1,185,450 1,463,822 1,924,873 4,809,664 I
! i
Tota1 1,915,541 8,009,447 4,079,103 2,932,980 16,937,071 : ~ I ' I I
.J
------------- -----~
TABLE 2.5.1 .3
INCREASES IN TOTAL MILES - 1980 PROGRAM
,:-'
New Miles % increase
Interstate 150 15. 1
Principal Arterial 561 16.5
Minor Arteria 1 52 0.7
Collectors 23 0.1
Local 4,567 6.0
. :1
' '
-161-
I ..... "' "' '
Functional Classification
Interstate
Principal Arterial
Minor Arterial
TABLE 2.5.1.4
1980 CAPACITY MILES (thousands)
URBAN
1980 Increase % Capacity Miles from 1972 Increase
1,850 337 22.0
3,925 968 32.0
2,779 498 22.0
RURAL
1980 Increase % Capacity Miles from 1972 Increase
2,512 300 14.0
4,906 827 20.0
3,678 322 10.0
Functional 1980 Classification Vehicle Miles
l Interstate 78 ..... "' w I
Principal Arterial 179
Minor Arterial 97
Collector 37
Local 43
TABLE 2.5.1.5
1980 VEHICLE MILES (1 00 mi 11 ions)
URBAN
Increase % from 1972 Increase
29 59.1
31 20.9
10 11.5
5 15.6
4 10.3
RURAL
1980 Increase % Vehicle Miles from 1972 Increase
38 10 35.7
43 21 95.5
54 9 20.0
79 8 11.3
41 4 10.8
Table 2.5.1.6 summarizes highway related pollutants developed for the
1980 Program. These pollutant leve 1 s are considerably reduced in a 11 respects
from those levels of the 1972 Inventory. These effects are primarily due to
anticipated decreases in vehicle exhaust emissions on a vehicle mile basis for
later model year cars.
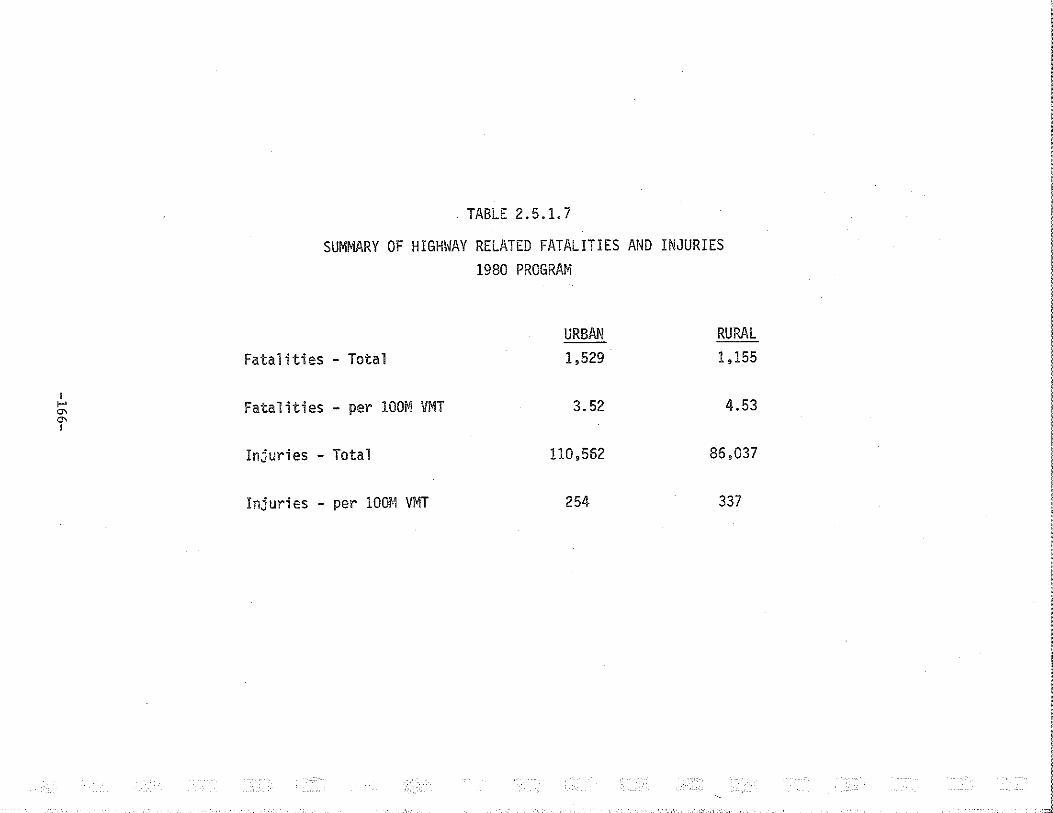
Table 2.5.1.7 summarizes anticipated highway related fatalities and
injuries for the 1980 Program. The increase noted in fatalities and injuries
are due primarily to projected increases in the total annual vehicle miles for
the State's highway system.
-164-

I Oxides of Nitrogen
,.... "' V>
' Hydrocarbons
Carbon Monoxide
TABLE 2.5.1.6
SUMMARY OF HIGHWAY RELATED POLLUTANTS 1980 PROGRAM
Pounds Pounds/ (mill ions) VMT
585 .008
351 .0051
2,462 .0357
Pounds/ Pounds/ PMT Ca2ita
.006 60.6
.0037 36.4
.0257 254.9
' ..... "' "' I
TABLE 2.5.1. 7
SUMMARY OF HIGHWAY RELATED FATALITIES AND INJURIES 1980 PROGRAM
URBAN RURAL
Fatalities - Total 1,529 1,155
Fatalities - per lOOM VMT 3.52 4.53
Injuries - Total 110,562 86,037
Injuries - per lOOM VMT 254 337

-,.,
2-5.2 URBAN PUBLIC TRANSPORTATION
This section describes the transit systems in the 10 major urban areas
in Michigan and those portions of the State which are included in urban
areas of other states, namely:
o South Bend, Indiana o Toledo, Ohio
It is not possible to discuss this as a State Urban Transit System,
but rather as a set of individual systems operating within the State. Thus,
each urban area will be dealt with separately. Exhibit 2-5.2.1 presents
those physical and performance measures of each urban area which best
describe the system in operational terms.
In some instances, the program levels have been accelerated with
respect to the 1990 Plan because of the 1973-1974 "Energy Crisis". The
Program may appear ambitious compared to the Plan, but the local areas
are undergoing a re-ordering of transportation priorities due to the cur
rent energy supply between now and 1980. In some other instances, the
Program physical and performance data is beyond the Plan and that may be
a reflection on the change in priorities. It is difficult to compare the
Plan and Program because of the uncertainties of the energy supply beyond
1980.
o Ann Arbor: Two kinds of service will be provided:
o Fixed Route-Fixed Schedule Express Service o Demand Responsive Feeder and Local Service
(see 2-5.5 for descriptions)
The Express Service will have 50 small (22-passenger) buses on 65
street miles and about 120 route miles. Access will be available to nearly
the entire population and about 80% of the jobs. During the peak hours,
-167-
the buses will be on 10-minute headways. The Dial-A-Ride buses will pro
vide feeder service. Fare will be 25 cents.
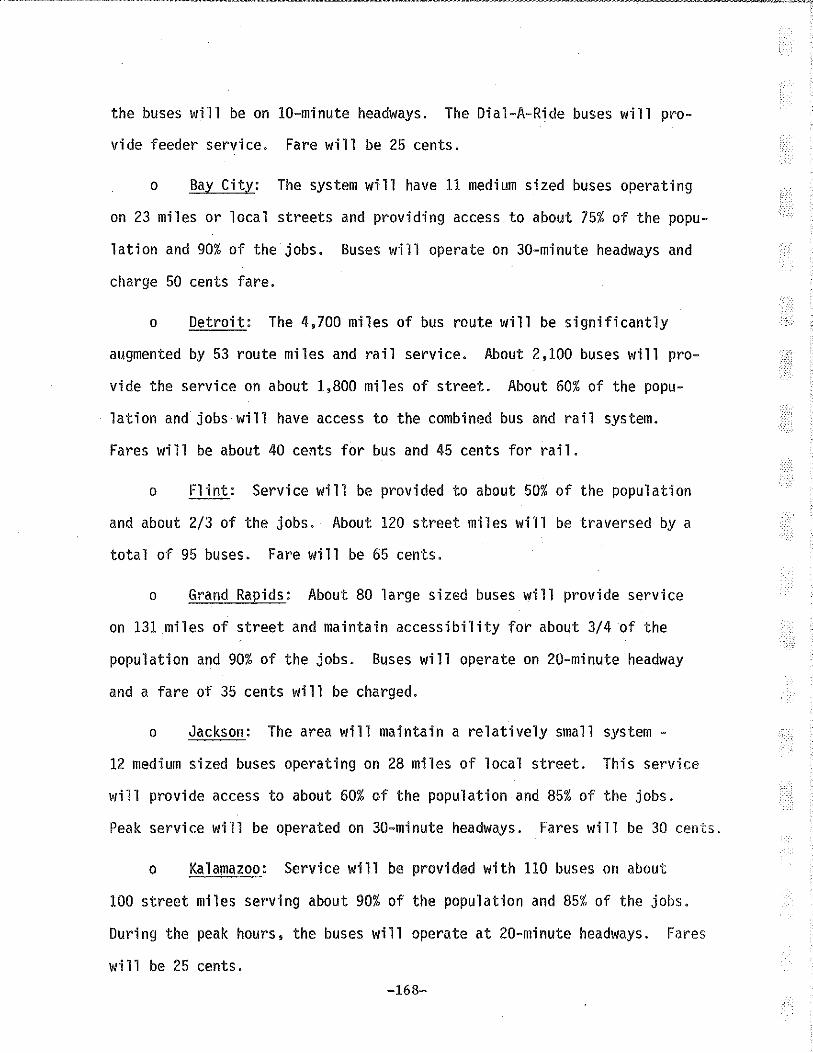
o Bay City: The system will have 11 medium sized buses operating
on 23 miles or local streets and providing access to about 75% of the popu
lation and 90% of the jobs. Buses will operate on 30-minute headways and
charge 50 cents fare.
o Detroit: The 4,700 miles of bus route will be significantly
augmented by 53 route miles and rail service. About 2,100 buses will pro
vide the service on about 1,800 miles of street. About 60% of the popu
lation and jobs will have access to the combined bus and rail system.
Fares will be about 40 cents for bus and 45 cents for rail.
o Flint: Service will be provided to about 50% of the population
and about 2/3 of the jobs. About 120 street miles will be traversed by a
total of 95 buses. Fare will be 65 cents.
o Grand Rapids: About 80 large sized buses will provide service
on 131 miles of street and maintain accessibility for about 3/4 of the
population and 90% of the jobs. Buses will operate on 20-minute headway
and a fare of 35 cents will be charged.
o Jackson: The area will maintain a relatively small system -
12 medium sized buses operating on 28 miles of local street. This service
will provide access to about 60% of the population and 85% of the jobs.
Peak service wi 11 be operated on 30-minute headways. Fares wi 11 be 30 cents.
o Kalamazoo: Service w111 be provided with 110 buses on about
100 street miles serving about 90% of the population and 85% of the jobs.
During the peak hours, the buses will operate at 20-minute headways. Fares
will be 25 cents. -168-
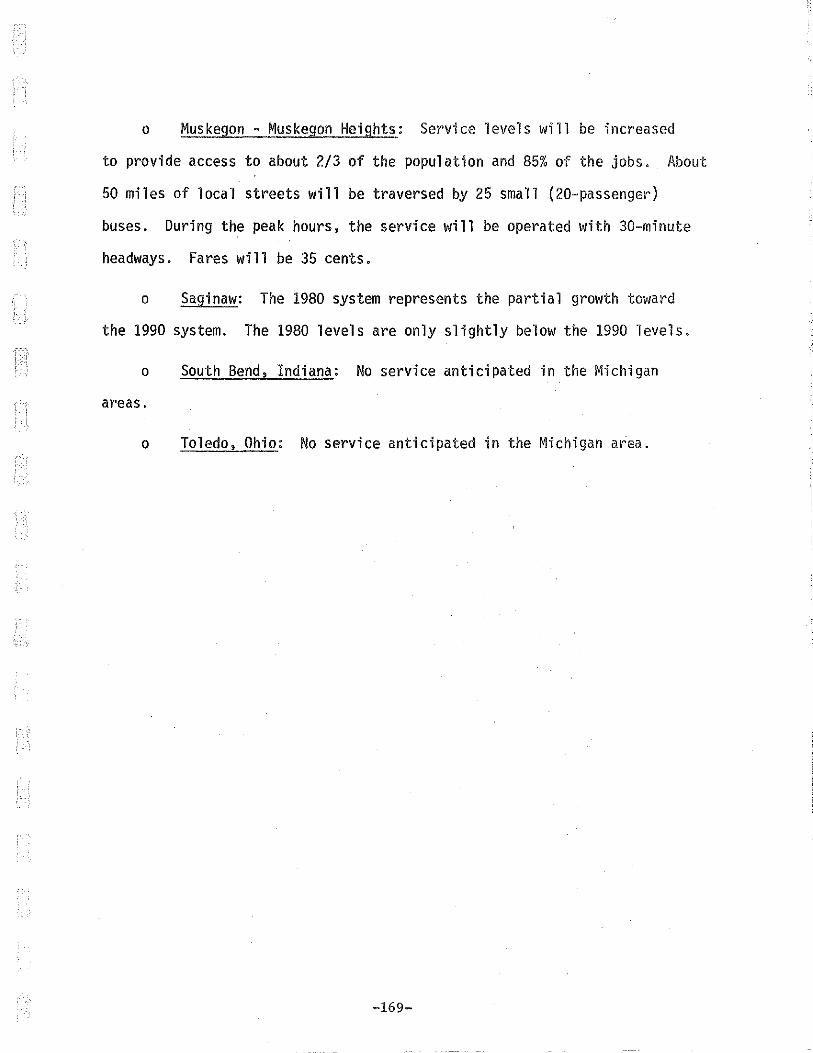
o Muskegon - Muskegon Heights: Service levels will be increased
to provide access to about 2/3 of the population and 85% of the jobs. About
50 miles of local streets will be traversed by 25 small (20-passenger)
buses. During the peak hours, the service will be operated with 30-minute
headways. Fares will be 35 cents.
o Saginaw: The 1980 system represents the partial growth toward
the 1990 system. The 1980 levels are only slightly below the 1990 levels.
o South Bend, Indiana: No service anticipated in the Michigan
areas.
o Toledo, Ohio: No service anticipated in the Michigan area.
-169-
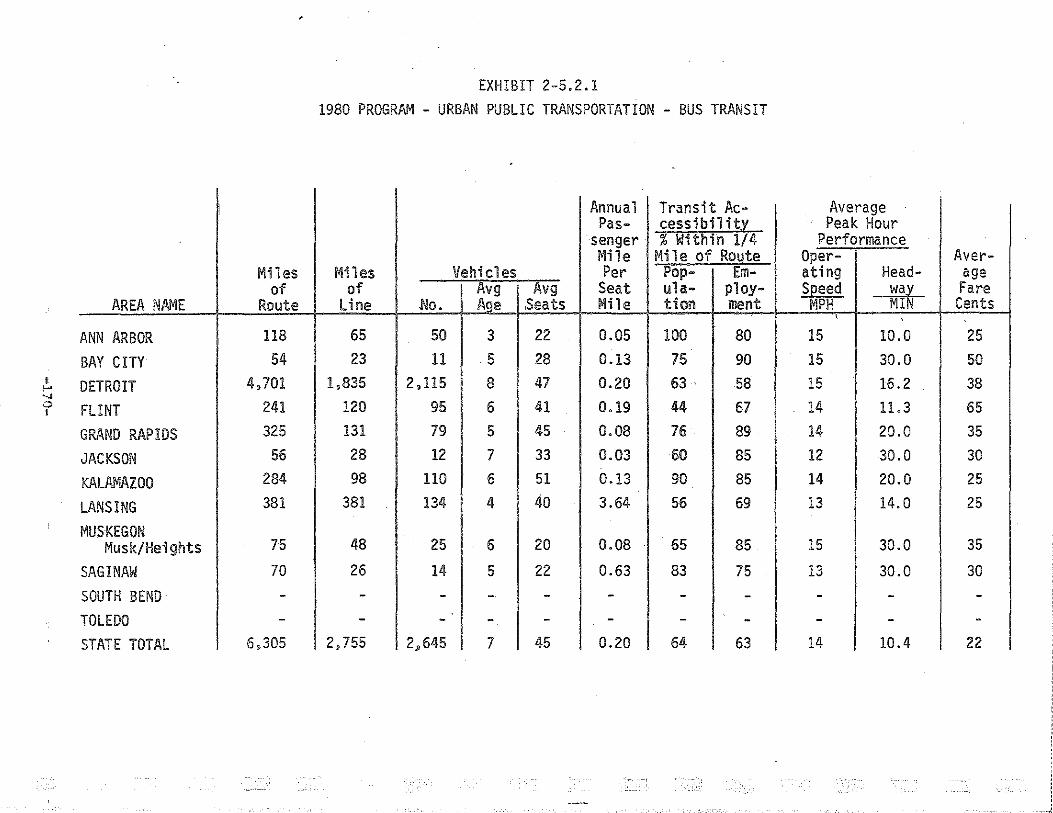
EXHIBIT 2-5.2.1 1980 PROGRAM - URBAN PUBLIC TRANSPORTATION - BUS TRANSIT
Annual Tr;~nsit Ac- Average Pas- cessibil it~ Peak Hour
senger % Within 1/4 Performance ~me Mile of Route Oper- Aver-
Miles Miles Vehicles Per Pop- Em- ating Head- age of of Avg Avg Seat ula- ploy- S~eed wa~ Fare
AREA NAME Route line .No. Age Seats ~me tion ment MPH MI Cents \ '
ANN ARBOR 118 65 50 3 22 0.05 100 80 15 10.0 25
BAY CITY 54 23 11 5 28 0.13 75 90 15 30.0 50
DETROIT 4,701 1,835 2,115 8 47 0.20 63. 58 15 16.2 38
FLINT 241 120 95 6 41 0.19 44 67 14 11.3 65
GRAND RAPIDS 325 131 79 5 45 0.08 76 89 14 20.0 35
JACKSON 56 28 12 7 33 0.03 60 85 12 30.0 30
KALAMAZOO 284 98 110 6 51 0.13 90 85 14 20.0 25
LANSING 381 381 134 4 40 3.64 56 69 13 14.0 25
MUSKEGON Musk/Heights 75 48 25 6 20 0.08 65 85 15 30.0 35
SAGINAW 70 26 14 5 22 0.63 83 75 13 30.0 30
SOUTH BEND - - - -· - - - - - - -TOLEDO - - - - - - - - - - -STATE TOTAL 6,305 2,755 2,645 7 45 0.20 64 63 14 10.4 22
2-5.3 AIRPORTS
Projects of aviation activity used in the development of the 1980 Pro
gram cor·respond with the Intermediate Range development period on the Michigan
Airport System Plan. The Intermediate Range Plan uses 1980 as a base, there
fore, coinciding with the NTS 1980 Program.
Exhibit 2-5.3.1 projects a tabulation of significant parameters with respect
to the 1980 Program Data. Operations, based aircraft and passengers enplaned
are presented in the comparative Section 2-6.
Operations
Projections of aviation activity expected to occur in 1980 display a marked
increase over corresponding statistics in the 1972 Inventory. Total activities
in this period are projected to increase to approximately 8 mill·ion, which is
an increase of 56 percent (Exhibit 2-6.3.1). Detailed analysis indicates that
general aviation operations represent 94 percent of the total projection, an
increase of 57 percent. As may be anticipated, air carrier operations account
for a fractional portion of the total 1980 forecast, but at the same time
increase by 163,000 operations, 48 percent above the 1972 Inventory.
Enplaned Passengers
The 1980 Program projects an increase in enplaned passengers of almost
7 million, revealing a gross total of approximately 15.3 million. Air Carrier
passenger enplanements comprise 9.5 or 62 percent of total state enplanements
for this period reflecting an increase of 125 percent of all commercial enplane
ments.
Geographically, it is noted that over the comparative inventory 9 million
or approximately 95 percent of the air carrier enplanements will be generated
-171-
from the urban areas. Of these enplanements, approximately 8 million will take
place in the Detroit area, which represents 97 percent of all urban enplanements
and 89 percent of the total for the state. For the Detroit area, this is a pro
jected increase of 4.3 million enplanements or 119 percent increase.
Based Aircraft
By 1980, based aircraft in Michigan is expected to rise by 53 percent over
the 1972 Inventory (Exhibit 2-6.3.3) from 6162 to 9380 units. The urban areas will
account for 56 percent of these aircraft, 30 percent attributable to the Detroit
area alone. Of. the total based aircraft located in Urban areas, the Detroit
area is expected to account fo.r 53 percent or over ha 1 f.
Operating and Maintenance Costs
Projected operating and maintenance costs for the 1980 Program are 28.5
million (excluding interest), this is an increase of 44 percent above costs for
the 1972 Inventory. This increase can be attributed to the following three
factors:
1. Development of additional aviation facilities.
2. Expansion and improvement of existing facilities.
3. Certification costs for air carrier facilities in accordance with federal regulations. The year 1972 saw the certification program as an added large expenditure for air carrier and reliever airports. Therefore, the use of 1971 as a base for operating and maintenance costs may be misleading.
Capital Costs
The projections of development and construction costs used in this study
are derived from the Michigan State Airport System Plan. The system plan uses
-172-
~--.-.
"-: i -
~ • I
'
,!-.
the following three planning periods as a base for future development:
Planning Period
Short Range Intermediate Range Long Range
Fiscal Years
1973-1977 1978-1982 1983-1992
Base for Aeronautical Activity Forecasts
1975 1980 1990
Since the Intermediate and Long Range periods correspond (parallel},
with the dates for the 1980 Program and 1990 Plan, it was considered expedient
to use these planning periods for the Program and Plan.
However, a comparison of the adjusted cost of the intermediate range
planning period with Federal, State and local revenues based on Appendix "0",
produced the following results: projected revenues equal to 81 percent of the
costs for air carrier facilities and 23 percent of the general aviation needs
(Exhibit 2-7.3.1). (The 1980 program guidelines/targets presented in Appendix
"0" were adjusted to cover the period January 1, 1972 through December 31, 1979.)
Therefore, to arrive at a balance of revenues and expenditures, it was
decided to base the 1980 Program on the Short Range planning period of the ~IASP.
In so doing, the projected development costs proved greater than anticipated
revenues and met only 89 percent of air carrier and 39 percent of general
aviation needs. To respond to this imbalance, consideration was then given
to developing only those facilities in the Short Range period which were de
termined to be of critical importance in the system. Although this reduced
1980 development costs, they were still above total revenues. As a further
means to bring development costs in line with revenues, reduction of develop
ment at remaining airports was then considered a proper course. At each of
these airports, development was reduced to include only those items considered
most critical to the operation and safety of the facility. In certain ·instances,
-173-
costs were reduced by rescheduling such development as parallel taxiways
proposed in the Short Range period, in favor of runway lengthening so as to
accommodate larger business aircraft as recommended in the Intermediate Range
period.
In evaluating the funding for the 1980 Program, the following should be
noted. The cost of all terminal buildings are to be financed with funds der
ived from revenue bonds. It is assumed that all bond issues will be repaid
by income from tenants and concessionaires.
The total cost for improvements and expansion of Detroit Metropolitan
Airport is assumed to be financed by revenue bonds and private funds. This
decision was based on the following facts.
1. In the past, very little of Michigan's Federal and State Funds have been allocated for this facility.
2. It is assumed this airport can generate its own revenues for development.
3. Projected costs for this airport are approximately 56 percent of the total air carrier costs for the Program. Therefore, if Federal and State Funds were allocated to this airport, it would not be possible to finance an adequate level of development for the air carrier system throughout the rest of the state.
-174-

, EXHIBIT 2-5.3.1
1980 PROGRAM - AIRPORT SYSTEM
IVC En-plane- G/A
Percent of Pooulation Within ments Oper- Pollutants-Per ations Lbs. per A/C & 30 60 30
Numb r in ASP Oper- Per G/A per a ions Min I Min I Min I 60 Min AIC Rel G/A ation Caoita cio NO HC Anv A/P Scheduled Service
Ann Arhnr 0 0 1 0 0.00 0.0 0.0 0.0 0 0 0 0
Bav Citv 0 0 1 0 0.61 6.0 0.1 0.1 0 0 0 0 it 1 11 2 30 0.36 12.7 3.3 4.3 100 100 90 100 .
Flint 1 1 0 13 0.96 6.4 0.4 0.3 100 100 100 100 c~, ,~ Raoids 1 2 0 15 ! 0.73 6.7 1.0 0.4 100 100 100 100
J~rk~nn 1 0 0 0 0.00 0.0 0.0 0.0 0 0 0 0
Ka1 am~7nn 1 2 0 11 1.66 6.3 0.5 0.3 :o 0 0 0
Lansina 1 1 0 11 0.76 6.9 1.0 0.4 0 0 0 0
Muskegon Muskeaon/Heiahts 1 0 0 0 0.00 0.0 0.0 0.0 0 0 0 0
5!29 i oa~1 1 0 1 13 1.12 7.1 1.2 0.5 0 0 0 0
South BPnc! 0 0 1 0 0.00 i 0.0 0.0 0.0 100 100 100 100
To1ec!o 0 0 1 0 0.00 J 0.0 0.0 0.0 100 100 100 100
Subtotal 8 17 7 26 0.50 j1o.o 2.1 2.6 100 100 100 100
Smilll llrban A 7 0 28 0 I 0.00 I o.o I o.o o.ol N/A N/A N/A N/A
lL I [~.o IQ."o o.oi:N/A ,-
: I _smal J Urba.n 13 2 2 0 0.00 . N/A N/A N/ iJ, ~~-
I .

2-5.4
2-5.5
0
TERMINALS (NOT APPLICABLE)
OTHER TRANSPORTATION
Ann Arbor Dial-A-Ride
The design of this demand responsive system is based upon a pre-1972
demonstration. The system is designed to provide feeder service to express
buses and local service. The fare will be 25 cents per trip. The feeder
service will have headways of 20 minutes in both the peak and off-peak
hours. Average weekday patronage will approach 10,000. This level of
service is close to the 1990 Plan; this apparent discontinuity is predi
cated by the energy crisis.
o Bay City Special Transportation Service
This service will be fully integrated into the area-wide transit
system ..
-176-

_:_ ;
,- -; '_-:
2-6
2-6.1
- ------- ------ ----- -- -- --- ---------------~--- ------- --~ ··~ _,..,-.. ~
EVALUATIONS AND COMPARISONS
EVALUATION AND COMPARISON OF THE HIGHWAY INVENTORY,.PLAN AND PROGRAM
The purpose of this section is to present comparisons between the 1972
Inventory, 1990 Plan and 1980 Program for highways in Michigan, and to discuss
these comparisons in terms of qualitative and quantitative attributes of the
system.
One of the primary distinctions. to be made in these comparisons will be
between those portions of the system which facilitate traffic movement within
urban areas, and those portions of the system which are predominantly oriented
toward intercity traffic movement. Inasmuch as reporting requirements for the
1974 NTS did not distinguish between those portions of the system serving
intercity traffic movement and those portions oriented toward serving rural
residents of Michigan, it is assumed for discussion purposes here that the
rural arterial system is primarily oriented toward serving intercity travel
needs and that lower functional classifications are primarily oriented toward
providing the collection and distribution function for the rural population.
Perhpas the most significant comparison which can be made between the
Inventory, Program and Plan is with respect to capital costs associated w-ith
required system improvements during the two study time periods. Table
2-6.1.1 shows these cost comparisons by functional classification for 1990
urban areas and the rest of state. This table clearly reveals a uniformity
of assumptions made with respect to Program and Plan development. Table 2-6.1.1(a)
shows a comparison of the source of funds for highway purposes for the Plan
and Program. As this table shows, State Motor Vehicle Highway Fund revenues
comprise 41% of available funds during both time periods. This table shows
one of the basic assumptions of the 1974 National Transportation Study which
is clearly subject to debate and discussion - namely that the relative roles
-177-

TABLE 2-6. l .1
CAPITAL COST COMPARISONS
(Thousands of Dollars)
·URBAN REST OF STATE
Functional 1980 1990 1980 1990 Classification Program Plan Program Plan
I Interstate 713,632 1,122,626 1-'
151,707 424,432 ..... 00 I
Principal Arterial 874,032 2,728,101 825,482 1,359.108
Minor Arterial 207,409 565,645 138,214 676,481
Collectors 55,336 154' 170 38,994 583,888
Local 742,034 1,630,955 438,090 1,155,825
TOTAL 2,592,443 6,201,497 1,592,487 4,199,734

-_ ~· _,_·: :_
TABLE 2-6.1.1(a)
HIGHWAY SOURCE OF FUNDS COMPARISONS
(millions of dollars)
1980 1990 Program % Plan %
I f-'
Federal 1,314 31 3,470 33 ......
"' I
State Motor Vehicle Highway Fund 1,697 41 4,304 41
Locally Raised Revenues 342 8 756 8
Private Funds 832 20 1 ,871 18
· Tota 1 4,185 100 10,401 100
of the Federal government, State government and Local governments with respect
to funding highway programs will remain relatively unchanged over the next
eighteen years.
Another very significant comparison which can be made with the Program and
Plan is the comparison of 1980 Needs with the 1980 Program, and of 1990 Needs
with the 1990 Plan. This comparison is shown in Table 2-6.1 .l(b). As this
table clearly shows, there is a vast disparity between Michigan's highway needs,
as developed in the 1972 NTS (and updated during the course of the 1974 NTS),
and the funds available per study assumptions for Program and Plan development.
This disparity is particularly evident, with potentially serious consequences,
for the State's arterial and collector system.
Table 2-6.1.2 presents a comparison of highway mileages in the Inventory,
Program and Plan by functional classification for the urban areas and rest of
state. Table 2-6.1.3 shows the miles of new roads constructed between the
1972 Inventory and 1980 Program and between the 1980 Program and 1990 Plan.
A comparison of these new mileages with the preceding table shows. that the
percentage changes in the State's highway system is however quite small. In
light of the projected increases in traffic volumes for the two time periods,
however, there may be reasonable cause to believe that the new mileages deter
mined in the Needs study may more accurately reflect the State's requirements
for highways.
It would appear that one of the major intents of the 1974 National
Transportation Study was to determine the performance of the highway system
under somewhat rea 1 i stica lly constrained funding 1 evel s. Based upon data
required for 1974 NTS reporting, perhaps the most significant performance
related comparison which can be made are those with respect to changes in
highway capacity compared with changes in projected traffic volumes.
-180-

TABLE 2-6.1.1(b)
NEEDS, COMPARISON WITH PLAN AND PROGRAM
(Thousands of 1971 dollars)
1980 1990 Functi ona 1
Classification Needs Program Needs Plan
' Interstate 1,915,541 865,339 2,089,550 1,547,058
>-' 00 >-'
' Principal Arterial 8,009,447 1,699,514 13,520,013 4,087,209
Minor Arterial 4, 079 '1 03 345,623 6,267,213 1,242,126
Collectors 2,932,980 94,330 4,360,802 738,058
Local 7 ,743,143 1,180,124 17,422,245 2 '786 '780
Total 24,680,214 4,184,930 43,659,823 10,401 ,231
---=-=-crc_---,-_--,-_~---c---
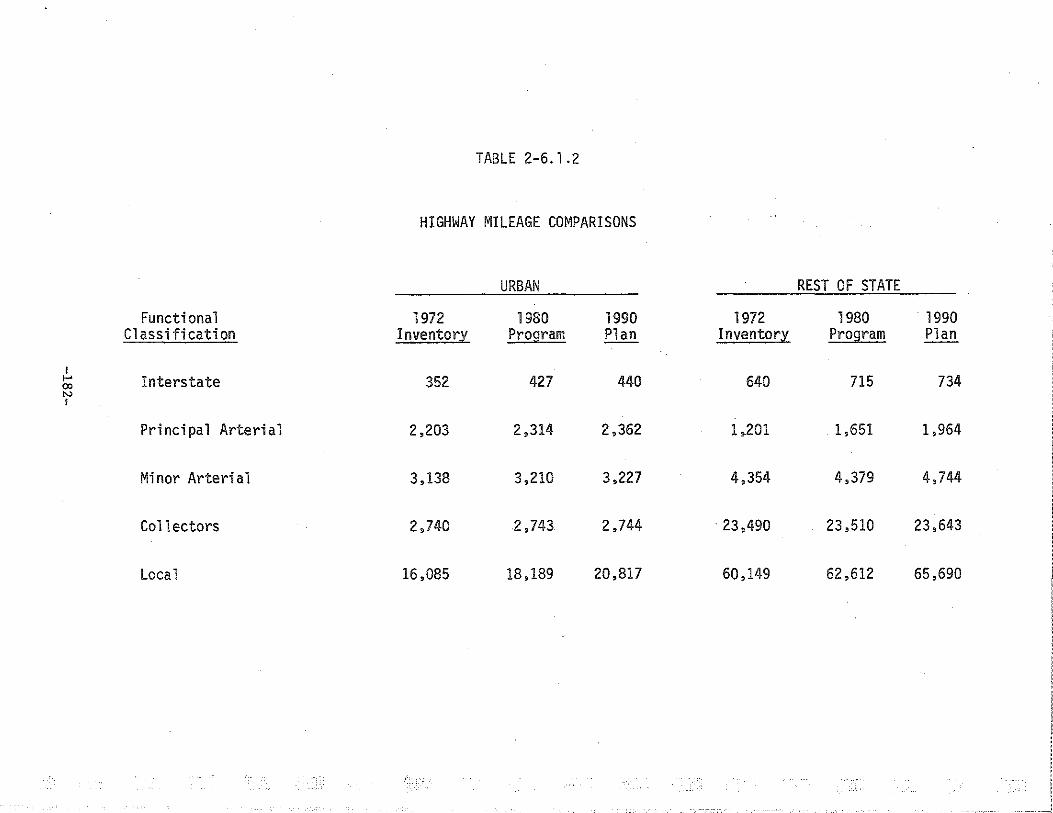
TABLE 2-6.1.2
HIGHWAY MILEAGE COMPARISONS
URBAN
Functional 1972 1980 1990 Classification Inventory Program Plan
I >-' Interstate 352 427 440 00 N
' Principal Arterial 2,203 2,314 2,362
Minor Arteria 1 3,138 3,210 3,227
Collectors 2,740 2,743 2,744
Local 16,085 18,189 20,817
REST OF STATE
1972 1980 Inventory Program
640 715
1 ,.201 1,651
4,354 4,379
. 23,490 23,510
60,149 62,612
1990 Plan
734
1,964
4,744
23,643
65,690
::
i 1 I i '
I !
-- -----.--:;;1.!
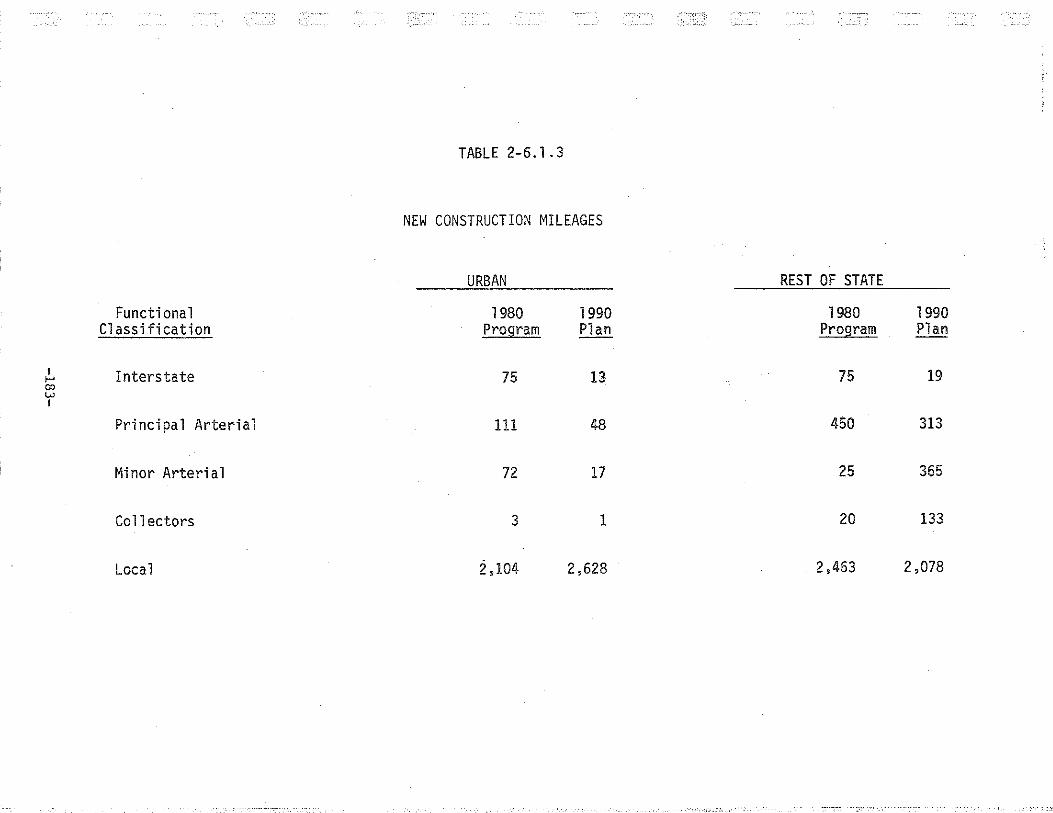
TABLE 2-6.1.3
NEW CONSTRUCTION MILEAGES
URBAN REST OF STATE
Functional 1980 1990 1980 1990 Classification Program Plan Program Plan
I Interstate 75 13 75 19 1-' 00 w I
Principal Arterial 111 48 450 313
Minor Arterial 72 17 25 365
Collectors 3 1 20 133
Local 2,104 2,628 2,463 2,078
- J]
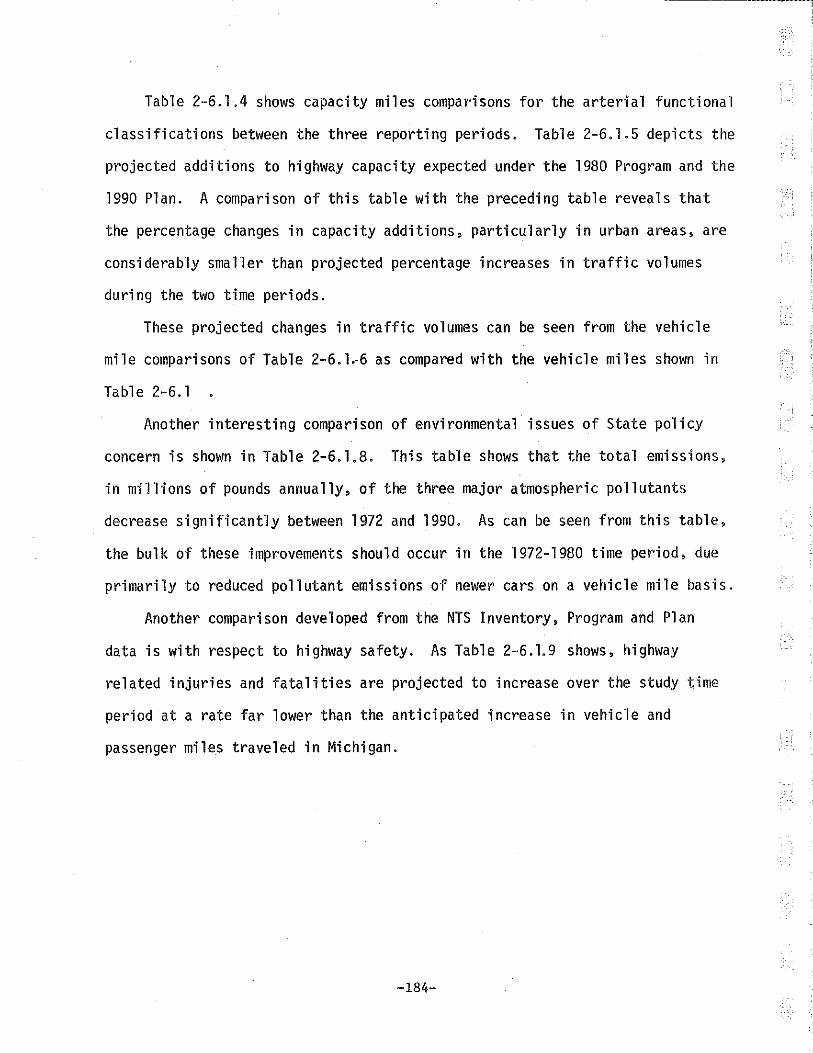
Table 2-6.1.4 shows capacity miles comparisons for the arterial functional
classifications between the three reporting periods. Table 2-6.1.5 depicts the
projected additions to highway capacity expected under the 1980 Program and the
1990 Plan. A comparison of this table with the preceding table reveals that
the percentage changes in capacity additions, particularly in urban areas, are
considerably smaller than projected percentage increases in traffic volumes
during the two time periods.
These projected changes in traffic volumes can be seen from the vehicle
mile comparisons of Table 2-6.1.-6 as compared with the vehicle miles shown in
Table 2-6.1
Another interesting comparison of environmental issues of State policy
concern is shown in Table 2-6.1.8. This table shows that the total emissions,
in millions of pounds annually, of the three major atmospheric pollutants
decrease significantly between 1972 and 1990. As can be seen from this table,
the bulk of these improvements should occur in the 1972-1980 time period, due
primarily to reduced pollutant emissions of newer cars on a vehicle mile basis.
Another comparison developed from the NTS Inventory, Program and Plan
data is with respect to highway safety. As Table 2-6.1.9 shows, highway
related injuries and fatalities are projected to increase over the study time
period at a rate far lower than the anticipated increase in vehicle and
passenger miles traveled in Michigan.
-184-
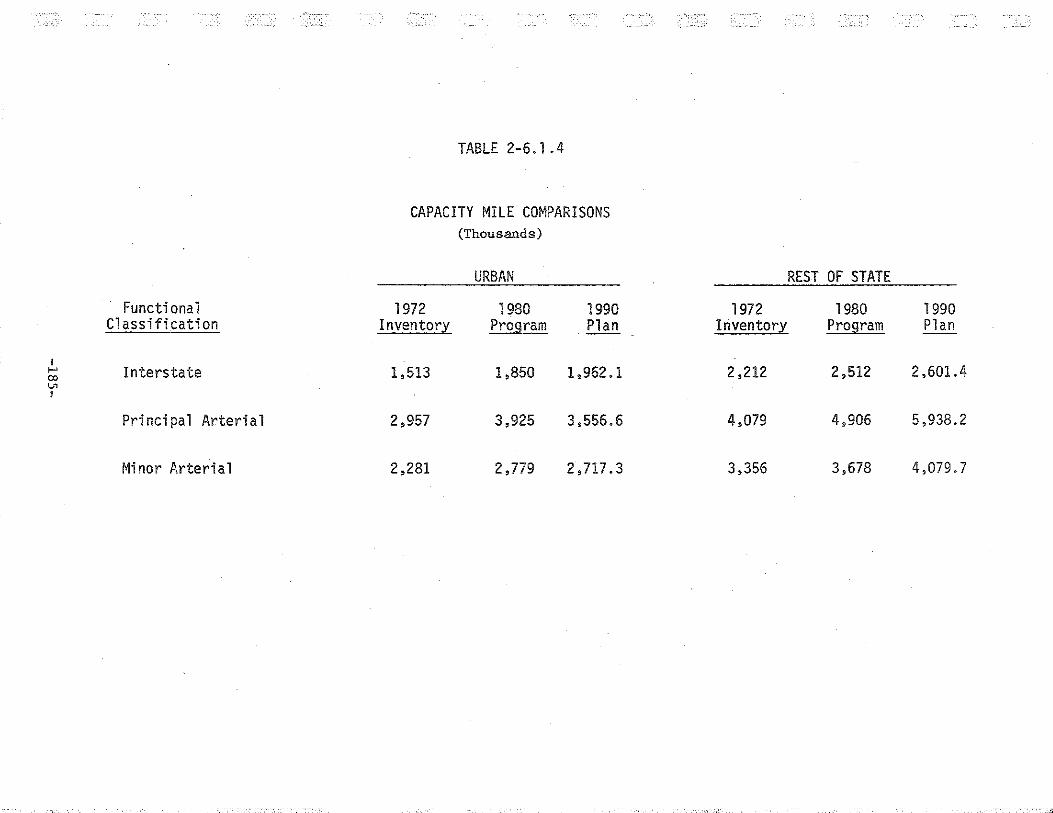
TABLE 2-6.1.4
CAPACITY MILE COMPARISONS (Thousands)
URBAN REST OF STATE
Functi ona 1 1972 1980 1990 1972 1980 1990 Classification Inventory Program Plan Inventory Program Plan
I
""' Interstate 1,513 1,850 1,962.1 2,212 2,512 2,601.4 co <..n
' Principal Arterial 2,957 3,925 3,556.6 4,079 4,906 5,938.2
Minor Arterial 2,281 2,779 2,717.3 3,356 3,678 4,079.7
. '"'
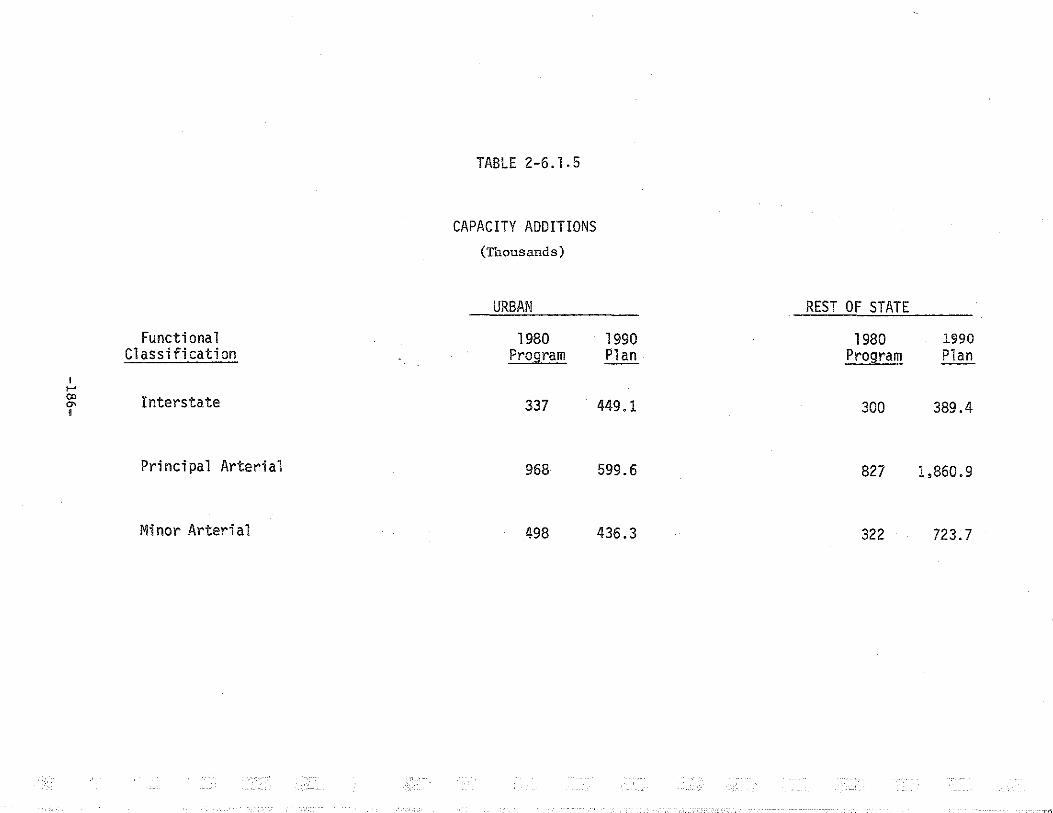
TABLE 2-6.1.5
CAPACITY ADDITIONS (Thousands)
URBAN REST OF STATE
Functi ona 1 1980 1990 1980 1990 Classification Program Plan Program Plan
I 1-' 00 Interstate 337 449.1 300 389.4 "" I
Principal Arterial 968 599.6 827 1,860.9
Minor Arteria 1 498 436.3 322 723.7
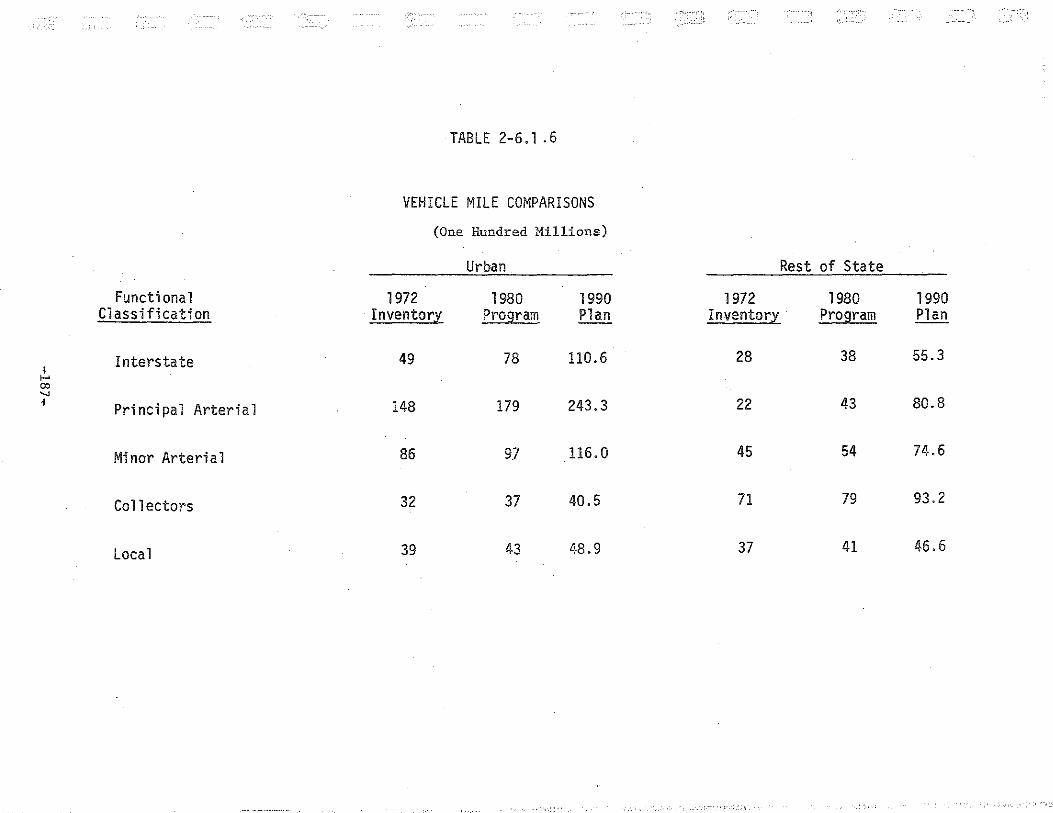
TABLE 2-6.1 .6
VEHICLE MILE COMPARISONS
(One Hundred Millions)
Urban Rest of State
Functional 1972 1980 1990 1972 1980 1990 Classification · Inventory Program Plan Inventory Program Plan
Interstate 49 78 110.6 28 38 55.3 ~ ..... "' ..., i Principal Arterial 148 179 243.3 22 43 80.8
Minor Arterial 86 9.7 116.0 45 54 74.6
Collectors 32 37 40.5 71 79 93.2
Local 39 43 48.9 37 41 46.6
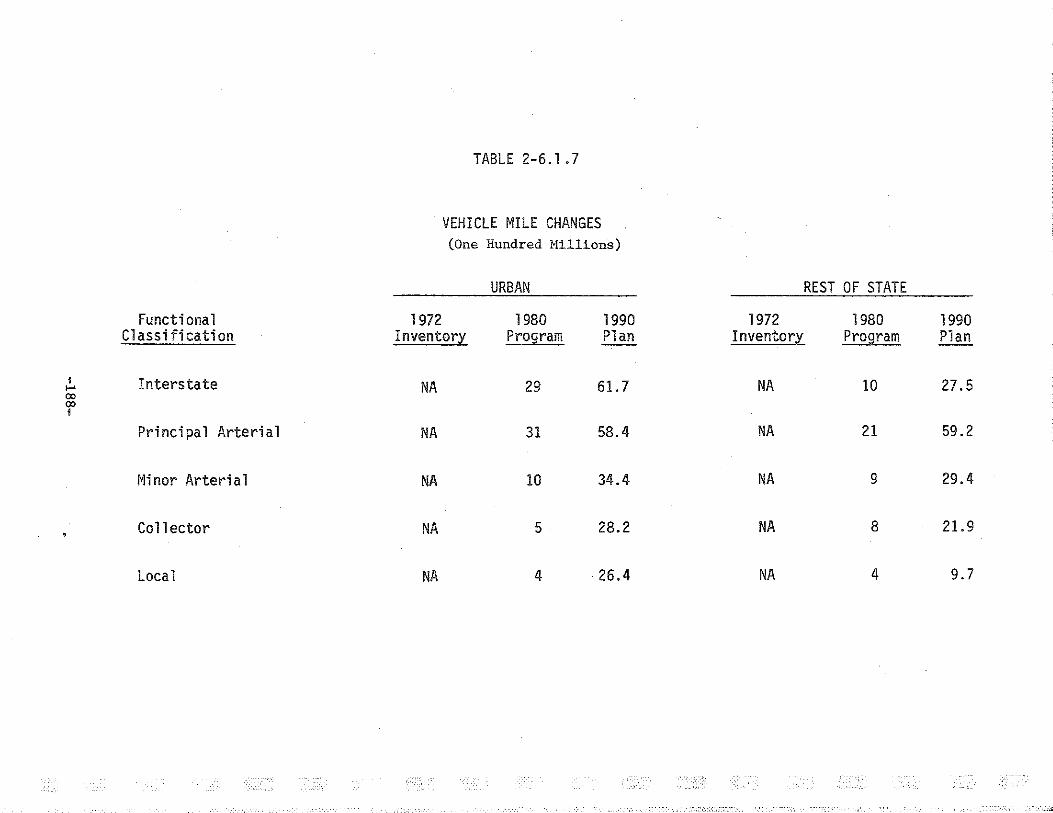
TABLE 2-6.1. 7
VEHICLE MILE CHANGES (One Hundred Hillions)
URBAN REST OF STATE
Functional 1972 1980 1990 1972 1980 1990 Class i fi cation Inventory Program Plan Inventory Program Plan
' Interstate NA 29 61.7 NA 10 27.5 f-'
"' "' l
Principal Arterial NA 31 58.4 NA 21 59.2
Minor Arteria 1 NA 10 34.4 NA 9 29.4
Collector NA 5 28.2 NA 8 21.9
Local NA 4 . 26.4 NA 4 9.7
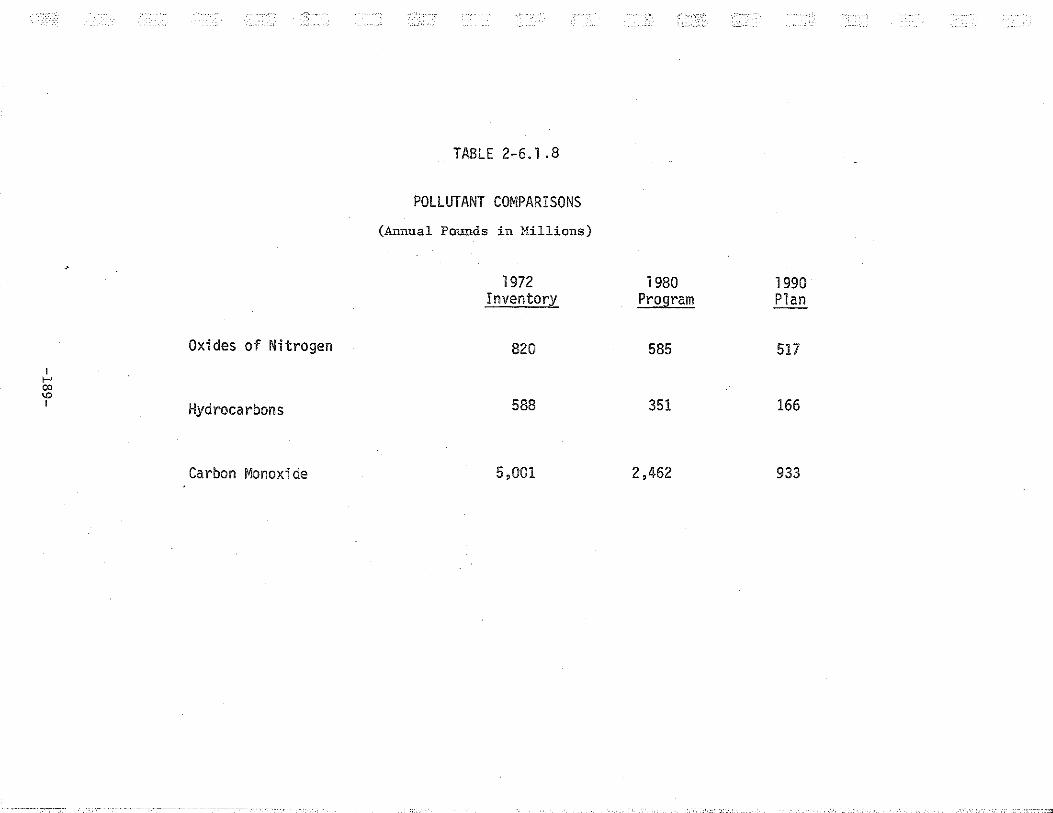
1 ,_.. co "' 1
Oxides of Nitrogen
Hydrocarbons
Carbon Monoxide
TABLE 2-6.1.8
POLLUTANT COMPARISONS
(Annual Pounds in Millions)
1972 Inventory
820
588
5,001
]g8o Program
585
351
2,462
, .. _,,-.,,;-.·.
1990 Plan
517
166
933
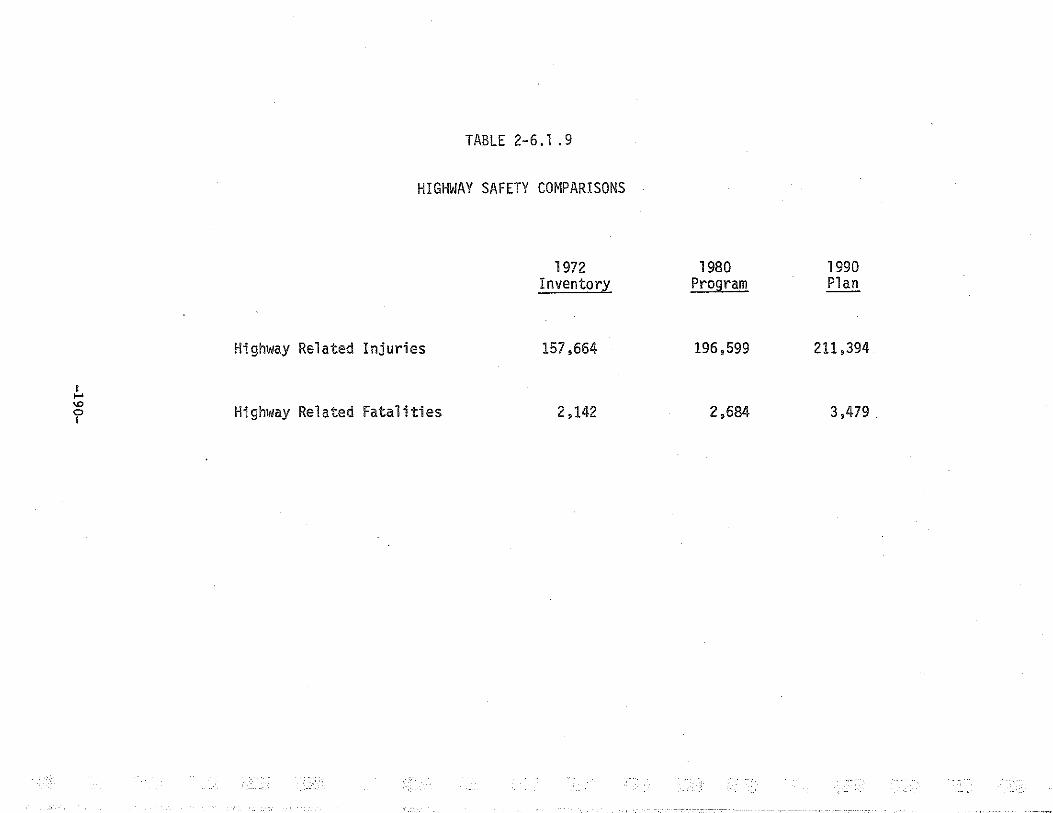
I >-'
"' 0 t
TABLE 2-6.1 .9
HIGHWAY SAFETY COMPARISONS
Highway Related Injuries
Highway Related Fatalities
1972 Inventory
157,664
2,142
1980 Program
196,599
2,684
1990 Plan
211 ,394
3,479

,. -, ' . !
2-6.2 URBAN PUBLIC TRANSPORTATION
Transit service throughout the State will grow during the period
1972-1990. Exhibits 2-6.2.1 and 2-6.2.2 demonstrate this growth by urban
area and State total for 1972-1990 and 1972-1980. The growth or, better,
the result is best demonstrated by the transit accessibility: by 1980 about
50% more of the urban population will have access to public transit and by
1990 about 100% more will have access than had access in 1972. Buses,
generally, will be smaller and younger than they were in 1972, thus providing
a more attractive, more personalized service and requiring less maintenance.
By 1980, 200% more street mileage will have bus service than in 1972 and
by 1990, the street mileage, with transit, will have increased over 400%
of the 1972 coverage. Fares will decrease from 1972 to 1980, but will
rise above 1972 levels by 1990.
·. -191-
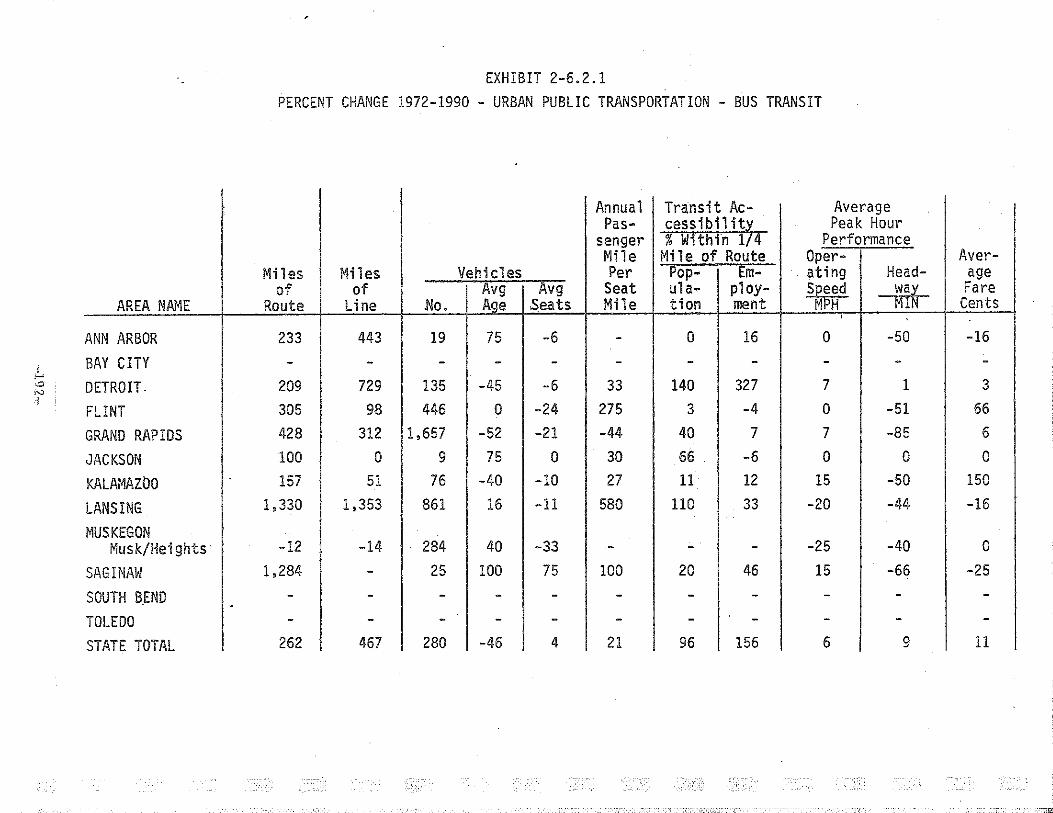
EXHIBIT 2-6.2.1
PERCENT CHANGE 1972-1990 - URBAN PUBLIC TRANSPORTATION - BUS TRANSIT
Annua 1 Transit Ac- Average Pas- cessibi1it7 Peak Hour
senger % Within 1 4 Performance Mile Mile of Route Oper- Aver-
Miles Miles Vehl cles Per Pop- Em- ating Head- age of of Avg Avg Seat u1a- ploy- Speed wa* Fare
AREA NAME Route Line .No. Age Seats Mile tion ment MPH MI Cents '
ANN ARBOR 233 443 19 75 -6 - 0 16 0 -50 -16
BAY CITY - - - - - - - - - - -DETROIT. 209 729 135 -45 -6 33 140 327 7 1 3
FLINT 305 98 446 0 -24 275 3 -4 0 -51 66
GRAND RAPIDS 428 312 1,657 -52 -21 -44 40 7 7 -85 6
JACKSON 100 0 9 75 0 30 66 -6 0 0 0
KALAMAZOO - 157 51 76 -40 -10 27 11 12 15 -50 150
LANSING 1,330 1,353 861 16 -11 580 110 33 -20 -44 -16
MUSKEGON Musk/Heights· -12 -14 284 40 -33 - - - -25 -40 0
SAGINAW 1,284 - 25 100 75 100 20 46 15 -66 -25
SOUTH B_END - - - - - - - - - - -. TOLEDO - - - - - - - - - - -STATE TOTAL 262 467 280 -46 4 21 96 156 6 9 11
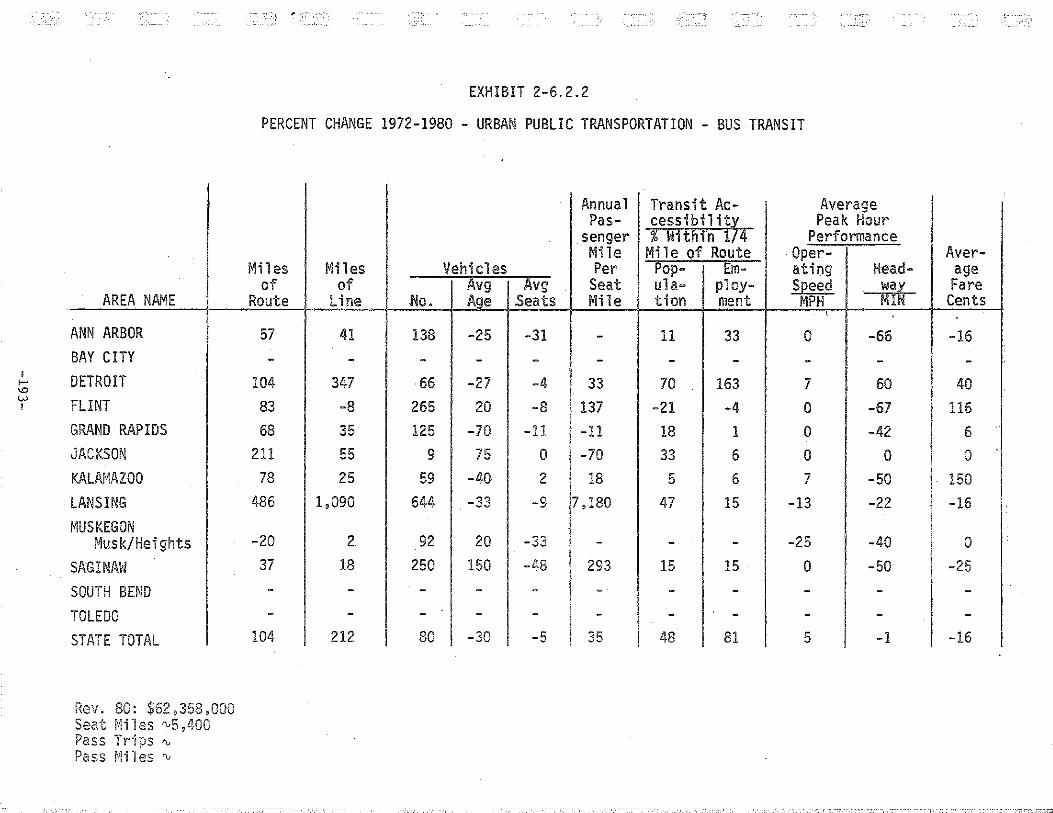
AREA NAME
ANN ARBOR BAY CITY DETROIT FLINT GRAND RAPIDS JACKSON KALAMAZOO LANSING MUSKEGON
Musk/Heights SAGINA~l
SOUTH BEND TOLEDO STATE TOTAL
Rev. 80: $62,358,000 Seat ~!il es -v5 ,4.00 Pass T;·i ps "' Pass f•1i 1 es "'
. ... __ ·,
EXHIBIT 2-6. 2. 2
PERCENT CHANGE 1972-1980 - URBAN PUBLIC TRANSPORTATION - BUS TRANSIT
Annual Transit Ac- Average Pas- cessibi1 it7 Peak Hour
senger % Within 1 4 Performance Mile Mile of Route Oper- Aver-
Miles Miles Vehicles Per Pop- Em- ating Head- age of of Avg Avg Seat ula- ploy- Sj2eed Wilt Fare
Route Line .No. Age .Seats Mile tion ment MPH MIN Cents '
57 41 138 -25 -31 - 11 33 0 -66 -16
- - - - - - - - - - -104 347 66 -27 -4 33 70 163 7 60 40 83 -8 265 20 -8 137 -21 -4 0 -67 116
68 35 125 -70 -11 -11 18 1 0 -42 6 211 55 9 75 0 -70 33 6 0 0 0
78 25 59 -40 2 18 5 6 7 -50 150 486 1,090 644 -33 -9 7,180 47 15 -13 -22 -16
-20 2 92 20 -33
I - - - -25 -40 0
37 18 250 150 -~·8 293 15 15 0 -50 -25 - - - - - - - - - - -- - - -
I - - - - - - . -
104 I 212 I 80 I -30 -5 I 35 I 48 81 5 I -1 -16 I
'
2-6.3 AIRPORTS
This section includes display exhibits on significant aviation parameters
resulting from the 1974 NTS data collection and development activity. Exhibits
2-6.3.1 through 2-6.3.3 are referenced and discussed in Section 2-3 through
2-5 of this part of the report. Exhibits 2-6.3.4 and 2-6.3.5 present percent
changes between 1972 and 1990 and 1972 and 1980 respectively. The implication
and interpretation of the data should be conducted only against the b,ackdrop
of the State Aviation System Plan (SASP) and the guidelines provided by the
DOT. Further discussion of the reasonbleness of the Plan is presented in
Section 2-4.
-194-
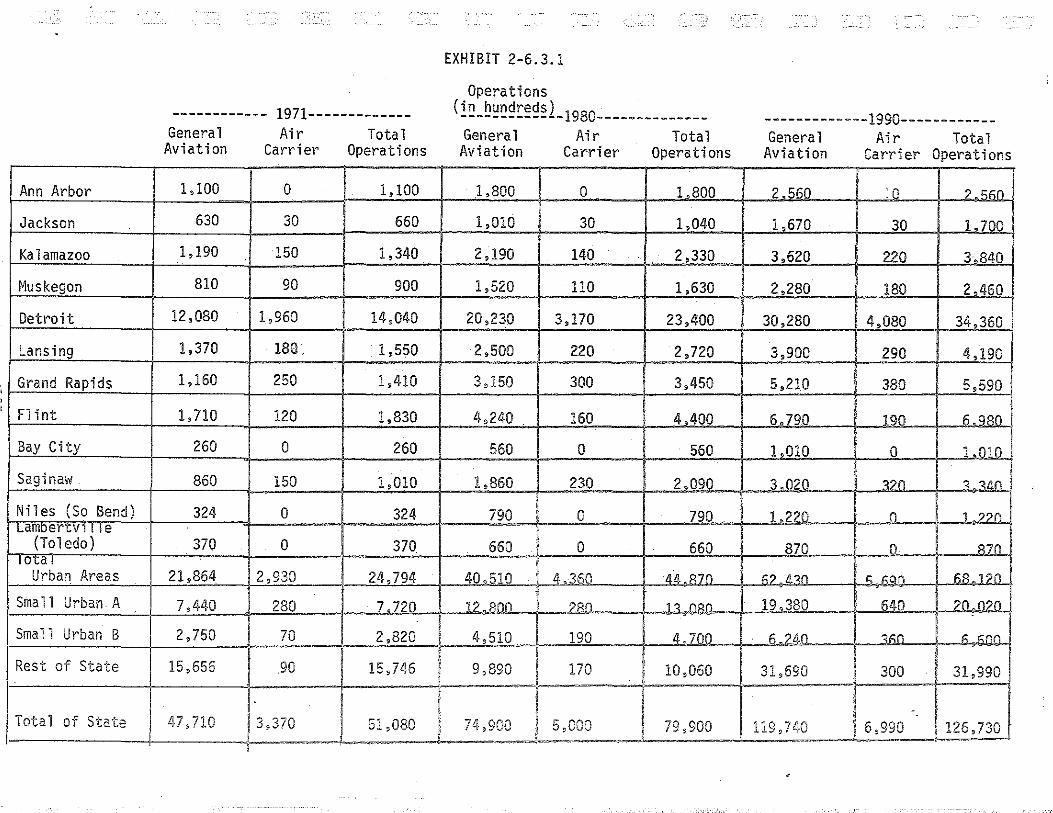
Ann Arbor
Jackson
Kalamazoo
Muskegon
Detroit
Lansing
' Grand Rapids
' ' Flint
Bay City
Saginaw .
Niles (So Bend) Lamoertvl 1 1 e
(Toledo) IOta I
Urban Areas
Small Urban A
Small Urban B
Rest of State
Total of State I
------------ 1971-------------General Aviation
1,100
630
1,190
810
12,080
1,370
1,160
1,710
260
860
324
370
21,864
7,440
2,750
15,656
47,710
Air Total Carrier Operations
0 . 1,100
30 660
150 1,340
90 900
1,960 14,040
18\L 1,550
250 1,410
120 1,830
0 260
150 1,010
0 324
0 370.
2,930 24,794
280 7 720
70 2,820
I I 90 15,74-6
13,370 I 51,080 ~
' i
I I
EXHIBIT 2-6.3.1
Operations (in hundreds) -------------1980--------------General Aviation
1,800
1,010
2,190
1,520
20,230
2,500
3,150
4,240 .
560
1,860
790
660
40.510
l?.Rnn
4,510
9,890
74~900
I I
I I I ' '
Air Carrier
0
30
140
110
3,170
220
300
160
0
230
0
0
4 360
?Rfl
190
170
5,000 -~-
Total Operations
1 800
1,040
2,330
1,630
23,400
2,720
3,450
4.400
560
2.090
790
660
lili.R70
1~ (lQ()
4.70fl
10,060
79,900
-------------1990------------General
Aviation
2 560
1,670
3,620
2,280
30,280
3,900
5,210
6 790
1,010
3 020
1..2?0
870
C:.? ~":!11
19 380
6.?M
31,690
119 '740~
Air Total Carrier Operations
·o ?.1;1>0
30 1 700
220 3 840
180 2 460
4,080 34 360
290 4,190
380 5,590
190 _6_. qgo
0 1.010
~?n "<.'llil1
0 1 ??11
0 _8]Jl_
r:; ,;an 6R.l?O . 640 ?0.0?0
<c:.n ~; _;;nn
I I 31,990 ! 300
[ 6,990
I 1126,730
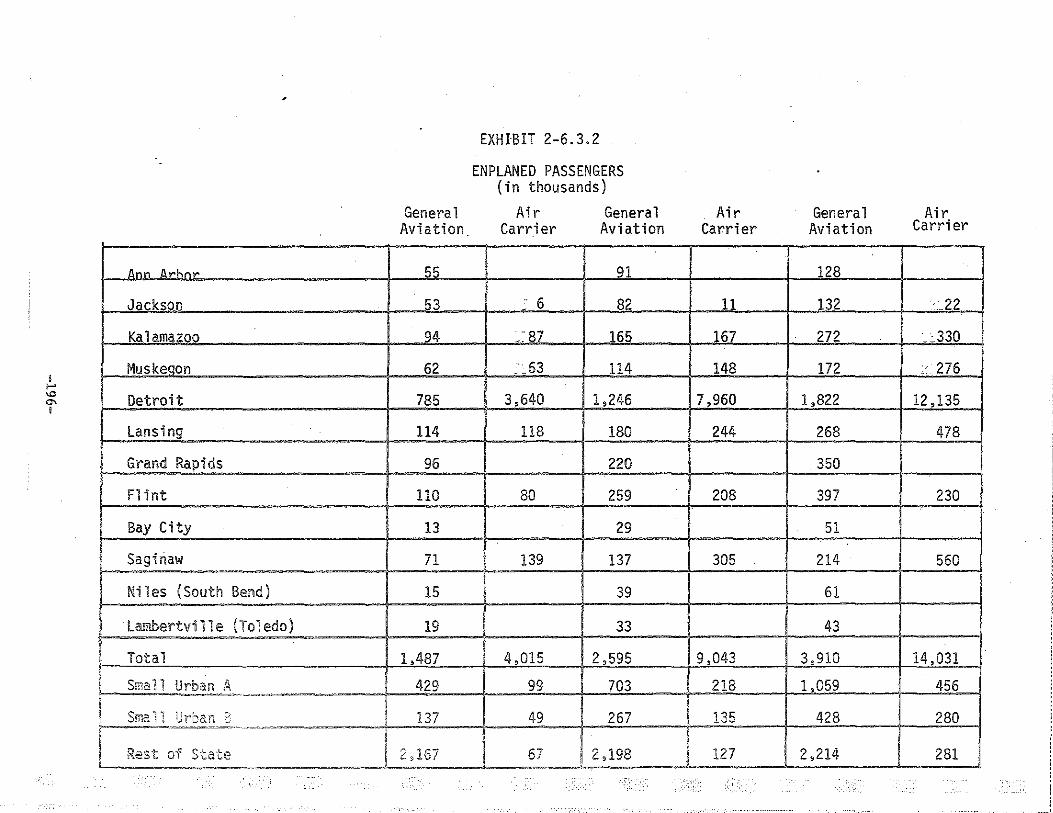
,
Ann 8rhn
Jackson
Kalamazoo
Muskeqon
Detroit
lansing
Grand Rapids
F1 int
Bay City
Saginaw
Niles (South Bend)
lambertvi 11 e (Toledo)
Total
I Small Urban P';.
~~~~~=
! Sma 11 Urban 8-' ,1,
I =~~",~-.~~~-=-=--
I Rest of State
I
I I
General Aviation_
55
53
94
62
785
114
96
110
13
71
15
19
1,487
429
137
2,167
EXHIBIT 2-6.3.2
ENPLANED PASSENGERS (in thousands)
I
Air Carrier
:.: 6
_: 87
:c63
3,640
118
80
139
4,015
99
49
67
General Aviation
91
82
165
114
1,246
180
220
259
29
137
39
33
2,595
703
267
I 2,198 ' l
Air Carrier
11
167
148
7,960
244
208
305
9,043
218
135
127
General Aviation
128
132
272
172
1,822
268
350
397
51
214
61
43
3,910
1,059
428
2,214
Air Carrier
_22
_:330
:c276
12,135
478
230
560
14,031 .. 456
280
281
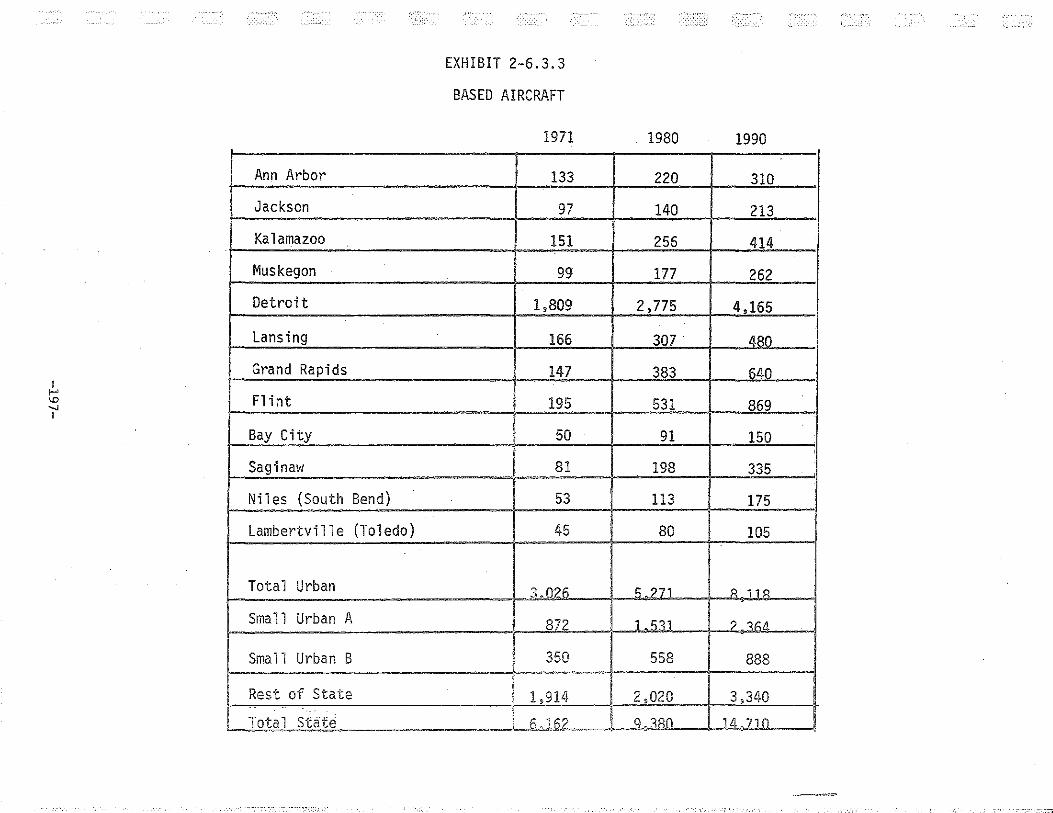
Ann Arbor
Jackson
Kalamazoo
Muskegon
Detroit
Lansing
Grand Rapids
Flint
Bay City
Saginaw
Niles (South Bend)
lambertville (Toledo)
Total Urban
Small Urban A .
Small Urban B
Rest of State
I Total State
EXHIBIT 2-6.3. 3
BASED AIRCRAFT
1971
133
97
151
99
1,809
166
147
195
50
81
53
45
3.026 .
872
350 -
1980
220
140
256
177
2,775
307
383
531
91
198
113
80
'i.?71
1 . 'i11
I 558 .
I 1,914 2,020
~li.Jli2~~LL,J.8fl
' --·· ~
1990
310
213
414
262
4,165
48!2
640
869
150 '
335
175
105
R 11 R
? 3.6_4
888
3,340
11L7JQ I
---;-';
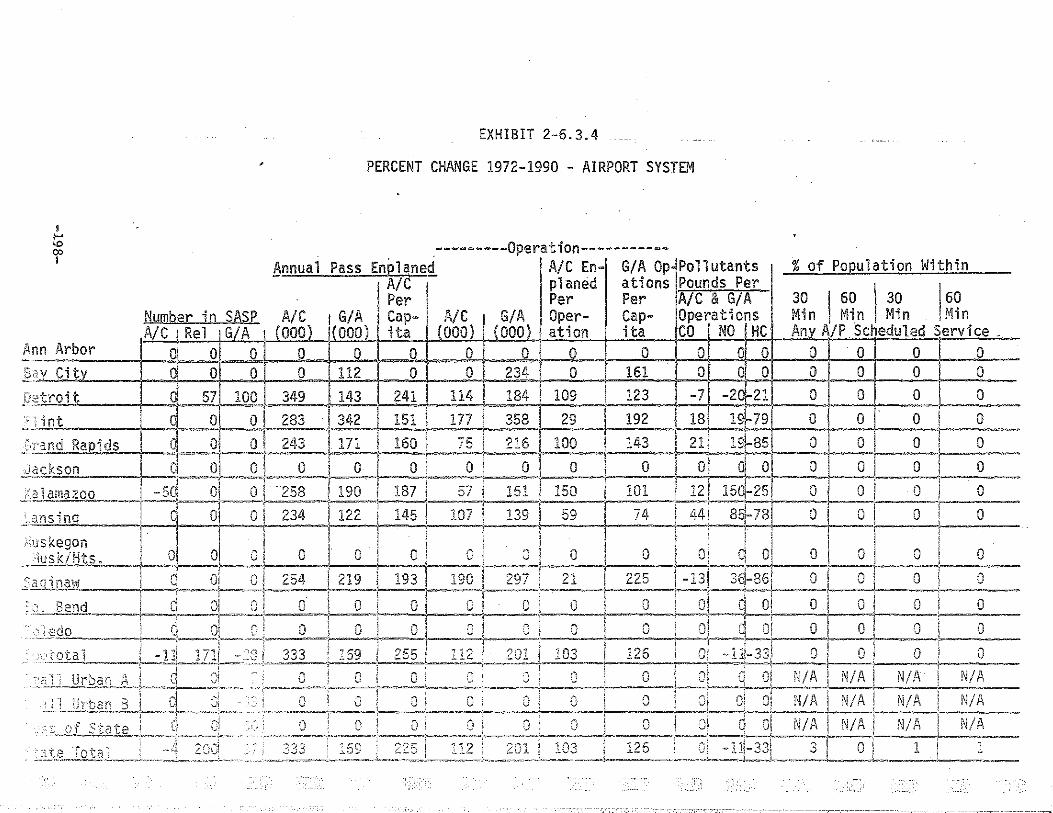
l ..... "' 00 l
Ann Arbor §D::. Citv
'
Number in SASP A/C 1 Rel 1G/A •
c 0 0 0
0
0 0
EXHIBIT 2-6. 3. 4
PERCENT CHANGE 1972-1990 - AIRPORT SYSTEM
~nnual Pass Enplaned
I A/C Per
A/~, !,GI~, CapIOOOJ 11000J ita
0 0 0 0 112 0
---------Operation-----------
,A/~, ,G/~, t000J . \000!
A/C En- G/A Op Pollutants planed ations Pounds Per Per Per A/C & G/A Oper- Cap- Operations ation ita CO NO HC
0 0 0 0 0
,':_: __ '
% of Pooulation Within
30 I 60 1 30 ,60 Min Min ! Min !Min Any AlP Scheduled Service _
0 I Q 0 0
0 0 0 0
------ ---~:0:<:1.

EXHIBIT 2-6.3.5
PERCENT CHANGE 1972-1980 - AIRPORT SYSTEM
---------Operation-----------Annual Pass En~laned A/C En- G/A Op Pollutants I % of Po~ulation Within
A/C plaaed at ions Pounds Per Per Per Per. A/C & G/A 30 I 60 l 30 160
Number in SM.£. (~/~) 1(~/~) Cap- (~/~) (~/~) Oper- Cap- Operations Min Min M>in Min A/C Rel G/A 000 000 ita 000 000 at ion ita . co NO HC Anv MP Sch€duled Service
Ann Arbor 0 0 0 0 n n 0 0 0 n -.0 D n n n n Bav Citv n n 0 n ~4 n D _75 0 56 0 0 0 0 0 0 Detroit 0 57 100 133 65 104 61 89 42 71 19 37 -5 0 0 -1 0 Flint 0 0 0 128 162 87 77 200 29 139 4 -19 -7 0 0 0 0 Grand Rapids 0 0 0 79 69 57 25 89 50 65 11 0 -8 0 0 0 0
Jackson 0 0 0 0 0 0 0 0 0 0 0 0 ( 0 0 0 0 Kalamazoo -50 0 0 81 81 63 0 51 83 36 10 150 -2 0 0 0 0
Lansinq 0 0 0 70 54 47 57 60 9 38 13 42 -8, 0 0 0 0
t~us kegon Musk/Hts. 0 0 0 0 n 0 n _Q 0 _ _0 0 0 1 Jl n n n
Saoinaw n 0 0 93 117 77 109 J:l'l -7 1?'l -?0 . q -Rf n . n n n So. Bend 0 0 0 Q 0 0 0 0 0 0 0 0 ( 0 . 0 0 0
Toledo 0 -
0 0 0 0 n n , n n n n r n n n n 0
Subtotal -11 142 0 125 76 06 56 94 ' 43 f)q 14 'lO _o;; n n n n Small Urban A 0 0 7 0 0 0 I 0 0 0 0 0 0 ( N/A N/A N/A N/A
Small Urban B 0 0 -33 0 0 0 0 Q 0 0 0 0 ( N/A N/A N/A N/A Rest of State 0 0 60 0 I 0 0 0 0 0 t:= 0 n ( N/A N/A N/A N/A State Tota 1 -4 , 171 39 125 76 96 56 ' 94 43 14 30 -5 1 0 0 -1
2-7 SOURCES OF FUNDS
2-7.1 HIGHWAYS
The purpose of this section is to document the analyses performed with
respect to funding for the 1980 Program, as well as to discuss the implications
and reasonableness of the level of taxes reported as sources of funds.
The starting point for the projection of 1980 Program funds for highways
was the projection of Federal funds. Appendix 0 of Manual II shows that the
tota 1 source of funds for the highway program for fi sea 1 year 1973 through I
fiscal year 1979 was 1.1 billion dollars, as shown in Table 2.7.1.1. In onler·
to compensate for reporting in the 1980 Program for projects completed subse-
quent to January 1, 1972, the Appendix 0 target funds were adjusted for
Michigan's apportionment of Federal funds for fiscal year 1972. This was
done for each of the funding categories shown as the Appendix 0 Federal Target
Funds. This apportionment is shown in Table 2.7.1.2. The final projection of
available Federal funds for projects to be completed between 1972 and 1980 is
shown in Table 2.7.1.3. As this table shows, for the purposes of 1980 Pr·ogram
reporting, there was assumed to be available 1.3 billion dollars. This was
comprised of 779 million dollars of Interstate funds, 47 million dollars
priority primary funds, 208 million dollars to be applied to the state primary
and secondary system, and 270 million dollars of urban program funds. This
included the 4 million dollars TOPICS funds for 1972 and the 10.7 m"illion doll;_,.rs
of TOPICS funds shown in Appendix 0 for fiscal year 1973.
The next step in the development of the source of funds for the 1980 l!iq!,;,;;,,.c
P1·ogram was the projection of estimated revenues from the Michigan Motor
Vehicle Highway Fund. This was projected from fiscal year 1972 through 1979
on the basis of the current motor fuel tax rate, current license plate, title
and other fees, etc. There were no genera 1 state funds considered to be avail
able for the highway program and thus, no analysis of the burden on the generid
··200-
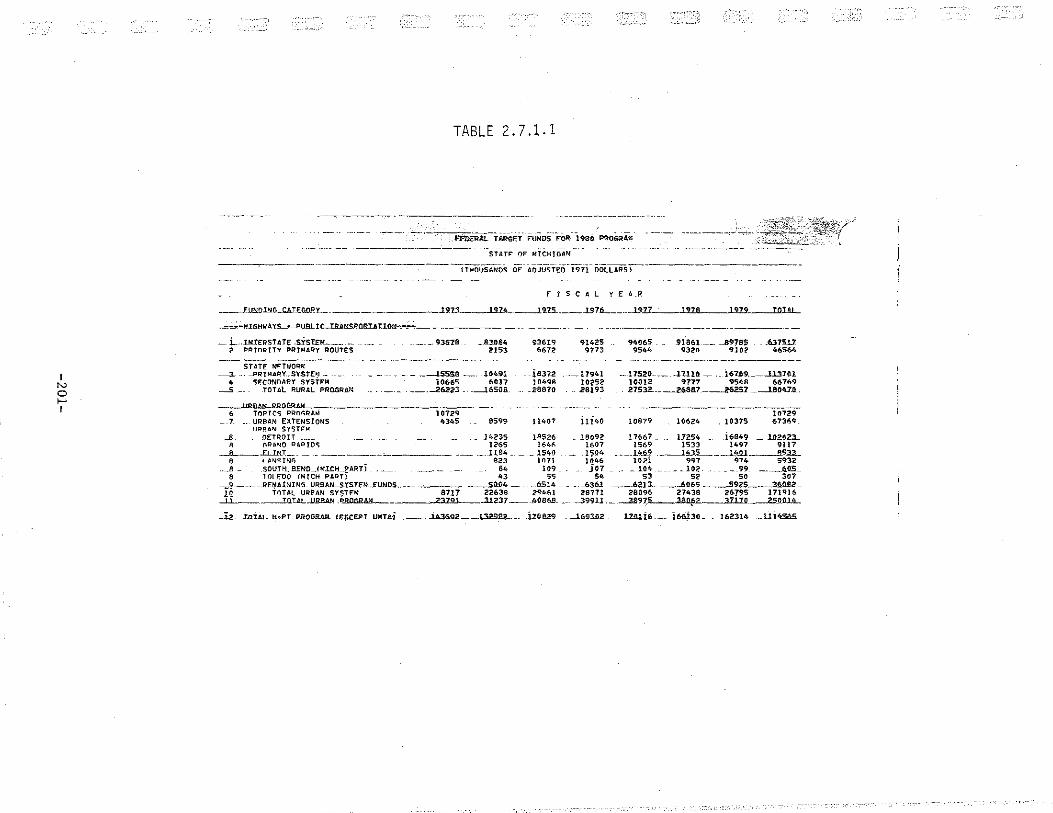
I N 0
'"' I
TABLE 2.7.1.1
- -- ~--~--·------~----
STAT~ OF IHCHTGAN
F T S CAL Y E A_R
__ 2E~~~~~!DD!NG-l:AT£GO.R_y ______ ~-------..l9.1!33L__.JI£97~· -..-..l'i7.5_ ___ ..J.97L _____ _l911.....__"1>9>Z•B---''''"''''--CTOO"T"'"'-
_ L .. .INtERSTATE .sist£tot ______ _ ? P~tn~TTY PRt~ARY ROUTES
ST4Tf NFTWORK -----3. .. _pRTM.4R'I'..SYstE':I-
4 SFCONDARY SYSTFM -..5 __ TOTAl RURAL PRO.GR.414
6 TOPTC<; PRO~RA~ __ 7 URBAN EXTENSIONS
URflll."' SY'HF"M --.8 f)ETROIT - ---·
p, r;RUIO PAPIQ<; _.__ __ ..f.LIN_f __ - ·- ----
F.I ! A"'<;INr, ... J! - SOUHl.. B.ENO_IM.U:I-LJ!ARTi
8 TOt F.OO CNtCH PART)
936lQ 6672
--- - - .. -l.SSS.S --- 10491 6017
.--l6SOa
-- iS31.2 104<';1R
. zatno 10661:;
---- ___ -26223-
10729 4345 9599< 11407
14235 1AS26 1265 1641'> ll94- - 1540
823 lOT! 64 109. 43 '5'5
~ -- _ RE.'l!AlNING .. URSAN-S'iSTEN E"UMOS .. ---------- -----..-S!l.04- __ 6514 !Q TOTAL URSAN SYSTF.M
...l.l........-------..I.O.UL...I.I.RBA.N . P..R!l.GRAM 8717 22639 2946!
----''"'"''""'--...ll237 ___ ;.0a6.B_
91.425 9773
·--17941 10?52
- 28193
it }40
18092 !607
.1$04 }04.6 107 •• __ 6361
28771 __ J991l
94065 9544
.9196i -~- _89785 - .637S.l.1 9320 910? 46564
-11520---· ....11.110- .. 167.09 ____ ....ll.J70.1 HI012 9777 .95Ml 667fl9 27SJ.2...._----26SS.7 ____ ---2fl251 _.......I.aou.o. .
10879 10624 10375
1766 7 1.7254 i 6849 __ l.OUZ3.__ 1569 1533 1497 9117
----lill __ __lHs____--.1..4.Q.l ___ ,;_,_,__ 1021 997 974 5932
..104- ___ ]02 ______ 99. _........_6,05_ 53 52 50 307
____ _62J:L __ . ....6.065- _ __59.25_~2-28096 27438 26795 171'116
__ ..-J.S975 380(>2 -.3l.Ull. zsnou
162314 ... lli4SS._
-_-,;.
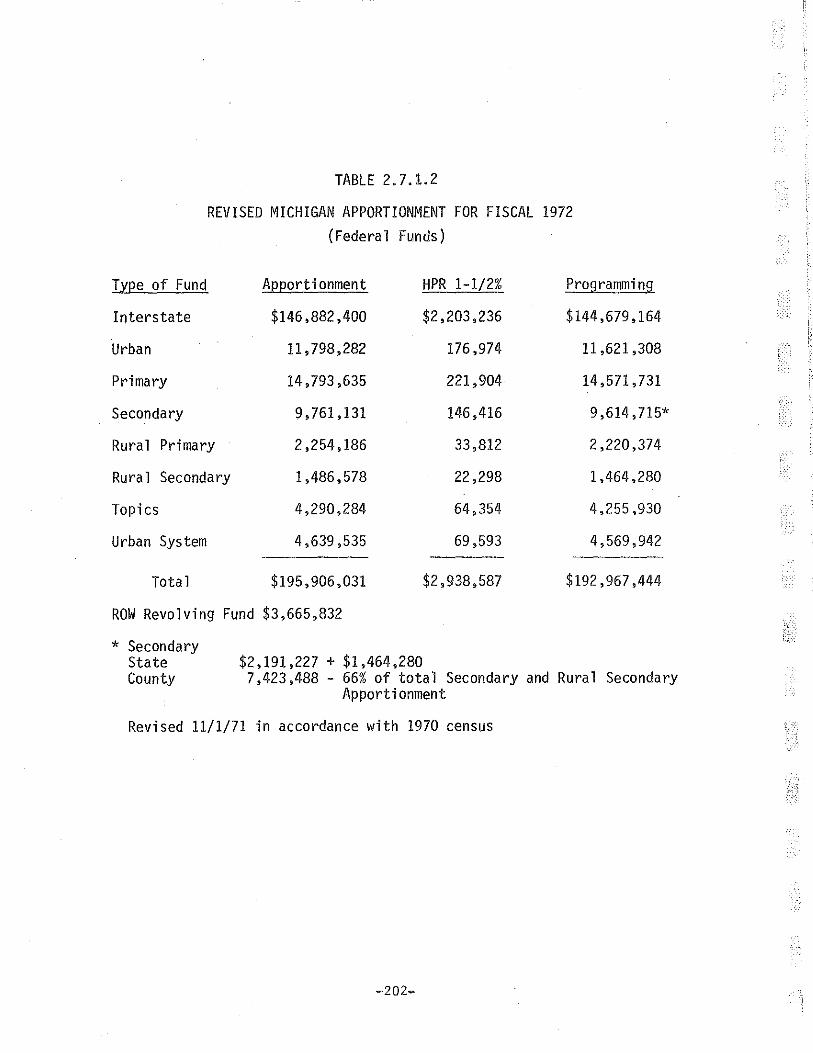
TABLE 2.7.1.2
REVISED MICHIGAN APPORTIONMENT FOR FISCAL 1972 ( Federa 1 Funds)
Type of Fund Apportionment HPR 1-1/2% Programming
Interstate $146,882,400 $2,203,236 $144,679,164
Urban 11,798,282 176,974 11,621,308
Primary 14,793,635 221,904 14,571,731
Secondary 9,761,131 146,416 9,614 '715*
Rural Primary 2,254,186 33,812 2,220,374
Rural Secondary 1,486,578 22,298 1,464,280
Topics 4,290,284 64,354 4,255,930
Urban System 4,639,535 69,593 4,569,942
Total $195,906,031 $2,938,587 $192,967,444
ROW Revolving Fund $3,665,832
$2,191,227 + $1,464,280 * Secondary
State County 7,423,488- 66% of total Secondary and Rural Secondary
Apportionment
Revised 11/1/71 in accordance with 1970 census
-202-
-------------- ---------~
'

,_ ";
FUND
TABLE 2. 7.1.3
MICHIGAN FEDERAL FUND PROJECTIONS - HIGHWAYS
(Derived from Appendix 0 and 1972 Apportionment) 1972 - 1980
(Thousands of Dollars)
Interstate
Priority Primary
State Network:
Primary System
Secondary System
Total Rural Program
Urban Program:
Topics Program
Urban Extensions
Urban System
Total Urban Program
130,099
77,588
14,885
78,718
176,379
AMOUNT ( 1971 do 11 a rs)
778,805
46,564
207,687
269,982
Total Highway Program· 1,303,038
-203-
------------,---------"
taxpayer from state revenue sources has been made. Table 2.4.2.1.2 shows the
projected revenues from the Motor Vehicle Highway Fund for fiscal years 1972
through 1979. As this table shows, gasoline and diesel fuel taxes, license
plate fees, and other fees have projected to determine the total available
revenue for each fiscal year. From these total revenues has been subtracted
the appropriate collection costs, as well as that portion of the Motor Vehicle
Highway Fund which is devoted to mass transit purposes as part of the General
Transportation Fund. The total projected amount of highway funds available
from this source over the eight year period is seen in Table 2.7.1.4 to be 4.4
billion dollars.
Per DOT instructions in Manual I, these annual receipts were discounted
for each year in the 1972-1980 period to account for the effects of general
inflation at an assumed rate of 2.4% per year. As Table 2.7.1.4 shows, the
total amount available for highway purposes, including both construction and
maintenance expenditures over the time period, was 3.9 billion dollars.
The next step in the projection of highway funds for the 1980 Program was
the distribution of this 3.9 billion dollar highway program in the manner
currently prescribed by Michigan law. The current allocation formula dictates
that 44.5% of the funds go to the State Trunkline Fund for construction and
maintenance and administration of the state highway system. The remainder of
the Motor Vehicle Highway Fund is distributed to county road commissions and
to cities and villages, with 35.7% to the county road commissions and 19.8%
to cities and villages. Of the 35.7% distributed to the county road commissions,
10% is distributed to the state's urban system, and the remainder of these CRC
funds are distributed between county primary and county local roads on a 75/25
basis. The legislation also provides that the funds distributed to cities and
villages be distributed between city major and city local roads at a ratio of
75/25. -204-
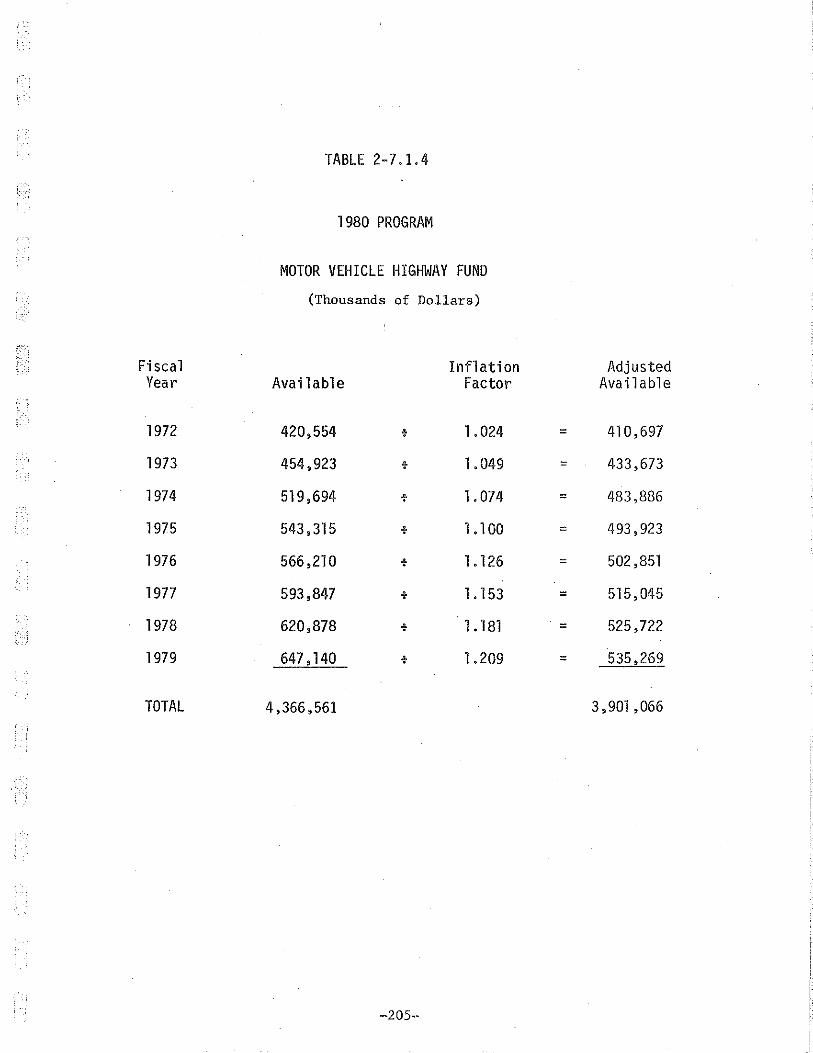
TABLE 2-7.1.4
1 980 PROGRAM
MOTOR VEHICLE HIGHWAY FUND
(Thousands of Dollars)
Fiscal Inflation Adjusted Year Available Factor Available
1972 420,554 • 1.024 = 410,697
1973 454,923 + 1.049 = 433,673
1974 519,694 t 1.074 = 483,886
1975 543,315 t 1.100 = 493,923
1976 566,210 t 1.126 = 502 ,851
1977 593,847 t 1.153 = 515,045
1978 620,878 t 1.181 = 525,722
1979 647 '140 t 1.209 = 535,269
TOTAL 4,366,561 3,901,066
-205-·

Table 2.7.1.5 shows the resulting distribution of this 3.9 billion dollar
Motor Vehicle Highway Fund. This table also shows the estimate of the percent
age of these motor vehicle highway funds which would be utilized by each
agency for non-construction related expenditures, including highway maintenance,
administration, etc. These maintenance percentages were developed based upon
an analysis of financial reports submitted by county road commissions and city
developers annually as required by Act 51. This table shows, then, that there
was approximately 1.7 billion dollars of the 3.9 billion dollar Motor Vehicle
Highway Fund available for construction purposes in the 1972-1980 time period.
Table 2. 7.1.6 shows the resulting allocation of funds to the State
Highway Program for the period. This includes the 868 million dollar distribu
tion from the Motor Vehicle Highway Fund and the 1.3 billion dollar distribution
of Federal funds as previously discussed.
The next step in the distribution of the Federal and State funds was to
determine the funds that would be available to each individual urbanized area,
the small urban aggregates, and the rest of state. Table 2.7.1.7 shows the
allocation of the non-local funds by funding category to each of the urban
areas. These allocations were developed in the following manner. First of
all, a detailed assessment was made for each county road commission to deter
mine the portion of its funds, by category, which would be spent within the
1990 urban area boundaries. Secondly, for each of the cities and villages a
determination was made regarding the geographic area in which it was located.
Thirdly, the State Highway Program covering the 1972-1980 time period was
reviewed on a project by project basis to determine those projects, or portions
of projects, which were within the 1990 urban area boundaries.
~206-·
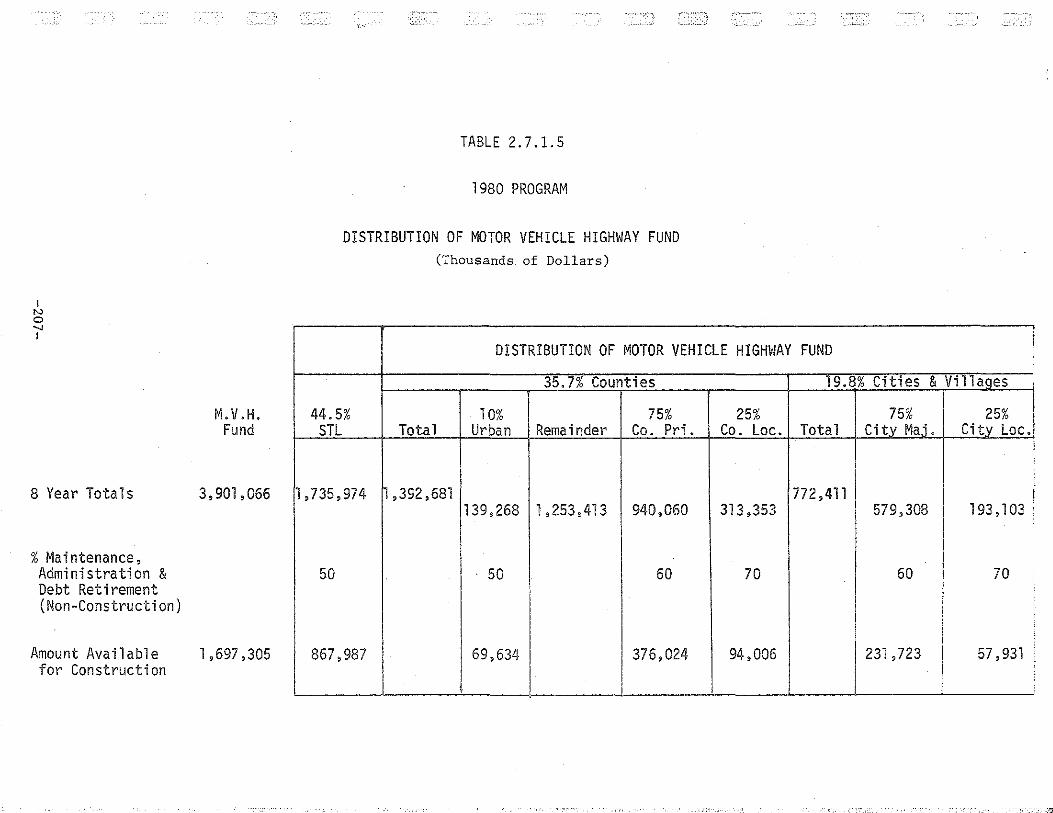
I N 0 .._, I
8 Year Tota 1 s
% Maintenance, Administration & Debt Retirement (Non-Construction)
Amount Available for Construction
M.V.H. Fund
3,901,066
1 ,697,305
TABLE 2.7.1.5
1980 PROGRAM
DISTRIBUTION OF MOTOR VEHICLE HIGHWAY FUND (Thousands of Dollars)
DISTRIBUTION OF MOTOR VEHICLE HIGHWAY FUND
35.7% Counties 19.8% Cities & Villaqes I
44.5% 10% 75% 25% 75% 25% I ' STL Total Urban Remainder Co. Pri. Co. loc. Total Ci tv Ma.i. Citv Loc.t 1
1,735,974 ~ ,392,681 772,411 139,268 1 ,253,413 940,060 313,353 579,308 193,103 '
I 50 50 60 70 60 70
i
1 231 ,723 I
867,987 69,634 376,024 94,006 I 57,931 i j I ' ' , i .
- .,-;
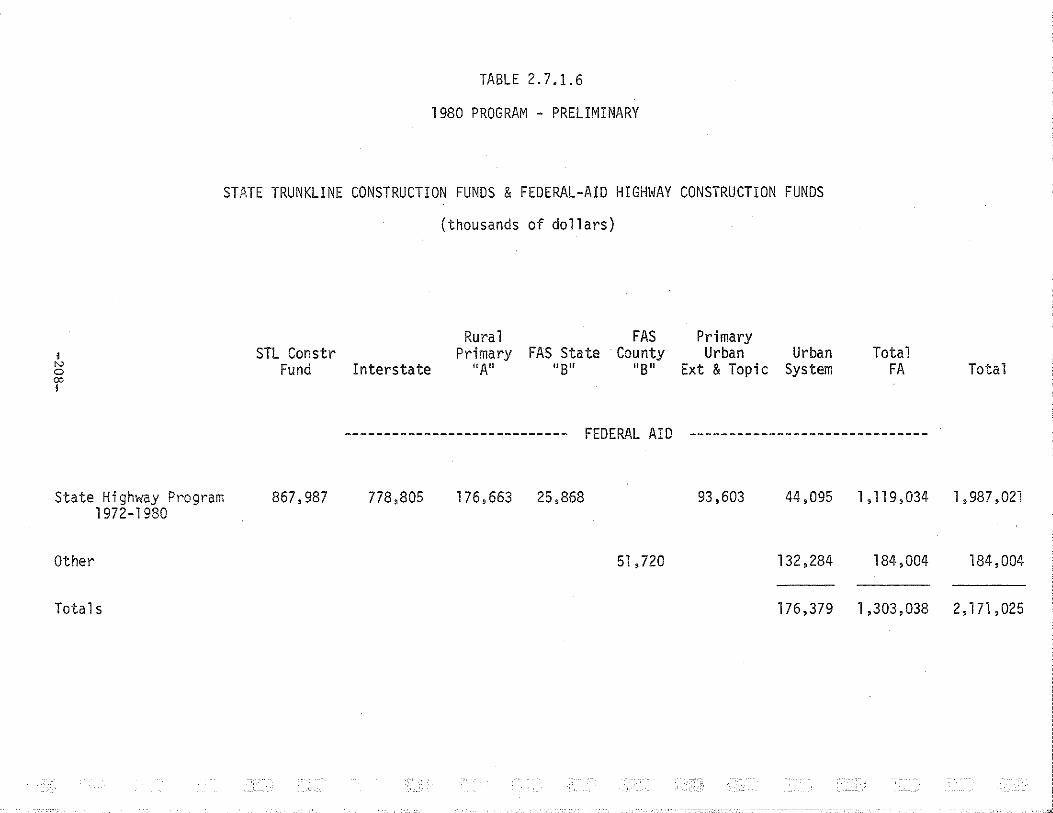
TABLE 2.7.1.6
1980 PROGRAM - PRELIMINARY
STATE TRUNKLINE CONSTRUCTION FUNDS & FEDERAL-AID HIGHWAY CONSTRUCTION FUNDS
l N 0 00 I
State Hi gh;,.ay Program 1972-1980
Other
Totals
STL Constr Fund
867,987
(thousands of dollars)
Rural Primary FAS State
Interstate HAll nsn FAS
County liB II
Primary Urban
Ext & Topic Urban
System Total
FA Total
---------------------------- FEDERAL AID ------------------------------
778,805 176,663 25,868 93,603 44,095 1,119,034 1,987,021
51 '720 132,284 184,004 184,004
176,379 1,303,038 2,171,025
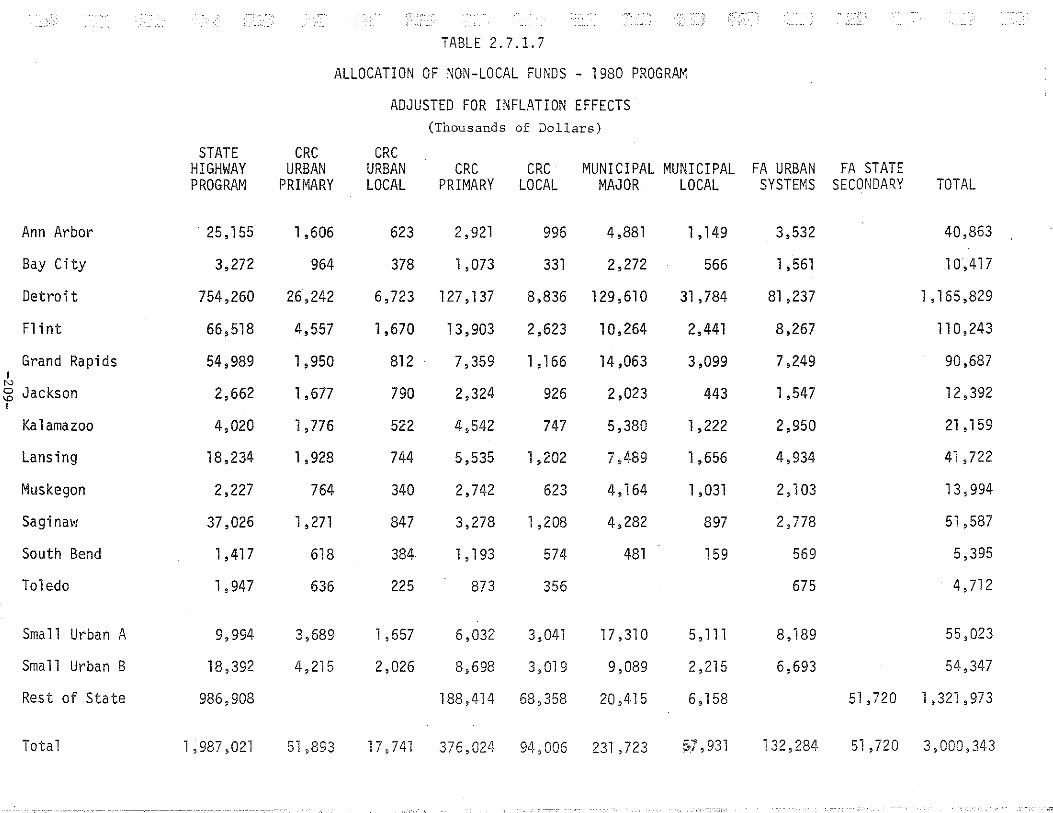
TABLE 2.7.1.7
ALLOCATION OF NON"LOCAL FUNDS - 1980 PROGRAM
ADJUSTED FOR INFLATION EFFECTS (Thousands of Dollars)
STATE CRC CRC HIGHWAY URBAN URBAN CRC CRC MUNICIPAL MUNICIPAL FA URBAN FA STATE PROGRAM PRIMARY LOCAL PRIMARY LOCAL MAJOR LOCAL SYSTEMS SECONDARY TOTAL
Ann Arbor 25 '155 1,606 623 2 '921 996 4,881 1 , 149 3,532 40,863
Bay City 3,272 964 378 1 ,073 331 2,272 566 1 '561 10,417
Detroit 754,260 26,242 6,723 127 '137 8,836 129,610 31 '784 81 ,237 1,165,829
F1 int 66,518 4,557 1,670 13 '903 2,623 10' 264 2,441 8,267 110,243
Grand Rapids 54,989 1,950 812 7,359 1 '166 14,063 3,099 7,249 90,687 I
N
~ Jackson 2,662 1 ,677 790 2,324 926 2,023 443 1,547 12 '392 I
Kalamazoo 4,020 1 '776 522 4,542 747 5,380 1,222 2,950 21 '159
Lansing 18,234 1 '928 744 5,535 1,202 7,489 1,656 4,934 41 ,722
Muskegon 2,227 764 340 2,742 623 4,164 1 ,031 2 '1 03 1 3 '994
Saginaw 37,026 1 '271 847 3,278 1 ,208 4,282 897 2,778 51,587
South Bend 1 '417 618 384 1 '193 574 481 159 569 5,395
Toledo 1 '947 636 225 873 356 675 4,712
Sma 11 Urban A 9,994 3,689 1 '657 6,032 3,041 17 '31 0 5 '111 8,189 55,023
Small Urban B 18 '392 4,215 2,026 8,698 3,019 9,089 2 '215 6,693 54,347
Rest of State 986,908 188,414 68,358 20,415 6 '158 51 , 720 1,321,973
Total 1,987,021 51 ,893 i7 ,741 376,024 94,006 231 '723 ~;',931 132,284 51 '720 3, 000' 343
-----------~- ------·--.------------- -- ----- -------. .
- ---- ------------ --- ------- ------ ------ ---- -----------------------------11
The assumption was made for the development of the 1980 Highway Program
that private funds would be utilized for the construction of all new subdivi
sion streets. This same assumption was utilized in the development of the
1990 Plan. Subdivision street costs for the 1972-1980 period were developed,
and these costs adjusted to account for differential changes between construc
tion cost indices and general inflation in the 1972-1980 time period. Table
2.3.1.8 shows the private funds required for completion of the subdivision
streets during the time period, by urbanized area.
Local funds were projected in a manner somewhat different than that
utilized for the development of local funding for the 1990 Plan. As is
discussed in Section 2.5, the 1980 Program for each urban area was developed
on the basis of the Short Range Improvement Programs for Highways developed
through the 3C process. Thus, local fund requirements were developed based
upon perceived short-falls between the Short Range Improvement Program capital
cost requirements and the funds which would be available to each geographic
reporting area from Federal and State sources as previously discussed. For
each urban area, a comparison was made with the projected requirements for
local funding developed for the 1990 Plan, utilizing the projections from
1972-1980. In all cases for which Short Range Improvement Programs were
available, required local funding was tolerably close to the initial projec-
tions, and it was believed that the local funding requirements derived from
the Short Range Improvements Programs waul d pro vi de the more real i st·i c est·i mates.
Table 2.3.1.9 shows the resulting estimate of local funding requirements ro, highway related capital costs during the 1972-1980 period on both an absolute
and a per capita basis.
Finally, based upon all of the considerations ~reviously discussed, Table
2.3.1.10 shows the summary allocation of all capital costs for the 1980 Program,
and Table 2.3.1.11 shows, for each urban area, the distribution of these costs
on a per capita basis and on a basis per passenger mile and per vehi c 1 e mi h
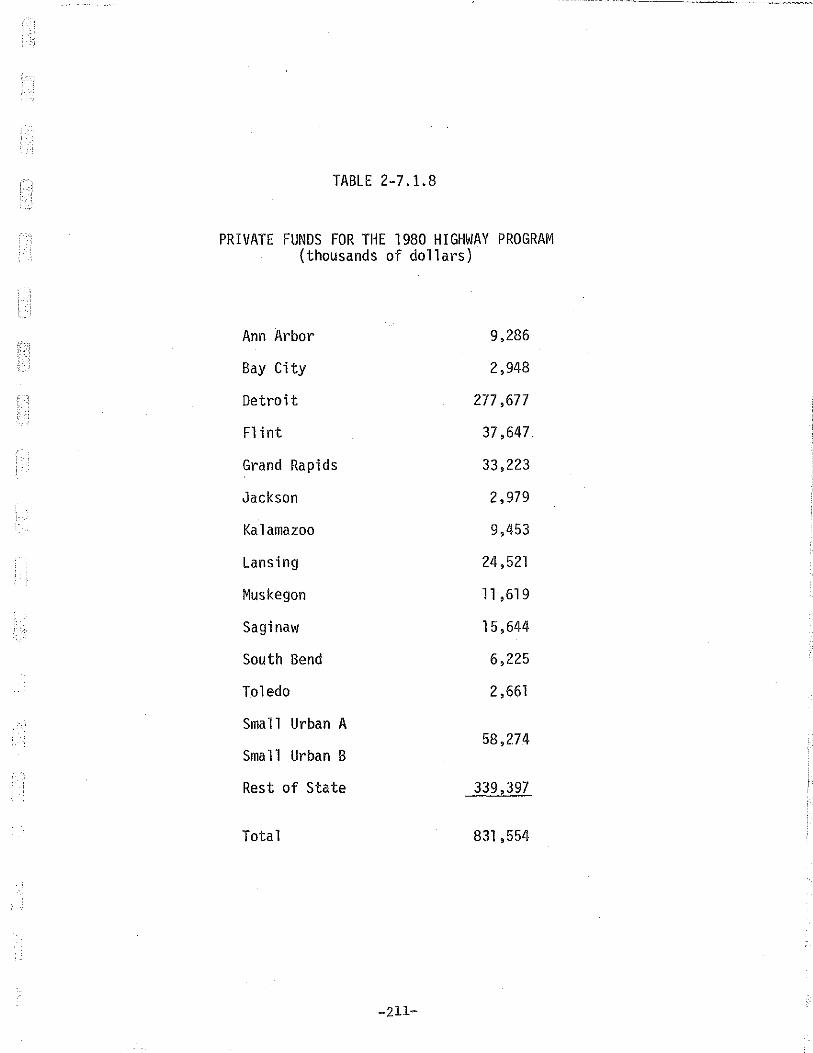
:··:, ; ... ~ TABLE 2-7.1.8
PRIVATE FUNDS FOR THE 1980 HIGHWAY PROGRAM (thousands of dollars)
Ann Arbor 9,286
Bay City 2,948
Detroit 277,677
Flint 37,647
Grand Rapids 33,223
Jackson 2,979
Kalamazoo 9,453
Lansing 24,521
Muskegon 11 ,619
Saginaw 15,644
South Bend 6,225
Toledo 2,661
Small Urban A 58,274
Small Urban B
Rest of State 339,397
Total 831,554
-211-
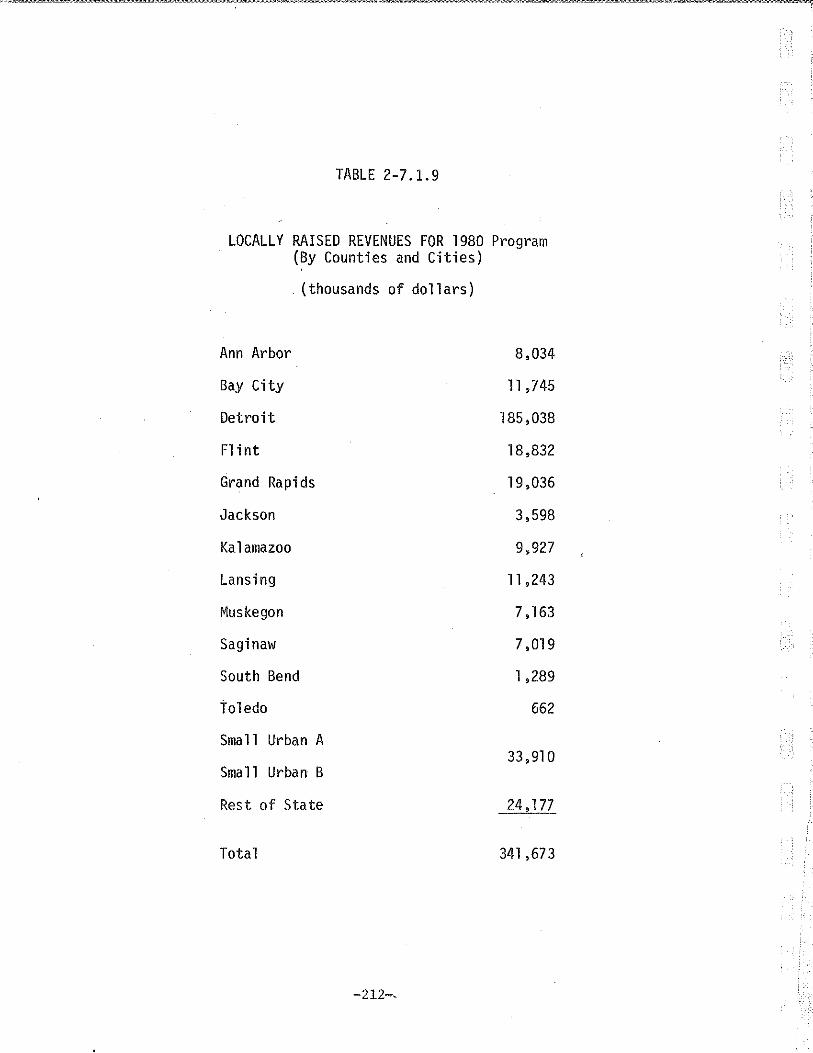
TABLE 2-7.1.9
LOCALLY RAISED REVENUES FOR 1980 Program (By Counties and Cities)
(thousands of dollars)
Ann Arbor 8,034
Bay City 11 ,745
Detroit 185,038
Flint 18,832
Grand Rapids 19,036
Jackson 3,598
Ka.1 amazoo 9,927
Lansing 11 ,243
Muskegon 7,163
Saginaw 7,019
South Bend 1,289
toledo 662
Small Urban A 33,91 0
Small Urban B
Rest of State 24,177
Total 341 ,673
-212--

TABLE 2-7.1.10
SUMMARY OF FUNDS FOR 1980 PROGRAM (thousands of dollars)
Federal Target Funds
Other Federal Funds
Total Federal Funds
State Motor Vehicle Highway Fund Funds
Locally Raised Revenues
Sub-Tota 1
Private Funds
Total
-213-
1,303,038
11 , 360
1,314,398
1,697,305
341,673
3,330,656
831 ,554
4,184,930

Ann Arbor
Bay City
Detroit
Flint
Grand Rapids
Jackson
Kalamazoo
Lansing -Muskegon
Saginaw
South Bend
Toledo
Sma11 Urban A
'-''! ~:o,-11 Urban B
I Rest of Stat_?1 __ I
TABLE 2-7.1.11
CAPITAL COST PER CAPITA 1980 PROGRAM
TOTAL CAP COSTS/
CAPITA -
?93.65
348.57
365.93
377.90
247.04
242.49
235.29
298.86
282.72
578.81
411.58
270.45
207.70
313.53 --
TOTAL CAP COSTS/
VMT
0.05
0.08
0.06
0.06
0.05
0.05
0.04
0.05 __
0.05
0.11
0.10
0.06
0.06
0.05 1-
0.06 ,_?72.68 --- --- --- . -
TOTAL CAP COSTS/ ANNUALIZED
PMT COST/CAPITA
0.04 3Fi.71
0.04 43.57
0.04 45 74
0.04 47.24
0.03 30.88
0.03 30.31
0.03 29.41
0.04 37.36
0~03 35.35
0.07 72.35
0.06 51.45
0.04 33.81
0.03 25.96
0.03 39.19
L 0.03 96.59 -- ··- c_._ __
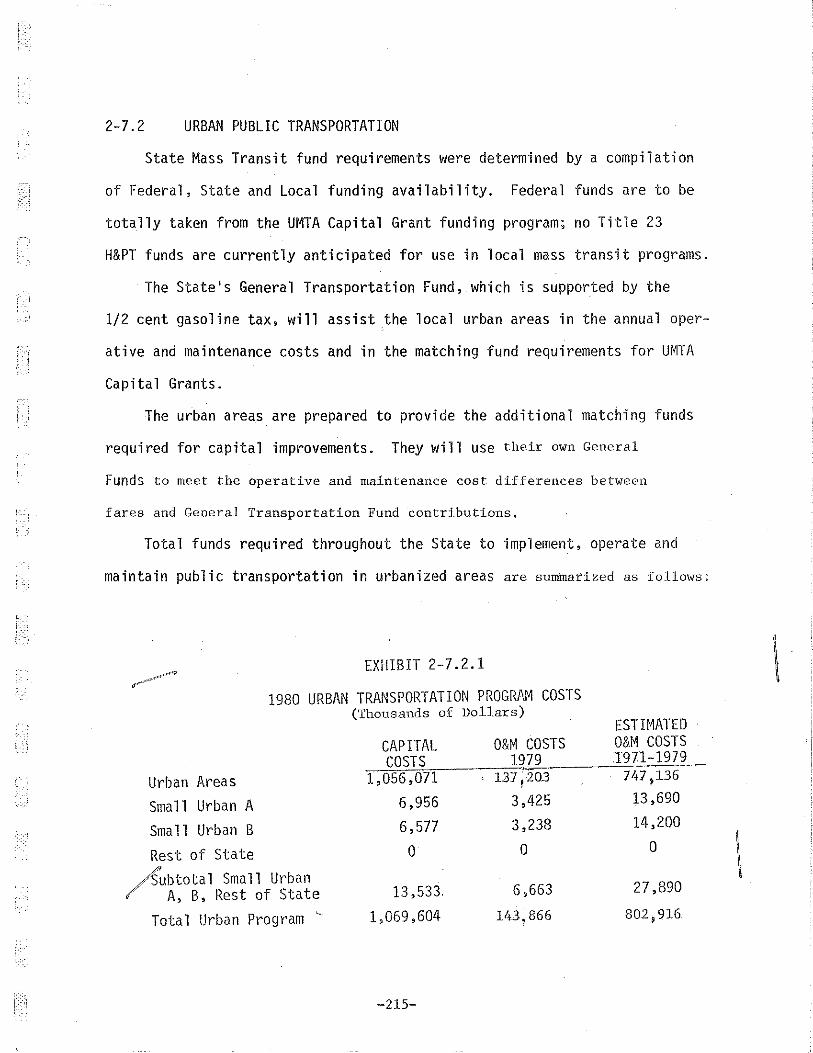
2-7.2 URBAN PUBLIC TRANSPORTATION
State Mass Transit fund requirements were determined by a compilation
of Federal, State and Local funding availability. Federal funds are to be
totally taken from the UMTA Capital Grant funding program; no Title 23
H&PT funds are currently anticipated for use in local mass transit programs.
The State's General Transportation Fund, which is supported by the
1/2 cent gasoline tax, will assist the local urban areas in the annual oper-
ative and maintenance costs and in the matching fund requirements for UMTA
Capital Grants.
The urban areas are prepared to provide the additional matching funds
required for capita 1 improvements. They wi 11 use their own General
Funds to meet the operative and maintenance cost differences between
fares and General Transportation Fund contributions.
Total funds required throughout the State to implement, operate and
maintain public transportation in urbanized areas are summarized as follows:
EXHIBIT 2-7.2.1
1980 URBAN TRANSPORTATION PROGRAM COSTS (Thousands of Dollars)
ESTIMATED CAPITAL O&M COSTS O&.M COSTS COSTS 1979 1971-1979
;..-.;....-
Urban Areas 1,056,071 1.37 1203 747,136
Sma 11 Urban A 6,956 3,425 13,690
Small Urban B 6,577 3,238 14,200
Rest of State 0 0 0
~ubtotal Small Urban A, B, Rest of State 13,533. 6,663 27,890
Tota 1 Urban Progr·am ' 1,069,604 143,866 802 i 916
-215-
]·
\
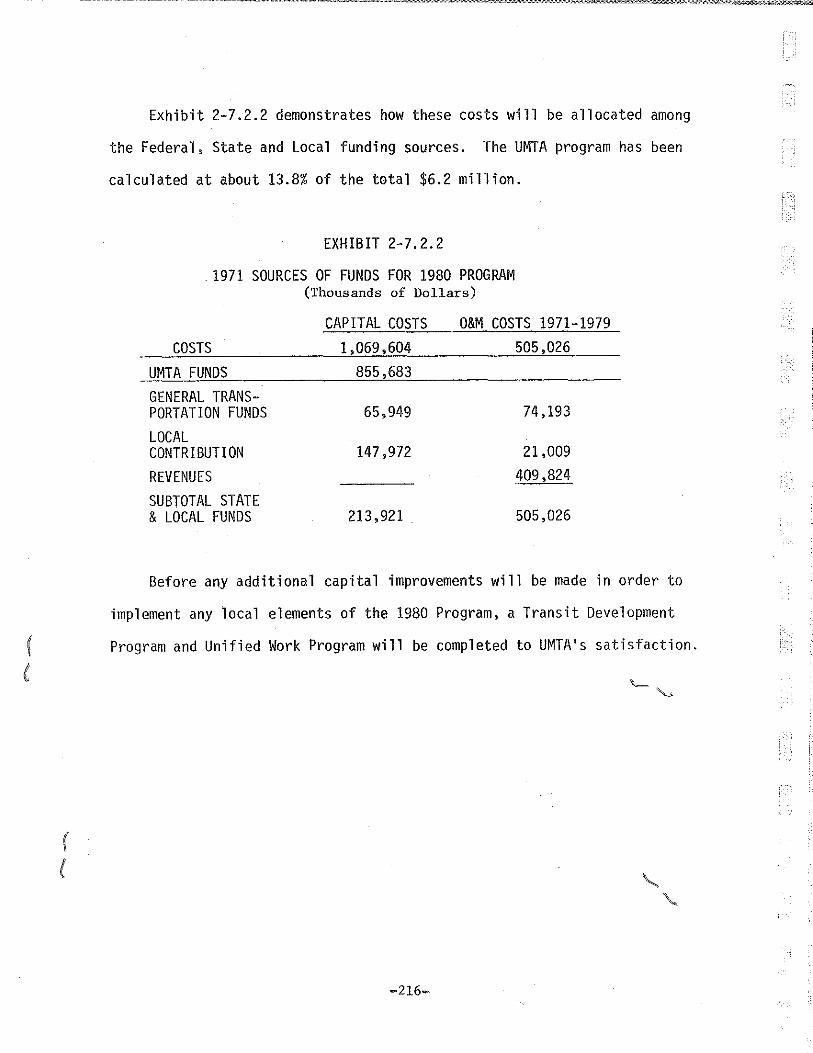
:·c·=.~,o::;;-~-~~""""-o:·~~~-~~~7-~10-"":s::..;:;."Z~~=..;.~,~>·..-~-~~":""·~-·~...-..,....1'-".<'"~-"'-"'~"--,....,.,;:.,.,..,.,~,;o,;,_...._,.~ ..... ;~;.,:~:;g~~'(;_~~..;v~.,_-,;"""'~-;·.£.•~..._"-"'"-x--:-;~·;·o·~·~·.~~-;,;•:,.;:·-:.;;•~o;:,.:-x·~-~o;o:-;-.:,o:;-:-;;-:·:•~.,;:<:--:~,z.~~.:-~::.:.c..-,.7-~·~-"-r ... -:';.~r.•.:cv.~.~-~'~~.oR~'-"'~<~·6>;;,~..--8.l .,
( (
Exhibit 2-7.2.2 demonstrates how these costs will be allocated among
the Federal, State and Local funding sources. The UMTA program has been
calculated at about 13.8% of the total $6.2 million.
EXHIBIT 2-7.2.2
. 1971 SOURCES OF FUNDS FOR 1980 PROGRAM (Thousands of Dollars)
CAPITAL COSTS O&M COSTS 1971-1979 COSTS
UMTA FUNDS GENERAL TRANSPORTATION FUNDS LOCAL CONTRIBUTION REVENUES SUBTOTAL STATE & LOCAL FUNDS
1,069,604 855,683
65,949
147,972
213,921 .
505,026
74,193
21,009 409,824
505,026
Before any additional capital improvements will be made in order to
implement any local elements of the 1980 Program, a Transit Development
Program and Unified Work Program will be completed to UMTA's satisfaction.
-216-

2-7.3 AIRPORTS
The problem of raising funds to finance the cost of airport development in
the State of Michigan was addressed in the Michigan Airport System Planning
Study. The detail for the options for coping with the resource shortages are
taken from that document.
There are two obvious approaches to dealing with the anticipated shortage
of resources to fund estimated MASP costs: additional funds could be sought
or planned development could be delayed (or deleted). More specific options
are outlined below, and those that appear promising or likely are later in-
corpora ted in avera 11 comparisons of MASP resources and costs.
Although State resources are a small fraction of the total required to
fund the MASP, an increase in these funds might encourage some vital airport
development.
A tax on aviation fuel provides the bulk of the funds for State contri
bution to airport development. The present tax of 3¢ per gallon is comparable
to that levied in surrounding states. For air carriers, one-half of the tax
is refunded. Without the refund, out-of-state purchases of fuel would be
encouraged. A concerted effort by several states to raise fuel taxes would,
if successful, avoid this problem, but such increased federal taxes on general
aviation, as recommended by a current federal airport cost allocation study,
would cause resistance to further state taxes on general aviation--and may
also slow the growth of general aviation compared with this study's projections.
Increases in local funds are outside the State's ability to influence,
except by encouragement. To the extent that local funding takes place through
issuance of revenue bonds, selective state insurance of such bonds might achieve
a lo\'ler interest rate and thereby offer encouragement to grant applications.
-217-

In most cases, however, it seems unlikely that local airport authorities will
be eager to use local funds for improvements that are eligible for ADAP funds.
Even to reach the local cost levels implied by the MASP would require stren
uous efforts, and to then substitute local funds for some items eligible for
ADAP will be regarded as an added burden.
Because of its size, Detroit Metropolitan Airport may elect to compen
sate for shortages in ADAP funds by increased local resources. Detroit has
greater financial ability (through airport fees and charges) and more in
centive than other Michigan airports to use local funds.
The state plan can only be implemented on the initiative of locally
owned and controlled airports, and it is not certain at what rate future ADAP
grant requests will be submitted. Local enthusiasm for implementing the MASP
is questionable in light of anticipated shortages of ADAP funds.
Planned airport improvements that are not closely related to safety or
to achieving needed capacity could in theory be deferred until more urgent
improvements are funded. The authority to defer airport improvements currently
rests with the FAA and not the MAC. This authority has not been exercised
because grant requests have not yet exceeded available funds at the national
level.
In the event that Michigan grant applications do exceed available funds
at some point, the MAC may wish to share with the FAA the difficult judgment
as to which grants should be deferred. These decisions will require assess
ment of the relative merits of each grant request received.
-218-
~!Je~j_of_~he Energy Crisis on Development
Aviation forecast provides a basis for the projections used in both the
: : System Planning Study and the Department of Transportation Study. The State
Airport System Planning Study began before the emergence of the energy crisis.
At the end of our study, the effect of the energy crisis was addressed in the
'~'-''
following manner.
Because aviation forecasts provide the basis for much of this study, it
must be noted that the projects were prepared andused before the emergence
of this winter's ''energy crisis.'' Recent events, such as the curtailment of
oil imports from the Middle East, have brought to full federal attention the
possibility of national fuel shortages for an undertermined period. There is
now, also, the prospect of substantial increases in the cost of transportation,
arising from increases in fuel costs. It is judged too early to assess paten-
tial effects of such factors on future aviation activity levels in Michigan-
much depends on the methods by which available fuel supplied will be priced
and allocated among competing uses. For example, demand for air travel may
increase if federal restrictions are imposed on automobile travel. On the
other hand, high prices may curtail travel demand, including the demand for
air transportation. In light of these uncertainties, the projections of this
study can be viewed in several ways:
o The forecasts may significantly overstate future aviation activity.
o Projected activity may occur, but at a later date than indicated (e.g., 1980 projections may not be reached until 1985 or 1990).
o The projections may turn out to be accurate or even understated because of changes in travel patterns.
-219-
~ ~- ~ -- --~- ~ ~-- ~ --------- -~ --~ ~ ~ ------1
In the absence of reliable information on the pattern of future federal
responses to the energy crisis, and considering that aviation is a small part
of the overall energy picture, it is most reasonable to assume that past pat
terns will tend to persist (extreme government responses to the present
crisis are likely to be temporary). If a change should occur, it is most
likely to be in the direction of deferred growth. It must be emphasized that
much of the recommended development of Michigan's airport system does not
appear to be critically dependent on rapid growth in aviation activity.
-220-
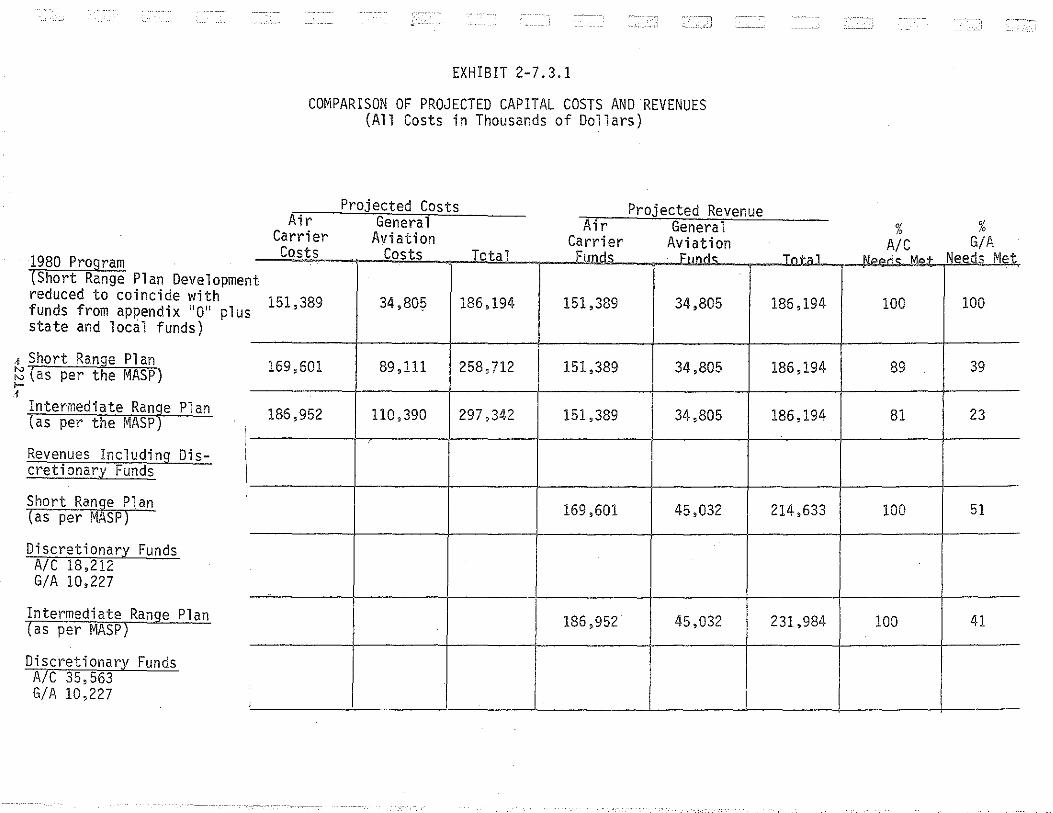
1980 Program (Short Range Plan Developme reduced to coincide with funds from appendix "0" plu state and local funds)
, Short Range Plan t;:; (as per the MASP) ,_. 1
Intermediate RanJe Plan (as per the MASP
Revenues Including Discretionary Funds
Short Range Plan (as per MASP)
Discretionary Funds A/C 18,212 G/A 10,227
Intermediate Range Plan (as per MASP)
Discretionary Funds A/C 35,563 G/A 10,227
nt
s
'
EXHIBIT 2-7.3.1
COMPARISON OF PROJECTED CAPITAL COSTS AND REVENUES (All Costs in Thousands of Dollars)
, __ _:,__ ___ _
Projected Costs Projected Revenue Air General
Carrier A vi at ion Air General
Carrier Aviation Costs Costs Total Ftmrlo · Funrl~
151,389 34,80~ 186,194 151,389 34,805
169,601 89,111 258,712 151,389 34,805
186,952 110,390 297,342 151,389 34,805
'
169,601 45,032
. '
186,952 45,032
Tr>bl
186,194
186,194
186,194
214,633
231,984
% A/C
MooAo Mo+
100
89
81
100
100
% G/A
Need< Met
100
39
23
51
41
~: >-'
2-8 LOW AND NON-CAPITAL ALTERNATIVES
This section includes a summary of the responses of the Urban Areas.
Consistent with the State goals and objectives cited in Section 2-2.1,
the State anticipates encouraging and sponsoring those program alternatives
which are consistent with total transportation service development within
the State. Specific emphasis is now being placed on encouraging car-pooling.
Exhibit 2-8.1 presents the Summary of Urban Area Responses.
-222-
• ' j

EXHIBIT 2-8.1 SUMMARY OF L~~ AND NON-CAPITAL ALTERNATIVES
PERIOD ·OF IMPLEMENTATION
1972 1980 1990 Not Being Program Alternative Inventory Program Plan Considered
I. Staggering of work hours. 2 1 8 2. Measures to encourage car pools. 1 R 1 1
). Banning private automobiles from the CBD, 1 9
4. Raising tolls on toll bridges and tunnels during peak hours. 10
5. Lowering tolls on toll bridges and tunnels during off-peak hours. 10
z 0 6. Increasing CBD daytime H
~ parking rates. 2 1 8 "' 0 7. Lowering transit fares during .. ~ off-peak hours. 2 7 z
~ 8. Leas restrictiona on taxicabs. 10 " H
_10 ...,
9. I.e" restrictions on iitneys. "' "' .. ~
lO. Reserved lanes for buses. 3 1 7 i-· ll. Restrictions on curbside loading
2 (l and unloading in congested areas. 3 7 '1. -~·-
:>< l2. Evening delivery by trucks in
~ downtown areas. 8 H !). Other ~'8r~e~;ra, 1 1 1 " (describe) ri nn
l4. Im[!roved Traffic Ooer. 1 1
15. Bike Paths 1 ~ .
16. "
17. "
18. "
19. Rescheduling aircraft 10 operations to reduce peaking. --
20. Diverting low-passenger operations from air carrier airport runways to general
10 aviation facilities, ~ H 21. Other (describe) "' 0 -.. "' 22. " H ..
2). " '
24. "
25. "
-223-
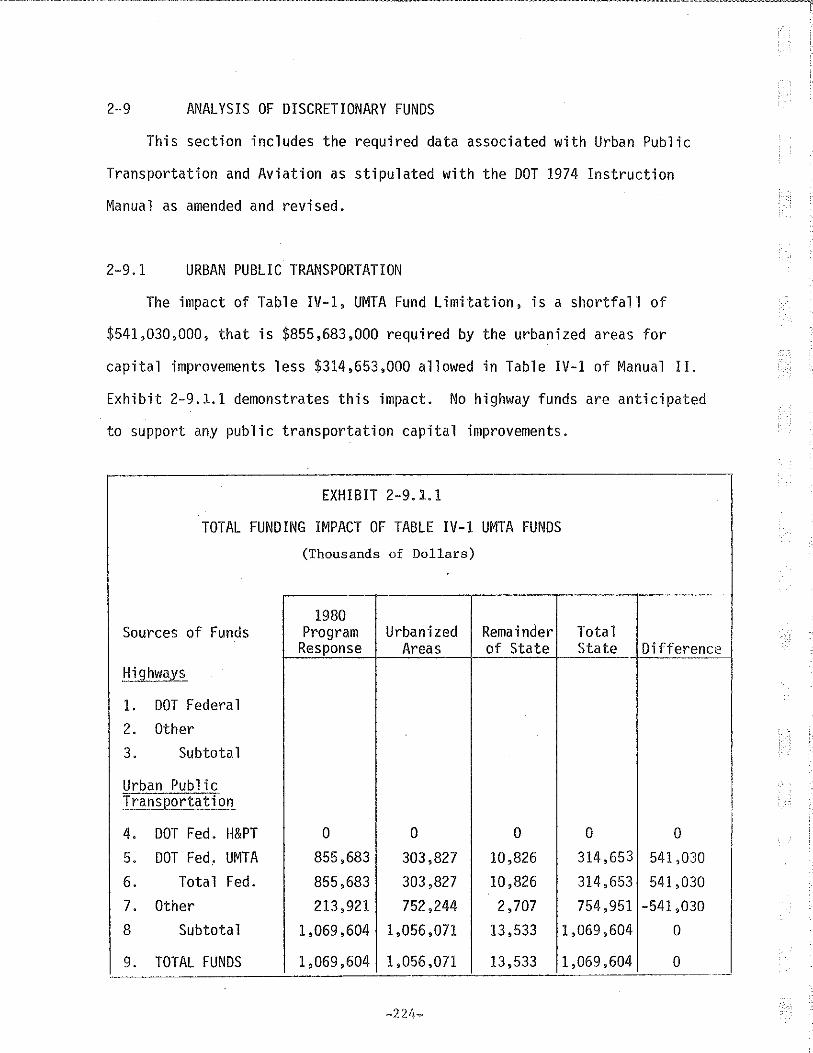
2-9 ANALYSIS OF DISCRETIONARY FUNDS
This section includes the required data associated with Urban Public
Transportation and Aviation as stipulated with the DOT 1974 Instruction
Manual as amended and revised.
2-9.1 URBAN PUBLIC TRANSPORTATION
The impact of Table IV-1, UMTA Fund Limitation, is a shortfall of
$541,030,000, that is $855,683,000 required by the urbanized areas for
capital improvements less $314,653,000 allowed in Table IV-1 of Manual II.
Exhibit 2-9.1.1 demonstrates this impact. No highway funds are anticipated
to support any public transportation capital improvements.
EXHIBIT 2-9.1.1
TOTAL FUNDING IMPACT OF TABLE IV-1 UMTA FUNDS
(Thousands of Dollars)
1980 Sources of Funds Program Urbanized Remainder Total
Response Areas of State State Difference
Highwa_ys
1. DOT Federal
2. Other
3. Subtotal
Urban Public I Tran3lortation
4. DOT Fed. H&PT 0 0 0 0 0
5. DOT Fed. UMTA 855,683 303,827 10,826 314,653 541,030
6. Total Fed. 855,683 303,827 10,826 314,653 541,030
7. Other 213,921 752,244 2,707 754,951 -541 ,030
8 Subtotal 1,069,604 1,056,071 13,533 1,069,604 0
9. TOTAL FUNDS 1,069,604 1,056,071 13,533 1,069,604 0 ---·-
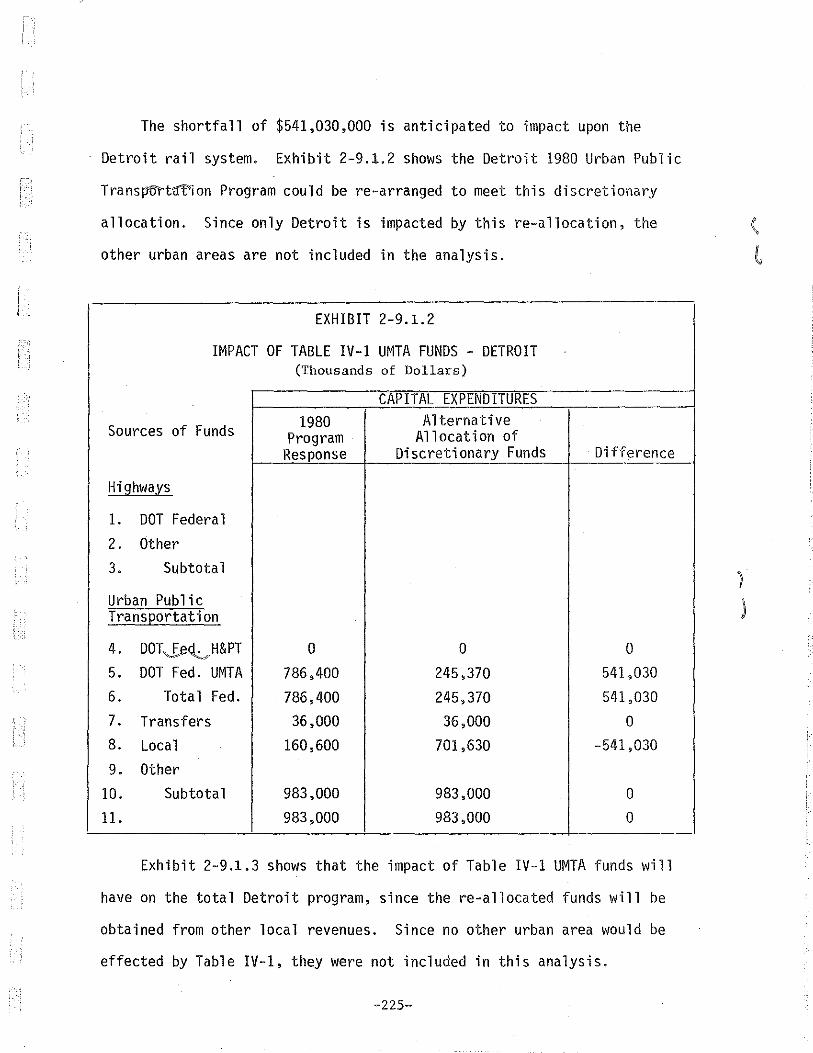
! ·'
The shortfall of $541,030,000 is anticipated to impact upon the
Detroit rail system. Exhibit 2-9.1.2 shows the Detroit 1980 Urban Public
Transj15rt1lt'ion Program caul d be re-arranged to meet this discretionary
allocation. Since only Detroit is impacted by this re-allocation, the
other urban areas are not included in the analysis.
EXHIBIT 2-9.1.2
IMPACT OF TABLE IV-1 UMTA FUNDS - DETROIT (Thousands of Dollars)
CAPITAL EXPENDITURES
Sources of Funds 1980 Alternative Program Allocation of
Response Discretionary Funds Difference
Highways
1. DOT Federal
2. Other 3. Subtotal
Urban Public Trans~ortation
4. DOTJ:,e<:L?H&PT 0 0 0 5. DOT Fed. UMTA 786,400 245,370 541,030
6. Total Fed. 786,400 245,370 541,030 7. Transfers 36,000 36,000 0 8. Local 160,600 701,630 -541,030 9. Other
10. Subtotal 983,000 983,000 0 11. 983,000 983,000 0
Exhibit 2-9.1.3 shows that the impact of Table IV-1 UMTA funds will
have on the total Detroit program, since the re-allocated funds will be
obtained from other local revenues. Since no other urban area would be
effected by Table IV-1, they were not included in this analysis.
--225-
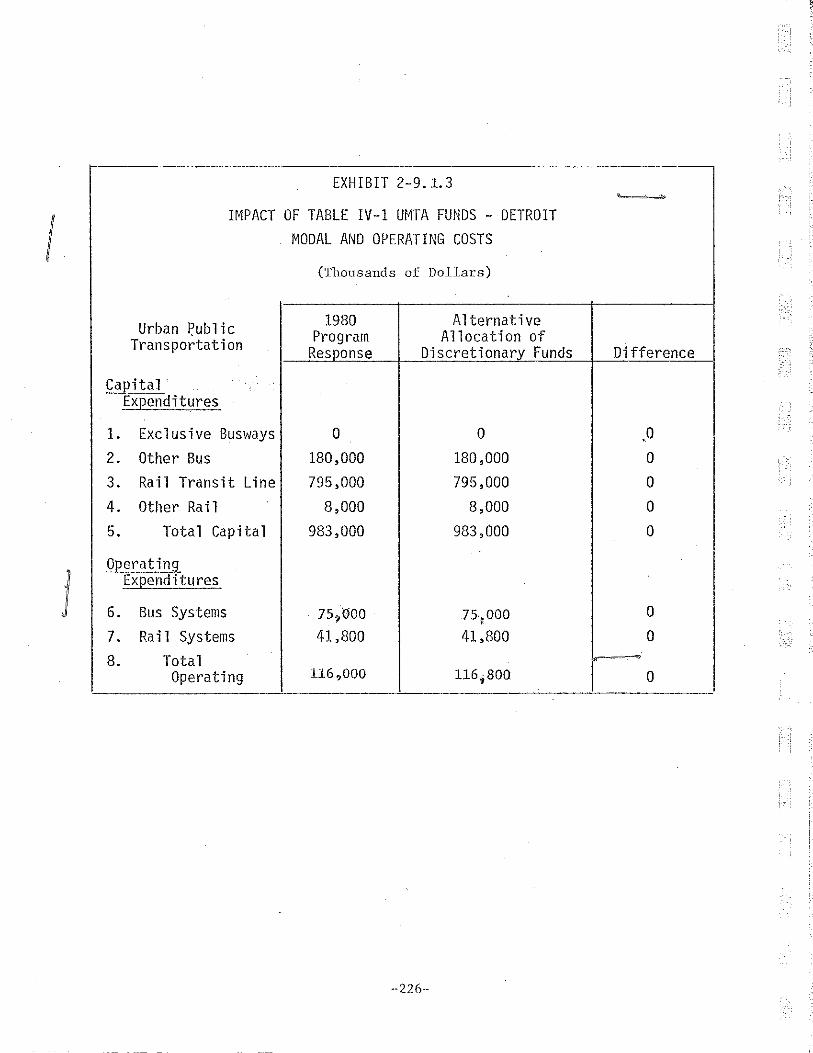
-- --EXHIBIT 2-9.1.3
I IMPACT OF TABLE IV-1 UMTA FUNDS - DETROIT
MODAL AND OPERATING COSTS
(Thousands of Dollars)
Urban ~ublic 1980 Alternative Program Allocation of Transportation Response D-iscretionary Funds Difference
~ita] Ex[Jenditures
1. Exclusive Busways 0 0 0 . 2. Other Bus 180,000 180,000 0 3. Rail Transit Line 795,000 795,000 0 4. Other Rail 8,000 8,000 0 5. Total Capital 983,000 983,000 0
j Operating
Ex[Jenditures
6. Bus Systems 75,000 751000 0
7. Rail Systems 41,800 41,800 0 8. Total -
Operating 116,000 116,;800 0
-226--

! · .. ;
2-9.2 AIRPORTS
Additional discretionary funds create a marked difference in the level of
development for the 1980 Program. This is indicated by a review of cost pro
jections, as per the MASP, for both the Short and Intermediate Range periods
in comparison to available revenues plus discretionary funds (Table 2-9.2.1).
With the addition of approximately $18 million, 100 Percent of the pro
posed air carrier and reliever airport development in the Short Range period
can be financed. Unfortunately, this is not the case with general aviation.
The addition of the total discretionary funds available for general aviation,
equals only 51 percent of general aviation costs in the Short Range period.
For the Intermediate Range period, an auditional $35.5 million in dis
cretionary funds would allow development of all projected air carrier and re
liever needs. The use of the total general aviation discretionary funds
available would satisfy only 41 percent of projected costs for the per-iod.
Identification of all air carrier facilities requiring $5 million or
more in additional discretionary funds is requested. For the 1980 Program,
based on the Short Range period, there are no facilities. in this category.
As noted earlier, an assumption was made that Detroit Metropolitan Airport
would be funded by other sources. Should this not prove to be the case,
it is likely that additional funds possibly exceeding $5 million would be
necessary.
-227-

EXHIBIT 2-9.2.1
TABLE FOR REPORTING USE OF ADDITIONAL AIRPORT DISCRETIONARY FUNDS
Capital Expenditures Alternative .Difference
Sources of Funds .1980 Allocation of Co 1 . ( 1) Program Discretionary minu(:~) Response Funds Co 1. 2
I Col. (1) (2) (3)
Air Carrier/Reliever Air~orts Millions of Adj. 1971 Dollars
1 DOT Federal 64.399 144.906 80.507
2 State 10.596 10.586 0
3 Local 60,097 60,097 0
4 Other 208.027 208.027 0
5 Total 343.119 423.622 80.507
General Aviation Air~orts
6 DOT Federal 8.495 17.320 8.825
7 State 3.701 3.701 0
8 Local 20.999 20.999 0
9 Other 1.610 1.610 0
10 Total 34.805 43.630 8.825
11 TOTAL AIRPORT FUNDS 377.924 467.252 89.332
-228-
2-10 RECOMMENDATIONS FOR ACTION
, The study participants appreciate the magnitude of a national multi
modal transportation study and believe the Department of Transportation should
be complimented on both preparation and coordination of the 1974 National
Transportation Study.
It is felt that more pre-testing by the Department of Transportation
should be undertaken in forms, methodology, availability of data and unifor
mity of data among states and metropolitan areas. We also feel that the in
structional material submitted to the participants in this study should be
edited and clarified in some cases. It is suggested that the next study be
timed so that after an opportunity for review of instructional material by
states, the Federal Department of Transportation should hold meetings with the
technicians conducting data collection and analysis in each state to ensure
understanding or requests and conversely have the Federal Department of Tran~.
portation personnel become aware of state and local viewpoints on this study.
These meetings should then be called periodically throughout the study so that
as problems arise, they can be addressed on a coordinated State-wide basis
with all parties involved present at such coordination meetings.
It may be worthwhile for the Department of Transportation to reconsider
focusing the 1976 NTS Study on the financial aspects or 1980 Program type
analyses with special emphasis on source-of-funds and levels-of-funds con
tingencies. It may also be reasonable to structure the next study and suc
ceeding studies such that core aspects of the study continue from one NTS
study through the next and that special analyses be scoped which can be
accomplished within reasonable time windows such that excessive schedule
modifications and slippages are avoided.
-229-
---------------------- ·-- -----~~
For the development of a comprehensive aviation plan and data bank, in
formation should be collected for non-hub air carrier facilities as was for
the larger hubs. Although the non-hubs represent a small portion of the total
operations and enplaned passengers. geographically they serve approximately
two-thirds of Michigan. It is felt that their existence and future expansion
is an important factor directly related to the economic growth of the areas
they serve.
Future studies should include additional analysis of third-level air car
rier service as this is the only air transportation available for certain areas
of Michigan. Data relating to area and population served plus investigation
of the financial problems encountered for this level of service should be
studied. Also, the practicality of subsidization of third-level air carrier
service should be a product of analysis of this data;
It is also recommended that if reasonableness, arguments and analyses
are required in future studies -- more internal to DOT -- effort should be
expended to insure that all participants adhere at least to fiscal projections
and limitations in a vigorous manner.
We would also recommend that further consideration be given to the de
velopment of a simpler, less time consuming method of applying price adjust
ment factors as a considerable amount of time was consumed in this exercise.
-230-