rtr telekom monitor annual review 2016 …...• the number of mobile call minutes rose by 6.0% from...
TRANSCRIPT

RTR
Tele
kom
Mon
itor |
Jah
resb
eric
ht 2
016
Rund
funk
und
Tel
ekom
Reg
ulie
rung
s-Gm
bH
RTR TELEKOM MONITOR
2016
Rundfunk und Telekom Regulierungs-GmbHMariahilfer Straße 77–79, 1060 Vienna, Austria T: +43 1 58058-0, F: +43 1 58058-9191, [email protected] www.rtr.at
ANNUAL REVIEW

RTR Telekom MonitorAnnual Review 2016

RTR Telekom Monitor | Annual Review 2016 | 2
ContentsPreface 5
1 Mobile communications 7
Mobile penetration 8
Retail revenues from mobile communications 9
Call minutes on the retail market 10
Text messages (SMS) 11
Data volume (retail market) 12
SIM cards in use 13
The average SIM card 14
Total mobile communications revenues 15
Porting of mobile telephone numbers 16
Market shares of mobile service providers in Austria 17
Price index in mobile communications 18
Tables 19
2 Broadband 23
Fixed and mobile broadband connections 24
Broadband penetration 25
Retail broadband connections by type of infrastructure 26
Retail broadband connections by bandwidth category – fixed network 27
Retail broadband connections by bundle category – fixed network 28
Revenues from retail broadband connections – fixed network 29
Wholesale broadband products of A1 Telekom Austria AG 30
Price index for broadband (hedonic) 31
RTR-NetTest: Median of download speed per technology 32
RTR-NetTest: Number of measurements per technology 33
RTR-NetTest: Number of measurements per Austrian province in 2016 34
Tables 35
3 Fixed network 43
Fixed lines 44
Fixed-line penetration 45
Carrier pre-selection and call-by-call usage 46
Retail revenues from access services 47
Retail revenues from carrier services 48
Call minutes on the retail market 49
Revenues per call minute 50
The average fixed line 51

RTR Telekom Monitor | Annual Review 2016 | 3
Wholesale market in minutes 52
Wholesale revenues 53
Geographical numbers in use 54
Service numbers in use 55
Tables 56
4 Leased lines 63
Number of retail leased lines in Austria 64
Number of national terminating segments (at the wholesale level) 65
Tables 66
5 Comparisons across sectors 71
Revenues from mobile, broadband, fixed and leased line services 72
Real minutes in fixed and mobile networks 73
6 Business indicators 75
Investments 76
Employees in the telecommunications sector 77
Tables 78
7 International comparisons 81
Mobile penetration rate 2014 to 2015 82
Interconnection charges for termination in mobile networks 83
Average retail roaming charges for calls within the EU/EEA 84
Average retail SMS roaming charges within the EU/EEA 85
Average retail data roaming charges within the EU/EEA (per megabyte) 86
Fixed broadband penetration 87
Mobile broadband penetration 88
Incumbent operator’s share of broadband market 89
Tables 90
8 Technology indicators 93
Computers, Internet access and broadband in households 94
Global Competitiveness Index 95
Gross domestic expenditure on R&D in absolute terms and as a proportion of GDP 96
Digital Economy and Society Index (1) 97
Digital Economy and Society Index (2) 98
9 Explanatory comments and glossary 101
Explanatory comments on the survey 102
Glossary 103


RTR Telekom Monitor | Annual Review 2016 | 5
PrefacePreface
Dear readers,
With the Annual Review 2016 of the RTR Telekom Monitor we again present an extended quarterly edition with the focus on year-on-year comparisons and two additional sections containing international comparisons and indices that show the performance of Austria in relation to other EU/EEA countries.
Continuing importance of mobile communicationsIt is no coincidence that the section on mobile communications comes first in the RTR Telekom Monitor. Also in 2016, the importance of mobile communications in Austria is undiminished: 87.7% of call minutes came from the mobile network, revenues from mobile communications accounted for some 64.5% of total revenues (EUR 4.028 billion) generated by the telecom sector. Mobile data volumes also continued to develop dynam-ically in 2016: Mobile upload and download data volumes climbed from about 300,000 terabytes in 2015 to more than 570,000 terabytes, which is an increase of 90%.
5G roll-out is important for Austria as ICT locationWhile 4G is truly gaining momentum (with the number of 4G SIM cards soaring by about 500% year on year), the development of the next generation of mobile communications – 5G – is the next item on the agenda. To be able to respond to this challenge a national tour de force and the pooling of forces would be necessary. The still incumbent federal government had accorded great importance to the expansion of 5G infrastructure and had stated in the government programme that it was intended to make Austria the pioneer in 5G worldwide.
Unfortunately, this development is now at risk of slowing down and suffering delays even though, especially with 5G roll-out, every month counts. The planned awards of frequencies for mobile communications cannot take place as long as the required legal changes have not been made. Availability of frequencies, however, is the very basis for 5G development. In December 2016, RTR published a preliminary schedule for the frequency awards in the RTR Spectrum Release Plan. Yet, it is essential that the necessary political decisions be taken.
New since 2016: RTR data available as open dataSince 2016, the data of the RTR Telekom Monitor – just as many other data collected by RTR – have also been available as open data. The open data offering is available at https://www.rtr.at/de/inf/RTROpenData and at the Open Government data portal data.gv.at.
Johannes Gungl
CEO Telecommunications and Postal ServicesAustrian Regulatory Authority for Broadcasting and Telecommunications (RTR)


| 7
1 Mobile communications
Mobile penetration 8
Retail revenues from mobile communications 9
Call minutes on the retail market 10
Text messages (SMS) 11
Data volume (retail market) 12
SIM cards in use 13
The average SIM card 14
Total mobile communications revenues 15
Porting of mobile telephone numbers 16
Market shares of mobile service providers in Austria 17
Price index in mobile communications 18
Tables 19

154.7 153.1 151.2 150.9 150.9 151.2 153.4 154.8 155.5 155.0162.6159.2
180
160
140
120
100
80
60
40
20
0
Q12014
Q22014
Q32014
Q42014
Q12015
Q22015
Q32015
Q22016
Q32016
Q42015
Q12016
Q42016
Pene
tratio
n ra
te (%
)
Mobile penetration (based on population)
RTR Telekom Monitor | Annual Review 2016 |1 8
The mobile penetration rate is calculated as the number of activated SIM cards divided by the country‘s population. This figure therefore represents the (notional) average number of SIM cards owned by every inhabitant. However, it also includes both SIM cards used by businesses and machine-to-machine (M2M) SIM cards.
• Altogether, the mobile penetration rate rose in the course of 2016, except for a minimal slump in Q2. At the end of 2015, it was 154.8%, one year later 162.6%. Thus, the number of active SIM cards increased more strongly than the country’s population in 2016.
Source for population figure: Statistics Austria
Mobile penetrationFurther increase in mobile penetration in 2016

154.7 153.1 151.2 150.9 150.9 151.2 153.4 154.8 155.5 155.0162.6159.2
180
160
140
120
100
80
60
40
20
0
Q12014
Q22014
Q32014
Q42014
Q12015
Q22015
Q32015
Q22016
Q32016
Q42015
Q12016
Q42016
Pene
tratio
n ra
te (%
)
Mobile penetration (based on population)
121
125
131
117
105
107
113
107
101
109
71 65
27 27 27
24 24 24 26 24 24 25
21
71 70 73 78
76 74 79 88 81 84 82
86
325
332 34
4
352
356 353 35
6
358
361
365
413
4 3
4 4 2 2
2 2 4 3 4
2085
417
5
700
600
500
400
300
200
100
0
Q12014
Q22014
Q32014
Q42014
Q12015
Q22015
Q32015
Q22016
Q32016
Q42015
Q12016
Q42016
Reve
nues
(EUR
mill
ions
)
Data services and value-added data services Bundled products and base feesVoice telephony Text messaging Other revenues
RTR Telekom Monitor | Annual Review 2016 |1 9
• In 2016, the mobile communications retail segment generated revenues of some EUR 2.346 billion. Against the year 2015, this is an increase of 2.7%.
• The major part of the revenues (66.4%) came from bundled products and base fees, amounting to EUR 1.557 billion. Thus, revenues from this category climbed by 9.4% against 2015.
• About EUR 346.0 million were earned from mere voice telephony, 19.8% less than in 2015. Revenues from voice telephony totalled 14.8% of total revenues.
• Data services generated revenues of some EUR 336.8 million (14.4% of total revenues), i.e. revenues from data services increased by 4.6% compared with the previous year.
• Text messages accounted for 3.8% of total revenues (EUR 90.3 million) and other revenues amounted to 0.7% of total revenues (EUR 16.3 million).
*These are not shown separately in the chart; however, their shares are listed in the table at the end of the section.
The chart above includes all revenues (base fees, activation charges, service charges, connection charges, etc.) earned from (own) retail customers in Austria, including revenues earned from roaming. In line with the amendment to the KEV, mobile services revenues were classified in 2012 as follows:
• Revenues clearly attributable to mobile voice telephony or value-added voice services;
• Revenues clearly attributable to text messaging and value-added text messaging services;
• Revenues clearly attributable to mobile data and value-added data services (including multimedia messages);
• Bundled products and base fees: revenues not clearly attributable to one of the aforementioned categories;
• Revenues from “bundled products and base fees“ accounted for by data services (excluding text messages)*;
• Other revenues, e.g. reminder charges.
Retail revenues from mobile communicationsSlight year-on-year revenue growth

5,44
9
5,46
1
5,33
5
5,57
0
5,40
7
5,31
9
4,90
7
5,22
0
5,18
6
5,03
3
5,03
8
5,33
9
6,000
5,000
4,000
3,000
2,000
1,000
0
Q12014
Q22014
Q32014
Q42014
Q12015
Q22015
Q32015
Q22016
Q32016
Q42015
Q12016
Q42016
Figu
res
in m
illio
ns
Real minutes (retail market)
RTR Telekom Monitor | Annual Review 2016 |1 10
• The number of mobile call minutes rose by 6.0% from Q3 to Q4 2016.
• Altogether however, in 2016, the number of call minutes decreased against the previous year. Mobile call minutes totalled some 20.596 billion, which is a decline of 1.2% against 2015, the general downward trend of recent years continuing.
The chart above shows the actual call minutes (technical measurement, see Glossary) on mobile networks. This includes minutes from voice telephony including value-added voice services, but not non-voice services, video telephony, etc.
Call minutes on the retail marketSlight year-on-year decline in number of call minutes

5,44
9
5,46
1
5,33
5
5,57
0
5,40
7
5,31
9
4,90
7
5,22
0
5,18
6
5,03
3
5,03
8
5,33
9
6,000
5,000
4,000
3,000
2,000
1,000
0
Q12014
Q22014
Q32014
Q42014
Q12015
Q22015
Q32015
Q22016
Q32016
Q42015
Q12016
Q42016
Figu
res
in m
illio
ns
Real minutes (retail market)
1,18
2
1,14
1
1,04
8
1,07
4
975
949
857
881
772
765
732
736
1,400
1,200
1,000
800
600
400
200
0
Q12014
Q22014
Q32014
Q42014
Q12015
Q22015
Q32015
Q22016
Q32016
Q42015
Q12016
Q42016
Figu
res
in m
illio
ns
Text messages sent (technical measurement)
RTR Telekom Monitor | Annual Review 2016 |1 11
• In Q4 2016, some 736.3 million text messages were sent, which is a slight gain of 0.7% against the previous quarter.
• Year on year, however, fewer text messages were sent than in the year before. In total, about 3.005 billion text messages were recorded, which is a drop of 17.9% compared with 2015. Thus, the downward trend of previ-ous years is seen to continue. This is mainly attributed to widespread use of data-based instant messaging services like WhatsApp or Facebook Messenger.
The chart above shows the number of text messages (technical measurement) sent in the respective quarters. For text messages, similar to call minutes, the term “technical measurement“ means that the figure also includes text messages that are not charged individually to the retail customer (e. g. text messages included in the base fee or flat rate). Multimedia messages are not included in these figures.
Text messages (SMS)Text messages declining year on year

35,3
80
36,9
50
42,3
90
51,2
30
59,0
80
64,8
30
76,2
00
99,2
40
109,
880
124,
490
142,
940
194,
170
250,000
200,000
150,000
100,000
50,000
0
Q12014
Q22014
Q32014
Q42014
Q12015
Q22015
Q32015
Q22016
Q32016
Q42016
Q12017
Q22017
Q42015
Q12016
Data
vol
ume
(tera
byte
s)
Retail upload/download volume
RTR Telekom Monitor | Annual Review 2016 |1 12
• The data volume used continues to grow unabatedly. In Q4 2016, 194,170 terabytes were used. Thus, data usage increased by 35.8% compared with the previous quarter.
• In 2016, some 571,480 terabytes of data were used in total, which constitutes an increase of 90.9% compared with 2015. Thus, the strong upward trend continued. The data volume used has been rising exponentially in recent years and is expected to increase on this scale also in the future.
The chart above shows the data volume used for uplink and downlink transmis-sions on the retail mobile communica-tions market in terabytes (1 terabyte = 1,024 gigabytes = 1,048,576 mega-bytes). These figures do not include text messages or multimedia messages. In addition, a simple exponential trend line illustrates how the data volume would develop if the trend persisted.
Data volume (retail market)Data usage in 2016 almost twice as high as in the year before

35,3
80
36,9
50
42,3
90
51,2
30
59,0
80
64,8
30
76,2
00
99,2
40
109,
880
124,
490
142,
940
194,
170
250,000
200,000
150,000
100,000
50,000
0
Q12014
Q22014
Q32014
Q42014
Q12015
Q22015
Q32015
Q22016
Q32016
Q42016
Q12017
Q22017
Q42015
Q12016
Data
vol
ume
(tera
byte
s)
Retail upload/download volume
2,45
0
2,35
0
2,10
0
2,03
0
1,97
0
1,95
0
1,95
0
1,95
0
1,94
0
1,93
0
1,87
0
1,78
0
10,6
80
10,6
50
10,7
40
10,7
60
10,8
20
10,8
10
10,8
90
10,5
00
10,3
80
7,65
0
6,47
0
6,41
0
60 70 110
160
190
280 440 1,01
0
1,25
0
3,98
0
5,62
0
6,08
0
16,000
14,000
12,000
10,000
8,000
6,000
4,000
2,000
0
Q12014
Q22014
Q32014
Q42014
Q12015
Q22015
Q32015
Q22016
Q32016
Q42015
Q12016
Q42016
Num
ber o
f SIM
car
ds (t
hous
ands
)
2G 3G 4G
RTR Telekom Monitor | Annual Review 2016 |1 13
• At the end of 2016, some 14.3 million SIM cards were in use, 5.9% more than in the reference period of 2015.
• In the course of 2016, many operators upgraded previous 3G cards to 4G and many new LTE tariffs were introduced, which is why the number of 4G cards rose substantially. While about 1.0 million 4G cards were in use at the end of 2015, this figure jumped to some 6.1 million at the end of 2016, which corre-sponds to an increase of 501.2%. At the same time, the number of 3G cards dropped from 10.5 million at the end of 2015 to 6.4 million (down 39.0%) at the end of 2016. 2G cards amounted to about 12.5% (1.8 million) of all SIM cards at the end of 2016, which is a decline in number by 9.1% against 2015.
• About 720,300 SIM cards were explicitly reported as M2M SIM cards at the end of 2016.
The chart above shows the number of SIM cards activated and in use, broken down into 2G (GSM), 3G (UMTS) and 4G (LTE) cards.
The breakdown of SIM cards into prepaid and postpaid customers can be found in the table at the end of the section.
SIM cards in useNumber of 3G and 4G cards almost even

2,57
5
2,83
0
3,21
1
3,58
0
4,75
8
21.8
19.0
18.8
17.5
17.2
14.2
14.1
14.4
14.2
13.8
129.
2
127.
4
123.
8
120.
4
124.
8
15
10
5
0
25
20
15
10
5
0
5,000
4,000
3,000
2,000
1,000
0
150
100
50
0
Q42016
Q22016
Q32016
Q42015
Q12016
Q42016
Q22016
Q32016
Q42015
Q12016
Q42016
Q22016
Q32016
Q42015
Q12016
Q42016
Q22016
Q32016
Q42015
Q12016
Text
mes
sage
s/m
onth
MB/
mon
th
EUR/
mon
th
Min
utes
/mon
th
Real minutes – per SIM card and month
Data volume – per SIM card and monthText messages (technical measurement) – per SIM card and month
Revenues – per SIM card and month
RTR Telekom Monitor | Annual Review 2016 |1 14
• In Q4 2016, average revenues of EUR 13.8 were generated per SIM card and month. Thus, on average 17.2 text messages were sent, outgoing calls corre-sponding to 124.8 call minutes were made and 4,758 megabytes of data volume were used.
• These figures reflect the general development of the usage patterns described on the previous pages. Accordingly, compared with Q4 2015, reve-nues (down 2.3%), the number of text messages sent (down 21.1%) as well as the number of outgoing call minutes (down 3.4%) dropped, while the average data volume used increased by 84.8%.
The charts show the average revenues generated (ARPU – Average Revenue per User), the average number of real minutes and text messages sent as well as the data volume used in megabytes per SIM card in an average month for each quarter. The values are therefore based on one-third of retail customer revenues, real minutes, number of text messages sent and data volumes of a quarter, divided by the total number of activated SIM cards (including mobile broadband cards and M2M SIM cards) at the end of a quarter. The revenues per SIM card depicted shall not be interpreted as prices. Information on the price developments can be found in the mobile communications price index at the end of the section.
The average SIM cardData usage on the rise, SMS, minutes and revenues decreasing

2,57
5
2,83
0
3,21
1
3,58
0
4,75
8
21.8
19.0
18.8
17.5
17.2
14.2
14.1
14.4
14.2
13.8
129.
2
127.
4
123.
8
120.
4
124.
8
15
10
5
0
25
20
15
10
5
0
5,000
4,000
3,000
2,000
1,000
0
150
100
50
0
Q42016
Q22016
Q32016
Q42015
Q12016
Q42016
Q22016
Q32016
Q42015
Q12016
Q42016
Q22016
Q32016
Q42015
Q12016
Q42016
Q22016
Q32016
Q42015
Q12016
Text
mes
sage
s/m
onth
MB/
mon
th
EUR/
mon
th
Min
utes
/mon
th
Real minutes – per SIM card and month
Data volume – per SIM card and monthText messages (technical measurement) – per SIM card and month
Revenues – per SIM card and month
547
560
583
573
561
565
586
572
575
584
596
591
62 58
59 56 55 58
61 59 63 61 68 60
700
600
500
400
300
200
100
0
Q12014
Q22014
Q32014
Q42014
Q12015
Q22015
Q32015
Q22016
Q32016
Q42015
Q12016
Q42016
Reve
nues
(EUR
mill
ions
)
Retail revenues Wholesale revenues
RTR Telekom Monitor | Annual Review 2016 |1 15
• Total revenues from the retail and wholesale segments of mobile commu-nications amounted to some EUR 2.599 billion in 2016. Thus, compared with 2015, an upswing in revenues of 3.3% was achieved.
• Both retail revenues (up 2.7 to EUR 2.346 billion) and wholesale revenues (up 8.7% to EUR 253.0 million) showed an increase year on year.
The chart above shows the revenues on the retail and wholesale markets. Retail revenues include all revenues (base fees, activation charges, service charges, connection charges, etc.) earned from (own) retail customers in Austria, including revenues earned from roaming. Wholesale revenues are revenues from origination and termina-tion charges, from selling airtime to resellers and revenues from national and international roaming (including MVNO access).
Total mobile communications revenuesSlight rise in annual revenues

69,9
30
58,1
30
27,4
70
40,3
70
53,1
50
48,8
90
39,4
10
51,5
90
55,4
60
47,6
50
53,3
00
68,6
40
80,000
70,000
60,000
50,000
40,000
30,000
20,000
10,000
0
Q12014
Q22014
Q32014
Q42014
Q12015
Q22015
Q32015
Q22016
Q32016
Q42015
Q12016
Q42016
Num
ber o
f por
ting
proc
edur
es
Porting procedures (mobile phone numbers)
RTR Telekom Monitor | Annual Review 2016 |1 16
Number porting allows customers to retain their telephone numbers when they switch service providers. The chart above shows the porting procedures/imports of telephone numbers carried out for an operator in one quarter, i.e. SIM cards in the case of mobile operators and subscriber numbers on the fixed network. Reverse portings (e.g. after cancellation by a subscriber) are not considered as porting procedure. If a subscriber number is ported several times within a quarter (“subsequent porting”), this is counted separately each time.
Porting of mobile telephone numbersNumber of porting procedures rises substantially towards the end of the year
• In Q4 2016, 68,640 mobile phone numbers were ported. Thus, the number of porting procedures was up 28.8% against Q3 2016.

69,9
30
58,1
30
27,4
70
40,3
70
53,1
50
48,8
90
39,4
10
51,5
90
55,4
60
47,6
50
53,3
00
68,6
40
80,000
70,000
60,000
50,000
40,000
30,000
20,000
10,000
0
Q12014
Q22014
Q32014
Q42014
Q12015
Q22015
Q32015
Q22016
Q32016
Q42015
Q12016
Q42016
Num
ber o
f por
ting
proc
edur
es
Porting procedures (mobile phone numbers)
5.3%
29.5% 38.4%
26.8%
Q4 2016
Hutchison Drei Austria GmbH
T-Mobile Austria GmbH
A1 Telekom Austria AG
Other mobile service providers
RTR Telekom Monitor | Annual Review 2016 |1 17
• In Q4 2016, A1 achieved a market share of 38.4% (5.5 million customers), T-Mobile held a market share of 29.5% (4.2 million customers), Hutchison reached a share of 26.8% (3.8 million customers).
• The category of “Other mobile services providers” comprises MVNOs and airtime resellers (see Glossary) that notified RTR of the provision of mobile communications services and hold the corresponding general authorisa-tion. With 746,200 customers, together they had a market share of 5.3% at
the end of 2016.
The chart above shows the market shares of mobile operators in Austria based on the number of their subscrib-ers (number of SIM cards used).
Market shares of mobile service providers in AustriaAlternative mobile service providers achieve a market share above 5%

160
140
120
100
80
60
40
20
0
Q12014
Q22014
Q32014
Q42014
Q12015
Q22015
Q32015
Q22016
Q32016
Q42016
Q42015
Q12016
Q12017
Inde
x po
ints
High User Power UserMedium UserLow UserIndex
Q1
Q2
Q3
Q4
Q1
Q2
Q3
Q4
Q1
Q2
Q3
Q4
Q1
Q2
Q3
Q4
2014
2015
2016
5,448,927,110
5,461,038,010
5,335,100,380
5,569,638,360
5,407,174,220
5,318,743,560
4,907,266,740
5,219,612,720
5,186,160,870
5,033,123,720
5,038,083,780
5,338,820,600
Real minutes
Call minutes on the retail market (page 10)
Q1
Q2
Q3
Q4
Q1
Q2
Q3
Q4
Q1
Q2
Q3
Q4
Q1
Q2
Q3
Q4
2016
2015
2014
Retail revenues from mobile communications (page 9)
Voice telephony
Text messaging
Data services and value-added data
servicesBundled products
and base fees
Share of data services in
bundled productsOther
revenues
120,631,990 26,777,090 70,131,480 325,475,670 16.2% 3,520,680
124,999,050 26,625,960 72,544,340 332,298,020 16.2% 3,494,430
130,688,350 26,727,090 78,453,030 343,834,580 16.2% 3,557,350
116,716,640 24,346,790 75,917,690 351,999,690 15.9% 4,303,150
104,690,740 23,686,570 74,416,240 355,881,760 24.7% 2,118,420
107,235,980 24,140,880 78,908,480 353,092,870 24.5% 2,080,240
113,186,230 26,074,580 87,742,710 356,376,090 24.7% 2,256,920
106,537,540 24,195,300 80,907,520 357,883,530 25.6% 2,132,310
101,068,020 24,350,800 84,142,680 360,946,810 25.5% 4,305,770
109,069,050 25,124,830 81,810,590 365,068,050 24.4% 2,998,780
71,206,320 21,035,560 85,508,600 413,451,210 29.4% 4,498,970
64,698,250 19,744,590 85,310,410 417,084,130 29.8% 4,511,750
EUR
Q1
Q2
Q3
Q4
Q1
Q2
Q3
Q4
Q1
Q2
Q3
Q4
Q1
Q2
Q3
Q4
2014
2015
2016
1,182,412,900
1,141,435,250
1,047,778,890
1,073,631,360
974,741,650
949,268,080
857,063,820
881,028,120
771,994,730
765,122,450
731,573,530
736,332,090
Text messages sent (technical measurement)
Text messages (page 11)
RTR Telekom Monitor | Annual Review 2016 |1 18
• In Q1 2017, the mobile communications price index remained almost unchanged – the overall index dropped by 0.7 percentage point.
• The tariff landscape, however, experienced some changes even though, in total, these had only little effects on the price level. Hutchison, UPC, Bob, Spusu and eety, for example, introduced new tariffs in Q1 2017. A1 lowered the prices for some postpaid tariffs but increased the SIM flat fee. In addi-tion, many providers changed the amount of data volume included in their tariffs, extending it for many tariffs.
• In terms of method, the following adjustments were made in Q1 2017: First, like every year, in January 2017, usage of the four user types was adjusted but as the index was linked accordingly, this usage adjustment does not have an impact on the calculated price level (see Glossary).
• Second, from Q1 2017 onwards, the tariffs of Media Markt Mobil, Saturn Mobil, Krone mobile, Kurier mobil, LIWEST and Rapid Mobil were taken into account in the mobile communications price index. As the prices per brand calculated in the mobile communications price index are weighted with the respective brand’s market share, however, the tariffs of the mobile operators without infrastructure, because of their comparatively low market shares, have less influence on the calculated price development than the tariffs of the mobile network operators A1, T-Mobile and Hutchison.
For the calculation of the average monthly prices the tariff data published monthly by the Austrian Chamber of Labour are used and average prices are derived for four different user types: three of these user types are so-called “smartphone users” who use both voice and text messaging services as well as data services. The fourth user type (the “low user”) exclusively uses voice and text messaging services. Up to five of the cheapest tariffs per brand are used (see Glossary). The calculation started in January 2011, the chart shows the development over the past three years.
In contrast to the other charts in the RTR Telekom Monitor, this chart does not show the price development on a quarterly but on a monthly basis. As data up to March 2017 are already available, they are also included in the chart.
Price index in mobile communicationsStable price level in mobile communications in Q1 2017

160
140
120
100
80
60
40
20
0
Q12014
Q22014
Q32014
Q42014
Q12015
Q22015
Q32015
Q22016
Q32016
Q42016
Q42015
Q12016
Q12017
Inde
x po
ints
High User Power UserMedium UserLow UserIndex Tables
Q1
Q2
Q3
Q4
Q1
Q2
Q3
Q4
Q1
Q2
Q3
Q4
Q1
Q2
Q3
Q4
2014
2015
2016
5,448,927,110
5,461,038,010
5,335,100,380
5,569,638,360
5,407,174,220
5,318,743,560
4,907,266,740
5,219,612,720
5,186,160,870
5,033,123,720
5,038,083,780
5,338,820,600
Real minutes
Call minutes on the retail market (page 10)
Q1
Q2
Q3
Q4
Q1
Q2
Q3
Q4
Q1
Q2
Q3
Q4
Q1
Q2
Q3
Q4
2016
2015
2014
Retail revenues from mobile communications (page 9)
Voice telephony
Text messaging
Data services and value-added data
servicesBundled products
and base fees
Share of data services in
bundled productsOther
revenues
120,631,990 26,777,090 70,131,480 325,475,670 16.2% 3,520,680
124,999,050 26,625,960 72,544,340 332,298,020 16.2% 3,494,430
130,688,350 26,727,090 78,453,030 343,834,580 16.2% 3,557,350
116,716,640 24,346,790 75,917,690 351,999,690 15.9% 4,303,150
104,690,740 23,686,570 74,416,240 355,881,760 24.7% 2,118,420
107,235,980 24,140,880 78,908,480 353,092,870 24.5% 2,080,240
113,186,230 26,074,580 87,742,710 356,376,090 24.7% 2,256,920
106,537,540 24,195,300 80,907,520 357,883,530 25.6% 2,132,310
101,068,020 24,350,800 84,142,680 360,946,810 25.5% 4,305,770
109,069,050 25,124,830 81,810,590 365,068,050 24.4% 2,998,780
71,206,320 21,035,560 85,508,600 413,451,210 29.4% 4,498,970
64,698,250 19,744,590 85,310,410 417,084,130 29.8% 4,511,750
EUR
Q1
Q2
Q3
Q4
Q1
Q2
Q3
Q4
Q1
Q2
Q3
Q4
Q1
Q2
Q3
Q4
2014
2015
2016
1,182,412,900
1,141,435,250
1,047,778,890
1,073,631,360
974,741,650
949,268,080
857,063,820
881,028,120
771,994,730
765,122,450
731,573,530
736,332,090
Text messages sent (technical measurement)
Text messages (page 11)
RTR Telekom Monitor | Annual Review 2016 |1 19

Q1
Q2
Q3
Q4
Q1
Q2
Q3
Q4
Q1
Q2
Q3
Q4
Q1
Q2
Q3
Q4
2014
2015
2016
2,447,320 10,680,630 58,290 139,390
2,354,060 10,648,920 70,130 142,560
2,099,580 10,743,490 108,690 145,990
2,033,290 10,757,350 161,970 149,470
1,969,370 10,818,050 190,020 153,080
1,953,260 10,806,400 275,590 154,490
1,947,260 10,891,530 438,870 155,150
1,954,290 10,504,620 1,011,720 156,580
1,938,690 10,379,100 1,250,420 154,910
1,925,000 7,650,280 3,975,890 167,560
1,865,250 6,470,290 5,618,540 475,630
1,776,220 6,405,400 6,082,160 720,320
2G 3G 4G thereof M2M SIM cards
SIM cards in use (page 13)Number
of SIM cards
Q1
Q2
Q3
Q4
Q1
Q2
Q3
Q4
Q1
Q2
Q3
Q4
Q1
Q2
Q3
Q4
2014
2015
2016
37,097,553,920
38,746,695,680
44,448,829,440
53,717,923,840
61,949,788,160
67,976,837,120
79,906,375,680
104,059,719,680
115,213,209,600
130,535,526,400
149,880,688,640
203,606,384,640
Retail upload/download volume (megabytes)
Data volume retail market (page 12)
Q1
Q2
Q3
Q4
Q1
Q2
Q3
Q4
Q1
Q2
Q3
Q4
Q1
Q2
Q3
Q4
2014
2015
2016
9,199,180 3,987,060
9,124,880 3,948,230
9,070,280 3,881,480
9,066,370 3,886,240
8,947,740 4,029,700
8,903,980 4,131,260
8,892,970 4,384,690
8,956,320 4,514,300
8,993,380 4,574,840
8,989,200 4,561,960
8,933,520 5,020,570
9,071,760 5,192,020
Postpaid Prepaid
Prepaid vs. postpaid SIM cards Number
of SIM cards
Q1
Q2
Q3
Q4
Q1
Q2
Q3
Q4
Q1
Q2
Q3
Q4
Q1
Q2
Q3
Q4
2014
2015
2016
69,930
58,130
27,470
40,370
53,150
48,890
39,410
51,590
55,460
47,650
53,300
68,640
Number of porting procedures / mobile phone numbers
Porting of mobile telephone numbers (page 16)
Q1
Q2
Q3
Q4
Q1
Q2
Q3
Q4
Q1
Q2
Q3
Q4
Q1
Q2
Q3
Q4
2014
2015
2016
546,536,910 61,886,600 608,423,510
559,961,800 57,524,000 617,485,800
583,260,400 58,512,900 641,773,300
573,283,960 56,456,900 629,740,860
560,793,730 54,809,900 615,603,630
565,458,450 58,293,300 623,751,750
585,636,530 61,063,200 646,699,730
571,656,200 58,580,900 630,237,100
574,814,080 63,073,300 637,887,380
584,071,300 61,257,900 645,329,200
595,700,660 68,238,300 663,938,960
591,349,130 60,383,600 651,732,730
Retail revenues Wholesale revenues Total
Total mobile communications revenues (page 15)
EUR
RTR Telekom Monitor | Annual Review 2016 |1 20

Q1
Q2
Q3
Q4
Q1
Q2
Q3
Q4
Q1
Q2
Q3
Q4
Q1
Q2
Q3
Q4
2014
2015
2016
2,447,320 10,680,630 58,290 139,390
2,354,060 10,648,920 70,130 142,560
2,099,580 10,743,490 108,690 145,990
2,033,290 10,757,350 161,970 149,470
1,969,370 10,818,050 190,020 153,080
1,953,260 10,806,400 275,590 154,490
1,947,260 10,891,530 438,870 155,150
1,954,290 10,504,620 1,011,720 156,580
1,938,690 10,379,100 1,250,420 154,910
1,925,000 7,650,280 3,975,890 167,560
1,865,250 6,470,290 5,618,540 475,630
1,776,220 6,405,400 6,082,160 720,320
2G 3G 4G thereof M2M SIM cards
SIM cards in use (page 13)Number
of SIM cards
Q1
Q2
Q3
Q4
Q1
Q2
Q3
Q4
Q1
Q2
Q3
Q4
Q1
Q2
Q3
Q4
2014
2015
2016
37,097,553,920
38,746,695,680
44,448,829,440
53,717,923,840
61,949,788,160
67,976,837,120
79,906,375,680
104,059,719,680
115,213,209,600
130,535,526,400
149,880,688,640
203,606,384,640
Retail upload/download volume (megabytes)
Data volume retail market (page 12)
Q1
Q2
Q3
Q4
Q1
Q2
Q3
Q4
Q1
Q2
Q3
Q4
Q1
Q2
Q3
Q4
2014
2015
2016
9,199,180 3,987,060
9,124,880 3,948,230
9,070,280 3,881,480
9,066,370 3,886,240
8,947,740 4,029,700
8,903,980 4,131,260
8,892,970 4,384,690
8,956,320 4,514,300
8,993,380 4,574,840
8,989,200 4,561,960
8,933,520 5,020,570
9,071,760 5,192,020
Postpaid Prepaid
Prepaid vs. postpaid SIM cards Number
of SIM cards
Q1
Q2
Q3
Q4
Q1
Q2
Q3
Q4
Q1
Q2
Q3
Q4
Q1
Q2
Q3
Q4
2014
2015
2016
69,930
58,130
27,470
40,370
53,150
48,890
39,410
51,590
55,460
47,650
53,300
68,640
Number of porting procedures / mobile phone numbers
Porting of mobile telephone numbers (page 16)
Q1
Q2
Q3
Q4
Q1
Q2
Q3
Q4
Q1
Q2
Q3
Q4
Q1
Q2
Q3
Q4
2014
2015
2016
546,536,910 61,886,600 608,423,510
559,961,800 57,524,000 617,485,800
583,260,400 58,512,900 641,773,300
573,283,960 56,456,900 629,740,860
560,793,730 54,809,900 615,603,630
565,458,450 58,293,300 623,751,750
585,636,530 61,063,200 646,699,730
571,656,200 58,580,900 630,237,100
574,814,080 63,073,300 637,887,380
584,071,300 61,257,900 645,329,200
595,700,660 68,238,300 663,938,960
591,349,130 60,383,600 651,732,730
Retail revenues Wholesale revenues Total
Total mobile communications revenues (page 15)
EUR
RTR Telekom Monitor | Annual Review 2016 |1 21


| 23
2 Broadband
Fixed and mobile broadband connections 24
Broadband penetration 25
Retail broadband connections by type of infrastructure 26
Retail broadband connections by bandwidth category – fixed network 27
Retail broadband connections by bundle category – fixed network 28
Revenues from retail broadband connections – fixed network 29
Wholesale broadband products of A1 Telekom Austria AG 30
Price index for broadband (hedonic) 31
RTR-NetTest: Median of download speed per technology 32
RTR-NetTest: Number of measurements per technology 33
RTR-NetTest: Number of Measurements per Austrian province in 2016 34
Tables 35

2,26
6
2,28
2
2,31
1
2,35
3
2,38
3
2,39
9
2,42
0
2,45
6
2,47
9
2,48
8
2,49
3
2,52
3
2,19
1
2,15
1
2,19
7
2,19
4
2,14
7
2,13
2
2,15
7
2,20
3
2,41
7
2,46
2
2,79
5
2,92
4
3,35
4
3,42
4
3,47
9
3,56
0
3,55
4
3,61
8
3,78
3
3,82
9
4,22
3
4,28
2
4,33
9
4,66
1
Q12014
Q22014
Q32014
Q42014
Q12015
Q22015
Q32015
Q22016
Q32016
Q42015
Q12016
Q42016
12,000
10,000
8,000
6,000
4,000
2,000
0
Smartphone tariffsFixed broadband Mobile broadband (data tariffs and prepaid cards)
Conn
ectio
ns (t
hous
ands
)
RTR Telekom Monitor | Annual Review 2016 |2 24
• For the first time, the 10 million mark for broadband connections was topped in Austria. At the end of 2016, 10.1 million broadband connections were recorded, 19.1% more than at the end of 2015.
• In the reference period, fixed broadband connections grew by 2.8% to 2.5 million, data and prepaid tariffs by 32.7% to 2.9 million and smartphone tariffs by 21.7% to 4.7 million connections.
• At the end of 2016, smartphone tariffs accounted for about 46.1% of all broadband connections, 28.9% were attributable to data and prepaid tariffs and the remaining 25.0% to fixed broadband connections.
The chart above shows the total number of fixed and mobile broadband connec-tions. With mobile broadband, mobile data tariffs and smartphone tariffs are distinguished. For the definitions of fixed broadband connections as well as mobile data tariffs and smartphone tariffs see Glossary.
Fixed and mobile broadband connectionsSignificant growth in data and prepaid tariffs as well as in smartphone tariffs

2,26
6
2,28
2
2,31
1
2,35
3
2,38
3
2,39
9
2,42
0
2,45
6
2,47
9
2,48
8
2,49
3
2,52
3
2,19
1
2,15
1
2,19
7
2,19
4
2,14
7
2,13
2
2,15
7
2,20
3
2,41
7
2,46
2
2,79
5
2,92
4
3,35
4
3,42
4
3,47
9
3,56
0
3,55
4
3,61
8
3,78
3
3,82
9
4,22
3
4,28
2
4,33
9
4,66
1
Q12014
Q22014
Q32014
Q42014
Q12015
Q22015
Q32015
Q22016
Q32016
Q42015
Q12016
Q42016
12,000
10,000
8,000
6,000
4,000
2,000
0
Smartphone tariffsFixed broadband Mobile broadband (data tariffs and prepaid cards)
Conn
ectio
ns (t
hous
ands
)
88.3 90.0 91.1 92.6 92.3 93.797.6 97.9
107.7 109.0
118.2
110.1
59.6 60.0 60.5 61.2 61.9 62.2 62.4 62.8 63.2 63.3
63.3 64.057.6 56.5 57.5 57.0 55.7 55.2 56.355.6
61.6 62.7
70.9 74.2
Q12014
Q22014
Q32014
Q42014
Q12015
Q22015
Q32015
Q22016
Q32016
Q42015
Q12016
Q42016
140
120
100
80
60
40
20
0
Smartphone tariffs Mobile broadband (data tariffs and prepaid cards) Fixed broadband
Pene
tratio
n ra
te a
s a
perc
enta
ge o
f hou
seho
lds
RTR Telekom Monitor | Annual Review 2016 |2 25
• Smartphone penetration in Austrian households is increasing further. While there were still more households than smartphone tariffs at the end of 2015, this trend reversed from the beginning of 2016 onwards. Meanwhile, statistically speaking, every household uses more than one smartphone tariff (penetration rate of 118.2% in Q4 2016).
• Mobile broadband penetration also rose substantially within one year. While it was still at 56.3% at the end of Q4 2015, it grew to 74.2% in Q4 2016.
• In contrast, little change was seen for fixed broadband penetration in Austrian households. Here, the rate was 64.0% in Q4 2016 (compared with 62.8% at the end of 2015).
Broadband penetration refers to the ratio of fixed and mobile broadband connections to the total number of households in Austria. Calculation of the penetration rate also includes broadband connections used in businesses.
Source for number of households: Statistics Austria
Broadband penetrationSignificant growth rates for smartphone tariffs and mobile broadband

Q12014
Q22014
Q32014
Q42014
Q12015
Q22015
Q32015
Q22016
Q32016
Q42015
Q12016
Q42016
5,000
4,500
4,000
3,500
3,000
2,500
2,000
1,500
1,000
500
0
Smartphone tariffsCoaxial cable
Mobile broadbandUnbundled lines (incl. virtual unbundling)
Copper-wire pairsOther infrastructure (FWA, FTTH etc.)
Conn
ectio
ns (t
hous
ands
)
RTR Telekom Monitor | Annual Review 2016 |2 26
• Within one year, smartphone tariffs went up by 21.7% (to 4.7 million connec-tions), mobile broadband connections grew by 32.7% (to 2.9 million connec-tions).
• Fixed broadband connections developed far less dramatically. Between the end of 2015 and the end of 2016, copper-wire pairs rose by 2.0% (to 1.5 million connections), unbundled lines dropped by 7.2% to 124,600. In contrast, connections implemented by means of virtual unbundling more than doubled, climbing by 103.1% to 13,200 connections.
• Cable broadband connections saw growth of 4.0% to 819,500 at the end of 2016 against the end of 2015.
• Substantial gains were recorded by FWA connections (up 72.9% to 28,700), FTTH connections amounted to some 40,900 connections (up 1.5%) at the end of 2016. Other broadband connections that are not attributable to one of the afore-mentioned technologies (e.g. SAT) are increasingly losing signif-icance, amounting to only about 500 connections (down 82.1%) at the end of 2016.
The chart above shows the total number of fixed and mobile broadband connec-tions in Austria by infrastructure used. For the infrastructure of fixed broadband connections see Glossary. The data underlying this chart and the number of connections realised by means of virtual unbundling are contained in the table at the end of the section.
Retail broadband connections by type of infrastructureMobile broadband outruns fixed broadband

Q12014
Q22014
Q32014
Q42014
Q12015
Q22015
Q32015
Q22016
Q32016
Q42015
Q12016
Q42016
5,000
4,500
4,000
3,500
3,000
2,500
2,000
1,500
1,000
500
0
Smartphone tariffsCoaxial cable
Mobile broadbandUnbundled lines (incl. virtual unbundling)
Copper-wire pairsOther infrastructure (FWA, FTTH etc.)
Conn
ectio
ns (t
hous
ands
)
697
726
744
769
794
834
833
821
827
82171
5
704
1,00
5
1,00
7
1,00
7
993
983
963
944
932
923
9371,00
2
1,00
0
336
410
428
439
452
478
525
562
575
602
378
357
228
221
216
210
204
198
191
181
177
173
168
163
Q12014
Q22014
Q32014
Q42014
Q12015
Q22015
Q32015
Q22016
Q32016
Q42015
Q12016
Q42016
3,000
2,500
2,000
1,500
1,000
500
0
≥ 10 Mbit/s to < 30 Mbit/s> 2 Mbit/s to < 10 Mbit/s≥ 144 kbit/s to ≤ 2 Mbit/s ≥ 30 Mbit/s
Conn
ectio
ns (t
hous
ands
)
RTR Telekom Monitor | Annual Review 2016 |2 27
• The majority of fixed broadband connections (37.1%) have bandwidths from 2 Mbit/s to 10 Mbit/s. At the end of 2016, they totalled 937.000 connections, which is 2.7% less than at the end of 2015. Below a bandwidth of 2 Mbit/s the decline was in fact 9.8% (163,000 connections).
• There is a trend towards higher bandwidths; however, from 2015 to 2016, fixed broadband connections with bandwidths of 10 to 30 Mbit/s retreated (by 1.6% to 821,000 connections).
• In contrast, broadband connections with bandwidths above 30 Mbit/s reported significant gains. About 602,300 connections in Q4 2016 consti-tute a solid increase of 26.1% against Q4 2015. Thus, connections in this bandwidth category meanwhile account for nearly one quarter (23.9% in Q4 2016) of all fixed broadband connections in Austria.
• In total, the number of all fixed broadband connections, regardless of the bandwidth, rose by 2.8% to 2.5 million compared with Q4 2015.
The chart above shows the total number of fixed broadband connections in Austria, broken down by bandwidth categories. Because of the small number of cases, categories with low bandwidths (≥ 144 kbit/s to < 2 Mbit/s and = 2 Mbit/s) and categories with high bandwidths (30 Mbit/s to < 100 Mbit/s and ≥ 100 Mbit/s) were combined. The categories in between (> 2 Mbit/s to < 10 Mbit/s and 10 Mbit/s to < 30 Mbit/s) are unchanged. All categories are shown separately in the table at the end of the section.
Retail broadband connections by bandwidth category – fixed networkHigh bandwidths are rising sharply

473
482
509
536
559
561
565
579
582
582
589
607
1,07
3
1,06
5
1,06
3
1,06
8
1,07
9
1,08
3
1,08
7
1,09
3
1,10
4
1,10
8
1,06
6
1,07
2
520 53
3
535
540
544
556
559
561
563
563
528
525
119
125 14
4
151
156
159 165
169
172
175
181
131
41 39
36 34 33 31 31 30 28 26 21
37
Q12014
Q22014
Q32014
Q42014
Q12015
Q22015
Q32015
Q22016
Q32016
Q42015
Q12016
Q42016
3,000
2,500
2,000
1,500
1,000
500
0
Broadband + fixed-line telephonyOther bundles with fixed-line telephony, TV or mobile broadband
Stand-alone broadbandBroadband + TV
Broadband + fixed-line telephony + TV
Conn
ectio
ns (t
hous
ands
)
RTR Telekom Monitor | Annual Review 2016 |2 28
• The number of stand-alone broadband connections went up by 4.8% to 606,600 in the course of the year and accounted for about 24.5% of all possible broadband combinations at the end of 2016.
• At the end of 2016, 44.7% of products bundled with broadband were attri-butable to the combination of broadband and fixed-line telephony. Thus, this combination amounted to some 1.1 million connections in Austria, which is an increase of 2.3% against the end of 2015.
• The typical bundle combining broadband, fixed-line telephony and TV came to 563,000 connections (up 1.2%). Broadband and TV without fixed-line telephony rose by 10.0% to 181,200 connections, thus reaching a share of 7.3%.
• Other products bundled with broadband accounted for only 0.8% at the end of 2016 and increasingly lost significance (down 32.0% to 21,000 connections).
The chart shows the number of broadband products sold to retail customers, using own infrastructure or an unbundled line but not using additionally purchased infrastructure. Broadband products may be sold without any other product (stand-alone) or can be a combination of broadband with one or more other products (bundled product), for example, broadband and fixed network and/or TV.
Retail broadband connections by bundle category – fixed networkSteady upward trend for almost all broadband bundled products

473
482
509
536
559
561
565
579
582
582
589
607
1,07
3
1,06
5
1,06
3
1,06
8
1,07
9
1,08
3
1,08
7
1,09
3
1,10
4
1,10
8
1,06
6
1,07
2
520 53
3
535
540
544
556
559
561
563
563
528
525
119
125 14
4
151
156
159 165
169
172
175
181
131
41 39
36 34 33 31 31 30 28 26 21
37
Q12014
Q22014
Q32014
Q42014
Q12015
Q22015
Q32015
Q22016
Q32016
Q42015
Q12016
Q42016
3,000
2,500
2,000
1,500
1,000
500
0
Broadband + fixed-line telephonyOther bundles with fixed-line telephony, TV or mobile broadband
Stand-alone broadbandBroadband + TV
Broadband + fixed-line telephony + TV
Conn
ectio
ns (t
hous
ands
)
15,1
00
15,7
00
16,3
00
16,5
00
16,7
00
16,9
00
16,9
00
10,9
00
13,4
00
14,4
00
12,8
00
11,9
00 2,30
0
2,20
0
1,70
0
1,60
0
1,50
0
1,40
0
1,20
0
2,70
0
2,90
0
2,40
0
2,50
0
2,60
0
50,5
00
49,7
00
52,3
00
52,8
00
54,1
00
55,1
00
55,7
00
56,8
00
56,7
00
57,6
00
56,4
00
58,2
00
78,8
00
77,1
00
77,3
00
77,5
00
78,6
00
77,5
00
78,2
00
79,3
00
80,9
00
81,9
00
82,7
00
83,4
00
51,0
00
51,5
00
51,2
00
51,7
00
52,3
00
52,8
00
53,9
00
54,5
00
54,3
00
53,5
00
51,4
00
51,1
00
Q12014
Q22014
Q32014
Q42014
Q12015
Q22015
Q32015
Q22016
Q32016
Q42016
Q42015
Q12016
250,000
200,000
150,000
100,000
50,000
0
Broadband + fixed-line telephonyOther bundles with fixed-line telephony, TV or mobile broadband
Stand-alone broadbandBroadband + TV
Broadband + fixed-line telephony + TV
Reve
nues
(EUR
thou
sand
s)
RTR Telekom Monitor | Annual Review 2016 |2 29
• In 2016, bundled products generated revenues of some EUR 846.6 million, which is an increase of 4.2% compared with the previous year.
• The product combining broadband and fixed-line telephony generated the highest revenues in 2016, contributing EUR 328.8 million to total revenues (up 5.3%). EUR 228.8 million were generated by stand-alone broadband (up 3.2%), EUR 216.3 million were earned by the combination of broadband, fixed-line telephony and TV (up 4.0%).
• Revenues from the bundle combination of broadband and TV grew by 8.8% (about EUR 67.0 million).
The chart shows the revenues from broadband connections sold to retail customers using own infrastructure or an unbundled line. This includes broadband stand-alone products and bundled products where broadband is offered in combination with another product (voice telephony and/or TV and/or other products).
Revenues from retail broadband connections – fixed networkMore connections – more revenues

246,
700
245,
200
241,
900
239,
300
236,
200
233,
400
230,
400
227,
400
223,
500
218,
100
214,
000
210,
300
161,
800
157,
800
157,
400
152,
300
148,
500
144,
000
139,
100
134,
200
137,
700
133,
000
129,
900
124,
600
39,5
00
39,3
00
38,8
00
38,6
00
38,0
00
38,0
00
38,0
00
37,8
00
37,5
00
37,5
00
37,3
00
37,2
00
Q12014
Q22014
Q32014
Q42014
Q12015
Q22015
Q32015
Q22016
Q32016
Q42015
Q12016
Q42016
300,000
250,000
200,000
150,000
100,000
50,000
0
thereof unbundled broadband lines according to KEV dataUnbundled lines of A1 Bitstream connections
Num
ber o
f lin
es
RTR Telekom Monitor | Annual Review 2016 |2 30
• Unbundled lines in the network of A1 (not only broadband connections) reported last numbered 210,300, which is down 7.5% against the end of 2015.
• Unbundled broadband lines of these amounted to 124,600 connections (down 7.2% compared with the end of 2015).
• Bitstream connections offered by A1 on the wholesale market constituted some 37,200 lines at the end of 2016. Compared with the end of the previous year, this is a drop of 1.6%.
The chart above shows all unbundled lines in the network of A1 Telekom Austria AG and the unbundled broad-band lines thereof that are used by the operators according to the KEV sample. This means that all lines unbundled by A1 (supply-side) are depicted in comparison to the broadband lines unbundled by the other operators (demand-side) according to the KEV. The difference between the two bars relates to those unbundled lines that are exclusively used for voice or for leased lines and are therefore not attributable to broadband. In addition, all bitstream connections offered by A1 on the wholesale market are shown.
Wholesale broadband products of A1 Telekom Austria AGDecline in wholesale products of A1

246,
700
245,
200
241,
900
239,
300
236,
200
233,
400
230,
400
227,
400
223,
500
218,
100
214,
000
210,
300
161,
800
157,
800
157,
400
152,
300
148,
500
144,
000
139,
100
134,
200
137,
700
133,
000
129,
900
124,
600
39,5
00
39,3
00
38,8
00
38,6
00
38,0
00
38,0
00
38,0
00
37,8
00
37,5
00
37,5
00
37,3
00
37,2
00
Q12014
Q22014
Q32014
Q42014
Q12015
Q22015
Q32015
Q22016
Q32016
Q42015
Q12016
Q42016
300,000
250,000
200,000
150,000
100,000
50,000
0
thereof unbundled broadband lines according to KEV dataUnbundled lines of A1 Bitstream connections
Num
ber o
f lin
es
March2017
Dec.2016
Sept.2016
June 2016
March2016
Dec.2015
Sept.2015
June2015
March2015
Dec.2014
Sept.2014
June 2014
March2014
120
100
80
60
40
20
0
Fixed broadband Fixed and mobile broadbandMobile broadband
Inde
x po
ints
RTR Telekom Monitor | Annual Review 2016 |2 31
• The index for mobile and fixed-line broadband rose in Q1 2017 compared with the previous quarter, the hedonic price index climbed from 86.1 to 90.2 index points.
• In the fixed-network sector, the index increased mainly due to A1 raising its fees, which was not fully compensated by concurrent bandwidth increases.
• In contrast, in the case of mobile broadband, the index declined further due to special offers of A1.
The broadband index is a hedonic price index for fixed and mobile broadband products. Hedonic means that both price changes and changes in the product characteristics (in particular download rate and download volume) are taken into account. For this purpose, a regression of prices on product characteristics and on time variables is performed.
For the calculation, tariffs and product characteristics of the broadband products of the major suppliers
(currently A1, UPC, Tele2, LIWEST, Salzburg AG, Kabelplus, Russmedia IT, T-Mobile, Hutchison, HoT) are collected quarterly. All tariffs available to new customers at the respective time are collected. Both mere stand-alone broadband products and products bundled with fixed-line telephony or TV are captured. In the case of mobile broadband, prepaid tariffs are not included. In addition to monthly charges, also one-off charges and annual charges as well as special offers are taken into account. The most expensive 10% of
tariffs (currently tariffs exceeding EUR 65) are not included in the calculation, as they can be assumed to be in low demand by customers. The remaining tariffs are weighted in proportion to the operators’ market shares in the respective quarter. In the calculation all tariffs of an operator are given the same weights in a quarter. The reference basis is 2010.
As data up to March 2017 are already available, they are also included in the chart.
Price index for broadband (hedonic)Overall index rises from December until March

7.4
7.7
9.2
10.4
11.1
12.0
12.6
13.7
14.7
14.5
15.0
15.1
5.7
5.4
5.0
5.7
6.9
7.8
7.7
9.1
9.0
9.4
9.3
9.4
37.5
45.8
42.0
42.8
41.0
43.2
40.7
44.4
40.1
39.9
37.0
32.0
Q22014
Q32014
Q42014
Q12015
Q22015
Q32015
Q22016
Q32016
Q42016
Q42015
Q12016
Q12017
50
45
40
35
30
25
20
15
10
5
0
3G(W)LAN 4G
Mbi
t/s
RTR Telekom Monitor | Annual Review 2016 |2 32
• The median of download speed for LTE fell at the beginning of 2017 (from 37 to 32 Mbit/s), thus following the trend of declining download speeds seen to emerge in the 4G network in 2016.
• The median for the 3G network rose slightly from 9.3 to 9.4 Mbit/s, that for LAN and WLAN connections from 15.0 to 15.1 Mbit/s.
The RTR-NetTest allows users to test the speed and quality of their Internet connection reliably and independently of their provider. In addition, it is possible to compare the measurement results with the average values of other users. The speed of an Internet connection is expressed in megabits per second (Mbit/s) and thus indicates the data volume transmitted in one second. Among other things, the speed depends on the technology used. 2G (GPRS, EDGE), 3G (UMTS, HSPA), 4G (LTE) as well as connections using different technologies that are set up via LAN or WLAN are distinguished. The chart shows the median per technology and quarter, i.e. the observed value that lies exactly in middle of all these values. Due to the low data rates the medians of 2G data connections are not shown in the chart.
The data underlying this chart can be found in the table at the end of the section.
Source: RTR-NetTest
RTR-NetTest: Median of download speed per technologyMore measurements in the LTE network, median of download speed is lower

7.4
7.7
9.2
10.4
11.1
12.0
12.6
13.7
14.7
14.5
15.0
15.1
5.7
5.4
5.0
5.7
6.9
7.8
7.7
9.1
9.0
9.4
9.3
9.4
37.5
45.8
42.0
42.8
41.0
43.2
40.7
44.4
40.1
39.9
37.0
32.0
Q22014
Q32014
Q42014
Q12015
Q22015
Q32015
Q22016
Q32016
Q42016
Q42015
Q12016
Q12017
50
45
40
35
30
25
20
15
10
5
0
3G(W)LAN 4G
Mbi
t/s
69,6
00
52,8
00
63,9
00
98,9
00
134,
900
1,50
0
1,30
0
1,20
0
1,20
0
1,50
0
15,6
00
12,4
00
10,5
00
9,60
0
9,60
0
26,5
00
26,0
00
35,0
00
48,2
00
52,3
00
Q22016
Q42016
Q32016
Q12016
Q12017
160,000
140,000
120,000
100,000
80,000
60,000
40,000
20,000
0
3G2G(W)LAN 4G
Num
ber o
f mea
sure
men
ts
RTR Telekom Monitor | Annual Review 2016 |2 33
• The number of recorded measurements again increased. With 157,900 measurements at the end of 2016, this figure rose to 198,300 measurements in Q1 2017, which is a gain of 25.6%.
• The most significant increase was seen for LANs and WLANs (up 36.4% to 134,900).
• Measurements in the LTE network climbed from 48,200 to 52,300 (up 8.5%).
• 3G measurements remained unchanged. With 1,500 measurements, 2G measurements played only a minor role.
Using the RTR-NetTest users can perform measurements under real conditions and compare their test results with those of other users.
At the beginning of 2016, there was a change regarding the measurements performed within the framework of the RTR-NetTest. Accordingly, repeated measurements carried out by the same user at the same location within a short time span are no longer included in the statistics. Therefore, the statistics from Q1 2016 onwards show fewer measure-ments compared with previous periods, which is why comparison would have no informative value.
The data underlying this chart can be found in the table at the end of the section.
RTR-NetTest: Number of measurements per technology Number of measurements per quarter increasing
Source: RTR-NetTest

111,600
109,700
68,200
66,800
34,500
31,000
21,400
15,800
14,800
Vienna
Lower Austria
Styria
Upper Austria
Tyrol
Carinthia
Salzburg
Vorarlberg
Burgenland
0 20,000 40,000 60,000 80,000 100,000 120,000
Q1
Q2
Q3
Q4
Q1
Q2
Q3
Q4
Q1
Q2
Q3
Q4
Q1
Q2
Q3
Q4
2014
2015
2016
Residential customers Business customers
Mobile broadband Smartphone tariffs Mobile broadband Smartphone tariffs
1,878,200 2,988,400 312,300 365,400
1,820,900 3,007,200 330,100 417,200
1,859,500 3,046,000 337,100 432,700
1,857,700 3,113,800 335,800 446,000
1,812,200 3,098,900 334,900 454,800
1,799,600 3,137,400 331,900 480,400
1,818,600 3,303,900 337,900 479,300
1,810,100 3,346,200 393,100 482,400
1,996,500 3,645,200 420,300 577,400
2,035,200 3,699,400 426,900 582,500
1,966,300 3,545,400 828,200 793,700
2,023,600 3,837,500 900,800 823,500
Retail mobile broadband connections by customer type (page 26)Number of
mobile broadband connections
RTR Telekom Monitor | Annual Review 2016 |2 34
• In 2016, the majority of measurements were carried out in Vienna (111,600), followed by Lower Austria (109,700), Styria (68,200) and Upper Austria (66,800). Thus, about three quarters (75.2%) of all measurements using the RTR-NetTest were performed in these Austrian provinces.
• With regard to the number of measurements, the remaining Austrian prov-inces are running far behind.
In measurements using the RTR-NetTest the location of the measurement can be determined. For the above evaluations only measurements with a location accuracy of < 2 km are used. Accord-ingly, for each province the number of measurements performed can be determined. The chart shows the sum of all measurements performed in each province in 2016.
Source: RTR-NetTest
RTR-NetTest: Number of measurements per Austrian province in 2016Clear regional differences in number of measurements

Tables111,600
109,700
68,200
66,800
34,500
31,000
21,400
15,800
14,800
Vienna
Lower Austria
Styria
Upper Austria
Tyrol
Carinthia
Salzburg
Vorarlberg
Burgenland
0 20,000 40,000 60,000 80,000 100,000 120,000
Q1
Q2
Q3
Q4
Q1
Q2
Q3
Q4
Q1
Q2
Q3
Q4
Q1
Q2
Q3
Q4
2014
2015
2016
2,265,700 2,190,500 3,353,800
2,282,000 2,151,000 3,424,400
2,311,200 2,196,600 3,478,700
2,352,600 2,193,500 3,559,800
2,382,700 2,147,100 3,553,700
2,399,100 2,131,500 3,617,800
2,419,700 2,156,500 3,783,200
2,455,500 2,203,200 3,828,600
2,478,600 2,416,800 4,222,600
2,487,600 2,462,100 4,281,900
2,492,800 2,794,500 4,339,100
2,523,200 2,924,400 4,661,000
Fixed and mobile broadband connections (page 24)
Fixed broadbandMobile broadband
(data tariffs and prepaid cards) Smartphone tariffsNumber
of connections
Q1
Q2
Q3
Q4
Q1
Q2
Q3
Q4
Q1
Q2
Q3
Q4
Q1
Q2
Q3
Q4
2016
2015
2014 1,351,600 161,800 705,000 16,100 27,5003,700
1,361,500 157,800 713,800 16,300 29,1003,500
1,376,800 157,400 726,300 16,400 30,9003,400
1,403,600 152,300 743,800 16,500 33,1003,300
1,422,600 148,500 754,800 16,200 34,500 2,900 3,200
1,429,800 144,000 766,100 16,300 35,900 3,900 3,100
1,444,400 139,100 774,900 16,600 36,600 5,100 3,000
1,467,000 134,200 788,100 16,600 40,300 6,500 2,800
1,476,200 137,700 793,500 29,100 32,600 8,200 1,300
1,478,500 133,000 802,800 29,100 33,700 9,400 1,100
1,473,200 129,900 810,400 28,900 38,000 11,400 1,000
1,495,800 124,600 819,500 28,700 40,900 13,200 500
Copper-wire pairs
Unbundled lines
Coaxial cable
FWA (fixed wire-less access)
FTTH (fibre to the home)
Virtual unbundling Others
Retail fixed broadband connections by type of infrastructure (page 26)
Number of fixed broadband
connections
Q1
Q2
Q3
Q4
Q1
Q2
Q3
Q4
Q1
Q2
Q3
Q4
Q1
Q2
Q3
Q4
2014
2015
2016
Residential customers Business customers
Mobile broadband Smartphone tariffs Mobile broadband Smartphone tariffs
1,878,200 2,988,400 312,300 365,400
1,820,900 3,007,200 330,100 417,200
1,859,500 3,046,000 337,100 432,700
1,857,700 3,113,800 335,800 446,000
1,812,200 3,098,900 334,900 454,800
1,799,600 3,137,400 331,900 480,400
1,818,600 3,303,900 337,900 479,300
1,810,100 3,346,200 393,100 482,400
1,996,500 3,645,200 420,300 577,400
2,035,200 3,699,400 426,900 582,500
1,966,300 3,545,400 828,200 793,700
2,023,600 3,837,500 900,800 823,500
Retail mobile broadband connections by customer type (page 26)Number of
mobile broadband connections
RTR Telekom Monitor | Annual Review 2016 |2 35

Q1
Q2
Q3
Q4
Q1
Q2
Q3
Q4
Q1
Q2
Q3
Q4
Q1
Q2
Q3
Q4
2016
2015
2014 1,200,600 120,100 691,200 14,300 22,900 0 2,400
1,210,100 116,800 699,500 14,400 24,500 0 2,200
1,225,900 113,900 711,400 14,600 26,500 0 2,100
1,253,600 111,200 726,100 14,600 28,600 0 2,000
1,273,200 109,500 735,900 14,300 29,600 2,900 1,900
1,280,300 106,000 746,400 14,400 30,700 3,900 1,800
1,294,100 102,000 754,500 14,700 31,500 5,100 1,600
1,315,700 97,500 767,000 14,700 34,800 6,500 1,500
1,324,400 98,800 774,000 24,000 27,500 8,200 1,100
1,326,800 94,900 782,400 24,000 28,500 9,400 800
1,322,900 92,500 789,300 23,800 31,700 11,400 700
1,346,200 87,800 797,500 23,600 34,400 13,200 300
Copper-wire pairs
Unbundled lines
Coaxial cable
FWA (fixed wireless access)
FTTH (fibre to the home)
Virtual unbundling Others
Retail fixed broadband connections by type of infrastructure – retail customers
Number of fixed broadband
connections
Q1
Q2
Q3
Q4
Q1
Q2
Q3
Q4
Q1
Q2
Q3
Q4
Q1
Q2
Q3
Q4
2016
2015
2014 151,000 41,700 13,800 1,800 4,600 0 1,300
151,400 41,000 14,300 1,900 4,600 0 1,300
150,900 43,500 14,900 1,800 4,400 0 1,300
150,000 41,100 17,700 1,900 4,500 0 1,300
149,400 39,000 18,900 1,900 4,900 0 1,300
149,500 38,000 19,700 1,900 5,200 0 1,300
150,300 37,100 20,400 1,900 5,100 0 1,400
151,300 36,700 21,100 1,900 5,500 0 1,300
151,800 38,900 19,500 5,100 5,100 0 200
151,700 38,100 20,400 5,100 5,200 0 300
150,300 37,400 21,100 5,100 6,300 0 300
149,600 36,800 22,000 5,100 6,500 0 200
Copper-wire pairs
Unbundled lines
Coaxial cable
FWA (fixed wireless access)
FTTH (fibre to the home)
Virtual unbundling Others
Retail broadband connections by type of infrastructure – business customers
Number of fixed broadband
connections
Q1
Q2
Q3
Q4
Q1
Q2
Q3
Q4
Q1
Q2
Q3
Q4
Q1
Q2
Q3
Q4
2016
2015
2014 13,000 215,200 1,004,700 697,100 294,700 41,200
11,900 209,300 1,000,400 703,700 315,900 40,800
11,300 205,100 1,001,800 714,900 334,900 43,200
10,500 199,500 1,006,600 725,700 339,800 70,600
9,600 194,500 1,006,500 743,900 354,200 74,100
8,900 189,000 993,200 769,400 363,400 75,100
8,300 182,800 982,800 793,700 374,900 77,300
6,800 173,900 962,800 834,300 394,100 83,600
5,900 171,000 944,000 833,200 434,700 89,900
5,400 167,800 932,000 821,000 466,300 95,200
5,000 163,100 922,700 826,900 475,900 99,400
4,300 158,700 937,000 821,000 495,300 107,000
≥ 144 kbit/s to
< 2 Mbit/s = 2 Mbit/s
> 2 Mibt/s to
< 10 Mbit/s
≥ 10 Mbit/s to
< 30 Mbit/s
≥ 30 Mbit/s to
< 100 Mbit/s ≥ 100 Mbit/s
Retail broadband connections by bandwidth category – fixed network (page 27)
Number of connections
RTR Telekom Monitor | Annual Review 2016 |2 36

Q1
Q2
Q3
Q4
Q1
Q2
Q3
Q4
Q1
Q2
Q3
Q4
Q1
Q2
Q3
Q4
2016
2015
2014 1,200,600 120,100 691,200 14,300 22,900 0 2,400
1,210,100 116,800 699,500 14,400 24,500 0 2,200
1,225,900 113,900 711,400 14,600 26,500 0 2,100
1,253,600 111,200 726,100 14,600 28,600 0 2,000
1,273,200 109,500 735,900 14,300 29,600 2,900 1,900
1,280,300 106,000 746,400 14,400 30,700 3,900 1,800
1,294,100 102,000 754,500 14,700 31,500 5,100 1,600
1,315,700 97,500 767,000 14,700 34,800 6,500 1,500
1,324,400 98,800 774,000 24,000 27,500 8,200 1,100
1,326,800 94,900 782,400 24,000 28,500 9,400 800
1,322,900 92,500 789,300 23,800 31,700 11,400 700
1,346,200 87,800 797,500 23,600 34,400 13,200 300
Copper-wire pairs
Unbundled lines
Coaxial cable
FWA (fixed wireless access)
FTTH (fibre to the home)
Virtual unbundling Others
Retail fixed broadband connections by type of infrastructure – retail customers
Number of fixed broadband
connections
Q1
Q2
Q3
Q4
Q1
Q2
Q3
Q4
Q1
Q2
Q3
Q4
Q1
Q2
Q3
Q4
2016
2015
2014 151,000 41,700 13,800 1,800 4,600 0 1,300
151,400 41,000 14,300 1,900 4,600 0 1,300
150,900 43,500 14,900 1,800 4,400 0 1,300
150,000 41,100 17,700 1,900 4,500 0 1,300
149,400 39,000 18,900 1,900 4,900 0 1,300
149,500 38,000 19,700 1,900 5,200 0 1,300
150,300 37,100 20,400 1,900 5,100 0 1,400
151,300 36,700 21,100 1,900 5,500 0 1,300
151,800 38,900 19,500 5,100 5,100 0 200
151,700 38,100 20,400 5,100 5,200 0 300
150,300 37,400 21,100 5,100 6,300 0 300
149,600 36,800 22,000 5,100 6,500 0 200
Copper-wire pairs
Unbundled lines
Coaxial cable
FWA (fixed wireless access)
FTTH (fibre to the home)
Virtual unbundling Others
Retail broadband connections by type of infrastructure – business customers
Number of fixed broadband
connections
Q1
Q2
Q3
Q4
Q1
Q2
Q3
Q4
Q1
Q2
Q3
Q4
Q1
Q2
Q3
Q4
2016
2015
2014 13,000 215,200 1,004,700 697,100 294,700 41,200
11,900 209,300 1,000,400 703,700 315,900 40,800
11,300 205,100 1,001,800 714,900 334,900 43,200
10,500 199,500 1,006,600 725,700 339,800 70,600
9,600 194,500 1,006,500 743,900 354,200 74,100
8,900 189,000 993,200 769,400 363,400 75,100
8,300 182,800 982,800 793,700 374,900 77,300
6,800 173,900 962,800 834,300 394,100 83,600
5,900 171,000 944,000 833,200 434,700 89,900
5,400 167,800 932,000 821,000 466,300 95,200
5,000 163,100 922,700 826,900 475,900 99,400
4,300 158,700 937,000 821,000 495,300 107,000
≥ 144 kbit/s to
< 2 Mbit/s = 2 Mbit/s
> 2 Mibt/s to
< 10 Mbit/s
≥ 10 Mbit/s to
< 30 Mbit/s
≥ 30 Mbit/s to
< 100 Mbit/s ≥ 100 Mbit/s
Retail broadband connections by bandwidth category – fixed network (page 27)
Number of connections
Q1
Q2
Q3
Q4
Q1
Q2
Q3
Q4
Q1
Q2
Q3
Q4
Q1
Q2
Q3
Q4
2016
2015
2014 472,800 1,073,300 520,400 118,800 40,900
482,100 1,072,100 524,800 125,200 38,800
508,800 1,066,100 528,100 131,000 37,200
536,400 1,064,900 532,500 143,600 35,500
559,000 1,063,200 534,700 151,000 33,800
561,000 1,067,500 539,600 156,100 32,500
565,000 1,078,500 543,800 159,400 31,400
578,600 1,082,900 556,400 164,800 30,900
582,400 1,087,300 558,500 168,700 29,600
581,500 1,092,500 561,200 171,800 28,100
588,800 1,103,900 562,600 175,100 26,200
606,600 1,108,100 563,000 181,200 21,000
Number of retail broadband connections by bundle category – fixed network (page 28)
Stand-alone broadband
Broadband + fixed-line telephony
Broadband + fixed-line telephony + TV Broadband + TV
Other bundles with fixed-line telephony, TV
or mobile broadbandNumber of
connections
Q1
Q2
Q3
Q4
Q1
Q2
Q3
Q4
Q1
Q2
Q3
Q4
Q1
Q2
Q3
Q4
2016
2015
2014 50,524,700 78,807,700 50,971,200 10,936,400 2,737,300
49,690,500 78,567,300 51,121,500 11,879,800 2,604,700
52,267,200 77,526,800 51,446,100 12,764,200 2,503,200
52,834,900 77,146,500 51,545,000 13,369,900 2,854,100
54,060,400 77,289,700 51,169,700 14,395,700 2,382,000
55,087,200 77,503,200 51,671,000 15,144,700 2,290,400
55,717,900 78,219,900 52,338,000 15,673,900 2,209,800
56,844,500 79,294,600 52,822,200 16,310,400 1,739,500
56,746,400 80,853,800 53,930,500 16,478,900 1,613,800
57,559,800 81,879,100 54,471,400 16,730,500 1,489,700
56,369,300 82,653,500 54,333,500 16,886,400 1,407,100
58,170,600 83,401,000 53,524,400 16,866,400 1,197,500
Revenues from retail broadband connections – fixed network (page 29)
Stand-alone broadband
Broadband + fixed-line telephony
Broadband + fixed-line telephony + TV Broadband + TV
Other bundles with fixed-line telephony, TV
or mobile broadbandEUR
Q1
Q2
Q3
Q4
Q1
Q2
Q3
Q4
Q1
Q2
Q3
Q4
Q1
Q2
Q3
Q4
2016
2015
2014 39,490 6,470 10,500 1,000 6,250 1,550 78,370
39,300 6,380 10,410 1,020 6,210 1,560 79,230
38,860 7,020 10,780 1,020 6,180 1,560 79,630
38,650 6,890 11,030 1,050 6,100 1,560 79,220
37,990 6,750 11,280 1,050 5,930 1,570 21,670
38,000 6,640 11,870 1,050 5,820 1,610 21,740
38,000 6,480 12,120 1,050 4,530 1,610 65,270
37,800 6,240 12,530 1,070 5,480 1,600 66,670
37,540 9,890 15,470 290 4,030 120 64,600
37,470 9,780 15,630 280 3,960 130 64,390
37,300 9,680 15,820 290 3,900 130 669,590
37,200 9,640 15,970 290 3,870 150 707,180
Copper-wire pairs
Unbundled lines
Coaxial cable
FWA (fixed wireless access)
FTTH (fibre to the home)
Others (satellite etc.)
Mobile broadband
Number of wholesale broadband connections
Number of connections
RTR Telekom Monitor | Annual Review 2016 |2 37

Q1
Q2
Q3
Q4
Q1
Q2
Q3
Q4
Q1
Q2
Q3
Q4
Q1
Q2
Q3
Q4
2014
2015
2016
39,460 3,100 9,080 980 6,240
39,270 2,990 9,160 1,000 6,200
38,830 2,880 9,260 1,000 6,170
38,620 2,860 9,420 1,020 6,080
37,960 2,760 9,640 1,030 5,920
37,970 2,680 11,870 1,030 5,800
37,970 2,600 12,120 1,030 4,520
37,770 2,470 12,530 1,050 5,460
37,540 3,840 13,820 260 4,000
37,470 3,800 13,980 250 3,940
37,300 3,760 14,160 250 3,870
37,200 3,740 14,320 260 3,850
Copper-wire pairs
Unbundled lines
Coaxial cable
FWA (fixed wireless access)
FTTH (fibre to the home)
Number of wholesale broadband connections – Bitstream
Number of connections
Q1
Q2
Q3
Q4
Q1
Q2
Q3
Q4
Q1
Q2
Q3
Q4
Q1
Q2
Q3
Q4
2014
2015
2016
30 3,370 1,420 20 10
30 3,390 1,250 20 10
30 4,130 1,520 20 10
30 4,040 1,610 20 10
30 3,990 1,640 20 10
30 3,960 0 20 10
30 3,890 0 20 20
30 3,770 0 20 20
0 6,050 1,650 30 30
0 5,990 1,650 30 30
0 5,920 1,650 30 30
0 5,900 1,650 30 30
Copper-wire pairs
Unbundled lines
Coaxial cable
FWA (fixed wireless access)
FTTH (fibre to the home)
Number of wholesale broadband connections – Resale
Number of connections
Q1
Q2
Q3
Q4
Q1
Q2
Q3
Q4
Q1
Q2
Q3
Q4
Q1
Q2
Q3
Q4
2014
2015
2016
2,568,700 1,030,100
2,542,500 995,500
2,543,200 1,021,700
2,544,100 1,062,000
2,548,200 1,064,900
2,637,700 1,176,500
2,613,000 1,053,900
2,669,600 898,300
2,778,600 988,400
2,804,200 985,700
2,796,600 4,169,300
2,781,000 4,185,200
Bitstream Resale
Revenues from wholesale broadband connections
EUR
RTR Telekom Monitor | Annual Review 2016 |2 38

Q1
Q2
Q3
Q4
Q1
Q2
Q3
Q4
Q1
Q2
Q3
Q4
Q1
Q2
Q3
Q4
2014
2015
2016
39,460 3,100 9,080 980 6,240
39,270 2,990 9,160 1,000 6,200
38,830 2,880 9,260 1,000 6,170
38,620 2,860 9,420 1,020 6,080
37,960 2,760 9,640 1,030 5,920
37,970 2,680 11,870 1,030 5,800
37,970 2,600 12,120 1,030 4,520
37,770 2,470 12,530 1,050 5,460
37,540 3,840 13,820 260 4,000
37,470 3,800 13,980 250 3,940
37,300 3,760 14,160 250 3,870
37,200 3,740 14,320 260 3,850
Copper-wire pairs
Unbundled lines
Coaxial cable
FWA (fixed wireless access)
FTTH (fibre to the home)
Number of wholesale broadband connections – Bitstream
Number of connections
Q1
Q2
Q3
Q4
Q1
Q2
Q3
Q4
Q1
Q2
Q3
Q4
Q1
Q2
Q3
Q4
2014
2015
2016
30 3,370 1,420 20 10
30 3,390 1,250 20 10
30 4,130 1,520 20 10
30 4,040 1,610 20 10
30 3,990 1,640 20 10
30 3,960 0 20 10
30 3,890 0 20 20
30 3,770 0 20 20
0 6,050 1,650 30 30
0 5,990 1,650 30 30
0 5,920 1,650 30 30
0 5,900 1,650 30 30
Copper-wire pairs
Unbundled lines
Coaxial cable
FWA (fixed wireless access)
FTTH (fibre to the home)
Number of wholesale broadband connections – Resale
Number of connections
Q1
Q2
Q3
Q4
Q1
Q2
Q3
Q4
Q1
Q2
Q3
Q4
Q1
Q2
Q3
Q4
2014
2015
2016
2,568,700 1,030,100
2,542,500 995,500
2,543,200 1,021,700
2,544,100 1,062,000
2,548,200 1,064,900
2,637,700 1,176,500
2,613,000 1,053,900
2,669,600 898,300
2,778,600 988,400
2,804,200 985,700
2,796,600 4,169,300
2,781,000 4,185,200
Bitstream Resale
Revenues from wholesale broadband connections
EUR
Q1
Q2
Q3
Q4
Q1
Q2
Q3
Q4
Q1
Q2
Q3
Q4
Q1
Q2
Q3
Q4
2014
2015
2016
2,032,500 193,800 2,226,300
2,050,900 192,100 2,243,000
2,076,800 194,400 2,271,200
2,118,500 194,500 2,313,000
2,147,800 193,900 2,341,700
2,163,200 193,500 2,356,700
2,184,700 193,400 2,378,100
2,218,800 194,800 2,413,600
2,228,800 197,700 2,426,500
2,238,000 197,200 2,435,200
2,260,500 196,100 2,456,600
2,284,500 195,400 2,479,900
Residential customers Business customers Total
Number of retail fixed broadband connections by customer typeNumber of
connections
Q1
Q2
Q3
Q4
Q1
Q2
Q3
Q4
Q1
Q2
Q3
Q4
Q1
Q2
Q3
Q4
2014
2015
2016
158,946,900 37,256,800 196,203,700
158,971,300 37,135,600 196,106,900
160,969,100 37,809,700 198,778,800
162,121,500 37,941,900 200,063,400
163,721,100 37,918,000 201,639,100
165,853,000 38,200,200 204,053,200
167,932,000 38,605,800 206,537,800
169,618,900 39,805,900 209,424,800
172,025,800 40,024,200 212,050,000
174,038,400 40,527,300 214,565,700
173,775,600 40,330,900 214,106,500
174,178,600 41,461,100 215,639,700
Residential customers Business customers Total
Revenues from retail fixed broadband connections by customer type
EUR
Q1
Q2
Q3
Q4
Q1
Q2
Q3
Q4
Q1
Q2
Q3
Q4
Q1
Q2
Q3
Q4
2014
2015
2016
2017
7.40 5.70 37.50
7.70 5.40 45.80
9.20 5.00 42.00
10.40 5.70 42.80
11.10 6.90 41.00
12.00 7.80 43.20
12.60 7.70 40.70
13.70 9.10 44.40
14.70 9.00 40.10
14.50 9.40 39.90
15.00 9.30 37.00
15.10 9.40 32.00
(W)LAN 3G 4G
RTR-NetTest: Median of download speed per technology (page 32)
Mbit/s
RTR Telekom Monitor | Annual Review 2016 |2 39

Q1
Q2
Q3
Q4
Q1
Q2
Q3
Q4
Q1
Q2
Q3
Q4
Q1
Q2
Q3
Q4
2016
2017
2017
RTR-NetTest: Number of measurements per technology (page 33)
(W)LAN 2G 3G 4G
69,600 1,500 15,600 26,500
52,800 1,300 12,400 26,000
63,900 1,200 10,500 35,000
98,900 1,200 9,600 48,200
134,900 1,500 9,600 52,300
Number of measurements
RTR Telekom Monitor | Annual Review 2016 |2 40

Q1
Q2
Q3
Q4
Q1
Q2
Q3
Q4
Q1
Q2
Q3
Q4
Q1
Q2
Q3
Q4
2016
2017
2017
RTR-NetTest: Number of measurements per technology (page 33)
(W)LAN 2G 3G 4G
69,600 1,500 15,600 26,500
52,800 1,300 12,400 26,000
63,900 1,200 10,500 35,000
98,900 1,200 9,600 48,200
134,900 1,500 9,600 52,300
Number of measurements
RTR Telekom Monitor | Annual Review 2016 |2 41


| 43
3 Fixed network
Fixed lines 44
Fixed-line penetration 45
Carrier pre-selection and call-by-call usage 46
Retail revenues from access services 47
Retail revenues from carrier services 48
Call minutes on the retail market 49
Revenues per call minute 50
The average fixed line 51
Wholesale market in minutes 52
Wholesale revenues 53
Geographical numbers in use 54
Service numbers in use 55
Tables 56

1,95
4
1,93
0
1,90
8
1,91
8
1,89
7
1,89
2
1,89
3
1,89
4
1,89
9
1,89
6
1,90
0
1,89
6
646
643
636
620
621
616
611
612
626
620
613
608
2,500
2,250
2,000
1,750
1,500
1,250
1,000
750
500
250
0
Q12014
Q22014
Q32014
Q42014
Q12015
Q22015
Q32015
Q22016
Q32016
Q42015
Q12016
Q42016
Figu
res
in th
ousa
nds
Fixed lines /businessesFixed lines / households
RTR Telekom Monitor | Annual Review 2016 |3 44
• At the end of 2016, there were 2.5 million fixed lines in Austria, 0.1% less than at the end of 2015. This suggests that fixed lines show constant devel-opment.
• Connections in households, at 1,895,500, went up by 0.1% against the end of 2015, business connections dropped by 0.7% (to 608,200).
The chart above shows the total number of fixed telephone lines in households and businesses, regardless of the infrastructure on which those lines are based (e.g. copper-wire pairs, coaxial cable or optical fibre).
Fixed linesHardly any changes against 2015

1,95
4
1,93
0
1,90
8
1,91
8
1,89
7
1,89
2
1,89
3
1,89
4
1,89
9
1,89
6
1,90
0
1,89
6
646
643
636
620
621
616
611
612
626
620
613
608
2,500
2,250
2,000
1,750
1,500
1,250
1,000
750
500
250
0
Q12014
Q22014
Q32014
Q42014
Q12015
Q22015
Q32015
Q22016
Q32016
Q42015
Q12016
Q42016
Figu
res
in th
ousa
nds
Fixed lines /businessesFixed lines / households
196.9 195.9 194.0 189.0 189.4 187.9 186.1 186.7 190.9 189.0 186.8 189.4
51.4 50.7 50.0 49.9 49.3 49.0 48.8 48.4 48.4 48.2 48.2 48.1
250
225
200
175
150
125
100
75
50
25
0
Q12014
Q22014
Q32014
Q42014
Q12015
Q22015
Q32015
Q22016
Q32016
Q42015
Q12016
Q42016
Pene
tratio
n ra
te (%
)
Fixed-line penetration / businesses Fixed-line penetration / households
RTR Telekom Monitor | Annual Review 2016 |3 45
• The penetration rates of connections in households and businesses are not subject to major changes either. At the end of 2016, the penetration rate for businesses was 189.4%, for households 48.1%.
• Against the end of 2015, the penetration rate for businesses climbed by 2.7 percentage points, that for households fell by 0.3 percentage point.
The chart shows fixed-line penetration rates among households and busi-nesses. The higher penetration rate for businesses is due to the – in most cases – greater number of fixed lines per business and is therefore not strictly comparable with that of households.
Source for number of households and businesses: Statistics Austria
Fixed-line penetrationBarely any changes over time

79 80 78 76 74 73 57 35 34 33 32 32344
336
328
316
308
301
293
285
278
270
262
251
400
300
200
100
0
Q12014
Q22014
Q32014
Q42014
Q12015
Q22015
Q32015
Q22016
Q32016
Q42015
Q12016
Q42016
Figu
res
in th
ousa
nds
CbC customers CPS customers
RTR Telekom Monitor | Annual Review 2016 |3 46
• CPS and CbC lines continue to lose importance over time.
• At the end of 2016, there were some 250,700 CPS lines in Austria (12.1% less than at the end of 2015). CbC lines show a similar pattern: 31,800 lines constitute a decline of 9.9% against the end of 2015.
• The chart shows the number of customers with lines on which carrier pre-selection (CPS) is used and the number of call-by-call (CbC) customers who used call-by-call at least once in each quarter (see Glossary).
Carrier pre-selection and call-by-call usageContinuing decline of CPS and CbC

79 80 78 76 74 73 57 35 34 33 32 32344
336
328
316
308
301
293
285
278
270
262
251
400
300
200
100
0
Q12014
Q22014
Q32014
Q42014
Q12015
Q22015
Q32015
Q22016
Q32016
Q42015
Q12016
Q42016
Figu
res
in th
ousa
nds
CbC customers CPS customers
35.8
34.5
33.9
32.2
28.3
27.8
28.9
28.0
28.6
27.8
35.035.9
22.6
21.6
20.5
19.5
18.5
17.8
23.8
22.9
22.8
22.4
22.2
21.8
70
60
50
40
30
20
10
0
Q12014
Q22014
Q32014
Q42014
Q12015
Q22015
Q32015
Q22016
Q32016
Q42015
Q12016
Q42016
Reve
nues
(EUR
mill
ions
)
Residential customers Business customers
RTR Telekom Monitor | Annual Review 2016 |3 47
• In 2016, some EUR 202.4 million were generated from access services, i.e. base fees and setup charges, which is a drop of 1.4% against 2015.
• At the residential customer level, annual revenues picked up by 7.5% to EUR 89.1 million. However, this is basically due to the fact that until mid-2015 one operator’s revenues from residential customers had been booked as revenues from business customers, which was corrected only then. There-fore, in 2015, revenues from residential customers were underrepresented.
• For the same reason, revenues from business customers declined by 7.4% (to EUR 113.3 million) in the course of the year.
Retail revenues from access services include base fees and setup charges.
Base fees refer to revenues that are earned periodically and do not depend on the actual use of the subscriber line. They also include revenues from monthly flat rates (e.g. packages which include a certain number of minutes), but such rates do not play a significant role in fixed-network services. Not included are so-called “optional tariffs” and “flat-rate tariffs“ as well as revenues from products bundled with broadband.
Setup charges include revenues generated from the setup, transfer and termination of fixed telephone lines.
Retail revenues from access servicesAccess services are declining slightly

35.8
33.0
32.2
29.3
30.8 30.0
29.8
28.9
27.8
27.7
33.9
33.9
34.6
25.6
24.6
24.1
24.9
23.0
21.4
21.9
22.6
20.5
19.2
18.2
18.9
70
60
50
40
30
20
10
0
Q12014
Q22014
Q32014
Q42014
Q12015
Q22015
Q32015
Q22016
Q32016
Q42015
Q12016
Q42016
Reve
nues
(EUR
mill
ions
)
Residential customers Business customers
RTR Telekom Monitor | Annual Review 2016 |3 48
• Revenues from carrier services continue to decline: EUR 190.8 million were generated in 2016, which is 9.6% less than in 2015. Not even the usual reve-nue increase in the residential customer segment in Q4 (up 4.1%) was able to change this.
• For residential customers, revenues from carrier services dropped by 13.7% (to EUR 76.7 million) from 2015 to 2016; at 6.6% (to EUR 114.2 million) the decline was somewhat more moderate for business customers.
Retail revenues from carrier services depend on the number of call minutes used, i.e. the more telephone calls a fixed subscriber makes, the higher their bill normally is.
The revenues shown above include the retail fees charged by operators for calls to the domestic fixed network, domestic mobile networks, international destina-tions and service numbers. Revenues from fixed monthly flat rates (e.g. packages including a certain number of minutes) are not included in the figures above.
Retail revenues from carrier servicesTrend of declining revenues from carrier services continues in 2016

35.8
33.0
32.2
29.3
30.8 30.0
29.8
28.9
27.8
27.7
33.9
33.9
34.6
25.6
24.6
24.1
24.9
23.0
21.4
21.9
22.6
20.5
19.2
18.2
18.9
70
60
50
40
30
20
10
0
Q12014
Q22014
Q32014
Q42014
Q12015
Q22015
Q32015
Q22016
Q32016
Q42015
Q12016
Q42016
Reve
nues
(EUR
mill
ions
)
Residential customers Business customers
209
207
202
197
196
201
196
197
192 197
203204
150
138
134
127
124
122
119
111
105 104
139142
22
19 18
16 16 15 13
12
11 11
1920
553
503
489
496
481
437
424
432
431
404
385
399
1,200
1,000
800
600
400
200
0
Q12014
Q22014
Q32014
Q42014
Q12015
Q22015
Q32015
Q22016
Q32016
Q42015
Q12016
Q42016
Real
min
utes
(mill
ions
)
International Service numbers and directory assistance servicesDomestic fixed network Domestic mobile network
RTR Telekom Monitor | Annual Review 2016 |3 49
• The ongoing decline in revenues from carrier services was caused by the decrease in call minutes in the fixed network. In 2016, call minutes totalled 2.885 billion, which is 8.2% less than in 2015.
• Most minutes (1.618 billion) were accounted for by calls to the domestic fixed network. Here, the decrease against 2015 was about 8.8%.
• Calls to the domestic mobile network amounted to 781.5 million minutes, the decline, at 1.9%, being less dramatic compared with 2015.
• Calls to international networks amounted to 438.9 million minutes (down 13.5% against 2015), calls to service numbers totalled 46.5 million minutes, which means a drop of 28.3%.
The chart above shows the number of real minutes (see Glossary) in the fixed network, broken down by destination.
Call minutes on the retail marketSignificantly fewer call minutes than in 2015

20
15
10
5
0
Q12014
Q22014
Q32014
Q42014
Q12015
Q22015
Q32015
Q22016
Q32016
Q42015
Q12016
Q42016
Reve
nues
per
cal
l min
ute
(EUR
cen
ts)
Residential customers:Business customers:
Domestic fixed networkDomestic fixed network
Domestic mobile networkDomestic mobile network
InternationalInternational
RTR Telekom Monitor | Annual Review 2016 |3 50
• In Q4 2016, revenues per call minute for calls to the domestic network amounted to 4.9 euro cents (down 10.9% against Q4 2015) in the residential customer segment and 3.0 euro cents in the business customer segment (down 6.3%).
• Calls to the domestic mobile network generated 11.7 euro cents per call minute in the private customer segment (down 1.7%) and 8.1 euro cents for business customers (down 2.4%).
• Revenues per call minute from the fixed network to international networks amounted to 12.3 euro cents for private customers (up 2.5%); the business customers’ contribution to revenues was 10.0 euro cents per minute (down 1.0%).
• In the private customer segment calls to service numbers generated reve-nues per minute of 9.0 euro cents (up 9.8%), for business customers this figure was 37.9 euro cents (up 17.3%).
The chart above shows the revenues per call minute for telephone calls from the fixed network to various destina-tions, broken down into residential and business customer segments. Revenue per call minute is calculated from retail revenues from carrier services to individual destinations (see table at the end of the section), divided by the number of real minutes (chart “Call minutes on the retail market”). The data underlying this chart can be found in the table at the end of the section. For the sake of clarity, the revenue figure for call minutes to service numbers is not included in the chart.
Revenues per call minuteStable development of revenues per call minute

20
15
10
5
0
Q12014
Q22014
Q32014
Q42014
Q12015
Q22015
Q32015
Q22016
Q32016
Q42015
Q12016
Q42016
Reve
nues
per
cal
l min
ute
(EUR
cen
ts)
Residential customers:Business customers:
Domestic fixed networkDomestic fixed network
Domestic mobile networkDomestic mobile network
InternationalInternational
4.0
3.6
3.4
3.2
3.3
16.3
15.9
15.5
15.1
15.2
50.2
48.2
44.7
41.4
44.3
263.
8
258.
0
252.
3
248.
1
251.
8
18
16
14
12
10
8
6
4
2
0
Q42016
Q22016
Q32016
Q42015
Q12016
Q42016
Q22016
Q32016
Q42015
Q12016
Reve
nues
(EUR
) per
fixe
d lin
e an
d m
onth
300
200
100
0Call
min
utes
per
fixe
d lin
e an
d m
onth
Business customers Residential customers Business customersResidential customers
RTR Telekom Monitor | Annual Review 2016 |3 51
• At the end of 2016, private customers made calls amounting to about 44.3 minutes per month (down 11.8% against the end of 2015), generating monthly revenues of EUR 3.30 (down 17.5%).
• Calls made by business customers amounted on average to 251.8 minutes per month (down 4.5%) and thus yielded average monthly revenues of EUR 15.20 (down 6.7%).
The chart shows the average number of active call minutes (real minutes) on the fixed network per customer in the business and residential segments per month in the respective quarter as well as the average revenues from carrier services generated per month in the quarter. The monthly values are calculated from a third of revenues from carrier service charges and a third of the call minutes, divided in each case by the total number of fixed-network lines in the respective quarter. Revenues from access services are not depicted in the chart as they are no longer exactly attributable to fixed-line voice telephony (products bundled with broadband) following the KEV amendment.
The average fixed lineFixed line ARPU declining year on year

698
666
648
656
640
618
593
604
631
605
577
590
591
625
618 62
4
647
629
644
660 621
695
753 83
0
1,01
0
952
934
977
940
897
877
884 889
832
786
815
2,500
2,000
1,500
1,000
500
0
Q12014
Q22014
Q32014
Q42014
Q12015
Q22015
Q32015
Q22016
Q32016
Q42015
Q12016
Q42016
Min
utes
(mill
ions
)
TransitOrigination Termination
RTR Telekom Monitor | Annual Review 2016 |3 52
• In 2016, minutes at the wholesale level totalled some 8.624 billion, remain-ing at much the same level as in 2015 (down 0.1%).
• Origination minutes amounted to 2.403 billion (down 2.1% against 2015). Termination minutes came to 3.321 billion (down 7.7%) and transit minutes
increased by 12.4% to 2.899 billion compared with 2015.
Wholesale services in the field of fixed-network voice telephony include three sub-services: origination, termina-tion and transit services (see Glossary). In the chart wholesale minutes are shown.
Wholesale market in minutesIncrease in transit minutes year on year

698
666
648
656
640
618
593
604
631
605
577
590
591
625
618 62
4
647
629
644
660 621
695
753 83
0
1,01
0
952
934
977
940
897
877
884 889
832
786
815
2,500
2,000
1,500
1,000
500
0
Q12014
Q22014
Q32014
Q42014
Q12015
Q22015
Q32015
Q22016
Q32016
Q42015
Q12016
Q42016
Min
utes
(mill
ions
)
TransitOrigination Termination
2,96
7
2,84
8
2,76
2
2,76
3
2,61
1
2,40
4
2,33
7
2,38
8
2,52
9
2,39
8
2,22
6
2,24
33,
212
4,02
6
3,85
8
4,00
9
3,83
7
3,63
1
3,33
3
3,38
3
3,30
0
3,14
0
3,18
9
3,30
7
1,05
5
1,54
8
1,37
4
1,23
7
1,21
8
1,20
9
1,11
8
1,08
9
1,17
9
1,09
2
1,02
7
1,00
7
9,000
8,000
7,000
6,000
5,000
4,000
3,000
2,000
1,000
0
Q12014
Q22014
Q32014
Q42014
Q12015
Q22015
Q32015
Q22016
Q32016
Q42015
Q12016
Q42016
Reve
nues
(EUR
thou
sand
s)
TransitOrigination Termination
RTR Telekom Monitor | Annual Review 2016 |3 53
• In the course of 2016, at EUR 26.4 million, wholesale revenues were down by about 5.6% against 2015.
• Origination revenues declined by 3.5% to just below EUR 9.4 million, termi-nation revenues dropped by 5.9% to EUR 12.8 million.
• Transit revenues generated EUR 4.2 million (down 9.0%) in 2016.
In line with wholesale minutes, wholesale revenues are shown for origination, termination and transit services.
Wholesale revenuesDownward trend for wholesale revenues

2,93
7
2,90
7
2,88
7
2,85
7
2,84
0
2,83
1
2,83
1
2,81
6
2,80
4
2,79
1
2,77
4
2,74
5
3,500
3,000
2,500
2,000
1,500
1,000
500
0
Q12014
Q22014
Q32014
Q42014
Q12015
Q22015
Q32015
Q22016
Q32016
Q42015
Q12016
Q42016
Figu
res
in th
ousa
nds
Geographical numbers in use
RTR Telekom Monitor | Annual Review 2016 |3 54
• The amount of geographical numbers in use continues to fall slowly but steadily over time. At the end of 2016, some 2.7 million geographical numbers were recorded, which is down by 2.5% against the end of 2015.
Geographical numbers are domestic telephone numbers prefixed by a local area code (e.g. 01 for Vienna).
As more than one number may be assigned to a single line, the number of geographical numbers is not identical to the number of fixed subscriber lines.
Geographical numbers in useGeographical numbers in use are falling slowly but steadily

2,93
7
2,90
7
2,88
7
2,85
7
2,84
0
2,83
1
2,83
1
2,81
6
2,80
4
2,79
1
2,77
4
2,74
5
3,500
3,000
2,500
2,000
1,500
1,000
500
0
Q12014
Q22014
Q32014
Q42014
Q12015
Q22015
Q32015
Q22016
Q32016
Q42015
Q12016
Q42016
Figu
res
in th
ousa
nds
Geographical numbers in use25,000
20,000
15,000
10,000
5,000
0
Q12014
Q22014
Q32014
Q42014
Q12015
Q22015
Q32015
Q22016
Q32016
Q42015
Q12016
Q42016
Num
bers
in u
se
Total of (0)900, (0)930 Total of (0)810, (0)820 ,(0)821, (0)828 (0)800
RTR Telekom Monitor | Annual Review 2016 |3 55
• The amount of (0)900 and (0)930 premium rate numbers increased year on year (basis Q4 2015) by 9.9% to 21,717.
• (0)800 numbers posted a slight increase, namely by 0.9% to 17,554.
• In total, the amount of numbers from the (0)810, (0)820, (0)821 and (0)828 ranges dropped by 9.6% to 10,811. The decline in Q2 2016 can be explained by the fact that one operator, who had been using a relatively large proportion of numbers from the stated ranges according to the transmitted notifica-tions of use, discontinued service.
The chart above shows the number of service numbers in use in the following ranges:
• (0)800 range: toll-free services
• (0)810 range: max. EUR 0.10 per minute or text message
• (0)820 range: max. EUR 0.20 per minute or text message
• (0)821 range: max. EUR 0.20 per call or text message
• (0)828 range: text messages only; standard charges apply
• (0)900 range: max. EUR 3.64 per minute or max. EUR 10.- per text message
• (0)930 range: max. EUR 3.64 per minute or max. EUR 10.- per text message (erotic hotlines)
Service numbers in useMore (0)900 and (0)930 premium rate numbers year on year

TablesQ1
Q2
Q3
Q4
Q1
Q2
Q3
Q4
Q1
Q2
Q3
Q4
Q1
Q2
Q3
Q4
2014
2015
2016
1,954,000 645,800
1,929,500 642,500
1,907,700 636,300
1,918,200 620,000
1,897,400 621,100
1,891,900 616,300
1,892,800 610,500
1,893,600 612,300
1,898,600 626,000
1,895,600 619,800
1,900,300 612,600
1,895,500 608,200
Households Businesses
Fixed lines (page 44)Number
of fixed lines
Q1
Q2
Q3
Q4
Q1
Q2
Q3
Q4
Q1
Q2
Q3
Q4
Q1
Q2
Q3
Q4
2014
2015
2016
51.40% 196.90%
50.70% 195.90%
50.00% 194.00%
49.90% 189.00%
49.30% 189.40%
49.00% 187.90%
48.80% 186.10%
48.40% 186.70%
48.40% 190.90%
48.20% 189.00%
48.20% 186.80%
48.10% 189.40%
Households Businesses
Fixed-line penetration (page 45)Fixed-line
penetration in %
Q1
Q2
Q3
Q4
Q1
Q2
Q3
Q4
Q1
Q2
Q3
Q4
Q1
Q2
Q3
Q4
2014
2015
2016
2,288,300 291,800 19,600 612,700 29,500
2,262,200 288,800 20,900 628,900 30,300
2,236,800 285,600 21,600 638,900 30,400
2,241,200 274,400 22,600 645,000 30,700
2,224,500 270,600 23,400 647,600 30,700
2,214,900 269,000 24,400 653,300 30,900
2,212,400 263,500 27,400 660,800 30,900
2,216,700 260,100 29,100 673,300 31,200
2,225,100 271,600 27,800 694,100 15,800
2,219,100 267,400 28,900 702,500 3,400
2,222,100 263,900 27,000 727,100 100
2,215,800 260,200 27,700 752,300 100
POTS ISDN Multi-ISDN VoB Wireless
Development of fixed lines
Number of lines
RTR Telekom Monitor | Annual Review 2016 |3 56

Q1
Q2
Q3
Q4
Q1
Q2
Q3
Q4
Q1
Q2
Q3
Q4
Q1
Q2
Q3
Q4
2014
2015
2016
1,954,000 645,800
1,929,500 642,500
1,907,700 636,300
1,918,200 620,000
1,897,400 621,100
1,891,900 616,300
1,892,800 610,500
1,893,600 612,300
1,898,600 626,000
1,895,600 619,800
1,900,300 612,600
1,895,500 608,200
Households Businesses
Fixed lines (page 44)Number
of fixed lines
Q1
Q2
Q3
Q4
Q1
Q2
Q3
Q4
Q1
Q2
Q3
Q4
Q1
Q2
Q3
Q4
2014
2015
2016
51.40% 196.90%
50.70% 195.90%
50.00% 194.00%
49.90% 189.00%
49.30% 189.40%
49.00% 187.90%
48.80% 186.10%
48.40% 186.70%
48.40% 190.90%
48.20% 189.00%
48.20% 186.80%
48.10% 189.40%
Households Businesses
Fixed-line penetration (page 45)Fixed-line
penetration in %
Q1
Q2
Q3
Q4
Q1
Q2
Q3
Q4
Q1
Q2
Q3
Q4
Q1
Q2
Q3
Q4
2014
2015
2016
2,288,300 291,800 19,600 612,700 29,500
2,262,200 288,800 20,900 628,900 30,300
2,236,800 285,600 21,600 638,900 30,400
2,241,200 274,400 22,600 645,000 30,700
2,224,500 270,600 23,400 647,600 30,700
2,214,900 269,000 24,400 653,300 30,900
2,212,400 263,500 27,400 660,800 30,900
2,216,700 260,100 29,100 673,300 31,200
2,225,100 271,600 27,800 694,100 15,800
2,219,100 267,400 28,900 702,500 3,400
2,222,100 263,900 27,000 727,100 100
2,215,800 260,200 27,700 752,300 100
POTS ISDN Multi-ISDN VoB Wireless
Development of fixed lines
Number of lines
Q1
Q2
Q3
Q4
Q1
Q2
Q3
Q4
Q1
Q2
Q3
Q4
Q1
Q2
Q3
Q4
2014
2015
2016
78,600 344,200
80,000 335,700
78,100 327,700
76,400 316,100
74,000 308,000
73,300 300,900
57,400 292,700
35,300 285,200
33,500 277,500
32,900 270,000
32,300 261,900
31,800 250,700
CbC CPS
Carrier pre-selection and call-by-call usage (page 46)
Number of customers
Q1
Q2
Q3
Q4
Q1
Q2
Q3
Q4
Q1
Q2
Q3
Q4
Q1
Q2
Q3
Q4
2014
2015
2016
22,572,600 35,849,700
21,575,600 35,937,000
20,512,200 35,023,400
19,533,100 34,461,400
18,453,200 33,946,000
17,754,800 32,240,000
23,754,200 28,336,100
22,947,500 27,784,600
22,773,800 28,919,600
22,362,200 27,980,700
22,166,200 28,602,000
21,814,800 27,787,200
Residential customers Business customers
Retails revenues from access services (page 47)
EUR
Q1
Q2
Q3
Q4
Q1
Q2
Q3
Q4
Q1
Q2
Q3
Q4
Q1
Q2
Q3
Q4
2014
2015
2016
25,623,700 35,803,300
24,644,700 33,911,400
24,068,300 33,865,300
24,878,600 33,012,400
22,974,000 32,181,200
21,377,800 29,300,300
21,903,700 30,801,100
22,586,700 29,989,300
20,455,900 29,771,600
19,156,300 28,860,200
18,150,200 27,784,900
18,893,500 27,737,900
Residential customers Business customers
Retail revenues from carrier services (page 48)
EUR
RTR Telekom Monitor | Annual Review 2016 |3 57

Q1
Q2
Q3
Q4
Q1
Q2
Q3
Q4
Q1
Q2
Q3
Q4
Q1
Q2
Q3
Q4
2014
2015
2016
14,925,600 25,784,400 16,763,100 3,953,900
17,287,400 21,785,000 15,917,100 3,566,600
18,713,200 19,784,900 15,880,400 3,555,100
19,089,600 20,112,600 15,167,100 3,521,700
18,121,400 19,212,600 14,530,900 3,290,300
16,050,600 17,760,400 13,757,000 3,110,200
17,444,200 18,631,700 13,736,400 2,892,400
17,645,300 18,632,300 13,232,500 3,065,900
16,342,500 18,742,500 12,593,500 2,549,000
15,363,300 18,606,700 11,852,700 2,193,700
14,435,800 17,666,400 11,339,000 2,493,900
14,923,900 17,823,200 11,286,400 2,598,100
Domestic fixed network
Domestic mobile network International
Service numbers and directory assistance services
Retail revenues from carrier services 2
EUR
Q1
Q2
Q3
Q4
Q1
Q2
Q3
Q4
Q1
Q2
Q3
Q4
Q1
Q2
Q3
Q4
2014
2015
2016
553,321,000 209,059,000 150,413,000 21,800,000
503,026,000 204,270,000 142,479,000 19,822,000
489,067,000 203,102,000 138,685,000 19,389,000
496,474,000 207,307,000 138,285,000 18,847,000
480,876,000 202,419,000 134,444,000 17,525,000
437,122,000 197,064,000 127,338,000 16,219,000
423,613,000 196,167,000 123,942,000 15,727,000
432,277,000 200,775,000 121,612,000 15,292,000
431,251,000 196,352,000 118,667,000 12,610,000
403,643,000 196,696,000 110,965,000 11,851,000
384,764,000 191,567,000 104,801,000 10,999,000
398,722,000 196,899,000 104,452,000 11,003,000
Domestic fixed network
Domestic mobile network International
Service numbers and directory assistance services
Call minutes on the retail market (page 49)
Minutes
Q1
Q2
Q3
Q4
Q1
Q2
Q3
Q4
Q1
Q2
Q3
Q4
Q1
Q2
Q3
Q4
2016
2015
2014 2.90 18.30 11.80 2.60 10.00 10.70
4.20 14.50 11.90 2.90 9.20 10.60
5.00 12.30 12.20 3.10 8.80 11.00
5.00 12.10 11.90 3.10 8.80 10.30
4.90 11.90 11.70 3.00 8.60 10.20
4.90 11.80 11.50 2.90 8.00 10.30
5.60 12.10 12.30 3.20 8.60 10.40
5.50 11.90 12.00 3.20 8.30 10.10
4.90 12.00 11.60 3.00 8.60 10.00
5.00 12.00 11.60 3.10 8.60 10.10
5.00 12.00 12.30 3.00 8.20 10.00
4.90 11.70 12.30 3.00 8.10 10.00
Domestic fixed network / residential
customers
Domestic mobile network / residential
customers
International / residential customers
Domestic fixed network / business
customers
Domestic mobile network / business
customers
International / business
customers
Revenues per call minute (page 50)
EUR cents
RTR Telekom Monitor | Annual Review 2016 |3 58

Q1
Q2
Q3
Q4
Q1
Q2
Q3
Q4
Q1
Q2
Q3
Q4
Q1
Q2
Q3
Q4
2014
2015
2016
14,925,600 25,784,400 16,763,100 3,953,900
17,287,400 21,785,000 15,917,100 3,566,600
18,713,200 19,784,900 15,880,400 3,555,100
19,089,600 20,112,600 15,167,100 3,521,700
18,121,400 19,212,600 14,530,900 3,290,300
16,050,600 17,760,400 13,757,000 3,110,200
17,444,200 18,631,700 13,736,400 2,892,400
17,645,300 18,632,300 13,232,500 3,065,900
16,342,500 18,742,500 12,593,500 2,549,000
15,363,300 18,606,700 11,852,700 2,193,700
14,435,800 17,666,400 11,339,000 2,493,900
14,923,900 17,823,200 11,286,400 2,598,100
Domestic fixed network
Domestic mobile network International
Service numbers and directory assistance services
Retail revenues from carrier services 2
EUR
Q1
Q2
Q3
Q4
Q1
Q2
Q3
Q4
Q1
Q2
Q3
Q4
Q1
Q2
Q3
Q4
2014
2015
2016
553,321,000 209,059,000 150,413,000 21,800,000
503,026,000 204,270,000 142,479,000 19,822,000
489,067,000 203,102,000 138,685,000 19,389,000
496,474,000 207,307,000 138,285,000 18,847,000
480,876,000 202,419,000 134,444,000 17,525,000
437,122,000 197,064,000 127,338,000 16,219,000
423,613,000 196,167,000 123,942,000 15,727,000
432,277,000 200,775,000 121,612,000 15,292,000
431,251,000 196,352,000 118,667,000 12,610,000
403,643,000 196,696,000 110,965,000 11,851,000
384,764,000 191,567,000 104,801,000 10,999,000
398,722,000 196,899,000 104,452,000 11,003,000
Domestic fixed network
Domestic mobile network International
Service numbers and directory assistance services
Call minutes on the retail market (page 49)
Minutes
Q1
Q2
Q3
Q4
Q1
Q2
Q3
Q4
Q1
Q2
Q3
Q4
Q1
Q2
Q3
Q4
2016
2015
2014 2.90 18.30 11.80 2.60 10.00 10.70
4.20 14.50 11.90 2.90 9.20 10.60
5.00 12.30 12.20 3.10 8.80 11.00
5.00 12.10 11.90 3.10 8.80 10.30
4.90 11.90 11.70 3.00 8.60 10.20
4.90 11.80 11.50 2.90 8.00 10.30
5.60 12.10 12.30 3.20 8.60 10.40
5.50 11.90 12.00 3.20 8.30 10.10
4.90 12.00 11.60 3.00 8.60 10.00
5.00 12.00 11.60 3.10 8.60 10.10
5.00 12.00 12.30 3.00 8.20 10.00
4.90 11.70 12.30 3.00 8.10 10.00
Domestic fixed network / residential
customers
Domestic mobile network / residential
customers
International / residential customers
Domestic fixed network / business
customers
Domestic mobile network / business
customers
International / business
customers
Revenues per call minute (page 50)
EUR cents
Q1
Q2
Q3
Q4
Q1
Q2
Q3
Q4
Q1
Q2
Q3
Q4
Q1
Q2
Q3
Q4
2014
2015
2016
697,907,500 1,009,864,900 590,609,500
666,073,700 952,006,900 625,252,700
647,579,300 933,714,100 618,289,900
656,254,400 976,529,200 624,081,700
640,330,500 939,535,600 647,467,800
618,165,500 896,752,900 628,577,100
592,976,100 876,556,600 644,334,100
603,928,700 883,696,700 659,559,500
631,096,500 888,579,800 620,841,800
604,717,000 831,934,200 695,077,800
577,337,200 785,935,200 753,409,000
590,069,300 814,922,900 830,143,300
Origination Termination Transit
Wholesale market in minutes (page 52)
Minutes
Q1
Q2
Q3
Q4
Q1
Q2
Q3
Q4
Q1
Q2
Q3
Q4
Q1
Q2
Q3
Q4
2014
2015
2016
2,967,300 4,025,900 1,548,000
2,847,700 3,857,800 1,374,400
2,761,500 4,008,600 1,236,600
2,762,900 3,837,300 1,217,700
2,610,900 3,630,500 1,208,800
2,404,300 3,332,500 1,117,500
2,337,000 3,383,100 1,089,100
2,387,500 3,299,900 1,179,100
2,529,300 3,139,900 1,091,700
2,397,800 3,188,700 1,026,800
2,226,000 3,306,600 1,006,700
2,242,600 3,212,200 1,054,900
Origination Termination Transit
Wholesale revenues (page 53)
EUR
Q1
Q2
Q3
Q4
Q1
Q2
Q3
Q4
Q1
Q2
Q3
Q4
Q1
Q2
Q3
Q4
2014
2015
2016
2,936,986 307,383 12,058
2,907,113 308,597 11,933
2,887,446 311,403 13,240
2,857,400 310,853 13,080
2,839,775 311,003 13,446
2,830,545 310,215 13,463
2,830,825 309,391 13,340
2,815,607 301,393 13,340
2,804,325 301,121 13,192
2,790,785 300,382 13,032
2,773,564 295,123 12,891
2,745,236 292,967 12,552
Geographical numbers in use and fixed-line porting (page 54)
Geographical numbers in use Geographical numbers ported Service numbers portedNumber of
telephone numbers
RTR Telekom Monitor | Annual Review 2016 |3 59

Q1
Q2
Q3
Q4
Q1
Q2
Q3
Q4
Q1
Q2
Q3
Q4
Q1
Q2
Q3
Q4
2014
2015
2016
42,342 549 16,452 11,975 21,012
43,255 549 16,575 12,102 20,765
46,107 545 16,598 11,645 20,111
46,450 542 16,794 11,498 19,826
43,958 536 17,088 11,784 19,832
48,280 536 17,184 11,657 19,762
46,954 536 16,114 10,936 18,436
47,840 531 17,406 11,957 19,765
53,684 529 17,651 11,864 22,208
54,463 528 17,540 9,261 21,803
54,734 527 17,653 10,511 21,710
53,925 203 17,554 10,811 21,717
(0)720 (0)780 (0)800(0)810, (0)820, (0)821, (0)828 (0)900, (0)930
Service numbers in use (page 55)
Number of service numbers
RTR Telekom Monitor | Annual Review 2016 |3 60

Q1
Q2
Q3
Q4
Q1
Q2
Q3
Q4
Q1
Q2
Q3
Q4
Q1
Q2
Q3
Q4
2014
2015
2016
42,342 549 16,452 11,975 21,012
43,255 549 16,575 12,102 20,765
46,107 545 16,598 11,645 20,111
46,450 542 16,794 11,498 19,826
43,958 536 17,088 11,784 19,832
48,280 536 17,184 11,657 19,762
46,954 536 16,114 10,936 18,436
47,840 531 17,406 11,957 19,765
53,684 529 17,651 11,864 22,208
54,463 528 17,540 9,261 21,803
54,734 527 17,653 10,511 21,710
53,925 203 17,554 10,811 21,717
(0)720 (0)780 (0)800(0)810, (0)820, (0)821, (0)828 (0)900, (0)930
Service numbers in use (page 55)
Number of service numbers
RTR Telekom Monitor | Annual Review 2016 |3 61


| 63
4 Leased lines
Number of retail leased lines in Austria 64
Number of national terminating segments (at the wholesale level) 65
Tables 66

Q12014
Q22014
Q32014
Q42014
Q12015
Q22015
Q32015
Q22016
Q32016*
Q42015
Q12016
Q42016
13,5
80
13,4
00
13,2
50
13,1
00
12,7
50
13,5
60
13,0
30
11,6
70
10,5
90
11,1
30
10,8
00
9,93
0
3,45
0
3,58
0
3,60
0
3,63
0
3,67
0 4,40
0
5,32
0
4,51
0
3,91
0
3,93
0
3,01
0
3,07
02,54
0
2,47
0
2,41
0
2,16
0
2,19
0
3,05
0
2,92
0
2,75
0
1,70
0
1,66
0
1,60
0
1,54
0
> 2 Mbit/s = 2 Mbit/s< 2 Mbit/s
Num
ber o
f ret
ail l
ease
d lin
es
25,000
20,000
15,000
10,000
5,000
0
RTR Telekom Monitor | Annual Review 2016 |4 64
• The number of retail leased lines has shown a general downward trend over time, with exceptions in 2015. These were caused by the fact that one oper-ator also recorded all backup lines from the beginning of Q2 2015 onwards.
• At the end of 2016, leased lines totalled 14,540, which is a decline of 23.2% against the previous year, when 18,930 leased lines were recorded.
• Not only did the total number of leased lines decrease, also the number of leased lines in the individual bandwidth categories went down year on year. The number of leased lines with bandwidths of < 2 Mbit/s fell by 14.9%, that of the = 2 Mbit/s category by 44.0% and the category of > 2 Mbit/s posted a drop of 31.9%.
The chart above shows the number of retail leased lines (see Glossary), broken down into data rates of < 2 Mbit/s, = 2 Mbit/s and > 2 Mbit/s. A differentiation between the > 2 Mbit/s to 155 Mbit/s and > 155 Mbit/s categories as well as corresponding revenues can be found in the tables at the end of the section.
Number of retail leased lines in AustriaDrop in all bandwidth categories
*Due to post-hoc data corrections, the values presented here differ by more than 5% from those provided in the previous issue of the RTR Telekom Monitor.

Q12014
Q22014
Q32014
Q42014
Q12015
Q22015
Q32015
Q22016
Q32016*
Q42015
Q12016
Q42016
13,5
80
13,4
00
13,2
50
13,1
00
12,7
50
13,5
60
13,0
30
11,6
70
10,5
90
11,1
30
10,8
00
9,93
0
3,45
0
3,58
0
3,60
0
3,63
0
3,67
0 4,40
0
5,32
0
4,51
0
3,91
0
3,93
0
3,01
0
3,07
02,54
0
2,47
0
2,41
0
2,16
0
2,19
0
3,05
0
2,92
0
2,75
0
1,70
0
1,66
0
1,60
0
1,54
0
> 2 Mbit/s = 2 Mbit/s< 2 Mbit/s
Num
ber o
f ret
ail l
ease
d lin
es
25,000
20,000
15,000
10,000
5,000
0
Q12014
Q22014
Q32014
Q42014
Q12015
Q22015
Q32015
Q22016
Q32016*
Q42015
Q12016
Q42016
10,5
20
10,1
30
8,95
0
8,37
0
8,03
0
7,89
0
6,28
0
6,02
0
5,83
0
5,69
0
5,56
0
5,08
0
690
750
760
830
840 90
0
940
1,19
0
1,05
0 1,37
0
1,36
0
8,31
0
8,73
0
9,05
0
9,20
0
9,30
0
9,98
0
10,7
40
10,0
10
9,36
0
10,9
00
11,4
90
1,39
011
,730
> 155 Mbit/s> 2 Mbit/s to 155 Mbit/s≤ 2 Mbit/s
Num
ber o
f ter
min
atin
g se
gmen
ts
25,000
20,000
15,000
10,000
5,000
0
RTR Telekom Monitor | Annual Review 2016 |4 65
• The number of terminating segments of leased lines and Ethernet services rose by 5.7% throughout 2016. Terminating segments of leased lines plum-meted (down 25.9%), while those of Ethernet services jumped by 40.2%.
• Looking at the individual bandwidth categories year on year, the ≤ 2 Mbit/s category shows a decline of 15.6%, while the number of terminating segments in the > 2 Mbit/s to 155 Mbit/s categories increased by 17.2% and that in the > 155 Mbit/s category grew by 16.8%.
The chart above shows the number of terminating segments of leased lines and Ethernet services on the wholesale market, broken down into data rates of ≤ 2 Mbit/s, > 2 Mbit/s to 155 Mbit/s and > 155 Mbit/s. A breakdown into data rates of < 2 Mbit/s and = 2 Mbit/s as well as > 155 Mbit/s to 1 Gbit/s and > 1 Gbit/s, broken down into terminating segments of leased lines and Ethernet services, as well as corresponding revenues can be also found in the tables at the end of the section.
Number of national terminating segments (at the wholesale level)Year-on-year increase, mainly in higher bandwidth categories
*Due to post-hoc data corrections, the values presented here differ by more than 5% from those provided in the previous issue of the RTR Telekom Monitor.

Tables
Q1
Q2
Q3
Q4
Q1
Q2
Q3
Q4
Q1
Q2
Q3
Q4
Q1
Q2
Q3
Q4
2014
2015
2016
320 8,860 3,170 290 11
360 8,400 3,260 330 10
340 7,420 3,280 320 14
330 6,910 3,240 340 11
330 6,600 3,240 340 11
320 6,460 3,770 350 11
300 4,920 4,380 320 8
310 4,660 3,490 470 64
280 4,460 2,530 290 30
220 4,160 1,800 200 30
170 4,130 2,520 270 40
170 3,670 2,490 290 40
< 2 Mbit/s = 2 Mbit/s> 2 Mbit/s to
155 Mbit/s> 155 Mbit/s to
1 Gbit/s > 1 Gbit/s
Number of terminating segments of leased lines in Austria (page 65)Number of
terminating segments
Q1
Q2
Q3
Q4
Q1
Q2
Q3
Q4
Q1
Q2
Q3
Q4
Q1
Q2
Q3
Q4
2014
2015
2016
1,899,100 3,483,400 5,456,500 608,500
1,874,500 3,392,700 5,536,800 716,600
1,800,200 3,332,700 5,571,100 783,100
1,837,300 2,987,900 5,650,800 786,100
1,572,300 3,156,900 5,836,800 823,100
1,629,800 3,175,000 5,892,900 756,400
1,662,700 3,051,900 5,875,300 719,500
1,661,000 3,003,600 5,218,200 1,632,100
1,549,700 2,752,500 4,522,200 1,264,500
1,557,900 2,695,800 4,645,800 1,336,000
1,512,100 2,689,300 4,155,300 1,310,100
1,477,900 2,649,800 4,348,300 1,371,700
< 2 Mbit/s = 2 Mbit/s > 2 Mbit/s to 155 Mbit/s > 155 Mbit/s
Revenues from retail leased lines in Austria
EUR
Q1
Q2
Q3
Q4
Q1
Q2
Q3
Q4
Q1
Q2
Q3
Q4
Q1
Q2
Q3
Q4
2014
2015
2016
13,580 2,540 3,200 250
13,400 2,470 3,290 290
13,250 2,410 3,300 300
13,100 2,160 3,310 320
12,750 2,190 3,360 310
13,560 3,050 4,070 330
13,030 2,920 4,990 330
11,670 2,750 3,920 590
10,590 1,700 3,320 590
11,130 1,660 3,410 520
10,800 1,600 2,580 430
9,930 1,540 2,620 450
< 2 Mbit/s = 2 Mbit/s > 2 Mbit/s to 155 Mbit/s > 155 Mbit/s
Number of retail leased lines in Austria (page 64)
Number of lines
RTR Telekom Monitor | Annual Review 2016 |4 66

Q1
Q2
Q3
Q4
Q1
Q2
Q3
Q4
Q1
Q2
Q3
Q4
Q1
Q2
Q3
Q4
2014
2015
2016
320 8,860 3,170 290 11
360 8,400 3,260 330 10
340 7,420 3,280 320 14
330 6,910 3,240 340 11
330 6,600 3,240 340 11
320 6,460 3,770 350 11
300 4,920 4,380 320 8
310 4,660 3,490 470 64
280 4,460 2,530 290 30
220 4,160 1,800 200 30
170 4,130 2,520 270 40
170 3,670 2,490 290 40
< 2 Mbit/s = 2 Mbit/s> 2 Mbit/s to
155 Mbit/s> 155 Mbit/s to
1 Gbit/s > 1 Gbit/s
Number of terminating segments of leased lines in Austria (page 65)Number of
terminating segments
Q1
Q2
Q3
Q4
Q1
Q2
Q3
Q4
Q1
Q2
Q3
Q4
Q1
Q2
Q3
Q4
2014
2015
2016
1,899,100 3,483,400 5,456,500 608,500
1,874,500 3,392,700 5,536,800 716,600
1,800,200 3,332,700 5,571,100 783,100
1,837,300 2,987,900 5,650,800 786,100
1,572,300 3,156,900 5,836,800 823,100
1,629,800 3,175,000 5,892,900 756,400
1,662,700 3,051,900 5,875,300 719,500
1,661,000 3,003,600 5,218,200 1,632,100
1,549,700 2,752,500 4,522,200 1,264,500
1,557,900 2,695,800 4,645,800 1,336,000
1,512,100 2,689,300 4,155,300 1,310,100
1,477,900 2,649,800 4,348,300 1,371,700
< 2 Mbit/s = 2 Mbit/s > 2 Mbit/s to 155 Mbit/s > 155 Mbit/s
Revenues from retail leased lines in Austria
EUR
Q1
Q2
Q3
Q4
Q1
Q2
Q3
Q4
Q1
Q2
Q3
Q4
Q1
Q2
Q3
Q4
2014
2015
2016
13,580 2,540 3,200 250
13,400 2,470 3,290 290
13,250 2,410 3,300 300
13,100 2,160 3,310 320
12,750 2,190 3,360 310
13,560 3,050 4,070 330
13,030 2,920 4,990 330
11,670 2,750 3,920 590
10,590 1,700 3,320 590
11,130 1,660 3,410 520
10,800 1,600 2,580 430
9,930 1,540 2,620 450
< 2 Mbit/s = 2 Mbit/s > 2 Mbit/s to 155 Mbit/s > 155 Mbit/s
Number of retail leased lines in Austria (page 64)
Number of lines
Q1
Q2
Q3
Q4
Q1
Q2
Q3
Q4
Q1
Q2
Q3
Q4
Q1
Q2
Q3
Q4
2014
2015
2016
3,600 282,600 1,814,000 2,456,200 1,360,300
4,700 264,800 1,753,900 2,744,800 1,204,700
4,600 233,700 1,782,700 2,626,300 1,941,800
4,500 220,000 1,798,600 3,119,400 1,461,800
4,200 210,800 1,796,500 2,707,900 1,604,400
4,200 205,700 3,971,700 2,854,900 1,721,700
4,000 156,000 3,840,400 2,639,700 1,408,700
5,000 149,200 1,788,400 3,271,700 11,570,200
4,200 142,000 1,337,700 2,549,900 2,988,300
2,900 131,300 955,700 1,289,900 3,179,600
1,600 130,100 1,207,100 1,628,600 3,411,800
1,600 117,200 1,202,100 1,734,000 4,263,000
< 2 Mbit/s = 2 Mbit/s> 2 Mbit/s to
155 Mbit/s> 155 Mbit/s to
1 Gbit/s > 1 Gbit/s
Number of 64 kbit/s equivalents of terminating segments of leased linesNumber of
64 kbit/s equivalents
Q1
Q2
Q3
Q4
Q1
Q2
Q3
Q4
Q1
Q2
Q3
Q4
Q1
Q2
Q3
Q4
2014
2015
2016
14,069,100 9,528,500 1,374,500 1,054,800
13,840,600 10,453,300 1,291,000 866,300
12,888,400 10,677,700 1,290,700 903,300
11,413,200 11,121,000 1,295,800 931,500
12,002,700 11,424,400 1,301,400 964,300
12,267,600 11,757,200 1,431,900 980,400
11,887,800 12,128,500 1,552,600 937,300
10,528,500 12,281,500 1,611,700 917,800
8,105,200 13,556,300 1,287,300 1,017,100
7,338,400 15,104,800 1,275,500 1,122,000
7,681,900 13,326,300 1,266,100 1,033,900
7,296,800 19,599,100 1,197,900 1,109,500
Wholesale revenues from leased lines and Ethernet services
Terminating segments / leased lines
Terminating segments /Ethernet services
Trunk segments / leased lines
Trunk segments / Ethernet servicesEUR
Q1
Q2
Q3
Q4
Q1
Q2
Q3
Q4
Q1
Q2
Q3
Q4
Q1
Q2
Q3
Q4
2014
2015
2016
14 1,330 5,140 380 12
7 1,360 5,470 380 25
12 1,180 5,770 400 27
14 1,120 5,960 450 30
14 1,090 6,060 460 30
12 1,100 6,210 500 36
12 1,050 6,360 560 47
9 1,040 6,520 610 54
69 1,020 6,830 690 40
90 1,220 9,100 1,080 60
80 1,180 8,970 950 100
90 1,150 9,240 1,010 50
< 2 Mbit/s = 2 Mbit/s> 2 Mbit/s to
155 Mbit/s> 155 Mbit/s to
1 Gbit/s > 1 Gbit/s
Number of terminating segments of Ethernet services in Austria (page 65)Number of
terminating segments
RTR Telekom Monitor | Annual Review 2016 |4 67

Q1
Q2
Q3
Q4
Q1
Q2
Q3
Q4
Q1
Q2
Q3
Q4
Q1
Q2
Q3
Q4
2014
2015
2016
200 41,400 2,690,500 3,157,100 486,800
100 42,300 2,787,700 3,226,900 930,800
200 37,200 2,840,900 3,267,100 942,900
200 35,500 2,939,400 3,435,600 962,700
200 34,800 3,083,600 3,705,900 960,800
200 34,800 3,122,500 4,061,400 1,136,600
200 32,400 3,201,000 4,753,800 1,556,700
100 32,100 3,294,800 5,349,400 1,984,700
1,000 31,600 3,201,800 5,585,700 1,479,500
1,200 38,100 4,333,400 7,742,700 2,418,500
1,200 36,800 4,835,500 8,378,500 2,545,200
1,400 36,000 4,974,100 7,718,400 1,675,300
< 2 Mbit/s = 2 Mbit/s> 2 Mbit/s to
155 Mbit/s> 155 Mbit/s to
1 Gbit/s > 1 Gbit/s
Number of 64 kbit/s equivalents of terminating segments of Ethernet servicesNumber of
64 kbit/s equivalents
RTR Telekom Monitor | Annual Review 2016 |4 68

Q1
Q2
Q3
Q4
Q1
Q2
Q3
Q4
Q1
Q2
Q3
Q4
Q1
Q2
Q3
Q4
2014
2015
2016
200 41,400 2,690,500 3,157,100 486,800
100 42,300 2,787,700 3,226,900 930,800
200 37,200 2,840,900 3,267,100 942,900
200 35,500 2,939,400 3,435,600 962,700
200 34,800 3,083,600 3,705,900 960,800
200 34,800 3,122,500 4,061,400 1,136,600
200 32,400 3,201,000 4,753,800 1,556,700
100 32,100 3,294,800 5,349,400 1,984,700
1,000 31,600 3,201,800 5,585,700 1,479,500
1,200 38,100 4,333,400 7,742,700 2,418,500
1,200 36,800 4,835,500 8,378,500 2,545,200
1,400 36,000 4,974,100 7,718,400 1,675,300
< 2 Mbit/s = 2 Mbit/s> 2 Mbit/s to
155 Mbit/s> 155 Mbit/s to
1 Gbit/s > 1 Gbit/s
Number of 64 kbit/s equivalents of terminating segments of Ethernet servicesNumber of
64 kbit/s equivalents
RTR Telekom Monitor | Annual Review 2016 |4 69


| 71
5 Comparisons across sectors
Revenues from mobile, broadband, fixed and leased line services 72
Real minutes in fixed and mobile networks 73

Q12014
Q22014
Q32014
Q42014
Q12015
Q22015
Q32015
Q22016
Q32016
Q42015
Q12016
Q42016
608
617
642
630
616
624
647
630
638
645
664
652
128
124 12
1
120
115
108 11
2
110
109
105 10
3
103
198
197 20
0
201
203
206 20
8
211
213
216 219
220
37 38 37 36 37 38
38 37 34 35 33 39
1,200
1,000
800
600
400
200
0Reve
nues
(EUR
mill
ions
)
Leased linesFixed network – voice telephonyBroadbandMobile communications
RTR Telekom Monitor | Annual Review 2016 |5 72
• In 2016, the telecom sector generated EUR 4.028 billion, which is 2.3% more than in the previous year.
• The largest share of telecom revenues is accounted for by mobile services with just below EUR 2.599 billion. Against the year 2015, this is an increase of 3.3%.
• Revenues from broadband services amounted to EUR 868.1 million, up 5.0% compared with 2015.
• Revenues from fixed-line services dropped by 5.6% to EUR 419.6 million year on year.
• Leased line revenues totalled EUR 141.2 million, declining by 5.7% compared with 2015.
The chart includes revenues from the following categories:
Mobile communications: Retail revenues from periodic base fees, activation charges, connection charges and data services, remuneration pursuant to the Telecommunications Fee Subsidies Act, wholesale revenues from termination, origination, interna-tional roaming, national roaming, sale of airtime to resellers (see Glossary);
Broadband (fixed network): Retail revenues (including revenues from products bundled with broadband) and wholesale revenues from setup charges, ongoing charges and volume-based charges;
Fixed network (voice telephony): Retail revenues from residential and business customers (except for bundles with broadband) as well as public pay phones (phone booths), wholesale revenues, revenues from additional services, other fees and remuneration pursuant to the Telecommunications Fee Subsidies Act;
Leased lines: Retail revenues from periodic base fees and setup charges for domestic retail leased lines, wholesale revenues from terminating segments and trunk segments (see Glossary).
Revenues from mobile, broadband, fixed and leased line servicesRevenue growth compared with 2015

Q12014
Q22014
Q32014
Q42014
Q12015
Q22015
Q32015
Q22016
Q32016
Q42015
Q12016
Q42016
608
617
642
630
616
624
647
630
638
645
664
652
128
124 12
1
120
115
108 11
2
110
109
105 10
3
103
198
197 20
0
201
203
206 20
8
211
213
216 219
220
37 38 37 36 37 38
38 37 34 35 33 39
1,200
1,000
800
600
400
200
0Reve
nues
(EUR
mill
ions
)
Leased linesFixed network – voice telephonyBroadbandMobile communications
Q12014
Q22014
Q32014
Q42014
Q12015
Q22015
Q32015
Q22016
Q32016
Q42015
Q12016
Q42016
5,44
9
5,46
1
5,33
5
5,57
0
5,40
7
5,31
9
4,90
7
5,22
0
5,18
6
5,03
3
5,03
8
5,33
971
1
935
870
850 86
1
835
778
759 77
0
759
723
692
7,000
6,000
5,000
4,000
3,000
2,000
1,000
0Call
min
utes
(mill
ions
)
Fixed network (excl. online minutes)Mobile communications
RTR Telekom Monitor | Annual Review 2016 |5 73
• In 2016, call minutes in the mobile and fixed networks totalled some 23.481 billion minutes, which is a decline of 2.1% compared with 2015.
• With 20.596 billion minutes, the mobile network contributed the lion’s share, even though the number of minutes retreated by 1.2% against 2015.
• Minutes from the fixed network amounted to 2.885 billion in 2016, which is 8.2% less than in the reference period.
The chart above shows the number of real minutes (in million) in the following segments:
Mobile communications: Call minutes to the domestic fixed network, domestic mobile networks, international numbers, service numbers and directory assis-tance services;
Fixed network: Call minutes to the domestic fixed network, domestic mobile networks, international numbers, service numbers and directory assis-tance services.
Real minutes in fixed and mobile networksFewer call minutes year on year


| 75
6 Business indicators
Investments 76
Employees in the telecommunications sector 77
Tables 78

2014 2015 20162013
2,01
6.8
9.3
9.3
4.1
14.6
10.1 6.
3
7.5
497.
0
532.
0
645.
9
588.
9
3,000
2,500
2,000
1,500
1,000
500
0Inve
stm
ents
(EUR
mill
ions
)
Sales and customer serviceTechnical infrastructureFrequencies
RTR Telekom Monitor | Annual Review 2016 |6 76
The chart above shows the develop-ment of investments in frequencies, technical infrastructure as well as sales and customer service on an annual basis. In this context, it is important to note that the values reported here are partly based on estimates and extrapola-tions from individual quarters for entire years. As a result, the exact figure for total investments cannot be calculated reliably.
The investment volumes shown above only include those investments made directly by telecommunications enterprises. They do not include investments by upstream or down-stream industry sectors.
• In 2016, total investments in the telecommunications sector amounted to some EUR 600.5 million. This figure is down by 9.2% against 2015.
• Investments in the telecommunications sector mainly go into technical infrastructure, i.e. into network expansion. In 2016, investments came to some EUR 588.9 million, which is 8.8% less than in 2015.
• In 2016, investments in frequencies slumped by 55.9% to EUR 4.1 million. In 2018, the frequencies in the 3.4 GHz to 3.8 GHz bands are to be auctioned.
• Investments in sales and customer service were intensified: EUR 7.5 million mean an increase of 19.0%.
• The 2-billion investment of the mobile operators in 2013 was generated by the frequency auction for the 800/900/1800 MHz frequencies and is now used for the rollout of ultra-fast broadband in Austria.
InvestmentsLower investment activity than in 2015

2014 2015 20162013
2,01
6.8
9.3
9.3
4.1
14.6
10.1 6.
3
7.5
497.
0
532.
0
645.
9
588.
9
3,000
2,500
2,000
1,500
1,000
500
0Inve
stm
ents
(EUR
mill
ions
)
Sales and customer serviceTechnical infrastructureFrequencies
Q12014
Q22014
Q32014
Q42014
Q12015
Q22015
Q32015
Q22016
Q32016
Q42015
Q12016
Q42016
13,0
00
12,9
30
12,8
50
12,6
70
12,6
50
12,6
20
12,6
60
12,5
60
12,6
00
12,5
80
12,5
60
12,5
001,
2601,46
0
1,21
0
1,31
0
1,21
0
1,46
0
1,40
0
1,37
0
1,36
0
1,25
0
1,29
0
1,21
0
16,000
14,000
12,000
10,000
8,000
6,000
4,000
2,000
0Num
ber o
f em
ploy
ees
Leased employees and freelancersPersons employed directly by telecommunication companies
RTR Telekom Monitor | Annual Review 2016 |6 77
• At the end of 2016, 13,760 persons were employed in the telecom sector, which roughly corresponds to the figure of the previous year.
• 12,500 persons were employed directly in telecommunications companies; this figure is down by 0.5% against the end of 2015.
• Leased employees and freelancers dropped by 7.4% to 1,260 persons.
The chart above shows the number of employees in the telecommunications sector, broken down into employees directly employed by telecommunica-tions enterprises, leased employees and freelancers, and expressed in terms of full-time equivalents.
When interpreting these figures, please note that they only include staff employed in the telecom sector. The figures do not include employees in supplier industries, external call-centre employees or outsourced positions.
Employees in the telecommunications sectorFewer leased employees and freelancers than in 2015

Tables2013
2015
2016
2014
FrequenciesTechnical
infrastructureSales and customer
service Total
Investments (page (76)
2,016,800,000 497,000,000 14,600,000 2,528,400,000
9,300,000 532,000,000 10,100,000 551,400,000
9,300,000 645,900,000 6,300,000 661,500,000
4,100,000 588,900,000 7,500,000 600,500,000
EUR
RTR Telekom Monitor | Annual Review 2016 |6 78

2013
2015
2016
2014
FrequenciesTechnical
infrastructureSales and customer
service Total
Investments (page (76)
2,016,800,000 497,000,000 14,600,000 2,528,400,000
9,300,000 532,000,000 10,100,000 551,400,000
9,300,000 645,900,000 6,300,000 661,500,000
4,100,000 588,900,000 7,500,000 600,500,000
EUR
RTR Telekom Monitor | Annual Review 2016 |6 79


| 81
7 International comparisons
Mobile penetration rate 2014 to 2015 82
Interconnection charges for termination in mobile networks 83
Average retail roaming charges for calls within the EU/EEA 84
Average retail SMS roaming charges within the EU/EEA 85
Average retail data roaming charges within the EU/EEA (per megabyte) 86
Fixed broadband penetration 87
Mobile broadband penetration 88
Incumbent operator’s share of broadband market 89
Tables 90
This section contains several comparisons of European mobile and broadband services data. The statistics given here are an extended and more in-depth analysis of the data on the Austrian market discussed in Sections 1-6. The data are taken mainly from the Digital Agenda Scoreboard of the Euro-pean Commission. It contains a series of indicators charting the progress made in achieving the goals of the Digital Agenda of the European Commission.
All other graphics in this section show the latest available figures. Regularly updated data and the option to create interactive charts can be found on the website of the Digital Agenda (http://ec.europa.eu/digital-agenda/en/scoreboard).

250
200
150
100
50
0
Swed
en
Latv
ia
Finl
and
Denm
ark
Portu
gal
Bulg
aria
Aust
ria Italy
Lith
uani
a
Esto
nia
Luxe
mbo
urg
U.K.
Pola
nd
Germ
any
EU
Mal
ta
Cypr
us
Czec
h Re
publ
ic
Belg
ium
Irela
nd
Slov
akia
Net
herla
nds
Gree
ce
Fran
ce
Spai
n
Hung
ary
Slov
enia
Rom
ania
Croa
tia
Pene
tratio
n ra
te (%
)
Mobile penetration 2015 (based on population)Mobile penetration 2014 (based on population)
RTR Telekom Monitor | Annual Review 2016 |7 82
Mobile penetration rate 2014 to 2015Small increase in Austria from 2014 to 2015
The chart above provides an interna-tional comparison of mobile penetration rates (as of 2014 and 2015). The respective penetration rate is based on the number of SIM cards per 100 inhabitants.
The data underlying this chart can be found at the end of the section.
Source: Digital Agenda Scoreboard
• The mobile penetration rate in Austria increased slightly from 153.5% in 2014 to 156.6% in 2015. With close to 20 percentage points above the EU average of 2015, which was at 137.7%, Austria improved by one spot to 7th place by international comparison.
• Compared with 2014, the unweighted EU average rose by 2 percentage points to 137.7% in 2015.
• With a penetration rate of 235.0%, Sweden replaced Latvia (217.6%) as leading nation. However, Sweden revised its annual figures for 2014 upwards. Finland, with 172.8%, reached the third place. At the bottom of the ranking were Slovenia (114.0%), Romania (113.7%) and, in last place, Croatia with a penetration rate of 109.0%.

3.0
2.5
2.0
1.5
1.0
0.5
0.0
Irela
nd
Net
herla
nds
Germ
any
Finl
and
Slov
akia
Belg
ium
Slov
enia
Spai
n
Gree
ce
Latv
ia
Cypr
us
Czec
h Re
publ
ic
Pola
nd
Italy
Bulg
aria
Luxe
mbo
urg
Rom
ania
Lith
uani
a
Esto
nia
Croa
tia
Swed
en
Portu
gal
Aust
ria
Fran
ce
Denm
ark
U.K.
Hung
ary
Mal
ta
Inte
rcon
nect
ion
char
ges
(EUR
cen
ts)
July 2016July 2015 EU average July 2016 (=1.04 EUR cents)250
200
150
100
50
0
Swed
en
Latv
ia
Finl
and
Denm
ark
Portu
gal
Bulg
aria
Aust
ria Italy
Lith
uani
a
Esto
nia
Luxe
mbo
urg
U.K.
Pola
nd
Germ
any
EU
Mal
ta
Cypr
us
Czec
h Re
publ
ic
Belg
ium
Irela
nd
Slov
akia
Net
herla
nds
Gree
ce
Fran
ce
Spai
n
Hung
ary
Slov
enia
Rom
ania
Croa
tia
Pene
tratio
n ra
te (%
)
Mobile penetration 2015 (based on population)Mobile penetration 2014 (based on population)
RTR Telekom Monitor | Annual Review 2016 |7 83
The chart above provides an interna-tional comparison of mobile termination charges. Telecommunications service providers charge each other (at the wholesale level) for termination services, that is, the routing of incoming calls to their mobile networks.
The data underlying this chart can be found at the end of the section.
• Compared with 2015, Austria lost two places (to the United Kingdom and Denmark), ranking 6th in 2016. Nevertheless, with termination rates unchanged against 2015, at 0.80 euro cents Austria is still among the coun-tries with the lowest termination rates and lies far below the EU average.
• From 2014 to 2016, the EU average was dropping steadily from 1.36 euro cents to 1.13 euro cents and is now at 1.04 euro cents.
• Malta (0.40 euro cents), Hungary (0.55 euro cents) and the United Kingdom (0.64 euro cents) led the ranking of lowest termination rates in the EU in 2016.
• In Finland, Cyprus, Portugal and the United Kingdom, termination rates were reduced significantly between July 2015 and July 2016.
• Even though Germany lowered its termination rates from 1.72 to 1.66 euro cents, it is still the third expensive country in terms of termination rates. Higher termination rates are found only in Ireland, at 2.60 euro cents, and in the Netherlands, at 1.86 euro cents.
Source: BEREC – Termination rates at European level July 2016
Interconnection charges for termination in mobile networks Austria has low termination rates by EU comparison

21.6
21.1
21.6
19.9
17.9
17.1
17.1
16.6
15.5
13.9
7.8
7.2
8.2
7.2
6.4
6.2
6.1
6.0
4.7
4.2
5.0
5.0
5.0
1.14
1.14
1.14
5.0
30
25
20
15
10
5
0Roam
ing
char
ges
(EUR
cen
ts)
Maximum roaming surcharge / outgoing callsMaximum surcharge / incoming calls
Outgoing callsIncoming calls
Price cap for outgoing callsPrice cap for incoming calls
Q42013
Q12014
Q22014
Q32014
Q42014
Q12015
Q22015
Q32015
Q22016
Q32016
Q42015
Q12016
Q42016
RTR Telekom Monitor | Annual Review 2016 |7 84
Average retail roaming charges for calls within the EU/EEATransitional regime from Q2 2016 onwards
The chart above shows the average retail roaming rates (excluding VAT) charged to Austrian subscribers for outgoing and incoming calls while roam-ing within the EU/EEA and the price caps prescribed by the Roaming Regu-lation until the end of Q1 2016. Since 30 April 2016 a transitional regime has been in force, which constitutes the first step towards ultimate abolition of roam-ing charges within the EU. Within this transitional period, which is effective until 14 June 2017, providers may levy a roaming surcharge in addition to the domestic retail price but may not exceed certain maximum charge levels. In addi-tion to the domestic price for voice minutes, only a surcharge corresponding to the wholesale price cap (5 euro cents per outgoing minute exclusive of VAT, 1.14 euro cents per incoming minute exclusive of VAT) will be charged. No distinction is made anymore between domestic prices and roaming prices; therefore, these figures can no longer be shown from Q2 2016 onwards.
Source: RTR, BEREC International Roaming Benchmark Data Reports
• The downward trend of roaming charges continued also in Q1 2016. Before the transitional regime took effect on 30 April 2016, average retail roaming prices for both calls received and calls made within the EEA had dropped to 4.2 euro cents (for incoming calls) and to 13.9 euro cents (for outgoing calls).

6.2
6.2
6.2
4.7
4.9
4.8
4.6
4.4
4.5
4.3
2.0
2.0
2.0
11.0
11.3
11.3
10.3
6.9
6.7
6.8
6.5
6.7
6.6
12
10
8
6
4
2
0Roam
ing
char
ges
(EUR
cen
ts)
Maximum roaming surchargeNon-Eurotariff Eurotariff Price cap
Q42013
Q12014
Q22014
Q32014
Q42014
Q12015
Q22015
Q32015
Q22016
Q32016
Q42015
Q12016
Q42016
21.6
21.1
21.6
19.9
17.9
17.1
17.1
16.6
15.5
13.9
7.8
7.2
8.2
7.2
6.4
6.2
6.1
6.0
4.7
4.2
5.0
5.0
5.0
1.14
1.14
1.14
5.0
30
25
20
15
10
5
0Roam
ing
char
ges
(EUR
cen
ts)
Maximum roaming surcharge / outgoing callsMaximum surcharge / incoming calls
Outgoing callsIncoming calls
Price cap for outgoing callsPrice cap for incoming calls
Q42013
Q12014
Q22014
Q32014
Q42014
Q12015
Q22015
Q32015
Q22016
Q32016
Q42015
Q12016
Q42016
RTR Telekom Monitor | Annual Review 2016 |7 85
For roaming text messages the same is true as for roaming minutes. Accord-ingly, providers may levy a roaming surcharge in addition to the domes-tic retail price but may not exceed certain maximum charge levels. In addition to the domestic price for a text message, only a surcharge corre-sponding to the wholesale price cap (2 euro cents per text message exclusive of VAT) will be charged. No distinction is made anymore between domestic and roaming prices; there-fore, these figures can no longer be shown from Q2 2016 onwards.
• In Q1 2016, hardly any change was seen against the previous quarters; before the transitional regime took effect, the charges for text messages had remained relatively constant.
Source: RTR, BEREC International Roaming Benchmark Data Reports
Average retail SMS roaming charges within the EU/EEAConstant charges before the transitional regime took effect

1.4
1.3 1.
8 2.4
1.7
1.5
26.2
24.4
23.1
23.2
17.2
15.5
14.3
17.3
13.4
12.2
10.7
2.9
3.6
3.4
3.2
3.2
5.0
5.0
30
25
20
15
10
5
0
300
250
200
150
100
50
0Pric
e (E
UR c
ents
)
Data
vol
ume
Price per megabyte (EUR cents) – Non-EurotariffPrice per megabyte (EUR cents) – Eurotariff Maximum roaming surcharge
Data volume (terabytes)
Q42013
Q32013
Q12014
Q22014
Q32014
Q42014
Q12015
Q22015
Q32015
Q22016
Q32016
Q42015
Q12016
RTR Telekom Monitor | Annual Review 2016 |7 86
Source: RTR
• As in Q1 2015, average retail roaming charges per megabyte were again seen to contract both for the Eurotariff as well as outside the Eurotariff in Q1 2016.
• Data usage increased significantly after the transitional regime had become
effective.
Since 30 April 2016, a transitional regime directed towards ultimate abol-ishment of roaming charges within the EU has been in force also for data roam-ing, in line with that for voice minutes and text messages. Here, too, provid-ers may levy a roaming surcharge in addition to the domestic retail price but may not exceed certain maximum charge levels. In addition to the domes-tic price per megabyte, only a surcharge corresponding to the wholesale price cap (5 euro cents per megabyte exclu-sive of VAT) will be charged. Here, too, no distinction is made anymore between domestic and roaming prices; therefore, these figures can no longer be shown from Q2 2016 onwards.
Average retail data roaming charges within the EU/EEA (per megabyte)Again vigorous rise in data roaming usage

43.8
43.1
41.1
38.7
38.2
38.2
37.2
36.2
34.7
32.8
32.7
31.6
31.5
31.3
30.7
29.5
29.3
29.2
28.9
28.8
28.6
28.1
25.7
25.0
24.5
24.1
22.9
21.3
18.6
50
40
30
20
10
0
Net
herla
nds
Denm
ark
Fran
ce
Mal
ta
U.K.
Germ
any
Belg
ium
Swed
en
Luxe
mbo
urg
Gree
ce EU
Portu
gal
Cypr
us
Finl
and
Esto
nia
Slov
enia
Lith
uani
a
Spai
n
Irela
nd
Aust
ria
Czec
h Re
publ
ic
Hung
ary
Latv
ia
Italy
Slov
akia
Croa
tia
Bulg
aria
Rom
ania
Pola
nd
Pene
tratio
n ra
te (%
)
Fixed broadband penetration 2016 (based on population)
1.4
1.3 1.
8 2.4
1.7
1.5
26.2
24.4
23.1
23.2
17.2
15.5
14.3
17.3
13.4
12.2
10.7
2.9
3.6
3.4
3.2
3.2
5.0
5.0
30
25
20
15
10
5
0
300
250
200
150
100
50
0Pric
e (E
UR c
ents
)
Data
vol
ume
Price per megabyte (EUR cents) – Non-EurotariffPrice per megabyte (EUR cents) – Eurotariff Maximum roaming surcharge
Data volume (terabytes)
Q42013
Q32013
Q12014
Q22014
Q32014
Q42014
Q12015
Q22015
Q32015
Q22016
Q32016
Q42015
Q12016
RTR Telekom Monitor | Annual Review 2016 |7 87
• Compared with 2015, fixed broadband penetration in Austria (relative to the country’s population) remained almost constant (increase of 0.8 percent-age point) to 28.8%. Against 2015, the EU average rose slightly from 31.6% to 32.7%.
• The highest density of fixed broadband connections was reported for the following three countries: Netherlands (43.8%), Denmark (43.1%) and France (41.1%).
• At the bottom of the ranking were Poland (18.6%), Romania (21.3%) and Bulgaria (22.9%).
The chart above provides an interna-tional comparison of broadband pene-tration rates based on fixed infrastruc-ture such as DSL, cable broadband, unbundled line (see Glossary), wireless, etc. (as of June 2016). The penetration rate is calculated from the number of broadband connections per 100 inhab-itants. Mobile broadband connections are not included in these figures.
Source: Digital Agenda Scoreboard
Fixed broadband penetrationNo major changes against the previous year

147.
2
123.
4
119.
8
116.
3
115.
7
114.
6
95.6
91.4
89.4
86.3
85.4
84.6
83.9
81.9
80.7
77.6
77.6
77.2
77.1
74.8
73.4
73.3
71.4
67.8
65.9
56.9
54.9
49.8
42.7
160
140
120
100
80
60
40
20
0
Finl
and
Denm
ark
Swed
en
Esto
nia
Luxe
mbo
urg
Pola
nd
Irela
nd
U.K.
Cypr
us
Spai
n
Italy
Net
herla
nds
EU
Bulg
aria
Fran
ce
Croa
tia
Latv
ia
Aust
ria
Czec
h Re
publ
ic
Lith
uani
a
Slov
akia
Germ
any
Rom
ania
Belg
ium
Mal
ta
Slov
enia
Portu
gal
Gree
ce
Hung
ary
Pene
tratio
n ra
te (%
)
Mobile broadband penetration 2016 (based on population)
RTR Telekom Monitor | Annual Review 2016 |7 88
• Although Austria increased its mobile penetration rate by 10 percentage points compared with the previous year, at 77.2%, it nevertheless remained in the middle range among the countries compared, below the EU average of 83.9%
• As in 2015, the first three places were occupied by Finland (147.2%), Denmark (123.4%) and Sweden (119.8%), the latter two switching places compared with 2015.
• In 2016, again Hungary was the country with the lowest mobile broadband penetration (42.7%). Greece performed only slightly better (49.8%) and Portu-gal (54.9%) was in the third last position.
The chart provides an international comparison of mobile broadband penetration rates (as of June 2016). The penetration rate is calculated from the number of mobile broadband connec-tions (active broadband SIM cards) per 100 inhabitants. Broadband connections on fixed infrastructure (such as DSL, cable broadband, etc.) are not included in these figures.
Source: Digital Agenda Scoreboard
Mobile broadband penetrationDespite improvement similar ranking as in the previous year

100.
0
66.4
60.4
58.6
58.4
58.1
54.7
49.6
49.0
46.9
46.6
46.1
44.3
43.4
42.3
41.4
41.3
40.7
40.7
39.5
37.1
36.6
34.2
33.7
32.9
29.4
26.4
25.1
24.8
100
90
80
70
60
50
40
30
20
10
0
Finn
land
Luxe
mbu
rg
Zype
rn
Lettl
and
Estla
nd
Öste
rrei
ch
Däne
mar
k
Mal
ta
Kroa
tien
Lita
uen
Italie
n
Belg
ien
Grie
chen
land
Span
ien
Portu
gal
Nie
derla
nde
Unga
rn EU
Deut
schl
and
Fran
krei
ch
Schw
eden
U,K,
Slow
akei
Irlan
d
Slow
enie
n
Pole
n
Tsch
echi
en
Bulg
arie
n
Rum
änie
n
Figu
res
in %
Market share June 2016
147.
2
123.
4
119.
8
116.
3
115.
7
114.
6
95.6
91.4
89.4
86.3
85.4
84.6
83.9
81.9
80.7
77.6
77.6
77.2
77.1
74.8
73.4
73.3
71.4
67.8
65.9
56.9
54.9
49.8
42.7
160
140
120
100
80
60
40
20
0
Finl
and
Denm
ark
Swed
en
Esto
nia
Luxe
mbo
urg
Pola
nd
Irela
nd
U.K.
Cypr
us
Spai
n
Italy
Net
herla
nds
EU
Bulg
aria
Fran
ce
Croa
tia
Latv
ia
Aust
ria
Czec
h Re
publ
ic
Lith
uani
a
Slov
akia
Germ
any
Rom
ania
Belg
ium
Mal
ta
Slov
enia
Portu
gal
Gree
ce
Hung
ary
Pene
tratio
n ra
te (%
)
Mobile broadband penetration 2016 (based on population)
RTR Telekom Monitor | Annual Review 2016 |7 89
• International comparison of the market shares of the respective incum-bents did not show any major changes. With a market share of 58.1%, A1 is in 6th place.
• Incumbent operators reached the highest market shares, with penetration rates beyond 60%, in Finland (100%), Luxemburg (66.4%) and Cyprus (60.4%).
• The lowest market shares were reported for the incumbents in Romania (24.8%), Bulgaria (25.1%) and Czech Republic (26.4%).
The chart above shows the market shares of the retail broadband market held by national incumbent operators (former monopoly operators) (as of June 2016). It only includes broadband connections based on fixed infrastruc-ture (e.g. DSL, cable broadband, etc.). Mobile broadband connections are not included in these figures.
Source: Digital Agenda Scoreboard
Incumbent operator’s share of broadband market Austrian incumbent continues to hold a market share of 58%

RTR Telekom Monitor | Annual Review 2016 |7 90
Tables Penetration rate 2014 Penetration rate 2015
Mobile penetration rate 2014 to 2015 (page 82)
224.7% 235.0%
215.5% 217.6%
172.6% 172.8%
162.1% 165.1%
156.7% 160.6%
158.6% 157.8%
153.5% 156.6%
161.6% 156.2%
150.6% 143.9%
142.6% 143.5%
145.1% 143.2%
138.2% 142.7%
135.4% 140.3%
137.0% 137.7%
135.8% 137.7%
133.7% 133.4%
130.2% 131.4%
128.1% 127.9%
122.7% 127.3%
126.1% 126.7%
119.4% 125.1%
122.5% 123.3%
118.4% 122.8%
116.1% 120.9%
119.2% 119.1%
114.0% 116.9%
112.8% 114.0%
111.3% 113.7%
109.3% 109.0%
Sweden
Latvia
Finland
Denmark
Portugal
Bulgaria
Austria
Italy
Lithuania
Estonia
Luxembourg
United Kingdom
Poland
Germany
European Union
Malta
Cyprus
Czech Republic
Belgium
Ireland
Slovakia
Netherlands
Greece
France
Spain
Hungary
Slovenia
Romania
Croatia

RTR Telekom Monitor | Annual Review 2016 |7 91
Penetration rate 2014 Penetration rate 2015
Mobile penetration rate 2014 to 2015 (page 82)
224.7% 235.0%
215.5% 217.6%
172.6% 172.8%
162.1% 165.1%
156.7% 160.6%
158.6% 157.8%
153.5% 156.6%
161.6% 156.2%
150.6% 143.9%
142.6% 143.5%
145.1% 143.2%
138.2% 142.7%
135.4% 140.3%
137.0% 137.7%
135.8% 137.7%
133.7% 133.4%
130.2% 131.4%
128.1% 127.9%
122.7% 127.3%
126.1% 126.7%
119.4% 125.1%
122.5% 123.3%
118.4% 122.8%
116.1% 120.9%
119.2% 119.1%
114.0% 116.9%
112.8% 114.0%
111.3% 113.7%
109.3% 109.0%
Sweden
Latvia
Finland
Denmark
Portugal
Bulgaria
Austria
Italy
Lithuania
Estonia
Luxembourg
United Kingdom
Poland
Germany
European Union
Malta
Cyprus
Czech Republic
Belgium
Ireland
Slovakia
Netherlands
Greece
France
Spain
Hungary
Slovenia
Romania
Croatia
July 2015 July 2016
Interconnection charges for termination in mobile networks (page 83)
2.60 2.60
1.86 1.86
1.72 1.66
1.87 1.25
1.23 1.23
1.18 1.18
1.14 1.14
1.09 1.09
1.10 1.08
1.05 1.05
1.76 1.01
0.99 1.00
1.05 0.98
0.98 0.98
0.97 0.97
0.97 0.97
0.96 0.96
1.04 0.94
1.00 0.92
0.83 0.84
0.81 0.82
1.27 0.81
0.80 0.80
0.78 0.76
0.81 0.73
0.94 0.64
0.56 0.55
0.40 0.40
Ireland
Netherlands
Germany
Finland
Slovakia
Belgium
Slovenia
Spain
Greece
Latvia
Cyprus
Czech Republic
Poland
Italy
Bulgaria
Luxembourg
Romania
Lithuania
Estonia
Croatia
Sweden
Portugal
Austria
France
Denmark
United Kingdom
Hungary
Malta
EUR cents


| 93
8 Technology indicators
Computers, Internet access and broadband in households 94
Global Competitiveness Index 95
Gross domestic expenditure on R&D in absolute terms and as a proportion of GDP 96
Digital Economy and Society Index (1) 97
Digital Economy and Society Index (2) 98
Information and communications systems are the pillars of the knowledge society and form the basis for the interaction of industry, politics and society. Technologies driving and underpinning informa-tion and communications are therefore increasingly important. Coupled with this is the need to quan-tify the developmental levels of societies with respect to the use of information and communications technologies (ICT). The intention is to make comparisons between countries, chart developments over time and create the basis for economic and political decision-makers. One method of responding to all these requirements is to map the relevant technology and communications parameters in the form of indices.
There are various technology indices used internationally with differing methodological approaches and emphasis. This section will discuss the main indices and Austria’s performance by international standards.
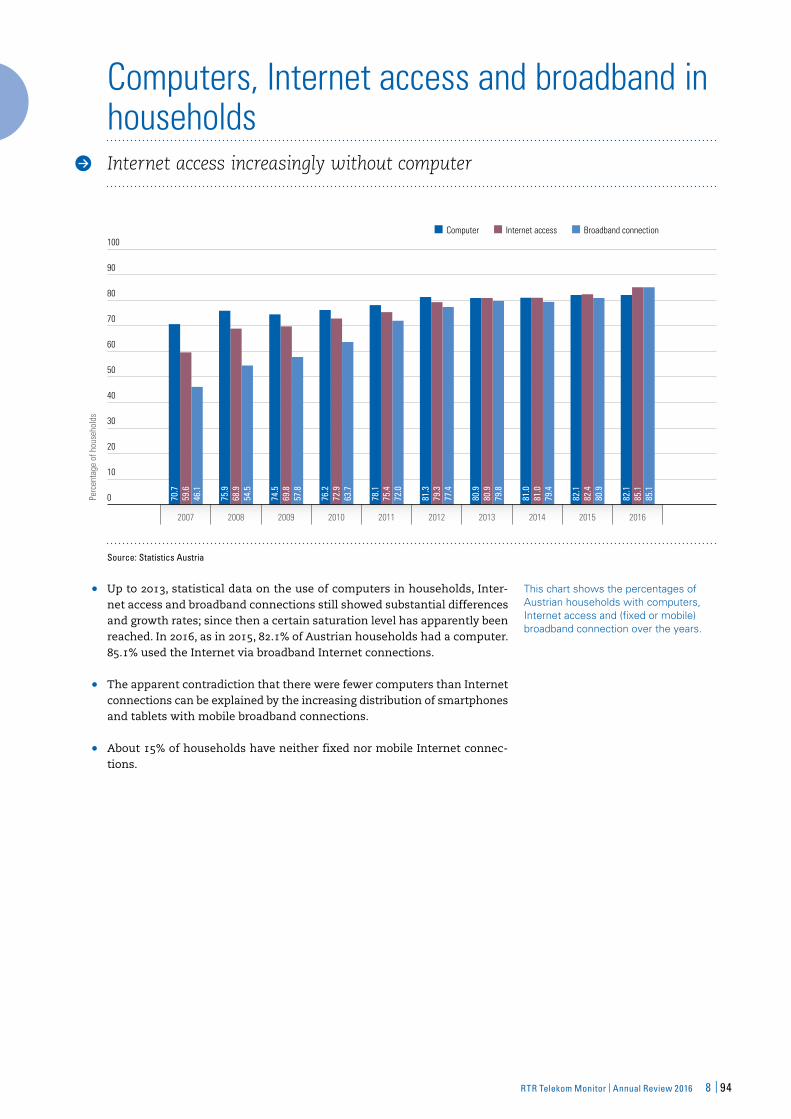
2007 2008 2009 2010 2011 2012 2015 20162013 2014
70.7
75.9
74.5
76.2
78.1
81.3
80.9
81.0
82.1
82.1
59.6
68.9
69.8
72.9
75.4
79.3
80.9
81.0
82.4
85.1
46.1
54.5
57.8
63.7
72.0
77.4
79.8
79.4
80.9
85.1
Perc
enta
ge o
f hou
seho
lds
100
90
80
70
60
50
40
30
20
10
0
Internet accessComputer Broadband connection
1 - Ausstattung von Haushalten
RTR Telekom Monitor | Annual Review 2016 |8 94
• Up to 2013, statistical data on the use of computers in households, Inter-net access and broadband connections still showed substantial differences and growth rates; since then a certain saturation level has apparently been reached. In 2016, as in 2015, 82.1% of Austrian households had a computer. 85.1% used the Internet via broadband Internet connections.
• The apparent contradiction that there were fewer computers than Internet connections can be explained by the increasing distribution of smartphones and tablets with mobile broadband connections.
• About 15% of households have neither fixed nor mobile Internet connec-tions.
This chart shows the percentages of Austrian households with computers, Internet access and (fixed or mobile) broadband connection over the years.
Source: Statistics Austria
Computers, Internet access and broadband in householdsInternet access increasingly without computer

Business sophistication
Higher education and training
Infrastructure
Innovation
Overall ranking
Health and primary education
Institutions
Technological readiness
Goods market efficiency
Macroeconomic environment
Financial market development
Labour market efficiency
Market size
8
12
14
14
19
20
20
23
25
31
34
40
43
0
1
1
0
1
-4
-1
-3
-4
-1
-1
-14
-13
1 11 21 31 41 51 -15 -10 -5 0 5
2016–2017 comparisonsranks lostranks gained
Austria's rankings
2007 2008 2009 2010 2011 2012 2015 20162013 2014
70.7
75.9
74.5
76.2
78.1
81.3
80.9
81.0
82.1
82.1
59.6
68.9
69.8
72.9
75.4
79.3
80.9
81.0
82.4
85.1
46.1
54.5
57.8
63.7
72.0
77.4
79.8
79.4
80.9
85.1
Perc
enta
ge o
f hou
seho
lds
100
90
80
70
60
50
40
30
20
10
0
Internet accessComputer Broadband connection
1 - Ausstattung von Haushalten
RTR Telekom Monitor | Annual Review 2016 |8 95
• Following the setbacks in the ranking in the previous two years, Austria improved by four places to rank 19 in the current competitiveness ranking of the World Economic Forum, thus closing up with its historical best positions.
• Austria improved in nearly all categories, especially in the typical economic parameters “Macroeconomic environment“ (up 14 places to currently rank 31) and “Financial market development“ (up 13 places, currently rank 34).
• Moreover, there were improvements by several ranks in the following parameters: “Higher education and training“ (up four ranks to currently 12th position) and „Innovation“ (up three places, currently rank 14).
• In three categories Austria lost one place against the previous year (“Market size“, “Goods market efficiency“ and “Health and primary education“). As in 2016, “Business sophistication“ retained its 8th position.
• The ranking is headed by Switzerland, followed by Singapore and the United States. Germany is in 5th place.
The World Economic Forum defines competitiveness as the set of institu-tions, policies and production factors that determine the level of productivity of a country. The level of productivity, in turn, sets the level of prosperity that can be earned by an economy. In other words, the greater a country‘s competi-tiveness, the more likely it is that it can produce high incomes. Productivity is by definition an input-output ratio, i.e. it is a measure of the best possible output that can be achieved with the existing production factors.
The twelve parameters are measured either by questioning or by observation. The index also takes into account a country‘s level of development. Accordingly, it distinguishes between factor-driven, efficiency-driven and innovation-driven economies. Develop-ing countries are among the factor-driven economies, while western industrial nations represent innova-tion-driven economies.
Source: World Economic Forum, Global Competitiveness Report 2016-2017
Global Competitiveness IndexAustria improves considerably by international comparison

2007 2008 2009 2010 2011 2012 2015 20162013 2014
6,87
0
7,55
0
7,48
0
8,07
0
8,28
0
9,29
0
9,57
0
10,1
00
10,4
40
10,7
40
Expe
nditu
re in
EUR
mill
ions
Rese
arch
-spe
ndin
g ra
tio a
s a
perc
enta
ge o
f GDP
14,000
12,000
10,000
8,000
6,000
4,000
2,000
0
3.5
3.0
2.5
2.0
1.5
1.0
0.5
0
Gross domestic expenditure on R&D (EUR millions) Expenditure on R&D as a percentage of GDP
RTR Telekom Monitor | Annual Review 2016 |8 96
• In 2016, the research-spending ratio, at 3.07% of GDP, dropped slightly against the previous year. Nevertheless, the research-spending ratio was above 3% of GDP for the third year in a row.
• Absolute expenditure on research and development increased by 2.9% to EUR 10.740 billion.
The annual overall estimate of gross domestic expenditure on research and development (R&D) is derived from the detailed structural data of Statistics Austria obtained from primary-data surveys on R&D and the research-re-lated analyses and evaluations of the budgets of the federal and provincial governments of Austria, also conducted annually. Gross domestic expenditure on R&D, expressed as a percentage of gross domestic product, constitutes the research-spending ratio.
Source: Statistics Austria
Gross domestic expenditure on R&D in absolute terms and as a proportion of GDPResearch-spending ratio consistently above 3% for the first time

DESI (*Denmark)
Connectivity (*Netherlands)
Human Capital (*Finland)
Use of internet (*Denmark)
Integration of digital technology (*Denmark)
Digital public services (*Estonia)
10
15
7
21
14
5
1 6 11 16 21 26
Austria‘s rankings
2007 2008 2009 2010 2011 2012 2015 20162013 2014
6,87
0
7,55
0
7,48
0
8,07
0
8,28
0
9,29
0
9,57
0
10,1
00
10,4
40
10,7
40
Expe
nditu
re in
EUR
mill
ions
Rese
arch
-spe
ndin
g ra
tio a
s a
perc
enta
ge o
f GDP
14,000
12,000
10,000
8,000
6,000
4,000
2,000
0
3.5
3.0
2.5
2.0
1.5
1.0
0.5
0
Gross domestic expenditure on R&D (EUR millions) Expenditure on R&D as a percentage of GDP
RTR Telekom Monitor | Annual Review 2016 |8 97
• In the current DESI ranking Austria is in 10th place. In “Digital public services” (5th place) and “Human capital” (7th place) Austria scored particu-larly well. Improvement is needed for the “Use of Internet” dimension (21st place). In “Integration of digital technology” Austria ranks 14, losing four places compared with the previous year.
• The ranking is headed by Denmark, followed by Finland and Sweden.
The index for digital economy and society (Digital Economy and Society Index – DESI) is compiled annually by the EU Commission. Different technol-ogy parameters are used to compare the 28 EU Member States. In the course of the evaluation by the European Commission, Member States were surveyed according to performance indicators in 5 main groups and 33 subgroups that altogether showed the degree of their digitisation. The chart shows the rankings of Austria in the DESI and in its five main groups. The countries in brackets (with the asterisk) denote the leader in the respective main group.
Source: http://digital-agenda-data.eu/charts/
Digital Economy and Society Index (1)Austria ranks 10th in the EU

Catching up
Falling behind
Running ahead
Lagging ahead
SVK
AUT
SLO
DENITA
GRE
BUL
ROM
IRE
GER
POR
CRO FRA
CZE
POLHUN
SPA
LAT
LUX
EST
NED
LITFINBEL
EU28
Grow
th
Performance0.0 0.1 0.2 0.3 0.4 0.5 0.6 0.7 0.8 0.9
0.050
0.045
0.040
0.035
0.030
0.025
0.020
0.015
0.010
RTR Telekom Monitor | Annual Review 2016 |8 98
• “Running ahead countries” are those that are above the EU average and developed faster han the EU average. Among others, the number one, Denmark, as well as Luxemburg, Estonia and Spain fall into this quadrant.
• Even though “Lagging ahead countries” score above average, they develop more slowly than the EU average. This suggests that a certain ICT maturity has already been achieved in these countries. In addition to top ICT nations such as Finland, Germany and the Netherlands, Austria is also found in this category.
• “Catching up countries” are still below the EU average but are catching up fast. Among them are, for example, Italy, Czech Republic, Greece and Poland.
• “Falling behind countries” constitute the fourth and last quadrant and designate all those countries that are lagging behind the EU average in terms of ICT performance and development. For example, Croatia, Bulgaria and Romania fall into this category.
In line with their performance in the DESI and their development from 2016 to 2017 the 28 EU countries can be grouped in four quadrants. For this purpose the absolute values for “Performance” according to the DESI are entered on the x-axis and the absolute changes between 2016 and 2017 on the y-axis (“Growth”). The origin constitutes the EU average of all 28 Member States (“EU28”).
Source: http://digital-agenda-data.eu/charts/; RTR calculations
Digital Economy and Society Index (2)Austria among the “Lagging ahead nations“ in the EU

Catching up
Falling behind
Running ahead
Lagging ahead
SVK
AUT
SLO
DENITA
GRE
BUL
ROM
IRE
GER
POR
CRO FRA
CZE
POLHUN
SPA
LAT
LUX
EST
NED
LITFINBEL
EU28
Grow
th
Performance0.0 0.1 0.2 0.3 0.4 0.5 0.6 0.7 0.8 0.9
0.050
0.045
0.040
0.035
0.030
0.025
0.020
0.015
0.010
RTR Telekom Monitor | Annual Review 2016 |8 99


| 101
9 Explanatory comments and glossary
Explanatory comments on the survey 102
Glossary 103

RTR Telekom Monitor | Annual Review 2016 |7 102
Explanatory comments on the survey
The RTR Telekom Monitor is published quarterly and examines the developments on the Austrian telecommunications markets.
The rationale for the data survey on which the RTR Telekom Monitor is based is the Communications Survey Ordinance (KEV), Federal Law Gazette II No. 365/2004, which came into force on 1 October 2004 and was amended in 2012 and 2013. RTR is obliged by this Ordinance to carry out statistical surveys of communications markets on a quarterly basis, compile the statistics and publish them.
In order to reduce the burden on the individual operators, RTR specified the sample in line with Art. 4 Par. 1 KEV in such a way that in each segment (mobile communications, broadband, fixed network and leased lines) a market share of at least 90% of the total market is covered. From this sample, RTR extrapolates the data for the total market. The data for the total market are available to RTR from the last full survey in the course of the market analysis procedure. For this edition of the RTR Telekom Monitor the extrapolation was adjusted by using the data of the full survey carried out in 2015, which is why leaps may occur in the charts.
The charts and tables in the RTR Telekom Monitor contain for the most part rounded values. Due to occasional post-hoc data corrections, the values in the charts and tables presented here may differ slightly from the information provided in earlier issues of the RTR Telekom Monitor. Where major deviations (> 5%) arise in individual data values, a comment to this effect is provided for the figure in question. Retail revenues referred to are always net revenues.

RTR Telekom Monitor | Annual Review 2016 |7 103
Glossary
Airtime (mobile communications)Airtime refers to a service that mobile network operators provide for domestic resellers. A reseller (airtime reseller) is a communications service provider that offers public mobile services to retail customers but does not provide those services using its own network. This includes all mobile service providers, such as resellers or (enhanced) service provid-ers, that do not operate their own communications network – neither a radio network nor a core network – in providing mobile communications services.
Bitstream and resaleBitstream and resale are wholesale products at different levels of the value chain, on the basis of which Internet connections can be provided to the end user. Bitstream access is provided at predefined (regional or national) handover points, the wholesale customer providing Internet connectivity. By comparison, in the case of resale, Internet connec-tivity is provided by the wholesale supplier, the wholesale customer acting merely as reseller.
BroadbandBroadband Internet access or broadband Internet connections are Internet connections (technology neutral) with a download speed of > 144 kbit/s. The Internet connection can also be offered as part of a bundle with other services. The connection can be made in the following ways:
• using own infrastructure (copper-wire pairs in the A1 Telekom Austria AG network),
• on an unbundled line (see unbundling),
• as virtual unbundling (see virtual unbundling),
• via coaxial cable (cable modem),
• as fixed wireless access, e.g. WLAN, WiFi, WLL (“fixed“ access, not via hotspots),
• or on other infrastructure. This includes e.g. power line carrier broadband (PWL) and broadband access via satellite (SAT).
Carrier Pre-Selection and Call-by-CallCarrier pre-selection (CPS) refers to a pre-set carrier network code (10xx) that routes all of a subscriber’s traffic (except for calls to value-added services and public service numbers) via the pre-selected carrier network.
In contrast, call-by-call carrier selection (CbC) makes it possible to route individual tele-phone calls via a service provider other than the network that provides the subscriber line. In this case, the subscriber is required to enter the carrier network code (10xx)
before each call.
Ethernet servicesEthernet services with guaranteed bandwidth are lines that provide guaranteed band-width between two network termination points, excluding leased lines with Ethernet user interfaces at the user’s end (because, for example, on-demand switching function-ality is provided).

RTR Telekom Monitor | Annual Review 2016 |7 104
Fixed wholesale market for voice telephonyThe fixed wholesale market includes three sub-services: origination, termination and transit services.
Origination refers to calls that originate from a fixed-network termination point in a carrier’s own network. Termination refers to the routing of calls to a fixed-network termi-nation point in a carrier’s own network. Transit refers to calls between two networks or between two interconnectable exchanges in a network. These services can be provided internally (i.e. as self-provided services, e.g. in an intra-network call) or externally between network operators (e.g. origination to services and carrier network operators or termination from an external network). Origination, termination and transit services are not charged to the customer directly but are settled between network operators (at the wholesale level). The RTR Telekom Monitor reports both revenues and corresponding origination, termination and transit minutes.
International roamingIn connection with mobile communications, the term “roaming“ refers to the use of a mobile telephone outside the coverage area of one‘s own network operator (the home network), in which case the mobile phone uses the service of another network (the host network). In international roaming, the home and host networks are located in different countries and their coverage areas generally do not overlap.
Leased linesLeased lines provide symmetrical transmission capacity with a guaranteed bandwidth between two points without switching functions. Leased lines may also be referred to as
“dedicated lines“ or “point-to-point connections“. A distinction is made between retail and wholesale leased lines.
Retail leased lines refer to leased lines which are not provided for operators or providers of communications networks or services (i.e. companies having a general authorisation) but for companies outside the telecommunications sector (e.g. banks, insurance compa-nies, retail stores, etc.).
Wholesale leased lines are leased lines provided for other operators or providers of communications networks or services. A distinction is made between trunk segments and terminating segments (see trunk segments and terminating segments).
Where leased lines are concerned, it must be borne in mind that there are often time lags in leased lines markets between revenues and demand, frequently resulting in strong fluctuations between months and, indeed, quarters, caused by the billing of project busi-
ness, billbacks and credits.
Mobile broadbandMobile broadband comprises pure data tariffs, data products not based on a fixed monthly charge and smartphone tariffs.
Up to Q4 2015, pure data tariffs (no voice services or text messaging) were restricted to tariffs that included at least 250 megabytes in the monthly charges. This restriction was abolished as from Q1 2016.
Products not based on a fixed monthly charge (e.g. prepaid data products or data/voice products) are products that are used by customers to access the Internet at least once each quarter. Smartphone tariffs are all contracts for voice and text messaging services that are used by customers to access the Internet at least once each quarter. Up to Q4 2015, the tariffs were additionally restricted to those that included at least 250 megabytes in the monthly charges. This restriction was abolished as from Q1 2016.

RTR Telekom Monitor | Annual Review 2016 |7 105
Mobile Virtual Network Operator (MVNO)Mobile Virtual Network Operators (MVNOs) are communications network operators that do not have their own radio communications networks (or the corresponding frequency usage rights) but operate essential network elements in the core network (Home Location Register “HLR”, Mobile Switching Centre “MSC”, etc.), possess corresponding addressing elements (e.g. Mobile Network Code) and administer SIM cards themselves. Thus, MVNOs are active as providers on the retail and wholesale markets. As they do not have their own radio communications networks, they have to rely on corresponding wholesale services of mobile network operators. Examples of MVNOs are Mass Response (Spusu) and UPC (UPC mobile).
Number portingNumber porting allows customers to retain their telephone numbers when they switch service providers. The RTR Telekom Monitor only includes the porting procedures/imports of telephone numbers carried out for an operator in one quarter, i.e. SIM cards in the case of mobile operators and subscriber numbers on the fixed network. Reverse portings (e.g. after cancellation by a subscriber) are not considered porting procedures. If the number of a subscriber is ported several times within a quarter (subsequent porting), this is counted separately each time.
Price index in mobile communicationsFor the calculation of the monthly prices for different user types RTR uses the tariff data published by the Austrian Chamber of Labour on a monthly basis. Only new tariffs avail-able in the respective month are considered because this allows immediate detection of changes in tariffs (price increases and reductions).
The details about minutes, text messages and data services used monthly by the respec-tive user types and about handset subsidies per tariff are supplied by the mobile opera-tors; with regard to information not provided, RTR makes every effort to estimate such information on the basis of available data. Average prices per month are calculated for four different user types. The medium user, high user and power user types also use data services; therefore, for these user types only so-called smartphone tariffs (with included data volume) are applied. The fourth user type, the so-called low user, exclusively relies on voice and text messaging services.
The user types were classified as follows: For each service (voice, text messaging, data) users were ranked according to the frequency of use and divided into four groups of equal size (quartiles). One quartile each represents one user type and the median of the respective quartile is used for the underlying number of used minutes, text messages and megabytes. The user type data are fed into the tariff data by means of the following procedure: The usage values of the previous year are used for the respective tariffs of the current year (e.g. usage in 2012 for calculation of the prices per tariff for 2013). It is determined which new tariffs available are the cheapest ones for the respective user type per brand. Apart from the monthly base fees and the included minutes, text messages and data volume, the following tariff components are reflected in the calculation: acti-vation charge, SIM/service flat fee, minimum revenue, where appropriate, as well as the price per minute, text message and megabyte beyond the included quantities and the handset subsidies (written off over 24 months).
An average price from the respective up to five most inexpensive tariffs per brand is calculated. The following brands are reflected: A1, T-Mobile, Drei, tele.ring, Yesss!, Bob, Ge.org, Red Bull Mobile, S-Budget, since Q1 2015 HoT, UPC, since Q2 2015 also VOLmobil, Wowww! and Spusu. Since Q3 2015 also tariffs of the Allianz SIM brand of ATK Telekom and Service GmbH have been reflected and since Q4 2015 also eety und Yoopi. From Q1 2017 onwards, also tariffs of Media Markt Mobil, Saturn Mobil, Krone mobile, Kurier mobil, LIWEST and Rapid Mobile are taken into account in the mobile communications price index. Subsequently, the price per brand is weighted with the brand’s market share.
The calculated price index is a linked index, where usage is adjusted regularly, in this case annually, similarly to the Consumer Price Index.

RTR Telekom Monitor | Annual Review 2016 |7 106
Average usage of the four user types used for the calculation is shown in the following table:
Residential customers – business customers“Business customers“ are all legal persons and corporations under public or private law, partnerships, registered companies and partnerships under the Civil Code [eingetragene Erwerbsgesellschaften, Gesellschaften bürgerlichen Rechts], as well as natural and legal persons who are entrepreneurs within the meaning of Art. 1 of the Austrian Consumer Protection Act, Federal Law Gazette 140/1979 as amended (including start-up activities within the meaning of Art. 1 Par. 3 leg. cit). In this context, business shall mean any orga-nisation that is intended to be permanent for the purposes of independent commercial activity, even though it may be a non-profit enterprise.
“Residential customers” are all customers not captured by the above definition.
For the distinction between residential customers and business customers all relevant information available shall be used.
Technical measurement (real minutes)Real minutes refer to the actual duration of calls made by customers. In contrast, billed call minutes indicate the number of minutes actually charged to those customers. The main factors accounting for the difference between these two figures are the number of free minutes included in the base fee, which carry considerably more weight in mobile networks than in the fixed network, and the billing increment.
2010
2011
2012
2013
2014
2015
2016
2010
2011
2012
2013
2014
2015
2016
2010
2011
2012
2013
2014
2015
2016
Power High Medium Low
550 240 120 20
530 250 120 20
510 240 100 20
500 230 110 20
471 208 93 19
469 210 94 21
450 198 91 23
229 33 5 1
243 42 7 1
260 46 7 1
168 42 9 1
104 28 6 1
90 23 6 1
66 17 5 1
136 9 2 0
417 36 3 0
932 134 2 0
1483 345 21 0
2093 632 60 0
2382 816 171 0
3440 1240 381 0
Minutes
Text messages
Data in megabytes
User type

RTR Telekom Monitor | Annual Review 2016 |7 107
Trunk segments and terminating segments (leased lines and Ethernet services)At the wholesale level a distinction is made between trunk segments and terminating segments. Trunk segments refer to leased lines or Ethernet services that normally do not extend to the user’s network termination point and link interconnection points in the 28 Austrian towns and cities where A1 Telekom Austria AG has set up network interconnection points to other telecommunications operators. In contrast, terminating segments refer to leased lines or Ethernet services at the wholesale level, which are not to be classified as trunk segments.
UnbundlingIn telecommunications, unbundling refers to the separate provision of specific services which were previously available only in conjunction with other services. For example, the unbundling of sub- scriber lines from fixed-network access offered by the incum-bent operator gives alternative service providers direct access to the customer without requiring the latter to install the “last mile“ them- selves, as they can lease the (naked) subscriber line from the incumbent at a regulated price. Unbundled network elements are made available if the regulatory authority has identified in a market analysis proce-dure that one company has significant market power and has imposed on it the obli-gation of granting access to its telecommunications network and unbundled elements thereof.
Virtual unbundlingAccording to an official TKK decision, A1 Telekom Austria AG is obliged to offer virtual unbundling in areas where it expands the fibre optic cable network (Next Generation Access - NGA). Virtual unbundling is a wholesale service that enables alternative provid-ers (as in the case of physical unbundling) to offer their own (broadband) products to end users.
Voice over Broadband (VoB)VoB are voice telephony services based on a broadband connection (stand-alone or bundled). VoB does not include Voice over Internet, where services are provided on the basis of the (public) Internet, but the Internet connection is provided by an independent third party (e.g. Skype).

RTR Telekom Monitor | Annual Review 2016 |7 108
Publishing information
Owner and publisher: Austrian Regulatory Authority for Broadcasting and Telecommunications (Rundfunk und Telekom Regulierungs-GmbH)
Mariahilfer Straße 77-79, A-1060 Vienna
Tel.: +43 1 58058-0, fax: +43 1 58058-9191, e-mail: [email protected], Internet: http://www.rtr.at
Responsible for content: Mag. Johannes Gungl (CEO Telecommunications and Postal Services), Austrian Regulatory Authority for Broadcasting and Telecommunications
Conceptual design and text: Austrian Regulatory Authority for Broadcasting and Telecommunications
Graphic design:garnitur – Gestaltung aller Art, www.garnitur.com
All parts of this publication are protected by copyright. All rights reserved under copy-right, especially rights to distribution, reprinting, translations, presentations, the use of illustrations and tables, broadcasting, microfilms or reproduction of this document in photocopies or any other form, as well as storage in computer systems, even in cases where excerpts are used.
Although the contributions to the RTR Telekom Monitor Annual Review 2016 were reviewed with the utmost care, it is not possible to rule out errors. Therefore, no guaran-tee of accuracy can be provided for this information.
Copyright Rundfunk und Telekom Regulierungs-GmbH 2017

RTR
Tele
kom
Mon
itor |
Jah
resb
eric
ht 2
016
Rund
funk
und
Tel
ekom
Reg
ulie
rung
s-Gm
bH
RTR TELEKOM MONITOR
2016
Rundfunk und Telekom Regulierungs-GmbHMariahilfer Straße 77–79, 1060 Vienna, Austria T: +43 1 58058-0, F: +43 1 58058-9191, [email protected] www.rtr.at
ANNUAL REVIEW