s cenar - europaagrilife.jrc.ec.europa.eu/documents/banse_meijl.pdf · scenar 2020 2020 policy...
TRANSCRIPT

SCENAR 2020
SCENAR 2020: The Implications for Land and
Labour Markets Study for DGAgri
Income and Factor Market Implications of the 2003 CAP Reform
Martin Banse & Hans van Meijl Agricultural Economics Research Institute
(LEI, The Hague)

SCENAR 2020 Scenar 2020 Objectives
• Identification of major future trends and driving factors (baseline 1990 – projections to 2020);
• Identification major perspectives and challenges for agriculture and rural regions until 2020;
• Development of a well defined and solid baseline scenario in order to identify policy effects (with two alternative scenarios);
• Regional SWOT analysis à ‘typical’ regional reactions to the 3 scenarios.
SCENAR 2020 2020 Policy Scenarios
• Baseline: continuation of trends in longterm drivers, and pursuing current policy objectives including conclusion of the Doha Round on the basis of the EU offer on November 2005
• Regionalisation: no Doha Round, therefore bilateral and multilateral negotiations and internal market encouragement
• Liberalisation: strong move towards open markets, and no more income support

SCENAR 2020
Methodological improvements: Linking a commodity with a sectoral
approach
CLUEs Grid
No model available: Downscaling
CAPRI NUTS II
LEITAP ESIM EU/national
LEITAPIMAGE Global
Rest of economy Agricultural

SCENAR 2020
L _
L HORT
L pasture
L FCP
CET
σ1
L wheat L coarse grains L oilseeds
CET σ3
L sugar L COP
σ2 L OCR L NAG
Land allocation based on PEM from OECD

SCENAR 2020 Land supply curve
Agricultural Land
Average Agricultural Rental Rate
L 1
L 2
L 1 *
L 2 *

SCENAR 2020 Labour and capital market
• Wage differentials between agriculture and nonagriculture can be maintained through limited offfarm migration (e.g. De Janvry)
• Returns to assets invested in agriculture also tend to diverge from ROI in other activities
• Modelled: segmentation of the labour and capital market between agriculture and non agriculture – The elasticities of transformation are calibrated to fit estimates of the elasticity of labour supply from OECD (2001).

SCENAR 2020
Population, GDP, GDP per capita annual growth rates 20052020 = market context
1
0
1
2
3
4
5
6
7
EU15 EU10 EU25 EU_3 HDC C&S Amer
Asia Africa
POP GDP GDP per capita

SCENAR 2020
World trade growth à potential markets: yearly growth rates 20052020
0
1
2
3
4
5
6
7
8
grain oils hort crops cattle oap dairy sugar agro ind ser
Base Regionalisation Liberalisation

SCENAR 2020
Sectoral structure of the economy: EU25 2005 & 2020
0%
10%
20%
30%
40%
50%
60%
70%
80%
Crops Livestock Food Proc. Agric. + Food Proc.
Industry Services
Baseline, 2005 Baseline, 2020

SCENAR 2020
Share of Agriculture and Food Processing in GVA: EU15 & EU10, 2005 & 2020
0%
2%
4%
6%
8%
10%
12%
14%
16%
Crops Livestock Food Proc. Agric. + Food Proc.
EU15 Baseline, 2005 EU15 Baseline, 2020 EU10 Baseline, 2005 EU10 Baseline, 2020

SCENAR 2020
Ongoing structural change in the EU economy leads to adjustments of agricultural labour force
Sectoral employment growth, EU15 2005à2020
15
10
5
0
5
10
Baseline Regionalisation Liberalisation
Protected Other primary TotAgri Industries Services

SCENAR 2020
… particularly in the new Member States Sectoral employment growth, EU10 2005à2020
40
35
30
25
20
15
10
5
0
5
10
Baseline Regionalisation Liberalisation
Protected Other primary TotAgri Industries Services

SCENAR 2020
The land market will have an important buffer function easing the adjustment of production …
Development real factor prices, EU15 2005à2020
30
20
10
0
10
20
30
40
Land Unskilled labour Skilled labour Capital
Base Regionalisation Liberalisation

SCENAR 2020
… but the dynamics are different in the new Member States
Development real factor prices, EU10 2005à2020
0
10
20
30
40
50
60
70
Land Unskilled labour Skilled labour Capital
Base Regionalisation Liberalisation

SCENAR 2020
Development agricultural and non agricultural wages in baseline scenario in
EU15 (market prices, 20052020).
0
5
10
15
20
25
30
35
Baseline agriculture Baseline non agriculture
Unskilled labour Skilled labour

SCENAR 2020
Real wages: sensitivity analysis (50% band) on the elasticity of transformation between agricultural and nonagricultural labour
4.9 4.6 Standard Dev.
3.5 2.7 Mean 4.6 3.8 Simulation result Agriculture
0.3 0.3 Standard Dev.
23.3 21.3 Mean 23.2 21.2 Simulation result
Non agriculture
Skilled labour
Unskilled labour EU15
Interval for unskilled labour ranges from 6.5% to 11.9%.
SCENAR 2020
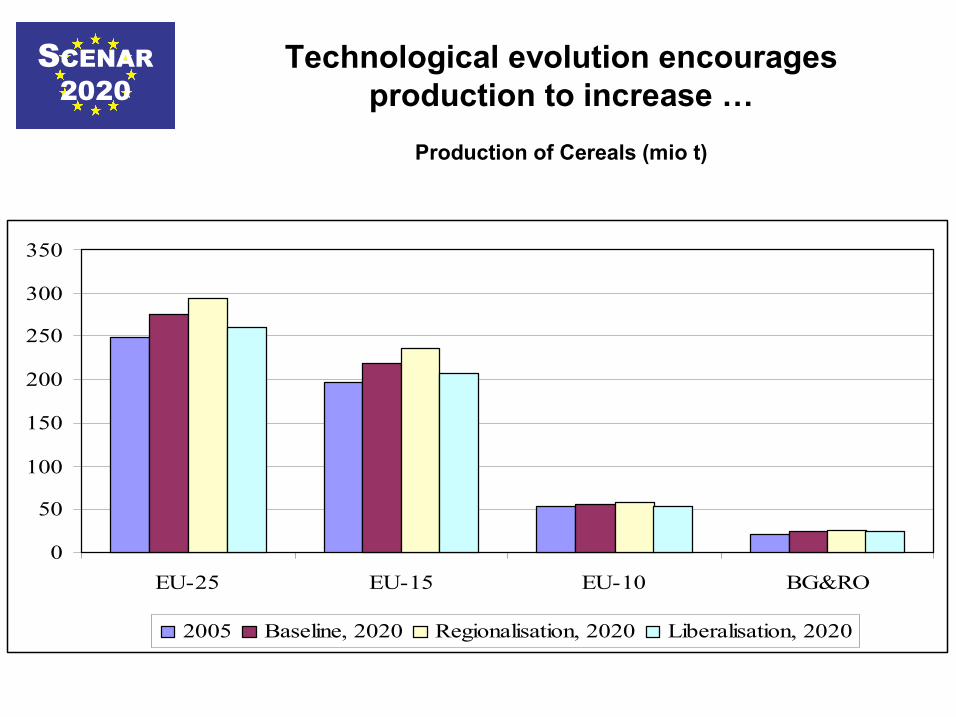
Technological evolution encourages production to increase …
Production of Cereals (mio t)
0
50
100
150
200
250
300
350
EU25 EU15 EU10 BG&RO
2005 Baseline, 2020 Regionalisation, 2020 Liberalisation, 2020
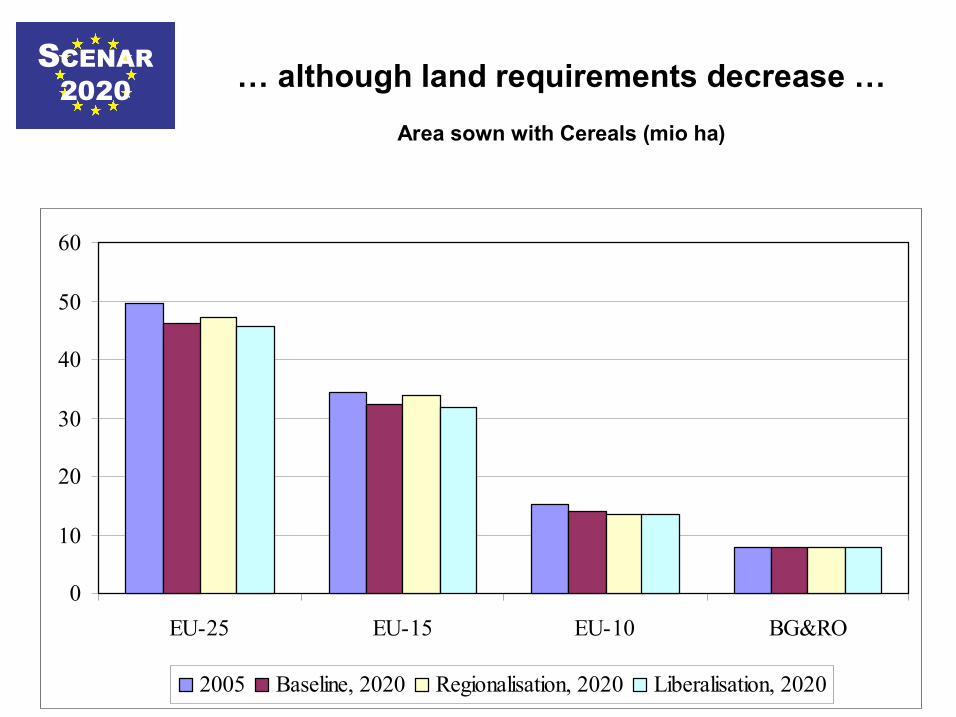
SCENAR 2020 … although land requirements decrease …
Area sown with Cereals (mio ha)
0
10
20
30
40
50
60
EU25 EU15 EU10 BG&RO
2005 Baseline, 2020 Regionalisation, 2020 Liberalisation, 2020
SCENAR 2020
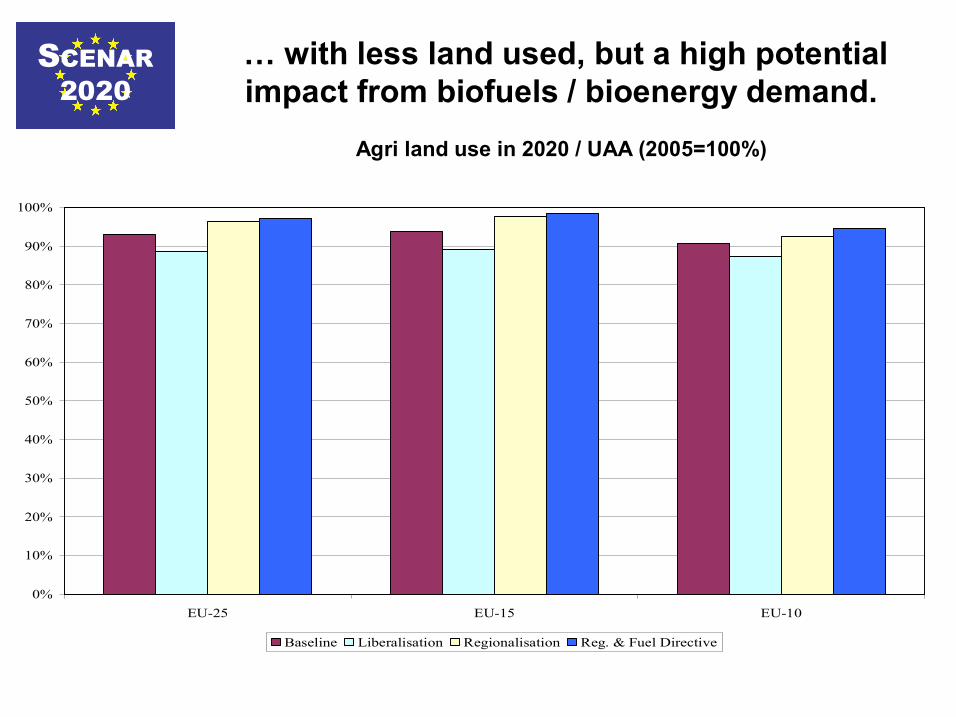
… with less land used, but a high potential impact from biofuels / bioenergy demand.
Agri land use in 2020 / UAA (2005=100%)
0%
10%
20%
30%
40%
50%
60%
70%
80%
90%
100%
EU25 EU15 EU10
Baseline Liberalisation Regionalisation Reg. & Fuel Directive
SCENAR 2020
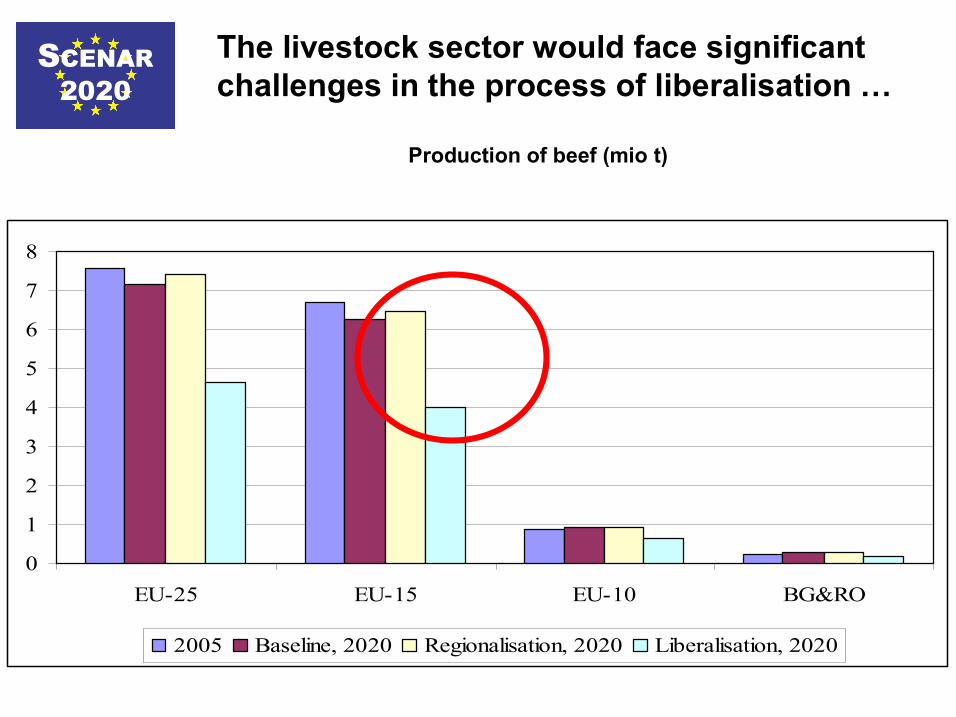
The livestock sector would face significant challenges in the process of liberalisation …
Production of beef (mio t)
0
1
2
3
4
5
6
7
8
EU25 EU15 EU10 BG&RO
2005 Baseline, 2020 Regionalisation, 2020 Liberalisation, 2020

SCENAR 2020
… while some (high value added) sectors would benefit from a process of liberalisation
Production of cheese (mio t)
0 1 2 3 4 5 6 7 8 9 10
EU25 EU15 EU10 BG&RO
2005 Baseline, 2020 Regionalisation, 2020 Liberalisation, 2020

SCENAR 2020
Projecting the evolution of real prices: 2020 relative to 2002 (100%)
0 10 20 30 40 50 60 70 80 90 100
Cereals
Oilseeds
Other arable
Veg & perm
Beef
Pork
Sheep
Poultry
Milk
Butter
Cheese
Olive oil
2020 (Base) 2020 (Reg) 2020 (Lib)

SCENAR 2020 Agri income 2020, relative to baseline
10 to > 5 to 10 0 to 5 25 to 0 50 to 25 75 to 50 < to 75
EU25 EU15
UK
Sweden
EU10 Finland
Ireland
Malta Italy
Cyprus Greece
Slovak Rep. Spain
Slovenia Portugal
Poland France
Latvia Netherlands
Lithuania Austria
Hungary Germany
Estonia Denmark
Czech Rep. Belgium
Liberalisation Regionalisation Liberalisation Regionalisation

SCENAR 2020
Changes in farm income / ha: Regionalisation vs. Baseline
Change in Income per ha, Regionalisation vs. Baseline less than +5% +5% to +10% more than +10% not displayed

SCENAR 2020
Changes in farm income / ha: Liberalisation vs. Baseline
Change in Income per ha, Liberalisation vs. Baseline 60% and more 60% to 55% 55% to 40% 40% 20% 20% 10% 10 and less

SCENAR 2020
Trend and policy effects: number of farms 2003 / 2020
47.1 29.1 25.4 5.3 7.5 10.0 Total
49.1 39.9 15.3 0.6 1.0 1.2 Other livestock and crop farms
90.3 18.8 88.1 0.1 0.1 0.8 Mixed crop farms
75.2 30.4 64.4 0.2 0.2 0.7 Mixed livestock farms
101.3 15.5 74.3 0.7 0.6 0.4 Other animals
62.2 53.0 19.6 0.7 1.5 1.8 Cattle activities
25.4 19.1 7.9 2.1 2.6 2.8 Vegetables and
permanent crops
59.6 35.4 37.4 0.9 1.4 2.3 Arable crops
Liberalisation vs. 2003
Liberalisation vs. baseline
Baseline vs. 2003 Liberalisation Baseline
Difference (%) 2020 2003 Subsector

SCENAR 2020
Longterm change in number of farms: baseline, 20032020 (%/yr)
Baseline, 2020vs. 2001 more than 10% 10%to 5% 5% to 0% 0%to 5% more than5%

SCENAR 2020
Changes in number of farms: Liberalisation scenario, 20032020 (%/yr)
Liberalisation, 2020vs. 2001 more than 10% 10%to 5% 5% to 0% 0%to 5% more than 5%
SCENAR 2020
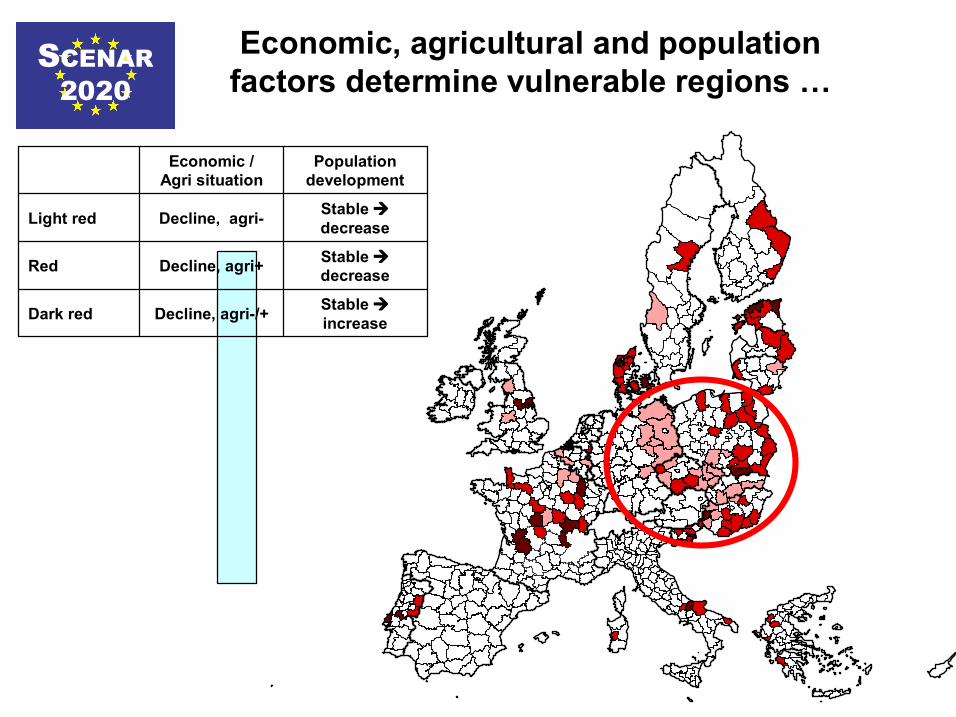
Stable à increase Decline, agri/+ Dark red
Stable à decrease Decline, agri+ Red
Stable à decrease Decline, agri Light red
Population development
Economic / Agri situation
Economic, agricultural and population factors determine vulnerable regions …
SCENAR 2020
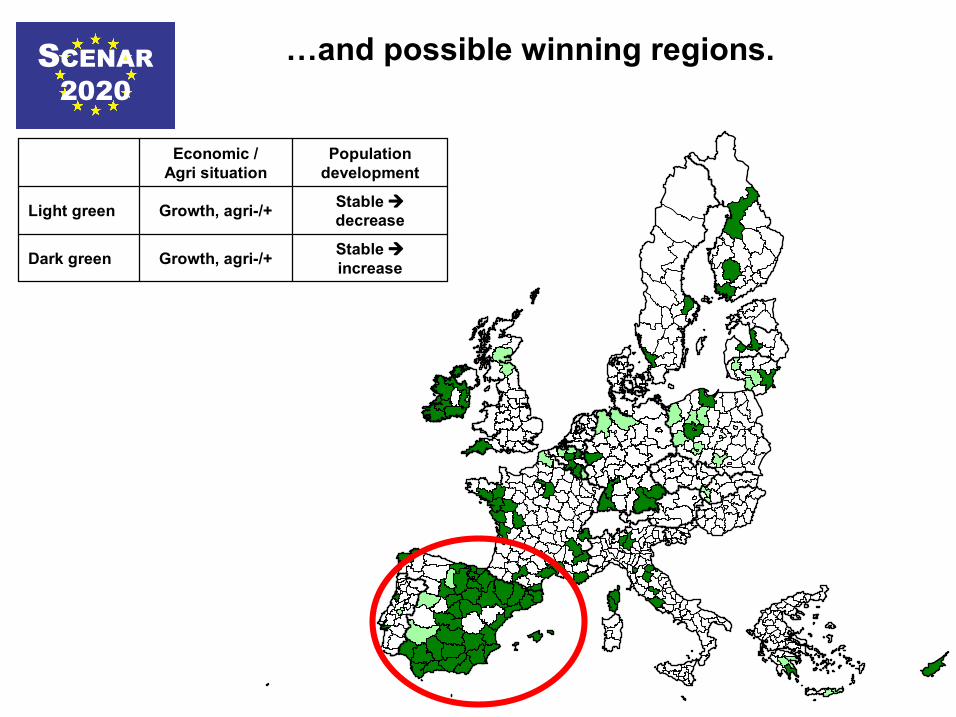
Stable à increase Growth, agri/+ Dark green
Stable à decrease Growth, agri/+ Light green
Population development
Economic / Agri situation
…and possible winning regions.

SCENAR 2020
oilseeds + granivores
oilseeds + cereal +
arable crops + cereal +
Liberalisation Regionalisation
Agri production (ex: cereals and oilseeds) varies according to contrasting scenarios

SCENAR 2020
Challenges for agriculture as identified by the study
• Structural change process in agriculture is a longterm driver that continues with or without policy changes
• EU is facing an increasing diversity of structure and structural adjustment – Livestock sector faces important challenges and restructuring
• Alternative policy settings may not produce very different effects on the overall production but on income and farm structure – However, the regional impact may prove to be more significant
• Functioning of factor markets is crucial for adjustment process: – Segmented factor markets and the fixed factor land absorb part of the
negative impact of lower prices on production – Keeping production up, but at lower wages and land rents
• Impact of liberalization: – ò Agricultural income > ò agricultural production and land use – Reduction of border support and export refunds has a higher impact
on production than does a reduction of direct payments – Reduction of direct payments has a higher impact on agricultural
income than on agricultural production
SCENAR 2020