sailing in a world of volatility and uncertainty · global boxboard market review ... • worked in...
TRANSCRIPT

© Copyright 2018 RISI, Inc. | Proprietary Information
Global Boxboard Market ReviewSailing In A World Of Volatility And Uncertainty
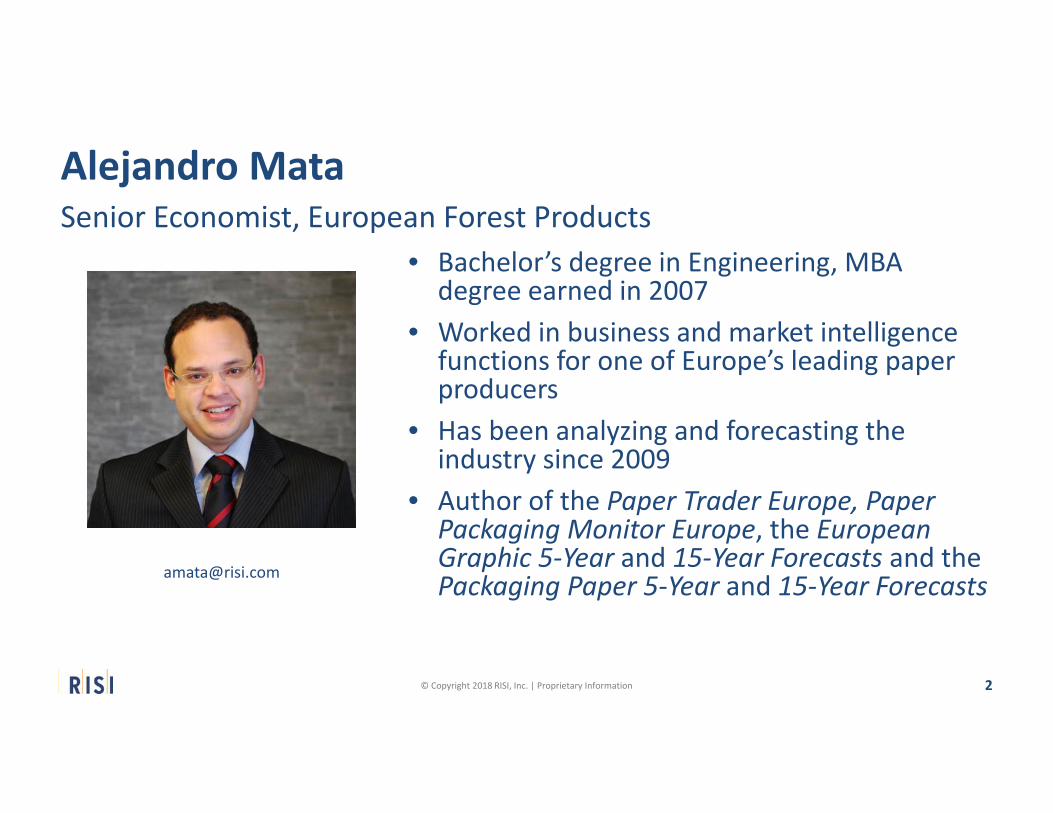
Alejandro MataSenior Economist, European Forest Products
European ConferenceMarch 2018
2
• Bachelor’s degree in Engineering, MBA degree earned in 2007
• Worked in business and market intelligence functions for one of Europe’s leading paper producers
• Has been analyzing and forecasting the industry since 2009
• Author of the Paper Trader Europe, Paper Packaging Monitor Europe, the European Graphic 5‐Year and 15‐Year Forecasts and the Packaging Paper 5‐Year and 15‐Year Forecasts
Senior Economist, European Forest ProductsAlejandro Mata
© Copyright 2018 RISI, Inc. | Proprietary Information
3© Copyright 2018 RISI, Inc. | Proprietary Information
Economic Tailwind Boosting Demand

4
…But What If the Wind Changes?© Copyright 2018 RISI, Inc. | Proprietary Information
Boxboa
rd Dem
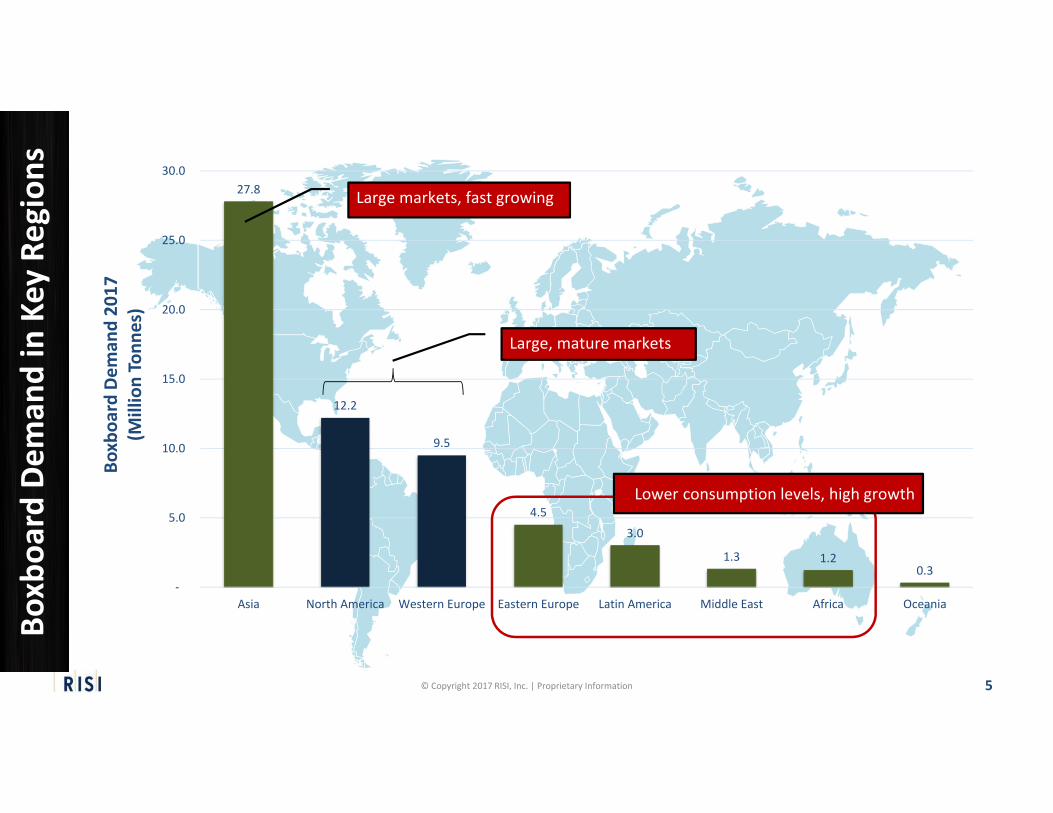
and in Key Regions
5© Copyright 2017 RISI, Inc. | Proprietary Information
27.8
12.2
9.5
4.5
3.0
1.3 1.20.3
‐
5.0
10.0
15.0
20.0
25.0
30.0
Asia North America Western Europe Eastern Europe Latin America Middle East Africa Oceania
Boxboa
rd Dem
and 20
17(M
illion Tonn
es)
Large markets, fast growing
Large, mature markets
Lower consumption levels, high growth

6© Copyright 2017 RISI, Inc. | Proprietary Information
‐4%
‐2%
0%
2%
4%
6%
8%
10%
‐2.0
‐1.0
0.0
1.0
2.0
3.0
4.0
5.0
Global Boxboard Demand GrowthMillion Tonnes
Demand Change % Change
Synchronized global growth
Still below pre‐crisis despite synchronized global economic growth
Other packaging material substitutes
Change in consumption patterns

7© Copyright 2017 RISI, Inc. | Proprietary Information

8© Copyright 2017 RISI, Inc. | Proprietary Information
7.4% 8.7% 10.0%11.5%
13.0%14.6%
25.5%23.7% 22.8% 21.6%
19.5% 18.7%
0%
5%
10%
15%
20%
25%
30%
35%
40%
45%
50%
0
5
10
15
20
25
30
2015 2016 2017 2018 2019 2020
Trillion USD
Traditional E‐commerce % of Total Growth
Speed of growth slowing down as e‐commerce slowly becomes mainstream
Asia‐Pacific will remain the world’s largest retail e‐commerce market
Growth fueled by:• Expanding middle class
• Greater mobile and internet penetration
• Growing competition
• Improving logistics and infrastructure

9© Copyright 2017 RISI, Inc. | Proprietary Information

10© Copyright 2017 RISI, Inc. | Proprietary Information
Plastics SubstitutionPlastics
Substitution

11© Copyright 2017 RISI, Inc. | Proprietary Information
Offers better visual properties and personalization??
Are cheaper to produce and buy??
More environmental friendly than boxes??
They will stay for a few more years, perhaps a
couple of decades, before pouch bags replace them as the sole medium to
package cereals
0
50
100
150
200
250
300
2000 2002 2004 2006 2008 2010 2012 2014 2016
European IPEX Brent Spot (FOB), USD/Barrel GC2 GD2
According to Pouch Manufacturers

12© Copyright 2017 RISI, Inc. | Proprietary Information
Oil prices are keeping plastic prices low More competitive vs fiber packaging Making new plastic has become less
expensive than recycling
Low Oil Price Is Reducing Recycling Rate Of PlasticsPlastics Recycling Rate VS Oil Prices
13© Copyright 2018 RISI, Inc. | Proprietary Information
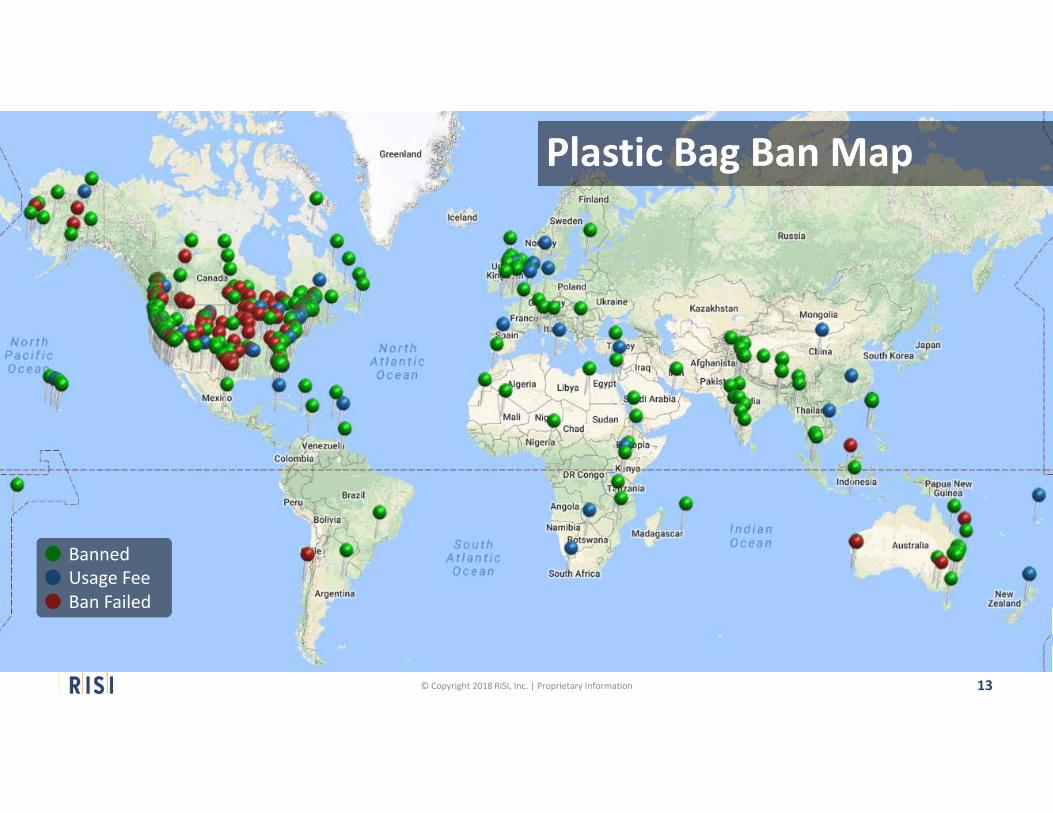
Map of countries banning plastics
Plastic Bag Ban Map
BannedUsage FeeBan Failed

14© Copyright 2018 RISI, Inc. | Proprietary Information

15© Copyright 2017 RISI, Inc. | Proprietary Information
78%
80%
82%
84%
86%
88%
90%
-2.0
-1.0
0.0
1.0
2.0
3.0
4.0
5.0
2000
2001
2002
2003
2004
2005
2006
2007
2008
2009
2010
2011
2012
2013
2014
2015
2016
2017
2018
2019
2020
Ope
ratin
g R
ate
Gro
wth
in M
illio
n To
nnes
Demand Capacity Operating Rate Overinvestment dominated the industry between 2005 and 2014
Investment has cooled down since 2014
Operating rates on the rise. However still below 90%
70%
75%
80%
85%
90%
95%
100%
2000 2002 2004 2006 2008 2010 2012 2014 2016 2018 2020
North America Western Europe Asia
Asia still the region with the lowest operating rates

16© Copyright 2018 RISI, Inc. | Proprietary Information
0.0
0.1
0.2
0.3
0.4
0.5
0.6
CHAN
GE (M
ILLION TONNES)
‐0.3
‐0.2
‐0.1
0.0
0.1
0.2
0.3
0.4
CHAN
GE (M
ILLION TONNES)
Economic growth engine changing to consumption
Restrictions on fiber side will also slowdown investment
European industry, on the other hand, is investing more than before
Higher exports have been a key to allow for higher investment in the region

17© Copyright 2018 RISI, Inc. | Proprietary Information
68.0%
70.0%
72.0%
74.0%
76.0%
78.0%
80.0%
82.0%
84.0%
86.0%
88.0%
‐1,000
‐500
0
500
1,000
1,500
2,000
2,500
3,000
2012 2013 2014 2015 2016 2017 2018 2019 2020
Chinnese Supply & Demand Growth
Demand Capacity OR
Economic transformation continues
Consumption of Paper and Board still constrained
Investment has decelerated
Ongoing environmental issues sparkling fiber crisis
ASI
A

18© Copyright 2017 RISI, Inc. | Proprietary Information
Remember This?
USA+19
China
-28.5 WE+3
UK+5
EE+1
Japan+4
Oceania+2
Middle East+1
Other Asia-7
China is the largest buyer of PfR in the World

19© Copyright 2017 RISI, Inc. | Proprietary Information
China Banning Imports of Mixed Papers
ONP, 5.2
MIX, 5.7
HGR, 0.9
OCC, 16.7
2016: 28.5 Million Tonnes
Increase volatility in PfR prices, therefore costs most likely to remain high
Consequences
Production to suffer due to lack of fibers and high costs – lower margins for producers
China will import more finished paper products to compensate

20© Copyright 2017 RISI, Inc. | Proprietary Information
China Banning Imports of Mixed Papers
How to compensate for the missing fiber?
Increase domestic collection?
More market pulp?
Imports of finished paper products?
Diverting fiber away from low margin Paper & Board grades (graphics) ?
21© Copyright 2017 RISI, Inc. | Proprietary Information
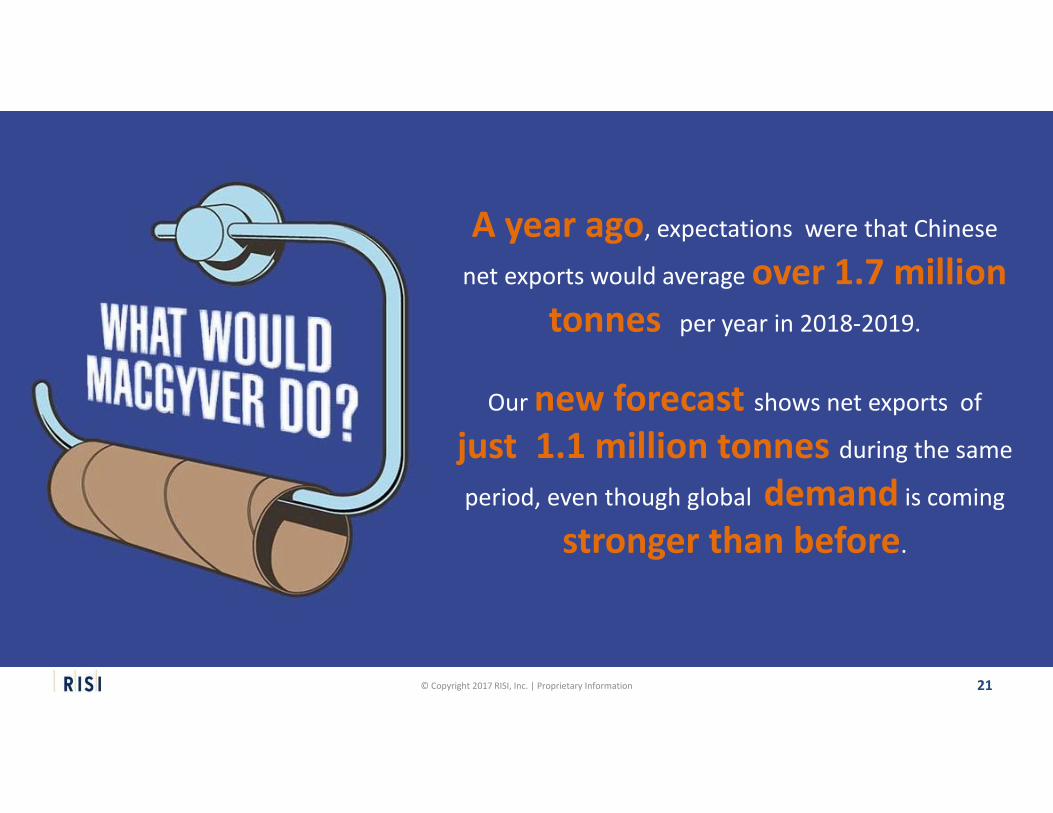
A year ago, expectations were that Chinese net exports would average over 1.7 million
tonnes per year in 2018‐2019.
Our new forecast shows net exports of just 1.1 million tonnes during the same
period, even though global demand is coming
stronger than before.
22© Copyright 2017 RISI, Inc. | Proprietary Information
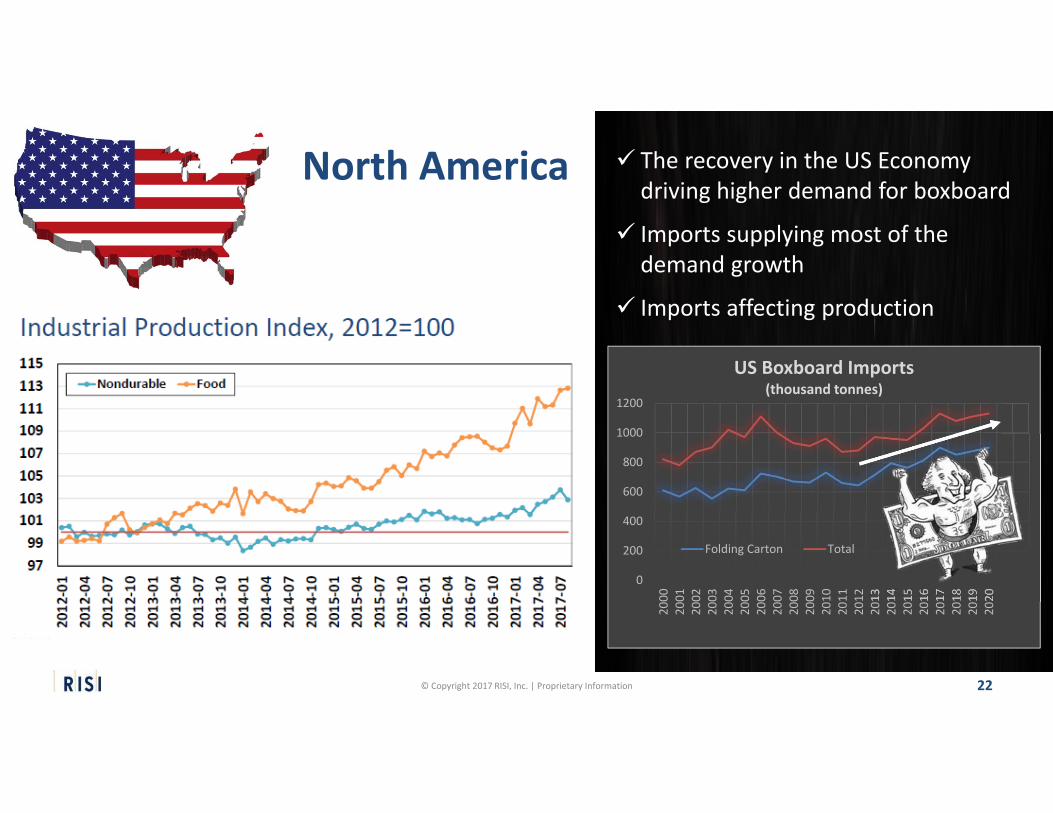
North America The recovery in the US Economy driving higher demand for boxboard
Imports supplying most of the demand growth
Imports affecting production
0
200
400
600
800
1000
1200
2000
2001
2002
2003
2004
2005
2006
2007
2008
2009
2010
2011
2012
2013
2014
2015
2016
2017
2018
2019
2020
US Boxboard Imports (thousand tonnes)
Folding Carton Total

23© Copyright 2017 RISI, Inc. | Proprietary Information
300
400
500
600
700
800
900
2013 2014 2015 2016 2017
Global Recycled Cartonboard Prices(Euros per Tonne)
Europe USA China
In the USA:
Strengthening of the USD since 2014
The US has become an interesting destination for exporters
In Europe:
Prices steady for most of the period
Lack of improvement in market balances
In Asia:
Also changing due exchange rates in 2015, latest increases due to PfRprice volatility

24© Copyright 2017 RISI, Inc. | Proprietary Information
Virgin M
arkets Doing
Better
Challenging Co
ndition
s On Th
e CR
B Market Demand not strong enough due to:
Changing in people’s buying behaviour (less processed food buying)
Fiercer threat from plastics
Imports rising rapidly: Most of the imports from Europe and Asia
fall within recycled cartonboard in the USA
Capacity fell nearly 11% in 2017
Demand doing better. Growth in liquid packaging board, cupstock)
Producers benefiting from food service market (cups, takeout containers)
Imports not impacting virgin boxboard markets much
Capacity rising slowly

25© Copyright 2018 RISI, Inc. | Proprietary Information
86.0%
87.0%
88.0%
89.0%
90.0%
91.0%
92.0%
93.0%
94.0%
‐300
‐200
‐100
0
100
200
300
400
500
600
2012 2013 2014 2015 2016 2017 2018 2019 2020
Supply & Demand Growth
Demand Capacity OR
Economic recovery underway, but uncertainties persist
Virgin grades account for roughly 60% of the market
Biggest challenge Europe is facing is uncertainty
Exports expected to increase
EUR
OPE

26© Copyright 2018 RISI, Inc. | Proprietary Information
• More dining out
Europeans Consuming More
• At home…
‐6.0%
‐5.0%
‐4.0%
‐3.0%
‐2.0%
‐1.0%
0.0%
1.0%
2.0%
3.0%
4.0%
YEAR
LY PER
CENTAGE CH
ANGE
Total Food Restaurants
Household Consumption

27© Copyright 2018 RISI, Inc. | Proprietary Information
‐50
‐40
‐30
‐20
‐10
0
10
20
30
40
50
Mar‐08
Aug‐08
Jan‐09
Jun‐09
Nov
‐09
Apr‐10
Sep‐10
Feb‐11
Jul‐1
1De
c‐11
May‐12
Oct‐12
Mar‐13
Aug‐13
Jan‐14
Jun‐14
Nov
‐14
Apr‐15
Sep‐15
Feb‐16
Jul‐1
6De
c‐16
May‐17
Production in the EU Manufacturing Industry
• Still, pharma is leading the recovery
• Pharma did not even declined after the Great Recession
• Pharma is more associated with virgin boxboard grades
Pharma
Automotive
Food & Drinks
Manufacturing
Machinery & Equipment
Percentage change relative to the first quarter of 2008Source: Eurostat
28© Copyright 2018 RISI, Inc. | Proprietary Information
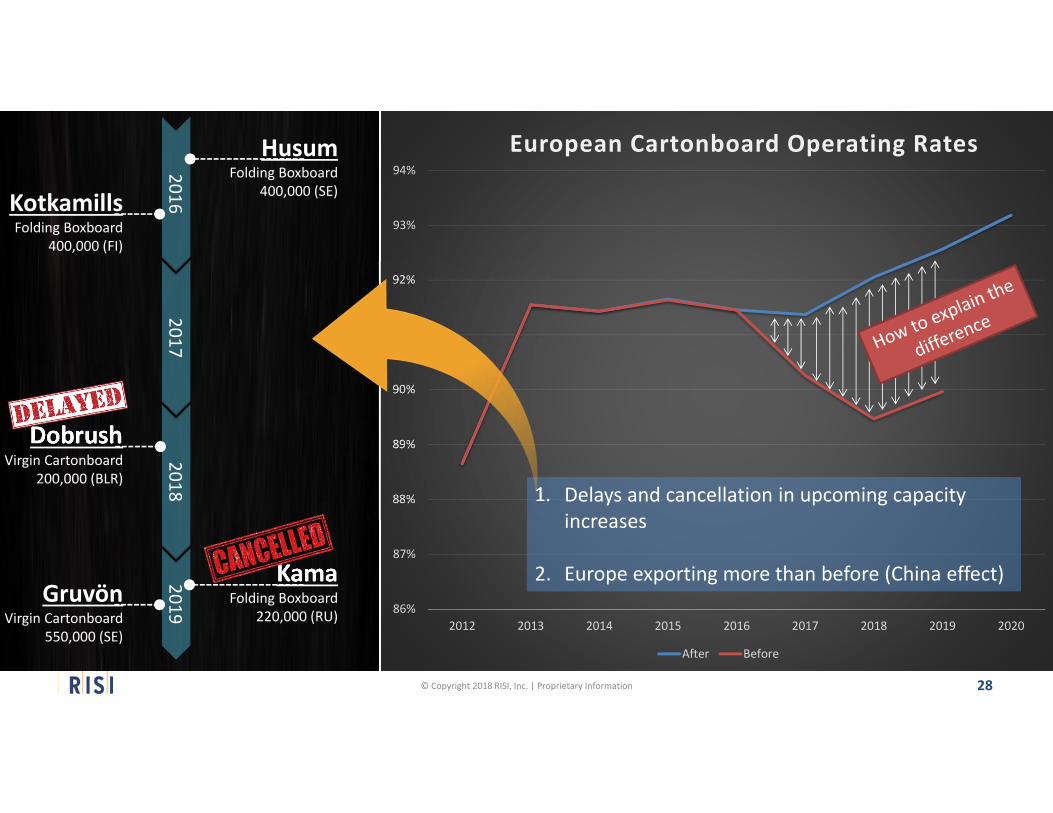
20162017
20182019
KotkamillsFolding Boxboard
400,000 (FI)
HusumFolding Boxboard
400,000 (SE)
DobrushVirgin Cartonboard
200,000 (BLR)
KamaFolding Boxboard
220,000 (RU)Gruvön
Virgin Cartonboard550,000 (SE)
86%
87%
88%
89%
90%
91%
92%
93%
94%
2012 2013 2014 2015 2016 2017 2018 2019 2020
European Cartonboard Operating Rates
After Before
1. Delays and cancellation in upcoming capacity increases
2. Europe exporting more than before (China effect)

29© Copyright 2017 RISI, Inc. | Proprietary Information
China Fiber Ban Pushing Exports
‐2
‐1
0
1
2
3
4
5
2008 2009 2010 2011 2012 2013 2014 2015 2016 2017 2018 2019 2020
NET
EXP
ORT
S, M
ILLION TONNES
W. Europe E. Europe

Asian Prices Rising The Most in 2017
30© Copyright 2017 RISI, Inc. | Proprietary Information
600
650
700
750
800
850
900
950
1000
1050
1100
2013 2014 2015 2016 2017
Virgin Cartonboard(Euros per Tonne)
Europe USA China
Strengthening of the USD
Higher market pulp prices
350370390410430450470490510530550
‐
2
4
6
8
10
12
14
16
Latin America North America Europe Asia
Million Tonn
es
Europe exporting more to the United States
Exporting to Asia has become more interesting than before due to rising Asian prices in 2017
Europe remains one of the lowest cost regions to produce virgin boxboard

31© Copyright 2017 RISI, Inc. | Proprietary Information
Questions?

32
Asian Graphic Paper 5‐Year Forecastwww.risi.com/forecasts
Asian Pulp and Paper Monitorwww.risi.com/appm
Thank you!For more information:
© Copyright 2018 RISI, Inc. | Proprietary Information