sam rayburn reservoir - texas...management history: the black bass fishery is the most popular at...
TRANSCRIPT

Sam Rayburn Reservoir 2018 Fisheries Management Survey Report
PERFORMANCE REPORT
As Required by
FEDERAL AID IN SPORT FISH RESTORATION ACT
TEXAS
FEDERAL AID PROJECT F-221-M-3
INLAND FISHERIES DIVISION MONITORING AND MANAGEMENT PROGRAM
Prepared by:
Todd Driscoll, District Management Supervisor and
Dan Ashe, Assistant District Management Supervisor
Inland Fisheries Division Jasper District, Brookeland, Texas
Carter Smith Executive Director
Craig Bonds Director, Inland Fisheries
July 31, 2019

i
Contents
Survey and Management Summary ............................................................................................................. 1
Introduction.................................................................................................................................................... 2
Reservoir Description ................................................................................................................................ 2 Angler Access ............................................................................................................................................ 2 Management History ................................................................................................................................. 2
Methods......................................................................................................................................................... 4
Results and Discussion ................................................................................................................................. 4
Fisheries Management Plan for Sam Rayburn Reservoir, Texas................................................................. 7
Objective-Based Sampling Plan and Schedule (2019–2023) ....................................................................... 9
Literature Cited ............................................................................................................................................ 11
Tables and Figures ..................................................................................................................................... 12
Water Level ............................................................................................................................................. 12 Reservoir Characteristics ........................................................................................................................ 12 Boat Ramp Characteristics ...................................................................................................................... 13 Harvest Regulations ................................................................................................................................ 15 Stocking History ....................................................................................................................................... 16 Objective-based Sampling Plan for 2018-2019 ....................................................................................... 19 Aerial Survey of Prevalent Vegetation ..................................................................................................... 20 Percent Directed Angler Effort per Species............................................................................................. 20 Total Fishing Effort and Fishing Expenditures......................................................................................... 20 Gizzard Shad ........................................................................................................................................... 21 Bluegill ..................................................................................................................................................... 22 Blue Catfish ............................................................................................................................................. 24 Channel Catfish ....................................................................................................................................... 25 White Bass............................................................................................................................................... 27 Spotted Bass ........................................................................................................................................... 29 Largemouth Bass .................................................................................................................................... 30 Crappie .................................................................................................................................................... 33 Proposed Sampling Schedule ................................................................................................................. 34
APPENDIX A – Catch rates for all species from all gear types .................................................................. 35
APPENDIX B – Map of sampling locations ................................................................................................. 36
APPENDIX C – Creel ZIP code data .......................................................................................................... 38
APPENDIX D - Black bass tournament results ........................................................................................... 39

1
Survey and Management Summary Fish populations in Sam Rayburn Reservoir were surveyed in 2018 using electrofishing and in 2019 using gill netting. Anglers were surveyed from June 2018 through May 2019 with a creel survey. Historical data are presented with the 2018-2019 data for comparison. This report summarizes the results of the surveys and contains a management plan for the reservoir.
Reservoir Description: Sam Rayburn Reservoir is an 111,422-acre impoundment of the Angelina River in Angelina, Jasper, Nacogdoches, Sabine, San Augustine, and Tyler counties in southeast Texas. Water level fluctuations average 6 to 7 feet annually. Aquatic habitat consists of aquatic vegetation (primarily hydrilla and American lotus) and standing timber.
Management History: The black bass fishery is the most popular at Sam Rayburn Reservoir (70 - 80% of annual angling effort, which includes over 400 bass tournaments per year). Approximately 10 - 15% of anglers target crappie and 5 - 10% target catfish. Angler interest in more restrictive length limits for Largemouth Bass and potential biological and economic impacts of bass tournaments prompted research from 2004 - 2009. Results indicated that the proportion of the Largemouth Bass population harvested was relatively low (9%) and more restrictive length limits would provide little benefit. In addition, impacts of tournaments on the Largemouth Bass population were low (only 5% of population retained by tournament anglers) but tournament expenditures were high (66% of total). Florida Largemouth Bass (FLMB) have been stocked annually since 1994 to increase abundance of large bass (>8 pounds). Giant salvinia was found in the reservoir in 2008, and is now present in a majority of creeks and embayments. Coverage exceeded 4,000 acres in 2014, but aggressive herbicide treatments along with high inflows and flushing have reduced abundance to < 2,000 acres.
Fish Community
• Prey species: Gizzard Shad, Threadfin Shad, and Bluegill were the most abundant prey species and provided ample forage for sport fish.
• Catfishes: The relative abundance of Blue Catfish was stable compared to previous years, but Channel Catfish numbers declined. Angler catch rates averaged 2.7 fish/hour. Blue and Flathead Catfish provided trophy opportunities for anglers.
• Temperate basses: Historically, White Bass abundance has been low. Gill net catch rates ranged from 0.5 to 1.6 fish/nn over the last three sample years. Yellow Bass were present in moderate numbers. Few anglers target temperate bass.
• Black basses: Few Spotted Bass were sampled with electrofishing. Largemouth Bass abundance was relatively high (> 174 fish/hour) but varied over the last three sampling years. Size structure and fish condition were favorable and stable. The black bass fishery was most popular (81% of anglers targeted bass) and angler catch rate was high (1.3/hour).
• Crappie: White and Black Crappie were present in the reservoir. Angler catch (2.9/hour) reflected an abundant crappie population.
Management Strategies: Continue to manage Largemouth Bass harvest with a 14-inch minimum length limit. Collect angler catch of trophy Largemouth Bass via the tournament-monitoring program and creel surveys to justify Florida Largemouth Bass stockings. Request annual stockings of Florida Largemouth Bass to maximize trophy fish abundance. Maintain information signs, conduct annual aerial vegetation surveys, and apply herbicides when appropriate to minimize impacts of giant salvinia. Continue to promote fish handling procedures that minimize tournament-related mortality to minimize impacts on Largemouth Bass population and reduce conflicts with non-tournament anglers. Publish monthly articles in the Lakecaster magazine to inform angling public regarding TPWD activities.

2
Introduction This document is a summary of fisheries data collected from Sam Rayburn Reservoir from June 2018 through May 2019. The purpose of the document is to provide fisheries information and make management recommendations to protect and improve the sport fishery. While information on other fishes was collected, this report deals primarily with major sport fishes and important prey species. Historical data are presented with the 2018-2019 data for comparison.
Reservoir Description Sam Rayburn Reservoir is an impoundment of the Angelina River in Angelina, Jasper, Nacogdoches, Sabine, San Augustine, and Tyler counties in southeast Texas. The U.S. Army Corps of Engineers (USACE) constructed the reservoir in 1966 for flood control, generation of hydroelectric power, and for municipal, industrial, agricultural, and recreational uses. At conservation pool, Sam Rayburn Reservoir is 111,422 surface acres, has a shoreline length of 750 miles, and a mean depth of 20 feet. Water level fluctuations average 6 to 7 feet annually but can exceed 10 feet during years of heavy rainfall or drought (Figure 1). The reservoir was eutrophic with a mean Trophic State Index chl-a of 47.1 (Texas Commission of Environmental Quality 2018). Habitat at time of sampling consisted of aquatic vegetation (primarily hydrilla and American lotus) and standing timber. Most of the land around the reservoir is used for timber production and agriculture. Other descriptive characteristics for Sam Rayburn Reservoir are in Table 1. The Texas Department of State Health Services (TDSHS) has a fish consumption advisory in effect due to dioxins and mercury. Species affected include Smallmouth Buffalo, gar, Blue and Flathead Catfish, and Spotted and Largemouth Bass (TDSHS 2013).
Angler Access Sam Rayburn Reservoir has 22 public boat ramps. Additional boat ramp characteristics are in Table 2. Shoreline access is limited to public boat ramp areas.
Management History Previous management strategies and actions: Management strategies and actions from the previous survey report (Driscoll and Ashe 2015) included:
1. Stock FLMB annually (> 500,000 fingerlings) to maintain and improve the trophy Largemouth Bass population.
Action: Since 2015, FLMB were stocked every year.
2. Conduct biennial electrofishing and creel surveys to monitor status of Largemouth Bass population and examine growth every four years.
Action: Electrofishing surveys were conducted in 2016 and 2018, and a creel survey was conducted in 2018/2019. Growth was examined in 2018.
3. Continue black bass tournament-monitoring program to increase information on relative abundance of large fish (> 20 inches).
Action: Since 2014, data from 108 tournaments were entered and are summarized in Appendix D.
4. Conduct annual vegetation surveys to monitor hydrilla abundance and locate giant salvinia coverage suitable for herbicide treatments.
Action: Annual surveys were conducted from 2015 to 2018.
5. Conduct gill netting surveys every two years to monitor the status of catfish populations. Action: Surveys were conducted in 2017 and 2019.
6. Complete sampling for research exploring effects of plastic type and shape on fish attractor effectiveness.
Action: Sampling was completed in 2016, and a draft manuscript was in progress.
3
7. Promote fish handling procedures that minimize tournament-related mortality, impacts on
Largemouth Bass population, and conflicts with non-tournament anglers. Action: Discussions with numerous tournament organizers and presentations for several bass clubs promoted optimum fish care in livewells and at weigh-ins.
8. Minimize giant salvinia introductions and overall coverage. Action: The USACE and Aquatic Habitat Enhancement office have led giant salvinia monitoring and control efforts. Educational signs at access sites were maintained. Plant control methods included herbicide treatments (contract applicators funded by the USACE) and salvinia weevil releases.
9. Publish monthly popular articles in the Lakecaster, a newsletter distributed to 30 counties in Texas and Louisiana.
Action: Articles highlighting TPWD activities at Sam Rayburn Reservoir have been published monthly since 2000.
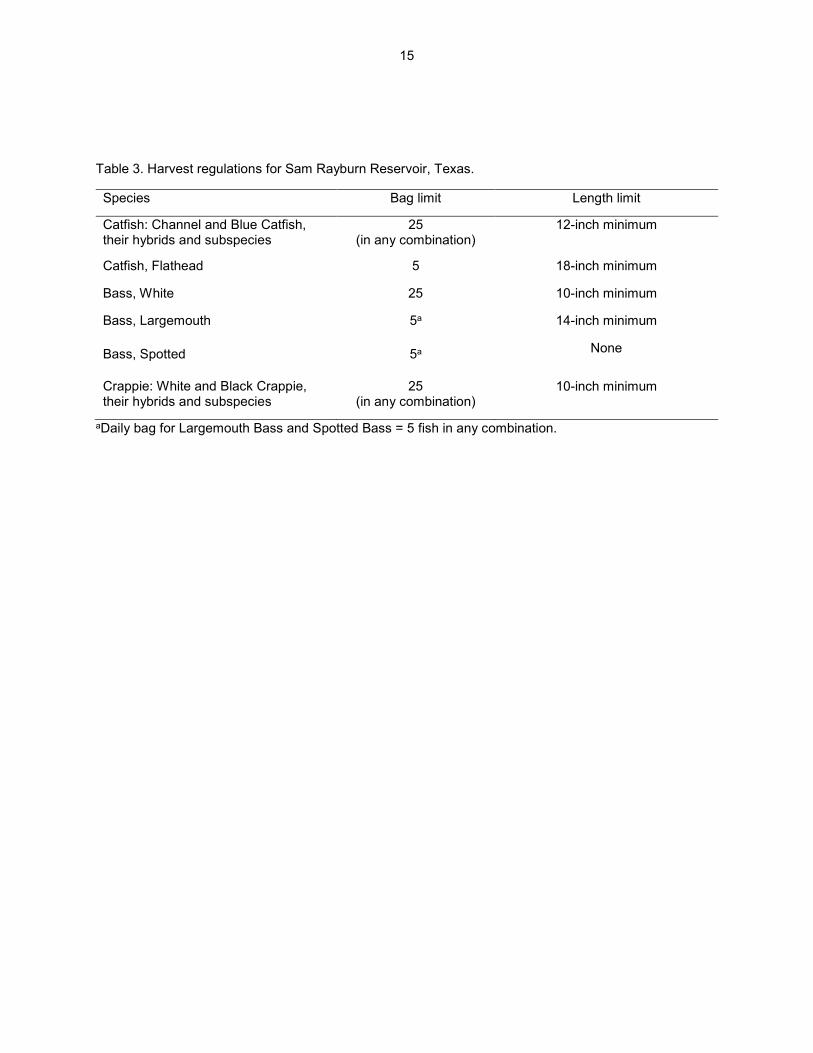
Harvest regulation history: Historically, all sport fishes in Sam Rayburn Reservoir have been managed with statewide regulations (Table 3).
Stocking history: Since 1994, FLMB have been stocked annually (Table 4). From 1991 to 2000, Palmetto Bass were stocked annually but were discontinued due to low directed angler effort and harvest. The complete stocking history is in Table 4.
Vegetation/habitat management history: Historically, aquatic vegetation coverage at Sam Rayburn Reservoir (primarily hydrilla) has approached 20,000 surface acres and included over 25 plant species. Although hydrilla is an exotic invasive species and is listed on the TPWD list of prohibitive plants, hydrilla has historically provided beneficial aquatic habitat at Sam Rayburn Reservoir, as coverage has never been problematic or created access problems. Nuisance exotic species include common salvinia, giant salvinia, and water hyacinth. Common salvinia and water hyacinth have persisted in shallow backwaters of creeks and embayments and caused few problems. Giant salvinia was first documented in 2008, persists in a majority of the embayments and creeks, and reached a historic high coverage of 4,308 surface acres in 2014. The USACE funds herbicide treatments via private applicators. Since 2013, annual herbicide treatments of giant salvinia have ranged from 1,449 to 2,463 surface acres.
Water transfer: Nearly 1,000,000 acre-feet of water rights are annually appropriated from Sam Rayburn Reservoir. The Lower Neches Valley Authority (LNVA) is the local sponsor of the reservoir and shared initial construction costs as well as annual reservoir operation expenses with the USACE. The LNVA has rights to 820,000 acre-feet annually to provide water via releases through the reservoir powerhouse. Municipal, agricultural, and industrial water is pumped from the lower Neches River and Pine Island Bayou and delivered to Jefferson, Chambers, and Liberty counties via a 400-mile canal system. The LNVA also contracts with Westvaco Corporation to provide their appropriated 50,000 acre-feet of water annually. The City of Lufkin has 56,000 acre-feet of water rights from Sam Rayburn Reservoir for future municipal and industrial use, but no infrastructure exists to pump water. The USACE has a contractual agreement with Southwest Power Corporation to produce hydropower throughout the year, independent of water rights.

4
Methods Surveys were conducted to achieve survey and sampling objectives in accordance with the objective-based sampling (OBS) plan for Sam Rayburn Reservoir (Driscoll and Ashe 2015). Primary components of the OBS plan are listed in Table 5. All survey sites were randomly selected, and all surveys were conducted according to the Fishery Assessment Procedures (TPWD, Inland Fisheries Division, unpublished manual revised 2015).
Electrofishing – Largemouth Bass, sunfishes, Gizzard Shad, and Threadfin Shad were collected by electrofishing (1.3 hours at 16, 5-min stations). Catch per unit effort (CPUE) for electrofishing was recorded as the number of fish caught per hour (fish/h) of actual electrofishing. Ages for Largemouth Bass were determined using otoliths from 13 randomly-selected fish (range 13.0 to 14.9 inches).
Gill netting – Blue Catfish, Channel Catfish, and White Bass were collected by gill netting (15 net nights at 15 stations). CPUE for gill netting was recorded as the number of fish caught per net night (fish/nn).
Statistics – Sampling statistics (CPUE for various length categories), structural indices [Proportional Size Distribution (PSD), terminology modified by Guy et al. 2007], and condition indices [relative weight (Wr)] were calculated for target fishes according to Anderson and Neumann (1996). Index of Vulnerability (IOV) was calculated for Gizzard Shad (DiCenzo et al. 1996). Standard error (SE) was calculated for structural indices and IOV. Relative standard error (RSE = 100 X SE of the estimate/estimate) was calculated for all CPUE and creel statistics.
Creel survey – A roving creel survey (36 days; 9 days per quarter) was conducted from June 2018 through May 2019. Angler interviews were conducted on 5 weekend days and 4 weekdays per quarter to assess angler use and fish catch/harvest statistics in accordance with the Fishery Assessment Procedures (TPWD, Inland Fisheries Division, unpublished manual revised 2017). Total angler catch of Largemouth Bass > 4, 7, and 10 pounds was also estimated. Anglers were asked if released fish were within weight categories. Harvested fish lengths were converted to weights for classification (19 inches = 4 pounds; 23 inches = 7 pounds; 25 inches = 10 pounds). Harvested and released fish were combined to represent total catch for weight categories.
Habitat –Vegetation surveys via airplane were conducted in 2015–2018 to monitor hydrilla, water hyacinth, and giant salvinia coverages. Coverages were calculated using the digital shapefile method (TPWD, Inland Fisheries Division, unpublished manual revised 2017).
Water level – Source for water level data was the USACE website (USACE 2019).
Results and Discussion Habitat: A habitat survey conducted in 2002 indicated the littoral zone included primarily natural bank and standing timber (Driscoll and Parks 2003). Approximately 24,000 acres of standing timber were present. Abundant areas of torpedograss, buttonbush, willow, and cypress are inundated when water level is above 164 feet MSL. Prevalent aquatic vegetation providing beneficial fish habitat includes hydrilla, American lotus, and torpedograss (Table 6). Since 2014, hydrilla and American lotus coverages have varied due to water levels. In 2014, hydrilla and American lotus covered 11,945 and 2,112 surface acres, respectively. Extremely high water levels during spring and summer of 2015 reduced coverage of both plants. Since then, coverages have been rebounding. Torpedograss tolerates water level fluctuations and is very stable from year to year, but the actual amount of aquatic coverage varies due to water levels. Giant salvinia was first documented in 2008 and is present in the majority of embayments and creeks due to frequent introductions via boat trailers, plant growth, and wind dispersal. Since 2010, plant coverage has varied seasonally due to water level fluctuations, with maximum coverage during April/May and trace amounts during fall and winter. In 2014, relatively high water levels throughout the growing season resulted in a historic high amount of giant salvinia (4,308 surface acres). Since that time, aggressive herbicide treatments directed by the USACE have reduced coverage considerably.
Creel: Similar to previous survey years, fishing effort at Sam Rayburn Reservoir was primarily directed at black basses (80.8%) (Table 7). Total fishing effort for all species steadily increased over the last three

5
survey periods and was 514,624 hours in 2018/2019 (direct expenditures were $7,436,724) (Table 8). However, expenditures estimated from creel surveys from the last three survey years were much lower than total annual expenditures derived from economic research in 2008 ($32,259,314) (Driscoll and Myers 2014).
Prey species: Primary prey species included Gizzard Shad, Threadfin Shad, and Bluegill. In 2018, Gizzard Shad catch rates increased and IOV was relatively high (76) (Figure 2). Historically, Threadfin Shad catch rates have been highly variable and likely not reflective of population status. The catch rate in 2018 was 1,860.0/h (Appendix A). Bluegill are relatively abundant, but catch rates varied during the last three survey years (171.0 to 325.5/h) (Figure 3). Few anglers targeted sunfish in 2018/2019 (Tables 7 and 9). Overall, prey species abundance was adequate, as reflected by electrofishing catch rates and desirable relative weights of sport fish.
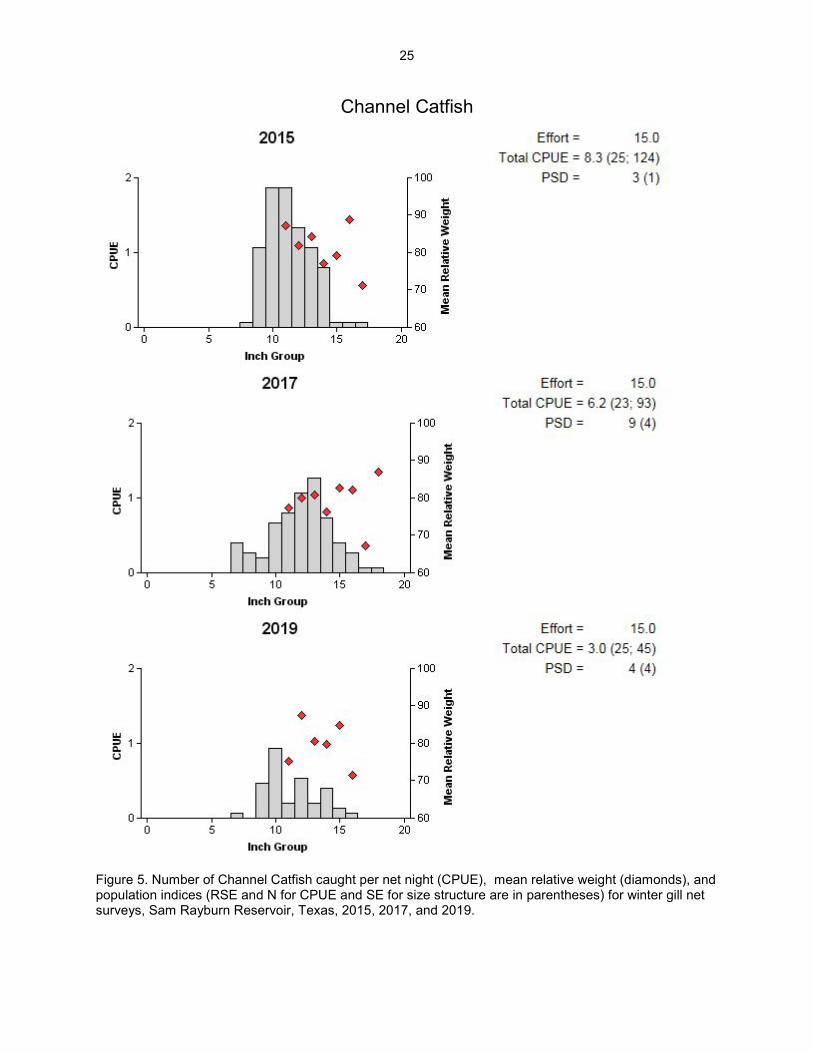
Catfish: Historically, Blue and Channel Catfish recruitment have been relatively stable. During the last three survey years, Blue Catfish catch rates ranged from 3.2 to 5.1/nn (Figure 4). Although few Blue Catfish >25 inches were collected, anecdotal information indicates passive gear anglers frequently catch fish >30 pounds. In 2019, Channel Catfish catch rates declined to 3.0/nn, compared to 8.3 and 6.2/nn in 2015 and 2017 (Figure 5). However, this decline may be due to extremely high water levels (> 174 feet above MSL) and related reduction in sampling efficiency, rather than an actual drop in population abundance. Few fish > 15 inches were present. Directed rod and reel angler effort towards catfishes increased from 2012 to 2019 (Table 10). Catfish anglers accounted for 7 to 10% of the total fishing effort and catch rates were high (1.7 to 3.0 fish/h). Total estimated harvest increased to 44,071 fish in 2018/2019; 92% of harvested fish were Channel Catfish (Figure 6).
White Bass and Yellow Bass: During most sampling years, White Bass catch rates from gill nets indicate a low population density in the reservoir. Since 2004, catch rates have been < 2.5/nn, with the exception of 2011 (6.3/nn). Catch rates from the last three surveys were < 1.6/nn (Figure 7). Yellow Bass gill net catch was not recorded, but an abundant population was present. Few anglers target temperate bass in the reservoir (Table 11), but a fishery exists in the Angelina River above the reservoir during the spring spawning run.
Black bass: Historically, electrofishing catch rates of Spotted Bass have been low. Catch rates were <9.8/h from 2014 to 2018 (Figure 9). Few Spotted Bass >10 inches were collected. Estimated angler harvest was 7,655 fish in 2018/2019. Fall electrofishing catch rates of Largemouth Bass from 2014 to 2018 reflected relatively high recruitment rates and population abundance (range = 177.0 - 290.3/h; Figure 10). Population size structure was similar and desirable across years (PSD range = 60 - 68; PSD-14 range = 30 – 33). Nearly all relative weights were > 85, indicating Largemouth Bass were in adequate condition. Growth rate was relatively high, as average age at 14 inches was 2.2 years (N = 13; range = 1 – 4 years). The black bass fishery accounted for the majority of annual fishing effort (80.8%; Table 7). Total angler directed effort increased over the last three survey years (range = 257,825 – 414,953 h); proportion tournament-related (range = 42 - 52%) was relatively stable (Table 12). Angler catch rates remained high and stable (range = 1.3 - 1.5 fish/h). In 2018/2019, total angler catch (466,585 fish) and tournament-retained catch (73,728 fish) were higher than the previous two survey. Non-tournament harvest in 2018/2019 (26,399 fish) was similar to 2014/2015 (27,847 fish). The proportion of legal fish released (non-tournament) ranged from 60 to 74%. The majority of harvested Largemouth Bass were 14 to 16 inches in length and 80% were temporarily retained during tournaments (Figure 10). The proportion of total catch for all four weight categories was similar during the last three survey years. Fish from 4 to 6.9 pounds comprised 2.1 to 2.5% of catch, and 7 to 9.9-pound fish comprised 0.2 to 0.4% of the catch each year.
A tournament-monitoring program was implemented in June 2003 to increase information on fish > 14 inches and provide greater insight regarding large (> 20 inches) fish abundance (Appendix D). Overall,

6
most tournament variables were favorable and similar during 2014 - 2018. The percent of anglers catching 5-fish limits was > 40% for most years and as high as 79%, indicating high and stable numbers of fish >14 inches. Average big bass weight in team tournaments was >8 pounds for all years but one (with two estimates > 10 pounds), and average weight to win events ranged from 19.8 to 29.1 pounds, reflecting relatively high and stable numbers of large fish. Similarly, results of the 3-day Sealy Outdoors McDonald’s Big Bass Splash tournaments also suggested high and stable numbers of large bass. In 2019, average weights of the top 10 fish/hour (6.7 pounds; N = 210), top 10 fish/day (8.5 pounds, N = 30), and overall top 10 (9.3 pounds, N = 10) were similar to the previous five years.
Crappie: Creel data reflected an abundant crappie population. In 2018/2019, total fishing effort (60,377 h) nearly doubled when compared to 2012/2013 (32,867 h) (Table 13). Similarly, harvest increased from 46,423 to 85,388 fish. Angler catch was high and varied over the last three survey years (1.9 – 3.7 fish/h) (Table 13).

7
Fisheries Management Plan for Sam Rayburn Reservoir, Texas
Prepared – July 2019
ISSUE 1: Creel surveys indicate most sportfishing effort at Sam Rayburn Reservoir is for Largemouth Bass. The economic contribution of the Largemouth Bass fishery to the local area is high, as the total economic value of the recreational fishery was estimated at $46.7 million (Driscoll and Myers 2014). The reservoir also hosts over 400 bass tournaments per year with an economic value of $31.1 million (Driscoll and Myers 2014). The reservoir also has a demonstrated potential for producing trophy fish.
MANAGEMENT STRATEGIES
1. Continue to manage the Largemouth Bass population with the statewide 14-inch length limit.
2. Continue annual stocking of FLMB (> 500,000 fingerlings/year) to maintain and improve the trophy Largemouth Bass population.
3. Continue the tournament monitoring program to collect information on larger fish to justify FLMB stockings.
4. Continue to promote fish handling procedures that minimize tournament-related mortality to minimize impacts on Largemouth Bass population and reduce conflicts with non-tournament anglers.
ISSUE 2: In 2008, giant salvinia was documented in Sam Rayburn Reservoir. The plant is now present in a majority of embayments and creeks due to frequent introductions via boat trailers, plant growth, and wind dispersion. Relatively high water levels in 2014 resulted in a historic high of 4,308 surface acres. Since then, aggressive herbicide treatments overseen by the USACE have reduced coverage to 1,000 to 1,500 surface acres.
MANAGEMENT STRATEGIES
1. Support USACE efforts relative to herbicide treatments via private applicators to control plant coverage.
2. Support Aquatic Habitat Enhancement efforts with salvinia weevil research. 3. Maintain all educational signs at access points to minimize potential transport to other waters. 4. Conduct an annual reservoir-wide aerial survey and post-treatment surveys, when applicable, to
monitor trends in giant salvinia coverage.
ISSUE 3: The crappie fishery at Sam Rayburn Reservoir has been productive and popular. Historically, directed effort and harvest has exceeded 3.0 h/acre and 400,000 fish, respectively. Since 2008, directed effort (<0.6 h/acre) and total harvest (< 100,000 fish) has been stable but considerably lower than historical highs.
MANAGEMENT STRATEGIES
1. Conduct creel surveys every four years to monitor the crappie fishery, as trap netting at Sam Rayburn Reservoir is not effective.

8
2. Publish research manuscript exploring effects of plastic fish attractor shape and material type on
effectiveness. 3. Monitor condition of 15 plastic fish attractor reefs via sonar and scuba, and refurbish with
additional attractors as necessary to increase fishing success.
ISSUE 4: Area constituents are interested in TPWD activities and management actions related to Sam Rayburn Reservoir and need to be informed.
MANAGEMENT STRATEGY
1. Continue to publish monthly popular articles on TPWD activities in the Lakecaster, a newsletter distributed to approximately 30 counties in Texas and Louisiana.
ISSUE 5: Many invasive species threaten aquatic habitats and organisms in Texas and can adversely affect the state ecologically, environmentally, and economically. For example, zebra mussels can multiply rapidly and attach themselves to any available hard structure, restricting water flow in pipes, fouling swimming beaches and plugging engine cooling systems. Giant salvinia and other invasive vegetation species can form dense mats, interfering with recreational activities like fishing, boating, skiing, and swimming. The financial costs of controlling and/or eradicating these types of invasive species are significant. Additionally, the potential for invasive species to spread to other river drainages and reservoirs via watercraft and other means is a serious threat to all public waters of the state.
MANAGEMENT STRATEGIES
1. Cooperate with the controlling authority to post appropriate signage at access points around the reservoir.
2. Contact and educate marina owners about invasive species and provide them with posters and literature so they can educate their customers.
3. Educate the public about invasive species using media and the internet. 4. Discuss invasive species when presenting to constituent and user groups. Document existing and future inter-basin water transfers to facilitate potential invasive species
responses.

9
Objective-Based Sampling Plan and Schedule (2019–2023)
Sport fish, forage fish, and other important fishes
Sport fishes in Sam Rayburn Reservoir include Largemouth Bass, Spotted Bass, crappies, Channel Catfish, Blue Catfish, Flathead Catfish, and White Bass. Important forage species include Bluegill, Gizzard Shad, and Threadfin Shad.
Low-density or underutilized fisheries
Historically, White Bass catch rates from gill net surveys were <1.5/nn, indicating a low population density in the reservoir. Since 2008, creel surveys have not documented directed effort towards temperate basses. Although no future directed sampling is planned, White Bass catch will be recorded from gill net surveys directed at catfishes (see below).
Currently, little is known about the Flathead Catfish population at Sam Rayburn Reservoir. During the summer of 2014, a low-frequency electrofishing survey was conducted to establish a baseline relative abundance estimate for trend comparisons over time. However, no Flathead Catfish were collected from 10 random electrofishing stations and no additional surveys are planned.
Survey objectives, fisheries metrics, and sampling objectives
Largemouth Bass: Largemouth Bass are the most popular sport fish in Sam Rayburn Reservoir, accounting for approximately 75% of the annual angling effort. The reservoir supports a high-quality, nationally recognized fishery with substantial economic contributions. The annual economic value of the recreational fishery was estimated at $46.7 million. The reservoir also hosts over 400 bass tournaments per year with an economic value of $31.1 million. Largemouth Bass have been managed with the statewide 14-in MLL regulation since 1986. For nearly 20 years, trend data on CPUE, size structure, and body condition were collected annually with fall electrofishing. Since 2013, fall electrofishing has been conducted biennially. The population is abundant, recruitment rates have been high and steady, and size structure has been desirable and stable. Continuation of biennial trend data with night electrofishing in the fall of 2020 and 2022 will allow for determination of any large-scale changes in the Largemouth Bass population that may spur further investigation. A minimum of 16 randomly-selected 5-min electrofishing sites will be sampled, but sampling will continue at random sites until 50 stock-size fish are collected and the RSE of CPUE-S is < 25 (the anticipated effort to meet both sampling objectives is 12-20 stations with 80% confidence). If failure to achieve either objective has occurred after one night of sampling and objectives can be attained with 6-12 additional random stations, another night of effort will be expended.
In addition, average age of Largemouth Bass between 330 and 381 mm (Category 2; N = 13) will be estimated in 2022, and every four years thereafter. If growth problems are detected from this cursory estimate, mean length-at-age will be estimated from a random population sample of 400 fish > 150 mm, subsampled at 10 fish per 10 mm strata (Category 4).
Crappies: The crappie fishery is the second most popular at Sam Rayburn Reservoir, accounting for 10 – 15% of the annual angling effort. Historically, standard, tandem, and offshore trap netting has resulted in low and variable catch rates. For over 10 years, creel surveys have been used to monitor the crappie fishery and make inferences about the population. Although directed effort and harvest have varied over the years, angler catch rates have remained relatively high since 2004 (range = 1.5 – 3.0 fish/h), reflecting an abundant crappie population. We will conduct a creel survey in 2022/2023 (4 quarters, 5

10
weekend and 4 week days/quarter) to detect any large-scale changes in the crappie population that may warrant additional sampling.
Catfishes: The rod and reel catfish fishery accounts for approximately 10% of the annual angling effort. Anecdotal information indicates that the passive gear fishery is more popular and accounts for frequent catches of Blue and Flathead Catfish > 30 pounds. Catfish populations have historically been managed with statewide regulations.
Biennial gill netting data has indicated relatively stable Channel and Blue Catfish recruitment and abundance, and should provide adequate population-level insight relative to large-scale changes that would dictate further investigation. A minimum of 15 randomly selected gill netting sites will be sampled in 2021 and 2023, but sampling will continue at random sites until 50 stock-size fish are collected and the RSE of CPUE-S is < 25 (the anticipated effort to meet both sampling objectives is 12-18 stations with 80% confidence). Additional sampling will occur (5-10 gill netting sites) if objectives are not attained.
Prey species: Bluegill, Gizzard Shad, and Threadfin Shad are the primary forage at Sam Rayburn Reservoir. Like Largemouth Bass, trend data on CPUE and size structure were collected annually for 20 years with fall electrofishing. Since 2013, fall electrofishing has been conducted biennially. Continuation of biennial sampling, as per Largemouth Bass above, will allow for monitoring of large-scale changes in Bluegill and Gizzard Shad relative abundance and size structure. Effort based on achieving sampling objectives for Largemouth Bass will result in enough Bluegill for size structure (PSD; 50 fish minimum) and relative abundance (RSE < 25 of CPUE-Total) and Gizzard Shad size structure (IOV; 50 fish minimum). At the effort needed to achieve sampling objectives for Largemouth Bass, the expected RSE for CPUE-T is 33 for Gizzard Shad and 60 for Threadfin Shad. No additional effort will be expended to achieve an RSE25 for Gizzard or Threadfin Shad, but Largemouth Bass body condition (fish > 8” TL) will be used to provide additional information on forage abundance and vulnerability.

11
Literature Cited Anderson, R. O., and R. M. Neumann. 1996. Length, weight, and associated structural indices. Pages
447-482 in B. R. Murphy and D. W. Willis, editors. Fisheries techniques, 2nd edition. American Fisheries Society, Bethesda, Maryland.
DiCenzo, V. J., M. J. Maceina, and M. R. Stimpert. 1996. Relations between reservoir trophic state and gizzard shad population characteristics in Alabama reservoirs. North American Journal of Fisheries Management 16:888-895.
Driscoll, M. T, and J. O. Parks. 2003. Statewide freshwater fisheries monitoring and management program survey report for Sam Rayburn Reservoir, 2004. Texas Parks and Wildlife Department, Federal Aid Report F-30-R, Austin.
Driscoll, M. T and D. E. Ashe. 2015. Statewide freshwater fisheries monitoring and management program survey report for Sam Rayburn Reservoir, 2014. Texas Parks and Wildlife Department, Federal Aid Report F-30-R, Austin.
Driscoll, M. T., and R. A. Myers. 2014. Black bass tournament characteristics and economic value at Sam Rayburn Reservoir, Texas. Journal of the Southeastern Association of Fish and Wildlife Agencies 1:26–32.
Guy, C. S., R. M. Neumann, D. W. Willis, and R. O. Anderson. 2007. Proportional Size Distribution (PSD): a further refinement of population size structure index terminology. Fisheries 32(7):348.
Texas Commission on Environmental Quality. 2018. Trophic Classification of Texas Reservoirs: 2016 Texas Water Quality Inventory and 303(d) List, Austin. 15 pp.
Texas Department of State Health Services (TDSHS). 2013. Characterization of Potential Adverse Health Effects Associated with Consuming Fish from Sam Rayburn Reservoir. Seafood and Aquatic Life Group, Austin. 105 pp.
U.S. Army Corps of Engineers (USACE). 2019. Fort Worth District, Water Management Information. Available: http://www.swf-wc.usace.army.mil/cgi-bin/rcshtml.pl?page=Hydrologic (April 2019).

12
Tables and Figures
Figure 1. Quarterly water level elevations in feet above mean sea level (MSL) recorded for Sam Rayburn Reservoir, Texas.
Table 1. Characteristics of Sam Rayburn Reservoir, Texas.
Characteristic Description
Year constructed 1966
Controlling authority U.S. Army Corps of Engineers
County Angelina, Jasper, Nacogdoches, Sabine, San Augustine, and Tyler
Reservoir type Mainstream
Shoreline Development Index 16.25
Conductivity 120 µS/cm

13
Table 2. Boat ramp characteristics for Sam Rayburn Reservoir, Texas, August 2018. Reservoir elevation at time of survey was 162 feet above mean sea level.
Boat ramp
Latitude Longitude (dd)
Public
Parking capacity (N)
Elevation at end of ramp (ft)
Condition
South Public 31.06760 94.06395
Y 90 154 Excellent
Twin Dikes 31.07524 94.06818
Y 220 154 Excellent
Sandy Creek 31.09588 94.20363
Y 25 155 Adequate
Caney Creek 31.13540 94.25561
Y 72 155 Excellent
Cassels-Boykin 31.21247 94.35019
Y 144 153 Excellent
Monterey Park 31.21262 94.31095
Y 50 154 Excellent
Hanks Creek 31.26812 94.39908
Y 60 152 Excellent
Ewing Park 31.37201 94.48117
Y 20 159 Adequate
Marion’s Ferry 31.39718 94.52679
Y 20 154 Excellent
Kingtown 31.40910 94.51677
Y 15 154 Adequate
Etoile 31.37700 94.46490
Y 45 158 Adequate
Shirley Creek 31.30942 94.37302
Y 30 153 Adequate
Ralph McAllister 31.37532 94.33169
Y 24 161 Excellent
Townsend 31.34788 94.31304
Y 20 157 Excellent
Jackson Hill 31.27023 94.32260
Y 40 154 Excellent
Harvey Creek 31.21371 94.32260
Y 25 154 Adequate
Five Fingers 31.12935 94.11796
Y 20 150 Adequate

14
Rayburn Park 31.10501
94.11017 Y 75 152 Excellent
Powell Park 31.13034 94.08379
Y 36 151 Excellent
Highway 83 31.26591 94.11160
Y 15 161 Adequate
San Augustine Park
31.20293 94.08047
Y 30 152 Excellent
Mill Creek 31.14974 94.00761
Y 45 156 Excellent
15
Table 3. Harvest regulations for Sam Rayburn Reservoir, Texas.
Species Bag limit Length limit
Catfish: Channel and Blue Catfish, their hybrids and subspecies
25 (in any combination)
12-inch minimum
Catfish, Flathead 5 18-inch minimum
Bass, White 25 10-inch minimum
Bass, Largemouth 5a 14-inch minimum
Bass, Spotted 5a None
Crappie: White and Black Crappie, their hybrids and subspecies
25 (in any combination)
10-inch minimum
aDaily bag for Largemouth Bass and Spotted Bass = 5 fish in any combination.

16
Table 4. Stocking history of Sam Rayburn Reservoir, Texas. FGL = fingerling; AFGL = advanced fingerling; ADL = adults; UNK = unknown. Species Year Number Size
Blue Catfish 1966 105,100 UNK
1987 199,870 FGL
Total 304,970
Channel Catfish 1966 74,600 AFGL
1966 6,100 FGL
1973 110,000 AFGL
Total 190,700
Florida Largemouth Bass 1975 25,000 FRY
1976 60,000 FRY
1977 60,000 FRY
1978 165,000 FGL
1978 47,000 FRY
1980 361,840 FGL
1983 1,200 AFGL
1983 37,700 FGL
1987 249,660 FRY
1990 1,000 AFGL
1994 159,360 FGL
1994 782,966 FRY
1995 232,392 FGL
1996 948,017 FGL
1996 276,051 FRY
1997 317,729 FRY
1998 229,200 FGL
1999 1,329,160 FGL
2000 510,735 FGL
2001 500,783 FGL
2001 273,407 FRY
2002 42 ADL
2002 1,066,781 FGL
2003 1,033,318 FGL
2003 291,008 FRY
2004 523,648 FGL
2005 1,026,943 FGL
2006 499,858 FGL
2007 500,033 FGL
2008 501,382 FGL
2009 1,284,341 FGL
2009 377,936 FRY
2010 500,100 FGL
2011 952,285 FGL
2012 1,466,043 FGL

17
Species Year Number Size
2013 522,120 FGL
2014 500,331 FGL
2014 96,250 FRY
2015 501,113 FGL
2016 502,125 FGL
2017 585,163 FGL
2018 760,099 FGL
2018 7,920 FRY
Total 20,067,039
Largemouth Bass 1965 364,000 FGL
1966 97,000 FGL
1988 21 ADL
Total 461,021
Longear Sunfish 1965 40,000 UNK
Total 40,000
Paddlefish 1990 3,581 UNK
1991 16,741 UNK
1992 43,584 UNK
1995 46,529 UNK
Total 110,435
Palmetto Bass 1979 571,400 FRY
1981 447,528 FRY
1982 1,000,000 FRY
1985 1,000,000 FRY
1987 1,500,000 FRY
1988 1,100,000 FRY
1989 279,748 FGL
1989 1,130,036 FRY
1991 1,111,683 FRY
1992 1,347,961 FRY
1993 1,140,000 FRY
1994 1,175,000 FRY
1995 943,903 FGL
1995 1,469,882 FRY
1996 116,000 FGL
1997 186,577 FGL
1998 406,229 FGL
1998 168,428 FRY
1999 289,974 FGL
2000 290,990 FGL
Total 15,675,339
Redear Sunfish 1966 1,400 UNK
1967 530,000

18
Species Year Number Size
Total 531,400
ShareLunker Largemouth Bass 2008 2,604 FGL
2018 7,843 FGL
Total 10,447
Striped Bass 1976 115,108 UNK
1977 843,161 UNK
1978 182,800 UNK
1979 215,490 UNK
1983 1,000,000 UNK
Total 2,356,559
Walleye 1973 426,000 FRY
1974 349,400 FRY
1975 378,376 FRY
1976 220,000 FRY
Total 1,373,776
Warmouth 1965 80,000 UNK
1966 800 UNK
Total 80,800
White Crappie 1965 7,000 FGL
Total 7,000
19
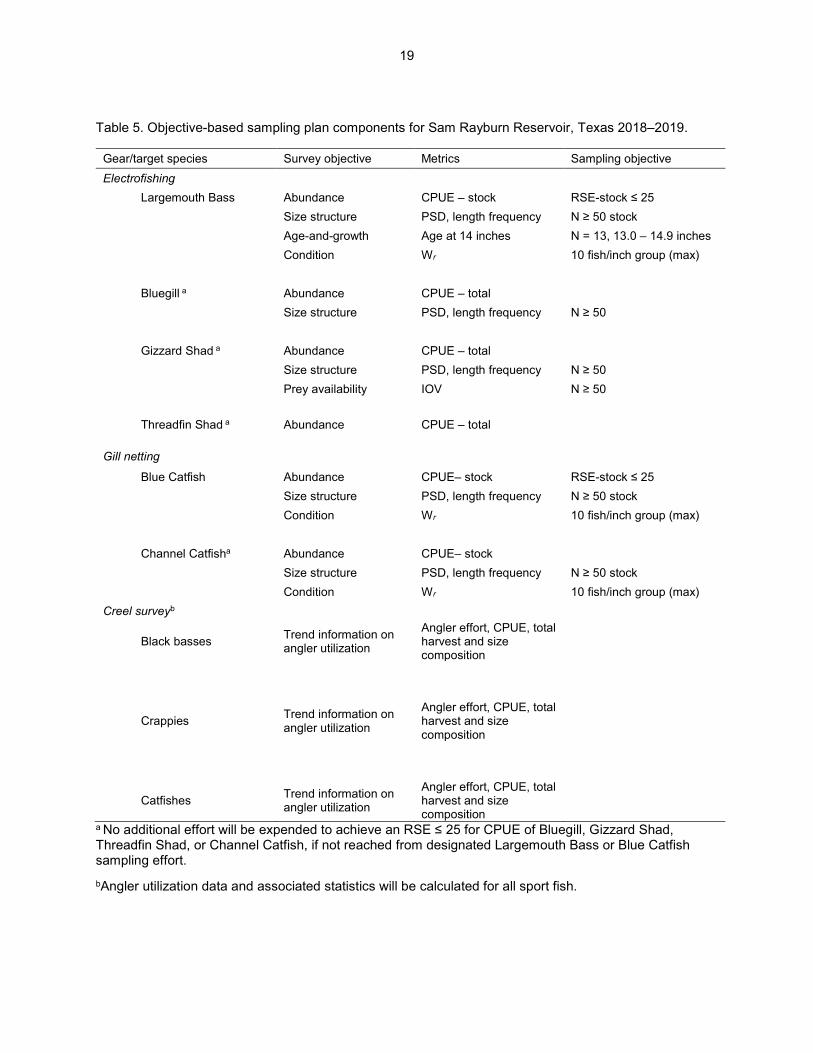
Table 5. Objective-based sampling plan components for Sam Rayburn Reservoir, Texas 2018–2019.
Gear/target species Survey objective Metrics Sampling objective Electrofishing Largemouth Bass Abundance CPUE – stock RSE-stock ≤ 25 Size structure PSD, length frequency N ≥ 50 stock Age-and-growth Age at 14 inches N = 13, 13.0 – 14.9 inches Condition Wr 10 fish/inch group (max) Bluegill a Abundance CPUE – total Size structure PSD, length frequency N ≥ 50 Gizzard Shad a Abundance CPUE – total Size structure PSD, length frequency N ≥ 50 Prey availability IOV N ≥ 50 Threadfin Shad a Abundance CPUE – total Gill netting
Blue Catfish Abundance CPUE– stock RSE-stock ≤ 25 Size structure PSD, length frequency N ≥ 50 stock Condition Wr 10 fish/inch group (max) Channel Catfisha Abundance CPUE– stock Size structure PSD, length frequency N ≥ 50 stock Condition Wr 10 fish/inch group (max) Creel surveyb
Black basses Trend information on angler utilization
Angler effort, CPUE, total harvest and size composition
Crappies Trend information on angler utilization
Angler effort, CPUE, total harvest and size composition
Catfishes Trend information on angler utilization
Angler effort, CPUE, total harvest and size composition
a No additional effort will be expended to achieve an RSE ≤ 25 for CPUE of Bluegill, Gizzard Shad, Threadfin Shad, or Channel Catfish, if not reached from designated Largemouth Bass or Blue Catfish sampling effort. bAngler utilization data and associated statistics will be calculated for all sport fish.

20
Table 6. Aerial survey of prevalent aquatic vegetation, Sam Rayburn Reservoir, Texas, 2014–2018. Surface area (acres) is listed with percent of total reservoir surface area in parentheses.
Vegetation 2014 2015 2016 2017 2018
American lotus 2,112 (2) 153 (<1) 994 (1)
Giant salvinia 4,308 (4) 3,053 (3) 1,521 (1) 982 (1) 1,467 (1)
Hydrilla 11,945 (11) 558 (1) 8,088 (7) 8,453 (8)
Torpedograss 1,872 (2) 1,280 (1) 165 (<1) 1,515 (1) 252 (<1)
Water hyacinth trace 1,031 (1)
Table 7. Percent directed angler effort by species for Sam Rayburn Reservoir, Texas, 2012–2019. Survey periods were from 1 June through 31 May.
Species 2012/2013 2014/2015 2018/2019
Catfishes 9.4 9.6 6.5
Sunfishes 0.2 0.1
Black basses 78.4 74.7 80.8
Temperate basses 1.0 0.1
Crappies 10.0 10.6 11.8
Anything 2.1 3.9 0.7
Table 8. Total fishing effort (h) for all species and total directed expenditures at Sam Rayburn Reservoir, Texas, 2012-2019. Survey periods were from 1 June through 31 May. Relative standard error is in parentheses.
Creel statistic 2012/2013 2014/2015 2018/2019
Total fishing effort 328,874 (22) 441,709 (18) 514,624 (18) Total directed expenditures
$3,751,136 (26) $4,670,828 (29) $7,436,724 (24)

21
Gizzard Shad
Figure 2. Number of Gizzard Shad caught per hour (CPUE) and population indices (RSE and N for CPUE and SE for IOV are in parentheses) for fall electrofishing surveys, Sam Rayburn Reservoir, Texas, 2014, 2016, and 2018.

22
Bluegill
Figure 3. Number of Bluegill caught per hour (CPUE) and population indices (RSE and N for CPUE and SE for size structure are in parentheses) for fall electrofishing surveys, Sam Rayburn Reservoir, Texas, 2014, 2016, and 2018.

23
Sunfishes Table 9. Creel survey statistics for sunfishes at Sam Rayburn Reservoir, Texas, from June 2012 through May 2013, June 2014 through May 2015, and June 2018 through May 2019. Total catch per hour is for anglers targeting sunfishes and total harvest is the estimated number of sunfishes harvested by all anglers. Relative standard errors (RSE) are in parentheses.
Creel survey statistic Year
2012/2013 2014/2015 2018/2019
Directed effort (h) 672 (121) 733 (98)
Directed effort/acre 0.01 (121) 0.01 (98)
Total catch per hour 1.3 (.) 0
Total harvest 3,208 (186) 0 834 (389)
Harvest/acre 0.02 (186) 0 0.01 (389)
Percent legal released 2 100 54

24
Blue Catfish
Figure 4. Number of Blue Catfish caught per net night (CPUE), mean relative weight (diamonds), and population indices (RSE and N for CPUE and SE for size structure are in parentheses) for winter gill net surveys, Sam Rayburn Reservoir, Texas, 2015, 2017, and 2019.
25
Channel Catfish
Figure 5. Number of Channel Catfish caught per net night (CPUE), mean relative weight (diamonds), and population indices (RSE and N for CPUE and SE for size structure are in parentheses) for winter gill net surveys, Sam Rayburn Reservoir, Texas, 2015, 2017, and 2019.

26
Catfishes Table 10. Creel survey statistics for catfishes at Sam Rayburn Reservoir, Texas, from June 2012 through May 2013, June 2014 through May 2015, and June 2018 through May 2019. Total catch per hour is for anglers targeting catfishes and total harvest is the estimated number of catfishes harvested by all anglers. Relative standard errors (RSE) are in parentheses.
Creel survey statistic Year
2012/2013 2014/2015 2018/2019
Directed effort (h) 30,926 (37) 42,431 (22) 60,378 (20)
Directed effort/acre 0.28 (37) 0.38 (22) 0.54 (20)
Total catch per hour 2.96 (20) 1.65 (39) 2.68 (30)
Total harvest 35,844 (29) 25,124 (52) 44,071 (35)
Harvest/acre 0.32 (29) 0.23 (52) 0.40 (35)
Percent legal released 1 1 1
Figure 6. Length frequency of harvested Channel Catfish observed during creel surveys at Sam Rayburn Reservoir, Texas, June 2018 through May 2019, all anglers combined. N is the number of harvested Channel Catfish observed during creel surveys, and TH is the total estimated harvest for the creel period.

27
White Bass
Figure 7. Number of White Bass caught per net night (CPUE), mean relative weight (diamonds), and population indices (RSE and N for CPUE and SE for size structure are in parentheses) for winter gill net surveys, Sam Rayburn Reservoir, Texas, 2015, 2017, and 2019.

28
Temperate Basses Table 11. Creel survey statistics for temperate basses at Sam Rayburn Reservoir, Texas, from June 2012 through May 2013, June 2014 through May 2015, and June 2018 through May 2019. Total catch per hour is for anglers targeting temperate basses and total harvest is the estimated number of temperate basses harvested by all anglers. Relative standard errors (RSE) are in parentheses.
Creel survey statistic Year
2012/2013 2014/2015 2018/2019
Directed effort (h) 4,569 (43) 403 (147)
Directed effort/acre 0.04 (43) 0.01 (147)
Total catch per hour 2.68 (45) 18.86 (.)
Total harvest 398 (447) 15,715 (71) 4,181 (325)
Harvest/acre <0.01 (447) 0.14 (71) 0.04 (325)
Percent legal released 87 32 48

29
Spotted Bass
Figure 8. Number of Spotted Bass caught per net night (CPUE), mean relative weight (diamonds), and population indices (RSE and N for CPUE and SE for size structure are in parentheses) for fall electrofishing surveys, Sam Rayburn Reservoir, Texas, 2014, 2016, and 2018.

30
Largemouth Bass
Figure 9. Number of Largemouth Bass caught per hour (CPUE, bars), mean relative weight (diamonds), and population indices (RSE and N for CPUE and SE for size structure are in parentheses) for fall electrofishing surveys, Sam Rayburn Reservoir, Texas, 2014, 2016, and 2018.

31
Black Basses Table 12. Creel survey statistics for black basses at Sam Rayburn Reservoir, Texas, from June 2012 through May 2013, June 2014 through May 2015, and June 2018 through May 2019. Catch rate is for all anglers targeting black basses. Harvest is partitioned by the estimated number of fish harvested by non-tournament anglers and the number of fish retained by tournament anglers for weigh-in and release. The estimated number of fish caught by weight category is for all anglers. Relative standard errors (RSE) are in parentheses.
Creel survey statistic Year
2012/2013 2014/2015 2018/2019
Directed angling effort (h)
Tournament 135,145 (22) 136,741 (19) 209,727 (21)
Non-tournament 122,680 (22) 192,628 (22) 205,226 (18)
All black bass anglers combined 257,825 (22) 329,368 (21) 414,953 (19)
Angling effort/acre 2.3 (22) 3.0 (21) 3.7 (19)
Catch rate (number/h) 1.3 (12) 1.5 (16) 1.3 (11)
Harvest
Non-tournament harvest 11,453 (51) 27,847 (38) 26,399 (38)
Harvest/acre 0.1 (51) 0.3 (38) 0.2 (38)
Tournament weigh-in and release 12,645 (43) 37,837 (28) 73,728 (27)
Total catch 262,560 (25) 356,748 (25) 466,585 (24)
< 4.0 lbs 255,227 – 97.2% 347,823 – 97.5% 453,439 – 97.2%
> 4-6.9 lbs 6,525 – 2.5% 7,461 – 2.1% 11,803 – 2.5%
> 7-9.9 lbs 807 – 0.3% 1,464 – 0.4% 1063 – 0.2%
> 10 lbs 0 0 280 – 0.1%
Percent legal released (non-tournament) 74 60 71

32
Figure 10. Length frequency of harvested Largemouth Bass observed during creel surveys at Sam Rayburn Reservoir, Texas, June 2014 through May 2015, all anglers combined. N is the number of harvested Largemouth Bass observed during creel surveys, and TH is the total estimated harvest for the creel period.

33
Crappie Table 13. Creel survey statistics for crappies at Sam Rayburn Reservoir, Texas, from June 2012 through May 2013, June 2014 through May 2015, and June 2018 through May 2019, where total catch per hour is for anglers targeting crappies and total harvest is the estimated number of crappies harvested by all anglers. Relative standard errors (RSE) are in parentheses
Creel Survey Statistic Year
2012/2013 2014/2015 2018/2019
Directed effort (h) 32,867 (32) 46,659 (21) 60,377 (20)
Directed effort/acre 0.29 (32) 0.42 (21) 0.54 (20)
Total catch per hour 1.93 (24) 3.68 (45) 2.87 (22)
Total harvest 46,243 (40) 74,292 (30) 85,388 (29)
Harvest/acre 0.42 (40) 0.67 (30) 0.77 (29)
Percent legal released 0 0 <1
Figure 11. Length frequency of harvested crappie observed during creel surveys at Sam Rayburn Reservoir, Texas, June 2018 through May 2019, all anglers combined. N is the number of harvested crappie observed during creel surveys, and TH is the total estimated harvest for the creel period.

34
Proposed Sampling Schedule
Table 14. Proposed sampling schedule for Sam Rayburn Reservoir, Texas. Survey period is June through May. Gill netting surveys are conducted in the winter, while electrofishing surveys are conducted in the fall. Standard survey denoted by S and additional survey denoted by A.
Survey year
2019-2020 2020-2021 2021-2022 2022-2023
Angler Access S
Vegetation A A A S
Electrofishing – Fall A S
Gill netting A S
Creel survey A
Report S

35
APPENDIX A – Catch rates for all species from all gear types
Number (N) and catch rate (CPUE) (RSE in parentheses) of all target species collected from all gear types from Sam Rayburn Reservoir, Texas, 2018-2019. Sampling effort was 15 net nights for gill netting and 1.3 hours for electrofishing.
Species Gill Netting Electrofishing
N CPUE N CPUE
Gizzard Shad 162 121.5 (41)
Threadfin Shad 2,480 1,860.0 (44)
Blue Catfish 48 3.2 (27)
Channel Catfish 45 3.0 (25)
White Bass 8 0.5 (77)
Redbreast Sunfish 2 1.5 (68)
Warmouth 2 1.5 (100)
Bluegill 387 290.3 (14)
Longear Sunfish 17 12.8 (29)
Redear Sunfish 49 36.8 (35)
Redspotted Sunfish 7 5.3 (51)
Spotted Bass 6 4.5 (41)
Largemouth Bass 232 174.0 (16)
White Crappie 2 0.1 (68)
Black Crappie 17 1.1 (41)

36
APPENDIX B – Map of sampling locations
Location of sampling sites, lower Sam Rayburn Reservoir, Texas, 2018-2019. Gill net and electrofishing stations are indicated by G and E, respectively. Water level was near full pool at time of sampling.

37
APPENDIX B – Map of sampling locations
Location of sampling sites, upper Sam Rayburn Reservoir, Texas, 2018-2019. Gill net and electrofishing stations are indicated by G and E, respectively. Water level was near full pool at time of sampling.

38
APPENDIX C – Creel ZIP code data
Frequency of anglers that traveled various distances (miles) to Sam Rayburn Reservoir, Texas, as determined from the June 2018 through May 2019 creel survey.

39
APPENDIX D - Black bass tournament results Results from individual and team format bass tournaments at Sam Rayburn Reservoir, 2014 to 2018. Only tournaments with 5-fish bag limits and greater than 50 participants or teams were included. Average weights are expressed in pounds.
Year
N
1st place weight
2nd
place weight
3rd place weight
% total weights > 15 lbs.
% catching
limit
Big bass weight
Individual 2014 15 21.4 19.5 18.2 8.4 30.5 8.1 2015 11 19.8 18.0 17.1 6.2 44.1 7.7 2016 5 23.9 23.0 22.1 20.1 62.3 10.1 2017 11 26.6 23.7 22.1 31.2 78.6 8.7 2018 7 22.4 19.6 17.9 8.8 52.3 8.3
Team 2014 18 22.7 20.6 19.6 11.1 41.1 8.9 2015 8 26.3 21.8 20.7 12.2 40.6 10.0 2016 11 25.4 23.2 22.0 23.9 66.8 9.5 2017 9 27.5 25.2 20.7 24.6 58.0 9.2 2018 13 29.1 26.1 24.2 20.7 51.5 9.2
Results of Sealy Outdoors McDonald’s Big Bass Splash tournaments, Sam Rayburn Reservoir, 2015 – 2019. Weights are expressed in pounds. Sample sizes in parentheses.
Year
Average weight of Top 10 fish/hour
Average weight of Top 10 fish/day
Average weight of overall top 10 fish
Weight of overall big fish
2015 6.8 (210) 8.3 (30) 9.1 (10) 10.0 2016 6.9 (210) 8.7 (30) 9.6 (10) 12.0 2017 6.3 (210) 7.9 (30) 8.6 (10) 9.6 2018 6.7 (210) 8.6 (30) 9.6 (10) 12.1 2019 6.7 (210) 8.5 (30) 9.3 (10) 10.0

In accordance with Texas State Depository Law, this publication is available at the Texas State Publications Clearinghouse and/or Texas Depository Libraries.
© Texas Parks and Wildlife, PWD RP T3200-1371 (08/19)
TPWD receives funds from the USFWS. TPWD prohibits discrimination on the basis of race, color, religion, national origin, disability, age, and gender, pursuant to state and federal law. To request an accommodation or obtain information in an alternative format, please contact TPWD on a Text Telephone (TTY) at (512) 389-8915 or by Relay Texas at 7-1-1 or (800) 735-2989 or by email at [email protected]. If you believe you have been discriminated against by TPWD, please contact TPWD, 4200 Smith School Road, Austin, TX 78744, or the U.S. Fish and Wildlife Service, Office for Diversity and Workforce Management, 5275 Leesburg Pike, Falls Church, VA 22041.