sandia report sand2011-5552p 2010
TRANSCRIPT

SANDIA REPORTSAND2011-5552PUnlimited ReleasePrinted September 2011
Prepared bySandia National LaboratoriesAlbuquerque, New Mexico 87185
Sandia National Laboratories is a multi-programlaboratory managed and operated by Sandia Corporation,a wholly owned subsidiary of Lockheed Martin Corporation,for the U. S. Department of Energy’s National Nuclear SecurityAdministration under Contract DE-AC04-94AL85000.
Approved for public release; further dissemination unlimited.
Annual SiteAnnual SiteEnvironmentalEnvironmentalReportReportfor Sandiafor SandiaNationalNationalLaboratories,Laboratories,New MexicoNew Mexico
20102010


SAND2011-5552PUnlimited Release
Printed September 2011
Calendar Year 2010Annual Site Environmental Report
Sandia National Laboratories, Albuquerque, New Mexico
Produced By:Sandia National Laboratories
P.O. Box 5800Albuquerque, New Mexico 87185-1042
ABSTRACT
Sandia National Laboratories, New Mexico (SNL/NM) is a government-owned/contractor-operated facility. Sandia Corporation (Sandia), a wholly owned subsidiary of Lockheed Martin Corporation (LMC), manages and operates the laboratory for the U.S. Department of Energy (DOE), National Nuclear Security Administration (NNSA). Th e DOE/NNSA, Sandia Site Offi ce (SSO) administers the contract and oversees contractor operations at the site. Th is annual report summarizes data and the compliance status of Sandia Corporation’s environmental protection and monitoring programs through December 31, 2010. Major environmental programs include air quality, water quality, groundwater protection, terrestrial surveillance, waste management, pollution prevention (P2), environmental restoration (ER), oil and chemical spill prevention, and implementation of the National Environmental Policy Act (NEPA). Environmental monitoring and surveillance programs are required by DOE Order 450.1A, Environmental Protection Program (DOE 2008a) and DOE Manual 231.1-1A, Environment, Safety, and Health Reporting (DOE 2007).
Calendar Year 2010 Annual Site Environmental Report Sandia National Laboratories, Albuquerque, New MexicoFinal Approval date: August 2011
Work performed under Contract No. DE-ACO4-94AL85000
Prepared For:U.S. Department of Energy (DOE), National Nuclear Security Administration (NNSA),Sandia Site Offi ce, Albuquerque, New Mexico
Prepared By:Sandia Corporation, Albuquerque, New MexicoES&H and Emergency Management Center

ACKNOWLEDGMENTS
We wish to thank the following individuals who provided their time and expertise assisting in the production of the SNL/NM annual report:
PROJECT COORDINATOR/TECHNICAL EDITOR/GRAPHICS SPECIALISTRebecca Sanchez (GAITS)
DOE PROJECT LEAD/TECHNICAL REVIEWERKaren Agogino (DOE/NNSA/SSO)
TECHNICAL REVIEWERMark Miller (Sandia)
STATISTICS/DATA & PRODUCTION SUPPORTSusan Gorman (SSA)
WORD PROCESSING/PRODUCTION SUPPORTNancy White (SSA)
CONTRIBUTING AUTHORSArmstrong, Karen Duran, Leroy Mauser, Joseph Roma, CharlesBailey-White, Brenda Eckstein, Joanna Mayeux, Lucie Salinas, StephanieBonaguidi, Joseph Evelo, Stacie McCord, Samuel Skelly, MichaelBrown, Mendy French, Chris Miller, Mark Ullrich, RebeccaByrd, Caroline Gerard, Morgan Oborny, Stephanie Padilla-Vigil, YolandaCastillo, Dave Jackson, Timothy Perini, Robin Wagner, KatrinaCurran, Kelsey Jarry, Jeff Puissant, Pamela Wrons, RalphDeola, Regina Jones, Adrian Reiser, Anita
NOTE TO THE READER
Th e goal for SNL/NM Annual Site Environmental Report is to present summary environmental dataregarding environmental performance, compliance with environmental standards and requirements, andto highlight signifi cant facility programs. In addition, the U.S. Department of Energy (DOE) views this document as a valuable tool for maintaining a dialogue with our community about the environmental health of this site. We are striving to improve the quality of the contents as well as include information that is important to you. Please provide feedback, comments, questions, or requests for copies of this report and/or appendices to:
U.S. Department of EnergyNational Nuclear Security Administration
Sandia Site Offi ceP.O. Box 5400
Albuquerque, NM 87185-5400Attention: Karen Agogino
Th e SNL/NM Annual Site Environmental Report (ASER) can be found at the following website:http://www.sandia.gov/news/publications/environmental/index.html

Th is page intentionally left blank.

CONTENTS i
Acronyms and Abbreviations .................................................................................................................... viiExecutive Summary ................................................................................................................................ S-1
1.0 Introduction ................................................................................................................................ 1-1 1.1 Sandia Corporation’s History and Mission ............................................................................ 1-1
1.1.1 History ...................................................................................................................... 1-1 1.1.2 Mission ..................................................................................................................... 1-1 1.1.3 Sandia’s Operations Contract .................................................................................... 1-1
1.2 SNL/NM’s Site Location and Characteristics ......................................................................... 1-2 1.2.1 General Site Characteristics ....................................................................................... 1-2 1.2.2 Technical Areas ......................................................................................................... 1-4 1.2.3 Other Facilities .......................................................................................................... 1-5
1.3 ES&H at SNL/NM ............................................................................................................... 1-5 1.3.1 Managing a Legacy of Contamination ...................................................................... 1-6
1.4 Regional Characteristics ......................................................................................................... 1-6 1.4.1 Regional Topography and Layout.............................................................................. 1-6 1.4.2 Population ................................................................................................................. 1-8
1.5 Regional Geologic Setting ...................................................................................................... 1-8 1.5.1 Albuquerque Basin ................................................................................................... 1-9 1.5.2 Regional Fault Systems .............................................................................................. 1-9
1.6 Hydrological Settings ............................................................................................................. 1-9 1.6.1 Natural Springs ....................................................................................................... 1-12 1.6.2 Groundwater Production......................................................................................... 1-12
1.7 Regional Climate ................................................................................................................. 1-12 1.7.1 Temperature ............................................................................................................ 1-12 1.7.2 Precipitation ............................................................................................................ 1-12 1.7.3 Climate ................................................................................................................... 1-12
1.8 Regional Ecology ................................................................................................................. 1-13 1.8.1 Physiographic Provinces .......................................................................................... 1-13
1.8.2 Regional Life Zones Occurring on Kirtland Air Force Base (KAFB) ........................ 1-13 1.9 GreenGov Presidential Award .............................................................................................. 1-14
2.0 Compliance Summary ..................................................................................................................... 2-1 2.1 Compliance Status with Federal Regulations .......................................................................... 2-1 2.1.1 Comprehensive Environmental Response, Compensation, and Liability Act (CERCLA) ......................................................................................................... 2-1 2.1.2 Emergency Planning and Community Right-to-Know Act (EPCRA) ....................... 2-3 2.1.3 Resource Conservation and Recovery Act (RCRA) ................................................... 2-4 2.1.4 Federal Facility Compliance Act (FFCA) .................................................................. 2-5 2.1.5 Atomic Energy Act (AEA) ......................................................................................... 2-5 2.1.6 Clean Air Act (CAA) and Clean Air Act Amendments (CAAA) of 1990 ................... 2-6 2.1.7 Clean Water Act (CWA)........................................................................................... 2-7 2.1.8 Safe Drinking Water Act (SDWA) ............................................................................ 2-8 2.1.9 Toxic Substances Control Act (TSCA) ..................................................................... 2-9 2.1.10 Federal Insecticide, Fungicide, and Rodenticide Act (FIFRA) ................................. 2-9 2.1.11 National Environmental Policy Act (NEPA) ........................................................... 2-9 2.1.12 Endangered Species Act (ESA) ................................................................................. 2-9 2.1.13 Migratory Bird Treaty Act (MBTA) ...................................................................... 2-11 2.1.14 Cultural Resources Acts ......................................................................................... 2-11 2.1.15 Environmental Compliance Executive Orders (EO) .............................................. 2-12 2.1.16 DOE Directives ..................................................................................................... 2-12
CONTENTSii
2.1.17 Summary of Radiological Releases ........................................................................ 2-12 2.2 2010 Releases, Compliance Issues, and Environmental Occurrences ..................................... 2-13
2.2.1 Occurrence Tracking .............................................................................................. 2-13 2.2.2 Environmental Release Tracking ............................................................................. 2-14
2.3 2010 Audits and Appraisals ......................................................................................2-14 2.4 Summary of Reporting Requirements ......................................................................2-14 2.5 Summary of Environmental Permits ........................................................................2-14 2.6 Environmental Performance Measures .....................................................................2-14
3.0 Environmental Programs Information ............................................................................................ 3-1 3.1 Sandia Environmental Management System (EMS) ................................................................ 3-2 3.2 Environmental Restoration (ER) Project ................................................................................. 3-3
3.2.1 Waste Cleanup and Site Closures .............................................................................. 3-3 3.2.2 Selected Units at SNL/NM ....................................................................................... 3-4
3.3 Long Term Environmental Stewardship (LTES) Activities ..................................................... 3-9 3.4 Waste Management .............................................................................................................. 3-10
3.4.1 Hazardous and Chemical Waste .............................................................................. 3-11 3.4.2 Radioactive Waste and Mixed Waste ...................................................................... 3-14 3.4.3 Mixed Waste Regulatory Status ............................................................................... 3-15 3.4.4 Solid Waste ............................................................................................................. 3-16 3.4.5 P2 Program ............................................................................................................ 3-16 3.4.5.1 Sustainable Acquisition (SA) Program .................................................... 3-18 3.4.5.2 Waste Reduction ..................................................................................... 3-18 3.4.5.3 Electronics Stewardship........................................................................... 3-19 3.4.5.4 Recycling ................................................................................................ 3-20
3.5 Biological Control Activities ................................................................................................. 3-21 3.6 National Environmental Policy Act (NEPA) Program .......................................................... 3-21 3.7 Environmental Outreach Program ........................................................................................ 3-23
4.0 Terrestrial and Ecological Surveillance............................................................................................ 4-1 4.1 Terrestrial Surveillance Program .................................................................................4-1 4.1.1 Program Objectives .......................................................................................4-1 4.1.2 Sample Media ...............................................................................................4-3 4.1.3 Sampling Locations .......................................................................................4-3 4.1.4 Radiological Parameters and Results ..............................................................4-5 4.1.5 Non-Radiological Parameters and Results......................................................4-7 4.2 Ecological Surveillance .............................................................................................4-15
5.0 Air Quality Compliance & Meteorological Monitoring ................................................................. 5-1 5.1 Meteorological Monitoring Program ...................................................................................... 5-1 5.1.1 Meteorological Monitoring Results ........................................................................... 5-3 5.1.2 Wind Analysis ........................................................................................................... 5-3 5.2 Ambient Air Surveillance Program .......................................................................................... 5-3 5.2.1 Monitoring Stations .................................................................................................. 5-3 5.2.2 Ambient Air Monitoring Results ............................................................................... 5-8 5.3 Radiological Air Emissions .................................................................................................... 5-11 5.3.1 Compliance Reporting ............................................................................................ 5-11 5.3.2 SNL/NM NESHAP Facilities ................................................................................. 5-12 5.4 Assessment of Potential Dose to the Public ........................................................................... 5-15 5.4.1 NESHAP Dose Assessment .................................................................................... 5-15 5.4.2 Dose Assessment Results ......................................................................................... 5-17 5.5 Air Compliance Requirements & Compliance Strategies ...................................................... 5-19 5.5.1 SNL/NM Air Emission Sources .............................................................................. 5-20

CONTENTS iii
5.5.2 Title V .................................................................................................................... 5-27 5.5.3 Compliance Strategies ............................................................................................ 5-28
6.0 Water Quality 6.1 Wastewater Discharge Program .................................................................................6-1 6.1.1 SNL/NM and the ABCWUA .....................................................................6-1 6.1.2 Permitting and Reporting ............................................................................6-3 6.1.3 Wastewater Monitoring Stations...................................................................6-3 6.1.4 TA-V Radiological Screening ......................................................................6-4 6.1.5 Summary of Monitoring Results .................................................................6-5 6.1.6 Sanitary Sewer System Releases in 2010 .......................................................6-5 6.2 Surface Discharge Program .......................................................................................6-5 6.2.1 Surface Discharge Approval and Permitting .................................................6-5 6.2.2 Surface Discharge Releases in 2010 ..............................................................6-6 6.2.3 Pulsed Power Evaporation Lagoons ..............................................................6-6 6.3 Storm Water Program ...............................................................................................6-7 6.3.1 Storm Drain System ....................................................................................6-7 6.3.2 Storm Water Monitoring Stations ..............................................................6-10 6.3.3 Routine Inspections....................................................................................6-10 6.3.4 2010 Activities ..........................................................................................6-13 6.4 Oil Storage & Spill Control .....................................................................................6-13
7.0 Quality Assurance ............................................................................................................................ 7-1 7.1 Corporate Level Quality Assurance (QA) ................................................................................ 7-1
7.1.1 Environment, Safety & Health (ES&H) Policy Statement Requirement ................... 7-2 7.1.2 Integrated Laboratory Management System (ISMS) .................................................. 7-2
7.2 Environmental Program Quality Assurance ............................................................................ 7-4 7.3 2010 Sample Management Offi ce (SMO) Activities ................................................................ 7-5
8.0 References, Regulations & Standards for Environmental Programs .............................................. 8-1
9.0 Glossary ............................................................................................................................................ 9-1
Distribution ...........................................................................................................................................Dist-1
NOTE: “Groundwater Levels” (formerly Chapter 7 in previous year’s ASERs) is now Appendix B. All appendices are located on attached CD on the back inside cover of this report.
APPENDIX A 2010 Wastewater Monitoring Results ....................................................(See Attached CD)APPENDIX B Calendar Year 2010 Annual Groundwater Monitoring Report ..............(See Attached CD)APPENDIX C 2010 Terrestrial Surveillance Results ......................................................(See Attached CD)APPENDIX D 2010 Storm Water Sampling Results .....................................................(See Attached CD)
FIGURES
1-1 SNL/NM Technical Areas and the U.S. Forest Service Land Withdrawn Area ...............................1-31-2 State of New Mexico Map .............................................................................................................1-71-3 Generalized Geology in the Vicinity of SNL/NM and KAFB ......................................................1-101-4 Hydrogeologically Distinct Areas Primarily Controlled by Faults .................................................1-113-1 Six Year Summary of Total Radioactive Waste Shipped at SNL/NM ............................................3-154-1 Terrestrial Surveillance Program On-Site and Perimeter Sampling Locations .................................4-84-2 Terrestrial Surveillance Program Off -Site Sampling Locations........................................................4-94-3 TLD Exposure Rates By Year and Location Class .......................................................................4-10

CONTENTSiv
5-1 Th e Clean Air Network (CAN) of Meteorological Towers and Ambient Air Monitoring Stations ................................................................................................................5-25-2 Variations and Extremes in Meteorological Measurements Across the Meteorological Tower Network During CY 2010 ..........................................................................5-55-3 2010 Annual Wind Roses for Towers CL1, A36, and SC1 .............................................................5-65-4 2010 Annual Wind Roses for Daytime and Nighttime Wind Frequency at the A36 Tower .......................................................................................................................... 5-75-5 Locations of the 13 Facilities at SNL/NM that Provided Radionuclide Release Inventories in 2010 .....................................................................................................................5-145-6 Summary of Atmospheric Releases in Argon-41 and Tritium from SNL/NM Facilities from 2000 to 2010 ........................................................................................................5-166-1 Wastewater Monitoring Station Locations .....................................................................................6-26-2 Storm Water Monitoring Point Locations at SNL/NM .................................................................6-97-1 Sandia’s Integrated Laboratories Management System (ILMS) .......................................................7-17-2 ISMS Star ......................................................................................................................................7-3
TABLES 1-1 Common Plants and Animals Identifi ed at KAFB .......................................................................1-142-1 Major Environmental Regulations & Statutes Applicable to SNL/NM ..........................................2-22-2 2010 SARA Title III (or EPCRA) Reporting Requirements Applicable to SNL/NM .....................2-32-3 Th reatened and Endangered Species Potentially Occurring in Bernalillo County, NM ................2-102-4 SNL/NM Radiological Dose Reporting for Calendar Year 2010 ..................................................2-132-5 Environmentally-Related Occurrences for Five Years (2006-2010) ..............................................2-152-6 DOE Manual 231.1-2 Reportable Environmental Occurrences, 2010.........................................2-162-7 Environmental Program Audits and Appraisals Conducted in 2010 ............................................2-182-8 Summary of Sandia Reporting Requirements to Outside Agencies (Other than DOE) for Releases of Pollutants or Hazardous Substances .......................................2-193-1 Summary of ER Project Status, 1992- 2010 ..................................................................................3-53-2 Waste Shipped by SNL/NM Waste Management Facilities During Calendar Year 2010 ..............3-123-3 Waste Recycled by SNL/NM During Calendar Year 2010 ...........................................................3-133-4 Summary Data for SNL/NM NEPA Reviews Submitted to DOE/NNSA/SSO During Calendar Year 2010 .........................................................................................................3-224-1 Decision Matrix for Determining Priority Action Levels ................................................................4-24-2 On-Site Terrestrial Surveillance Locations and Sample Types .........................................................4-44-3 Perimeter Terrestrial Surveillance Locations and Sample Types ......................................................4-64-4 Off -Site Terrestrial Surveillance Locations and Sample Types .........................................................4-74-5 Radiological Summary Statistics for Sample Locations Noted as Priority-2 During Calendar Year 2010 .........................................................................................................4-104-6 Summary Statistics for TLD Exposure Rates, 2000-2010 ............................................................4-104-7 Various Reference Values for Metals in Soil .................................................................................4-124-8 Summary Statistics for All Locations Identifi ed as Priority-1 for Metals in Soil During Calendar Year 2010 .........................................................................................................4-124-9 Summary Statistics for All Locations Identifi ed as Priority-2 for Metals in Soil During Calendar Year 2010 .........................................................................................................4-13 4-10 Summary Statistics for All Locations Identifi ed as Priority-3 for Metals in Soil During Calendar Year 2010 .........................................................................................................4-135-1 Annual Climatic Summary from Tower A36 During Calendar Year 2010 ......................................5-45-2 Criteria Pollutant Results as Compared to Regulatory Standards During Calendar Year 2010 .......5-85-3 Monthly and Annual Averages for PM10 (Air) During Calendar Year 2010 ....................................5-95-4 Monthly and Annual Averages for PM2.5 (Air) During Calendar Year 2010 ....................................5-95-5 Averaged Results of PM10 Analysis (Air) During Calendar Year 2010 ...........................................5-10

CONTENTS v
5-6 VOC Average Concentrations Compiled from Monthly Results at Four Stations (Air) During Calendar Year 2010 .........................................................................................................5-125-7 Summary of Radionuclide Releases from the 13 NESHAP Sources During Calendar Year 2010 ....................................................................................................................................5-135-8 Annual Source-Specifi c Eff ective Dose Equivalent (EDE) from Primary Sources to Off -Site Receptors During Calendar Year 2010 ..........................................................5-175-9 Annual Source-Specifi c Eff ective Dose Equivalent (EDE) to On-Site Receptors During Calendar Year 2010 .........................................................................................................5-185-10 Calculated Dose Assessment Results for On-Site and Off -Site Receptors and for Collective Populations During Calendar Year 2010 .........................................................5-185-11 Boiler Usage and Emission Data During Calendar Year 2010 ......................................................5-215-12 Boilers Associated with Permits and Registrations During Calendar Year 2010 ............................5-225-13 Generator Hours and Emission Data During Calendar Year 2010 ...............................................5-245-14 Emergency Generators Associated with the Permits and Registrations During Calendar Year 2010 .....................................................................................................................5-255-15 HAP Chemical Usage Reportable Data During Calendar Year 2010............................................5-265-16 Facilities with Permits or Registrations for Chemical Use During Calendar Year 2010 .................5-266-1 SNL/NM Wastewater Discharge Permits and Station Characteristics ............................................6-46-2 NMWQCC Monitoring and Reporting Requirements ..................................................................6-76-3 SNL/NM Facilities Subject to Storm Water Permitting ...............................................................6-116-4 MSGP Storm Water Monitoring Requirements During Calendar Year 2010 ...............................6-128-1 Summary of Environmental Permits and Registrations in Eff ect During Calendar Year 2010 .......................................................................................................................8-98-2 Federal and State Air Regulations Applicable to SNL/NM ..........................................................8-158-3 Summary of Compliance History with Regard to Mixed Waste (MW) at SNL/NM ....................8-168-4 Mixed Waste Treatment and Disposal Status (End of FY 2010) ...................................................8-198-5 Derived Concentration Guides (DCGs) for Selected Radionuclides ............................................8-208-6 General Dose Limits to the Public from DOE Facilities ..............................................................8-218-7 Groundwater Monitoring Parameters Required by 40 CFR 265, Subpart F ................................8-218-8 EPA Primary Drinking Water Supply Standards/New Mexico Drinking Water Standards ...........8-228-9 EPA Secondary Drinking Water Supply Standards.......................................................................8-248-10 New Mexico Water Quality Control Commission (NMWQCC) Standards for Groundwater of 10,000 mg/L total dissolved solid (TDS) Concentration or Less ..................8-25
CONTENTSvi
This page intentionally left blank.

CONTENTS vii
Acronyms and Abbreviations A ABC/AQCB Albuquerque-Bernalillo County/Air Quality Control Board ABCWUA Albuquerque Bernalillo County Water Utility Authority ACE U.S. Army Corps of Engineers ACRR Annular Core Research Reactor ADA Americans with Disabilities Act AEA Atomic Energy Act AHCF Auxiliary Hot Cell Facility AIRFA American Indian Religious Freedom Act AIS Albuquerque International Sunport ALARA as low as reasonably achievable AML Advanced Materials Laboratory AMPF Advanced Manufacturing Prototype Facility AMPL Advanced Manufacturing Process Laboratory AMWTP Advance Mixed Waste Treatment Project ANOVA Analysis of Variance AOC area of concern APPRM Advanced Pulsed Power Research Module AQC Air Quality Compliance AQCB Air Quality Control Board AQMD Air Quality Management District ARCOC Analysis Request and Chain-of-Custody ARPA Archaeological Resources Protection Act ASER Annual Site Environmental Report AST above-ground storage tank ATC authority-to-construct AWN Acid Waste Neutralization
B BGS below ground surface BMP Best Management Practice BSG Burn Site Groundwater BWX Babcock & Wilcox Technical Services Group, Inc
C C&D Construction and Demolition CA Compliance Agreement CAA Clean Air Act CAAA Clean Air Act Amendment CAC Corrective Action Complete CAMU Corrective Action Management Unit CAN Clean Air Network CAP Consolidated Audit Program CAP88 Clean Air Act Assessment Package-1988 CARA Concrete and Asphalt Recycling Area CEARP Comprehensive Environmental Assessment and Response Program CEP Chemical Exchange Program CERCLA Comprehensive Environmental Response, Compensation, and Liability Act CERR Consolidated Emission Reporting Rule CFR Code of Federal Regulations CFRC Customer Funded Records Center CINT Center for Integrated Nanotechnologies

CONTENTSviii
CME Corrective Measures Evaluation CMS Corrective Measures Study CMI Corrective Measures Implementation CMIP Corrective Measures Implementation Plan COA City of Albuquerque COC contaminants of concern COD Chemical Oxygen Demand COOC Compliance Order on Consent CPA Closure Plan Amendment CPG Comprehensive Procurement Guidelines CPMS Criteria Pollutant Monitoring Station CSS CWL/sanitary sewer CTF Coyote Test Field CWA Clean Water Act CWL Chemical Waste Landfi ll CWP Corporate Work Process CY Calendar Year
D D&D decontamination and demolition DCG Derived Concentration Guide DETS Dynamic Explosives Test Site DoD U.S. Department of Defense DOE U.S. Department of Energy DOECAP DOE Consolidated Audit Program DQO data quality objective DSS Drain and Septic Systems DSSI Diversifi ed Scientifi c Services, Inc.
E EA Environmental Assessment EBOM Existing Building Operations and Maintenance ECF Explosive Components Facility EDE eff ective dose equivalent EEANM Environmental Education Association of New Mexico EHD Environmental Health Division EIS Environmental Impact Statement EM Environmental Management EMS Environmental Management System EO Executive Order EPA U.S. Environmental Protection Agency EPCRA Emergency Planning and Community Right-to-Know Act EPEAT Electronic Product Environmental Assessment Tool ER Environmental Restoration ES&H Environment, Safety, and Health ESA Endangered Species Act ET evapotranspirative
F FCC Facilities Command Center FEC Federal Electronics Challenge FFCA Federal Facilities Compliance Act FFCO Federal Facility Compliance Order FIFRA Federal Insecticide, Fungicide, and Rodenticide Act FLAME Fire Laboratory used for the Authentication of Modeling and Experiments

CONTENTS ix
FOP fi eld operating procedure FR Federal Register FY Fiscal Year
G GCP General Construction Permit GEL General Engineering Laboratories GHG greenhouse gas GIF Gamma Irradiation Facility GP guiding principles GSA General Services Administration GSF Gross Square Footage GWPP Groundwater Protection Program
H HAP hazardous air pollutant HBWSF High-Bay Waste Storage Facility HCF Hot Cell Facility HDRV Historical Disposal Requests Validation HE high explosive HERMES-III High Energy Radiation Megavolt Electron Source-III HLW high-level radioactive waste HPML High Power Microwave Laboratory HSM Heating System Modernization HSWA Hazardous and Solid Waste Amendment HWB Hazardous Waste Bureau HWMF Hazardous Waste Management Facility
I I-40 Interstate 40 IBL Ion Beam Laboratory IC institutional control ICM Interim Corrective Measure ILMS Integrated Laboratory Management System IPB International Programs Building IPOC Innovation Parkway Offi ce Center ISDP Internal Surface Discharge Program ISMS Integrated Safety Management System ISO International Organization for Standardization IT Information Technology
J JCEL Joint Computational Engineering Laboratory
K KAFB Kirtland Air Force Base KTF Kauai Test Facility L LANL Los Alamos National Laboratory LDPE low density polyethylene LDR Land Disposal Restrictions LE landfi ll excavation LECS Liquid Effl uent Control System LEED Leadership in Energy and Environmental Design LLW low-level waste LMC Lockheed Martin Corporation

CONTENTSx
LTES Long-Term Environmental Stewardship LTMMP Long-Term Monitoring and Maintenance Plan LTS Long-Term Stewardship LTTD Low-Temperature Th ermal Desorption M M&O Management and Operating MAC maximum allowable concentration MAPEP Mixed Analyte Performance Evaluation Program MBTA Migratory Bird Treaty Act MCL maximum contaminant level (Chapter 2) MCL Maximum Contaminant Limits (Chapter Exec Summary) MDL Microelectronics Development Laboratory MEI maximally exposed individual MESA Microsystems and Engineering Sciences Application MLLW mixed low-level waste MOCVD Metalorganic Chemical Vapor Deposition MP monitoring point MSB Manzano Storage Bunker MSDS Material Safety Data Sheet MSGP Multi-Sector General Permit MTRU mixed TRU MW mixed waste MWL Mixed Waste Landfi ll
N N/A not applicable NAAQS National Ambient Air Quality Standards NASP National Air Sampling Program NC New Construction NEI National Emissions Inventory NELAC National Environmental Laboratory Accreditation Conference NEPA National Environmental Policy Act NESHAP National Emission Standards for Hazardous Air Pollutants NGF Neutron Generator Facility NGPF Neutron Generator Production Facility NHPA National Historic Preservation Act NISAC National Infrastructure Simulation and Analysis Center NMAAQS New Mexico Ambient Air Quality Standards NMAC New Mexico Administrative Code NMDOA New Mexico Department of Agriculture NMED New Mexico Environment Department NMHWA New Mexico Hazardous Waste Act NMSA New Mexico Statutes Annotated NMWQCC New Mexico Water Quality Control Commission NNSA National Nuclear Security Administration NOD Notice of Disapproval NOI Notice of Intent NON Notice of Noncompliance NOV Notice of Violation NPDES National Pollutant Discharge Elimination System NPL National Priorities List NPN nitrate plus nitrite NRC U.S. Nuclear Regulatory Commission

CONTENTS xi
NSPS New Source Performance Standard NSR New Source Review NWS National Weather Service
O ODS Ozone Depleting Substance ORPS Occurrence Reporting Processing System
P P2 Pollution Prevention PA/SI Preliminary Assessment/Site Inspection PCB polychlorinated biphenyl PCCP Post-Closure Care Permit (Chapter 1) PCCP Post-Closure Care Plan (Chapter 2 & 3) PEP Performance Evaluation Plan PER Performance Evaluation Report PETL Processing and Environmental Technology Laboratory PGWS perched groundwater system pH potential Hydrogen PM particulate matter PM10 respirable particulate matter (diameter equal to or less than 10 microns) PM2.5 respirable particulate matter (diameter equal to or less than 2.5 microns) POTW Publicly-Owned Treatment Works PPE personnel protection equipment PRD Process Research Development PSD Prevention of Signifi cant Deterioration PSL Primary Subliner
Q QA quality assurance QAPP Quality Assurance Project Plan QC quality control QSAS Quality Systems Analytical Services
R R&D research and development RAP Remedial Action Plan RCRA Resource Conservation and Recovery Act RFQ Request for Quotation RHEPP 1 Repetitive High Energy Pulsed Power 1 RITS Radiographic Integrated Test Stand RMWMF Radioactive and Mixed Waste Management Facility ROD Record of Decision RPICL Radiation Protection Instrument Calibration Laboratory RPSD Radiation Protection Sample Diagnostics RQ reportable quantity RSY Reapplication Services Yard
S S3 Safe, Secure, and Sustainable SA Sustainable Acquisition Sandia Sandia Corporation SAP Sampling and Analysis Plan SARA Superfund Amendments and Reauthorization Act SDWA Safe Drinking Water Act SHPO State Historic Preservation Offi ce SIC Standard Industrial Classifi cation

CONTENTSxii
SMO Sample Management Offi ce SNL/CA Sandia National Laboratories, California SNL/NM Sandia National Laboratories, New Mexico SOP Standard Operating Procedure SOW statement of work SPCC Spill Prevention Control and Countermeasures (plan) SPHINX Short Pulse High Intensity Nanosecond X-Radiator (an accelerator facility) SSL soil screening level SSO Sandia Site Offi ce SSP Site Sustainability Plan SSPP Strategic Sustainability Performance Plan ST stabilization treatment START Sandia Tomography and Radionuclide Transport STP Site Treatment Plan SUWCO Sewer Use and Wastewater Control Ordinance SVE soil vapor extraction SVOC Semi Volatile Organic Compound SWEIS Site-Wide Environmental Impact Statement SWMU Solid Waste Management Unit SWP3 Storm Water Pollution Prevention Plan SWRI Southwest Research Institute SWTF Solid Waste Transfer Facility
T TA Technical Area TAG Tijeras Arroyo Groundwater TAI Tijeras Arroyo Intercept TAL Target Analyte List TCE trichloroethylene TCLP toxicity characteristic leaching procedure TDS total dissolved solids TG treatability groups TLD Th ermoluminescent Dosimeter TLV threshold limit value TNMHC total non-methane hydrocarbon TOC Total Organic Carbon TOMP Toxic Organic Management Plans TOP Technology and Operations Prototype TOX total halogenated organics TPO Th ermoplastic Polyolefi n TRI Toxic Release Inventory TRU transuranic (radioactive waste) TSCA Toxic Substances Control Act TSD treatment, storage, and disposal TSDF treatment, storage, and disposal facility TSP total suspended particulate TTC Th ermal Test Complex TTF Th ermal Treatment Facility TTR Tonopah Test Range U UNM University of New Mexico U.S. United States USAF U.S. Air Force

CONTENTS xiii
USFS U.S. Forest Service USGS U.S. Geological Survey UST underground storage tank
V VCM Voluntary Corrective Measure VOC volatile organic compound VSA Vertical Sensor Array VZMS Vadose Zone Monitoring System
W WIF Weapons Integration Facility WQG Water Quality Group
Z Z-Machine Z Accelerator
UNITS OF MEASURE / RADIOACTIVITY MEASUREMENTS
bgs below ground surface °C degree Celsius °F degree Fahrenheit ft feet ft3 cubic feet gal gallonkg kilogram km kilometerL liter lb pound mb millibar mph miles per hourmg milligram mi mile MMBtu Million British Th ermal Units min minutesppbv parts per billion by volume sq ft square feettpy tons per year yd3 cubic yardyr year mi2 square milerem roentgen equivalent man Sv Sievertmrem millirem (unit of radiation dose) Ci curieperson-Sv person-Sievert (unit of radiation dosage) pCi picocurieperson-rem radiation dose to population (also man-rem) μg microgrammSv millisievert (unit of radiation dosage) mR milliroentgenμR/hr microroentgen per hour cm centimeter

CONTENTSxiv
This page intentionally left blank.

S-1Execu ve Summary
Execu ve Summary Sandia National Laboratories, New Mexico (SNL/NM) is one of the nation’s premier multi-program national security laboratories. Sandia Corporation (Sandia), a wholly owned subsidiary of Lockheed Martin Corporation (LMC), manages and operates the laboratory for the U.S. Department of Energy (DOE), National Nuclear Security Administration (NNSA). Th e DOE/NNSA, Sandia Site Offi ce (SSO) administers the contract and oversees contractor operations at the site. Th is Annual Site Environmental Report (ASER) was prepared in accordance with and as required by DOE Order 450.1A, Environmental Protection Program (DOE 2008a) and DOE Manual 231.1-1A, Environment, Safety, and Health Reporting Manual (DOE 2007). Th is ASER summarizes the environmental protection, restoration, and monitoring programs in place at SNL/NM for Calendar Year (CY) 2010. It also discusses Sandia’s compliance with environmental statutes, regulations, and DOE directives and permit provisions; and it highlights signifi cant environmental program eff orts and accomplishments. Th is ASER is a key component of DOE’s eff ort to keep the public informed about environmental conditions throughout the DOE/NNSA nuclear weapons complex.
Environmental ProgramsSandia’s methodology for managing and implementing its Environment, Safety, and Health (ES&H) Program is outlined in the Integrated Safety Management System (ISMS). Th e ISMS is centered upon fi ve safety management functions that provide processes to guide management in identifying and controlling hazards. Furthermore, Sandia implemented an Environmental Management System (EMS) to enhance the ISMS. Th e EMS is the component of ISMS that addresses the environmental aspects and impacts of SNL/NM’s activities, products, and services. Sandia continued to improve environmental management and work processes and received International Organization for Standardization (ISO) 14001 Certifi cation in 2009. For additional information about EMS and ISMS refer to Chapters 3 and 8 of this report.
While all 2010 program activities are performed continuously, they are reported in this ASER on a CY basis, unless otherwise noted (programs based on the Fiscal Year [FY] run from October 1st through September 30th, annually). A summary of the primary environmental programs in place at SNL/NM are summarized below.
Waste ManagementWaste at SNL/NM is processed at nine facilities: the Hazardous Waste Management Facility (HWMF), the Th ermal Treatment Facility (TTF), the Radioactive and Mixed Waste Management Facility (RMWMF), fi ve Manzano Storage Bunkers (MSB), and the Solid Waste Transfer Facility (SWTF). In addition, the Reapplication Services Yard (RSY) processes material and equipment for recycling, after it is determined that it cannot be reapplied or sent for auction. For additional information about waste management programs and activities refer to Chapters 2 and 3 of this report.
Pollution Prevention (P2) Th e P2 Program provides assessment, guidance, and assistance to the laboratories’ workforce to implement measures that reduce resource use, generated waste, and to enhance the overall effi ciency of processes and organizations within SNL/NM. Additionally, the P2 Program works with several facilities to continue or initiate new recycle avenues for waste. In 2010, Sandia received several awards for P2 accomplishments. For additional information about P2 refer to Chapter 3 of this report.

S-2 2010 Annual Site Environmental Report
Environmental Restoration (ER) ProjectTh e ER Project currently collects groundwater samples at fi ve general project areas: the Chemical Waste Landfi ll (CWL), the Mixed Waste Landfi ll (MWL), Technical Area (TA)-V, Tijeras Arroyo Groundwater (TAG), and Burn Site Groundwater (BSG). Water quality results reported by the ER Project were consistent with past years’ analytical results.
At the close of CY 2010, there were 33 regulated ER sites remaining to be completed at SNL/NM. Of the remaining 33 sites, 31 were submitted for Corrective Action Complete (CAC) determinations from the New Mexico Environment Department (NMED). In April 2010 the NMED issued a letter requesting additional corrective action at fi ve of the 31 sites, including Solid Waste Management Units (SWMU) 8, 58, 68, 149, and 154. Th e remaining 26 sites are currently in the public comment process with a hearing anticipated in 2011 or 2012. Th e two remaining sites consist of the CWL, which is undergoing fi nal closure activities, and the MWL where the fi nal remedy (soil cover) was completed during 2009. In addition to the 33 sites, fi nal remedies are pending for three groundwater areas of concern (AOC) (TA-V, TAG, and BSG), and three sites with potential soil contamination will be evaluated at the completion of their test operations. For additional information about the ER Project refer to Chapter 3 of this report.
Long-Term Environmental Stewardship (LTES)Th e SNL/NM LTES Program provides environmental stewardship for past, present, and future activities at SNL/NM. LTES “promotes the long-term stewardship of a site’s natural and cultural resources throughout its operational, closure, and post-closure life cycle” (DOE/SNL 2006). Th e environmental programs referred to in this document support that stewardship. For additional information about LTES refer to Chapter 3 of this report.
Long-Term Stewardship (LTS)A major component of the LTES Program is LTS of legacy sites. Stewardship of legacy sites is defi ned as activities necessary to maintain long-term protection of human health, the environment, and natural and cultural resources from hazards associated with residual radioactive and hazardous contamination at former ER sites. Sandia’s LTS activities are increasing as remedial activities required at ER sites are completed. Th e LTS Program conducts compliance oversight activities, including long-term monitoring, to comply with NMED requirements. A monitoring well network of more than 70 wells is sampled for the presence of contaminants of concern (COC) at various intervals during the year. Th e data from this sampling activity are evaluated on an ongoing basis and kept in a comprehensive database. Th e LTS Program also conducts institutional control (IC) and community outreach to keep the public informed of LTS Program activities. Compliance Oversight Activities, IC Activities, Community Liaison and Stakeholder Involvement Activities for 2010 are summarized in Chapter 3 of this report. Additional information is available at the LTES website:
http://elm.sandia.gov
Terrestrial SurveillanceTh e Terrestrial Surveillance Program conducts sampling activities at SNL/NM to detect any potential releases or migration of radiological or non-radiological contaminated material to off -site locations (community locations outside Kirtland Air Force Base [KAFB] boundaries). Soil, sediment, and vegetation are collected from on-site, perimeter, and off -site locations. In 2010, there were no terrestrial sample results that indicated concerns or that further investigation or corrective action was warranted. For additional information refer to Chapter 4 of this report.
S-3Execu ve Summary
Air QualityAmbient Air Monitoring – Sandia measures ambient air quality at six locations throughout SNL/NM, and compares results with National Ambient Air Quality Standards (NAAQS) and local ambient air regulations. Th e network monitors criteria pollutants and volatile organic compounds (VOC).
Air Quality Compliance (AQC) – Air quality standards are implemented by regulations promulgated by local and federal governments in accordance with the Clean Air Act (CAA) and the CAA Amendments (CAAA) of 1990. Th e Albuquerque Bernalillo County/Air Quality Control Board (ABC/AQCB), the State of New Mexico and the U.S. Environmental Protection Agency (EPA) determine applicable air quality standards for non-radiological pollutants. Th e AQC program currently maintains 17 issued authority-to-construct (ATC) New Source Review (NSR) permits; and 26 issued NSR registrations from the City of Albuquerque (COA). Currently, there are no NSR source registrations pending issuance with the COA.
Radiological National Emission Standards Hazardous Air Pollutants (NESHAP) Compliance – Subpart H of NESHAP regulates radionuclide air emissions from DOE/NNSA facilities, with the exception of naturally occurring radon. In 2010, there were 13 SNL/NM facilities reporting NESHAP regulated emissions. Th e Radiological NESHAP Program evaluates facilities that have the potential to release emissions to the environment yearly. Two facilities ceased operations and one new facility started operations in CY 2010. In September of 2009, an evapotranspirative (ET) cover was installed at the MWL. Based upon past emissions studies and the new ET cover thickness, any potential release from the MWL is negligible (i.e., essentially zero) and will no longer be considered a radiological NESHAP source. Th e Hot Cell Facility’s (HCF) process ventilation system stack was reduced by a height of 80 feet in 2009. Due to the modifi cation the HCF will not be operated and is no longer considered a radiological NESHAP source. Operations at the Auxiliary Hot Cell Facility (AHCF) began in CY 2010. Th is facility characterizes, sorts, and repackages radioactive and mixed wastes exceeding the facility inventory limits of the RMWMF. In 2010, the primary radionuclides released were tritium and argon-41. In 2010, the on-site maximally exposed individual (MEI) was located on KAFB. Th e on-site MEI dose of 2.98E-02 millirems per year (mrem/yr) at the Honeywell Systems Support Site resulted primarily from conservatively calculated releases of americium-241 from the nearby Sandia Tomography and Radionuclide Transport Laboratory (START) Laboratory. In CY 2010 an americium-241 source for research was received at the START Laboratory with contamination on the outside of the vial. After numerous attempts at decontamination, the source was unable to be suffi ciently decontaminated to permit use of the source for the desired application. Th erefore, the source was returned to the vendor in the packing material received. Th e source was double bagged and no contamination existed on the outside of the bags when returned. Nevertheless, conservative release calculations arising from this activity were attributed to americium-241. Th e off -site MEI was located at the Eubank Gate Area. Th e MEI of 3.41E-03 mrem/yr at the Eubank Gate Area resulted also primarily from conservatively calculated releases of americium-241 from the nearby START Laboratory. Both doses are well below the 10 mrem/yr EPA standard. For additional information refer to Chapter 5 of this report.
Water QualityWastewater – Wastewater from SNL/NM is discharged from six on-site outfalls permitted by the Albuquerque Bernalillo County Water Utility Authority (ABCWUA). Wastewater monitoring is conducted to ensure that all discharges meet the standards set by the ABCWUA’s Publicly-Owned Treatment Works (POTW). During CY 2010, there was one reportable event. Th is event was discovered during a review of sampling data by ABCWUA and SNL/NM. During compliance sampling conducted on April 20, 2010, arsenic was detected at 0.132 milligrams per liter (mg/L) which

S-4 2010 Annual Site Environmental Report
exceeded the discharge limit of 0.051 mg/L. Th e result was reported by the ABCWUA and confi rmed after a review of the SNL/NM split sample that was collected during the ABCWUA sampling event. Th e investigation and review of the arsenic sources within the Station WW007 (Permit 2069G) fl ow basin allowed SNL/NM to isolate the source and allowed corrective actions to be implemented. See Section 6.1.1 for details. All discharge parameters at the other permitted locations were met resulting in SNL/NM receiving fi ve “Gold Pre-Treatment Awards” and one “Silver Pre-Treatment Award” from the ABCWUA for the 2009-2010 treatment year.
Surface Discharge – All water that will be discharged to the ground surface, either directly or to lined containments, must meet State of New Mexico surface discharge standards. All discharges in 2010 met NMED New Mexico Water Quality Control Commission (NMWQCC) standards and were approved by Sandia. Additionally, routine surface discharges are made to two evaporation lagoons that service the pulsed power facilities under an existing discharge permit. During CY 2010, all permit requirements were met for both NMED permitted lagoons. Th ere was one surface release reported to NMED. For additional information on this release refer to Chapters 2 and 6 of this report.
Storm Water Runoff – Quarterly visual sampling and analytical sampling were conducted in 2010. All monitoring data collected was submitted to EPA and can be found in Appendix D of this report. Visual observations of storm water were performed when there was adequate runoff to collect a sample. Th e majority of the visual observations of storm water quality were done in the summer months and these assessments did not produce any indications of storm water pollution.
Oil Storage and Spill Control – Sandia’s Spill Prevention Control and Countermeasures (SPCC) Plan (required under the Clean Water Act [CWA]) describes the oil storage facilities at SNL/NM and the mitigation controls in place to prevent inadvertent discharges of oil. Th e facilities at SNL/NM that are subject to regulations include oil storage tanks (aboveground storage tanks [AST] and underground storage tanks [UST]), bulk storage areas (multiple containers), and temporary or portable tanks. Sandia currently operates 46 ASTs and fi ve USTs at SNL/NM. For additional information refer to Chapter 6 of this report.
Groundwater Protection Th e Groundwater Protection Program (GWPP) includes general surveillance of water quality from a network of wells not directly associated with ER Project sites. Annual samples were collected from 16 wells and one spring. Analyses were conducted for metals, VOC, inorganics (including nitrate, anions, and cyanide), phenolics, alkalinity, total halogenated organics (TOX), gross alpha, gross beta, and selected radionuclides. Groundwater samples from six wells were analyzed for high explosives (HE). Th e six designated wells are used to establish background concentrations of HE at the Dynamic Explosives Test Site (DETS) east and south of TA-III and to monitor potential groundwater impacts from explosive testing. No VOCs or HEs were detected at concentrations above EPA Safe Drinking Water Regulations Maximum Contaminant Limits (MCL) or New Mexico Water Quality Commission Maximum Allowable Concentrations (MAC). Fluoride was detected above the MAC in Coyote Springs and three groundwater wells. Arsenic concentrations in one well exceeded the MCL and beryllium concentrations in Coyote Springs exceeded the MCL. Combined radium-226 and radium-228 exceeded the MCL at one groundwater well. Th e exceedance for each of these elements is attributable to the elevated natural concentrations associated with bedrock groundwater systems at the sampling locations. Please refer to Appendix B (formerly ASER Chapter 7 Groundwater) of this report for detailed information and results of the analysis of collected groundwater samples.

S-5Execu ve Summary
Groundwater levels are measured in 78 wells on a quarterly or monthly basis. Wells that have stable trends are measured monthly; wells that have fl uctuating water levels due to seasonal pumping at nearby extractive wells are measured on a monthly frequency. Water level data are used to generate a regional water table elevation contour map from which groundwater fl ow directions can be obtained. Groundwater elevation table, hydrographs, and contour maps derived from the data are provided in SNL/NM’s Calendar Year 2010 Annual Groundwater Monitoring Report (Appendix B). Th e report also provides information on the overall objectives of the GWPP, the regulatory drivers, the DOE directives that govern the program, and the program related activities that occurred during CY 2010.
ER – Th e ER Project collects groundwater samples at fi ve project areas—CWL, MWL, TA-V, TAG, and BSG. CY 2010 water quality results for these fi ve areas were consistent with results from past years, and the groundwater analytical results are provided in SNL/NM’s Calendar Year 2010 Annual Groundwater Monitoring Report (Appendix B). All analytical results were below applicable MCLs at the CWL and MWL. At TA-V, several analytical results exceeded the MCL for trichloroethene (TCE) and nitrate plus nitrite (NPN): TCE exceeded the MCL of 5 mg/L in three wells with a maximum concentration of 18.6 mg/L, and NPN exceeded the MCL of 10 mg/L in two wells with a maximum concentration of 13.7 mg/L. At TAG, several analytical results exceeded the MCL for TCE and NPN: TCE exceeded the MCL in one well with a maximum concentration of 8.94 mg/L, and NPN exceeded the MCL in fi ve wells with a maximum concentration of 33.3 mg/L. At BSG, several analytical results exceeded the MCL for NPN: NPN exceeded the MCL in seven wells with a maximum concentration of 36.6 mg/L. All other analytical results for TA-V, TAG, and BSG groundwater samples were below established MCLs.
National Environmental Policy Act (NEPA) Activities During CY 2010, Sandia began preparing for DOE’s development of a new Site-Wide Environmental Impact Statement (SWEIS). Environmental Programs Department personnel met with representatives from 63 SNL/NM facilities to discuss and compile data on their current and anticipated future operations that could be relevant to their potential impacts on the environment. In addition, personnel compiled an array of environmental information and data including environmental, safety, and health policies and procedures; descriptions of the natural environment at SNL/NM; environmental stewardship programs; overall site operations; and agreements between DOE and other governmental entities. Th is information and data will help DOE in developing environmental analyses for the next SWEIS.
Th e NEPA Team participated in the review of the following environmental documents:
• Draft Site-Wide Environmental Impact Statement for the Continued Operation of the Department of Energy/National Nuclear Security Administration Nevada Test Site and Off -Site Locations in the State of Nevada,
• Draft Classifi ed Waste Landfi ll Excavation at Sandia National Laboratories/New Mexico, and• Air Force Battlespace Environment Lab Antenna Farm.
Th e NEPA Team reviewed a total of 1,266 proposed projects in the ISMS NEPA Module and other corporate applications. Sixty-eight DOE NEPA checklists were transmitted to the DOE/NNSA/SSO for review and determination in 2010.

S-6 2010 Annual Site Environmental Report
Th is page intentionally left blank.

Introduc on 1-1
Th is Annual Site Environmental Report (ASER) was prepared in accordance with and as required by U.S. Department of Energy (DOE) Order 450.1A, Environmental Protection Program (DOE 2008a) and DOE Manual 231.1-1A, Environment, Safety, and Health Reporting Manual (DOE 2007). Th is ASER describes the environmental protection programs currently in place at Sandia National Laboratories, New Mexico (SNL/NM). Th is report is made available to the general public in printed and electronic form.
1.1 Sandia Corpora on’s History and Mission
Sandia Corporation (Sandia), a Lockheed Martin Corporation (LMC) company, manages and operates the laboratory for the DOE, National Nuclear Security Administration (NNSA). Th e DOE/NNSA, Sandia Site Offi ce (SSO) administers the contract and oversees contractor operations at the site. Sandia has developed technologies for nuclear weapons, non-proliferation, homeland security, energy and infrastructure, defense systems and assessments, and research and development (R&D) programs to support a wide variety of national security missions.
1.1.1 History
SNL/NM began operations in 1945 as Z Division, the ordnance design, testing, and assembly arm of Los Alamos Scientifi c Laboratory (now Los Alamos National Laboratory [LANL]). Th e division moved to Sandia Base (now merged into Kirtland Air Force Base [KAFB]) on the perimeter of the City of Albuquerque (COA), to be near an airfi eld and to work closely with the military. Due to its growth, Z Division became a separate branch of Los Alamos in 1948, and was renamed Sandia Laboratory. On November 1, 1949, Sandia, a wholly owned subsidiary of Western Electric, began managing SNL/NM. In 1979, Congress recognized the facility as a national laboratory. In 1993, Sandia became a wholly owned subsidiary of Martin Marietta, now LMC.
1.1.2 Mission
Sandia’s enduring mission is to provide science and engineering support for the nation’s nuclear weapons stockpile. Today, that mission has grown to include other critical aspects of national security, including the non-proliferation of weapons of mass destruction, developing technologies and strategies for responding to emerging threats, and protecting and preventing the disruption of critical infrastructures. Sandia also collaborates with representatives from the industrial sector, universities, and other government agencies to develop and commercialize new technologies. Information about recent technologies developed at SNL/NM can be found at the following web site:
http://www.sandia.gov/LabNews
1.1.3 Sandia’s Opera ons Contract
Sandia, like all regulated industries, complies with specifi c environmental regulations established by local, state, and federal agencies. Th e Management and Operating (M&O) Contract between Sandia and the DOE defi nes the primary contractual obligations for operating SNL/NM. Th is contract also drives Sandia’s Environment, Safety, and Health (ES&H) standards and requirements.
Introduc on

2010 Annual Site Environmental Report1-2
Th e M&O Contract states that Sandia must comply with DOE directives that establish specifi c requirements for environmental programs. Th e six primary DOE directives currently on the contract baseline that pertain to environmental protection and management, starting with the most recent, are listed below:
• DOE Order 450.1A, Environmental Protection Program (DOE 2008a),
• DOE Manual 231.1-1A, Environment, Safety, and Health Reporting (DOE 2007),
• DOE Manual 231.1-2, Occurrence Reporting and Processing of Operations Information (DOE 2003),
• DOE Order 435.1, Chg 1, Radioactive Waste Management (DOE 2001),
• DOE Order 5400.5, Chg 2, Radiation Protection of the Public and the Environment (DOE 1993). and
• DOE Order 430.2B, Departmental Energy, Renewable Energy and Transportation Management (DOE 2008)
1.2 SNL/NM’s Site Loca on and Characteris cs
1.2.1 General Site Characteris cs
KAFB is a 51,559-acre military installation that includes 20,486 acres withdrawn from the Cibola National Forest through an agreement with the U.S. Forest Service (USFS). Located at the foot of the Manzanita Mountains, it has a mean elevation of 5,384 feet (ft) and a maximum elevation of 7,986 ft. KAFB is host to more than 150 tenant groups.
In 2010, Sandia conducted operations on 5,817 acres of Air Force property leased to DOE/NNSA, and 2,841 acres of property owned by DOE, yielding a total of 8,658 acres of landholdings for SNL/NM. Th e site housed a staff of 9,530, who operated in approximately 5.4 million square feet (sq ft) of on- site building space, and an additional 300,000 sq ft of off -site building space leased by DOE/NNSA for SNL/NM. Most operations are within fi ve technical areas (TA), TA-I,-II,-III,-IV, and -V. An additional 9,000 acres serve as a buff er zone near the southwest boundary of KAFB. Th is buff er zone, leased from the State of New Mexico and Isleta Pueblo, provides margins of safety and sound buff ers for SNL/NM testing activities (Figure 1-1).
BordersKAFB and SNL/NM are located adjacent to the COA, which borders KAFB on its north, northeast, west, and southwest boundaries. Th e Albuquerque International Sunport (airport) and Mesa del Sol, an emerging 12,500-acre mixed-use urban development, are just beyond the base’s western borders, as is the Rio Grande. Th e development’s master plan projects that the community will ultimately reach 90,000 residents. To date, several business and industrial facilities have been completed; however, no residential development has begun.
Mountains on the east and plains on the west create a diverse range of geological, hydrological, climatic, and ecological settings, and are further detailed in this chapter.
Areas within BordersSNL/NM consists of fi ve secured TAs, buildings in non-secured areas, and several remote testing areas. Th ese remote test areas are collectively known as the Coyote Test Field (CTF) and are located in the canyons on the west side of the Manzano Mountains. Th e Burn Site is located in the northeast region

Introduc on 1-3
FIGU
RE 1
-1.
SNL/
NM
Tech
nica
l Are
as a
nd th
e U.
S. F
ores
t Ser
vice
Lan
d W
ithdr
awn
Area
7
77
7
777
Mes
ade
lSol
UE
BufferZone
Tije
ras
Can
yon
Bur
nSi
te
ityof
exic
o
Lura
nce
Can
yon
Mad
era
Can
yon
Sols
eM
ete
Can
yon
Tije
ras
Arr
oyo
Arro
yode
lCoy
ote
KAFB
Land
fill
KAFB
Gol
fCou
rse
I-40
Fwy
Cen
tral A
ve
Gib
son
Blv
d
Mag
azin
eR
d
Har
din
Lovelace Rd
WyomingBlvd
CarlisleBlvd
NoSw
eat B
lvd
Pennsylva
nia
PennsylvaniaSt
SanMateoBlvd
LouisianaBlvd
Sout
hern
Blv
d
EubankBlvd
Mt.
Was
hing
ton
Rd
Coy
ote
Sprin
gsR
d
TA-II
I
Man
zano
Bas
e
TA-I
TA-II
TA-IV TA
-V
Eub
ank
Gat
e
Aer
ialC
able
Site

2010 Annual Site Environmental Report1-4
of KAFB and the Th ermal Test Complex (TTC) is located within TA-III. Th e National Solar Th ermal Test Facility is located southeast of TA-III. See Figure 1-1 for an illustration of the area.
1.2.2 Technical Areas
TA-ITA-I is the focus of SNL/NM’s operations, housing the main administrative center and a close grouping of laboratories and offi ces. A majority of activities performed in TA-I are dedicated to weapon design, R&D of weapon systems, limited production of weapon systems components, technology transfer, high-performance computing, and energy research programs. Facilities in TA-I include the new Ion Beam Laboratory (IBL), the main technical library, several assembly/manufacturing areas, and various laboratories, such as the Advanced Manufacturing Processes Laboratory (AMPL), the Neutron Generator Facility (NGF), the Processing and Environmental Technology Laboratory (PETL), the Joint Computational Engineering Laboratory (JCEL), Sandia Tomography and Radionuclide Transport (START) Laboratory, and the Microsystems and Engineering Sciences Applications (MESA) Complex. Th e MESA Complex provides the systems designers, component designers, processes, and equipment to design and prototype qualifi ed microsystem-based components for maintaining a national nuclear deterrent.
TA-IITA-II includes facilities and lands south of the TA-I boundary at Hardin Boulevard and extends to the northern boundary of TA-IV. Th e Explosive Components Facility (ECF), the Hazardous Waste Management Facility (HWMF), the Facilities Command Center (FCC), the Solid Waste Transfer Facility (SWTF), the Construction and Demolition (C&D) Recycle Center, and the National Infrastructure Simulation & Analysis Center (NISAC) are all within TA-II.
TA-III TA-III is the largest and most remote of all the TAs, housing environmental test facilities separated by extensive undeveloped areas. TA-III is used to accommodate large-scale engineering test activities requiring large safety and/or security area buff ers, such as collision testing sled tracks, centrifuges, and the TTC. Other facilities include the Radioactive and Mixed Waste Management Facility (RMWMF), the Chemical Waste Landfi ll (CWL), the Mixed Waste Landfi ll (MWL), the Classifi ed Waste Landfi ll, and the Corrective Action Management Unit (CAMU).
TA-IVTA-IV, located south of TA-II, houses facilities used to conduct R&D activities in inertial-confi nement fusion, pulsed power, and nuclear particle acceleration. Accelerators located in TA-IV include the Z Accelerator (Z-Machine), the Advanced Pulsed Power Research Module (APPRM), the Radiographic Integrated Test Stand (RITS), the High Energy Radiation Megavolt Electron Source-III (HERMES-III), the Saturn Accelerator, the Repetitive High Energy Pulsed Power I (RHEPP I) Accelerator, the High Power Microwave Laboratory (HPML), and the Short-Pulse High Intensity Nanosecond X Radiator (SPHINX).
TA-V TA-V, located adjacent to the northeast corner of TA-III, includes facilities that routinely handle radioactive materials used in experimental R&D programs. TA-V houses the Gamma Irradiation Facility (GIF), the Annular Core Research Reactor (ACRR), the Hot Cell Facility (HCF), and the Auxiliary Hot Cell Facility (AHCF).
Introduc on 1-5
1.2.3 Other Facili es
Remote Test AreasSeveral remote test areas are located east and southeast of TA-III and within the canyons and foothills of the USFS withdrawn area (Arroyo del Coyote, and Lurance, Madera, and Sol se Mete Canyons). Th ese areas are used for explosive ordnance testing, rocket fi ring experiments, and open burn thermal tests.
Facilities Outside of KAFB’s BoundariesSome of the facilities utilized by Sandia personnel are outside the boundaries of KAFB. Th e Center for Integrated Nanotechnologies (CINT), the MESA Technology and Operations Prototype (TOP), the International Programs Building (IPB), the Innovation Parkway Offi ce Center (IPOC), and the new National Museum of Nuclear Science & History are all located on Eubank Boulevard Southeast within one mile of KAFB. Th ere are many other small-scale, off -site SNL/NM projects, including the Advanced Materials Laboratory (AML) at the University of New Mexico (UNM).
1.3 ES&H at SNL/NM
Sandia’s ES&H Program has grown and progressed, as detailed in the ES&H Corporate Policy System Documents, a dynamic online resource available to all Sandia personnel. Th ese documents clearly describe ES&H requirements for conducting all levels of work at SNL/NM.
http://www.sandia.gov/esh/
Improved waste management practices have been implemented, and state-of-the-art waste handling facilities have been constructed to handle and properly dispose of hazardous, radioactive, and solid waste. Waste minimization and recycling practices have been very successful in reducing SNL/NM’s environmental impact. Several audits have been conducted in recent years by the U.S. Environmental Protection Agency (EPA), various DOE/NNSA offi ces, the COA, the Albuquerque Bernalillo County Water Utility Authority (ABCWUA), and the State of New Mexico. Th e results of these audits, as well as SNL/NM internal audits, support Sandia’s ongoing commitment to ES&H practices at SNL/NM.
Implementing ES&H Sandia’s strategy for managing and implementing its ES&H Program is described by the Integrated Safety Management System (ISMS) which is structured around fi ve safety-based management functions:
(1) Plan the work, (2) Analyze the work hazards, (3) Control those hazards, (4) Perform the work, and (5) Get feedback and make improvements.
Th e ISMS provides processes that guide line management to identify and control hazards. For further information on audits and appraisals, refer to Section 2.3.
Environmental Management ProgramsAs part of its mission, Sandia addresses ES&H issues through its environmental management (EM) programs. EM programs include waste management, pollution prevention (P2), environmental restoration (ER), long-term environmental stewardship (LTES), water quality (surface discharge, groundwater, storm water, and waste water), oil storage, air quality, National Environmental Policy Act (NEPA), terrestrial and ecological surveillance, and quality assurance (QA).
2010 Annual Site Environmental Report1-6
Environmental Management System (EMS)Sandia strives to be a leader in environmental stewardship through the implementation of an EMS. In 2009, Sandia upgraded the EMS Program to fully conform to the international standard for EMS, International Organization for Standardization (ISO)14001-2004 (IOS 2004) and received third-party certifi cation to the standard. Sandia received ISO 14001 certifi cation in 2009. Th e EMS is utilized to plan, review, execute, and improve work processes, with the intent of improving upon the environmental elements in the ISMS. ES&H considerations are incorporated into each element of all work processes conducted by Sandia. For additional information on the EMS, refer to Section 3.1.
1.3.1 Managing a Legacy of Contamina on
SNL/NM was ranked as one of the least contaminated DOE facilities, and originally consisted of 268 ER sites. At the close of CY 2010, there were 33 regulated ER sites remaining to be completed at SNL/NM. Of the remaining 33 sites, 31 were submitted for Corrective Action Complete (CAC) determinations from the New Mexico Environment Department (NMED). In April 2010 the NMED issued a letter requesting additional corrective action at fi ve of the 31 sites, including Solid Waste Management Units (SWMU) 8, 58, 68, 149, and 154. Th e remaining 26 sites are currently in the public comment process with a hearing anticipated in 2011 or 2012. Th e two remaining sites are the MWL and the CWL. In addition to the 33 sites, fi nal remedies are pending for three groundwater areas of concern (TA-V, Tijeras Arroyo Groundwater [TAG] and Burn Site Groundwater [BSG]), and three sites with potential solid contamination will be evaluated at the end of their test operations. In December 2008, NMED granted approval of the Corrective Measures Implementation Plan (CMIP) for the MWL, and the fi nal corrective action was completed in 2009. Th e remaining site is the CWL. Th e CWL Closure Plan Amendment (CPA), the CWL Post-Closure Care Permit (PCCP), and the CWL Final Remedy were approved by the NMED in October 2009. After NMED approval of the Final CWL Resource Conservation and Recovery Act (RCRA) Closure Report, monitoring at the CWL will be performed under the CWL PCCP.
Some sites require long-term monitoring to ensure that any residual contamination does not migrate from the site. Detailed information about EM cleanup eff orts throughout DOE can be found at DOE’s website, and at Sandia’s LTES website:
http://www.em.doe.gov/pages/emhome.aspxhttp://www.sandia.gov/ltes
1.4 Regional Characteris cs
SNL/NM is set in a high desert region in central New Mexico. Th e adjacent land areas are the most densely populated area in New Mexico. Refer to Figures 1-1 and 1-2 for illustrations of the regions described below.
1.4.1 Regional Topography and Layout
KAFB has a widely varied topography, ranging from rugged mountains on the east to fl at plains on the west. Th e maximum elevation of 7,986 ft occurs on the eastern edges of KAFB, which includes 20,486 acres withdrawn from the Cibola National Forest (through an agreement with the USFS).
Th e mean elevation of 5,384 ft is typical of the remainder of KAFB, which is situated on gently west-sloping foothills that grades into wide, fl at areas; this topology is where the majority of SNL/NM facilities are situated.

Introduc on 1-7
FIGURE 1-2. State of New Mexico MapTh e overlay shows major roads, cities, and county lines.
Th e dashed circle encompasses the 50-mile radius from SNL/NM facilities.

2010 Annual Site Environmental Report1-8
Th e MountainsTh e most spectacular topographic feature in the Albuquerque region is the Sandia Mountains, which form an impressive backdrop to the east of the COA and KAFB. Th e Sandia Mountains form a 13-mile long escarpment distinguished by steep cliff s, pinnacles, and narrow canyons; the tallest point is Sandia Crest at 10,678 ft. At sunset, the Sandia Mountains are often bathed briefl y in a pinkish glow, which is how they got their name (“sandia” is Spanish for “watermelon”).
Th e Sandia Mountains are divided from the Manzanita and Manzano Mountains (to the south) by Tijeras Canyon, which is traversed by Interstate 40 (I-40). KAFB is located a few miles south of I-40 (Figure 1-1).
Tijeras ArroyoAt approximately ¾ of a mile wide, Tijeras Arroyo is a signifi cant topographic feature that cuts diagonally northeast to southwest across KAFB. Th e watershed drained by Tijeras Arroyo includes the southern Sandia Mountains, the Manzanita Mountains, and the north end of the Manzano Mountains. Th e arroyo is normally dry except during heavy downpours, which can cause signifi cant fl ash fl oods. Th e arroyo originates in Tijeras Canyon and runs coincident with the Tijeras Fault for several miles before deviating to the southwest, where it discharges to the Rio Grande about eight miles from the west boundary of KAFB.
Rio GrandeTh e Rio Grande fl ows to the west of the KAFB’s boundaries. A new water treatment plant was recently completed which includes 40 miles of new pipeline. Water testing for the San Juan Chama Drinking Water Project was completed by the ABCWUA and water from the new water treatment plant began fl owing to customers in December 2008 (for additional information refer to the ABCWUA website).
http://www.abcwua.org
1.4.2 Popula on
New Mexico is the fi fth largest state in the U.S. comprising 121,000 square miles (mi2). Th e population in 2010 for New Mexico is approximately 2,059,179 and is expected to be approximately over four million by 2020 according to the U.S. Census. Th e largest city in New Mexico is Albuquerque with about 545,852 metro-area residents; other neighboring metro areas, including the City of Rio Rancho of 87,521, raise that total to over 630,000 residents.
Th e population within an 80-kilometer/50-mile radius of SNL/NM is over 850,000 residents (DOC 2011); nine counties are contained or partially included in that radius (Figure 1-2).
http://www.census.gov/population/projections/SummaryTabA1.pdf
1.5 Regional Geologic Se ng
Th e regional geologic setting in which SNL/NM and KAFB are situated has been subjected to relatively recent episodes of basaltic volcanism and ongoing regional rifting (crustal extension). Th e Rio Grande Rift has formed a series of connected down-dropped basins fi lled with sediment deposits. Th e Rio Grande Rift extends for about 450 miles from Leadville, Colorado into New Mexico; Albuquerque and the KAFB are within a rift valley.
Introduc on 1-9
1.5.1 Albuquerque Basin
Th e Albuquerque Basin is one of several north south trending sediment-fi lled basins formed by the Rio Grande Rift. Th is major structural feature is approximately 30 miles wide, 100 miles long, and 3,000 square miles in area (Grant 1982). On the east, uplifted fault blocks manifested by the Sandia, Manzanita, and Manzano Mountains bound the basin. Th e western side of the basin is bound by the Lucero Uplift to the south, the Rio Puerco Fault Belt, and the Nacimiento Uplift at its northern end. Th ere is relatively little topographic relief along the Rio Puerco Fault Belt on the northwestern side of the basin. Th e Albuquerque Basin is drained to the south through the Rio Puerco and the Rio Grande.
1.5.2 Regional Fault Systems
Several faults are located on KAFB (Figure 1-3). Tijeras Fault, which has been traced as far north as Madrid, New Mexico, trends southwesterly through Tijeras Canyon and across KAFB. Th e Tijeras Fault is a strike-slip fault where movement is horizontal parallel to the strike of the fault. Early movement along the Tijeras Fault can be traced to the late Precambrian Period, 570 million years ago and has been active as recent as the late Pleistocene epoch 12,000 before present. Th e system of minor faults associated with the Tijeras Fault on KAFB is collectively referred to as the Tijeras Fault Complex. Th e Tijeras Fault Complex marks a distinct boundary between the bedrock geology on the east and the sediment-fi lled basin to the west. Th is geologic boundary also forms a boundary between the two major groundwater regimes at KAFB. For further information on hydrological settings, refer to Section 1.6.
Th e Sandia Fault establishes the eastern boundary of the Albuquerque Basin on KAFB. Th e up-thrown side of the fault is manifested as the Sandia Mountains. Th e conformal stratigraphy of the top of the mountain is buried under the sediments of the basin. Th e total off set is on the order of 7 kilometer (km) (4.3 miles). Th e eastern boundary of the basin south of KAFB is the Hubbell Spring Fault. Both the Sandia and Hubbell Spring Fault are north trending, down-to-the-west, en echelon normal faults, which are Tertiary in age (63 million to 1.8 million years ago). (Lozinsky et al. 1991; Woodward 1982; and Kelley 1977). Th e Sandia Fault converges with the Tijeras Fault and the Hubbell Spring Fault in the region of KAFB identifi ed as the Tijeras Fault complex.
1.6 Hydrological Se ngs
Th e hydrogeological system is divided into two areas separated by the Tijeras Fault Complex, which marks a distinct geological boundary (Figure 1-4). To the east of the Tijeras Fault Complex, the geology is characterized by fractured and faulted bedrock covered by a thin layer of alluvium and shallow groundwater 45 to 325 ft deep. On the west side of the Tijeras Fault Complex, within the basin groundwater is contained in alluvial sediments and water levels range from 295 ft to 570 ft below ground surface (bgs) at KAFB.
A perched groundwater system (PGWS) overlies the regional aquifer in the north portion of KAFB. Th e PGWS extends southward from TA-I to the KAFB Golf Course. Th e western extent of the PGWS is somewhere midway between Wyoming Boulevard and the Albuquerque Sunport’s east-west runway. Th e eastern extent is just east of the KAFB landfi ll and may be bounded by the West Sandia Fault. Th e groundwater gradient within the PGWS is to the southeast with the depth to water approximately 270 ft bgs in the western part and 420 ft bgs in the east.

2010 Annual Site Environmental Report1-10
FIGURE 1-3. Generalized Geology in the Vicinity of SNL/NM and KAFB (Van Hart 2003)
IPm
IPm
IPm
IPs
Pa
Pa
PyLT(?)
LT
LT(?)
Pm
Pa
Py
Pgs
IPm
Pa
TR
Wes
t Hub
bell S
pring fault
?
??
?
?
?
?
?
?
MANZANO
BASE?
?
Tije
ras
faul
t
Colorada fault
pC
pC
pC
pC
Man
zano
f
ault
KAFB
KAFBIsleta Pueblo Reservation
USFS Withdrawn Area
Centr
al Hu
bbell
Sp
g. fa
ult
East HubbellBurn Site
Sand
ia fa
ult
3 4
W. San
dia fa
ult
1 Mile
N
Spg. fault
TA-I
TA-II
TA-IV
SandiaMountains
Four
Hills
Man
zano
Base
TravertineHIlls
ManzanitaMountains
ManzanoMountains
EOD Hill
TA-III
MWL
CWL
TA-VTijeras A
rroyo
Arroyo del Coyote
LT Lower Tertiary
TR TriassicPgs Permian Glorietta Ss.
Py Permian Yeso Fm.Pa Permian Abo Fm.Pm Permian Madera Grp.IPm Pennsylvanian IPs Pennsylvanian
pC Precambrian basement
Main normal faults
Laramide(?)
L e g e n d
Bedrock deeply buried below Santa Fe Grp.
Sandia Fm.
Madera Grp.
& San Andres Ls.
(ball on down-side)
reverse faults(barbs on up-side)
Lurance Canyon C
oyot
e fa
ult
KAFB boundaryTAs
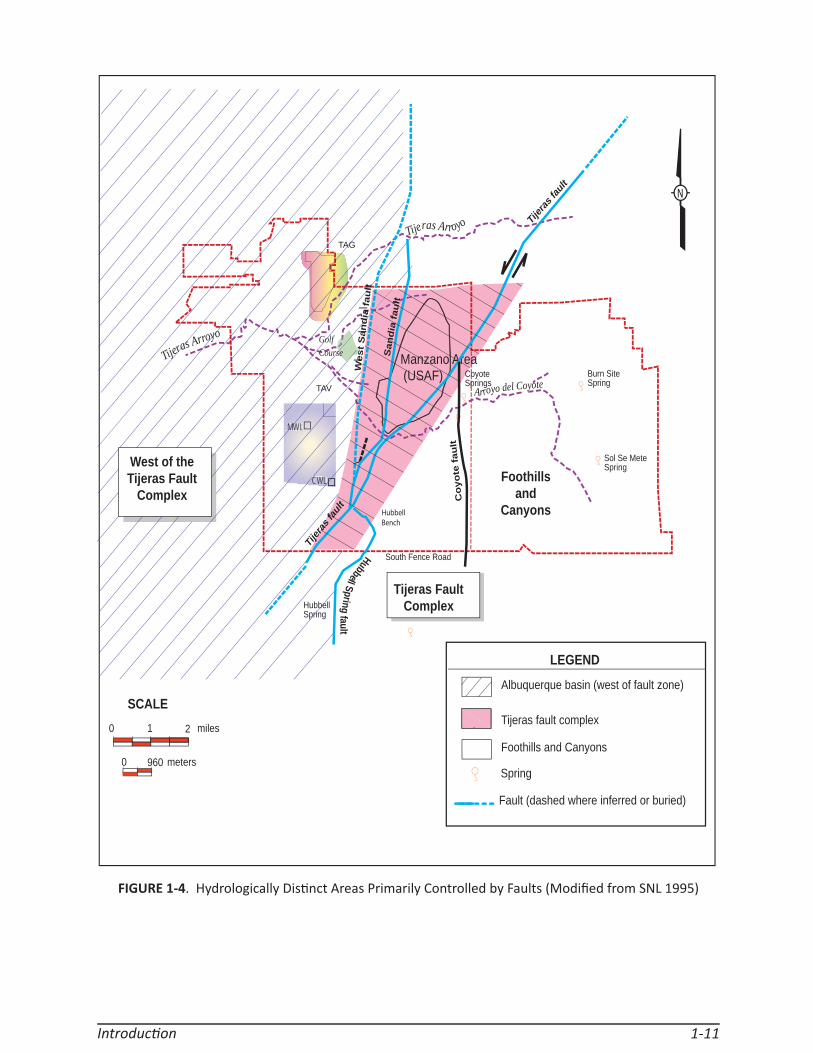
Introduc on 1-11
FIGURE 1-4. Hydrologically Dis nct Areas Primarily Controlled by Faults (Modifi ed from SNL 1995)
Foothills and
Canyons
Coyote Springs
LEGEND
Spring
Albuquerque basin (west of fault zone)
Hubbell Spring
South Fence Road
Burn Site Spring
Sol Se Mete Spring
Fault (dashed where inferred or buried)
SCALE
meters 0 960
miles 0 1 2
MWL
CWL
MMWMWMWMWLLL
CWCWL
Manzano Area (USAF)
Tijeras Fault Complex
N
A r r o y o d e l C o y o t e
T i j e r a s A r r o y o
T i j e r a s A r r o y o Golf Course
Foothills and Canyons
Tijeras fault complex
West of the Tijeras Fault
Complex
t l u a f s a r e j i T
t l u
a f a i
d
n
a S
t l u
a f a i
d
n
a S
t s e
W
t l u
a f e t
o
y o
C
t l u a f s a r e j i T
H u b b e l l S pri ngfau lt
HubbellBench
TAG
TAV

2010 Annual Site Environmental Report1-12
1.6.1 Natural Springs
Two perennial springs are located on KAFB (Coyote Springs and Sol se Mete Spring). Additionally, there is one perennial spring (Hubbell Spring) located immediately south of the KAFB boundary on Isleta Pueblo. Numerous ephemeral springs occur within the foothills and in the eastern reach of Arroyo del Coyote.
1.6.2 Groundwater Produc on
Th e primary regional aquifer in the Albuquerque Basin is within the upper unit and, to a lesser degree, the middle unit of the Santa Fe Group Aquifer System. Most ABCWUA water supply wells are located on the east side of the Rio Grande, which is the most productive portion of the aquifer. Th e highest yield wells are screened in the sediments associated with the ancestral river channel. Prior to extensive urban development in the Albuquerque area beginning in the 1950s, the direction of regional groundwater fl ow in the area of KAFB was primarily to the southwest. As a result of groundwater withdrawal, the local water table has dropped by as much as 141 ft (Th orn et al. 1993). Groundwater withdrawal from KAFB and ABCWUA wells at the north end of KAFB have created a trough-like depression in the water table, causing fl ow to be diverted northeast in the direction of the well fi elds.
1.7 Regional Climate
Large diurnal temperature ranges, summer monsoons, and frequent drying winds are characteristic of the regional climate in the Albuquerque Basin and the Sandia, Manzanito, and Manzano Mountains.
1.7.1 Temperature
Temperatures are typical of mid-latitude dry continental climates with summer high temperatures in the basin around 90 degrees Fahrenheit (°F) and winter high temperatures around 50°F. Daily low temperatures range from around 60°F in the summer to around 20°F in the winter. Th e dry continental climate also produces low average humidity in the late spring and summer prior to the onset of the monsoon season. Daytime relative humidity can be between 10 and 20 percent in the spring and early summer, with an average humidity near 30 percent. Winter relative humidity averages near 50 percent.
1.7.2 Precipita on
Precipitation varies across the region with many locations in the higher elevations of the mountains receiving twice the annual rainfall of locations in the Albuquerque Basin. Most precipitation falls between July and October mainly in the form of brief, heavy rain showers. Average annual precipitation, based on 15 years of data collected between 1995 and 2009, is approximately 9.0 inches at SNL/NM, with 10.9 inches in the lower foothills. Annual precipitation recorded at the National Weather Service (NWS) cooperative stations in mountain elevations varies between 10 and 23 inches. Th e winter season in the Albuquerque Basin and around SNL/NM is generally dry, with an average of less than 1.5 inches of precipitation falling between December and February.
1.7.3 Climate
While the regional climate is described by the atmospheric state variables of temperature and humidity, site-specifi c meteorology at SNL/NM is infl uenced by the proximity to topographic features such as mountains, canyons, and arroyos. Th ese features infl uence local wind patterns across the site. Canyons and arroyos tend to channel or funnel wind, whereas mountains create an upslope/downslope diurnal pattern to wind fl ows. Winds tend to blow toward the mountains or up the Rio Grande Valley during
Introduc on 1-13
the day, and nocturnal winds tend to blow down the mountain towards the Rio Grande Valley. Th ese topographically induced wind fl ows can be enhanced or negated by weather systems that move across the southwestern U.S. Th e strongest winds occur in the spring when monthly wind speeds average 10.3 miles per hour (mph). Wind gusts commonly reach 50 mph.
1.8 Regional Ecology
Th e SNL/NM facilities area is infl uenced by two major physiographic provinces - mesa and plains, and mountains. Th e various elevations in these provinces provide a varied range of life zones on KAFB.
1.8.1 Physiographic Provinces
Mesa and Plains - A signifi cant portion of central New Mexico, including the middle Rio Grande and much of SNL/NM, is comprised of this physiography. Major landforms include valleys, lowlands, outwash plains, and alluvial fans and terraces. Grama and galleta grasses, four-wing saltbush, and sand sage cover lower elevations, with piñon pine and juniper species characterizing the higher elevations. Riparian areas grow in strips along water courses and include cottonwood, willow and non-native salt cedar trees.
Mountains - Th e Sandia and Manzano Mountains are south of (but not part of ) the Rocky Mountains. Th e eastern portion of SNL/NM is located in, and bordered by, the Manzano Mountains. Vegetation in these steep, rugged mountains varies greatly on the basis of elevation and aspect. Forests tend to be patchy due to topography, weather, fi re, insect outbreaks, and disease. Th e landscape is a complex mosaic of open meadows, composed of forest stands of varying ages and species.
Th ese physiographic provinces each have an infl uence on the typical landforms, fl ora, and fauna predominant within the SNL/NM area. Th e topography at KAFB ranges from lowland grasslands to high elevation coniferous forests. With much of the area undeveloped, there is great diversity in plant and animal communities living on KAFB. At least 267 plant species and 195 animal species are found on KAFB (DOE 1999). Table 1-1 lists the most common species of birds, mammals, reptiles, amphibians, and plants that have been identifi ed on-site.
1.8.2 Regional Life Zones Occurring on Kirtland Air Force Base (KAFB)
Ponderosa Pine Forest or Transition Life Zone (7,000 to 8,000 ft) – a closed canopy of ponderosa pine, piñon-pine, juniper, scrub oak, grassy meadows, streams, marshes, and canyons are typical of this zone. Th e USFS withdrawn area in the eastern portion of KAFB reaches an elevation of just over 7,900 ft.
Piñon-Juniper Woodland Zone (6,000 to 7,000 ft) – a mostly open canopy of piñon-pine and juniper sparsely populate this zone of foothills and mesas. Animals typical of this woodland include the piñon mouse and piñon jay. Much of the rolling terrain in the withdrawn area is comprised of this zone.
Upper Sonoran Life Zone (below 6,000 ft) – this short grass prairie zone occurs on alluvial fans, mesas, and gently rolling or sloping plains. Pioneer plants include tumbleweed, goat head, and spurge; intermediate plants include galleta and burro grass, cactus, and mixed weeds; climax vegetation is grama grass. Animals include prairie dogs, burrowing owls, and kangaroo rats. Th e non-withdrawn area of KAFB land falls within this zone (Figure 1-1).

2010 Annual Site Environmental Report1-14
TABLE 1-1. Common Plants and Animals Iden fi ed at KAFBBIRDS
American robin Turdus migratorius Horned lark Eremophila alpestris American kestrel Falco sparverius Killdeer Charadrius vociferus Black-chinned hummingbird
Archilochus alexandris Loggerhead shrike Lanius ludovicianus
Black-headed grosbeak Pheucticus melanocephalus
Mountain bluebird Sialia currucoides
Broad-tailed hummingbird Selasphorus platycercus Red-tailed hawk Buteo jamaicensis Dark-eyed junco Junco hyemalis Rufous-sided towhee Pipiloerythro
melanocephalus MAMMALS
Black bear Ursus americanus Deer mouse Peromyscus maniculatus Bobcat Felis rufus Gunnison’s prairie
dog Cynomys gunnisoni
Banner-tailed kangaroo rat Dipodomys spectabilis Gray fox Urocyon cinereoargenteus Black-tailed jackrabbit Lepus californicus Mule deer Odocoileus hemionus Desert cottontail Sylvilagus audubonii
REPTILES AND AMPHIBIANS Collared lizard Crotaphytus collaris Great plains skink Eumeces obsoletus Chihuahuan spotted whiptail Aspidoscelis exsanguis Great plains toad Bufo cognatus Round-tailed horned lizard Phrynosoma modestum Western diamondback
rattlesnake Crotalus atrox
Prairie lizard Sceloporus consobrinus Side-blotched lizard Uta stansburiana Gopher snake Pituophis catenifer Short-horned lizard Phrynosoma hernandesi
PLANTS Apache plume Fallugia paradoxa Goathead Tribulus terrestris One-seed juniper Juniperus monosperma India ricegrass Achnatherum hymenoides New Mexico needlegrass Hesperostipa
neomexicana Ring muhly Muhlenbergia torreyi
Purple three-awn Aristida purpurea Bush muhly Muhlenbergia porteri Shrub live oak Quercus turbinella Soapweed yucca Yucca glauca Spectacle pod Dithyrea wislizenii Black grama Bouteloua eriopoda
NOTES: KAFB = Kirtland Air Force Base
1.9 GreenGov Presiden al Award
In 2010, SNL/NM received White House recognition as one of eight recipients of the 2010 GreenGov Presidential Awards for implementing photovoltaic (PV) powered carts. Th e awards honor federal agencies who develop methods to reduce greenhouse gas pollution and promote environmentally responsible products and techniques (see page 1-15).

Introduc on 1-15
SNL/NM Photovoltaic Carts
In 2010, SNL/NM received a “GreenGov Presidential Award”, which recognized extraordinary achievement in the pursuit of President Obama’s Executive Order 13514 on Federal Leadership in Environmental, Energy, and Economic Performance. Th e awards honor exceptional federal, civilian, and military personnel, agency teams, agency projects and facilities, and agency programs that exemplify President Obama’s charge to lead by example in sustainability. Sandia earned the “Green Innovation Award” for developing and implementing photovoltaic (PV) powered carts. SNL/NM personnel designed and modifi ed electric-powered Global Electric Motorcar (GEM®) carts by mounting a polycrystalline panel solar-collector system on its roof that continuously charges the batteries and runs the electric motor. A charge controller safety feature turns the system off when the battery is fully charged, thus increasing the life span of the GEM cart battery. Th e solar technology allows for a GEM cart battery to have a life span of longer than three years and is recyclable.
Th e GEM carts do not need to be grid-tied to electricity eliminating the need for SNL/NM to purchase power for their operation. On cloudy days, the cart can be plugged into an electrical outlet and bypass the photovoltaic (PV) system. Using an off -the-shelf PV panel and mounting kit, cart modifi cations can be made in about 30 days at a cost of $2,100 for materials and installation. Th e retrofi t includes a gauge that indicates when power is getting low and how many hours have elapsed since the cart was last charged. Charging stations for these carts cost about $10,000 each for materials (outlets, circuits, cords, and cord reels), and installation. With a PV panel modifi cation fewer of these charging stations are needed.
SNL/NM’s fl eet of 300 vehicles contains 156 electric carts. An average electric GEM cart uses 375 kWh of electricity annually. It takes 2.1 pounds of coal to create 1 kWh of energy, requiring 787 pounds of coal to be burned each year to power one cart. Expand this number to the 300 carts on site, and 236,100 pounds of coal are expended every year to power GEM carts, enough coal to fi ll a train car. In addition, each kWh of energy created by coal releases 1.408 pounds of carbon dioxide and 0.0053 pounds of sulfur dioxide. It would take 3,850 mature trees (over the age of 15) to eradicate all of the carbon dioxide emitted by the electric carts (each mature tree sequesters about 48 pounds of carbon dioxide per year).
Solar powered carts reduce the need for charging stations, thus reducing the expense for their construction, repairs, and maintenance. Converting electric carts to solar technology reduces energy costs, lowers pollution rates, and increases sustainability. SNL/NM personnel plan on converting the remaining electric carts in the fl eet to PV power. Th is would save substantial amounts of money, reduce grid-tied energy use, increase the use of renewable energy, and reduce greenhouse gas emissions.

2010 Annual Site Environmental Report1-16
Th is page intentionally left blank.

Compliance Summary 2-1
Sandia Corporation (Sandia) conducts operations based on environmental regulations, statutes, and U.S. Department of Energy (DOE) directives through a variety of programs at Sandia National Laboratories, New Mexico (SNL/NM) that work together to pursue complete compliance with applicable regulations. As a part of these federal, state, and local mandates, Sandia adheres to strict reporting and permitting requirements.
Th is chapter summarizes Sandia’s compliance status with major environmental regulations, statutes, and DOE directives that are applicable to operations conducted at SNL/NM (Table 2-1 and Section 2.1.16). Compliance issues, corrective actions, environmental occurrences, and environmental audits and appraisals are also discussed in this chapter.
Current permits held by Sandia, DOE, the National Nuclear Security Administration (NNSA), and the Sandia Site Offi ce (SSO) are listed in Chapter 8.
Compliance Order on Consent (COOC)On April 29, 2004, the New Mexico Environment Department (NMED), DOE, and Sandia entered into the COOC. Th e COOC provides requirements and establishes schedules and deliverables for corrective action pursuant to the New Mexico Hazardous Waste Act (NMHWA) and the New Mexico Solid Waste Act (NMSWA).
Compliance Agreement (CA)Th is CA was in place for City of Albuquerque (COA) Permit #1705-M2. During Calendar Year (CY) 2009, this permit was terminated with the COA. Th e building which housed the sources has since been demolished. Th erefore the CA that was in place no longer applies or is needed.
Federal Facilities Compliance Order (FFCO)On October 4, 1995, NMED issued the FFCO to DOE and Sandia, which was developed pursuant to the Federal Facilities Compliance Act. Th e FFCO provides requirements for achieving compliance with the requirements of Title 40 of the Code of Federal Regulations (CFR), Part 268.50 for mixed hazardous/radioactive waste at SNL/NM.
2.1 Compliance Status with Federal Regula ons
Most environmental regulations and statutes applicable to SNL/NM are shown in Table 2-1 including links to associated web sites. Th e following subsections detail the regulations.
2.1.1 Comprehensive Environmental Response, Compensa on, and Liability Act (CERCLA)
Th e CERCLA, commonly referred to as the “Superfund,” provides cleanup funds and/or assessment requirements for inactive waste sites at all federal facilities. A Preliminary Assessment/Site Inspection (PA/SI), as required by CERCLA, was performed at SNL/NM in 1988. Th is inspection confi rmed that Sandia does not own any sites that would qualify for the National Priorities List (NPL), which lists the
Compliance Summary
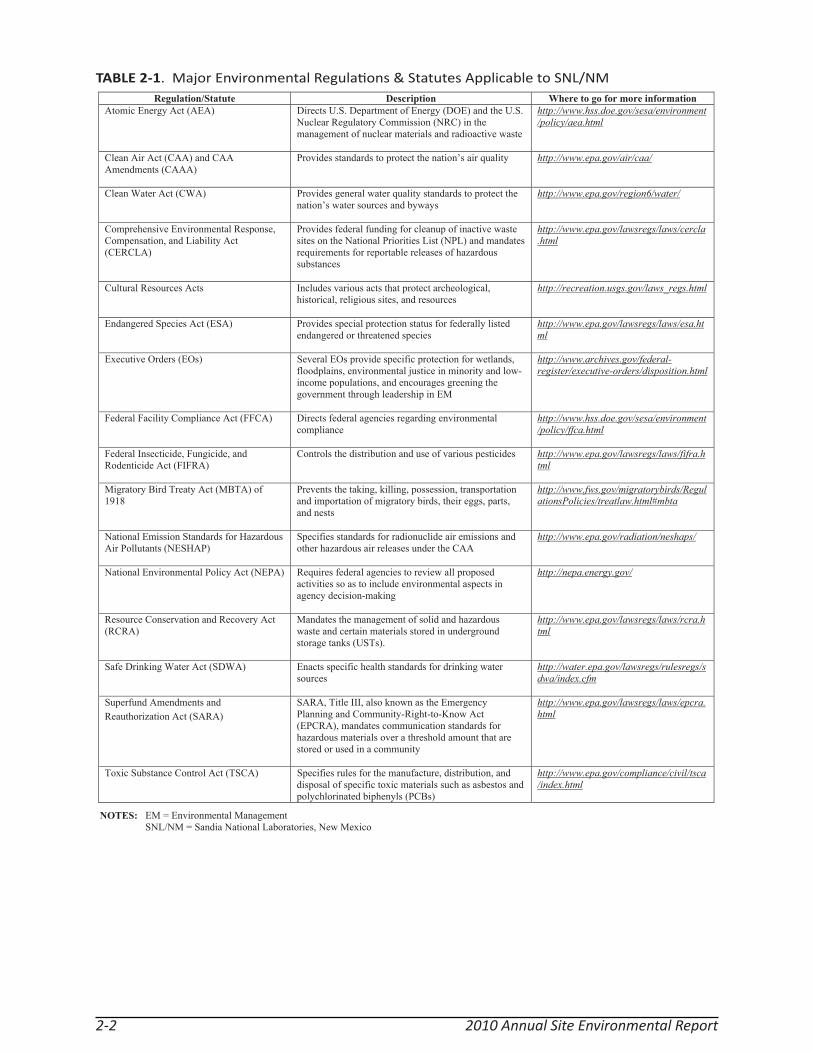
2010 Annual Site Environmental Report2-2
TABLE 2-1. Major Environmental Regula ons & Statutes Applicable to SNL/NMRegulation/Statute Description Where to go for more information
Atomic Energy Act (AEA) Directs U.S. Department of Energy (DOE) and the U.S. Nuclear Regulatory Commission (NRC) in the management of nuclear materials and radioactive waste
http://www.hss.doe.gov/sesa/environment/policy/aea.html
Clean Air Act (CAA) and CAA Amendments (CAAA)
Provides standards to protect the nation’s air quality http://www.epa.gov/air/caa/
Clean Water Act (CWA) Provides general water quality standards to protect the nation’s water sources and byways
http://www.epa.gov/region6/water/
Comprehensive Environmental Response, Compensation, and Liability Act (CERCLA)
Provides federal funding for cleanup of inactive waste sites on the National Priorities List (NPL) and mandates requirements for reportable releases of hazardous substances
http://www.epa.gov/lawsregs/laws/cercla.html
Cultural Resources Acts Includes various acts that protect archeological, historical, religious sites, and resources
http://recreation.usgs.gov/laws_regs.html
Endangered Species Act (ESA) Provides special protection status for federally listed endangered or threatened species
http://www.epa.gov/lawsregs/laws/esa.html
Executive Orders (EOs) Several EOs provide specific protection for wetlands, floodplains, environmental justice in minority and low-income populations, and encourages greening the government through leadership in EM
http://www.archives.gov/federal-register/executive-orders/disposition.html
Federal Facility Compliance Act (FFCA) Directs federal agencies regarding environmental compliance
http://www.hss.doe.gov/sesa/environment/policy/ffca.html
Federal Insecticide, Fungicide, and Rodenticide Act (FIFRA)
Controls the distribution and use of various pesticides http://www.epa.gov/lawsregs/laws/fifra.html
Migratory Bird Treaty Act (MBTA) of 1918
Prevents the taking, killing, possession, transportation and importation of migratory birds, their eggs, parts, and nests
http://www.fws.gov/migratorybirds/RegulationsPolicies/treatlaw.html#mbta
National Emission Standards for Hazardous Air Pollutants (NESHAP)
Specifies standards for radionuclide air emissions and other hazardous air releases under the CAA
http://www.epa.gov/radiation/neshaps/
National Environmental Policy Act (NEPA) Requires federal agencies to review all proposed activities so as to include environmental aspects in agency decision-making
http://nepa.energy.gov/
Resource Conservation and Recovery Act (RCRA)
Mandates the management of solid and hazardous waste and certain materials stored in underground storage tanks (USTs).
http://www.epa.gov/lawsregs/laws/rcra.html
Safe Drinking Water Act (SDWA) Enacts specific health standards for drinking water sources
http://water.epa.gov/lawsregs/rulesregs/sdwa/index.cfm
Superfund Amendments and Reauthorization Act (SARA)
SARA, Title III, also known as the Emergency Planning and Community-Right-to-Know Act (EPCRA), mandates communication standards for hazardous materials over a threshold amount that are stored or used in a community
http://www.epa.gov/lawsregs/laws/epcra.html
Toxic Substance Control Act (TSCA) Specifies rules for the manufacture, distribution, and disposal of specific toxic materials such as asbestos and polychlorinated biphenyls (PCBs)
http://www.epa.gov/compliance/civil/tsca/index.html
NOTES: EM = Environmental Management SNL/NM = Sandia National Laboratories, New Mexico

Compliance Summary 2-3
nation’s high priority cleanup or “Superfund” sites. Th erefo re, with respect to inactive hazardous waste sites, Sandia has no CERCLA reporting requirements. Amendments under the Superfund Amendments and Reauthorization Act (SARA) require additional reporting in the event of a reportable quantity (RQ) release. Sandia was in full compliance with CERCLA/SARA in 2010, as illustrated in this chapter.
2.1.2 Emergency Planning and Community Right-to-Know Act (EPCRA)
Th e EPCRA, also known as SARA Title III, establishes emergency planning requirements for federal, state, and local governments and industry.
EPCRA ensures that communities have the right to know about and be informed of potential hazards including the type and location of large quantities of toxic chemicals used and stored by facilities in or near the community. EPCRA specifi cally mandates that chemical information be made available to local emergency response organizations, such as fi re departments and hospitals. Any inadvertent release must be reported to appropriate state and local authorities. All subsequent reports must be made accessible to the public. Th e four major reporting requirements designated by specifi c sections of EPCRA are shown in Table 2-2.
TABLE 2-2. 2010 SARA Title III (or EPCRA) Repor ng Requirements Applicable to SNL/NM
Section SARA Title III Section Title
Requires Reporting?
Description
Yes No 302 - 303 Emergency
Planning Yes Sandia submits an annual report listing chemical inventories
above the reportable Threshold Planning Quantities listed in 40 CFR Part 355 Appendix B, the location of the chemicals, and emergency contacts. The report is prepared for the DOE/NNSA/SSO, which distributes it to the required entities.
304 Emergency Notification
No There was no reportable RQ release in 2010.
311-312 Hazardous Chemical Storage Reporting Requirements
Yes There are two “Community Right-to-Know” reporting requirements: (a) Sandia completes the EPA Tier II forms for all hazardous chemicals present at the facility at any one time in amounts equal to or greater than 10,000 lb and for all extremely hazardous substances present at the facility in an amount greater than or equal to 500 lb or the Threshold Planning Quantity, whichever is lower; (b) Sandia provides MSDSs for each chemical entry on a Tier II form unless it decides to comply with the EPA’s alternative MSDS reporting, which is detailed in 40 CFR Part 370.21.
313 Toxic Chemical Release Forms
Yes Sandia was above the reporting thresholds for CY 2010 for submitting a TRI Report for lead. A majority of the lead was from the use of lead-containing solders for laboratory benchmark solders.
NOTES: CFR = Code of Federal Regulations NNSA = National Nuclear Security Administration CY = Calendar Year RQ = reportable quantity DOE = U.S. Department of Energy Sandia = Sandia Corporation EPA = U.S. Environmental Protection Agency SARA = Superfund Amendments and EPCRA = Emergency Planning and Community Reauthorization Act Right-to-Know Act SSO = Sandia Site Office lb = pounds SNL/NM = Sandia National Laboratories, MSDS = Material Safety Data Sheets New Mexico (gives relevant chemical information) TRI = Toxic Release Inventory

2010 Annual Site Environmental Report2-4
Information on EPCRA can be found at the following U.S. Environmental Protection Agency (EPA) website:
http://www.epa.gov/emergencies/content/epcra
Toxic Release Inventory (TRI) ReportingEPCRA regulations require that facilities with activities described in the Standard Industrial Classifi cation (SIC) Codes 20 through 39 that use toxic chemicals listed in SARA Title III over a threshold value must submit a TRI report. Th e threshold value for listed chemicals requiring a TRI report is 10,000 pounds per year (lb/yr), unless otherwise specifi ed.
Each year, nearly 23,000 facilities report to the EPA under the TRI Program. Th e proposed TRI Reporting Forms Modifi cation Rule (1674 Federal Register/Vol. 70, No. 6/ Monday, January 10, 2005) sought comment on eliminating certain information from the reports, simplifying other reporting data, and, in some cases, reducing duplicate data collection eff orts. Th e options being proposed reduce the cost of compiling and submitting TRI reports, while maintaining the quality and practical utility of the TRI data. Th is rule became eff ective on September 12, 2005.
In 2010, chemical use at SNL/NM was above the reporting threshold for submitting a TRI report for lead. Sandia continues to document its toxic chemical use in the Chemical Inventory Report Calendar Year (CY) 2010 (SNL 2011b), which documents all purchases of chemicals at SNL/NM, Tonopah Test Range (TTR), and Kauai Test Facility (KTF) for CY 2010. Th is chemical inventory supports compliance with SARA Title III, as well as reporting for COA inventory requirements. 2. 1.3 Resource Conserva on and Recovery Act (RCRA)
RCRA regulates the generation, transportation, treatment, storage, and disposal (TSD) of hazardous chemical waste and non-hazardous solid wastes, and the storage of hazardous or petroleum products in underground storage tanks (UST). Under the authority of the NMHWA, and with delegated authority from the EPA under RCRA, the NMED administers hazardous and solid waste regulatory programs in New Mexico. Hazardous and solid waste management activities at SNL/NM are conducted under NMED regulations. Some additional RCRA requirements and EPA regulations also apply. Applicable regulations are listed in Chapter 8.
Th e hazardous component of hazardous/radioactive mixed waste (MW) is regulated as hazardous waste and subject to the requirements of state and federal regulations. Th e radioactive component of MW is regulated under the Atomic Energy Act (AEA) of 1946.
Sandia generates hazardous waste and MW through normal operations and through its ongoing environmental restoration (ER) project, which is responsible for the cleanup of sites that were formerly used for operations such as testing and disposal. Sandia currently implements an active and successful program to minimize hazardous waste and MW through product substitutions, process changes, material re-use, and recycling. For a summary of Sandia’s hazardous waste management activities during 2010 see Chapter 3.
Operating Permits – Sandia operates hazardous waste management units at SNL/NM under the following permits issued by NMED:
• Hazardous Waste Management Facility (HWMF), Permit NM5890110518-1,
• Th ermal Treatment Facility (TTF), Permit NM5890110518-2, and
• Corrective Action Management Unit (CAMU), Permit NM5890110518-1, Module IV.
Compliance Summary 2-5
On February 6, 2002, Sandia and DOE/NNSA/SSO submitted a comprehensive RCRA Part B request to renew the operating permits for these units. Th e request included updated permit applications for nine MW management units: the Radioactive and Mixed Waste Management Facility (RMWMF), the High Bay Waste Storage Facility (HBWSF), and seven Manzano Storage Bunkers (MSB); and a new application for operation of the Auxiliary Hot Cell Facility (AHCF). Sandia continues to operate under the existing permits and under interim status during the permit application and renewal process. Th e HBWSF and two of the seven MSB were withdrawn from the permit application in 2003, and closure of those units was completed in 2006. Treatment operations were completed at the CAMU in 2003. Closure of the unit was completed later that year, and DOE/NNSA/SSO and Sandia currently conducts post-closure care and maintenance, as detailed in Section 3.2.2.
On August 20, 2007, NMED issued a draft operating permit to DOE/NNSA/SSO and Sandia and invited public comments. DOE/NNSA/SSO, Sandia, and several citizens submitted comments to NMED. During 2009, NMED met with interested commenters to discuss their comments and propose modifi cations to the draft permit.
Classifi ed Waste Landfi ll – Th e Classifi ed Waste Landfi ll was used to store non-hazardous classifi ed media (e.g. fl oppy disks) and components. Sandia and DOE/NNSA/SSO, instead of seeking permit coverage, plan to excavate the contents of the landfi ll and revegetate the area. A draft excavation plan was approved by NMED on April 6, 2010.
Post-Closure Care Permit, Chemical Waste Landfi ll (CWL) – Th e CWL was used for hazardous waste disposal under interim status until 1985. From 1981 to 1989, the CWL was also used for storage of hazardous wastes in drums. Waste management operations ceased and closure activities began in 1989. Closure included two voluntary corrective measures (VCM): extraction of solvent vapors (primarily trichloroethylene) and excavation of the entire landfi ll. Sandia and DOE/NNSA/SSO submitted a Post-Closure Care Plan (PCCP) in 2005, and submitted additional permit materials in March 2007. Details about closure and post-closure care activities are detailed in Section 3.2.2.
On October 15, 2009, NMED issued a fi nal post-closure care permit and a notice of approval for the fi nal remedy and closure plan amendment. Th e permit will become eff ective when the NMED issues written approval of DOE/NNSA/SSO and Sandia’s certifi cation of the closure of the CWL.
2.1.4 Federal Facility Compliance Act (FFCA)
Th e FFCA requires federal facilities to comply with all federal, state, and local requirements for hazardous and solid waste, including full compliance with the restrictions and prohibitions on extended storage of wastes that do not meet the applicable hazardous waste treatment standards. On October 4, 1995, NMED issued the FFCO to DOE and Sandia, which was developed pursuant to the FFCA. A general Site Treatment Plan (STP) (SNL 2010b) and a schedule for processing the waste were developed. In 2010, Sandia continued to characterize and treat MW and to package wastes for shipment to permitted off -site TSD facilities. In 2010, DOE/NNSA/SSO and Sandia negotiated an extension to one STP deadline and met all of the other deadlines outlined in the STP.
2.1.5 Atomic Energy Act (AEA)
In 1946, the AEA was enacted to encourage the development and use of nuclear energy for general welfare, common defense, and security. Th e purpose of the AEA is to assure the proper management of nuclear materials and radioactive waste. Th e AEA, as amended, delegates control of nuclear energy and nuclear materials primarily to DOE/NNSA/SSO, the U.S. Nuclear Regulatory Commission (NRC) and the EPA. Federal regulations control radioactive emissions and the transportation of

2010 Annual Site Environmental Report2-6
nuclear materials. Th e authority for controlling radioactive waste is retained by DOE/NNSA/SSO and governed by DOE directives.
2.1.6 Clean Air Act (CAA) and Clean Air Act Amendments (CAAA) of 1990
Th e objectives of the CAA and the CAAA are to protect and enhance the nation’s air quality. Th e EPA is responsible for describing and regulating air pollutants from stationary and mobile sources and for setting ambient air quality standards. Th e COA has direct delegation from EPA Region VI to locally administer these standards as well as specifi c air emission permits and registrations, as shown in Chapter 8, Table 8-1.
Th e CAA requires the EPA to develop a list of air pollutants from all sources that could harm public health or the environment. Th e EPA identifi ed six substances as “criteria pollutants” and subsequently developed National Ambient Air Quality Standards (NAAQS) for these pollutants.
Th e EPA program for the attainment and maintenance of NAAQS requires local agencies to develop a comprehensive permitting program. Th e Air Quality Control Board (AQCB) has developed a set of regulations governing mobile and stationary sources of air pollution.
In addition to the regulations for criteria pollutants, the EPA’s National Emission Standards for Hazardous Air Pollutants (NESHAP) Program prescribes emission limitations for hazardous air pollutants (HAP).
Ra diological NESHAPSubpart H of 40 CFR 61 specifi cally regulates radionuclide emissions (other than radon) from DOE facilities. As required by the regulation, Sandia calculates an annual dose from actual or calculated emissions to potentially exposed members of the public. Th e regulation requires that Sandia determine the maximum possible dose that could be delivered to an individual residing at a nearby location 24 hours-per-day. Th e result is the eff ective dose equivalent (EDE) to the maximally exposed individual (MEI). Th e dose is compared to the EPA standard of 10 millirem per year (mrem/yr) allowed from radioactive air emissions from a DOE facility.
Th e on-site MEI dose of 2.98E-02 millirems per year (mrem/yr) at the Honeywell Systems Support Site resulted primarily from conservatively calculated releases of americium-241 from the nearby Sandia Tomography and Radionuclide Transport Laboratory (START) Laboratory. In CY 2010 an americium-241 source for research was received at the START Laboratory with contamination on the outside of the vial. After numerous attempts at decontamination, the source was unable to be suffi ciently decontaminated to permit use of the source for the desired application. Th erefore, the source was returned to the vendor in the packing material received. Th e source was double bagged and no contamination existed on the outside of the bags when returned. Nevertheless, conservative release calculations arising from this activity were attributed to americium-241. Th e off -site MEI was located at the Eubank Gate Area. Th e MEI of 3.41E-03 mrem/yr at the Eubank Gate Area resulted also primarily from conservatively calculated releases of americium-241 from the nearby START Laboratory. Both doses are well below the 10 mrem/yr EPA standard. For perspective, the annual radiation dose from natural background radiation is approximately 311 mrem/yr (NCRP 2009). Sandia met all NESHAP compliance requirements in 2010.
Fugitive Dust PermittingTh e COA enforces 20.11.20 New Mexico Administrative Code (NMAC) to ensure that all persons conducting active operations that result in disturbed surface areas, or that involve bulk material handling, use reasonably available control measures (or other eff ective measures) on an ongoing basis

Compliance Summary 2-7
to prevent or abate injury to human health, animal and plant life, and to prevent or abate unreasonable interference with public welfare, visibility, and the reasonable use of property.
National Emissions Inventory (NEI)As required by the Consolidated Emission Reporting Rule (CERR), (EPA 2002), the emission inventory requests annual emissions of volatile organic compounds (VOC), nitrogen oxide, carbon monoxide, sulfur dioxide, lead, ammonia, particulate matter with a diameter of equal to or less than 10 microns (PM10), particulate matter with a diameter of equal to or less than 2.5 microns (PM2.5), and HAPs.
New Source Review (NSR) RequirementsTh e NSR permitting program was established as part of the 1977 CAAA.
NSR requirements provide assurance to the public that any large, new, or modifi ed industrial source in their neighborhood will be protective of human health and the environment, and that advances in pollution control occur concurrently with industrial expansion.
New Source Performance Standard (NSPS) RequirementsAs part of an eff ort to control pollution in the United States (U.S.), the EPA provides NSPS requirements that dictate the level of pollution that a new stationary source may produce. Th ese standards are authorized by Section 111 of the CAA, and the regulations are published in 40 CFR Part 60. An NSPS has been established for a number of individual industrial or source categories, including boilers and generators.
Open Burn PermittingTh e COA enforces 20.11.21 NMAC to ensure that all persons conduct open burning in a manner that prevents or abates emissions that are visible and that produce noxious by-products of combustion.
Ozone Depleting Substances (ODS) RequirementsBased on the requirements of the CAA, the EPA has established regulations that aff ect many aspects of the refrigeration industry.
Title V Operating PermitTh e CAAA of 1990 contained provisions under Title V requiring all existing major air emission sources to obtain an operating permit. A major source is defi ned as the combined emissions from any facility with the potential to emit:
• 100 tons per year (tpy) or greater of any criteria pollutant,
• 100,000 carbon dioxide equivalent greenhouse gas (GHG) emissions,
• 10 tpy of any HAP, or
• 25 tpy of any combination of HAPs.
Details on the applicability of Title V to SNL/NM and activities are in Section 5.2.
2.1.7 Clean Water Act (CWA)
Th e CWA establishes guidelines to protect the “Waters of the U.S.” by regulating the discharge of pollutants. At SNL/NM, the CWA applies to sanitary and septic system wastewater effl uents, storm water runoff , and surface water discharges.

2010 Annual Site Environmental Report2-8
Th e CWA is implemented through local, state, and federal water quality standards as follows:
(1) the Albuquerque Bernalillo County Water Utility Authority (ABCWUA) administers regulations for sanitary sewer discharges based on federal pretreatment standards,
(2) the EPA and the NMED administer regulations concerning oil storage and surface discharges, and
(3) the EPA has authority over National Pollutant Discharge Elimination System (NPDES) permits.
New Mexico Stream StandardsEPA Region VI is the permitting agency for discharges under the NPDES. NMED Surface Water Quality Bureau assists EPA in regulation of storm water discharges by performing inspections on behalf of EPA and by serving as a local point of contact for providing information to permit holders. New Mexico has enacted “Standards for Interstate and Intrastate Surface Waters” (20.6.4 NMAC) to protect the quality of surface waters in the state.
ABCWUA Sewer Discharge RegulationsTh ere are six wastewater monitoring stations, or outfalls, operating under the ABCWUA permits at SNL/NM. During 2010, there was one reported event that exceeded permitted limits established by the ABCWUA. For additional information refer to Section 6.1.
Surface DischargeAll discharges made to the ground or to containment areas must be evaluated for compliance with regulations implemented through the New Mexico Water Quality Control Commission (NMWQCC) standards for the protection of ground waters and surface waters prior to discharge. Sandia reviewed and approved 25 one-time internal surface discharge permits in 2010. Sandia also investigated one reportable environmental release that met NMED reporting standards. Detailed information regarding these releases can be found in Section 2.2.2 and Section 6.2.2 of this report. Sandia maintains two evaporation lagoons in TA-IV which are permitted by NMED Discharge Permit-530 (DP-530). Th e TA-IV lagoons are used to contain and evaporate accumulated storm water pumped from the secondary containment areas around seven oil tanks that support the pulsed power accelerators. All permit conditions for the TA-IV permitted lagoons were met in 2010. Th e current permit for DP-530 was re-issued on September 12, 2007 and will expire on September 12, 2012.
NPDESNPDES implements the requirements that are specifi c to all discharges made to “Waters of the U.S.” as defi ned in the CWA and “Surface Waters of the State” and as defi ned in New Mexico’s “Standards for Interstate and Intrastate Surface Waters” (20.6.4 NMAC). At SNL/NM, all point sources discharge to either state or federal waters and are evaluated for compliance with their respective regulations.
Historically, collecting visual and analytical samples at SNL/NM has been a challenge due to Albuquerque’s climate. Analytical sampling and visual assessments are conducted, suffi cient runoff permitting. For additional information refer to Section 6.3.4.
2.1.8 Safe Drinking Water Act (SDWA)
Th e SDWA authorizes the EPA to set national standards for drinking water sources, treatment systems, and water distribution. Th ese standards are promulgated by the EPA as primary and secondary drinking water regulations. Specifi c drinking water quality criteria are established to protect human health, which limits the maximum contaminant level (MCL) of specifi c organic and inorganic chemical substances and biological organisms in potable water.
Compliance Summary 2-9
Drinking Water Supply at SNL/NMPotable water for most facilities on Kirtland Air Force Base (KAFB) (including SNL/NM) is provided by the KAFB Water System. Th e system derives its water from deep groundwater wells (discussed in Section 7.3, Groundwater Levels). KAFB routinely samples its water and conducts analyses to establish that its water quality conforms to EPA standards. In support of KAFB compliance with NMED Drinking Water Standards, DOE/NNSA/SSO and Sandia operates the water distribution system on their property in conformance with the SDWA regulations. DOE/NNSA/SSO and Sandia provide KAFB with an annual certifi cation that all backfl ow preventers installed in the potable water distribution system have been properly tested and maintained.
Information on the KAFB Water System is located on the EPA’s SDWA website, which details the compliance status for all drinking water systems in the U.S.:
http://www.epa.gov/safewater
Specifi c water quality data and system performance are published by KAFB in the Annual Consumer Confi dence Report on the Quality of Drinking Water.
2.1.9 Toxic Substances Control Act (TSCA)
TSCA provides regulations regarding the import, export, use, and disposal of specifi cally listed toxic chemicals. At SNL/NM, compliance with TSCA primarily involves the handling and disposal of polychlorinated biphenyls (PCB). Sandia was in full compliance with TSCA in 2010. Details related to TSCA are in Section 3.4.1.
2.1.10 Federal Insec cide, Fungicide, and Roden cide Act (FIFRA)
FIFRA regulates pesticide use and is enforced under the New Mexico Pesticide Control Act. Sandia’s Biological Control Activity compiles information on pesticide use at SNL/NM, as discussed in Section 3.5. Sandia was in full compliance with FIFRA in 2010.
2.1.11 Na onal Environmental Policy Act (NEPA)
NEPA requires federal agencies (and other organizations that perform federally sponsored projects) to consider environmental issues associated with proposed actions, be aware of the potential environmental impacts associated with these issues, and include this information in early project planning and decision making. Additionally, if a proposed action is not within a class of actions previously determined to have environmentally “insignifi cant” impacts, the agency must prepare an environmental assessment (EA) or an environmental impact statement (EIS) before making an irretrievable commitment of resources or funding. Although a major objective of NEPA is to preserve the environment for future generations, the law does not require an agency to choose a course of action with the least environmental impacts. Details are provided in Section 3.6.
2.1.12 Endangered Species Act (ESA)
Th e ESA ensures that any action authorized, funded, or carried out by a party will not jeopardize the continued existence of a “threatened or endangered species” or result in adverse modifi cations to its habitat. At SNL/NM, ESA compliance is coordinated through NEPA reviews and the Ecology Program. Table 2-3 lists the threatened and endangered species potentially occurring in Bernalillo County.

2010 Annual Site Environmental Report2-10
TABLE 2-3. Threatened and Endangered Species Poten ally Occurring in Bernalillo County, NM
Common Name Scientific Name Federal Status State Status Observed at KAFB
Plants Wright’s marsh thistle Cirsium wrightii Candidate ---
Animals Spotted bat Euderma maculatum --- Threatened
Pale Townsend’s big-eared bat Plecotus townsendii pallescens SOC --- New Mexican jumping mouse Zapus hudsonius luteus Candidate Endangered Fish
Rio Grande silvery minnow Hybognathus amarus Endangered Endangered Birds
Baird's sparrow Ammodramus bairdii --- Threatened Western burrowing owl Athene cunicularia hypugea SOC ---
Common black-hawk Buteogallus anthracinus anthracinus
--- Threatened
Mountain plover Charadrius montanus Proposed Threatened
---
Yellow-billed cuckoo Coccyzus americanus Candidate ---
Broad-billed hummingbird Cynanthus latirostris magicus --- Threatened Southwest willow flycatcher Empidonax traillii extimus Endangered Endangered Aplomado falcon Falco femoralis septentrionalis Endangered Endangered American peregrine falcon Falco peregrinus anatum --- Threatened XArctic peregrine falcon Falco peregrinus tundrius --- Threatened
Bald eagle Haliaeetus leucocephalus --- Threatened White-eared hummingbird Hylocharis leucotis borealis --- Threatened Brown pelican Pelecanus occidentalis
carolinensis --- Endangered
Neotropic cormorant Phalacrocorax brasilianus --- Threatened Mexican spotted owl Strix occidentalis lucida Threatened --- Bell's vireo Vireo bellii --- Threatened X
Gray vireo Vireo vicinior --- Threatened X
Reptiles
Narrowhead garter snake Thamnophis rufipunctatus SOC ---
Insects
Slate millipede Toltecus chihuanus SOC ---
NOTE: There are no listed endangered or threatened amphibian species in Bernalillo County for Calendar Year (CY) 2010. KAFB = Kirtland Air Force Base NM = New Mexico
SOC = species of concern

Compliance Summary 2-11
2.1.13 Migratory Bird Treaty Act (MBTA)
Th e MBTA of 1918 put the 1916 Convention for the Protection of Migratory Birds into eff ect. Th e original statute implemented the agreement between the U.S. and Great Britain (for Canada), and later amendments implemented treaties between the U.S. and Mexico, the U.S. and Japan, and the U.S. and Russia. Th e MBTA prevents the taking, possession, killing, transportation, or importation of migratory birds, their eggs, parts, or nests. At SNL/NM, the MBTA is coordinated through NEPA reviews and the Ecology Program.
2.1.14 Cultural Resources Acts
Th e three primary cultural resources acts applicable at SNL/NM are:
• National Historic Preservation Act (NHPA),
• Archaeological Resources Protection Act (ARPA), and
• American Indian Religious Freedom Act (AIRFA).
At SNL/NM, cultural resources compliance is coordinated through the NEPA Program. Actions that could adversely aff ect cultural resources are initially analyzed in a NEPA checklist. Historic properties, as defi ned by NHPA and other implementing regulations, include archaeological sites and historic buildings and structures. Historic buildings and structures may include those over 50 years of age that are historically signifi cant or younger structures of exceptional signifi cance. Th ere are historic buildings on property owned by DOE/NNSA. Planning through the NEPA process identifi es potential impacts to these sites, and appropriate historic documentation is undertaken to mitigate adverse eff ects when necessary.
Th ere are no known archaeological sites located on DOE/NNSA-owned property. However, archaeological sites do exist on and in close proximity to DOE/NNSA-permitted property and ER sites. Th ese areas are located on U.S. Air Force (USAF) property and on portions of the Cibola National Forest land withdrawn area. Sandia activities are planned to avoid potential impacts to these cultural resource sites. DOE/NNSA has a responsibility to ensure that impacts to cultural resources are assessed and appropriate actions are taken to mitigate any impact.
Historic Building AssessmentIn 2010, Sandia, DOE/NNSA/SSO undertook consultation with the New Mexico State Historic Preservation Offi ce (SHPO) on actions at 11 individual buildings. Actions at 9 of the buildings were found to have no adverse eff ect on cultural resources. Th e proposed addition of an Americans with Disabilities Act (ADA) compliant elevator to Building 860, however, requires additional consultation to ensure alterations will not undercut the building’s historic design. Similarly, consultation continues regarding the proposed removal of the Old Centrifuge in TA-II.
In 2010, SNL undertook a site-wide survey and historic building assessment of the SNL/NM site. Th e fi nal recommendation to SSO included eight historic districts and three individually eligible buildings. SSO has not yet completed consultation with SHPO on the recommendation. Also, documentation continues on buildings previously found eligible for the National Register of Historic Places.

2010 Annual Site Environmental Report2-12
2.1.15 Environmental Compliance Execu ve Orders (EO)
Floodplain Management (EO 11988), as amended, as minimal impact for SNL/NM since all active SNL/NM facilities are located outside the 500 year fl oodplain as described by the U.S. Army Corps of Engineers (ACE) (USACE 1979). Th is applies to both major on-site drainages: Tijeras Arroyo and Arroyo del Coyote.
Protection of Wetlands (EO 11990), as amended. Wetlands are areas inundated by surface or groundwater with a frequency suffi cient to support a prevalence of aquatic plant and/or animal life. Wetlands generally include swamps, bogs, potholes, ponds, mud fl ats, and areas around natural springs. Th ere are several natural springs on KAFB with a limited wetland setting. Th ese springs, located on lands withdrawn from Cibola National Forest, are managed by the USAF and the U.S. Forest Service (USFS). Th ese springs provide an important source of drinking water for wildlife and create a unique biological niche in an otherwise arid habitat.
Federal Actions to Address Environmental Justice in Minority Populations and Low-Income Populations (EO 12898), as amended. To the greatest extent practicable and permitted by law, consistent with the principles set forth in the Report on the National Performance Review (Gore 1993), each federal agency shall make achieving environmental justice part of its mission by identifying and addressing, as appropriate, disproportionately high and adverse human health or environmental eff ects of its programs, policies, and activities on minority populations and low-income populations in the U.S. and its territories and possessions. DOE/NNSA/SSO and Sandia perform a periodic analysis to assess whether their existing or proposed operations cause any disproportionate impacts on minority or low-income populations within the area of infl uence of Sandia operations.
Strengthening Federal Environmental, Energy, and Transportation Management (EO 13423), was issued in January 2007. EO 13423 sets goals in the areas of energy effi ciency, acquisition, renewable energy, toxin reductions, recycling, sustainable buildings, electronics stewardship, fl eets, and water conservation. EO 13423 also requires more widespread use of Environmental Management Systems (EMS) as the framework in which to manage and continually improve these sustainable practices. EO 13423 incorporates the requirements of and cancels EOs 13101, 13123, 13134, 13148, and 13149, which were implemented through DOE Order 450.1 in January 2003. DOE revised Order 450.1 to include the requirements of EO 13423 in June 2008.
Leadership in Environmental, Energy, and Economic Performance (EO 13514), was issued in October 2009. EO 13514 establishes an integrated strategy towards sustainability to safeguard the health of our environment and make greenhouse gas emissions a priority for all federal agencies. EO 13514 sets goals in the areas of promoting electronics stewardship, pollution prevention, increased renewable energy, waste reduction, recycling, and fossil fuel usage reduction.
2.1.16 DOE Direc ves
DOE directives on the contract baseline that pertain to environmental protection and management are discussed in Chapter 1, “Sandia’s Operations Contract.” In 2010, Sandia met all requirements stated in these DOE directives.
2.1.17 Summary of Radiological Releases
A summary of radiological releases and public doses resulting from Sandia operations is provided in Table 2-4. Additional detailed information is found in Sections 5.3 and 5.4 of this report.

Compliance Summary 2-13
Pathway Dose to Off-Site MEI
Dose to On-Site MEI
Percent of DOE
100 mrem/yrLimit
Estimated Population Dose (80-km radius)
Population within 80-km
radius of site
Estimated Background
Radiation Population Dose
mrem mSv mrem mSv Person-rem Person-Sv Person-rem
Person-Sv
Air 2.43E-03 2.43E-05 2.87E-02 2.87 -04 0.002 percent 1.24E-01 1.24E-03 882,187 - - Water 0 0 0 0 0 0 0 0 - - Other Pathways 0 0 0 0 0 0 0 0 - -
AllPathways
2.43E-03 2.43E-05 2.87E-02 2.87E-04 0.002 percent 1.24E-01 1.24E-03 882,187 5.03E+04 5.03E+02
Radiological Atmospheric Releases for 2010 (in Curies) Tritium Noble Gases
(t1/2 <40 days) Fission and Activation Products
(t1/2 <3 hr)
Fission and Activation Products
(t1/2 >3 hr)
Total Radio-
strontium
Total U
Other Actinides
Other
2.21E+00 4.09E+00 6.80E-04 1.01E-07 3.55E-07 0 6.73E-05 0
Liquid Effluent Releases of Radioactive Material for 2010 Tritium Fission and
Activation Products
(t1/2 <3 hr)
Fission & Activation Products
(t1/2 >3 hr)
Total Radio-iodine
Total Radio-
strontium
Total U Pu
0 0 0 0 0 0 0
NOTES: DOE = U.S. Department of Energy MEI = maximally exposed individual
km = kilometer mrem = millirem mSv = millisievert Pu = Plutonium U = Uranium
TABLE 2-4. SNL/NM Radiological Dose Repor ng for Calendar Year 2010
2.2 2010 Releases, Compliance Issues, and Environmental Occurrences
Under DOE Manual 231.1-2, an occurrence is defi ned as “one or more (i.e., recurring) events or conditions that adversely aff ect, or may adversely aff ect, DOE (including NNSA) or contractor personnel, the public, property, the environment, or the DOE mission.” Events or conditions meeting criteria thresholds identifi ed in DOE Manual 231.1-2, or determined to be recurring through performance analysis, are considered occurrences. Th ere are environmental releases that may not meet DOE Manual 231.1-2 reporting thresholds; however, they are still reportable to outside agencies (see Chapters 2 and 6).
2.2.1 Occurrence Tracking
DOE Occurrence Reporting is tracked by the Integrated Safety Management and Assurance Department. All SNL/NM occurrences are entered into DOE’s Occurrence Reporting Processing System (ORPS) database, which also tracks corrective actions and closure of occurrence reports.
For all categories, during 2010 there were 51 occurrences; fi ve of these were environmentally-related at SNL/NM.

2010 Annual Site Environmental Report2-14
DOE Manual 231.1-2 2010 Reportable Environmental OccurrencesTable 2-5 lists the DOE Manual 231.1-2 environmental and environmentally-related occurrences for the fi ve year period from 2006 to 2010. Th e table shows all occurrences for which the “reporting criteria” (post-August 25, 2003) included “environmental.” As stated previously, there were fi ve reportable environmental occurrences in 2010 — one was categorized as Signifi cance Category 2, one was categorized as Signifi cance Category 3 and three were categorized as Signifi cance Category 4 (the lowest level occurrence). Table 2-6 summarizes DOE Manual 231.1-2 2010 Reportable Environmental Occurrences.
2.2.2 Environmental Release Tracking
Environmental releases include notifi cations that are not tracked through ORPS, as well as notifi cations to outside agencies.
2010 Environmental ReleasesIn 2010, there was one surface discharge release that was reportable to NMED and one release to the sanitary sewer system reported to ABCWUA. Th ese releases are summarized in Section 6.2.2.
2.3 2010 Audits and Appraisals
Operations at SNL/NM and DOE/NNSA/SSO are routinely subjected to audits by external regulatory agencies. Sandia also conducts its own self-assessments and appraisals. Environmental audits and appraisals conducted by external agencies in 2010 are listed in Table 2-7. During 2010, the ABCWUA performed inspections of the wastewater discharges. No fi ndings or observations resulted from these inspections.
2.4 Summary of Repor ng Requirements
External reporting requirements (other than to DOE) are necessary for both routine and non-routine releases of pollutants or hazardous substances. Release information may be used to evaluate facility operation compliance, waste handling activities, and emergency response programs. Table 2-8 summarizes the primary reporting requirements for releases applicable to SNL/NM.
2.5 Summary of Environmental Permits
Table 8-1 in Chapter 8 lists all environmental permits and registrations that were in eff ect in 2010. It includes pending permit applications under review by various agencies.
2 .6 Environmental Performance Measures
Environmental performance at SNL/NM is tracked through performance measures and indicators. It is reported through management reports and annual summaries (such as this report).
Table 2-8 lists the environmental performance measure results for Notices of Violations at SNL/NM.

Compliance Summary 2-15
TABLE 2-5. Environmentally-Related Occurrences for Five Years (2006-2010)
Nature of Occurrence or Reporting Criteria
2006 2007 2008 2009 2010
Group 2 - Personnel Safety and Health
Personal exposure to chemical, biological, or physical hazards above limits - 2A(5) (Post-August 2003 Reporting Criteria). 4 2 2 3 1
Group 5 - Environmental Environmental releases above permitted levels and exceeds report quantities specified in 40 CFR 302 or 40 CFR 355 - 5A(1). 1
Any discharge that exceeds 100 gallons in any form - 5A(2). Release of Hazardous Substance, Material or Waste above permitted levels and exceeds percent of report quantities specified in 40 CFR 302 or 40 CFR 355 - 5A(3).
Release of Hazardous Substance, Material, or Waste that must be reported to outside agencies in a format other then routine periodic reports (oil spills <10 gal need not be reported) - 5A(4).
1 1 1 1 1
Group 9 - Noncompliance Notifications Any enforcement action (other than associated with the PAAA) involving ten or more cited violations, and/or an assessed fine of $10,000 or more - 9(1). 3
Any written notification from an outside regulatory agency that a site/facility is considered to be in noncompliance with a schedule or requirement - 9(2). 1 1 1
Group 10 - Management Concerns Any event, condition, or series of events that does not meet any of the other reporting criteria, but is determined by the Facility Manager or line management to be of safety significance or of concern to other facilities or activities in the DOE complex - 10(2).
1 6 4 1 2
A near miss, where no barrier or only one barrier prevented an event from having a reportable consequence - 10(3). 1 3 2
An event that results in a significance concern by affected state, tribal, or local officials, press, or general population; that could damage the credibility of the Department or that may result in inquiries to Headquarters - 10(4).
NOTES: CFR = Code of Federal Regulations DOE = U.S. Department of Energy PAAA = Price Anderson Amendment Act
Environmental performance and Sandia’s performance measures are also assessed as part of the Performance Evaluation Plan (PEP) agreement between DOE/NNSA/SSO and Sandia. On the basis of the PEP, DOE/NNSA/SSO prepares an annual Performance Evaluation Report (PER) that assesses Sandia’s performance for the fi scal year (FY). For FY 2010, the overall score for Sandia was listed as “Outstanding.”

2010 Annual Site Environmental Report2-16
TABLE 2-6. DOE Manual 231.1-2 Reportable Environmental Occurrences, 2010
Month Occurrence Significance
Category
Reporting Criteria
Description
May 4 5A(4) On May 20, 2010, an environmental sewage discharge of approximately 150 gallons (gal) of domestic waste occurred, which was caused by a backup in a sanitary sewer line. The discharge was stopped within a few minutes of being detected. The sanitary discharge traveled west approximately 150 feet (ft) along a paved roadway where approximately 10 gal entered a drop inlet of the storm drainage system. The remaining 140 gal traveled west about 150 ft along the paved roadway and then about 600 ft to the south along 14th Street Southeast. The material that travelled along the street was swept back into the sanitary sewer system using potable water. The roadway was neutralized with a 10 percent bleach solution. The release is not considered to be harmful to human health and safety, plant and animal life, and did not cause degradation to the environment. The release is being reported because it violates the terms of Sandia's Stormwater MSGP issued by the EPA. A critique/fact finding was conducted.
June 4 9(2) On June 21, 2010, a Notice of Violation (NOV) was received by Sandia National Laboratories (SNL) because analysis of environmental samples collected by the Albuquerque Bernalillo County Water Utility Authority (ABCWUA) and SNL on April 20, 2010 indicated an arsenic result of 0.131 mg/L, which exceeded the ABCWUA limit of 0.051 mg/L. On June 24, 2010 Center 1700 received the NOV. A critique/fact finding was performed. See Section 6.1.1 for details.
June 4 10(2) On June 24, 2010, analytical results for airborne beryllium sampling during a shot containing 400 mg of beryllium in Building 983-Z-Machine indicated that one member of the workforce (Center Section) exceeded the inhalable TLV (0.05 ug/m3) with a result of 0.052 ug/m3. The result for total beryllium for the same worker was .01 ug/m3 and did not exceed the DOE action limit (AL). All other results were either below the reporting limit or below the TLV or the DOE AL. On June 4, 2010 five members of the workforce were sampled for airborne beryllium exposure associated with the shot. The monitoring was conducted as part of the annual Industrial Hygiene Exposure Assessment for Z- Operations. The worker with the exceedance performed unloading activities. Unloading activities are conducted without a respirator for Z-Machine shots with less than 500 mg of beryllium based on historical data. Unloading activities for Z-Machine shots with 500 mg of beryllium or greater require that a respirator be worn. For this shot with 400 mg of beryllium, a respirator was not required. A critique/fact finding was performed.
October 3 2A(5) On September 1, 2010, a subcontractor was exposed to styrene while conducting a lining operation of a sewer located in TA-III. The SNL oversight monitoring of a sewer relining project revealed an exposure above the established limits of the American Conference of Governmental Industrial Hygienists (ACGIH). The specific task being monitored was the positioning and securing of the uncured liner with anchors in the manhole. Styrene is primarily a synthetic chemical that is used extensively in the manufacture of plastics, rubber, and resins. Sampling was conducted for both the Time Weighted Average (TWA) and the Short Term Exposure Limit (STEL). The results of the monitoring were received on October 20, 2010. One of the nine total samples resulted in an airborne concentration above the ACGIH styrene STEL. The one elevated STEL result was 186 ppm and the established ACGIH standard limit is 40 ppm. Management notifications were made and an investigation was initiated.
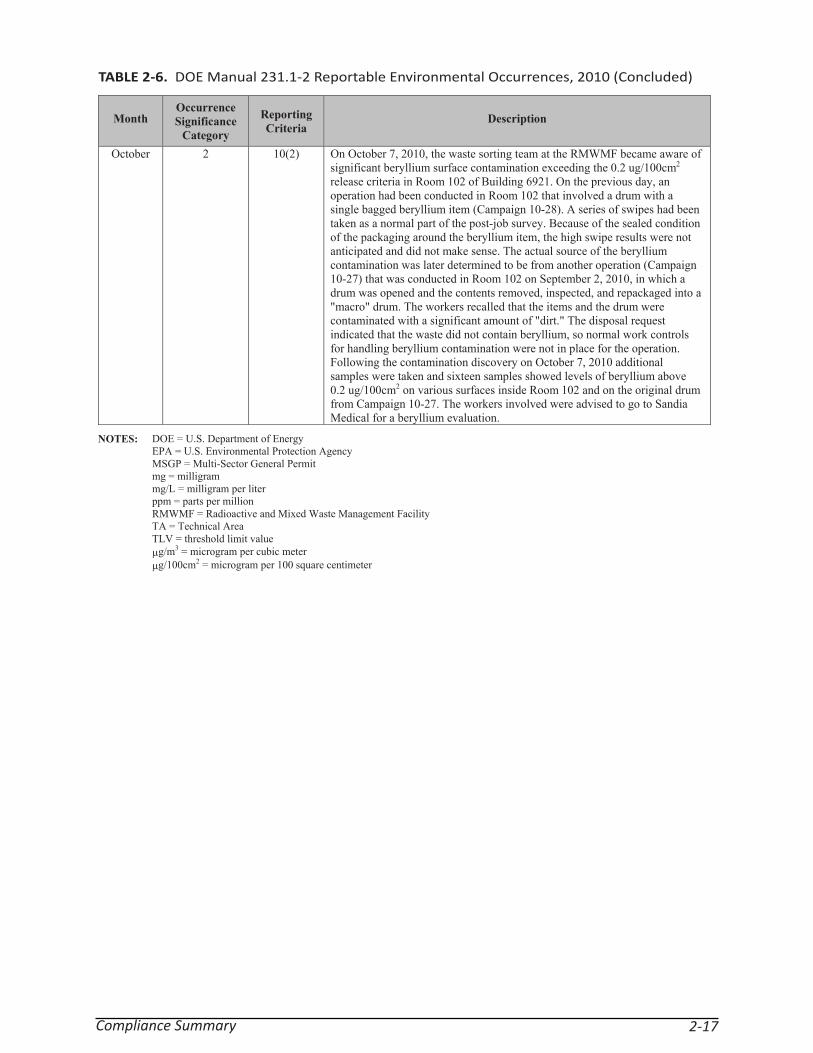
Compliance Summary 2-17
Month Occurrence Significance
Category
Reporting Criteria
Description
October 2 10(2) On October 7, 2010, the waste sorting team at the RMWMF became aware of significant beryllium surface contamination exceeding the 0.2 ug/100cm2
release criteria in Room 102 of Building 6921. On the previous day, an operation had been conducted in Room 102 that involved a drum with a single bagged beryllium item (Campaign 10-28). A series of swipes had been taken as a normal part of the post-job survey. Because of the sealed condition of the packaging around the beryllium item, the high swipe results were not anticipated and did not make sense. The actual source of the beryllium contamination was later determined to be from another operation (Campaign 10-27) that was conducted in Room 102 on September 2, 2010, in which a drum was opened and the contents removed, inspected, and repackaged into a "macro" drum. The workers recalled that the items and the drum were contaminated with a significant amount of "dirt." The disposal request indicated that the waste did not contain beryllium, so normal work controls for handling beryllium contamination were not in place for the operation. Following the contamination discovery on October 7, 2010 additional samples were taken and sixteen samples showed levels of beryllium above 0.2 ug/100cm2 on various surfaces inside Room 102 and on the original drum from Campaign 10-27. The workers involved were advised to go to Sandia Medical for a beryllium evaluation.
NOTES: DOE = U.S. Department of Energy EPA = U.S. Environmental Protection Agency MSGP = Multi-Sector General Permit mg = milligram mg/L = milligram per liter ppm = parts per million RMWMF = Radioactive and Mixed Waste Management Facility TA = Technical Area TLV = threshold limit value
g/m3 = microgram per cubic meter g/100cm2 = microgram per 100 square centimeter
TABLE 2-6. DOE Manual 231.1-2 Reportable Environmental Occurrences, 2010 (Concluded)

2010 Annual Site Environmental Report2-18
TABLE 2-7. Environmental Program Audits and Appraisals Conducted In 2010
Appraising Agency Title Date Summary External Audits and Appraisals ABCWUA ABCWUA inspected facilities
within Flow Basins 2069A, 2069F, 2069G, 2069I, 2069K and 2238A
Inspected facilities during March, August, September and November of 2010
No findings or observations resulted from these inspections
NMED * NMED site inspection of SNL/NM Holding and Septic Tanks
Inspection of active and removed systems April 1, 2010
NMED required submittal of updated information of active and removed systems
BSI ISO 14001 Assessment April 27, 2010 3 Minor Findings (non-conformities)
BSI ISO 14001 Assessment October 22, 2010 1 Minor Finding (non-conformity)
Internal Audits and Appraisals 00857 Internal Audit: ES&H, S&S, and IT Operations Department
ISO 14001 Internal Independent Audit of Selected Explosives Operations in SNL/NM Environmental Management System, 2010-E-0003
September 22, 2010 3 Findings 3 Observations 4 Noteworthy Practices
NOTES: ABCWUA = Albuquerque Bernalillo County Water Utility Authority BSI = British Standards Institute ES&H = Environment, Safety, and Health ISO = International Organization for StandardizationIT = Information Technology NMED = New Mexico Environment Department S&S = Safeguards and Security SNL/NM = Sandia National Laboratories, New Mexico *Refer to Section 2.3 for additional information.

Compliance Summary 2-19
TABLE 2-8. Summary of Sandia Repor ng Requirements to Outside Agencies (Other than DOE) for Releases of Pollutants or Hazardous Substances
Report Title Description Agency
Annual NESHAP Dose Assessment Report
A dose assessment of the calculated EDE to the MEI is based on the assumption that an exposed individual resides 24 hours-per-day at an area of highest incident radiation. Dose assessment is discussed in Section 5.4 of this report.
EPA40 CFR 61, Subpart H
RQ Accidental Release Reporting –
RQ release reporting is required by CERCLA and SARA Title III, or EPCRA to the NRC. CERCLA and EPCRA are discussed in Section 2.1.1 and 2.1.2 of this report. There were no reportable releases in 2010.
NRC40 CFR 302
TRI Report – EPCRA, Sections 302, 311, 312, and 313, requires a TRI report to be filed by facilities conducting specifically listed industrial activities and using listed toxic chemicals. As discussed in Section 2.1.2, Sandia is currently required to submit a TRI report because its chemical use is above the reporting threshold.
EPA40 CFR 372, Subpart B
Notification of Discharge
NMED requires reporting of oil or other water contaminant, in such quantity as may with reasonable probability injure or be detrimental to human health, animal or plant life, or property, or unreasonably interfere with the public welfare or use of the property shall make oral notification as soon as possible after learning of such a discharge, but in no event more than 24 hours thereafter to the NMED. Within one week, the owner and/or operator shall send written notification to the appropriate Bureau Chief verifying the prior oral notification. Within 15 days, the owner and/or operator shall send written notification to the appropriate Bureau Chief describing any corrective actions taken and/or to be taken relative to the discharge. One surface discharge release occurred in 2010. Details of this event is summarized in Section 6.2.2.
NMED 20.6.2.1203 NMAC
Accidental Slug Discharge Notification
The ABCWUA requires immediate notification to the Wastewater Utility Division of any accidental/slug discharge that may cause potential problems for the POTW. Within five days following such occurrence, the user is required to provide the Industrial Waste Engineer with a detailed written report describing the cause of the dangerous discharge and measures to be taken to prevent similar future occurrences. During CY 2010 there was one reportable event that exceeded permitted limits and notification was sent to the ABCWUA.
ABCWUA Sewer Use and Wastewater Control Ordinance
NOTES: ABCWUA = Albuquerque Bernalillo County Water NESHAP = National Emission Standards for Utility Authority Hazardous Air Pollutants CERCLA = Comprehensive Environmental Response, NMAC = New Mexico Administrative Code Compensation, and Liability Act NMED= New Mexico Environment Department CFR = Code of Federal Regulations NRC = U.S. Nuclear Regulatory Commission CY = Calendar Year POTW = Publicly-Owned Treatment Works
EDE = Effective Dose Equivalent RQ = Reportable Quantity EPA = U.S. Environmental Protection Agency Sandia = Sandia Corporation EPCRA = Emergency Planning and Community Right- SARA = Superfund Amendments and Reauthorization Act to-Know Act TRI = Toxic Release Inventory MEI = Maximally Exposed Individual

2010 Annual Site Environmental Report2-20
Th is page intentionally left blank.
Environmental Programs Informa on 3-1
Environmental programs carried out by Sandia Corporation (Sandia) are in place to protect the environment, safety, and health (ES&H) of its employees and the community. Th ese environmental programs meet or exceed the requirements of federal, state, and local environmental regulations, as well as U.S. Department of Energy (DOE) directives in the Prime Contract between Sandia and DOE. Presidential Executive Orders (EO) and DOE guidance documents are also used to establish program criteria.
Th e environmental programs are part of Sandia’s Environmental Management System (EMS). Sandia’s EMS is its primary management approach for addressing environmental aspects of operations and activities, including energy and transportation functions.
Environmental Monitoring HistoryEnvironmental monitoring began at Sandia National Laboratories, New Mexico (SNL/NM) in 1959 when the principal objective was to monitor radioactive effl uents and determine any associated environmental impacts. Since then, environmental programs, along with other ES&H activities, have greatly expanded at SNL/NM.
ES&H PolicySandia’s ES&H policy is implemented to protect and preserve the environment and to ensure the safety and health of its employees, contractors, visitors, and the public while maintaining the corporate vision and mission. Sandia’s corporate ES&H Program mandates compliance with all applicable laws, regulations, and DOE directives included in the Prime Contract between DOE and Sandia, internal Corporate Processes, and permit requirements. As such, Sandia has committed to the following:
• Plan work incorporating safety awareness, protective health practices, environmental management, pollution prevention (P2), and the long-term environmental stewardship (LTES) of resources;
• Identify hazards and evaluate, monitor, and manage risks with eff ective ES&H systems;
• Implement controls that prevent injury, exposure to hazardous materials, and the release of materials that could be hazardous to the environment;
• Perform quality work while protecting people, the environment, and our nation’s security;
• Continually improve ES&H performance by establishing, meeting, and assessing measurable ES&H goals, objectives, targets, and milestones; and
• Regularly communicate ES&H issues to the Members of the Workforce, the community, regulators, and our stakeholders.
Environmental Programs Informa on

2010 Annual Site Environmental Report3-2
Integrated Safety Management System (ISMS)Sandia’s methodology for managing and implementing its ES&H Program is outlined in the ISMS. Th e ISMS is centered on fi ve safety management functions, which provide processes to guide management in identifying and controlling hazards. Th ese include:
(1) defi ne the scope of work, (2) analyze the hazards, (3) develop and implement control hazards, (4) perform work within controls, and (5) provide feedback and continuous improvement.
3.1 Sandia Environmental Management System (EMS)
In accordance with DOE Order 450.1A, Environmental Protection Program (DOE 2008a), Sandia implemented an EMS as part of the ISMS. Th e EMS is the framework by which SNL/NM manages, and continually improves, its environmental compliance and sustainability practices. Th e EMS identifi es the environmental consequences of SNL/NM’s activities, products, and services and develops objectives and measurable targets to mitigate potential impacts to the environment.
SNL/NM personnel implemented its EMS in December 2005 and received third-party International Organization for Standardization (ISO) 14001 Certifi cation in 2009. Since that time, Sandia has worked to fully implement and establish the EMS in conjunction with ISMS in all site operations. Some major accomplishments of the EMS for Fiscal Year (FY) 2010 include:
• Corporate-and division-level EMS objectives and targets were established and tracked quarterly to survey progress;
• Internal and external outreach events were conducted to increase environmental awareness;
• Environmental program plans that detail requirements and roles and responsibilities were updated;
• Implementation of the Chemical Exchange Program (CEP) was continued, reapplying over 338 chemicals, reducing 998 kilograms (kg) of hazardous waste and avoiding approximately $17,595 and $90,120 in waste and new purchase costs, respectively;
• During Calendar Year (CY) 2010, two buildings were awarded Leadership in Energy and Environmental Design (LEED) certifi cation. Th e new Ion Beam Laboratory (IBL) received a Gold level certifi cation under the LEED for New Construction (NC) Green Building Rating System, and Building 750 received a Silver level certifi cation under the LEED for Existing Building: Operations and Maintenance (EBOM) rating system;
• Site Sustainability Plan (SSP) that articulates performance status and planned actions for meeting DOE’s Strategic Sustainability Performance Plan (SSPP) goals and broader sustainability program;
• Continued application of the successful Resource Management Audit process (developed by Sandia) for identifying sustainability opportunities and providing justifi cation for implementing improvement projects;
• Additionally, for CY 2011, six buildings have been targeted for compliance with the guiding principles (GP). Th ese newer buildings are already fully metered and equipped with advanced control systems, thus minimizing costs that would otherwise be associated with updating and/or renovations to incorporate high performance building; and
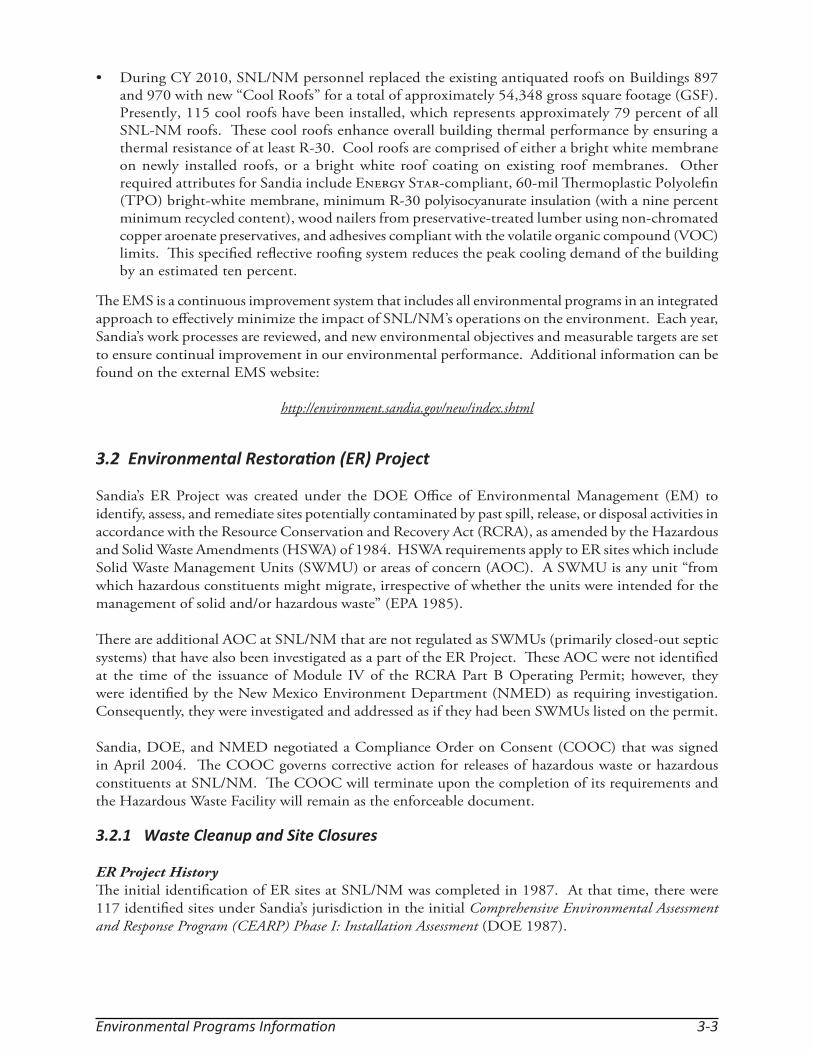
Environmental Programs Informa on 3-3
• During CY 2010, SNL/NM personnel replaced the existing antiquated roofs on Buildings 897 and 970 with new “Cool Roofs” for a total of approximately 54,348 gross square footage (GSF). Presently, 115 cool roofs have been installed, which represents approximately 79 percent of all SNL-NM roofs. Th ese cool roofs enhance overall building thermal performance by ensuring a thermal resistance of at least R-30. Cool roofs are comprised of either a bright white membrane on newly installed roofs, or a bright white roof coating on existing roof membranes. Other required attributes for Sandia include Energy Star-compliant, 60-mil Th ermoplastic Polyolefi n (TPO) bright-white membrane, minimum R-30 polyisocyanurate insulation (with a nine percent minimum recycled content), wood nailers from preservative-treated lumber using non-chromated copper aroenate preservatives, and adhesives compliant with the volatile organic compound (VOC) limits. Th is specifi ed refl ective roofi ng system reduces the peak cooling demand of the building by an estimated ten percent.
Th e EMS is a continuous improvement system that includes all environmental programs in an integrated approach to eff ectively minimize the impact of SNL/NM’s operations on the environment. Each year, Sandia’s work processes are reviewed, and new environmental objectives and measurable targets are set to ensure continual improvement in our environmental performance. Additional information can be found on the external EMS website:
http://environment.sandia.gov/new/index.shtml
3.2 Environmental Restora on (ER) Project
Sandia’s ER Project was created under the DOE Offi ce of Environmental Management (EM) to identify, assess, and remediate sites potentially contaminated by past spill, release, or disposal activities in accordance with the Resource Conservation and Recovery Act (RCRA), as amended by the Hazardous and Solid Waste Amendments (HSWA) of 1984. HSWA requirements apply to ER sites which include Solid Waste Management Units (SWMU) or areas of concern (AOC). A SWMU is any unit “from which hazardous constituents might migrate, irrespective of whether the units were intended for the management of solid and/or hazardous waste” (EPA 1985).
Th ere are additional AOC at SNL/NM that are not regulated as SWMUs (primarily closed-out septic systems) that have also been investigated as a part of the ER Project. Th ese AOC were not identifi ed at the time of the issuance of Module IV of the RCRA Part B Operating Permit; however, they were identifi ed by the New Mexico Environment Department (NMED) as requiring investigation. Consequently, they were investigated and addressed as if they had been SWMUs listed on the permit.
Sandia, DOE, and NMED negotiated a Compliance Order on Consent (COOC) that was signed in April 2004. Th e COOC governs corrective action for releases of hazardous waste or hazardous constituents at SNL/NM. Th e COOC will terminate upon the completion of its requirements and the Hazardous Waste Facility will remain as the enforceable document.
3.2.1 Waste Cleanup and Site Closures
ER Project HistoryTh e initial identifi cation of ER sites at SNL/NM was completed in 1987. At that time, there were 117 identifi ed sites under Sandia’s jurisdiction in the initial Comprehensive Environmental Assessment and Response Program (CEARP) Phase I: Installation Assessment (DOE 1987).

2010 Annual Site Environmental Report3-4
Since then, a total of 500 individual sites, potential sites, or individual historical activities have been identifi ed for investigation. Many of these sites were confi rmed to contain little or no contaminants of concern (COC). In 1992, the ER Project at SNL/NM was offi cially initiated to implement assessment and remediation activities for sites that had been contaminated or potentially contaminated because of past SNL/NM operations. In addition to the SNL/NM site, other sites included in the original scope of Sandia’s ER Project were Sandia National Laboratories, Livermore, California (SNL/CA), the Kauai Test Facility (KTF), and the Tonopah Test Range (TTR). Th ere were also a number of miscellaneous sites located in other areas, nationwide and internationally.
Corrective Action Complete (CAC) Status DOE and Sandia propose ER sites to NMED for CAC status when they meet NMED criteria, either before or after remediation; the criteria include acceptable levels of risk to human health and the environment presented by the contaminants at the site.
After NMED grants CAC status, DOE and Sandia submit a request for a Class III modifi cation to the HSWA Module (Module IV) of Permit NM5890110518-1 (the Permit) requesting that the site be deleted from Table A.1 “List of Solid Waste Management Units (SWMU) and Areas of Concern (AOC) Requiring Corrective Action” of the permit and added to Table A.2 “List of Solid Waste Management Units (SWMUs) and Areas of Concern (AOCs) not currently requiring Corrective Action” of the permit.
Th e majority of ER sites are granted CAC status under a risk-based scenario. Risks to human health and the environment are calculated for sites with residual contamination according to U.S. Environmental Protection Agency (EPA) and NMED guidelines. Th e level of contamination remaining, and the appropriate land-use category (i.e., industrial, residential, or recreational use) are used, together with the available information and conceptual model for each site, to determine the risk to human health and the environment.
Of the remaining 33 sites, 31 were submitted for CAC determinations from the NMED. In April 2010 the NMED issued a letter requesting additional corrective action at fi ve of the 31 sites, including SWMUs 8, 58, 68, 149, and 154. Th e remaining 26 sites are currently in the public comment process with a hearing anticipated in 2011 or 2012. All CAC proposals and Class III Permit modifi cations are available for review at the University of New Mexico (UNM) Zimmerman Library.
3.2.2 Selected Units at SNL/NM
Chemical Waste Landfi ll (CWL)Th e CWL, an interim status landfi ll, is approximately 1.9 acres and is located in the southeast corner of Technical Area (TA)-III. From 1962 through 1985, the CWL was used for disposal of hazardous wastes, chemicals, and solid wastes generated by SNL/NM research activities. Liquid waste disposal ended in 1982. Th e CWL was also used as a hazardous waste drum storage facility from 1981 to 1989.
Th e permitting and closure processes for the CWL were initiated during the 1980s. NMED approved the CWL Closure Plan in 1993. Closure activities were conducted through the ER Project and included two voluntary corrective measures (VCM): soil vapor extraction (SVE) and landfi ll excavation (LE). Excavation of the landfi ll began September 30, 1998. Over 52,000 cubic yards (yd3) of soil and debris were excavated from the landfi ll between 1998 and 2002. Except for the area around one verifi cation sampling grid point that was excavated in January 2003, all excavation was completed in February 2002. Th e excavation process, waste management activities, fi nal verifi cation soil sampling analytical
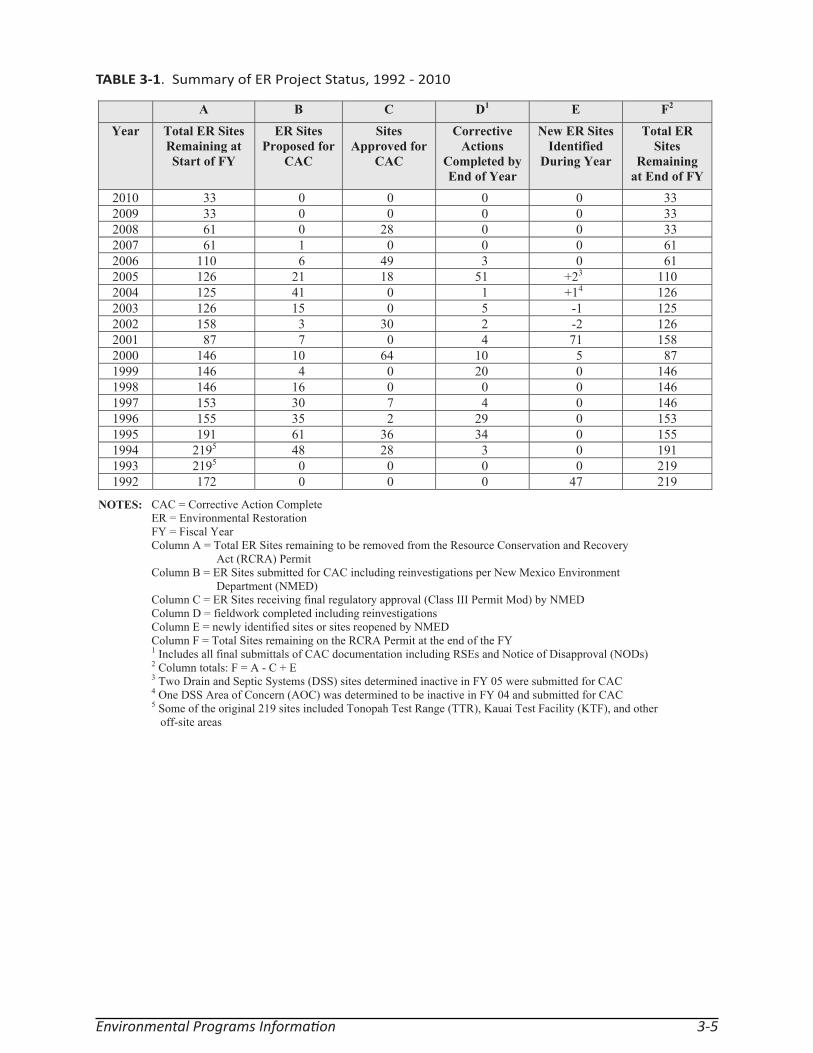
Environmental Programs Informa on 3-5
TABLE 3-1. Summary of ER Project Status, 1992 - 2010
A B C D1 E F2
Year Total ER Sites Remaining at Start of FY
ER Sites Proposed for
CAC
SitesApproved for
CAC
Corrective Actions
Completed by End of Year
New ER Sites Identified
During Year
Total ER Sites
Remaining at End of FY
2010 33 0 0 0 0 33 2009 33 0 0 0 0 33 2008 61 0 28 0 0 33 2007 61 1 0 0 0 61 2006 110 6 49 3 0 61 2005 126 21 18 51 +23 110 2004 125 41 0 1 +14 126 2003 126 15 0 5 -1 125 2002 158 3 30 2 -2 126 2001 87 7 0 4 71 158 2000 146 10 64 10 5 87 1999 146 4 0 20 0 146 1998 146 16 0 0 0 146 1997 153 30 7 4 0 146 1996 155 35 2 29 0 153 1995 191 61 36 34 0 155 1994 2195 48 28 3 0 191 1993 2195 0 0 0 0 219 1992 172 0 0 0 47 219
NOTES: CAC = Corrective Action Complete ER = Environmental Restoration FY = Fiscal Year Column A = Total ER Sites remaining to be removed from the Resource Conservation and Recovery
Act (RCRA) Permit Column B = ER Sites submitted for CAC including reinvestigations per New Mexico Environment
Department (NMED) Column C = ER Sites receiving final regulatory approval (Class III Permit Mod) by NMED Column D = fieldwork completed including reinvestigations Column E = newly identified sites or sites reopened by NMED Column F = Total Sites remaining on the RCRA Permit at the end of the FY 1 Includes all final submittals of CAC documentation including RSEs and Notice of Disapproval (NODs) 2 Column totals: F = A - C + E 3 Two Drain and Septic Systems (DSS) sites determined inactive in FY 05 were submitted for CAC 4 One DSS Area of Concern (AOC) was determined to be inactive in FY 04 and submitted for CAC 5 Some of the original 219 sites included Tonopah Test Range (TTR), Kauai Test Facility (KTF), and other off-site areas
2010 Annual Site Environmental Report3-6
results, and fi nal risk assessment were presented in the LE VCM Final Report (SNL 2003), which was approved by NMED on December 16, 2003 (Moats 2003). Th e primary COC at the CWL are VOC and metals.
Th e majority of the soils excavated from the CWL were managed at the Corrective Action Management Unit (CAMU), which is located adjacent to the CWL. Th e soils were treated as needed and placed into the CAMU containment cell for long-term management. Sampling and fi nal cleanup of the CWL site was completed in February 2004 and documented in an addendum to the LE VCM Final Report approved by NMED in October 2005.
As part of the CWL closure process defi ned in the amended Closure Plan, DOE and Sandia submitted a compilation of documents to NMED on May 20, 2003 that included the CWL Corrective Measures Study (CMS) Report, Remedial Action Plan (RAP), and Post-Closure Care Plan (PCCP), with a request that NMED select the remedy through approval of the CMS Report and RAP, and approve the PCCP for post-closure care. A revised CMS Report was submitted in December 2004, as requested by NMED; the revised RAP was included as an annex. A revised PCCP was submitted to NMED as a permit application in September 2005. In May 2004, DOE and Sandia requested NMED approval of an Interim Corrective Measure (ICM) to allow construction of the at-grade evapotranspirative landfi ll cover; the design for this cover was originally presented in the May 2003 RAP. NMED approved the ICM in September 2004. Backfi lling of CWL to four feet (ft) below ground surface (bgs) was completed in February 2004. Th e CWL cover installation began in March 2005 and was completed in September 2005.
On May 21, 2007, NMED issued a draft CWL Post-Closure Care Permit for public comment, together with a notice of intent to approve the CMS Report and the fi nal remedy selected for the CWL (i.e., at-grade evapotranspirative cover) and a Closure Plan amendment. DOE and Sandia submitted comments on the draft permit to NMED and requested a public hearing. Several citizens also submitted comments and requested a public hearing. Informal negotiations were initiated by the NMED in August 2008 with all interested parties requesting a public hearing. Th ese negotiations continued into CY 2009, and in October 2009 the CWL Closure Plan Amendment, as changed, the CWL Post-Closure Care Permit, and the CWL CMS Report/Final Remedy were approved by NMED. As part of these negotiations, DOE and Sandia agreed to decommission four groundwater monitoring wells and install four new monitoring wells.
In addition, during the negotiations DOE and Sandia submitted a revegetation plan for the at-grade cover because the initial seeding performed in 2005 was not successful (SNL 2009). NMED approved the plan on July 31, 2009 (Bearzi 2009).
Revegetation activities (i.e., weed removal, applying new seed and gravel mulch, and performing supplemental watering) were completed from August through October 2009, with additional weed removal performed in November 2009 and March 2010. Results included robust native grass growth with minimal weeds. From April through July 2010, the four new groundwater monitoring wells were installed and four existing wells were decommissioned in accordance with the approved Closure Plan Amendment.
All fi nal closure activities are documented in the CWL Final RCRA Closure Report (SNL 2010) that was submitted to NMED on September 27, 2010. After NMED approval, monitoring and post-closure care at the CWL will be performed under the NMED-approved CWL Post-Closure Care Permit (NMED 2009a).
Environmental Programs Informa on 3-7
CAMUTh e CAMU (located in TA-III near the CWL) is permitted under RCRA and Toxic Substances Control Act (TSCA) for the management of remediation waste (primarily contaminated soil) generated during the LE VCM at the CWL. Storage, treatment, and containment activities are authorized under the CAMU permit (EPA 1997). Two treatment processes, Low Temperature Th ermal Desorption (LTTD) for organic compounds and stabilization treatment (ST) for metals, were used as needed to treat soil wastes before they were placed in the containment cell. LTTD treatment operations were completed in December 2002, and ST treatment activities were completed in January 2003.
Th e staging, treatment, and support areas at the CAMU were clean-closed under the RCRA and TSCA provisions outlined in the closure plan (SNL 2002). Th e CAMU containment cell cover was installed in July 2003, which encapsulated the CWL remediation waste in place. Th e CAMU was certifi ed closed on October 15, 2003 in compliance with the closure requirements documented in the RCRA Closure Report (SNL 2003a). Th e CAMU containment cell, where the treated waste remains, will continue to be monitored and maintained in accordance with post-closure requirements.
Th e CAMU containment cell consists of engineered barriers, a fi nal cover system, and incorporates a bottom liner system with a leachate collection system and a vadose zone monitoring system (VZMS). Th e VZMS provides information on soil conditions under the cell for early detection of leaks. Th e VZMS consists of three subsystems that include the primary subliner (PSL), a vertical sensor array (VSA), and the CWL/sanitary sewer (CSS) line monitoring subsystems. Th e PSL, VSA, and CSS monitoring subsystems are monitored quarterly for the composition of soil vapors and soil moisture content.
In 2010, 527 gallons (gal) of leachate were removed from the collection system; 587 gal of leachate were removed during 2009. Th e leachate is pumped from the containment cell leachate collection system on a weekly basis. Th e leachate is a listed hazardous waste (F039 - Leachate [liquids that have percolated through land disposed wastes] resulting from the disposal of more than one restricted waste classifi ed as hazardous under Subpart D of this part). Th e pumped leachate is containerized in 55-gal poly drums and stored in a RCRA 90-Day Storage Area. Th e waste is characterized by drawing a composite sample which is sent to an off -site laboratory for analysis. Th e waste is transported to the SNL/NM Hazardous Waste Management Facility (HWMF). Th e waste is subsequently shipped to an off -site hazardous waste facility for treatment.
Baseline data for soil moisture and soil vapor were established between October 2003 and September 2004. Baseline is defi ned as data collected monthly for one year after the closure of the containment cell in October 2003. Th e soil moisture monitoring results indicate increases at two of the CSS monitoring subsystem locations when compared to the baseline data. Increasing soil moisture at location CSS-2 (12- and 16-ft depths) was fi rst observed in September 2005, and the increasing soil moisture trend at location CSS-3 (12-ft depth) was fi rst observed in March 2007. Th e monitoring results for 2010 indicate the soil moisture at CSS-2 (12- and 16-ft depths) has stabilized but continues to increase at the CSS-3 (12-depth). However, the PSL and VSA monitoring subsystem location soil moisture data have remained consistent with the baseline data indicating that the containment cell is not the source of the moisture.
Th e 2010 soil vapor monitoring results demonstrated a downward trend (with minor seasonal fl uctuations) in VOC concentrations at the CSS and VSA monitoring subsystem locations. Th e VOC concentrations appear to follow the trend of the soil temperature. Th e VOC concentrations are attributed to the remnant soil vapor plume around the CWL, and are consistent with the conceptual model of the CWL residual soil vapor plume (SNL 2004). Th e VOC concentrations are not attributed to the material in the CAMU containment cell. VZMS monitoring results are compiled and reported
2010 Annual Site Environmental Report3-8
on an annual basis; the most recent report was submitted in September 2010 (SNL 2010a). Th e annual VZMS monitoring reports are submitted to NMED as required by the CAMU permit (EPA also receives a copy).
Groundwater Management UnitsIn 2010, SNL/NM ER personnel performed groundwater monitoring at CWL, Mixed Waste Landfi ll (MWL), Burn Site Groundwater (BSG), Tijeras Arroyo Groundwater (TAG), and TA-V. SNL/NM personnel will continue groundwater monitoring as a part of Corrective Measures Implementation (CMI) and Long-Term Stewardship (LTS). Th e Corrective Measures Evaluation (CME) report for TA-V was submitted to NMED in July 2005 and Notices of Disapproval were received from NMED in July 2008, August 2009, and December 2009. Th e CME report for TAG was submitted in September 2005, but no comments have been received from NMED. After regulatory selection and public review of the preferred remedy, CMI Plans can be prepared for TAG and TA-V. Revised monitoring under the CMI plan for TAG and TA-V cannot begin until NMED reviews and approves the CME reports and CMI plans.
MWLTh e MWL was established in 1959 as a disposal area for radioactive waste and mixed waste (MW) generated at SNL/NM research facilities. Th e landfi ll accepted approximately 100,000 cubic feet (ft3) of low-level waste (LLW) and minor amounts of MW from March 1959 through December 1988. Tritium is the contaminant of primary concern at the MWL. It has been detected in surface and subsurface soils in and around the classifi ed area of the landfi ll. However, there is no indication that tritium or other contaminants have migrated to groundwater, which is approximately 500 ft bgs at the MWL. Tritium is released from MWL soils to the atmosphere at low levels, which do not pose a threat to human health or the environment.
Th e monitoring network at the MWL consists of seven wells. In 2010, MWL groundwater samples were collected in January, April, and July. Analytical results for MWL groundwater monitoring are summarized in SNL/NM’s CY 2010 Annual Groundwater Monitoring Report (Appendix B).
On October 11, 2001, NMED directed DOE and Sandia to conduct a CMS for the MWL. Th e MWL CMS Report (SNL 2003b) was submitted to NMED on May 21, 2003 and identifi ed, developed, screened, and evaluated corrective measures alternatives and recommended the preferred fi nal remedy for the MWL. Based upon detailed evaluation and risk assessment using EPA and NMED guidance, DOE and Sandia recommended a vegetative soil cover (i.e., evapotranspirative cover) with institutional controls (IC) as the preferred remedy for the MWL. ICs included long-term monitoring, maintenance, and land use restrictions.
As part of the NMED review and approval process for the CMS Report, a public comment period was established and public hearings were held on December 2-3 and 8-9, 2004. On May 26, 2005, the Secretary of NMED selected a vegetative soil cover with a bio-intrusion barrier as the remedy for the MWL, based upon the information in the administrative record and the hearing offi cer’s report. Th e decision of the Secretary of NMED was documented in the NMED Final Order for the MWL (Final Order) (NMED 2005) that was incorporated into the Sandia Permit through a draft Class III modifi cation issued by NMED. Th e Final Order also required two additional plans be submitted to NMED: a CMI Plan within 180 days of issuance of the Final Order, and a Long-Term Monitoring and Maintenance Plan (LTMMP) within 180 days following NMED approval of the CMI Report documenting installation of the remedy.
On November 9, 2005, DOE and Sandia submitted the MWL CMI Plan to NMED documenting the specifi cations and requirements for construction of the selected remedy (SNL 2005). Th e CMI Plan contains a description of the selected remedy, the objectives for the remedy, detailed engineering design

Environmental Programs Informa on 3-9
drawings, cover performance modeling, construction specifi cations, a construction quality assurance plan, and a health and safety plan. Th e CMI Plan also included the results of a comprehensive fate and transport model that was used to assess the performance of the MWL and develop monitoring triggers (i.e., constituent-specifi c concentrations by media) for future monitoring under the LTMMP. Th e MWL CMI Plan was conditionally approved by the NMED in December 2008 (Bearzi 2008) after resolution of two NMED Notice of Disapprovals (NOD) that requested additional information regarding landfi ll construction plans and performance modeling, and required more extensive and conservative monitoring trigger levels. DOE and Sandia responses to the MWL NODs were submitted to NMED in December 2006 (Wagner 2006), January 2007 (Wagner 2007), and November 2008 (Davis 2008). All conditions related to construction of the MWL evapotranspirative (ET) Cover were addressed and incorporated into the CMI Plan through replacement pages (Davis 2009).
Deployment of the MWL ET cover with a bio-intrusion layer was conducted in two main phases. During the fi rst phase in 2006, MWL Borrow Pit and Subgrade construction activities were performed in preparation for cover construction. Soil fi ll material was excavated, mechanically screened to 2-inch minus, and stockpiled at the MWL Borrow Pit from June through July 2006. Following NMED approval in September 2006, Subgrade construction was performed from October through December 2006, and protective measures were installed on the completed Subgrade surface in April 2007. After NMED conditional approval of the CMI Plan in December 2008, the MWL evapotranspirative cover with a bio-intrusion layer was constructed during the second phase, which took place from May through September 2009. Th e CMI Report documenting installation of the remedy was submitted to NMED in January 2010 and NMED held a public meeting on the CMI Report on December 14, 2010. Th e NMED public comment period for the CMI Report was held from November 29, 2010 through February 28, 2011, which included a 30-day extension to the original public comment period. Final NMED approval is pending.
In September 2007 at the request of NMED, DOE and Sandia submitted the MWL LTMMP in advance of the required submittal date in the Final Order. NMED posted the LTMMP (SNL 2007a) on their web site and solicited public comments, but did not initiate a formal public comment period or provide DOE and Sandia with written comments or an NOD. At the December 14, 2010 MWL CMI Report public meeting, NMED indicated that DOE and Sandia will be instructed to withdraw the September 2007 LTMMP and submit a revised LTMMP within 180 days when the NMED CMI Report is approved. Th e 2007 LTMMP will be revised to include the updated groundwater monitoring well network (four new monitoring wells were installed in 2008), the specifi cations of the 2009 evapotranspirative cover (installed in 2009), and fi nal monitoring and trigger level requirements defi ned in the fi nal NOD response (Davis 2008).
3.3 Long Term Environmental Stewardship (LTES) Ac vi es
Th e SNL/NM LTES involves stewardship for past, present, and future activities at SNL/NM. Th e LTES program’s purpose is to “promote the long-term stewardship of a site’s natural and cultural resources throughout its operational, closure, and post-closure life cycle” (DOE/SNL 2006). Th e environmental programs mentioned in this document support that stewardship.
LTS of legacy sites is one component of the LTES program. Stewardship of legacy sites is defi ned as “activities necessary to maintain long-term protection of human health, the environment, and natural and cultural resources from hazards associated with residual radioactive and hazardous contamination at former ER sites.” Sandia’s LTS activities are increasing as remedial activities at ER sites are completed. Th e LTS Program conducts compliance oversight activities, including long-term monitoring to meet

2010 Annual Site Environmental Report3-10
NMED requirements, conducts institutional control activities, and outreach activities to keep the public apprised of stewardship of legacy sites.
Compliance Oversight ActivitiesSixty groundwater monitoring wells associated with former ER sites are monitored to meet NMED requirements. An additional 16 wells are sampled to assess SNL/NM operations impacts on groundwater. Water level measurements were obtained from 78 wells. Water quality data and water levels are reported in detail in SNL/NM’s CY 2010 Annual Groundwater Monitoring Report (Appendix B). Monitoring wells are maintained or replaced as necessary. Th e LTS Program also conducts the long-term monitoring of the CAMU. Leachate is pumped weekly, and is periodically sampled and disposed of as hazardous waste. Additional information on activities conducted including sampling results can be found in the CAMU VZMS Annual Monitoring Results Report (SNL 2010a). A comprehensive information management system is used to manage legally defensible monitoring data for current and past activities to ensure protection of human health and the environment.
I C ActivitiesFormer ER sites that have not been cleaned up to residential risk standards are periodically inspected and maintained when necessary. An IC tracking system has been created to help manage site IC information. A total of 29 IC site inspections were completed in 2010.
Community Liaison and Stakeholder Involvement ActivitiesIt is important that the public be made aware of the work being conducted to maintain long-term protection of human health, the environment, and natural and cultural resources from hazards associated with residual radioactive and hazardous contamination at former ER sites. Semi-annual newsletters and an Annual Site Environmental Report (ASER) summary pamphlet are published and distributed to the public. In addition, a LTES website was created for public access. It contains key environmental regulatory decision documents for former ER sites and a map with site locations. Th e LTES website is updated as new regulatory documents are submitted by DOE/NNSA/SSO and Sandia to the NMED. Stakeholders participate in semi-annual DOE, Department of Defense (DoD) meetings on environmental activities. Th e LTES/LTS Program has updated the Community Checklist, which was compiled by Sandia’s Members of the Workforce and community members who have an interest in LTES/LTS at SNL/NM. Th e Community Checklist contains the community members’ questions about LTES/LTS and is posted to the LTES website. Th e Community Checklist is updated annually with new concerns or questions from the community. Please visit the LTES website for more information:
http://elm.sandia.gov
Click on “Legacy” for information about LTS sites.
3.4 Waste Management
Sandia follows the Waste Management hierarchy dictated in the Pollution Prevention Act of 1990 and reinforced in amendments to the RCRA. SNL/NM’s P2 and Waste Management Programs make every attempt to reduce, reuse, or recycle waste, as appropriate, before any treatment or disposal.
Waste at SNL/NM is received and processed at several facilities: the HWMF, the Th ermal Treatment Facility (TTF), the RMWMF, fi ve Manzano Storage Bunkers (MSB), the Auxiliary Hot Cell Facility (AHCF), and the Solid Waste Transfer Facility (SWTF). Th e primary waste types handled by these waste management facilities are described below (sections 3.4.1 through 3.4.4). Section 3.4.5 describes P2 support and activities at SNL/NM.
Environmental Programs Informa on 3-11
3.4.1 Hazardous and Chemical Waste
Various wastes generated at SNL/NM are packaged, segregated, and stored at the HWMF; these include hazardous wastes, chemical wastes, such as industrial solid waste and special wastes, and TSCA wastes. All wastes are tracked from the point of generation to fi nal disposal through meticulous “cradle to grave” documentation at each waste handling step. Each waste item received at the HWMF is labeled with a unique bar code, linking the item to the original disposal request. An individually coded waste item typically is a bottle, plastic bag, or other small item that contains chemicals or other waste.
All waste is reviewed at the HWMF before being placed in temporary storage. After suffi cient quantities of items have accumulated in the storage bays, the items are packed into larger containers suitable for shipment, which are also bar-coded. Th ese containers are moved to an adjacent building to await shipment to a permitted Treatment, Storage, and Disposal Facility (TSDF), landfi ll, or recycling facility, as appropriate. Waste is usually processed and shipped off -site within 90 days of receipt.
Applicable regulations for hazardous and chemical waste handled by the HWMF are listed in Chapter 8.
2010 Activities at the HWMF Th e HWMF began CY 2010 with 3,510 package items in storage from CY 2009. An additional 7,856 package items were received during 2010, for a total of 11,366 package items handled at the HWMF. Of these, 9,350 package items were shipped off -site; 7,951 items as waste for disposal and 1,399 items for recycle. At the end of 2010, 2,016 package items remained in storage at the HWMF.
Specifi c waste categories handled and shipped in 2010 are summarized in Table 3-2. Wastes recycled in 2010 are summarized in Table 3-3.
Hazardous and Chemical Waste MinimizationIn accordance with the requirements of Module IV, Section B.1 of Permit NM5890110518-1, Sandia annually certifi es that there is a “program in place to reduce the volume and toxicity of hazardous waste generated by the facility’s operation to the degree determined by the Permittee to be economically practicable” at SNL/NM. Waste minimization eff orts promoted throughout SNL/NM are investigated and implemented by line organizations with the support and technical assistance of the P2 Program. Th ese eff orts are not limited to hazardous wastes.
Hazardous and Chemical RecyclingSandia recycles many categories of hazardous and chemical waste, where feasible. RCRA recycled waste includes various batteries, silver compounds, mercury compounds, lamps, capacitors, and toxic metals. Miscellaneous categories of non-regulated wastes are also recycled through the HWMF. Th ese include alkaline batteries, fl uorescent lamps, oils, non-polychlorinated biphenyl (PCB) containing ballasts, and lead. Waste recycled at SNL/NM in 2010 is summarized in Table 3-3.
Asbestos Waste HandlingTh e abatement of asbestos-containing equipment and building materials is ongoing. Removal of asbestos material is only done if the material is an inhalation hazard, or if the building is slated to be torn down or renovated. Typical asbestos-containing building materials are contained in fl oors, ceilings, roofi ng tile, certain types of insulation, and other fi re-retardant construction materials. Typical asbestos waste generated from equipment abatement consists of fume hoods, ovens, and cable insulation. Asbestos wastes are managed according to the New Mexico requirements for regulated asbestos waste. Table 3-2 summarizes the quantities of asbestos waste generated and shipped in 2010.

2010 Annual Site Environmental Report3-12
In instances where laboratory equipment has asbestos-containing material in a non-friable form (which poses no inhalation risk), these items are allowed to remain in service or are redistributed through the property reapplication program.
Polychlorinated Biphenyl (PCB) HandlingPCBs are a class of organic chemicals that were widely used in industrial applications due to their practical, physical and chemical properties. Use of PCBs included dielectric fl uids (used in transformers, capacitors, etc.), hydraulic fl uids, and other applications requiring stable, fi re retardant materials. Th e domestic production and distribution of PCBs was banned in 1979, and their use continues to be phased out. PCB waste is managed at the HWMF in accordance with TSCA requirements.
Sandia has identifi ed and replaced most PCBs and PCB-containing equipment. Previously, the largest quantity of regulated PCB-containing equipment in use at SNL/NM was capacitors contained inside fl uorescent light ballasts manufactured before July 2, 1979. Th ese have been almost completely eliminated due to an aggressive fl uorescent lighting fi xture retrofi t program instituted in 1998. Th is program has removed all known PCB-containing ballasts running T12 lamps, replacing them with
TABLE 3-2. Waste Shipped by SNL/NM Waste Management Facili es During Calendar Year 2010
Waste Categories 2010 Waste Shipped
Radioactive Waste (kg) (lbs) Low-Level Waste 11,584 25,538 Transuranic Waste 614 1,354
Subtotal Waste Shipped 12,198 26,892 Mixed Radioactive/Hazardous Waste (kg) (lbs) Mixed Low-Level Waste 3,585 7,904 Mixed Low-Level Waste Treated On Site (includes wastes that were rendered non-hazardous through treatment)
3,520 7,760
Mixed Transuranic Waste 111 245 Subtotal Waste Shipped 3,696 8,149
Resource Conservation and Recovery Act (RCRA) (kg) (lbs) Hazardous Waste 51,181 112,598 Hazardous (Explosive) Waste Treated On-Site 174 383
Subtotal Waste Shipped 51,181 112,598 Toxic Substances Control Act (TSCA) (kg) (lbs) Polychlorinated Biphenyls (PCBs) 132 290 PCBs and hazardous waste mixture 80 176
Subtotal Waste Shipped 212 466 Other Regulated Wastes (kg) (lbs) Infectious Waste 391 861 Asbestos 300,308 660,677 Chemical Waste (includes Special Waste and Industrial Solid Waste)
242,826 534,217
Used Oil (not recycled) 346 762 Subtotal Waste Shipped 543,871 1,196,517
Commercial Solid Waste (kg) (lbs) Solid Waste Transfer Facility Dry Waste 797,840 1,758,918 Offsite Office Waste (Sandia Science & Technology Park) 49,230 108,532 Cafeteria Wet Waste 31,950 70,437
Subtotal Waste Shipped 879,020 1,937,887 2010 Total Waste Shipped 1,490,178 3,282,509
NOTES: All wastes shipped off site for treatment and/or disposal unless noted otherwise. Wastes that are treated on site and shipped off site are included in the quantities of wastes shipped off-site. kg = kilograms lbs = pounds SNL/NM = Sandia National Laboratories, New Mexico
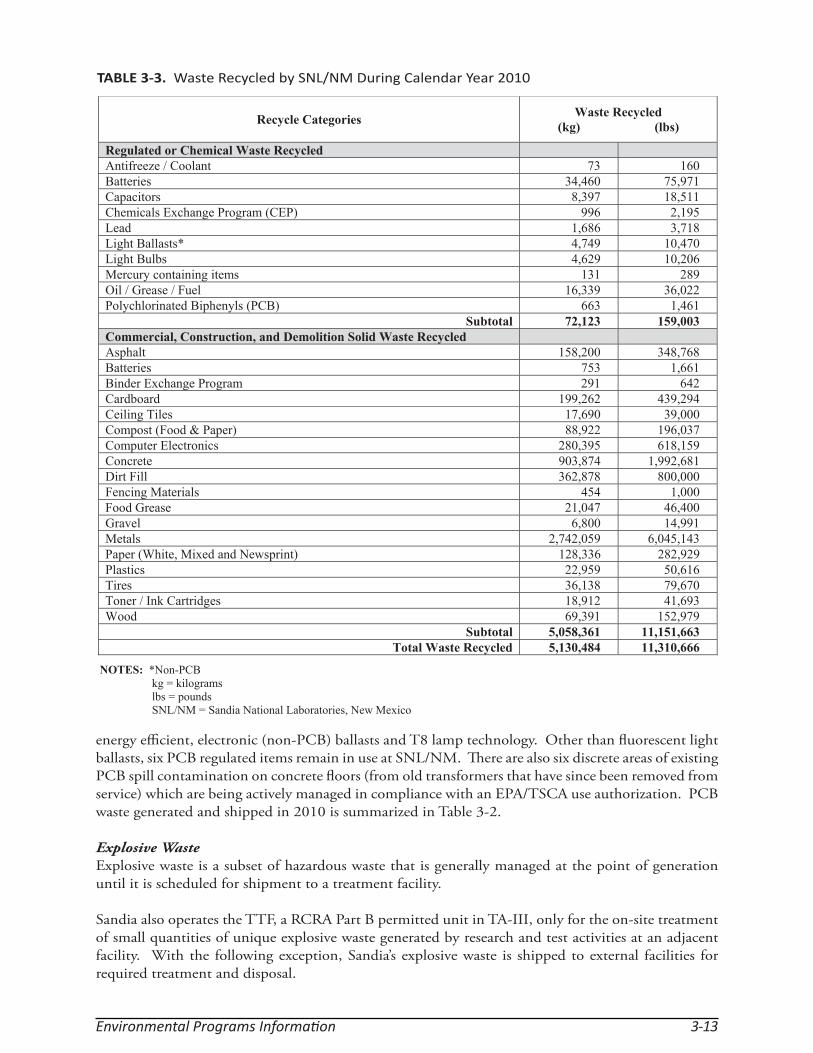
Environmental Programs Informa on 3-13
energy effi cient, electronic (non-PCB) ballasts and T8 lamp technology. Other than fl uorescent light ballasts, six PCB regulated items remain in use at SNL/NM. Th ere are also six discrete areas of existing PCB spill contamination on concrete fl oors (from old transformers that have since been removed from service) which are being actively managed in compliance with an EPA/TSCA use authorization. PCB waste generated and shipped in 2010 is summarized in Table 3-2.
Explosive WasteExplosive waste is a subset of hazardous waste that is generally managed at the point of generation until it is scheduled for shipment to a treatment facility.
Sandia also operates the TTF, a RCRA Part B permitted unit in TA-III, only for the on-site treatment of small quantities of unique explosive waste generated by research and test activities at an adjacent facility. With the following exception, Sandia’s explosive waste is shipped to external facilities for required treatment and disposal.
TABLE 3-3. Waste Recycled by SNL/NM During Calendar Year 2010
Recycle Categories Waste Recycled (kg) (lbs)
Regulated or Chemical Waste Recycled Antifreeze / Coolant 73 160 Batteries 34,460 75,971 Capacitors 8,397 18,511 Chemicals Exchange Program (CEP) 996 2,195 Lead 1,686 3,718 Light Ballasts* 4,749 10,470 Light Bulbs 4,629 10,206 Mercury containing items 131 289 Oil / Grease / Fuel 16,339 36,022 Polychlorinated Biphenyls (PCB) 663 1,461
Subtotal 72,123 159,003 Commercial, Construction, and Demolition Solid Waste Recycled Asphalt 158,200 348,768 Batteries 753 1,661 Binder Exchange Program 291 642 Cardboard 199,262 439,294 Ceiling Tiles 17,690 39,000 Compost (Food & Paper) 88,922 196,037 Computer Electronics 280,395 618,159 Concrete 903,874 1,992,681 Dirt Fill 362,878 800,000 Fencing Materials 454 1,000 Food Grease 21,047 46,400 Gravel 6,800 14,991 Metals 2,742,059 6,045,143 Paper (White, Mixed and Newsprint) 128,336 282,929 Plastics 22,959 50,616 Tires 36,138 79,670 Toner / Ink Cartridges 18,912 41,693 Wood 69,391 152,979
Subtotal 5,058,361 11,151,663 Total Waste Recycled 5,130,484 11,310,666
NOTES: *Non-PCB kg = kilograms
lbs = pounds SNL/NM = Sandia National Laboratories, New Mexico

2010 Annual Site Environmental Report3-14
3. 4.2 Radioac ve Waste and Mixed Waste
Th e RMWMF, AHCF, and MSB are used to manage LLW, MW, transuranic (TRU) waste, and mixed TRU (MTRU) waste. Th e waste processing functions at the RMWMF include waste characterization, segregation, treatment, packaging, storage, and shipment to permitted off -site facilities. Wastes are stored at the MSB.
No high-level radioactive waste (HLW) is generated at SNL/NM. Although Sandia operates several nuclear reactors, no spent fuel has ever been produced since the original fuel rods are still viable. Furthermore, because SNL/NM is not a power producing utility, any spent fuel that would eventually be removed from the research reactors would not be classifi ed as HLW.
All LLW, TRU, MTRU, and MW generators must contact the Radioactive Waste Program to obtain prior approval before generating waste; this allows development of a pathway for waste treatment and disposal before the waste is generated. Th e LLW and MW managed at the RMWMF are generated through a variety of processes. During 2010, both LLW and MW consisted of legacy wastes (wastes originally generated between 1990 and 1998), newly generated wastes from production processes, wastes from ER activities, and wastes generated during waste management activities at the RMWMF. MW also included wastes that had been treated at the RMWMF. TRU and MTRU wastes consisted of legacy wastes.
Applicable requirements for LLW and MW management are listed in Chapter 8. Normally, radioactive waste is shipped off -site within a one-year time frame. Th is is similar to the requirements for hazardous waste and MW. Some LLW may remain on-site longer than one year. Generally, this is to achieve full utilization of transport vehicles by ensuring that vehicles are full prior to leaving the site.
LLW is primarily contaminated with isotopes of strontium, plutonium, cobalt, americium, thorium, cesium, tritium, and uranium (plutonium and americium in LLW are below the activity level designated for TRU waste). Sandia’s LLW inventory generally consists of laboratory waste, Decontamination and Demolition (D&D) debris, and personnel protection equipment (PPE).
TRU waste may derive from sealed instrument sources, D&D waste, PPE, and laboratory waste. Th e radioactive component in TRU is generally americium, plutonium, neptunium, and curium.
MW and MTRU generally consist of the radioactive component (LLW or TRU waste) with the addition of one or more RCRA-hazardous components such as metals or solvents.
2010 Activities at the RMWMF and MSBIn 2010, all four types of waste (LLW, MW, TRU, and MTRU) were stored at fi ve of the seven MSB. Th e remaining two MSB were used for storage of LLW and TRU.
Activities at the RMWMF consisted of processing mixed low-level waste (MLLW) and LLW through storage, repackaging, and on-site treatment, including chemical deactivation (including neutralization), stabilization and solidifi cation, macro-encapsulation, and physical treatment (volume reduction). Some of the treated MLLW was rendered non-hazardous. Treated wastes were stored at the RMWMF or MSB awaiting shipment to permitted off -site facilities for further treatment (if needed) and/or disposal.
TRU wastes were repackaged at the AHCF. TRU and MTRU wastes were repackaged at the RMWMF. TRU and MTRU wastes were shipped off -site to the Advanced Mixed Waste Treatment Project (AMWTP) in Idaho for certifi cation. Th e wastes will then be shipped to the Waste Isolation Pilot Plant for fi nal disposal.

Environmental Programs Informa on 3-15
FIGURE 3-1. Six Year Summary of Total Radioac ve Waste Shipped at SNL/NM
1150000
100000
MTRU
TRU
50000
TRU
MW
LLWShipp
ed (k
g)
02005 2006 2007 2008 2009 2010
Th e quantities of LLW, MLLW, TRU, and MTRU are shown in Table 3-2. A six-year summary of radioactive waste shipped from SNL/NM is shown in Figure 3-1.
3.4.3 Mixed Waste Regulatory Status
As discussed in Section 2.1.4, Sandia manages MW that is subject to the Federal Facilities Compliance Order (FFCO) (NMED 2004). Th e requirements include:
• Deadlines for processing and/or disposing of various types of waste as specifi ed in the Site Treatment Plan (STP), and
• Providing an annual update of activities and the current inventory of stored waste still on-site.
During 2010, DOE/NNSA/SSO and Sandia requested NMED approval for a revision to the STP to establish new deadlines for most categories of mixed waste (treatability groups TG-1 through TG-27) and extend the compliance deadline for TG MTRU. NMED, DOE/NNSA/SSO, and Sandia agreed to an extension of the compliance deadline for TG MTRU as specifi ed in Amendment No. 5 to the FFCO. DOE/NNSA/SSO and Sandia met all deadlines; the compliance history regarding MW and the FFCO is shown in Chapter 8, Table 8-3.
MW TreatmentChapter 8, Table 8-4 lists the MW categories in eff ect during 2010 (TG-1 to TG-27 and TG MTRU) with the preferred treatment options and the status for each category. Five of the treatment technologies listed in Table 8-4 are performed on-site at the RMWMF as described in the current RCRA Part B permit request (most recently updated in November 2010) and in the draft permit issued by NMED in August 2007.
MW Inventory in 2010 At the end of 2010, the majority of MW stored on-site consisted of inorganic debris and radioactive metallic objects with hazardous waste constituents and wastes that have been treated to meet hazardous waste treatment standards.

2010 Annual Site Environmental Report3-16
3.4.4 Solid Waste
Th e primary function of the SWTF is to collect, process, and ship for disposal solid waste from SNL/NM in compliance with all applicable regulations. It does not accept hazardous, radioactive, residential, or food service wastes.
SWTF OperationsProcessing solid waste at the SWTF consists of screening 100 percent of the waste for prohibited materials, which are removed if identifi ed. Th e waste is further screened when it is placed on a conveyor that passes under a radiation detection system. If radiation is detected above background levels, the conveyor is automatically shut down and the source is investigated. Note that screening 100 percent of the solid waste is not a requirement of any regulations, and is a good faith eff ort to prevent prohibited materials from inadvertently ending up in the landfi ll. Th e conveyor then feeds the waste into a baler where it is compressed into desk-sized bales. Th e bales are weighed, individually tracked, and loaded into a trailer for transport to a local landfi ll. Th e SWTF also processes and ships solid waste delivered from Kirtland Air Force Base (KAFB) and DOE/NNSA. Solid waste generated in 2010 by SNL/NM is summarized in Table 3-2.
RecyclablesTh e secondary function of the SWTF is to collect, process (screen, bale, and track), market, and ship the following recyclable materials from SNL/NM: cardboard, white paper, mixed paper, aluminum cans, scrap metals, printer consumables, and plastics. Proceeds from the sale of recyclable materials are used to reinvest in the recycling program. Th e SWTF also provides some recycling support for KAFB (on a cost-reimbursable basis) and DOE/NNSA Service Center and SSO.
In support of small SNL/NM construction and demolition projects, the Construction and Demolition (C&D) Recycle Center at the SWTF accepts small quantities of C&D waste (managed separately from the solid waste), as long as the contractor brings recyclables. Th e C&D Recycle Center provides contractors roll-off s and hoppers to recycle cardboard, wood, plastics, and various scrap metals. Materials recycled in 2010 are summarized in Table 3-3.
3.4.5 P2 Program
Program ScopeTh e P2 Program provides guidance and technical support to reduce waste generation and resource consumption and to help improve the overall effi ciency of processes and organizations within SNL/NM. To achieve continuous improvement, the program annually sets targets and activities for recycling, waste reduction, sustainable acquisition (SA), and reduction of environmental releases. Th e P2 Program is directed and guided by federal requirements, including DOE directives.
Th e P2 Program partners with numerous organizations at SNL/NM, including ES&H, Facilities Engineering and Procurement. P2 Program staff researches waste reduction technologies and strategies applicable to SNL/NM work processes, seeks avenues to reuse and recycle waste streams currently landfi lled or incinerated, and assists with cost-eff ective implementation for new waste reduction or recycling initiatives.
Awareness and OutreachTh e P2 staff conducts awareness programs and outreach activities that promote and teach P2 strategies and technologies to waste generators. P2 staff also submit nominations for federal (DOE and EPA) and other award programs. Internal articles and notices are regularly created that showcase P2 activities

Environmental Programs Informa on 3-17
and awards to Sandia for its P2 accomplishments. P2 information and its successes can be found at the following website:
http://p2.sandia.gov
Th e P2 Program supports two large awareness events each year: Earth Day and Earth, Wind, and Sun. Sandia’s Earth Day event was held in April 2010 in conjunction with Take Your Daughters and Sons to Work Day. A booth was hosted showcasing everyday materials people can recycle, and used a matching game to encourage visitors to learn what their recycled materials can be made into as new products. Th e P2 booth was placed next to the catering and outdoor dining area to allow P2 staff to support the fi rst ever “Zero Waste Event” in which composting was presented as an option besides normal bottle and can recycling. Th e catering service was provided with compostable plates and utensils for this event.
Sandia’s Earth, Wind and Sun event was held in August 2010 and was combined with the annual Safety Fair to make the Safe, Secure and Sustainable (S3) Fair. P2 hosted a booth showcasing how visitors can fi nd reuse and recycling opportunities in their home communities, signing up Members of the Workforce to initiate recycling of their used alkaline batteries from their offi ce and laboratory areas, and presented a poster to raise awareness about a new power management feature soon to be implemented on most computers.
P2 staff routinely give presentations at conferences, professional society meetings, and other organized events to disseminate and share Sandia-specifi c P2 knowledge and experience. In 2010, P2 staff gave the following presentations:
• “Preparing for Zero Waste” at the 1st Annual GreenGov Symposium (October);
• “Recycling Packing Foam at SNL/NM” for the DOE Sustainability Assistance Network Monthly Conference Call (June);
• “Reinvesting Recycling Revenues for Remarkable Results” for the DOE Sustainability Assistance Network Monthly Conference Call (June) as well as the New Mexico Recycling Coalition biannual conference (June);
• “Striving for Zero Waste” at the New Mexico Recycling Coalition biannual conference (June);
• “P2 Striving for Environmental Sustainability” for the DOE Public Meeting, October; and
• “Update on SNL/NM’s Ceiling Tile Recycling Eff orts” for the DOE Sustainability Assistance Network Monthly Conference Call (November).
P2 AwardsTh e P2 group received two awards in 2010 on behalf of outstanding group eff orts made in 2009:
• EPA Waste Wise Gold Achievement Award. Industrial Materials Waste Reduction category. “Diverting Concrete and Asphalt Debris from the Landfi ll For Recycling and On-site Use.”
• DOE Environmental Sustainability (EStar) Award. Electronics Stewardship category. “EPEAT Gold by Default” (recognizing that the highest standard of environmentally preferable computing equipment was being purchased as part of normal business practice).

2010 Annual Site Environmental Report3-18
3.4.5.1 Sustainable Acquisi on (SA) Program
Th rough the SA Program, P2 works to integrate products with reduced environmental impact into purchase agreements and ongoing operations and maintenance across SNL/NM. Products with high recycled content percentages, renewable biobased source materials, and those that have been labeled by widely recognized environmental certifi cation systems are all part of the Sandia approach to sustainable acquisition. Th ese types of products reduce demand for virgin materials, while increasing demand on recycled markets; reduce material sent to landfi lls; use less energy for harvesting, transport, and conversion of raw materials; rely less on petroleum ingredients; and require less energy and water resource use in manufacturing. By seeking out suppliers who share these goals and communicating with Sandia procurement, purchasers, and end users, Sandia is helping to pull many markets toward products that are better for human health and the environment.
P2 works continuously to write green purchasing requirements into all applicable contracts at Sandia. Construction specifi cations are another means of calling out green products and P2 works with Facilities groups to put in item specifi c language. Th e ultimate goal is to provide products with sustainable alternatives as a fi rst choice to Sandia by contractual obligation. Increasingly, sustainable acquisition is being addressed as early as the Request for Quotation (RFQ) so that Sandia knows a company’s environmental stance from the beginning, and becomes a component in the contract awarding process.
Sustainable acquisition was incorporated into the automotive, offi ce, janitorial, carpet, and furniture supply chains at Sandia in 2010. Information technology products are also purchased with specifi c requirements for environmentally preferred attributes including those qualifi ed by Electronic Product Environmental Assessment Tool (EPEAT) and Energy Star, or printers that are duplex capable and toner products that are remanufactured in a closed loop system of purchase and return. Th e list continues to grow as more green products become available on the market and are proven eff ective by pilot testing among various organizations at Sandia.
For over 50 product types in eight categories cited by the EPA’s Comprehensive Procurement Guidelines (CPG), P2 collects quarterly purchase data to tabulate site progress with sustainable acquisition. Th e CPGs are designed as guidance for federal agencies and their facilities to use, in acquiring products with recycled content. Data provided by Sandia suppliers is categorized and summarized then provided to the DOE for inclusion in DOE-wide statistics. During 2010, Sandia procured recycled content products for 43 percent of the purchases (by dollar) made in applicable categories, nearing fi ve million dollars. CPG information can be found at the following website:
http://www.epa.gov/epawaste/conserve/tools/cpg/index.htm
P2 will continue to work on biobased product implementation, including products used at Fleet Services, Facilities maintenance, and in offi ces across Sandia into 2012 and beyond. As more experience is gained with green products, lessons learned are shared with other DOE sites, as well as other agencies interested in making their procurement more sustainable.
3.4.5.2 Waste Reduc on
In March of 2010, P2 established a six-month contract with a local composting company to divert food waste from the Th underbird Café, Building 861, which serves up to 1,000 customers per day. Food preparation areas in the kitchen were provided with compost bins, and the dish return and washing position was set up to scrap plates of leftovers into a compost bin. All eff orts were behind the scenes, and transparent to customers. During this time, the Th underbird Café diverted 15,000 lbs of food waste, approximately 34 percent of its total waste. Eff orts were made to correct for contamination
Environmental Programs Informa on 3-19
issues, such as testing out compostable products. Due to the success of the six month pilot, a new annual contract was reestablished with the local composting company. In 2011, it is anticipated that composting will be expanded into customer areas, and to the satellite café in TA-IV that serves up to 300 people per day.
During the pilot period of the composting contract, P2 sponsored the fi rst Zero Waste Event on Earth Day at the “Take Your Daughters and Sons to Work Day”. P2 worked with the contract composting company and the catering vendor to set up full recycling and composting support at the outdoor barbeque grill and dining area on Hardin Field. While some trash did result, even some as contamination in the compost bins, it was still a great outreach and educational event as workers brought their families to Sandia.
In other waste reduction eff orts, P2’s analysis of disposal quantities and costs of fi ve regulated wastes, completed and presented in the last quarter of 2010, resulted in recommendations for the HWMF to consider recycle pathways, or to possibly fi nd more effi cient ways of managing the materials. Th e ensuing discussion revealed more information on the HWMF’s and end-vendors’ processes, and some specifi c materials were identifi ed for diversion or improved handling, such as ethylene/propylene glycols and rechargeable batteries. One success was to fi nd out that soil contaminated with petroleum products is already going to an in-state permitted facility operating a soil remediation farm. Sandia continues to work on reducing and/or diverting from landfi lls the quantities of waste generated.
3.4.5.3 Electronics Stewardship
Electronics Stewardship covers the lifecycle impacts of information technology equipment and is an area of expanding interest in the DOE and federal government as a whole. Th e impacts of electronics use are many but include a signifi cant portion of an organization’s energy use, toxics contributed to the waste stream, and the opportunity for “e-cycling” or capture of the high value materials for use in new equipment. Electronics life cycle management is divided into three stages: purchase, operations, and end of life management. Each of these stages has specifi c impacts; the purpose of Sandia electronics stewardship eff orts is to address these individually. Th e SNL/NM P2 group is tasked with monitoring and facilitating improvements to Sandia performance at all three of these stages.
Sandia is a continuing partner in the Federal Electronics Challenge (FEC) Program. Th e FEC promotes a comprehensive approach to reducing the environmental impacts of electronics assets ownership. One part of that approach is use of the EPEAT in the purchase of electronic equipment. By integrating EPEAT into the Preferred Systems qualifi cations, Sandia has achieved exceptional compliance in recent years. In 2010, 95 percent of SNL/NM purchases of tower, laptops, and monitors were EPEAT Silver compliant, and for the next higher level of environmental attributes, over 80 percent of applicable Information Technology (IT) purchases were EPEAT Gold compliant. Th ese numbers indicate computing equipment that is more recyclable, uses less toxins in production, and is more energy effi cient.
Operations are currently an aspect of electronics stewardship that has a lot to do with people. All EPEAT certifi ed equipment is Energy Star compliant but it is up to each user to take advantage of energy saving features. In 2010, Sandia purchased a comprehensive power management software suite that allows for precise power management and usage reporting of all networked equipment. Th is removes much of the user dependence from power savings, and brings network down time closer to a lowest power scenario. As of April 2010, the power management software is capturing baseline data on approximately 16,000 Sandia computers. Following the transition to Windows 7, an active power policy will be implemented on nearly all of these systems. Calculations show possible energy savings in the hundreds of thousands of dollars, and the issue of leaving computers on at night for remote access has been resolved.

2010 Annual Site Environmental Report3-20
With the size of the population and movement within SNL/NM, an end of life for computer equipment often means the beginning of life at a new desk. If a unit is not immediately reapplied to another individual it enters the Property Reapplication system. Property Reapplication off ers a select amount of computers for reapplication if they meet the criteria of 2006 purchase date or later. Computer systems not reapplied are palletized and then stored in the P2 tent until suffi cient quantity for a recycling shipment is reached. P2 then coordinates a shipment to an approved electronics recycler that dismantles and segregates the material for distribution back to the manufacturing industry or raw materials market. Th e recycling rate for excess IT equipment (e-scrap) continues to be 100 percent. Considering the nature of Sandia’s work and the associated number of computing systems purchased annually, this practice represents a dramatic reduction of what would otherwise be hazardous waste if not recycled. A total of over 350,000 lbs of e-scrap was recycled by SNL/NM in 2010.
3.4.5.4 Recycling
Sandia accounts for its recycling in two separate categories: routine, which is waste from recurring and/or typical offi ce operations, and non-routine, which is from intermittent clean-up and construction activities. In 2010, 54 percent of Sandia’s routine waste and 33 percent of non-routine waste was recycled. See Table 3-3 for the breakdown of recycling by waste stream.
While the majority of recycling operations are conducted at the SWTF and HWMF, the P2 group manages several other recycling functions. Th is year the major initiatives included continuing to expand mixed paper recycling, standardizing alkaline and carbon-zinc battery recycling, and launching a composting program at the Th underbird Cafe.
Mixed paper recycling increased by 10,000 lbs over 2009 to more than 119,000 lbs in 2010. Volunteers continue to move all of the material out of buildings to distributed yellow dumpsters designated for mixed paper. Th ree new mixed paper dumpsters were deployed in 2010 bringing the total to 33 locations, with six more being purchased with recycling revenue for use in 2011. Th ese dumpsters also became the new distributed drop-off locations for the collection of packing foams. After commissioning a new piece of recycling equipment for packing foams in late 2009, diversion of EPS #6 Styrofoam and low density polyethylene (LDPE) #4 foam has successfully continued throughout 2010. Th e P2 Program did not conduct a crushing event at the Concrete and Asphalt Recycling Area (CARA) in 2010, as suffi cient stock remained from the prior crushing. Th e CARA is an accumulation site for concrete and asphalt rubble generated by Sandia construction-like activities. Th e rubble is periodically crushed to meet specifi c aggregate material requirements, and becomes a valuable commodity for reuse at Sandia for applications such as base course beneath asphalt pavement, paving material for remote dirt roads, and as general surface cover. Projects using crushed aggregate material reimburse the P2 program based on the quantities used, thus providing a fi nancially self-sustaining operation.
Noteworthy applications of crushed aggregate materials during 2010 include resurfacing of several access roads at SNL/NM. Th e Facilities Roads and Grounds Maintenance Department utilized P2’s Conphalt, (a mixture of crushed concrete and asphalt), with approximately 1,400 tons of material applied to resurface an existing graded dirt access road. Additionally, nearly 300 tons of Conphalt was applied to SNL/NM Power Line Road, an unpaved road which receives heavy traffi c. Resurfacing dirt roads using conphalt is a new application at Sandia with numerous environmental benefi ts. Th e conphalt material creates a more stable road surface that reduces fugitive dust emissions, water-based dust suppression requirements, and chemical dust suppression applications. As a result, the overall maintenance cost for conphalt-surfaced roads is reduced and fugitive dust is assuredly reduced.

Environmental Programs Informa on 3-21
As recycled aggregate awareness increases, project customers plan to implement its use into future projects. P2 has been making eff orts to work with Facilities and Roads and Grounds Departments to promote recycled aggregates into future SNL/NM projects. P2 anticipates a crushing event in July 2011 which will increase its stockpile of readily available materials.
Th e diversion and recycle of plastics broadened in 2010. Th rough a process change at the SWTF, the bales of mixed #1 and #2 plastic bottles are now much cleaner. Bales of #2 containers are now a separate stream and kept clean of contamination. SNL/NM’s fi rst bale of shrink wrap #4 LDPE was marketed, and process improvements were put into place for future collection runs. Clear, rigid #5 polypropylene is now segregated into cubic yard boxes and stored in the P2 Tent at Reapplication. Other new miscellaneous plastics are also now staged in the P2 Tent such as acrylonitrile butadiene styrene, and many types of proprietary plastics such as Plexiglas, Tefl on, Delran, and Lexan in large sheets and small chunks. When enough plastics are accumulated, a truckload will be shipped to a plastics recycling broker. One such shipment occurred in March, 2010 and is anticipated to be every 12-18 months in frequency.
In 2010, the P2 Program made further progress in its major focus areas of Waste Reduction, Electronics Stewardship, Sustainable Acquisition, Reuse/Recycling and Awareness programs, with the intent being to institutionalize these environmental sustainability approaches and actions into the daily work activities of Sandia mission-related and support programs. In striving for continuous improvement, the P2 Program has set new targets for 2011. Th e 2011 environmental sustainability targets include further improvements in waste segregation at the point of generation, continued use of on-site crushed recycled aggregates for roadway applications, developing a mercury awareness and reduction program, and standardizing on computer printers, to reduce the quantities of computer printers purchased annually and all of the various consumables required subsequently.
3.5 Biological Control Ac vi es
Th e Biological Control Activity provides customer support related to animal control issues and compiles information on pesticide use at SNL/NM. Animal control support includes providing general information and resolving issues related to removing nuisance animals. Requests for assistance in resolving nuisance animal problems are relayed and documented through Sandia’s Facilities Telecon Department. Th is eff ort may involve interacting, as necessary, with the U.S. Air Force (USAF) and State of New Mexico agencies to resolve animal control issues. Th e Biological Control Activity also involves providing support in addressing animal-borne disease concerns (e.g., Hantavirus) through activities including disinfecting, sanitizing, and cleaning up areas infested with rodents or pigeons.
Pesticide use at SNL/NM includes the use of herbicides for weed control, rodenticides for controlling mice, and insecticides for the control of insects in food service and work areas. Sandia uses EPA-registered pesticides that are applied by certifi ed pest control agencies. Material Safety Data Sheets (MSDS) and product labels for pesticides used at SNL/NM are maintained under the program. Pesticide use (product names and amounts applied) are documented in quarterly reports. Documents related to the program are listed in Chapter 8.
3.6 Na onal Environmental Policy Act (NEPA) Program
Sandia provides DOE/NNSA/SSO with technical assistance in support of compliance with NEPA and the National Historic Preservation Act (NHPA). Th e SNL/NM NEPA Team reviews projects for conformance to existing DOE NEPA documents and determinations. Th e use of the ISMS NEPA Module software facilitates SNL/NM NEPA reviews, citing existing NEPA documentation as

2010 Annual Site Environmental Report3-22
appropriate. Th e ISMS NEPA Module also streamlines DOE/NNSA/SSO’s review and determination of DOE NEPA checklists, when required, and supports quality assurance (QA) by providing a consistent framework that makes NEPA documentation and information readily available. A DOE NEPA checklist, or an Air Force Form 813, is prepared for DOE review and determination, if the proposed action:
• Does not fall within the analysis of an existing SNL/NM NEPA document, or
• Would occur on USAF property (permitted, or requested to be permitted, for SNL/NM use).
• NEPA program documents and regulations are listed in Chapter 8. NEPA reviews that were completed in 2010 are summarized in Table 3-4.
SNL/NM Site-Wide Environmental Impact Statement (SWEIS)During CY 2010, Sandia began preparing for DOE’s development of a new SWEIS. Environmental Programs Department personnel met with representatives from 63 SNL/NM facilities to discuss and compile data on their current and anticipated future operations that could be relevant to their potential impacts on the environment. In addition, personnel compiled an array of environmental information and data including environmental, safety, and health policies and procedures; descriptions of the natural environment at SNL/NM; environmental stewardship programs; overall site operations; and agreements between DOE and other governmental entities. Th is information and data will help DOE in developing environmental analyses for the next SWEIS.
2010 NEPA DocumentationTh e NEPA Team participated in the review of the following environmental documents:
(1) Draft Site-Wide Environmental Impact Statement for the Continued Operation of the Department of Energy/National Nuclear Security Administration Nevada Test Site and Off -Site Locations in the State of Nevada,
TABLE 3-4. Summary Data for SNL/NM NEPA Reviews Submi ed to DOE/NNSA/SSO During Calendar Year 2010
NEPA Reviews Review Breakouts Quantity
Corporate NEPA Software System Reviewed by SNL/NM NEPA Team 306
Reviews Completed by DOE/NNSA/SSO 68 Other Corporate NEPA Reviews Completed by SNL/NM NEPA Team 870 DOE / U.S. Air Force NEPA Documents New Land-Use Permit Reviews 0 Land-Use Permit Renewal Reviews 18 Land-Use Permit Termination Reviews 0 Project-Specific Reviews 4
Environmental Assessments Under AF Activities 0 Subtotal for USAF Reviews Completed 22
Grand Total of all NEPA Reviews 1,266Percentage of Total Reviews Requiring Submittal to DOE Total DOE Reviews (68 + 22 = 90) divided by Total NEPA Reviews (1,266) = 7 %
NOTES: AF = Air Force DOE = U.S. Department of Energy NNSA = National Nuclear Security Administration
NEPA = National Environmental Policy Act SNL/NM = Sandia National Laboratories, New Mexico SSO = Sandia Site Office USAF = United States Air Force % = percent

Environmental Programs Informa on 3-23
(2) Final Environmental Assessment for Removal Actions at the Technical Area III Classifi ed Waste Landfi ll, Sandia National Laboratories/New Mexico (DOE 2010), and
(3) Air Force Battlespace Environment Lab Antenna Farm
Th e NEPA Team reviewed a total of 1,266 proposed projects in the ISMS NEPA Module and other corporate applications. Sixty-eight DOE NEPA checklists were transmitted to the DOE/NNSA/SSO for review and determination in 2010.
Summary data for SNL/NM NEPA reviews performed in 2010 are detailed in Table 3-4.
3.7 Environmental Outreach Program
SNL/NM’s Environmental Outreach Program reaches out to the community via various events, and provides environmental information to members of Sandia’s workforce. Th e Outreach Program supports Sandia’s EMS and LTES Programs. Sandia recognizes that in addition to complying with requirements, it is important to communicate with Sandia’s workforce and the local community to help reduce environmental impacts at work and at home. Sandia has an integrated approach to communicate environmental awareness to its workforce via semi-annual EMS Newsletters, semi-annual LTES newsletters, awareness campaigns, and various outreach events. Sandia collaborates with numerous internal and external organizations such as Sandia’s Energy Management Team, Sandia’s Long-range Development Plan Team, the City of Albuquerque (COA), and the Environmental Education Association of New Mexico (EEANM).
Currently, Sandia participates in or holds several internal and external outreach and awareness events. Events conducted in 2010 include the Safe, Secure, and Sustainable Event, Youth Conference on the Environment; School to World, and the annual EMS Excellence Awards Ceremony. Sandia also coordinates the semi-annual DOE Public Meeting. At these events, the outreach team distributes fact sheets and newsletters; when working with children, the team often demonstrates environmental education models on topics including local air quality, landfi lls, and watershed education. Th e Outreach team also encourages the Members of the Workforce and the community to provide feedback and ask questions about Sandia’s environmental programs.
Th e Annual Youth Conference on the Environment is a free, one-day conference off ered to high school students as a means to educate them on various environmental issues. In 2010, the theme of the conference was reduce, reuse, and recycle and approximately 170 students attended. Th e event was co-sponsored by Sandia, the EEANM, and the COA.
Th e annual EMS Excellence Awards Program recognizes Members of the Workforce who demonstrate environmental excellence in fi ve specifi c categories (energy reduction/water conservation, risk mitigation/environmental protection, environmentally preferable purchasing, waste minimization, and recycling). Since its inception in 2006, the EMS Team has received over 150 nominations from individuals and teams who are contributing to Sandia’s vision of EMS. For additional information, please visit the following websites:
http://elm.sandia.govhttp://environment.sandia.gov/new/index.shtml

2010 Annual Site Environmental Report3-24
Th is page intentionally left blank.

Terrestrial & Ecological Surveillance 4-1
4.1 Terrestrial Surveillance Program
Terrestrial surveillance is conducted at Sandia National Laboratories, New Mexico (SNL/NM) to detect the possible deposition or migration of contaminants to off -site locations and to determine the impact, if any, of SNL/NM’s operations on human health or the environment.
Th e Terrestrial Surveillance Program samples surface soils, arroyo and river sediments, and vegetation from various on-site, perimeter, and off -site locations. Th e samples are used to detect the presence of anomalous radiological and non-radiological constituents.
Various locations have been used for sample collection for one to 20 years. When some of the older sampling locations are no longer relevant to current operations these sampling locations may be relocated and placed in areas with greater potential environmental impact. However, the number of samples collected annually should remain approximately the same as in the past.
4.1.1 Program Objec ves
Th e Terrestrial Surveillance Program is designed to meet the following U.S. Department of Energy (DOE) Order 450.1A, Environmental Protection Program (DOE 2008a) objectives:
• Collect and analyze samples in order to characterize environmental conditions and identify trends,
• Establish baseline (or background) levels of radiological and non-radiological constituents,
• Assess the eff ectiveness of Pollution Prevention (P2) and abatement programs,
• Identify new or existing environmental quality problems and their potential impacts on human health or the environment, and
• Verify compliance with applicable laws and regulations, as well as commitments made in offi cial documents (such as Environmental Impact Statements [EIS], in accordance with the National Environmental Policy Act [NEPA]).
Standards for Comparison No regulatory limits are available to directly compare concentrations of some radiological or non-radiological constituents in surface soils, vegetation, or sediments. SNL/NM personnel conduct statistical analyses to compare the results from on-site and perimeter samples to off -site results, and to establish trends in order to identify possible pollutants and their potential impact on human health or the environment. However, if anomalies are observed, there are various documents used for guidance with risk assessment, such as DOE Order 5400.5, Radiation Protection of the Public and the Environment(DOE 1993).
In addition, sample results for metals in surface soils are compared to U.S. surface soil average concentrations (Kabata-Pendias 2000), local and regional surface soil average concentrations (Dragun and Chekiri 2005), or site-specifi c surface soil concentrations (Dinwiddie 1997). A summary report of metals-in- soils at SNL/NM collected annually between 1993 and 2005 has been prepared and serves as another point of reference (SNL 2006).
Terrestrial and Ecological Surveillance

2010 Annual Site Environmental Report4-2
In summary for 2010, the mean value of non-radiological constituents in soils is less than the residential level set by the State of New Mexico soil screening levels (SSL), with the exception of arsenic. However, the mean value for arsenic is less than the industrial level set by the State of New Mexico SSLs. For an added measure of sample verifi cation, the DOE Oversight Bureau of the New Mexico Environment Department (NMED) splits samples with SNL/NM at several locations.
Statistical AnalysisSamples are generally collected from fi xed locations to eff ectively enable statistical comparisons with results from previous years. Statistical analyses are performed to determine if a specifi c on-site or perimeter location diff ers from off -site values and to identify trends at a specifi c sampling location. Since multiple data points are necessary to provide an accurate view of a system, the Terrestrial Surveillance Program does not rely on the results from any single year’s sampling event to characterize on-site environmental conditions. Results from a single sampling event may vary from year to year due to slight changes in sampling locations, diff erences in climatic conditions, and laboratory variations or errors. Th erefore, as the amount of data increases, the accuracy of the characterization increases.
Th e results of the statistical analyses allow SNL/NM to prioritize sample locations for possible follow-up action. Th e prioritization process is a decision-making tool used to assist in the determination of the appropriate level of concern for each sample result. Th e Statistical Analysis Prioritization Methodology (Shyr, Herrera, and Haaker 1998) is based on two “yes or no” questions resulting in a matrix of four priority levels. Th e matrix is shown in Table 4-1.
In 2000, SNL/NM changed to analytical laboratories with lower detection capabilities for many of the metals. Th e analyses in 2010 utilized data from the same analytical laboratory since 2000.
In some instances, this qualitative inspection of the data is augmented by the graphical evaluation methodology described and documented in the Chemical Analysis of Soil Samples Collected from the Sandia National Laboratories, New Mexico Environs, 1993-2005 (SNL 2006).
Th is enables the visual identifi cation of anomalies in the data that stand out from the data population for the entire site, or just that location. Th is step is performed to ensure that anomalous data that would otherwise pass statistical scrutiny is fl agged for further investigation. Th is is particularly useful where insuffi cient data exists for trending, but comparison of new data to “expected values” is desired.
TABLE 4-1. Decision Matrix for Determining Priority Ac on Levels
Priority Are results higher than off-site?*
Is there an increasing trend?
Priority for further investigation
1 Yes Yes Immediate attention needed. Specific investigation planned and/or notifications made to responsible parties.
2 Yes No Some concern based on the level of contaminant present. Further investigation and/or notifications as necessary.
3 No Yes A minor concern since contaminants present are not higher than off-site averages. Further investigation and/or notifications as necessary.
4 No No No concern. No investigation required.
NOTES: Based on Statistical Analysis Prioritization Methodology (Shyr, Herrera, and Haaker 1998). *Some sites may appear higher than off-site. However, there may not be a statistically significant difference.
Terrestrial & Ecological Surveillance 4-3
4.1.2 Sample Media
Samples of surface soils, arroyo and river sediments and vegetation are collected as part of the Terrestrial Surveillance Program and analyzed for radiological and non-radiological constituents. Soil Soil samples are collected to ascertain the presence or buildup of pollutants that may have been transported by air or water and deposited on the ground surface. Approximately 1,500 grams (g) of sample is collected from the top two inches of soil in accordance with SNL/NM fi eld operating procedures (FOP). In 2010, soil samples were collected from locations indicated in Tables 4-2, 4-3 and 4-4.
Sediment Sediment samples are collected from arroyo beds and from the banks of rivers and creeks to ascertain the presence, or buildup, of pollutants deposited from surface waters. Approximately 1,500 g of sample is collected from the top two inches of soil in accordance with SNL/NM FOPs. Sediment samples were collected from locations listed in Tables 4-2, 4-3 and 4-4. Vegetation Vegetation is sampled to monitor for potential uptake of radioactive pollutants, which could provide an exposure pathway to foraging animals and to humans through the food chain. In actuality, human exposure to contaminants through the food chain is highly unlikely on Kirtland Air Force Base (KAFB) since there is no hunting, livestock, or commercial farming within the boundaries of KAFB. Approximately 500 g of sample is collected, preferably from perennial grass, by cutting back several inches of growth from the plant. If grass is not available, samples from small leafy plants may be collected. In 2010, minimal vegetation was collected due to the on-going drought. At the few locations where vegetation was collected, no noteworthy results were observed.
Gamma Radiation Levels Gamma radiation levels are measured using thermoluminescent dosimeters (TLD) to determine the impact, if any, of SNL/NM’s operations on ambient radiation levels. Th e TLDs are changed out on a quarterly basis and processed at an on-site laboratory. TLDs were collected from locations listed in Tables 4-2, 4-3 and 4-4.
4.1.3 Sampling Loca ons
Occasionally, sampling locations are added or dropped for diff erent reasons, including the start-up of a new facility or operation, closure of an existing facility or operation, additional characterization of areas with elevated concentrations or increasing trends, or other technical or budgetary reasons. Th ese locations are illustrated in Figure 4-1. Locations sampled are shown in Tables 4-2, 4-3 and 4-4.
In some instances, special radiological or non-radiological “sampling campaigns” near operations of interest, as described in Section 4.1.5, may be conducted in addition to, or in partial substitution for fi xed locations.
On-site On-site locations are selected within or near areas of past or current SNL/NM operations (Figure 4-1 and Table 4-2). Sample locations are chosen near sites with known contamination from past operations, or near facilities that have the potential to discharge radiological or non-radiological pollutants to the environment. Other considerations in the selection of sampling locations include local topography

2010 Annual Site Environmental Report4-4
TABLE 4-2. On-Site Terrestrial Surveillance Loca ons and Sample TypesLocation Number Sampling Location Soil Sediment Vegetation TLD
1 †Pennsylvania Ave. X X 2NE* †Mixed Waste Landfill (MWL) (northeast) X X 2NW †MWL (northwest) X X X 2SE †MWL (southeast) X 2SW †MWL (southwest) X 3 †Coyote Canyon Control X X 6 †Technical Area (TA) III (east of water
tower) X X X
7 †Unnamed Arroyo (north of TA-V) X X 20 TA-IV (southwest) (KAFB Skeet Range) X 31 TA-II Guard Gate X 33* †Coyote Springs X X 34 †Lurance Canyon Burn Site X X 35 Chemical Waste Landfill (CWL) X X 41 †TA-V (northeast fence) X X 42 †TA-V (east fence) X X X 43 †TA-V (southeast fence) X X X 45 †Radioactive and Mixed Waste
Management Facility (RMWMF), TA-III (northwest corner)
X X X
46 †TA-II (south corner) X X X 47 Tijeras Arroyo (east of TA-IV) X 48 Tijeras Arroyo (east of TA-II) X 49 †Near the Explosive Components Facility
(ECF) X X
51 †TA-V (north of culvert) X X 52 †TA-III, northeast of Bldgs. 6716 and 6717 X 53* †TA-III south of long sled track X 54 †TA-III, Bldg. 6630 X 55 †Large Melt Facility (LMF), Bldg. 9939 X X 56 †TA-V, Bldg. 6588 (west corner) X 57 †TA-IV, Bldg. 970 (northeast corner) X 66 KAFB Facility X X 72 †Arroyo del Coyote (midstream) X 74N* †TA-IV, Tijeras Arroyo (midstream) X 75 †Arroyo del Coyote (down-gradient) X 76 †Thunder Range (north) X 77 †Thunder Range (south) X 78 †School House Mesa X 79 †Arroyo del Coyote (up-gradient) X
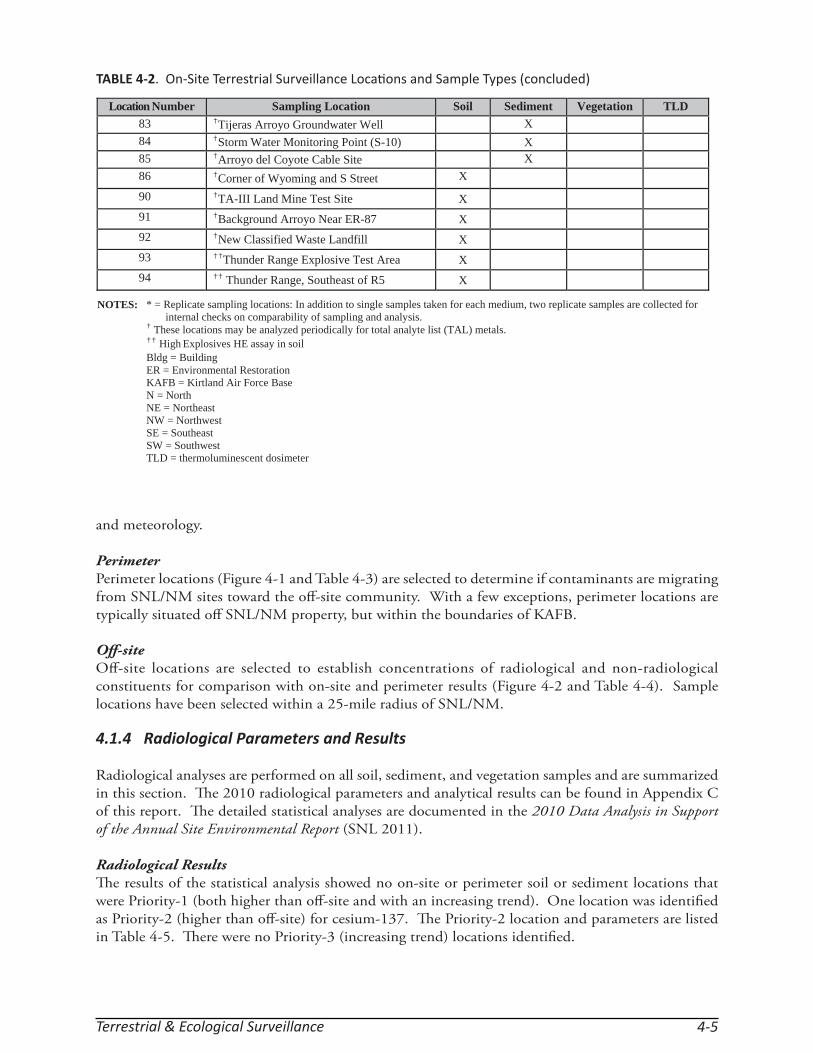
Terrestrial & Ecological Surveillance 4-5
and meteorology.
Perimeter Perimeter locations (Figure 4-1 and Table 4-3) are selected to determine if contaminants are migrating from SNL/NM sites toward the off -site community. With a few exceptions, perimeter locations are typically situated off SNL/NM property, but within the boundaries of KAFB.
Off -site Off -site locations are selected to establish concentrations of radiological and non-radiological constituents for comparison with on-site and perimeter results (Figure 4-2 and Table 4-4). Sample locations have been selected within a 25-mile radius of SNL/NM.
4.1.4 Radiological Parameters and Results
Radiological analyses are performed on all soil, sediment, and vegetation samples and are summarized in this section. Th e 2010 radiological parameters and analytical results can be found in Appendix C of this report. Th e detailed statistical analyses are documented in the 2010 Data Analysis in Support of the Annual Site Environmental Report (SNL 2011).
Radiological ResultsTh e results of the statistical analysis showed no on-site or perimeter soil or sediment locations that were Priority-1 (both higher than off -site and with an increasing trend). One location was identifi ed as Priority-2 (higher than off -site) for cesium-137. Th e Priority-2 location and parameters are listed in Table 4-5. Th ere were no Priority-3 (increasing trend) locations identifi ed.
Location Number Sampling Location Soil Sediment Vegetation TLD 83 †Tijeras Arroyo Groundwater Well X 84 †Storm Water Monitoring Point (S-10) X 85 †Arroyo del Coyote Cable Site X 86 †Corner of Wyoming and S Street X
90 †TA-III Land Mine Test Site X 91 †Background Arroyo Near ER-87 X 92 †New Classified Waste Landfill X 93 ††Thunder Range Explosive Test Area X 94 †† Thunder Range, Southeast of R5 X
NOTES: * = Replicate sampling locations: In addition to single samples taken for each medium, two replicate samples are collected for internal checks on comparability of sampling and analysis. † These locations may be analyzed periodically for total analyte list (TAL) metals. †† High Explosives HE assay in soil Bldg = Building ER = Environmental Restoration KAFB = Kirtland Air Force Base N = North NE = Northeast NW = Northwest SE = Southeast SW = Southwest TLD = thermoluminescent dosimeter
TABLE 4-2. On-Site Terrestrial Surveillance Loca ons and Sample Types (concluded)

2010 Annual Site Environmental Report4-6
TABLE 4-3. Perimeter Terrestrial Surveillance Loca ons and Sample Types
Location Number Sampling Location Soil Sediment Vegetation** TLD
4 †Isleta Reservation Gate X X 5 †McCormick Gate X X 12 †Northeast Perimeter X 16 †Four Hills X X 18 North Perimeter Road X 19 †USGS Seismic Center Gate X X 39 Northwest DOE Complex X 40 Tech Area I, northeast (by Bldg. 852) X 58 †North KAFB Housing X 59 †Zia Park (southeast) X 60 †Tijeras Arroyo (down-gradient) X X 61 †Albuquerque International Sunport (west) X 63 †No Sweat Boulevard X 64* †North Manzano Base X 73 †Tijeras Arroyo (up-gradient) X 80 †Madera Canyon X 81 †KAFB West Fence X X 82 †Commissary X 87 †Mesa del Sol (north) X 88 †Mesa del Sol (middle) X 89 †Mesa del Sol (south) X
NOTES: Bldg = Building DOE = U.S. Department of Energy KAFB = Kirtland Air Force Base TLD = thermoluminescent dosimeter
USGS = U.S. Geological Survey * = Replicate sampling locations: In addition to single samples taken for each medium, two replicate samples are collected for internal checks on comparability of sampling analysis. ** = No vegetation samples were collected due to the ongoing drought.
† These locations may be analyzed periodically for total analyte list (TAL) metals.
Cesium-137One perimeter location (12) continues to be identifi ed as Priority-2 for cesium-137 in surface soils. Location 12 is located on the U.S. Forest Service (USFS) land withdrawn area. Th is location is at a slightly higher elevation, which receives greater precipitation and results in slightly higher cesium-137 levels from fallout. Cesium-137 is prevalent in surface soils worldwide as a result of historical nuclear weapons testing. Over the past 10 years, the values for cesium-137 at this perimeter location ranged from 0.07 to 1.82 picocuries per gram (pCi/g). However, these levels are not cause for concern.
All sediment sample locations were identifi ed as Priority-4 (consistent with off -site results and no increasing trend) for cesium-137.
TritiumTritium is not a signifi cant indicator radionuclide for operations at SNL/NM, and the low soil moisture in the area will always make low-activity assay diffi cult. Th ere was no unusual tritium concentrations noted for any of the soil or sediment samples collected.
Total Uranium No sediment locations were identifi ed as Priority-1, Priority-2 or Priority-3 for total uranium.
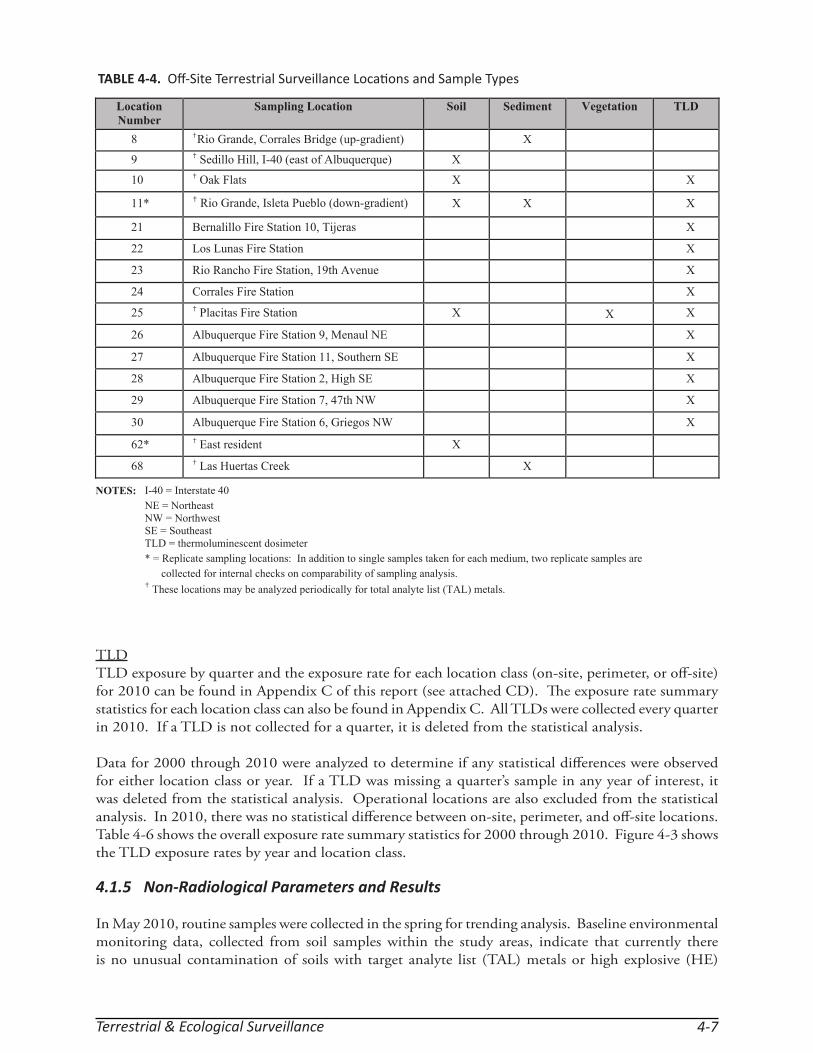
Terrestrial & Ecological Surveillance 4-7
TLDTLD exposure by quarter and the exposure rate for each location class (on-site, perimeter, or off -site) for 2010 can be found in Appendix C of this report (see attached CD). Th e exposure rate summary statistics for each location class can also be found in Appendix C. All TLDs were collected every quarter in 2010. If a TLD is not collected for a quarter, it is deleted from the statistical analysis.
Data for 2000 through 2010 were analyzed to determine if any statistical diff erences were observed for either location class or year. If a TLD was missing a quarter’s sample in any year of interest, it was deleted from the statistical analysis. Operational locations are also excluded from the statistical analysis. In 2010, there was no statistical diff erence between on-site, perimeter, and off -site locations. Table 4-6 shows the overall exposure rate summary statistics for 2000 through 2010. Figure 4-3 shows the TLD exposure rates by year and location class.
4.1.5 Non-Radiological Parameters and Results
In May 2010, routine samples were collected in the spring for trending analysis. Baseline environmental monitoring data, collected from soil samples within the study areas, indicate that currently there is no unusual contamination of soils with target analyte list (TAL) metals or high explosive (HE)
TABLE 4-4. Off -Site Terrestrial Surveillance Loca ons and Sample Types
Location Number
Sampling Location Soil Sediment Vegetation TLD
8 †Rio Grande, Corrales Bridge (up-gradient) X
9 † Sedillo Hill, I-40 (east of Albuquerque) X 10 † Oak Flats X X
11* † Rio Grande, Isleta Pueblo (down-gradient) X X X
21 Bernalillo Fire Station 10, Tijeras X
22 Los Lunas Fire Station X
23 Rio Rancho Fire Station, 19th Avenue X
24 Corrales Fire Station X
25 † Placitas Fire Station X X X
26 Albuquerque Fire Station 9, Menaul NE X
27 Albuquerque Fire Station 11, Southern SE X
28 Albuquerque Fire Station 2, High SE X
29 Albuquerque Fire Station 7, 47th NW X
30 Albuquerque Fire Station 6, Griegos NW X
62* † East resident X
68 † Las Huertas Creek X
NOTES: I-40 = Interstate 40 NE = Northeast NW = Northwest SE = Southeast TLD = thermoluminescent dosimeter
* = Replicate sampling locations: In addition to single samples taken for each medium, two replicate samples are collected for internal checks on comparability of sampling analysis. † These locations may be analyzed periodically for total analyte list (TAL) metals.

2010 Annual Site Environmental Report4-8
FIGU
RE 4
-1. T
erre
stria
l Sur
veill
ance
Pro
gram
On-
site
and
Perim
eter
Sam
plin
g Lo
ca o
ns.
O
n-sit
e lo
ca o
ns a
re w
ithin
are
as o
f SNL
/NM
ope
ra o
ns. P
erim
eter
loca
ons
a
re lo
cate
d bo
th o
n an
d off
KAF
B pr
oper
ty.

Terrestrial & Ecological Surveillance 4-9
FIGURE 4-2. Terrestrial Surveillance Program Off -Site Sampling Loca ons

2010 Annual Site Environmental Report4-10
TABLE 4-5. Radiological Summary Sta s cs for Sample Loca ons Noted as Priority-2 During Calendar Year 2010
Sample Media
Analyte Units Location Number of
Samples
Average StdDev
Minimum Maximum
Soil Cesium-137 pCi/g 12 11 1.04 0.53 0.07 1.82
NOTES: Data presented is for eleven years (2000-2010). pCi/g = picocurie per gram
Std Dev = Standard Deviation
TABLE 4-6. Summary Sta s cs for TLD Exposure Rates, 2000 – 2010
Location Class
No. of Obs
Units Mean Median Std Dev Minimum Maximum
Community 126 mR/hr 96.6 95.2 14.0 73.2 147.6 Perimeter 85 mR/hr 98.4 98.4 11.7 78.5 132.2 On-Site 149 mR/hr 97.5 97.0 9.4 80.9 119.7
NOTES: mR/hr = milliroentgen per hour (10-3 roentgen per hour) Obs = observations
Std Dev = Standard Deviation TLD = Thermoluminescent Dosimeter
FIGURE 4-3. TLD Exposure Rates by Year and Loca on Class

Terrestrial & Ecological Surveillance 4-11
compounds. With the exception of arsenic, none of the analyte concentrations detected in the site soils exceed NMED SSLs for industrial/occupational land use. In all but fi ve out of 56 samples, the arsenic concentrations (0.45 to 6.1 milligrams per kilogram [mg/kg]) did not exceed NMED residential SSLs of 4mg/kg. Based on process knowledge of site activities, these arsenic concentrations are most likely naturally occurring.
Th e results are consistent with Table 4-7, and in no instance do they exceed NMED industrial/occupational SSLs.
Site-wide Non-Radiological ResultsOne sampling location was noted to be Priority-1 (both higher than off -site and with an increasing trend). Six locations were identifi ed as Priority-2 (higher than off -site). Nine locations were identifi ed as Priority-3 (increasing trend). Th e Priority-1, Priority-2 and Priority-3 locations and parameters are listed in Tables 4-8, 4-9, and 4-10, respectively. It should be noted that beginning in 2008, all trending analyses include data from 2000 forward, rather than the previous fi ve year window. Th is change makes the trending analyses more meaningful by including all comparable data since 2000. All results are orders of magnitude below NMED SSLs, levels that would trigger further investigation. All metals (except potassium at on-site location 83) were listed as Priority-4 for all sediment samples. Refer to Figure 4-1 for an illustration of the locations listed in the following descriptions.
AluminumTwo on-site locations (1 and 55) and one perimeter location (61) were identifi ed as Priority-3 (increasing trend) for aluminum in surface soils. Th ese concentrations are well within the range of background identifi ed for aluminum in New Mexico surface soils. All remaining soil and sediment samples were identifi ed as Priority-4 (consistent with off -site results and no increasing trend) for aluminum.
ArsenicOne on-site location (58) was identifi ed as Priority-3 (increasing trend) and one on-site location (33) was identifi ed as Priority-2 (higher than off -site) for arsenic in surface soils. None of the 56 samples collected exceeded NMED SSLs for industrial/occupational land use. However, all concentrations are well within the range of background identifi ed for arsenic in New Mexico surface soils, and are expected to be naturally occurring. All remaining soil and sediment samples were identifi ed as Priority-4 (consistent with off -site results and no increasing trend) for arsenic.
BerylliumOne on-site location (33) was identifi ed as Priority-2 (higher than off -site) for beryllium in surface soils. Th e concentration of beryllium at this location was well within the range of background identifi ed for beryllium in New Mexico surface soils, and is expected to be naturally occurring. All remaining soil, sediment and vegetation samples were identifi ed as Priority-4 (consistent with off -site results and no increasing trend) for beryllium.
ChromiumOne on-site location (51) was identifi ed as Priority-2 (higher than off -site) for chromium in surface soils. Th e concentration is consistent the range of background for chromium in New Mexico surface soils, and is expected to be naturally occurring. All remaining soil and sediment samples were identifi ed as Priority-4 (consistent with off -site results and no increasing trend) for chromium.
CobaltOne perimeter location (64) was identifi ed as Priority-2 (higher than off -site) for cobalt in surface soils. Th e concentrations at all locations are well within the range of background for cobalt in New Mexico surface soils, and are expected to be naturally occurring. All remaining soil and sediment samples were identifi ed as Priority-4 (consistent with off -site results and no increasing trend) for cobalt.

2010 Annual Site Environmental Report4-12
TABLE 4-7. Various Reference Values for Metals in Soil (all units in mg/kg)
NM Soil Concentrations1 NMED Soil Screening Levels2 U.S. Soil Concentrations3
Analyte Lower Limit Upper Limit Residential Industrial Lower Limit Upper Limit
Aluminum 5,000 100,000 74,000 100,000 4,500 100,000 Antimony 0.2 1.3 31 454 0.25 0.6 Arsenic 2.5 19 4 17 1 93 Barium 230 1,800 15,600 100,000 20 1,500 Beryllium 1 2.3 156 2,250 0.04 2.54 Cadmium ND 11 39 564 0.41 0.57 Calcium 600 320,000 N/A N/A N/A N/A Chromium 7.6 42 100,000 100,000 7 1,500 Cobalt 2.1 11 1,520 20,500 3 50 Copper 2.1 30 3,130 45,400 3 300 Iron 1,000 100,000 23,500 100,000 5,000 50,000 Lead 7.8 21 400 800 10 70 Magnesium 300 100,000 N/A N/A N/A N/A Manganese 30 5,000 3,590 48,400 20 3,000 Mercury 0.01 0.06 100,000 100,000 0.02 1.5 Nickel 2.8 19 1,560 22,700 5 150 Potassium 1,900 63,000 N/A N/A N/A N/A Selenium 0.2 0.8 391 5,680 0.1 4 Silica (Silicon) 150,000 440,000 N/A N/A 24,000 368,000 Silver 0.5 5 3,921 5,680 0.2 3.2 Sodium 500 100,000 N/A N/A N/A N/A Thallium N/A N/A 5.6 74.9 0.02 2.8 Titanium 910 4,000 N/A N/A 20 1,000 Vanadium 15 94 78.2 1,140 0.7 98 Zinc 18 84 23,500 100,000 13 300
NOTES: mg/kg = milligram per kilogram N/A = not applicable ND = not detected NM = New Mexico NMED = New Mexico Environment Department U.S. = United States
(1) Dragun and Chekiri, Elements in North American Soils, 2005, Hazardous Materials Control Resources Institute, (Used San Juan Basin, A Horizon to determine values).
(2) Technical Background Document for Development of Soil Screening Levels, Revision 5.0, New Mexico Environment Department, Hazardous Waste. Bureau and Ground Water Quality Bureau Voluntary Remediation Program, Santa Fe, New Mexico (NMED 2009).
(3) U.S. Soil Surface Concentrations, Kabata-Pendias, A., CRC, Trace Elements in Soils and Plants, 3rd Edition, 2000.
TABLE 4-8. Summary Sta s cs for All Loca ons Iden fi ed as Priority-1 for Metals in Soil During Calendar Year 2010 (all units in mg/kg)
Analyte Location Type
Location Average StdDev
Minimum Maximum NMED Soil Screening
Level (Residential)
NMED Soil Screening
Level (Industrial)
Potassium On-Site 1 4,530 1,521 1,020 6,050 N/A N/A
NOTES: Data presented is for eleven years (2000 – 2010). mg/kg = milligram per kilogram
N/A = not applicable NMED = New Mexico Environment Department Std Dev = Standard Deviation

Terrestrial & Ecological Surveillance 4-13
TABLE 4-9. Summary Sta s cs for All Loca ons Iden fi ed as Priority-2 for Metals in Soil During Calendar Year 2010 (all units in mg/kg)
Analyte Location Type
Location Avg Std Dev Min Max NMED Soil Screening Level
(Residential)
NMED Soil Screening Level
(Industrial) Arsenic On-site 33 11.8 9.0 4.5 32.7 4 17 Beryllium On-site 33 1.2 0.30 0.79 1.59 156 2,250 Chromium On-site 51 28.5 14.1 6.9 51.8 100,000 100,000 Cobalt Perimeter 64 8.7 7.2 7.3 9.4 1,520 20,500 Copper On-site 6 34.1 15.5 11.0 55.8 3,130 45,400Iron Perimeter 64 21,714 2,466 18,000 25,500 23,500 100,000 Magnesium Perimeter 64 7.467 415 7,030 8,180 n/a n/a Manganese Perimeter 64 605 32 558 638 3,590 48,400Potassium On-site 1 4,330 1,321 1,020 6,050 N/A N/A
83 5,086 1,022 4,120 6,320Zinc Perimeter 64 80.4 8.7 68 96 23,500 100,000
NOTES: Avg = Average Data presented is for eleven years (2000-2010). Std Dev = Standard Deviation Max = Maximum
mg/kg = milligram per kilogram Min = Minimum
N/A = not applicable NMED = New Mexico Environment Department
TABLE 4-10. Summary Sta s cs for All Loca ons Iden fi ed as Priority-3 for Metals in Soil During Calendar Year 2010 (all units in mg/kg)
Analyte Location Type
Location Average Std Dev Minimum Maximum NMED Soil Screening Level
(Residential)
NMED Soil Screening Level
(Industrial) Aluminum On-Site 1 12,348 3,745 4,380 17,100 74,000 100,000
55 9,868 2,413 6,140 12,700 Perimeter 61 6,390 1,560 4,040 8,350
Arsenic Perimeter 58 3.16 0.31 2.55 3.48 4 17 Iron On-Site 6 11,730 1,583 9,910 14,500 23,500 100,000 Magnesium On-Site 55 3,201 551 2,290 3,960 N/A N/A
Perimeter 58 4,537 801 3,740 6,200 Off-Site 10 3,027 419 2,290 3,520
Potassium On-Site 2NW 1,821 373 1,190 2,310 N/A N/A 55 2,679 599 1,650 3,340 78 2,060 359 1,380 2,370
NOTES: Data presented is for eleven years (2000-2010). mg/kg = milligram per kilogram N/A = not applicable
NMED = New Mexico Environment Department NW = Northwest Std Dev = Standard Deviation

2010 Annual Site Environmental Report4-14
CopperOne on-site location (6) was identifi ed as Priority-2 (higher than off -site) for copper in surface soils. Th e concentrations were well within the range of background identifi ed for copper in New Mexico surface soils, and are expected to be naturally occurring. All remaining soil and sediment samples were identifi ed as Priority-4 (consistent with off -site results and no increasing trend) for copper.
IronOne on-site location (6) was identifi ed as Priority-3 (increasing trend) and one perimeter location (64) was identifi ed as Priority-2 (higher than off -site) for iron in surface soils. Th e concentrations are well within the range of background for iron in Western U.S. surface soils, and are expected to be naturally occurring. All remaining soil and sediment samples were identifi ed as Priority-4 (consistent with off -site results and no increasing trend) for iron.
MagnesiumOne on-site location (55), one perimeter location (58) and one off -site location (10) were identifi ed as Priority-3 (increasing trend) for magnesium in surface soils. One perimeter location (64) was identifi ed as Priority-2 (higher than off -site) for magnesium in surface soils. Th e concentrations are well within the range of background identifi ed for magnesium in New Mexico surface soils, and are expected to be naturally occurring. All remaining soil and sediment samples were identifi ed as Priority-4 (consistent with off -site results and no increasing trend) for magnesium.
ManganeseOne perimeter location (64) was identifi ed as Priority-2 (higher than off -site) for manganese in surface soils. Th e concentrations are well within the range of background identifi ed for manganese in New Mexico surface soils, and are expected to be naturally occurring. All remaining soil and sediment samples were identifi ed as Priority-4 (consistent with off -site results and no increasing trend) for magnesium.
PotassiumFour on-site locations (1, 2NW, 55 and 78) were identifi ed as Priority-3 (higher than off -site and increasing trend) for potassium in surface soils. One on-site location (1) for sediment was identifi ed as Priority-2 (higher than off -site) for potassium in surface soils. Th ese soil concentrations are well within soil concentrations identifi ed for potassium in New Mexico surface soils, and are expected to be naturally occurring. All remaining soil and sediment samples were identifi ed as Priority-4 (consistent with off -site results and no increasing trend) for potassium.
ZincOne perimeter location (64) was identifi ed as Priority-2 (higher than off -site) for zinc in surface soils. Th e soil concentrations are well within soil concentrations identifi ed in the Western U.S. soils concentrations, and are expected to be naturally occurring. All remaining soil and sediment samples were identifi ed as Priority-4 (consistent with off -site results and no increasing trend) for zinc.

Terrestrial & Ecological Surveillance 4-15
4.2 Ecological Surveillance
Biota monitoring began in 1996 as an additional element of environmental monitoring within the Terrestrial Surveillance Program. Th e objectives of the Ecological Surveillance Program are to:
• Collect ecological resource inventory data to support site activities while preserving ecological resources and to maintain regulatory compliance,
• Collect information on plant and animal species present to further the understanding of ecological resources on-site,
• Collect biota contaminant data on an as needed basis in support of site projects and regulatory compliance,
• Assist SNL/NM organizations in complying with regulations and laws,
• Educate the SNL/NM community regarding ecological resource conservation, and
• Support line organizations with biological surveys in support of site activities.
Th e biota data collected are consistent with the requirements under DOE Order 450.1A (DOE 2008a). Data are collected on mammal, reptile, amphibian, bird, and plant species that currently inhabit SNL/NM. Data collected include information on presence, abundance, species diversity, and land use patterns. Since no signifi cantly elevated levels of radionuclides or metals were observed in soil or vegetation samples, no contaminant analysis of radionuclides and metals on wildlife were performed in 2010. Table 1-1 in Chapter 1 represents common species identifi ed at KAFB.
Th ese data are primarily utilized to support NEPA documentation and land use decisions. Data also support wildlife communication campaigns to ensure safe work environments and sustainable decision-making strategies.
2010 Annual Site Environmental Report4-16
Th is page intentionally left blank.

Air Quality Compliance & Meteorological Monitoring 5-1
Personnel at Sandia National Laboratories, New Mexico (SNL/NM) conduct air quality monitoring and surveillance under the following three programs:
• Clean Air Network (CAN) Program conducts meteorological monitoring (Section 5.1) and ambient air surveillance (Section 5.2).
• National Emission Standards for Hazardous Air Pollutants (NESHAP) Program coordinates with facility owners to meet radiological air emission regulations (Sections 5.3 and 5.4).
• Air Quality Compliance (AQC) Program ensures that all non-radiological air emission sources at SNL/NM (such as generators, boilers, chemical users, and vehicles) meet applicable air quality standards and permitting requirements (Section 5.5).
5.1 Meteorological Monitoring Program
Th e Meteorological Monitoring Program is part of the CAN program. Th e main objective of the Meteorological Monitoring Program is to provide site-specifi c representative data for SNL/NM. Data is used for air dispersion and transport modeling, to support emergency response activities, and to support regulatory permitting and reporting processes. Additional uses of meteorological data include supporting various environmental activities and programs, and providing data to SNL/NM research and development (R&D) projects.
Th e U.S. Department of Energy (DOE) directives and regulations applicable to the Meteorological Monitoring Program are listed in Chapter 8.
Tower and Network InstrumentationSandia Corporation (Sandia) conducts meteorological monitoring through a network of eight meteorological towers located throughout Kirtland Air Force Base (KAFB). All towers are on or near SNL/NM property, and the network includes:
• Six 10-meter towers,
• One 30-meter tower, and
• One 60-meter tower.
Routine instrument calibrations and weekly tower site visits are performed as part of the Quality Assurance (QA) Program for the monitoring network. Th e CAN network of meteorological towers and ambient air monitoring locations are shown in Figure 5-1.
Meteorological Monitoring TowersAll meteorological towers are instrumented to measure temperature and wind velocity, including the standard deviation of horizontal wind direction (sigma theta), at 3- and 10-meter levels. Temperature and wind velocity are also measured at the top of the two tallest towers (30- and 60-meters).
Air Quality Compliance &Meteorological Monitoring

2010 Annual Site Environmental Report5-2
FIGU
RE 5
-1.
The
Clea
n Ai
r Net
wor
k (C
AN) o
f Met
eoro
logi
cal T
ower
s and
Am
bien
t Air
Mon
itorin
g St
a o
ns
Manzano Base
Isle
ta P
uebl
o
AlbuquerqueInternational Sunport
Arro
yo
delC
oy
ote
02 _
5-1.
ai
N
Tije
ras
Arro
yoG
olf C
ours
e
Old
Sch
ool
Hou
se
CL1
A21
KU
1
SC1
A36
MW
1
CW
1
A13
CSV
OC
CPM
S
A2V
OC
A2P
M CW
VOC
CW
PMMD
LVO
C
Met
eoro
logi
cal t
ower
Am
bien
t air
mon
itorin
g st
atio
nKEY
CLE
AN
AIR
NET
WO
RK
(C
AN
)
Not
to S
cale
A3PMTA
-III

Air Quality Compliance & Meteorological Monitoring 5-3
In addition, relative humidity is measured at the 3-meter level. Rainfall is measured at the 1-meter level at towers A36, A21, and SC1. Barometric pressure is measured at the 2-meter level at towers A36 and A21.
5.1.1 Meteorological Monitoring Results
Th e A36 60-meter tower is used to describe general meteorology at SNL/NM due to its central geographic position and the availability of data at all instrument levels. Th e 2010 annual climatic summary for tower A36 is shown in Table 5-1.
In general, the annual statistics for each of the towers are similar. However, daily meteorology varies considerably across the meteorological network. Th is real-time variability of meteorological conditions has implications on the transport and dispersion of pollutants, which are important in atmospheric emergency release scenarios and air dispersion modeling. Figure 5-2 shows some of the variations and extremes found in meteorological measurements across SNL/NM.
Current weather information from the SNL/NM CAN meteorological network can be found at the following website:
http://132.175.200.42/
5.1.2 Wind Analysis
Annual wind roses for three locations across SNL/NM are illustrated in Figures 5-3 and 5-4. A wind rose is a graphical representation of wind speed and direction frequency distribution. Wind direction is the true bearing when facing the wind (the direction from which the wind is blowing). As shown in Figure 5-3, wind directions and speeds can vary signifi cantly across SNL/NM. Th e annual wind frequency distribution for Technical Area (TA)-I, not shown, indicates yet another pattern, with the greatest direction frequency from the east and east-northeast, as winds blow from Tijeras Canyon. Th e predominant wind direction at most locations is produced by topographic infl uences that also create nocturnal drainage fl ows.
5.2 Ambient Air Surveillance Program
Ambient air surveillance is conducted under the CAN Program through a network of six air monitoring stations located on or near SNL/NM property (Figure 5-1). Th e primary objective of the Ambient Air Surveillance Program is to show compliance with the National Ambient Air Quality Standards (NAAQS) (40 Code of Federal Regulations [CFR] 50) and New Mexico Ambient Air Quality Standards (NMAAQS) (20.11.8 New Mexico Administrative Code [NMAC]). Ambient air surveillance is also important to establish background concentration levels for pollutants of concern and to evaluate the eff ects, if any, from SNL/NM operations on the public and the environment due to operations at SNL/NM. Applicable requirements are listed in Chapter 8.
5.2.1 Monitoring Sta ons
Criteria Pollutant Monitoring Station (CPMS) – Th ere is one CPMS in the CAN network. Th e CPMS is located in the northeast corner of TA-I. Criteria pollutants are the set of six common pollutants for which the U. S. Environmental Protection Agency (EPA) must set national ambient

2010 Annual Site Environmental Report5-4
TABLE 5-1. Annual Clima c Summary from Tower A36 During Calendar Year 2010
standards according to the Clean Air Act (CAA). For more information on air pollutants, visit the following website:
http://www.epa.gov/ebtpages/air.html
Th e CPMS is used to perform continuous monitoring for sulfur dioxide, carbon monoxide, nitrogen oxide, and ozone. Data are then compiled into hourly averages. A particulate matter (PM) monitor is a part of the CPMS. Lead, a criteria pollutant, is one of 23 metals analyzed from PM samples at this station.
PM10 Stations – PM with a diameter equal to or less than 10 microns are measured at four monitoring locations (CPMS, A2PM, A3PM, and CWPM). Samples are collected over a 24-hour period, starting and ending at midnight, every sixth day. Th is schedule is consistent with the National Air Sampling Program (NASP). Samples are analyzed for 23 metals and are radiologically screened using gross alpha, gross beta, and gamma spectroscopy.
PM2.5 Stations – PM with a diameter equal to or less than 2.5 microns is measured at two locations (CPMS and TA-III) at SNL/NM. PM2.5 is measured continuously and recorded in hourly concentrations 24-hours-a-day, 365-days-per-year. Filters are not manually weighed with this system. Th e mass is calculated with microprocessor measurements. PM2.5 and PM10 measurements at SNL/NM are done with diff erent instruments and should not be quantitatively compared with each other due to diff ering instrument limitations and processing techniques. PM2.5 fi lters are not sent to a laboratory for chemical analysis.
Jan Feb Mar Apr May Jun Jul Aug Sept Oct Nov Dec AnnualTemperature (°C) Average Daily High 7.16 8.37 13.97 19.91 25.03 32.45 31.63 30.75 29.28 21.37 12.82 10.54 20.27 Average Daily Low -3.90 -1.99 0.39 5.16 9.92 16.85 18.40 16.93 15.63 8.60 0.41 -0.25 7.18 Monthly Mean 1.87 3.34 7.30 12.76 17.67 24.93 24.59 23.85 22.62 15.31 6.83 5.67 13.90
Extremes (°C) High 11.57 14.39 26.69 25.19 31.72 36.97 37.28 34.83 32.00 29.12 20.35 16.68 37.28 Low -11.23 -7.10 -4.62 -3.41 -0.51 11.73 15.56 11.40 10.20 0.32 -8.06 -12.59 -12.59
Relative Humidity (%) 55.58 58.44 45.69 33.72 25.55 22.56 43.98 43.92 36.13 42.83 36.58 54.45 41.62
Precipitation (cm) Monthly 2.34 0.69 1.65 1.45 0.23 2.69 2.49 3.68 4.80 1.91 0.03 2.62 24.56 24 Hour Max 1.17 0.20 0.46 0.89 0.23 2.59 0.76 2.18 4.24 1.42 0.03 1.96 4.24
Wind (m/sec) Monthly 2.86 3.17 3.82 5.14 4.95 4.33 3.80 3.44 3.66 3.41 3.52 2.85 3.75 24 Hour Max 7.75 5.44 7.63 10.41 10.34 8.01 6.74 10.35 8.61 6.58 6.19 6.20 10.41 Maximum Gust 27.02 17.30 24.38 27.06 25.86 30.81 19.26 24.82 24.18 21.38 20.38 23.30 30.81
Barometric Pressure (mb) 833.7 831.0 832.0 830.0 831.2 833.8 835.3 836.1 835.5 836.7 834.7 834.0 833.7
NOTES: °C = degree celsius cm = centimeter m/sec = meters per second mb = millibar % = percent

Air Quality Compliance & Meteorological Monitoring 5-5
FIGURE 5-2. Varia ons and Extremes in Meteorological Measurements Across the Meteorological Tower Network During CY 2010.
Wind Speed Minimum (m/sec) Maximum (m/sec) Spread (m/sec)
Average Annual Wind Speed 3.65
(CL1) 3.93
(SC1) 0.28
Greatest Difference in Average Speed over 24
hours
2.82(A36)
7.82(SC1)
5.00In January
Greatest Daily Difference in Maximum
Wind Gust15.3
(SC1) 35.7
(CL1) 20.5
In June Average Difference in
Daily Wind Speed 0.97
Temperature Minimum (°C) Maximum (°C) Spread (°C)
Average Annual Temperature 13.62
(SC1) 14.35(A13) 0.73
Network Annual Temperature Extremes -13.89
(SC1) 38.11(CL1) 52.0
Greatest Difference in Daily Minimum Temperature
2.62(MW1)
8.10(A13)
5.48In April
Greatest Difference in Daily Average Temperature
0.68(SC1)
2.47(CL1)
1.79In February
Greatest Difference in Daily Maximum Temperature
8.76(A36)
11.72(KU1)
2.96In December
Precipitation Minimum (cm) Maximum (cm) Spread (cm)
Annual Precipitation (Extremes) 24.05
(A21) 28.37(SC1) 4.32
Greatest Daily Rainfall Variation
0.0(A21&A36)
2.62(SC1)
1.12In July
Greatest Monthly Precipitation Difference 2.49
(A36) 6.93
(SC1) 4.44
In July Greatest in Monthly
Rainfall 6.93(SC1 in July)
NOTE: Winter precipitation that falls as snow is underestimated (mostly at the SC1 tower).

2010 Annual Site Environmental Report5-6
FIGU
RE 5
-3. 2
010
Annu
al W
ind
Rose
s for
Tow
ers C
L1, A
36, a
nd S
C1
1LC
1CS
63A
aerAesuo
HloohcS
aerAetiS
LIO
C
ytiniciVIII-AT
N
Mader
aCa
nyon
No
t to
sc
ale
Valu
es >11
6 - 1
14
- 63
- 42
- 30.
3 - 2
Valu
es
MM

Air Quality Compliance & Meteorological Monitoring 5-7
FIGU
RE 5
-4.
2010
Ann
ual W
ind
Rose
s for
Day
me
and
Nig
h m
e W
ind
Freq
uenc
y at
the
A36
Tow
er
A36
NIG
HT (7
PM
- 7
AM)
N
Mad
era
Cany
on
Not
to S
cale
DAY
(7 A
M -
7 PM
)
Valu
es >11
6 - 11
4 - 6
3 - 4
2 - 3
1 - 2
MMMMMMMMMMMMMMMMMMMMMMMMMMMMMMMMMMMMMMMMMMMMMMMMMMMaaaaaaaaaaaaaa
Mddddddddddddddeeeeeeeeee
rrrrrraaaaaaaaaaarrCCCCaaa
nnnnnyyyyoooyynnnn
DAY
(7 A
M -
7 PM
)

2010 Annual Site Environmental Report5-8
Volatile Organic Compound (VOC) Stations – Th ere are four VOC monitoring stations (CSVOC, MDLVOC, CWVOC, and A2VOC). VOC samples are collected once a month over a 24-hour period.
5.2.2 Ambient Air Monitoring Results
Criteria PollutantsTh e latest EPA standards for criteria pollutants can be found at the following website:
http://www.epa.gov/air/criteria.html
In 2010, the automated data recovery for criteria pollutants was approximately 99.6 percent. Table 5-2 lists the results from the CPMS, PM10 and monitors and compares them to NAAQS and NMAAQS for criteria pollutants.
Although violations of annual federal standards for criteria pollutants are not allowed, exceedances for short-term standards are allowable once a year. State standards also allow short-term exceedances due to meteorological conditions for example, in the case of an atmospheric inversion where air mixing may be extremely restricted. Th ere were no exceedances of the criteria pollutant standards in 2010.
TABLE 5-2. Criteria Pollutant Results as Compared to Regulatory Standards During Calendar Year 2010
CriteriaPollutant
Averaging Time
Unit NMAAQSStandard
NAAQS Standard
Maximum or Measured
ConcentrationsCarbon Monoxide 1 hour
8 hours ppm ppm
13.1 8.7
35 9
12.2 2.4
Nitrogen Dioxide 24 hours Annual
ppm ppm
0.10 0.05
-0.053
0.03 0.01
Sulfur Dioxide§ 3 hours 24 hours Annual
ppm ppm ppm
-0.10 0.02
0.50 0.14 0.03
0.007 0.009 0.001
Ozone 1 hour 8 hour
ppm ppm
d-
d0.075
0.2 0.04a
PM10 24 hours Annual
μg/m3
μg/m3--
150b
50 29 9.3
PM2.5 24 hours Annual
μg/m3
μg/m3--
35 15.0
16.1c
6.9 Lead Any quarter μg/m3 1.5 1.5 0.001
NOTES: ppm = parts per million μg/m3 = micrograms per cubic meter
NMAAQS = New Mexico Ambient Air Quality Standards NAAQS = National Ambient Air Quality Standards PM10 = particulate matter (diameter equal to or less than 10 microns) PM2.5 = respirable particulate matter (diameter equal to or less than 2.5 microns) § Standards are defined in μg/m
3 and have been converted to ppm.
a Reported as the fourth highest average of the year – per regulatory standards. b Not to be exceeded more than once per year - per updated regulatory standards c Reported as the three year 98th percentile value - per regulatory standards
d As of June 15, 2005 EPA revoked the 1-hour ozone standard in all areas except the 8-hour ozone non-attainment Early Action Compact (EAC) Areas. Albuquerque, New Mexico is not an EAC Area.

Air Quality Compliance & Meteorological Monitoring 5-9
TABLE 5-3. Monthly and Annual Averages for PM10 (Air) During Calendar Year 2010 (all units in μg/m3)
Sample Location Jan Feb Mar Apr May Jun Jul Aug Sep Oct Nov Dec Annual
A2PM 8.60 10.20 6.60 11.00 10.00 12.50 11.50 10.00 11.00 10.40 10.80 4.80 9.78
CPMS 5.40 8.60 4.67 6.40 10.80 9.80 10.83 8.80 9.00 8.20 5.75 4.60 7.74
CWPM 10.60 11.20 6.40 8.25 14.20 19.20 12.67 10.20 9.00 10.40 6.80 8.20 10.59
A3PM 4.80 8.40 5.00 7.00 13.80 12.25 11.33 12.20 12.60 8.00 8.20 4.20 8.98
NOTES: PM10 = Particulate Matter (diameter equal to or less than 10 microns) g/m3 = microgram per cubic meter
PM10Data recovery for PM10 was 95.9 percent complete based on a sampling schedule occurring every sixth day. Th e highest daily particulate loading occurred at the CPMS site. A PM10 concentration of 29 micrograms per cubic meter (μg/m3) occurred at CPMS in June 2010. Th e monthly and annual averages for PM10 are listed in Table 5-3 (Table 5-4 shows monthly and annual averages for PM2.5). Th e annual PM concentrations for 2010 are slightly lower, though comparable to the results for 2009.
All fi lters collected from the PM10 stations that have complete fi eld data are analyzed for 23 metals plus the radiological analyses. Filters are collected every sixth day and are consolidated into monthly composites for analyses. In 2010, monthly composites varied from three to six fi lters per month, depending on the sampling schedule and sampler power problems. In an attempt to provide better analytical information, results are included in averages only when they are actually higher than the radiological decision levels or instrument detection limits. Table 5-5 lists the averaged results of the PM10 analysis. It should be noted that most of the radionuclides are naturally occurring, or are short-lived decay daughter products found while the sample was in the counter, and are not emitted from SNL/NM sources. Many of the radionuclide averages in Table 5-5 are based on the results of one or two samples in the year identifying small concentrations of the constituent.
An Analysis of Variance (ANOVA) was performed to determine if statistical diff erences existed between stations. Th e results of the ANOVA indicated that the concentrations of antimony at the CWPM and CPMS stations were statistically diff erent and slightly higher than the other sites. Th e area surrounding the CWPM and CPMS stations varies, with the CWPM fairly remote and the CPMS
TABLE 5-4. Monthly and Annual Averages for PM2.5 (Air) During Calendar Year 2010 (all units in μg/m3)
Location Jan Feb Mar Apr May Jun Jul Aug Sep Oct Nov Dec Annual
CPMS 7.26 5.73 6.27 7.78 8.52 11.59 9.38 6.28 7.72 7.31 6.15 6.52 7.54
TA3 5.50 5.31 5.41 5.96 6.85 8.03 6.96 5.62 6.72 6.68 5.23 5.70 6.16
NOTES: PM2.5 = Particulate Matter (diameter equal to or less than 2.5 microns) g/m3 = microgram per cubic meter
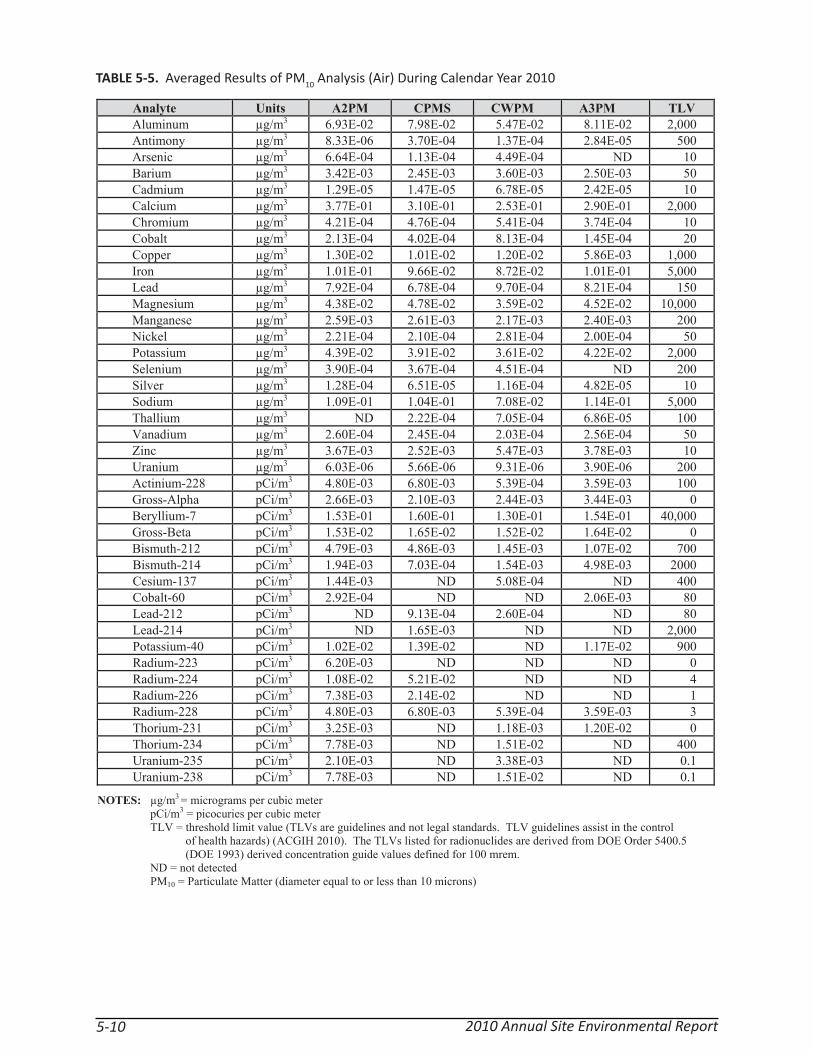
2010 Annual Site Environmental Report5-10
TABLE 5-5. Averaged Results of PM10 Analysis (Air) During Calendar Year 2010
Analyte Units A2PM CPMS CWPM A3PM TLVAluminum μg/m3 6.93E-02 7.98E-02 5.47E-02 8.11E-02 2,000 Antimony μg/m3 8.33E-06 3.70E-04 1.37E-04 2.84E-05 500 Arsenic μg/m3 6.64E-04 1.13E-04 4.49E-04 ND 10 Barium μg/m3 3.42E-03 2.45E-03 3.60E-03 2.50E-03 50 Cadmium μg/m3 1.29E-05 1.47E-05 6.78E-05 2.42E-05 10 Calcium μg/m3 3.77E-01 3.10E-01 2.53E-01 2.90E-01 2,000 Chromium μg/m3 4.21E-04 4.76E-04 5.41E-04 3.74E-04 10 Cobalt μg/m3 2.13E-04 4.02E-04 8.13E-04 1.45E-04 20 Copper μg/m3 1.30E-02 1.01E-02 1.20E-02 5.86E-03 1,000 Iron μg/m3 1.01E-01 9.66E-02 8.72E-02 1.01E-01 5,000 Lead μg/m3 7.92E-04 6.78E-04 9.70E-04 8.21E-04 150 Magnesium μg/m3 4.38E-02 4.78E-02 3.59E-02 4.52E-02 10,000 Manganese μg/m3 2.59E-03 2.61E-03 2.17E-03 2.40E-03 200 Nickel μg/m3 2.21E-04 2.10E-04 2.81E-04 2.00E-04 50 Potassium μg/m3 4.39E-02 3.91E-02 3.61E-02 4.22E-02 2,000 Selenium μg/m3 3.90E-04 3.67E-04 4.51E-04 ND 200 Silver μg/m3 1.28E-04 6.51E-05 1.16E-04 4.82E-05 10 Sodium μg/m3 1.09E-01 1.04E-01 7.08E-02 1.14E-01 5,000 Thallium μg/m3 ND 2.22E-04 7.05E-04 6.86E-05 100 Vanadium μg/m3 2.60E-04 2.45E-04 2.03E-04 2.56E-04 50 Zinc μg/m3 3.67E-03 2.52E-03 5.47E-03 3.78E-03 10 Uranium μg/m3 6.03E-06 5.66E-06 9.31E-06 3.90E-06 200 Actinium-228 pCi/m3 4.80E-03 6.80E-03 5.39E-04 3.59E-03 100 Gross-Alpha pCi/m3 2.66E-03 2.10E-03 2.44E-03 3.44E-03 0 Beryllium-7 pCi/m3 1.53E-01 1.60E-01 1.30E-01 1.54E-01 40,000 Gross-Beta pCi/m3 1.53E-02 1.65E-02 1.52E-02 1.64E-02 0 Bismuth-212 pCi/m3 4.79E-03 4.86E-03 1.45E-03 1.07E-02 700 Bismuth-214 pCi/m3 1.94E-03 7.03E-04 1.54E-03 4.98E-03 2000 Cesium-137 pCi/m3 1.44E-03 ND 5.08E-04 ND 400 Cobalt-60 pCi/m3 2.92E-04 ND ND 2.06E-03 80 Lead-212 pCi/m3 ND 9.13E-04 2.60E-04 ND 80 Lead-214 pCi/m3 ND 1.65E-03 ND ND 2,000 Potassium-40 pCi/m3 1.02E-02 1.39E-02 ND 1.17E-02 900 Radium-223 pCi/m3 6.20E-03 ND ND ND 0 Radium-224 pCi/m3 1.08E-02 5.21E-02 ND ND 4 Radium-226 pCi/m3 7.38E-03 2.14E-02 ND ND 1 Radium-228 pCi/m3 4.80E-03 6.80E-03 5.39E-04 3.59E-03 3 Thorium-231 pCi/m3 3.25E-03 ND 1.18E-03 1.20E-02 0 Thorium-234 pCi/m3 7.78E-03 ND 1.51E-02 ND 400 Uranium-235 pCi/m3 2.10E-03 ND 3.38E-03 ND 0.1 Uranium-238 pCi/m3 7.78E-03 ND 1.51E-02 ND 0.1
NOTES: μg/m3 = micrograms per cubic meter pCi/m3 = picocuries per cubic meter
TLV = threshold limit value (TLVs are guidelines and not legal standards. TLV guidelines assist in the control of health hazards) (ACGIH 2010). The TLVs listed for radionuclides are derived from DOE Order 5400.5 (DOE 1993) derived concentration guide values defined for 100 mrem. ND = not detected PM10 = Particulate Matter (diameter equal to or less than 10 microns)

Air Quality Compliance & Meteorological Monitoring 5-11
very high traffi c. Antimony can be found naturally occurring and it is also used in soldering activities for microelectronics. Both of these could explain the slightly higher concentrations that are found at the CWPM and CPMS stations. Th e results of the ANOVA also indicated that the concentration of arsenic and cesium were statistically higher at the A2PM station. Th is area has desert landscape and these naturally occurring radionuclides could contribute to this.
PM2.5PM2.5 is also known as “fi ne particulate”. Fine particulates are thought to be a greater health hazard than PM10 because the smaller-sized particles can lodge deep in the lungs. Most PM2.5 is created either directly from the combustion of all types of fossil fuels, including wood burning, or by secondary reactions of gases created in the combustion process with other gases in the atmosphere. Th e data recovery for PM2.5 measurements for 2010 was approximately 99 percent. Th e monthly and annual averages for PM2.5 are listed in Table 5-4. In 2010, the highest concentrations were found in the beginning of the summer and were most likely the result of wildland fi re smoke transported from areas outside of SNL/NM. Concentrations in the SNL/NM area dropped quickly with the onset of rains in late June to early July. Concentrations tend to be higher at the CPMS station due to the higher traffi c counts in the area.
VOCsTh e VOCs generally observed at SNL/NM are products or by-products of fossil fuels or from laboratory operations. In 2010, the data recovery for VOC monitoring was 99 percent. Monthly VOC samples were analyzed for 32 VOC species plus total non-methane hydrocarbon (TNMHC). Table 5-6 shows the compiled results for compounds detected at four stations.
Th e concentrations in Table 5-6 reveal that there is not one site with the highest concentration for all analytes, though the greatest numbers of contaminants are found at the MDLVOC site.
An ANOVA was performed to determine if statistical diff erences existed between locations for each VOC. Th e ANOVA indicated that the concentrations of benzene at the CPMSVOC and MDLVOC stations were statistically diff erent and slightly higher than the other sites. Th ere was also an indication that levels of isohexane were higher at the MDLVOC station. Due to the higher amount of vehicle traffi c, and the laboratory operations around these stations, that could explain the slightly higher concentrations found at the CPMSVOC and MDLVOC stations.
5.3 Radiological Air Emissions
Th e EPA regulates radionuclide air emissions in accordance with 40 CFR 61, Subpart H, National Emission Standards for Emissions of Radionuclides Other than Radon from Department of Energy Facilities. Th e EPA has set a maximally exposed individual (MEI) radiological dose limit of 10 millirems per year (mrem/yr) resulting from all radiological air emissions produced from a DOE facility.
5.3.1 Compliance Repor ng
Sandia prepares an annual NESHAP report that summarizes radionuclide air emission releases from SNL/NM facilities and presents the results of the annual dose assessment. Th e DOE National Nuclear Security Administration (NNSA), Sandia Site Offi ce (SSO) submits the annual report to EPA and the City of Albuquerque (COA) Environmental Health Department (EHD). Th e NESHAP report for CY10 is prepared in 2011 and is entitled, NESHAP Annual Report for Calendar Year (CY) 2010, SNL/NM (SNL 2011a).

2010 Annual Site Environmental Report5-12
5.3.2 SNL/NM NESHAP Facili es
Currently, there are 13 potential NESHAP facilities that may be defi ned as point emission sources at SNL/NM. Point sources are produced from an exhaust stack or vent. Th e Mixed Waste Landfi ll (MWL), located in TA-III, was the only diff use source with the potential to release radionuclides to the environment. In September of 2009, an evapotranspirative (ET) cover was installed at the MWL. Based upon past emissions studies and the new ET cover thickness, any potential release from the MWL is negligible (i.e., essentially zero).
Table 5-7 lists the radionuclides and the total reported emissions (in curies [Ci]) from each SNL/NM NESHAP source in 2010. Th ere were 13 were point sources.
Th e 13 SNL/NM NESHAP facilities are illustrated in Figure 5-5 and are described below.
T A-I SourcesRadiation Protection Instrument Calibration Laboratory (RPICL) – Calibration on radiation detection equipment resulted in small releases of tritium.
TABLE 5-6. VOC Average Concentra ons Compiled from Monthly Results at Four Sta ons (Air) During Calendar Year 2010 (Average was computed using only detected results*)
Compound CPMSVOC CWVOC MDLVOC TA-II VOC TLV1,1,1-Trichloroethane ** ND ND ND ND 350,000 1,1,2-Trichlorotrifluoroethane ** 0.35 0.31 0.40 0.31 1,000,000 1-Butene/Isobutene 0.17 0.38 0.21 0.15 NA 2,2,4-Trimethylpentane ND ND 0.55 ND NA 2-Butanone (MEK) 0.59 0.45 0.99 0.45 200,000 2-Methylbutane 0.57 0.24 2.00 0.51 1,770,000 3-Methylpentane ND ND ND ND 500,000 Acetone 5.30 4.68 8.94 3.97 500,000 Benzene 0.22 0.08 0.15 0.11 500 Carbon tetrachloride ** 0.12 0.10 0.13 0.11 5,000 Chloromethane 0.56 0.49 0.56 0.57 50,000 Dichlorodifluoromethane ** 0.49 0.49 0.50 0.48 1,000,000 Ethylbenzene ND ND ND ND 1,000,000 Isohexane 0.09 ND 0.26 ND 100,000 Methylene chloride 1.99 0.24 1.84 1.49 50,000 n-Butane 0.51 0.32 0.41 0.40 800,000 n-Hexane ND ND 0.46 ND 50,000 n-Pentane 0.28 0.16 0.40 0.44 600,000 o-Xylene ND ND 1.45 ND 100,000 p-Xylene/m-Xylene ND ND 4.03 ND NA Tetrachloroethene ND ND 0.57 ND 25,000 Toluene 0.37 0.14 12.05 0.53 50,000 Trichloroethene ND ND 2.86 0.44 50,000 Trichlorofluoromethane ** 0.27 0.27 0.29 0.27 1,000,000 TNMHC 14.96 11.96 39.99 11.50 NA
NOTES: ND = not detected NA = not available VOC = volatile organic compounds. VOCs may be shown as separate species as well as in combination with another analyte. TLV= threshold limit value (TLVs are guidelines and not legal standards. TLV guidelines assist in the control of occupational health hazards) (ACGIH 2010) * parts per billion by volume ** Ozone depleting compounds

Air Quality Compliance & Meteorological Monitoring 5-13
TABLE 5 7. Summary of Radionuclide Releases from the 13 NESHAP Sources During Calendar Year 2010
Source Name, Location
Description Source Type
MonitoringMethod
Radionuclide Emitted
Reported Release (Ci/yr)
ACRR, TA-V Reactor used to perform in-pile experiments for severe reactor accident research projects.
Point Periodic Argon-41 4.09
AHCF, TA-V The AHCF is used to identify, sort, characterize, and repackage legacy nuclear materials and transuranic waste (TRU) packages for permanent removal from the SNL/NM site. Legacy material may include accountable nuclear material, TRU waste, spent nuclear fuel, and radiological material.
Point Periodic Cobalt-60 Strontium-90Cesium-134Cesium-137
Promethium-147 Europium-154
Americium-241Plutonium-238Plutonium-239Plutonium-240Plutonium-241
2.54E-15 1.34E-10 5.16E-14 4.59E-10 3.26E-12 4.31E-13 5.56E-13 3.26E-12 1.94E-13 1.42E-13 1.12E-11
ECF, TA-II Facility used for testing neutron generator design and manufacturing.
Point Calculation Tritium 1.10E-03
HERMES-III,TA-IV
Gamma simulator used primarily for simulating the effects of prompt radiation from a nuclear burst on electronics and complete military systems.
Point Periodic Nitrogen-13 Oxygen-15
6.18E-04 6.18E-05
IBL, TAI Ion solid interaction and defect physics accelerator facility.
Point Calculation Tritium 1.00E-05
NGF, TA-I Principal production facility for neutron generators – Tritium Envelope North Wing.
Point Continuous Tritium 9.55E+00
PRD Laboratory, TA-I
Research and Development on tritium. Point Calculation NA NA
RadiationLaboratory, TA-I
Laboratory that performs small-scale experiments.
Point Calculation Tritium Nitrogen-13 Nitrogen-16 Argon-41
1.0E-05 2.0E-07 2.0E-07 1.0E-09
RMWMF, TA-III Facility that handles radioactive and mixed waste products.
Point Continuous Tritium oxide Tritium
(elemental) Americium-241
Strontium-90Cesium-137
9.52E+00 3.06E+00 1.73E-05 3.55E-07 1.01E-07
RPICL, TA-I Laboratory that performs radiation detection equipment calibration.
Point Calculation Tritium 1.70E-05
RPSD TA-II Small-scale laboratory analyses, as needed. Point Calculation NA NA START, TA-I Small-scale laboratory operation. Point Calculation Americium-241 5.00E-05 Z Facility, TA-IV
Experimental facility for research on light-ion inertial confinement fusion. Technology involves storing large amounts of electrical energy over a period of minutes and then releasing this energy in an intense, concentrated burst at a target.
Point Calculation Tritium 1.00E-03
NOTES: *Monitoring Method: Periodic = Based on periodic measurementsCalculation = Calculated from known parameters
Continuous = Based on continuous air monitoring results ACRR =Annular Core Research Reactor AHCF = Auxilliary Hot Cell Facility
Ci/yr = curies per year ECF = Explosive Components Facility HERMES-III = High Energy Radiation Megavolt Electron Source-III IBL = Ion Beam Laboratory NA = not available NESHAP = National Emission Standards for Hazardous NGF = Neutron Generator Facility Air Pollutants PRD = Process Research Development RMWMF = Radioactive and Mixed Waste Management RPICL = Radiation Protection Instrument Calibration Laboratory Facility RPSD = Radiation Protection Sample Diagnostics SNL/NM = Sandia National Laboratories, New Mexico START = Sandia Tomography and Radionuclide Transport Laboratory TA = Technical Area

2010 Annual Site Environmental Report5-14
Neutron Generator Facility (NGF) – Th e NGF is the nation’s principal production facility for neutron generators. Th is facility currently emits only tritium. Th e facility has two stacks, but only utilizes the main stack in the Tritium Envelope North Wing. In 2010, the NGF emitted 9.55 Ci of tritium, based on continuous stack monitoring. Although anticipated tritium releases do not exceed the regulatory threshold requiring continuous monitoring, it is performed voluntarily at NGF as a best management practice (BMP).
Process Research Development (PRD) Laboratory – Th is laboratory is capable of handling and conducting research on tritium materials. It is currently in standby mode and has yet to become operational; therefore, there were no emissions from the PRD laboratory in CY 2010.
Radiation Laboratory – Small-scale radiation experiments resulted in the release of air trace amounts activation products and tritium.
Radiation Protection Sample Diagnostics (RPSD) Laboratory – Small-scale radiometric sample analyses on an as-needed basis. In 2010 there were no reportable emissions.
Sandia Tomography and Radionuclide Transport (START) Laboratory – Th e START laboratory is used to perform small-scale experiments. In 2010, it received a source from a commercial vendor
FIGURE 5-5. Loca ons of the 13 Facili es at SNL/NM that Provided Radionuclide Release Inventories in 2010
Man
zano
Bas
e
Alb
uque
rque
Inte
rnat
iona
l Sun
port
N
HERMES-IIIExplosive Component Facility
Annular Core Research Reactor
Radioactive and Mixed WasteManagement Facility (RMWMF)
Z Facility
TA-IV
TA-V
TA-III
TA-II
Auxiliary Hot Cell Facility
TA-I
Radiation Lab
RP Instrument Calibration Lab
START Laboratory Neutron Generator Facility (NGF)
Not to Scale
Radiation Protection Sample Diagnostics Laboratory
Process Research Development (PRD) Laboratory
Ion Beam Laboratory

Air Quality Compliance & Meteorological Monitoring 5-15
that was contaminated on the outside of the container. It was sealed, repackaged, and returned to the vendor. Conservative release calculations arising from this activity were attributed to americium-241.
TANDEM/IBL Accelerator – Th is is an ion solid interaction and defect physics accelerator facility. In 2010, the facility was moved to a newly constructed building and will hereafter be referred to as the Ion Beam Laboratory (IBL). Operations at IBL resulted in small amounts of tritium.
TA-II SourcesExplosive Components Facility (ECF) – Th e ECF conducts destructive testing on neutron generators. In 2010, the facility reported emissions of tritium.
TA-III SourcesRadioactive and Mixed Waste Management Facility (RMWMF) – Th e RMWMF primarily handles low-level waste (LLW), mixed waste (MW), and some transuranic (TRU) waste. In 2010, the RMWMF reported tritium releases, americium-241, strontium-90, and cesium-137 as determined by continuous stack monitoring. Although anticipated tritium releases do not exceed the regulatory threshold requiring continuous monitoring, it is performed voluntarily at the RMWMF as a BMP.
TA-IV SourcesHigh Energy Radiation Megavolt Electron Source-III (HERMES-III) – Th e HERMES-III accelerator is used to test the eff ects of prompt radiation on electronics and complete military systems. Th is facility produces air activation products, primarily nitrogen-13 and oxygen-15. In 2010, the facility reported releases of nitrogen-13 and oxygen-15.
Z Facility – Th e Z Facility is an accelerator used for research on light ion inertial confi nement fusion. Large amounts of electrical energy are stored over several minutes and then released as an intense concentrated burst (shot) at a target. In 2010, the Z Facility reported small tritium releases.
TA-V Sources Annular Core Research Reactor (ACRR) – Th is reactor is used primarily to support defense program projects. Argon-41, an air activation product, was the only reported release in 2010.
Auxiliary Hot Cell Facility (AHCF) – Th e AHCF, which became operational in 2010, is used to identify, sort, characterize, and repackage legacy nuclear materials and TRU packages for permanent removal from the SNL/NM site. Legacy material may include accountable nuclear material, TRU waste, spent nuclear fuel, and radiological material. In 2010, there were trace emissions reported for a variety of radionuclides encountered in the handled waste materials.
5.4 Assessment of Poten al Dose to the Public
In general, the dose received by a person is dependent on the distance from the source, the available pathways in the environment (food chain, air, and water), radionuclide quantities and properties, and meteorological conditions. Historically, radioactive releases from SNL/NM have resulted in doses to the public that are several orders of magnitude below the EPA’s standard of 10 mrem/yr. Radiation protection standards specifi c to DOE facilities are provided in Chapter 8.
5.4.1 NESHAP Dose Assessment
Emission SourcesTo assess compliance, all NESHAP facilities at SNL/NM must submit annual facility emission data to the NESHAP Team Leader. Th e emissions from four “primary” sources (ACRR, Z Facility, NGF,

2010 Annual Site Environmental Report5-16
and the RMWMF ) are modeled using EPA’s CAA Assessment Package-1988 (CAP88) (EPA 2006) to estimate the annual dose to each of 36 identifi ed public receptors. Primary sources are those that determine their emissions by direct measurements or by calculations based on measured operational parameters.
Th e NESHAP regulation requires DOE to continuously monitor any radionuclide air emission source that has the potential to produce a dose of 0.1 mrem/yr to the MEI; however, there are no facilities at SNL/NM that exceed this criterion. As a BMP, some SNL/NM facilities perform continuous stack monitoring. Other facilities base their emission estimates on periodic confi rmatory measurements or engineering calculations. In 2010, the highest emissions were from tritium. Historically, tritium and argon-41 have been the most signifi cant contributor to the eff ective dose equivalent (EDE) of the MEI. Figure 5-6 shows the historical annual reported release (in Ci) of tritium and argon-41. Th e atmosphere contains 72 percent nitrogen, 21 percent oxygen, 0.93 percent argon, 0.03 percent carbon dioxide, and minor concentrations of neon, methane, hydrogen, helium, and krypton. Some of these constituents are susceptible to isotope transformations during high energy processes, which result in air activation products such as argon-41.
Demographic DataDemographic data includes the resident population, the number of beef and dairy cattle, and the utilized food crop area fraction for a 50-mile (mi) radius study area. Th e densities for resident population, cattle, and food crops are calculated as the quotient of the most recent county data and the county land area (e.g., cows per acre). In 2010, the NESHAP calculation for resident population was based on the State’s 2000 to 2001 estimated urban and county population data and U.S. Census Bureau data
FIGURE 5-6. Summary of Atmospheric Releases of Argon-41 and Tri um from SNL/NM Facili es from 2000 to 2010 (Emissions vary from year to year based on the opera ons conducted at the various facili es.)
18.9 16.210.6 6.7 4.5 4.9 7.0 4.0 3.9 4.5 4.1
10.14.6
15.3 18.3
1.311.5
33.226.3
123.9
9.5
22.1
0
20
40
60
80
100
120
140
2000 2002 2004 2006 2008 2010
Tota
l Cur
ies
per Y
ear (
Ci/y
r)
Calendar Year
Argon-41 (Ar-41)
Tritium (H-3)
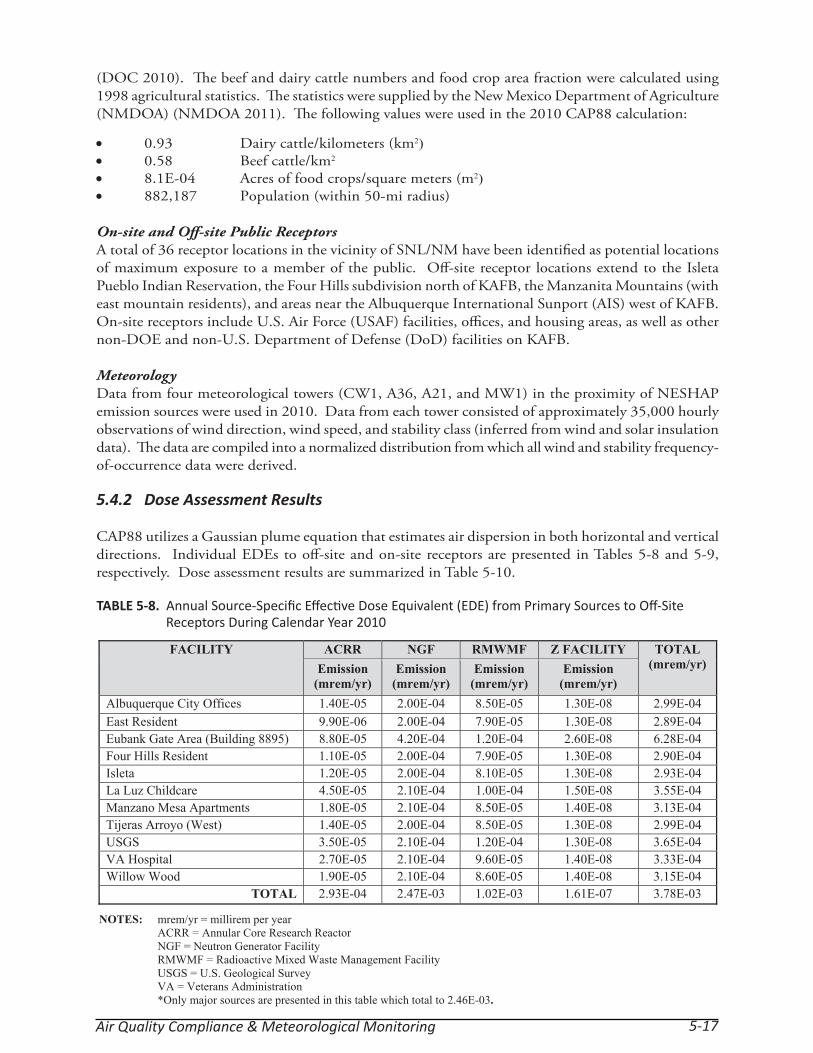
Air Quality Compliance & Meteorological Monitoring 5-17
(DOC 2010). Th e beef and dairy cattle numbers and food crop area fraction were calculated using 1998 agricultural statistics. Th e statistics were supplied by the New Mexico Department of Agriculture (NMDOA) (NMDOA 2011). Th e following values were used in the 2010 CAP88 calculation:
0.93 Dairy cattle/kilometers (km2) 0.58 Beef cattle/km2
8.1E-04 Acres of food crops/square meters (m2) 882,187 Population (within 50-mi radius)
On-site and Off -site Public ReceptorsA total of 36 receptor locations in the vicinity of SNL/NM have been identifi ed as potential locations of maximum exposure to a member of the public. Off -site receptor locations extend to the Isleta Pueblo Indian Reservation, the Four Hills subdivision north of KAFB, the Manzanita Mountains (with east mountain residents), and areas near the Albuquerque International Sunport (AIS) west of KAFB. On-site receptors include U.S. Air Force (USAF) facilities, offi ces, and housing areas, as well as other non-DOE and non-U.S. Department of Defense (DoD) facilities on KAFB.
MeteorologyData from four meteorological towers (CW1, A36, A21, and MW1) in the proximity of NESHAP emission sources were used in 2010. Data from each tower consisted of approximately 35,000 hourly observations of wind direction, wind speed, and stability class (inferred from wind and solar insulation data). Th e data are compiled into a normalized distribution from which all wind and stability frequency-of-occurrence data were derived.
5.4.2 Dose Assessment Results
CAP88 utilizes a Gaussian plume equation that estimates air dispersion in both horizontal and vertical directions. Individual EDEs to off -site and on-site receptors are presented in Tables 5-8 and 5-9, respectively. Dose assessment results are summarized in Table 5-10.
TABLE 5-8. Annual Source-Specifi c Eff ec ve Dose Equivalent (EDE) from Primary Sources to Off -Site Receptors During Calendar Year 2010
FACILITY ACRR NGF RMWMF Z FACILITY TOTAL (mrem/yr) Emission
(mrem/yr) Emission
(mrem/yr) Emission
(mrem/yr) Emission
(mrem/yr) Albuquerque City Offices 1.40E-05 2.00E-04 8.50E-05 1.30E-08 2.99E-04 East Resident 9.90E-06 2.00E-04 7.90E-05 1.30E-08 2.89E-04 Eubank Gate Area (Building 8895) 8.80E-05 4.20E-04 1.20E-04 2.60E-08 6.28E-04 Four Hills Resident 1.10E-05 2.00E-04 7.90E-05 1.30E-08 2.90E-04 Isleta 1.20E-05 2.00E-04 8.10E-05 1.30E-08 2.93E-04 La Luz Childcare 4.50E-05 2.10E-04 1.00E-04 1.50E-08 3.55E-04 Manzano Mesa Apartments 1.80E-05 2.10E-04 8.50E-05 1.40E-08 3.13E-04 Tijeras Arroyo (West) 1.40E-05 2.00E-04 8.50E-05 1.30E-08 2.99E-04 USGS 3.50E-05 2.10E-04 1.20E-04 1.30E-08 3.65E-04 VA Hospital 2.70E-05 2.10E-04 9.60E-05 1.40E-08 3.33E-04 Willow Wood 1.90E-05 2.10E-04 8.60E-05 1.40E-08 3.15E-04
TOTAL 2.93E-04 2.47E-03 1.02E-03 1.61E-07 3.78E-03
NOTES: mrem/yr = millirem per year ACRR = Annular Core Research Reactor NGF = Neutron Generator Facility RMWMF = Radioactive Mixed Waste Management Facility USGS = U.S. Geological Survey VA = Veterans Administration
*Only major sources are presented in this table which total to 2.46E-03.
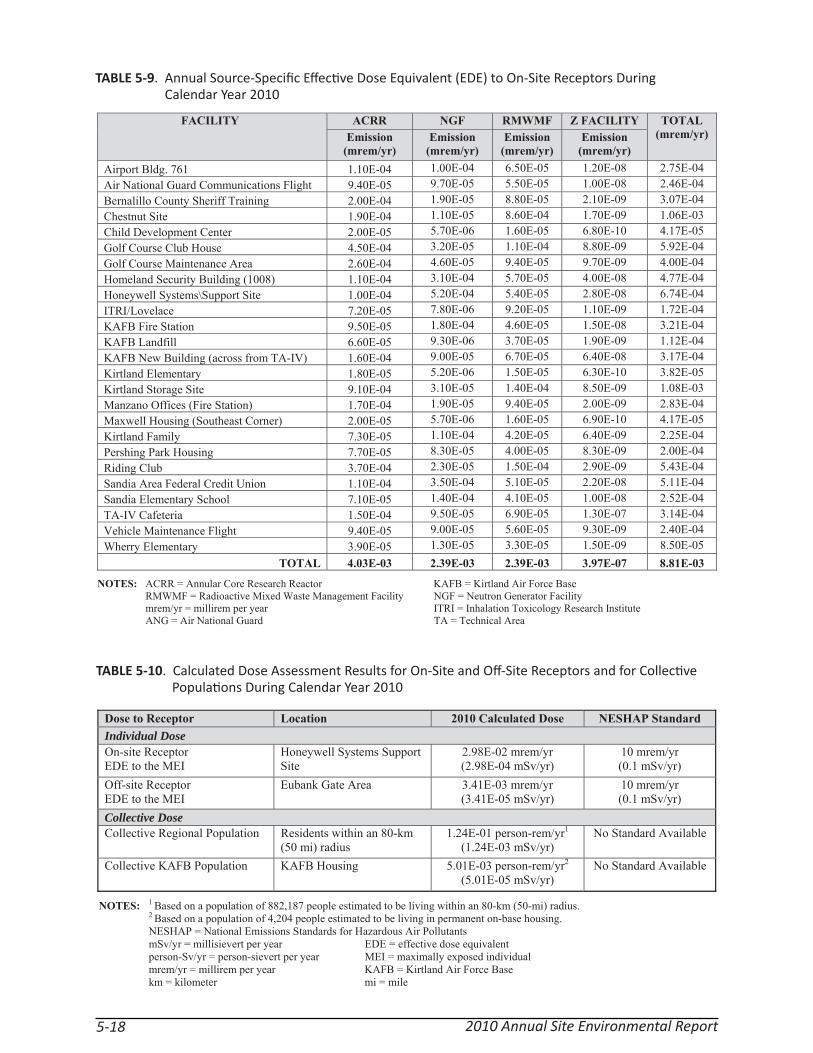
2010 Annual Site Environmental Report5-18
TABLE 5-10. Calculated Dose Assessment Results for On-Site and Off -Site Receptors and for Collec ve Popula ons During Calendar Year 2010
Dose to Receptor Location 2010 Calculated Dose NESHAP Standard Individual Dose On-site Receptor EDE to the MEI
Honeywell Systems Support Site
2.98E-02 mrem/yr (2.98E-04 mSv/yr)
10 mrem/yr (0.1 mSv/yr)
Off-site Receptor EDE to the MEI
Eubank Gate Area 3.41E-03 mrem/yr (3.41E-05 mSv/yr)
10 mrem/yr (0.1 mSv/yr)
Collective Dose Collective Regional Population Residents within an 80-km
(50 mi) radius 1.24E-01 person-rem/yr1
(1.24E-03 mSv/yr) No Standard Available
Collective KAFB Population KAFB Housing 5.01E-03 person-rem/yr2
(5.01E-05 mSv/yr) No Standard Available
NOTES: 1 Based on a population of 882,187 people estimated to be living within an 80-km (50-mi) radius. 2 Based on a population of 4,204 people estimated to be living in permanent on-base housing. NESHAP = National Emissions Standards for Hazardous Air Pollutants mSv/yr = millisievert per year EDE = effective dose equivalent person-Sv/yr = person-sievert per year MEI = maximally exposed individual
mrem/yr = millirem per year KAFB = Kirtland Air Force Base km = kilometer mi = mile
TABLE 5-9. Annual Source-Specifi c Eff ec ve Dose Equivalent (EDE) to On-Site Receptors During Calendar Year 2010
FACILITY ACRR NGF RMWMF Z FACILITY TOTAL(mrem/yr) Emission
(mrem/yr)Emission
(mrem/yr) Emission
(mrem/yr) Emission
(mrem/yr) Airport Bldg. 761 1.10E-04 1.00E-04 6.50E-05 1.20E-08 2.75E-04 Air National Guard Communications Flight 9.40E-05 9.70E-05 5.50E-05 1.00E-08 2.46E-04 Bernalillo County Sheriff Training 2.00E-04 1.90E-05 8.80E-05 2.10E-09 3.07E-04 Chestnut Site 1.90E-04 1.10E-05 8.60E-04 1.70E-09 1.06E-03 Child Development Center 2.00E-05 5.70E-06 1.60E-05 6.80E-10 4.17E-05 Golf Course Club House 4.50E-04 3.20E-05 1.10E-04 8.80E-09 5.92E-04 Golf Course Maintenance Area 2.60E-04 4.60E-05 9.40E-05 9.70E-09 4.00E-04 Homeland Security Building (1008) 1.10E-04 3.10E-04 5.70E-05 4.00E-08 4.77E-04 Honeywell Systems\Support Site 1.00E-04 5.20E-04 5.40E-05 2.80E-08 6.74E-04 ITRI/Lovelace 7.20E-05 7.80E-06 9.20E-05 1.10E-09 1.72E-04 KAFB Fire Station 9.50E-05 1.80E-04 4.60E-05 1.50E-08 3.21E-04 KAFB Landfill 6.60E-05 9.30E-06 3.70E-05 1.90E-09 1.12E-04 KAFB New Building (across from TA-IV) 1.60E-04 9.00E-05 6.70E-05 6.40E-08 3.17E-04 Kirtland Elementary 1.80E-05 5.20E-06 1.50E-05 6.30E-10 3.82E-05 Kirtland Storage Site 9.10E-04 3.10E-05 1.40E-04 8.50E-09 1.08E-03 Manzano Offices (Fire Station) 1.70E-04 1.90E-05 9.40E-05 2.00E-09 2.83E-04 Maxwell Housing (Southeast Corner) 2.00E-05 5.70E-06 1.60E-05 6.90E-10 4.17E-05 Kirtland Family 7.30E-05 1.10E-04 4.20E-05 6.40E-09 2.25E-04 Pershing Park Housing 7.70E-05 8.30E-05 4.00E-05 8.30E-09 2.00E-04 Riding Club 3.70E-04 2.30E-05 1.50E-04 2.90E-09 5.43E-04 Sandia Area Federal Credit Union 1.10E-04 3.50E-04 5.10E-05 2.20E-08 5.11E-04 Sandia Elementary School 7.10E-05 1.40E-04 4.10E-05 1.00E-08 2.52E-04 TA-IV Cafeteria 1.50E-04 9.50E-05 6.90E-05 1.30E-07 3.14E-04 Vehicle Maintenance Flight 9.40E-05 9.00E-05 5.60E-05 9.30E-09 2.40E-04 Wherry Elementary 3.90E-05 1.30E-05 3.30E-05 1.50E-09 8.50E-05
TOTAL 4.03E-03 2.39E-03 2.39E-03 3.97E-07 8.81E-03
NOTES: ACRR = Annular Core Research Reactor KAFB = Kirtland Air Force Base RMWMF = Radioactive Mixed Waste Management Facility NGF = Neutron Generator Facility
mrem/yr = millirem per year ITRI = Inhalation Toxicology Research Institute ANG = Air National Guard TA = Technical Area

Air Quality Compliance & Meteorological Monitoring 5-19
Th e total dose at each receptor location is determined by summing the individual doses resulting from each source. Th e dose to the MEI member of the public is then compared to the EPA limit of 10 mrem/yr.
Th e on-site MEI dose of 2.98E-02 millirems per year (mrem/yr) at the Honeywell Systems Support Site resulted primarily from conservatively calculated releases of americium-241 from the nearby Sandia Tomography and Radionuclide Transport Laboratory (START) Laboratory. In CY 2010 an americium-241 source for research was received at the START Laboratory with contamination on the outside of the vial. After numerous attempts at decontamination, the source was unable to be suffi ciently decontaminated to permit use of the source for the desired application. Th erefore, the source was returned to the vendor in the packing material received. Th e source was double bagged and no contamination existed on the outside of the bags when returned. Nevertheless, conservative release calculations arising from this activity were attributed to americium-241. Th e off -site MEI was located at the Eubank Gate Area. Th e MEI of 3.41E-03 mrem/yr at the Eubank Gate Area resulted also primarily from conservatively calculated releases of americium-241 from the nearby START Laboratory.
By comparison, the average person in the Albuquerque area receives 330 to 530 mrem/yr resulting primarily from radon emanating from earth materials, medical procedures, consumer products, and cosmic radiation (Brookins 1992).
Collective DoseTh e collective population dose resulting from all SNL/NM radiological emissions was calculated for both KAFB and the regional area (Table 5-10). Collective dose calculations are not required by NESHAP regulations; however, it provides a useful numerical comparison of the public dose from year to year. Collective dose is calculated by multiplying a representative individual dose within a population, by the total population. Sandia calculates the collective population dose for both the KAFB housing areas and the general Albuquerque area population within an 50-mi radius.
Regional Th e Albuquerque regional collective population dose in 2010 was 1.24E-01 person-mrem/yr. Th is is comparable with the average over the past fi ve years of regional collective population dose data. For the purpose of calculating the collective dose, all releases are assumed to occur from a location centered in TA-V. Th e population dose was calculated by multiplying 882,187 residents by doses per sector.
KAFB A collective population dose for KAFB residents was calculated based on three main housing areas (Maxwell, Pershing Park, and Kirtland Family). Housing demolition and new housing construction at KAFB resulted in fewer residential structures during 2010. However, the overall population increased as additional new housing was completed. Th e total population dose for KAFB was obtained by summing the three areas based upon a total residential population of 4,204. Th e CY 2010 calculation resulted in an estimated population dose of 5.01E-03 person-mrem/yr.
5.5 Air Compliance Requirements & Compliance Strategies
Air quality standards are implemented by regulations promulgated by local and federal governments in accordance with the CAA and the CAA Amendments (CAAA) of 1990. Th e Albuquerque Bernalillo County Air Quality Control Board (ABC/AQCB), the State of New Mexico, and the EPA determine applicable air quality standards for non-radiological pollutants. Radionuclide air emissions are currently regulated by the EPA under NESHAP, as discussed in Section 5.4.1. A complete list of air quality regulations applicable to SNL/NM is provided in Chapter 8.

2010 Annual Site Environmental Report5-20
5.5.1 SNL/NM Air Emission Sources
As discussed in Section 5.2.1, criteria pollutants include sulfur dioxide, nitrogen oxide, carbon monoxide, ozone, PM, and lead. For these criteria and other pollutants, the EPA:
• Sets ambient air quality standards – including those for motor vehicle emissions,
• Requires state implementation plans for protection and improvement of air quality,
• Institutes air quality programs to prevent the nation’s air from deteriorating, and
• Establishes hazardous air pollutant (HAP) control programs.
EPA standards for criteria pollutants are given in 40 CFR 50, NAAQS and implemented in (20.11.8 NMAC). NMAAQS with criteria pollutant standards for ambient air is met through on-going applicability determinations on potential criteria pollutant emission sources that require the following: acquisition of the necessary permits and registrations for applicable sources from the appropriate regulatory agencies; fuel throughput tracking, monitoring, and reporting; ambient air surveillance; and periodic direct emission sampling. As discussed previously, ambient air measurements taken in the vicinity of SNL/NM facilities have been well below maximum threshold limit values (TLV) and standards for criteria pollutants.
Th e signifi cant sources of criteria pollutants at SNL/NM are defined as sources that require a permit or registration from a regulatory agency.
A majority of the permits and registrations held by SNL/NM are multi-source (including a combination of criteria pollutant emission sources). Th e DOE NNSA Sandia Site Offi ce (SSO) and the AQC program has started to work with the COA to assure that we have only one permit or registration for combustion sources per building. Th is is to better align with the current regulations and requirements. During CY 2010, there are several new boiler registrations that were issued as part of this eff ort. It is anticipated that this task will be completed by the end of CY 2011. Signifi cant sources at SNL/NM are listed, below.
BoilersDuring CY 2010, SNL/NM maintained 21 permits and registrations for applicable boilers site wide. Table 5-11 illustrates the annual fuel usage and associated emissions for CY 2010. Th e boilers associated with the permits and registrations are shown in Table 5-12.
During CY 2010, the Steam Plant was demolished during the spring of 2010. Th is completed the phase out of the steam plant boilers and the Heating System Modernization (HSM) project entirely.
Emergency GeneratorsDuring CY 2010, SNL/NM maintained 11 permits and registrations for applicable generators site wide. Table 5-13 illustrates the annual hours of operation and associated emissions for CY 2010. Th e generators associated with the permits and registrations are shown in Table 5-14.
Chemical Usage During CY 2010, SNL/NM maintained ten permits and registrations for applicable HAPs chemical usage site wide. Th e HAP chemical usage associated with the permits and registrations is for general laboratory usage for R&D purposes. Table 5-15 illustrates the amount of chemicals purchased at the associated facility for CY 2010. Th e facilities that have permits or registrations for chemical usages are listed in Table 5-16.

Air Quality Compliance & Meteorological Monitoring 5-21
Miscellaneous New Source Review (NSR) PermitsTh e document disintegrator is an industrial-size, classified document shredder. Th ere is one pollutant of concern with this permit, which is particulate emissions. Th e document disintegrator operated 363 hours in CY 2010 which calculated an estimated 2.2 tons of total suspended particulate (TSP). Th e process input rate of material was 62.5 percent below the permitted limit.
Th e Th ermal Test Complex (TTC) is an enclosed R&D fire test complex and an important element in the revitalization of SNL/NM test capabilities needed for test article qualifi cation, development, surveillance, investigation, and modeling. Th ere were no operations at this facility during CY 2010 that contributed to any air emissions.
Open Burn Permits Open burn permits are required for:
• Disposal of Explosives by Burning (avoids the hazards of transport and handling),
• Aboveground Detonation of Explosives (over 20 pounds [lb]),
• Burning Liquid Fuel (2,000 gallons [gal] or more, or solid fuel of 5,000 lb in a single event, R&D activity), and
• Igniting Rocket Motors (with greater than 4,000 lb of fuel).
A list of 2010 permits can be found in Chapter 8, Table 8-1.
TABLE 5-11. Boiler Usage and Emission Data During Calendar Year 2010Permit # Fuel Usage
(scf)Emissions (tpy)
NOx CO PM10 SO2 VOC374-M2 9,381,119 0.23 0.39 0.04 0.008 0.03 R#936-M1 14,100,782 0.71 0.59 0.05 0.01 0.04 R#1406-M1 4,151,839 0.10 0.17 0.02 1.3E-03 1.1E-02 #1725 7,719,428 0.39 0.32 0.03 0.0005 0.02 #1820 32,702,800 0.82 1.37 0.12 0.03 0.09 R#1823 9,808,562 0.49 0.41 0.04 0.003 0.03 #1830 130,801,290 3.3 5.5 0.5 0.1 0.4 R#2109 1,012,114 2.5E-02 4.3E-02 3.8E-03 9.1E-04 2.8E-03 R#2110 1,566,092 3.9E-02 6.6E-02 6.0E-03 1.4E-03 4.3E-03 R#2111 1,795,200 4.5E-02 7.5E-02 6.8E-03 1.6E-03 4.9E-03 R#2112 1,123,472 2.8E-02 4.7E-02 4.3E-03 1.0E-03 3.1E-03 R#2113 2,429,731 6.1E-02 1.0E-01 9.2E-03 2.2E-03 6.7E-03 R#2114 553,281 1.4E-02 2.3E-02 2.1E-03 5.0E-04 1.5E-03 R#2115 712,606 1.8E-02 3.0E-02 2.7E-03 6.4E-04 2.0E-03 R#2116 1,815,017 4.5E-02 7.6E-02 6.9E-03 1.6E-03 5.0E-03 R#2117 393,577 9.8E-03 1.7E-02 1.5E-03 3.5E-04 1.1E-03 R#2118 451,491 1.1E-02 1.9E-02 1.7E-03 4.1E-04 1.2E-03 R#2119 354,536 8.9E-03 1.5E-02 1.3E-03 3.2E-04 9.7E-04 R#2120 1,055,825 2.6E-02 4.4E-02 4.0E-03 9.5E-04 2.9E-03 R#2121 537,409 1.3E-02 2.3E-02 2.0E-03 4.8E-04 1.5E-03 R#2122 731,151 1.8E-02 3.1E-02 2.8E-03 6.6E-04 2.0E-03
NOTES: tpy = tons per year scf = standard cubic feet NOx = nitrogen oxide CO = carbon monoxide PM10 = Particulate Matter (diameter equal to or less than 10 microns) SO2 = sulfur dioxide VOC = Volatile Organic Compound

2010 Annual Site Environmental Report5-22
TABLE 5-12. Boilers Associated with Permits and Registra ons During Calendar Year 2010
Permit Description Size Fuel Type
374-M2 Neutron Generator Production Facility (NGPF) Boilers used to heat the facility.
Six (6) 2 MMBtu/hr
Natural Gas
R#547 Explosives Components Facility (ECF) Boilers used to heat the facility.
Two (2) 4.3437 MMBtu/hr
Natural Gas
R#936-M1 Processing and Environmental Technology Laboratory (PETL) Boilers used to heat the facility.
Ten (10) 1.4 MMBtu/hr
Natural Gas
R#1406-M1 Advanced Manufacturing Prototype Facility (AMPF) Boilers used to heat the facility.
Two (2) 1.8 MMBtu/hr
Natural Gas
1725 Center for Integrated Nanotechnologies (CINT) Boilers used to heat the facility.
Two (2) 6 MMBtu/hr
Natural Gas
1820 Microsystems and Engineering Sciences Applications (MESA) Complex Boilers used to heat the facility.
Two (2) 20.412 MMBtu/hr
Natural Gas
One (1) 10.206 MMBtu/hr
1823 Weapons Integration Facility (WIF) Boilers used to heat the facility
Two (2) 8.17 MMBtu/hr
Natural Gas
One (1) 3.68 MMBtu/hr
1830 HSM Boilers used to heat buildings in TA-I, and will eventually allow for the decommissioning of the Steam Plant Boilers. Starting in CY 2010, the Air Quality Compliance (AQC) Program has been working with the City of Albuquerque (COA) to break this permit apart into individual building registrations as applicable. The COA has indicated that the structure of this permit does not meet the foundation of the COA air quality regulations. Buildings that do not support one another cannot be grouped into one individual permit. This is not a violation, however the COA would like for this to be corrected.
Seventy-Two (72) 2.0 MMBtu/hr or less
Natural Gas
R#2109 Building 802 boilers used to heat the facility Three (3) 2 MMBtu/hr
Natural Gas
R#2110 Building 804 boilers used to heat the facility Four (4) 2 MMBtu/hr
Natural Gas
R#2111 Building 810 boilers used to heat the facility Three (3) 2 MMBtu/hr
Natural Gas
R#2112 Building 823 boilers used to heat the facility Three (3) 2 MMBtu/hr
Natural Gas
R#2113 Building 840 boilers used to heat the facility Four (4) 2 MMBtu/hr
Natural Gas

Air Quality Compliance & Meteorological Monitoring 5-23
Permit Description Size Fuel Type
R#2114 Building 857 boilers used to heat the facility Two (2) 1.3 MMBtu/hr
Natural Gas
Two (2) 1.1001 MMBtu/hr
R#2115 Building 860 boilers used to heat the facility Two (2) 1.3 MMBtu/hr
Natural Gas
R#2116 Building 880 boilers used to heat the facility Four (4) 2 MMBtu/hr
Natural Gas
Two (2) 0.28 MMBtu/hr
R#2117 Building 890 boilers used to heat the facility Three (3) 2 MMBtu/hr
Natural Gas
R#2118 Building 887 boilers used to heat the facility Three (3) 2 MMBtu/hr
Natural Gas
R#2119 Building 891 boilers used to heat the facility Three (3) 2 MMBtu/hr
Natural Gas
R#2120 Building 892 boilers used to heat the facility Three (3) 2 MMBtu/hr
Natural Gas
R#2121 Building 894 boilers used to heat the facility Three (3) 2 MMBtu/hr
Natural Gas
Two (2) 1.001 MMBtu/hr
Two (2) 1.3 MMBtu/hr
R#2122 Building 897 boilers used to heat the facility Three (3) 2 MMBtu/hr
Natural Gas
NOTES: MMBtu/hr = Million British Thermal Units per hour TA = technical area CY = Calendar Year HSM = Heating System Modernization
TABLE 5-12. Boilers Associated with Permits and Registra ons During Calendar Year 2010 (concluded)

2010 Annual Site Environmental Report5-24
TABLE 5-13. Generator Hours and Emission Data During Calendar Year 2010
PermitNumber
Hours/ CY 2010
Emissions (tpy)
NOx CO PM10 SO2 VOC
#374-M2 22 2.0E-01 4.2E-02 1.4E-02 1.3E-02 1.6E-02
#402a 9.5 3.9E-01 1.0E-01 7.0E-03 4.9E-02 1.1E-02
10.8
10.9
12.2
#415-M2 7.1 2.1E-02 4.5E-03 1.5E-03 1.4E-03 1.7E-03
#924 26 2.3E-01 6.2E-02 4.2E-03 3.0E-02 6.6E-03
#925-M1 7 5.3E-02 1.4E-02 9.4E-04 4.8E-03 1.5E-03
#1678-M1 14 1.6E-01 4.2 E-02 1.5E-02 1.4E-02 1.8E-02
14 2.5E-01 6.7E-02 2.4E-02 3.8E-03 2.8E-02
#1725 23 1.2E-01 2.7E-02 8.9E-03 8.3E-03 9.9E-03
#1828 9.5 8.6E-02 2.0E-02 2.5E-03 2.9E-02 2.5E-03
#1900b 10.2 1.3E-02 1.1E-02 5.8E-04 4.1E-03 N/A
#1930b 1.9 1.16E-03 7.68E-04 6.23E-05 1.93E-04 N/A
#2097b 0 0 0 0 0 0
NOTES: a The emission limits stated in the permit are combined emissions, therefore they are calculated annually as a summed emission for all four units.
b City of Albuquerque has started issuing generator permits with combined NOx and VOC emissions. Permit #1900 is the first permit to have this combination for Sandia.
tpy = tons per year CY = calendar year N/A = not applicable NOx = nitrogen oxide CO = carbon monoxide PM10 = Particulate Matter (diameter equal to or less than 10 microns) SO2 = sulfur dioxide VOC = Volatile Organic Compound
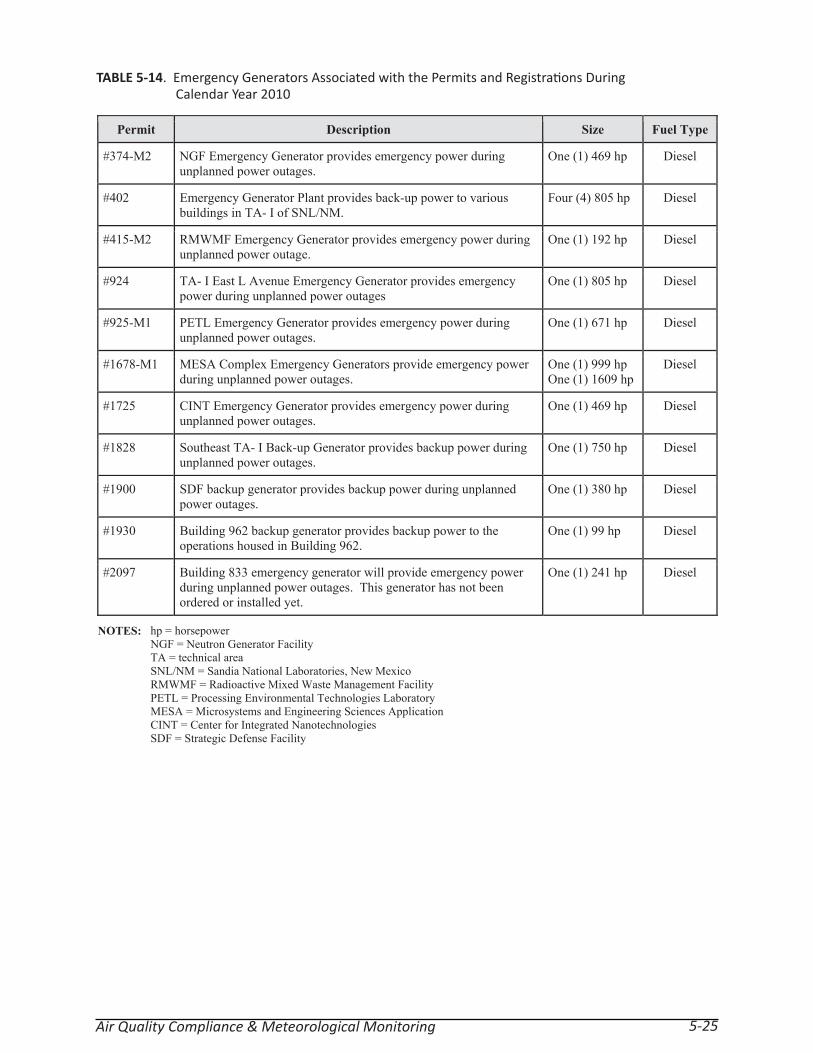
Air Quality Compliance & Meteorological Monitoring 5-25
TABLE 5-14. Emergency Generators Associated with the Permits and Registra ons During Calendar Year 2010
Permit Description Size Fuel Type
#374-M2 NGF Emergency Generator provides emergency power during unplanned power outages.
One (1) 469 hp Diesel
#402 Emergency Generator Plant provides back-up power to various buildings in TA- I of SNL/NM.
Four (4) 805 hp Diesel
#415-M2 RMWMF Emergency Generator provides emergency power during unplanned power outage.
One (1) 192 hp Diesel
#924 TA- I East L Avenue Emergency Generator provides emergency power during unplanned power outages
One (1) 805 hp Diesel
#925-M1 PETL Emergency Generator provides emergency power during unplanned power outages.
One (1) 671 hp Diesel
#1678-M1 MESA Complex Emergency Generators provide emergency power during unplanned power outages.
One (1) 999 hp One (1) 1609 hp
Diesel
#1725 CINT Emergency Generator provides emergency power during unplanned power outages.
One (1) 469 hp Diesel
#1828 Southeast TA- I Back-up Generator provides backup power during unplanned power outages.
One (1) 750 hp Diesel
#1900 SDF backup generator provides backup power during unplanned power outages.
One (1) 380 hp Diesel
#1930 Building 962 backup generator provides backup power to the operations housed in Building 962.
One (1) 99 hp Diesel
#2097 Building 833 emergency generator will provide emergency power during unplanned power outages. This generator has not been ordered or installed yet.
One (1) 241 hp Diesel
NOTES: hp = horsepower NGF = Neutron Generator Facility TA = technical area SNL/NM = Sandia National Laboratories, New Mexico RMWMF = Radioactive Mixed Waste Management Facility PETL = Processing Environmental Technologies Laboratory MESA = Microsystems and Engineering Sciences Application CINT = Center for Integrated Nanotechnologies SDF = Strategic Defense Facility

2010 Annual Site Environmental Report5-26
TABLE 5-15. HAP Chemical Usage Reportable Data During Calendar Year 2010
Permit # Pounds/Year Tons/Year
#374-M2 48 2.4E-02
R#936 955 5.0E-01
R#1406 2.5 1.3E-03
R#1888 588 2.9E-01
R#1901 110 2.2E-01
R#1902 31 2.0E-02
R#1903 0.05 3.0E-05
R#1905 0.0 0.0
R#1906 506 2.1E-01
NOTES: HAP = hazardous air pollutant
TABLE 5-16. Facili es with Permits or Registra ons for Chemical Use During Calendar Year 2010
Permit # Description Chemical Type
#374-M2 NGPF general chemical exhaust from fume hoods HAP, VOC
R#547 ECF general chemical exhaust from fume hoods HAP, VOC
R#936-M1 PETL general chemical exhaust from fume hoods HAP, VOC
R#1406 AMPF general chemical exhaust from fume hoods HAP, VOC
R#1888 AMPL general chemical exhaust from fume hoods HAP, VOC
R#1901 Miscellaneous Buildings general chemical exhaust from fume hoods
HAP, VOC
R#1902 TWT general chemical exhaust from fume hoods HAP, VOC
R#1903 Solar Tower general chemical exhaust from fume hoods
HAP, VOC
R#1905 EHL general chemical exhaust from fume hoods HAP, VOC
R#1906 AML general chemical exhaust from fume hoods HAP, VOC
NOTES: NGPF = Neutron Generator Production Facility ECF = Explosive Components Facility
PETL = Processing Environmental Technologies Laboratory AMPF = Advanced Manufacturing Prototyping Facility TWT = Trisonic Wind Tunnel EHL = Environmental Health Laboratory AMPL = Advanced Manufacturing Process Laboratory AML = Advanced Materials Laboratory HAP = hazardous air pollutant VOC = Volatile Organic Compounds

Air Quality Compliance & Meteorological Monitoring 5-27
Fugitive DustAs required by 20.11.20 NMAC, Fugitive Dust Control, DOE obtains fugitive dust permits for each of Sandia’s applicable projects that will disturb greater than ¾ acre of soil. For a list of 2010 permits refer to Chapter 8, Table 8-1 of this report.
VehiclesTh e majority of government vehicles at SNL/NM are owned and managed by the General Services Administration (GSA). All GSA vehicles must comply with the same emission standards set for all personal and non-personal vehicles that are issued KAFB vehicle passes. As required by 20.11.100 NMAC, Motor Vehicle Inspection Decentralized, Sandia submits an annual vehicle inventory update and inspection plan to the COA for the applicable SNL/NM owned vehicles.
5.5.2 Title V
Th e CAAA of 1990 contained provisions under Title V requiring all existing major air emission sources to obtain an operating permit. A major source is defi ned as the combined emissions from any facility with the potential to emit:
• 100 tons per year (tpy) or greater of any criteria pollutant, 100,000 carbon dioxide equivalent greenhouse gas (GHG) emissions,
• 10 tpy of any single HAP, and
• 25 tpy of any combination of HAPs.
BackgroundTh e DOE/NNSA/SSO submitted Operating Permit application 515 (DOE 2002) on March 1, 1996, since potential emissions for SNL/NM were greater than 100 tpy of criteria pollutants. Th e COA has yet to issue the final permit. An updated application is currently being negotiated with the COA.
Greenhouse Gas EmissionsOn May 13, 2010, the EPA issued a fi nal rule that establishes a common sense approach to addressing greenhouse gas emissions from stationary sources under the CAA permitting programs. Th is fi nal rule sets thresholds for GHG emissions that defi ne when permits under the NSR Prevention of Signifi cant Deterioration (PSD) and Title V Operating Permit programs are required for new and existing industrial facilities.
Th e CAA permitting program emissions thresholds for criteria pollutants such as lead, sulfur dioxide, and nitrogen oxide , are 100 and 250 tpy. While these thresholds are appropriate for criteria pollutants, they are not feasible for GHGs because GHGs are emitted in much higher volumes. EPA will phase in the CAA permitting requirements for GHGs in two initial steps. Operations at SNL/NM will become applicable in the second step, with deadline dates between July 1, 2011 and June 30, 2013. Operating permit requirements will, for the fi rst time, apply to sources based on their GHG emissions even if they would not apply based on emissions of any other pollutant. Facilities that emit at least 100,000 tpy carbon dioxide equivalent will be subject to Title V permitting requirements.
SNL/NM personnel will have to update the current Title V Operating Permit application to include the GHG carbon dioxide equivalent emissions. During CY 2010, there was a calculated total of 194,020 tpy carbon dioxide equivalent (including fugitive GHG emissions) that would apply to the Title V permit. Th e application will be updated with submission planned for CY 2012.
2010 Annual Site Environmental Report5-28
Permit Fee StructureTh e COA regulations require source owners to pay air emission fees, which are implemented under 20.11.2 NMAC, Fees. Th e sources included in the fee determination for SNL/NM include the COA NSR permitted and registered sources, as summarized in Chapter 8, Table 8-1. Total fees are based on the permitted emission limits that are requested in the NSR permit/registration applications, which are incorporated into the issued NSR permit/registration. In 2010, Sandia paid an annual fee of $11,296 based on a rate of $31 per ton of permitted emissions.
Stratospheric Ozone ProtectionTitle VI of the CAAA of 1990 required EPA to establish regulations to phase out the production and consumption of ozone depleting substances (ODS). ODSs are defi ned as chlorofl uorocarbons, hydrochlorofl uorocarbons, and other halogenated chemicals that have been found to contribute to the depletion of the stratospheric ozone layer. EPA has established regulations in 40 CFR Part 82 that require the following: recycling of ODSs during servicing of equipment; establishment of requirements for recycling and recovery equipment, technicians, and reclaimers; repair of substantial leaks in refrigeration equipment containing greater than 50 lbs of refrigerant; and establishment of safe disposal standards.
At SNL/NM, ODSs are mainly used for comfort cooling for buildings, air conditioning units in vehicles, and water cooling units in drinking fountains. Halon is contained in some fi re suppression systems and some fi re extinguishers.
Sandia remains committed to the reduction of ODSs and has been working towards replacing Class I refrigerant chillers with a cooling capacity of 150 tons or greater—a secretarial goal set by the DOE. Replacement is part of a larger upgrade to improve the reliability and overall effi ciency of the associated chilled water systems. Th ere are currently 100 refrigerant chillers greater than 50 lbs that exist at SNL/NM. Of the existing chillers, two of those contain Class I refrigerants and are on the list for replacement.
5.5.3 Compliance Strategies
DOE/NNSA/SSO and Sandia have met the conditions of its permits and registrations.
Sandia National Laboratories, New Mexico (SNL/NM) conducts effl uent monitoring through wastewater, surface water, storm water monitoring and surveillance programs. Sandia Corporation (Sandia) complies with water quality regulations established by local, state, and federal agencies. U.S. Environmental Protection Agency (EPA) standards are implemented at the state and local level by the New Mexico Environment Department (NMED) and the Albuquerque Bernalillo County Water Utility Authority (ABCWUA). Currently, EPA Region VI implements storm water regulations under the National Pollutant Discharge Elimination System (NPDES). Sandia also adheres to the water quality guidelines contained in U.S. Department of Energy (DOE) Orders 450.1A, Environmental Protection Program (DOE 2008a) and 5400.5, Chg 2, Radiation Protection of the Public and the Environment (DOE 1993).
6.1 Wastewater Discharge Program
Wastewater that is discharged to the public sewer system from SNL/NM facilities is divided into two categories: sanitary discharges and industrial discharges. Sanitary discharges include wastewater from restrooms and showers, food service establishments, and other domestic-type activities. Industrial discharges are produced from general laboratory research operations, including electroplating, metal fi nishing, microelectronic development, and photographic processes.
Sandia closely monitors its liquid effl uent discharges to meet regulatory compliance. Sandia further reduces its toxic discharges by implementing Toxic Organic Management Plans (TOMP), general good housekeeping, and engineering practices. Pollution Prevention (P2) measures are implemented to reduce, substitute, or eliminate toxic chemicals, where feasible, as discussed in Chapter 3, Section 3.4 of this report.
6.1.1 SNL/NM and the ABCWUA
ABCWUA Publicly-Owned Treatment Works (POTW) SNL/NM’s sewer system connects to the ABCWUA’s sanitary sewer system through six permitted outfalls (Figure 6-1). It should be noted that SNL/NM Station WW007 (Permit 2069G) for activities conducted at the Microelectronics Development Laboratory (MDL) is upstream of the fi nal discharge location, Station WW001 (Permit 2069A). Wastewater effl uent discharged from any of the six outfalls must meet the ABCWUA’s Sewer Use and Wastewater Control Ordinance (SUWCO) requirements. Information on the ABCWUA SUWCO requirements can be found at the American Legal Publishing Corporation’s website:
www.amlegal.com/albuquerque_nm/
During 2010 SNL/NM met effl uent discharge standards established by ABCWUA’s SUWCO at fi ve of its six permitted outfalls. Th e discharge limit of 0.051 milligrams per liter (mg/L) for arsenic was exceeded (0.121 mg/L) at the ABCWUA permitted outfall 2069G on April 20, 2010. Th e source of the release was determined to be activities associated with the cleaning procedure of metalorganic chemical vapor deposition (MOCVD) tools that generate arsenic deposits. Th e MOCVD equipment process records indicated a cleaning procedure was performed on the stainless steel vacuum lines on
Water Quality
Wastewater, Surface Discharge, Stormwater Monitoring, Oil Storage & Spill Control 6-1

April 20, 2010. Th e cleaning solution uses a basic mixture of ammonium hydroxide and hydrogen peroxide to dissolve arsenic-containing deposits from stainless steel parts. Th e equipment process records suggest that when the cleaning was completed on April 20, 2010, approximately 11 liters of arsenic-contaminated cleaning solution was released to the sanitary sewer system that drains to the Acid Waste Neutralization (AWN) system under Station WW007 (Permit 2069G). Th e cleaning solution was adjusted for potential hydrogen (pH), but the arsenic concentration remained untreated. Future discharges will require neutralization after the cleaning process prior to discharge to the existing arsenic removal system. Until these modifi cations are installed all liquid effl uent from MOCVD equipment cleaning activities that may contain arsenic compounds will be captured and disposed of as hazardous waste.
Wastewater Compliance Awards Th e ABCWUA’s reporting requirements are defi ned under its SUWCO. Th e SUWCO specifi es the discharge quality and requirements that the ABCWUA will accept at its POTW. Sandia received fi ve “Gold Pre-Treatment Awards and one Silver Pre-Treatment Award” from the ABCWUA for the 2009 to 2010 reporting year (November 2009 through November 2010). A “Gold Pre-treatment Award” is given based on a facility’s 100 percent compliance with reporting requirements and discharge limits set in its permits, or exceptional source reduction and P2. A “Silver Pre-Treatment Award” is given based on a facility’s 100 percent compliance with reporting requirements and 90 percent compliance with permit discharge limits.
FIGURE 6-1. Wastewater Monitoring Sta on Loca ons
KeyGeneral outfallmonitoring stationLiquid Effluent ControlSystem in TA-VSewer lineRoad
Man
zano
Bas
e
Alb
uque
rque
Inte
rnat
iona
l Sun
port
N
Tijeras Arroyo Intercept
WW006
LECS
WW008
WW001
WW007
To Publicly-OwnedTreatment
Works
Connectsto Tijeras
ArroyoInterceptdownline
MicroelectronicsDevelopmentLaboratory (MDL)
WW011
Not to Scale
CINT
2010 Annual Site Environmental Report6-2

6.1.2 Permi ng and Repor ng
Th e ABCWUA Water Utility Department, Water Reclamation Division, implements the EPA’s water quality standards under the authority of the SUWCO. Sandia submits semi-annual wastewater reports to the ABCWUA. Th e primary regulatory drivers for the Wastewater Program and important program documents and reports are listed in Chapter 8.
Discharge Control Program Th e Water Quality Group (WQG) at SNL/NM maintains a Discharge Control Program to track wastewater discharges resulting from ongoing chemical, manufacturing, and industrial processes conducted at SNL/NM facilities. Facility processes are reviewed for contaminants, concentrations, and discharge frequencies to determine if the effl uent will meet regulatory criteria. Once approved, a facility is issued an internal SNL/NM permit, which is reviewed annually. Generally, processes are well characterized and any constituents that are detected over the limits at a wastewater monitoring station can usually be tracked back to the source facility. Corrective actions to mitigate further releases are implemented, as necessary. One-time releases are approved on a case-by-case basis. Buildings that only produce domestic sewage, such as from lavatories (restrooms and showers), sinks, and fountains are not required to obtain an internal permit.
6.1.3 Wastewater Monitoring Sta ons
SNL/NM has six on-site monitoring stations permitted by the ABCWUA (Figure 6-1). Wastewater permits are listed in Chapter 8, Table 8-1 of this report. All of the wastewater from SNL/NM’s six permitted monitoring stations with the exception of Station WW007 (Permit 2069G) and the Center for Integrated Nanotechnologies (CINT) (Permit 2238A) contain a mixture of sanitary and industrial wastewater, which discharges into the ABCWUA sanitary sewer system through the Tijeras Arroyo Intercept (TAI).
Th e EPA has established categorical pre-treatment standards for specifi ed classes of industrial discharges. Station WW007 (Permit 2069G) monitors the wastewater discharged from the AWN system within the MDL in Technical Area (TA) I. Laboratory discharges from the MDL and buildings which comprise the Microsystems and Engineering Sciences Applications (MESA) complex may also be confi gured to discharge to this AWN system. Th e CINT facility also utilizes an AWN system for pre-treatment of its process wastewater. SNL/NM discharges approximately 800,000 to 1,000,000 gallons (gal) of wastewater per day to the public sewer system.
Wastewater Monitoring All outfall monitoring stations are equipped with fl ow meters which control automatic sampling units and pH sensors that continuously monitor wastewater 24-hours-a-day, 365-days-a-year. An auto-dialer notifi es SNL/NM personnel when pH regulatory limits have been exceeded. SNL/NM personnel are required to notify DOE’s, National Nuclear Security Administration (NNSA), Sandia Site Offi ce (SSO) personnel of the exceeded limit. In addition, DOE/NNSA/SSO personnel are required to report the exceeded limit to the ABCWUA within 24 hours. Wastewater discharge permits and station characteristics are listed in Table 6-1.
Discharge monitoring Stations WW001 (Permit 2069A), WW006 (Permit 2069F), WW008 (Permit 2069I), and WW011 (Permit 2069K) are manhole-type installations with permanently installed continuous fl ow measuring and pH recording instrumentation. Wastewater monitoring Station WW007 (Permit 2069G) and the CINT (Permit 2238A) are located within buildings and are also equipped with installed continuous fl ow measuring and pH recording instrumentation.
Wastewater, Surface Discharge, Stormwater Monitoring, Oil Storage & Spill Control 6-3

Sandia splits wastewater samples taken from SNL/NM permitted outfalls with the ABCWUA to determine compliance with permit requirements. NMED is notifi ed when sampling is scheduled to occur and is off ered the opportunity to obtain samples for analysis. All samples are obtained as 24-hour fl ow proportional or time-weighted composites. Sandia sends all collected samples to an EPA-approved laboratory for analysis. Sampling results are compared with results obtained by the ABCWUA. Currently, the procedure is to sample randomly from a list of potential pollutants. Th e ABCWUA determines which parameters it plans to analyze. Monitoring parameters are listed below:
Wastewater Analyte Parameters
• Metals - aluminum, arsenic, cadmium, chromium, copper, lead, mercury, molybdenum, nickel, selenium, silver, and zinc.
• Radiological - gamma spectroscopy, gross alpha, gross beta, and tritium.
• General Chemistry - chemical oxygen demand (COD), cyanide, formaldehyde, oil and grease, phenolic compounds, semi-volatile organic compounds (SVOC), soluble fl uoride, and volatile organic compounds (VOC).
Septic Systems Sandia maintains three active septic tank systems and one holding tank in remote areas on Kirtland Air Force Base (KAFB), which are used only for domestic sanitary sewage collection. Since these tanks receive only domestic sewage and no industrial discharges, they do not require sampling prior to pumping and discharge to the public sewer. However, as a Best Management Practice (BMP), Sandia periodically obtains samples from these active septic tank systems prior to pumping and discharge. All septic holding tank records are sent to the State of New Mexico.
6.1.4 TA-V Radiological Screening
SNL/NM maintains research and engineering reactors in TA-V. Th ese reactors and support facilities have the potential to produce radioactive process wastewater that includes liquids from fl oor drains, lab sinks and other drains located in buildings that use, process or store radioactive materials. To ensure that all wastewater from these facilities meets regulatory standards, liquid effl uent is separated
TABLE 6-1. SNL/NM Wastewater Discharge Permits and Sta on Characteris cs
Permit Waste Stream Process General Outfall
2069A (WW001) All waste streams 2069F (WW006) All waste streams 2069I (WW008) All waste streams
2069K (WW011) All waste streams
Categorical 2069G (WW007) Laboratory industrial processes Acid waste from MDL activities
2238A (CINT) Laboratory industrial processes Acid waste from CINT activities Not Permitted
LECS Radiological screening of TA-V process water
NOTES: “All waste streams” include both domestic and industrial discharges. CINT = Center for Integrated Nano-Technologies LECS = Liquid Effluent Control System MDL = Microelectronics Development Laboratory SNL/NM – Sandia National Laboratories, New Mexico TA-V = Technical Area V
2010 Annual Site Environmental Report6-4

into two process streams: reactor and non-reactor wastewater. Non-reactor wastewater is water from restrooms and non-radioactive laboratory activities. Reactor process wastewater is water from areas that use, process, or store radioactive materials and is channeled to holding tanks where it can be screened for radiological contaminants within the Liquid Effl uent Control System (LECS). Th e LECS was developed as a control system to maintain the integrity of the ABCWUA’s sanitary sewer system by collecting, analyzing, and handling SNL/NM reactor process wastewater from TA-V reactor activities. Water samples are analyzed for tritium, gross alpha, gross beta, and gamma spectroscopy to ensure radiological levels meet regulatory standards before the water is released to the public sewer system. If radioactivity levels are detected above regulatory limits, the water will not be released to the sanitary sewer system and an alternative disposal path will be found or the radionuclides will be allowed to decay in place over a matter of days or weeks if the contamination is due to short-lived medical radioisotopes. Once the activity is at or below regulatory levels, the water can be safely discharged to the public sewer system. Th e LECS consists of three 5,000 gal holding tanks with liquid level and radioactive alarm systems, a control room, and an ion exchange/fi ltration unit (treatment processor). Th e LECS is an engineered facility operating within an established safety envelope. Discharges to the sanitary sewer from the LECS and other SNL/NM activities did not exceed standards for radionuclides at any of SNL/NM’s wastewater monitoring stations in 2010.
6.1.5 Summary of Monitoring Results
During 2010, Sandia split wastewater samples with both the ABCWUA and the NMED. Laboratory analytical results for these split wastewater samples, based on the parameters shown in Section 6.1.3, confi rmed that Sandia was in compliance with all NMED and ABCWUA regulations for Permits 2069A, 2069F, 2069I, 2069K and 2238A. As previously stated in Section 6.1.1, Permit 2069G exceeded arsenic limits on April 20, 2010. Compliance sampling of SNL/NM facilities was conducted at the ABCWUA permitted fl ow basin outfalls during the months of April, August and October during 2010 to ensure that Sandia was in compliance with ABCWUA’s discharge requirements. Th e ABCWUA Industrial Waste Engineer also conducted inspections of individual laboratory operations within the permitted fl ow basins during the months of April, August and October of 2010. All water discharged from the LECS in 2010 also met federal regulatory standards and DOE orders for radiological levels in wastewater. All analytical results from sampling conducted in 2010 can be found in Appendix A of this report.
6.1.6 Sanitary Sewer System Releases in 2010
Reportable occurrences and environmental releases in 2010 are discussed in Chapter 2, Sections 2.2.1 and 2.2.2 of this report. Th ere was one reportable release (ABCWUA permit violation [Permit 2069G]) in 2010.
6.2 Surface Discharge Program
All water and water-based compounds that discharge to the ground surface are evaluated for compliance with New Mexico Water Quality Control Commission (NMWQCC) regulations as implemented by the NMED Groundwater Bureau. Th ese regulations are designed to protect the groundwater and surface water of the state for potential use as a domestic potable water source. Th e primary regulations and important program documents are listed in Chapter 8.
6.2.1 Surface Discharge Approval and Permi ng
Surface discharges are releases of water and water-based compounds made to roads, open areas, or impoundments. Surface discharges are only made with the approval of the Internal Surface Discharge
Wastewater, Surface Discharge, Stormwater Monitoring, Oil Storage & Spill Control 6-5

Program (ISDP). Proposed discharges are evaluated for potential contaminants and concentration levels to determine if the discharge complies with strict water quality guidelines for surface releases. Uncontaminated water discharges must also be approved, since large volumes of water discharged in areas of prior contamination (such as Environmental Restoration [ER] sites) could increase infi ltration rates and move contaminants deeper into the soil column. If any discharges do not meet surface water quality standards, alternative methods of disposal are found.
2010 Surface Discharge Activities Surface discharge requests are generally made when access to a sanitary sewer line is not available, such as in remote locations on KAFB where no sewer lines exist. Typical surface discharge requests include discharges made by the Groundwater Protection Program (GWPP) to dispose of well purge water from groundwater monitoring wells. Wells are purged before a representative groundwater sample can be taken. Other surface discharges are requested as a result of fi re training activities, the need to fl ush eyewash stations, and the cleaning of building exteriors. In 2010, 25 individual surface discharge requests were made; all met State of New Mexico standards and were approved.
6.2.2 Surface Discharge Releases in 2010 Th e Surface Discharge Program must be contacted in the event of an accidental release or spill to the ground surface. In 2010, one release met the reporting requirements established by NMED. Th is release is discussed in Chapter 2, Section 2.2.2 and is summarized below:
1. A surface release to the environment was reported to NMED on May 20, 2010. Th e release occurred south of Building 887. Th e release was from a backup in a sanitary sewer line and consisted of domestic sanitary waste. Th e discharge was stopped within a few minutes of being detected. Based upon the information available, it is believed that a total discharge of approximately 150 gal occurred. Th e released sanitary discharge traveled west approximately 150 feet (ft) along the paved roadway where approximately 10 gal entered a drop inlet of the storm drainage system. Th e remaining 140 gal traveled west approximately 150 ft along the paved roadway and then traveled approximately 600 ft to the south along 14th Street Southeast. Th e material that traveled along the street was swept back into the sanitary sewer system utilizing potable water and the roadway was neutralized with a 10 percent bleach solution. Although this release following cleanup was not considered to be harmful to human health and safety, plant and animal life, and did not cause degradation to the environment it was reported because it constitutes a violation of the terms of SNL/NM’s Storm water Multi-Sector General Permit (MSGP) issued by the EPA.
6.2.3 Pulsed Power Evapora on Lagoons
Th e Surface Discharge Program at SNL/NM reports water quality results from routine samples taken from two surface discharge lagoons in TA-IV. Both lagoons are permitted through NMED in Discharge Plan-530 (DP-530). Th e two surface discharge lagoons are primarily used to contain and evaporate water that collects in the secondary containments around seven outdoor oil storage tanks used to store dielectric oil. Th e secondary containments are designed to hold the entire content of the tanks in the event of an accidental release. Signifi cant volumes of precipitation can collect in the containments during storm events. Th e water is visually inspected for oil contamination and any oil present is skimmed off prior to discharge to the TA-IV lagoons.
Th e original DP-530 was issued to SNL/NM for discharges from the pulsed power facilities located in TA-IV to Lagoons #1 and #2 on March 8, 1988. Th e DP-530 was submitted pursuant to New Mexico Administrative Code (NMAC) 20.6.2.3106 of NMWQCC regulations, and was approved pursuant to 20.6.2.3109 NMAC. A permit renewal application for DP-530 was submitted to NMED
2010 Annual Site Environmental Report6-6

and was approved on September 12, 2007 and will expire on September 12, 2012. Th e monitoring and reporting requirements are listed in Table 6-2.
On October 19, 2010, Lagoon #1 was sampled prior to being discharged to the ABCWUA sanitary sewer system. Laboratory analysis results indicated that all detected constitutes met ABCWUA discharge requirements. Lagoon #1 was cleaned, the liner was inspected and preventative maintenance measures were implemented. During CY 2010, monthly inspections were performed on both lagoons and were documented in checklists fi led in Sandia’s Customer Funded Records Center (CFRC) and with DOE/NNSA/SSO. In October of 2010, vegetation around Lagoon #2 was removed to protect the liner. No sampling of Lagoon #2 was conducted since only storm water falls into the lagoon from storm events. No surface discharges and no discharges from the pulsed power facilities to Lagoon #2 occurred during 2010.
6.3 Storm Water Program
6.3.1 Storm Drain System
Storm water runoff fl owing over the ground surface has the potential to pick up and transport contaminants. Th e Storm Water Program works in coordination with the P2 Program, the Surface Discharge Program, Facilities Engineering, and the ER Project to implement measures and BMPs to prevent or reduce potential contaminants from being transported in storm water runoff . Potential contaminants may derive from:
• Oils and solvents from machine shops and manufacturing areas,
• Vehicle residues from streets and parking lots,
• Hazardous chemicals and metals from waste handling facilities,
• Residual radioactive and hazardous constituents from Solid Waste Management Units (SWMU),
• Building material contaminants from construction activities, and
• Pesticides and fertilizers from landscaped areas.
Sandia controls the potential contaminants that may be picked up by storm water runoff by routing all industrial waste water to the sanitary sewer and storing most chemicals indoors. Sandia also limits
TABLE 6-2. NMWQCC Monitoring and Repor ng Requirements
Action Frequency Reporting Inspection of Lagoons Monthly Documented in checklists Drain, clean and inspect lagoon and liner Annually Annually Water-level readings Monthly Annually Inspect sump stations and clean as needed Quarterly Annually Major cations, anions, and TDS Biennially Biennially Purgeable organics using EPA Method 8240 Biennially Biennially Extractable organics using EPA Method 8270 Biennially Biennially
NOTES: EPA = U.S. Environmental Protection Agency NMWQCC = New Mexico Water Quality Control Commission TDS = total dissolved solids
Wastewater, Surface Discharge, Stormwater Monitoring, Oil Storage & Spill Control 6-7

storm water contact with chemical storage containers and carefully controls runoff in areas where wastes, chemicals, and oils are stored or handled. Secondary containments for all outdoor oil storage tanks and chemical containers prevent potential pollutants from being transported in storm water runoff . Some facilities, such as the Hazardous Waste Management Facility (HWMF) and the Radioactive and Mixed Waste Management Facility (RMWMF) are designed to divert all runoff from the facility to a lined catchment basin. Water that accumulates in these basins evaporates. If evaporation is not adequate due to meteorological conditions, the accumulated water is evaluated and pumped to either the storm drain system or to the sanitary sewer for disposal. Per the Resource Conservation and Recovery Act (RCRA) Part B permit, discharge of the water is allowed if there have been no spills or releases or no visible sheen or excessive debris. If discharged to the sanitary sewer, approval must be obtained from the ABCWUA through DOE/NNSA/SSO.
NPDES Regulations NPDES regulations, under the Clean Water Act (CWA), require any point source discharges to be permitted. Any runoff that fl ows into the Tijeras Arroyo through a channel, arroyo, conduit, or pipe is considered a discharge point. Overland surface fl ow or “sheet” fl ow that drains into Tijeras Arroyo is not considered a point source discharge.
Th e State of New Mexico has defi ned “Surface Waters of the State” to include “Waters of the U.S.” and all other surface water in the State. In order to assist New Mexico in protecting its water resources, the EPA can apply NPDES regulations to discharges to New Mexico’s surface waters, even if those waters are not “Waters of the U.S.”
As shown in Figure 6-2, Tijeras Arroyo enters KAFB from the northeast, fl ows just south of TA-I, TA-II, and TA-IV, exits at KAFB’s west boundary, and continues about eight miles to its discharge point at the Rio Grande River. Th e arroyo has created a signifi cant topographic feature across KAFB where erosion of unconsolidated basin sediments has resulted in a channel over one half mile wide in some areas.
Watersheds at SNL/NM NPDES permits are required if storm water runoff discharges to “Waters of the U.S.” or “Surface Waters of the State.” Sandia facilities in TA-I, TA-II, and TA-IV have storm drains, culverts, and channels that divert storm water runoff to discharge points on the north side of Tijeras Arroyo, which is classifi ed as “Waters of the U.S.” Sandia also conducts various activities in remote mountain and canyon areas in the Arroyo del Coyote watershed, which empties into Tijeras Arroyo northwest of the KAFB Golf Course. Activities in all of these areas are evaluated for possible NPDES permitting.
Drainages south of the Arroyo del Coyote watershed are generally short and undeveloped. Runoff in this area infi ltrates quickly into highly permeable soils. Discharges from these areas do not reach any designated “Waters of the U.S.”; but they do discharge to “Surface Waters of the State;” therefore, activities are evaluated for possible NPDES permits for facilities in these areas. TA-III, TA-V, and several remote sites are located in this area.
NPDES Permit Th e EPA provides regulatory oversight for SNL/NM’s Storm Water Program. Operators must submit a Notice of Intent (NOI), implement control measures, sample storm water runoff for comparison to national benchmark values, and develop site-specifi c Storm Water Pollution Prevention Plans (SWP3). A NOI was submitted to the EPA for coverage under the new 2008 MSGP before the January 5, 2009 deadline and in November 2009 EPA issued a new permit.
2010 Annual Site Environmental Report6-8

FIGU
RE 6
-2.
Stor
m W
ater
Mon
itorin
g Po
int L
oca
ons
at S
NL/
NM
Tije
ras A
rroy
o
TA-I
TA-II
TA-III
TA-IV
TA-V
Wastewater, Surface Discharge, Stormwater Monitoring, Oil Storage & Spill Control 6-9
In 2009, the existing SWP3 was updated to comply with the new 2008 MSGP requirements. Key facilities aff ected by NPDES regulations are listed in Table 6-3. Chapter 8 lists all applicable regulations and program documents.
A construction permit requires protection of storm water runoff during and after construction. All areas of the site that are susceptible to erosion must be stabilized upon completion of the project. A General Construction Permit (GCP) 2003 was issued for a fi ve-year term, and expired July 1, 2008. Th e EPA issued a GCP in 2008 that is in eff ect from June 30, 2008 to June 30, 2010. On January 28, 2010 the EPA extended the CGP by one year, which will expire on or before June 30, 2011.
During 2010, 14 storm water construction permits were active. Construction permits are listed in Chapter 8, Table 8-1.
6.3.2 Storm Water Monitoring Sta ons
Figure 6-2 illustrates the storm water monitoring point locations. Using the locations of the MSGP sites along with the watershed boundaries and fl ow patterns the storm water monitoring points were located at points that would best be suited to collect a representative sample of storm water runoff . Th e locations identifi ed were then checked in the fi eld where slight adjustments were made. Th is understanding between the hydrologic connection between the watershed outfalls, drainage patterns and locations of MSGP sites allowed for the selection of the monitoring points where representative samples could be collected.
6.3.3 Rou ne Inspec ons
All routine inspection results are attached to the SWP3. Routine inspections include the following:
• Monitoring station inspections are conducted monthly to ensure that samplers and other equipment are functioning properly.
• Material storage area inspections are conducted quarterly. All waste handling areas, vehicle and equipment cleaning areas, and loading and unloading areas are inspected for uncovered and unprotected potential contaminant sources and spills. Th ese inspections increase personnel awareness and responsibility for storm water P2.
• Wet weather inspections (visual monitoring) are conducted quarterly during a storm event, if possible, but generally during the rainy season from April through September. Samples are collected and visually inspected for foaminess, clarity, and the presence of oil. Th e pH of the discharge is also measured and recorded. Th ese inspections also provide an opportunity to check for broken levees and fl oating debris.
• Dry weather inspections are conducted quarterly when storm drains and ditches are dry, primarily to detect illicit discharges. In general, only storm water is allowed in the storm drain system; however, with approval from the Surface Discharge Program, water that meets NPDES permit conditions can be discharged to storm drains. An example of NPDES permit-approved discharges would be water used during fi re training exercises or fi re hydrant testing. Dry weather inspections also provide an opportunity to inspect ditches for excess vegetation, accumulated sediment, and debris. Storm channels are cleaned out annually, or as necessary.
Annual inspections of all permitted facilities and the entire storm water system are conducted. After the inspections have been completed, a report is generated indicating the extent of the inspections and certifying that is in compliance with the NPDES permit. Any inconsistency between the SWP3
2010 Annual Site Environmental Report6-10

TABLE 6-3. SNL/NM Facili es Subject to Storm Water Permi ng These facili es are in areas where storm water can poten ally drain to Tijeras Arroyo
Description of SIC Code* Potential Pollutants and Impacts Applicable SNL/NM Facilities**
NPDES Multi-Sector Storm Water Permit Scrap and Waste Recycling - Various solid objects with potential
residual surface contamination - Reapplication and Storage Yard - Solid Waste Transfer Station
Hazardous Waste Treatment, Storage, or Disposal Facilities
- Regulated hazardous chemical and radioactive waste
- HWMF - Manzano Storage Complex - RMWMF - CWL - TTF - AHCF - CAMU - SWMUs (including those in Lurance and Madera Canyons)
Electronic and Electrical Equipment Manufacturing
- Raw chemical storage such as acid and sodium hydroxide - Electroplating processes
- 858 Complex - AMPL - CINT - NGF
Fabricated Metal Products - Metal Fabrication - Turnings
- Machine Shop
Short-Term Construction Permits Construction Permits - 2010 - Building material pollutants
- Disturbed soil - 20th Street Stockpile Area - Mixed Waste Landfill Cover - TA-III Borrow Site - Heating Systems Modernization - I Ave and 11th Street Mall Waterline
Project - 9940 Complex - Building 957 Parking Lot - Liquid Natural Gas - Thunder Range - TA II Escarpment - Ion Beam Laboratory - National Solar Thermal Test - TCR Phase II - 12th Street Roadway
NOTES: *The EPA requires a National Pollution Discharge Elimination System (NPDES) Storm Water Permit for all industrial facilities that have processes defined in the Standard Industrial Classification (SIC) codes listed in Appendix A of 40 CFR 122. **Applicable facilities are monitored under the expanded Storm Water Program, which was in effect in October 2001. The expanded program is documented in the revised Storm Water Pollution Prevention Plan (SWP3) (SNL 2010d). AHCF = Auxiliary Hot Cell Facility RMWMF = Radioactive & Mixed Waste AMPL = Advanced Manufacturing Process Laboratory Management Facility CAMU = Corrective Action Management Unit SNL/NM = Sandia National Laboratories, CINT = Center for Integrated Nano Technology New Mexico CWL = Classified Waste Landfill SWMU = Solid Waste Management Unit HWMF = Hazardous Waste Management TA = Technical Area Facility TCR = Test Capabilities Revitalization NGF = Neutron Generation Facility TTF = Thermal Treatment facility
Wastewater, Surface Discharge, Stormwater Monitoring, Oil Storage & Spill Control 6-11

and conditions at the facilities is noted in the report. If changes to the SWP3 are required as a result of these inspections, revisions are initiated. If potential pollution problems are uncovered, they are noted in the report along with a schedule for addressing those problem areas.
Sampling Protocols Quarterly benchmark monitoring is the only analytical monitoring is required at SNL/NM under the 2008 MSGP. Annual effl uent limitation monitoring; State monitoring; and impaired monitoring are not currently required.
An alternative to quarterly benchmark monitoring is allowed under the MSGP due to irregular storm water runoff associated with the semi-arid climate in New Mexico and is shown below:
• Period 1: June,
• Period 2: July,
• Period 3: August and,
• Period 4: September.
Table 6-4 shows the parameters to be sampled for each industry sector except Sector AC, which does not have monitoring under the 2008 MSGP.
TABLE 6.4. MSGP Storm Water Monitoring Requirements During Calendar Year 2010
Pollutant MSGP Sector/Section Benchmark Value (mg/L)
Total Recoverable Arsenic K 0.15 Total Recoverable Cadmium K 0.0029 Total Cyanide K 0.022 Total Recoverable Lead N, K, AA 0.122 Total Recoverable Mercury K 0.0014 Total Recoverable Magnesium K 0.064 Total Recoverable Selenium K 0.005 Total Recoverable Silver K 0.0065 Total Recoverable Aluminum AA, N 0.75 Total Recoverable Copper N 0.0189 Total Recoverable Iron AA, N 1.0 Total Recoverable Zinc AA, N 0.16 Chemical Oxygen Demand K, N 120 Ammonia K 2.14 Nitrate plus Nitrite Nitrogen AA 0.68 Total Suspended Solids L, N 100
NOTES: mg/L = milligram per liter MSGP = Multi-Sector General Permit
2010 Annual Site Environmental Report6-12
After collection of four samples, if the average of the four monitoring values for any parameter does not exceed the benchmark then the sampling requirements for that parameter have been fulfi lled for the permit term. If the average of the four values exceeds the benchmark then selection, installation, and implementation of the control measures must be reviewed to determine if modifi cation(s) are necessary.
If it is determined that the average concentration exceeds benchmark value(s) is due solely to the presence of that pollutant in the natural background, corrective action or additional monitoring is not required provided that:
• Th e average concentration of the benchmark monitoring results is less than or equal to the concentration of the pollutant in the natural background,
• Th e supporting rational and any data, literature studies that describe the levels of natural background pollutants in the storm water discharge is documented and maintained with the SWP3, and
• EPA is notifi ed on the fi nal quarterly benchmark monitoring report that the benchmark exceedances are attributable solely to natural background pollutant levels.
After a rainfall of suffi cient intensity and duration (as defi ned in the regulation), storm water runoff fl owing through each monitoring station is collected as a grab sample by the automatic sampler. Th e discharge is collected within the fi rst 30 minutes of the runoff event to allow for the sampling of any residues picked up in the soil upstream of the station. All samples are sent to off -site laboratories and analyzed according to protocols established by the EPA.
6.3.4 2010 Ac vi es
2010 Sampling Results Quarterly visual sampling and analytical sampling was conducted in 2010. All monitoring data collected must be submitted to EPA no later than 30 days after receiving the complete laboratory results for all monitored outfalls for the reporting period (Section 6.3.3). Th e monitoring data as submitted to the EPA along with the environmental surveillance sampling results can be found in Appendix D of this report.
Laboratory results received in September 2010 from rainfall runoff collected at SWMP-11 exceeded benchmark values for Total Cadmium and Total Silver therefore controls were installed to minimize on-site erosion and subsequent sediment transport in the drainage area to SWMP-11. Th ese controls will be evaluated by continuing sampling of the storm water runoff at SWMP-11 and comparing these results to the benchmark values.
Visual observations of storm water were performed when there was adequate runoff to collect a sample. Th e majority of the visual observations of storm water quality were done in the summer months and these assessments did not produce any indications of storm water pollution.
6.4 Oil Storage & Spill Control
Th e oil storage capacity at SNL/NM was reduced from 3.6 million gal in 51 Above Storage Tanks (AST) and fi ve Underground Storage Tanks (UST) to 2.1 million gal in 46 ASTs and fi ve USTs. Th is does not include oil-containing equipment and transformers. Additional oil storage capacity in 55 gal drums occurs throughout the site on an as needed basis. All oil storage sites with regulated containers must be equipped with secondary spill containment. Secondary containment structures include concrete-lined basins, retaining walls, containment reservoirs, earthen berms, sloped pads, trenches, and containment pallets.
Wastewater, Surface Discharge, Stormwater Monitoring, Oil Storage & Spill Control 6-13

A Spill Prevention Control and Countermeasures (SPCC) Plan is required under the CWA. SNL/NM’s SPCC Plan was revised in 2005 to incorporate changes to 40 Code of Federal Regulations (CFR) 112 and 20.5 NMAC. Th e focus of these 40 CFR 112 regulations is to protect specifi cally defi ned waterways, or “navigable waters of the United States” from potential oil contamination. “Navigable waters” is a broad term that includes rivers, lakes, oceans, and water channels (tributaries), such as streambeds and arroyos that connect to a river. Th is applies to the Tijeras Arroyo, which discharges to the Rio Grande. Th e 20.5 NMAC regulations are to reduce, mitigate and eliminate the threats to the environment posed by petroleum products released from storage tanks.
SNL/NM’s SPCC Plan describes oil storage facilities and the mitigation controls in place to prevent inadvertent discharges of oil. Facilities at SNL/NM subject to the regulations include:
• Oil storage tanks (USTs and ASTs),
• Bulk storage areas (multiple containers), and
• Temporary or portable tanks.
Table 8-1 lists the permit numbers for those tanks that are registered with NMED. SNL/NM’s State of New Mexico Owner ID Number is 14109.
UST Five USTs are currently operating at SNL/NM. Two 20,000 gal fi berglass USTs at SNL/NM are registered with NMED; one additional UST, used solely for emergency power generation, is exempt from New Mexico requirements, but is covered by federal regulations in 40 CFR 280; and two USTs in TA-III are exempt from state and federal requirements because they contain insignifi cant quantities of regulated substances.
AST Forty-six ASTs are currently operating at SNL/NM. In 2002, the State of New Mexico passed oil storage regulations that required the registration of all oil storage tanks with a storage capacity greater than 1,320 gal, but less than 55,000 gal. Seven ASTs at SNL/NM are registered with NMED.
2010 Annual Site Environmental Report6-14

Quality Assurance 7-1
7.1 Corporate Level Quality Assurance (QA)
Th e Integrated Laboratory Management System (ILMS) is the framework by which Sandia Corporation (Sandia) manages all work done at the Laboratories. It refl ects the major functions performed by the Laboratories as well as the management structure and the management information used to actually plan, execute, and monitor our work (Figure 7-1). ILMS is the means by which Sandia ensures long-term customer confi dence by improving management performance and eff ectiveness, achieving effi ciencies to enhance mission work, and satisfying National Nuclear Security Administration (NNSA) and the U.S. Department of Energy’s (DOE) contractor assurance requirements.
Sandia deploys responsibility and accountability for implementing and putting into action the QA Program elements specifi ed in International Organization for Standardization (ISO) 9001-2000 (IOS 2008), the Contractor Requirements Document of DOE Order 414.1C, Quality Assurance (DOE 2005), and regulation 10 Code of Federal Regulations (CFR) 830, Subpart A, Quality Assurance, via policy statements, processes, and procedures; and executing the actions specifi ed in those processes and procedures.
Sandia management is responsible for ensuring the quality of its products and for assessing its operations, programs, projects, and business systems; identifying defi ciencies and eff ecting continuous improvements.
Quality Assurance
FIGURE 7-1. Sandia’s Integrated Laboratories Management System (ILMS) (The Corporate Work Process is illustrated in the fi ve points of the star.)

2010 Annual Site Environmental Report7-2
7.1.1 Environment, Safety & Health (ES&H) Policy Statement Requirement
Sandia is committed to protecting the environment and to preserving the health and safety of workers and the community. Sandia considers the protection and preservation of the environment and the safety and health of its employees, contractors, visitors, and the public to be critical to its success.
It is the policy of Sandia to protect Members of the Workforce and the public, prevent incidents, integrate environmental stewardship and sustainability throughout the life cycle of its activities and to conserve natural resources and protect the environment.
DOE’s Integrated Safety Management System (ISMS) is a key element of Sandia’s ILMS. ISMS provides the framework for managing ES&H activities and functions while integrating them into all Sandia operations.
7.1.2 Integrated Laboratory Management System (ISMS)
Sandia’s corporate ES&H program mandates compliance with all applicable laws, regulations and DOE directives that are included in the Prime Contract between DOE and Sandia. As appropriate, internal corporate policy and permit requirements are included. Sandia is committed to performing work safely and ensuring protection of the Members of the Workforce, the public, and the environment.
ES&H performance at Sandiais based upon the
Five Safety Management Core Functionsand the
Seven Guiding Principles of ISMS.
Sandia is committed to environmental protection for current and future generations. Th is commitment includes identifying and mitigating potential risks to the environment, and incorporating environmental management as an integrated element of all work.
Environmental Management System (EMS)Sandia is committed to integrating environmental protection with its mission and recognizes that the environment must be protected and preserved for current and future generations. Sandia takes this responsibility seriously and expects employees, contractors, and visitors to proactively protect the environment and natural resources. Th is responsibility includes identifying and mitigating potential risks to the environment and incorporating environmental management in daily work activities.
In compliance with DOE Order 450.1A, Environmental Protection Program, Sandia has implemented an EMS as part of the ISMS.
Th e vision of the Sandia EMS is to implement a system that is a model within the NNSA complex and is consistent with the ISO 14001 Standard. Sandia National Laboratories, New Mexico (SNL/NM) received ISO 14001 certifi cation in 2009.
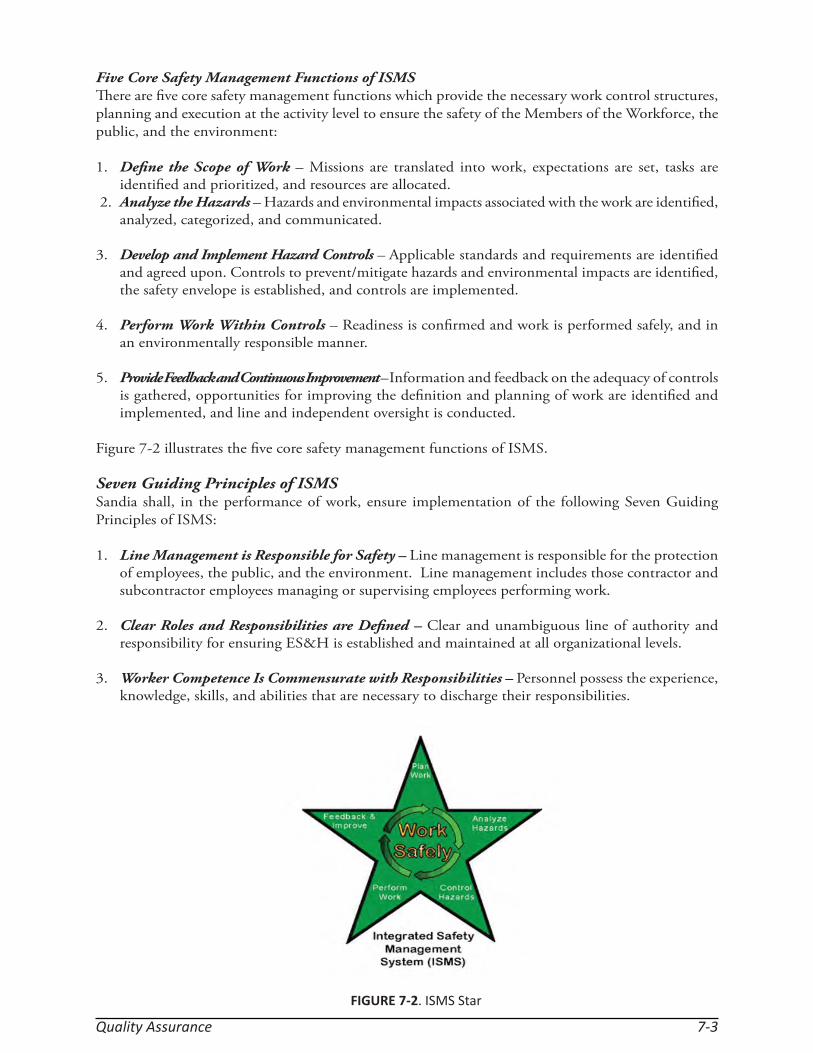
Quality Assurance 7-3
Five Core Safety Management Functions of ISMSTh ere are fi ve core safety management functions which provide the necessary work control structures, planning and execution at the activity level to ensure the safety of the Members of the Workforce, the public, and the environment:
1. Defi ne the Scope of Work – Missions are translated into work, expectations are set, tasks are identifi ed and prioritized, and resources are allocated.
2. Analyze the Hazards – Hazards and environmental impacts associated with the work are identifi ed, analyzed, categorized, and communicated.
3. Develop and Implement Hazard Controls – Applicable standards and requirements are identifi ed
and agreed upon. Controls to prevent/mitigate hazards and environmental impacts are identifi ed, the safety envelope is established, and controls are implemented.
4. Perform Work Within Controls – Readiness is confi rmed and work is performed safely, and in
an environmentally responsible manner. 5. Provide Feedback and Continuous Improvement – Information and feedback on the adequacy of controls
is gathered, opportunities for improving the defi nition and planning of work are identifi ed and implemented, and line and independent oversight is conducted.
Figure 7-2 illustrates the fi ve core safety management functions of ISMS.
Seven Guiding Principles of ISMSSandia shall, in the performance of work, ensure implementation of the following Seven Guiding Principles of ISMS:
1. Line Management is Responsible for Safety – Line management is responsible for the protection of employees, the public, and the environment. Line management includes those contractor and subcontractor employees managing or supervising employees performing work.
2. Clear Roles and Responsibilities are Defi ned – Clear and unambiguous line of authority and
responsibility for ensuring ES&H is established and maintained at all organizational levels. 3. Worker Competence Is Commensurate with Responsibilities – Personnel possess the experience,
knowledge, skills, and abilities that are necessary to discharge their responsibilities.
FIGURE 7-2. ISMS Star

2010 Annual Site Environmental Report7-4
4. Priorities are Balanced – Resources are eff ectively allocated to address ES&H, programmatic, and operational considerations. Protecting employees, the public, and the environment is a priority whenever activities are planned and performed.
5. Safety Standards and Requirements are Identifi ed – Before work is performed, the associated
hazards are evaluated and an agreed-upon set of ES&H standards and requirements are established which, if properly implemented, provide adequate assurance that employees, the public, and the environment are protected from adverse consequences.
6. Hazard Controls are Tailored to Work Being Performed – Administrative and engineering
controls to prevent and mitigate hazards are tailored to the work being performed and associated hazards. Emphasis should be on designing the work and/or controls to reduce or eliminate the hazards and prevent accidents and unplanned releases and exposures.
7. Operations Authorization Exists – Th e conditions and requirements to be satisfi ed for operations
to be initiated and conducted are established and agreed-upon by DOE and the contractor. Th ese agreed-upon conditions and requirements are requirements of the contract and binding upon the contractor. Th e extent of documentation and level of authority for agreement shall be tailored to the complexity and hazards associated with the work and shall be established in a Safety Management System.
7.2 Environmental Program Quality Assurance
Environmental samples are collected by personnel in various programs and analyzed for radiological and non-radiological contaminants. Some sampling is specifi cally mandated by regulations to meet compliance, while other sampling activities are carried out in accordance with DOE Orders.
Environmental SamplingEnvironmental sampling is conducted in accordance with program-specifi c Sampling and Analysis Plans (SAP) or Work Plans which contain applicable QA elements. Th ese documents meet appropriate federal, state, and local regulatory guidelines for conducting sampling and analysis activities.
Program-Specifi c SAPsEach program involved in environmental monitoring and sampling develops and follows a relevant SAP. Project SAPs include critical elements, such as procedures for sample collection, sample preservation and handling, sample control, references to analytical methods and analyte lists, laboratory quality control (QC) and procedures, required limits of detection, known potential matrix interferences, fi eld QC, health and safety, schedules and frequency of sampling, data review, data acceptability, and reporting.
Sample Management Offi ce (SMO)Environmental samples are packaged, shipped, and tracked to off -site (contracted) laboratories by the SMO. Th e SMO is responsible for QA and QC once the samples are relinquished to the SMO by fi eld team members.
Some samples are processed and analyzed for radiological constituents by the SNL/NM Radiation Protection Sample Diagnostics (RPSD) laboratory in accordance with RPSD procedures.
Quality Assurance 7-5
Th e SMO’s roles and responsibilities include providing guidance and sample management support for fi eld activities. However, each distinct program is responsible for its overall adherence and compliance regarding any sampling and analysis activity performed.
Selection of a Contract LaboratoryAll off -site contract laboratories are selected based on performance objectives, licenses and accreditations, and appraisals (pre-award assessments) as described in the Quality Assurance Project Plan (QAPP) for the SMO (SNL 2010c). All laboratories must employ U.S. Environmental Protection Agency (EPA) test procedures wherever possible; when these are not available, other suitable and validated test procedures are applied. Laboratory instruments must be calibrated in accordance with established procedures, methods, and the SMO Statement of Work (SOW). All calibrations and detection limits must be verifi ed before sample analysis and data reporting. Once a laboratory has passed initial appraisal and has been awarded a contract, the SMO is responsible for continuously monitoring laboratory performance to ensure that the laboratories are audited annually and meet their contractual requirements.
Contract laboratories are required to participate in applicable DOE and EPA programs for blind audit check sampling to monitor the overall accuracy of analyses routinely performed on SNL/NM samples.
Project QC SamplesProject-specifi ed QC samples are submitted to contract laboratories in order to meet project Data Quality Objectives (DQO) and SAP requirements. Various fi eld QC samples are collected to assess the quality and fi nal usability of the data. Errors that can be introduced into the sampling process include potential sample contamination in the fi eld or during the transportation of samples, some of which are unavoidable. Additionally, the variability present at each sample location can also aff ect sample results.
Laboratory QCWith each SNL/NM sample batch, laboratory QC samples are concurrently prepared at defi ned frequencies and analyzed in accordance with established methods. Analytical accuracy, precision, contamination, and matrix eff ects associated with each analytical measurement are determined.
QC sample results are compared either to statistically established control criteria or prescribed acceptance control limits. Analytical results generated concurrently with QC sample results within established limits are considered acceptable. If QC analytical results exceed control limits, the results are qualifi ed, and corrective action is initiated if warranted. Reanalysis is then performed for samples in the analytical batch as specifi ed in the SOW and laboratory procedures. QC sample summaries are included in analytical reports prepared by contract laboratories for SNL/NM.
7.3 2010 Sample Management Offi ce (SMO) Ac vi es
In 2010, the SMO processed a total of 4,137 samples in support of Sandia projects, including:
• Environmental Monitoring (air and water),
• Terrestrial Surveillance,
• Long-Term Stewardship (LTS),
• Waste characterization,
• Decontamination and Demolition (D&D), and
• Environmental Restoration (ER).

2010 Annual Site Environmental Report7-6
Of these, 3,938 were for environmental monitoring and surveillance projects. Compared to FY 2009, this was a 28 percent increase in sample volume. A total of 860 samples were submitted as fi eld and analytical QC samples to assist with data validation and decision making.
SMO contract laboratories perform work in compliance with the Sandia SOW for analytical laboratories (Puissant 2009).
Inter-Laboratory ComparisonsSMO contract laboratories are required to participate in the DOE Mixed Analyte Performance Evaluation Program (MAPEP). Th ey also participate in commercial vendor programs designed to meet the requirements given in the profi ciency testing section (Chapter II) of the National Environmental Laboratory Accreditation Conference (NELAC) Standard. SMO contract laboratories have a history of achieving a 90 percent or greater success rate during these comparisons. Acceptable results are based either on established control limits (as stated in the applicable methods) or statistically applied acceptance windows as determined by the performance evaluation provider. Windows are typically two or three standard deviations around the true value.
Laboratory QAIn 2010, the SMO continued on-site data package assessments and validation at the NELAC approved laboratories used by Sandia. Data packages (including a wide array of analysis methods) are requested at the time of the on-site visit. Th e laboratories are not notifi ed in advance and do not know which data packages will be assessed. Th e handling history of the data package is carefully reviewed from sample receipt to data completion by retracing each step through documentation fi les. Specifi c checks for documentation completeness, proper equipment calibration, and batch QC data are made. Th ese assessments focus on data defensibility and regulatory compliance.
SMO Sample Processing
The SMO processed the following types of samples in 2010 in support of SNL/NM projects:
Radioactive waste Mixed waste Hazardous waste D&D, D&D swipes and materials Sludges and liquids Soil Groundwater Decon water Solid waste Air Wastewater effluent Surface water Storm water Soil gas Air filters

Quality Assurance 7-7
During 2010, Sandia employed the following contract laboratories to perform analysis of SNL/NM samples:
• General Engineering Laboratories (GEL) in Charleston, South Carolina.
• Test America Inc. (formerly Severn Trent) in St. Louis, Missouri; Costa Mesa, California; and Austin, Texas.
• Southwest Research Institute (SWRI) in San Antonio, Texas.
• Babcock & Wilcox Technical Services Group, Inc. (BWX) Technologies (formerly BWXT Services) in Lynchburg, Virginia.
QA AuditsTh e DOE Consolidated Audit Program (DOECAP) conducted audits in 2010 at the primary SMO contract laboratories using DOECAP Quality Systems Analytical Services (QSAS) requirements. Th e audit reports, responses from the labs, and closure letters are all posted and tracked through the DOECAP website. Th e SMO works closely with the contract laboratories to expeditiously resolve audit fi ndings. Decisions regarding sample distribution to contract laboratories are based on audit information, including outstanding corrective actions. In 2010, no Priority-1 fi ndings that impacted SMO work were documented during laboratory audits. All corrective actions were expeditiously resolved.
Data Validation and Records ManagementSample collection, Analysis Request and Chain-of-Custody (ARCOC) documentation and measurement data were reviewed and validated for each sample collected. Analytical data reported by the laboratories were reviewed to assess laboratory and fi eld precision, accuracy, completeness, representativeness, and comparability with respect to method compliance and the DQOs of the particular program.
Th e following sources reviewed and validated data at a minimum of three levels:
1. Th e analytical laboratory, where data was validated according to the laboratory’s QA plan, Standard Operating Procedures (SOP), and client-specifi c requirements,
2. A qualifi ed member of Sandia’s SMO staff , who reviews the analytical reports and corresponding sample collection and ARCOC documentation for completeness and laboratory contract compliance, and
3. A Sandia project leader, who is responsible for program objectives, regulatory compliance, and project-specifi c data quality requirements. Th e project leader makes the fi nal decision regarding the usability and reporting of the data.
Additionally, all groundwater monitoring data, site wide confi rmatory data, and a specifi ed percentage of other program data are validated to detailed method-specifi ed requirements and qualifi ed in accordance with the Data Validation Procedure for Chemical and Radiochemical Data (SNL 2007).

2010 Annual Site Environmental Report7-8
Th is page intentionally left blank.
References, Permits, Regula ons & Standards for Environmental Programs 8-1
ACGIH 2010 American Conference of Government Industrial Hygienists, 2010 TLVs and BEIs, Cincinnati, OH, 2010.
Bearzi 2009 Bearzi, J.P. (New Mexico Environment Department), July 2009. Letter to K. Davis (U.S. Department of Energy) and F. Nimick (Sandia Corporation), Approval: Chemical Waste Landfi ll Evapo-transpirative Cover Plan, June 2009, Sandia National Laboratories NM5890110518, HWB-SNL-09-010 (July 31, 2009).
Bearzi 2008 Bearzi, J.P. (New Mexico Environment Department), December 2008. Letter to K. Davis (U.S. Department of Energy) and F. Nimick (Sandia Corporation), Conditional Approval, Mixed Waste Landfi ll Corrective Measures Implementation Plan, November 2005, Sandia National Laboratories NM5890110518, SNL-05-025 (December 22, 2008).
Brookins 1992 Brookins, D., Background Radiation in the Albuquerque, New Mexico, U.S.A., Area, in Environmental Geology and Water Science, Vol. 19, No. 1, pp. 11-15 (1992).
Davis 2009 Davis, K. (U.S. Department of Energy), February 2009. Letter to J. Bearzi (New Mexico Environment Department), submitting requested changes in the form of replacement pages in response to the Mixed Waste Landfi ll Conditional Approval letter from the New Mexico Environment Department dated December 22, 2008 (February 12, 2009).
Davis 2008 Davis, K. (U.S. Department of Energy), November 2008. Letter to J. Bearzi (New Mexico Environment Department), submitting responses to the New Mexico Environment Department Notice of Disapproval on the Mixed Waste Landfi ll Corrective Measures Implementation Plan dated October 10, 2008 (November 26, 2008).
Dinwiddie Dinwiddie, R.S., Request for Supplemental Information: Background Concentrations 1997 Report, SNL/KAFB, Letter from S. Dinwiddie, State of New Mexico Environment
Department, Hazardous & Radioactive Materials Bureau, September 24, 1997, to Michael J. Zamorski, U.S. Department of Energy, Kirtland Area Offi ce.
DOC 2011 U.S. Department of Commerce, U.S. Census Bureau, website at <http://www.census.gov/> Washington, DC (2011).
DOE 2010 Final Environmental Assessment for Removal Actions at the Technical Area III Classifi ed Waste Landfi ll, Sandia National Laboratories, New Mexico, DOE/EA-1729 and Finding of No Signifi cant Impact, August 27, 2010, U.S. Department of Energy, National Nuclear Security Administration, Albuquerque, NM (August 2010).
DOE 2008 DOE Order 430.2B, Change 1 (See DOE Orders Section).
DOE 2008a DOE Order 450.1A (See DOE Orders Section).
DOE 2007 DOE Manual 231.1-1A, Change 2 (See DOE Orders Section).
DOE 2005 DOE Order 414.1C (See DOE Orders Section).
References, Regulations & Standardsfor Environmental Programs

2010 Annual Site Environmental Report8-2
DOE 2003 DOE Manual 231.1-2 (See DOE Orders Section).
DOE 2002 U.S. Department of Energy, Title V Operating Permit Application #515 (2002 update; Volume 1 for Sandia National Laboratories). DOE/Sandia Site Offi ce, Albuquerque, NM (2002).
DOE 2001 DOE Order 435.1, Change 1 (See DOE Orders Section).
DOE 1999 U.S. Department of Energy, Sandia National Laboratories Final Site-Wide Environmental Impact Statement (SWEIS), DOE/EIS-0281. DOE Albuquerque Operations Offi ce, Albuquerque, NM (October 1999; ROD December 6, 1999).
DOE 1993 DOE Order 5400.5, Change 2 (See DOE Orders Section).
DOE 1987 U.S. Department of Energy/Albuquerque Operations Offi ce (DOE/AL), Comprehensive Environmental Assessment and Response Program (CEARP) Phase 1: Installation Assessment, draft. DOE/Albuquerque Area Offi ce, Environment, Safety and Health Division, Albuquerque, NM (September 1987).
DOE/SNL U.S. Department of Energy/Sandia National Laboratories, Environmental Restoration2006 Project Long-Term Stewardship (LTS) Implementation Plan. DOE/Sandia Site Offi ce and
Sandia National Laboratories, Albuquerque, NM (September 2006).
Dragun and Dragun, J. and K. Chekiri, Elements in North American Soils. Th e Association for Chekiri 2005 Environmental Health and Sciences, Amherst, MA (2005).
EPA 2006 U.S. Environmental Protection Agency, Radiation Risk Assessment Software (CAP88-PC), Version 3.0. Available on the EPA web site at < http://www.epa.gov/radiation/assessment/CAP88/index.html>.
EPA 2002 U.S. Environmental Protection Agency, Consolidated Emissions Reporting, Federal Register, 67 FR 39602 (June 10, 2002).
EPA 1997 U.S. Environmental Protection Agency (EPA) Region VI, September 1997, Module IV, Special Conditions Pursuant to the 1984 Hazardous and Solid Waste Amendments (HSWA) to RCRA, of the Resource Conservation and Recovery Act Permit for Sandia National Laboratories, EPA ID Number NM5890110518, issued September 25, 1997.
EPA 1985 U.S. Environmental Protection Agency, Hazardous Waste Management System; Final Codifi cation Rule. Federal Register, 50 FR 28702 (p. 28712) (July 15, 1985).
Gore 1993 Gore, A., From Red Tape to Results: Creating a Government that Works Better and Costs Less (Report of the National Performance Review). U.S. Government Printing Offi ce, Washington, DC (1993).
Grant 1982 Grant, P.R., Jr., Geothermal Potential in the Albuquerque Area, New Mexico, in Guidebook-New Mexico Geological Society, Volume 33, pp. 325-331 (1982). New Mexico Geological Society, Albuquerque, NM (1982).
IOS 2008 International Organization for Standardization, Quality Management Systems - Requirements (ISO 9001), International Organization for Standardization, Geneva, Switzerland (2008).

References, Permits, Regula ons & Standards for Environmental Programs 8-3
IOS 2004 International Organization for Standardization, Environmental Management Systems - Requirements with Guidance (ISO 14001), International Organization for Standardization, Geneva, Switzerland (2004).
Kabata- Kabata-Pendias, A., Trace Elements in Soils and Plants, 3rd. Ed. CRC Press, Inc., BocaPendias 2000 Raton, FL (2000).
Kelley 1977 Kelley, V. C., Geology of Albuquerque Basin, New Mexico, Memoir 33. New Mexico Bureau of Mines and Mineral Resources, Socorro, NM (1977).
Lozinsky Lozinsky, R., and R.H. Tedford, Geology and Paleontology of the Santa Fe Group, et al. 1991 Southwestern Albuquerque Basin, Valencia County, New Mexico. New Mexico Bureau of
Mines and Mineral Resources, New Mexico Institute of Mining and Technology, Socorro, NM (1991).
Moats, W. Moats, W.P., December 16, 2003, New Mexico Environment Department (NMED) Letter to 2003 K.L. Boardman (U.S. Department of Energy) and P.B. Davies (Sandia Corporation), Approval
of the Chemical Waste Landfi ll, Landfi ll Excavation Voluntary Corrective Measure Final Report, April 2003, EPA ID# NM5890110518, HWB SNL-03-012 (2003).
NCRP 2009 National Council on Radiation Protection and Measurements (NCRP), Ionizing Radiation Exposure of the Population of the United States, NCRP Report 160. National Council on Radiation Protection and Measurements, Bethesda, MD (2009).
NMDOA New Mexico Department of Agriculture website at <http://nmdaweb.nmsu.edu/> (2011).2011
NMED 2009 NMED, Hazardous Waste Bureau and Ground Water Quality Bureau Voluntary Remediation Program, Technical Background Document for Development of Soil Screening Levels, Revision 5.0 (2009).
NMED 2009a New Mexico Environment Department (NMED), October 2009. Final Permit Decision and Response to Comments, Post-Closure Care Permit for the Chemical Waste Landfi ll, Sandia National Laboratories, EPA ID# NM5890110518, SNL-06-022. New Mexico Environment Department, Hazardous Waste Bureau, Santa Fe, New Mexico (October 15, 2009)
NMED 2005 New Mexico Environment Department (NMED), May 2005. Final Order, State of New Mexico Before the Secretary of the Environment in the Matter of Request for a Class 3 Permit Modifi cation for Corrective Measures for the Mixed Waste Landfi ll, Sandia National Laboratories, Bernalillo County, New Mexico. EPA ID #5890110518 (May 26, 2005).
NMED 2004 New Mexico Environment Department (NMED), Federal Facilities Compliance Order (Sandia National Laboratories, New Mexico), as amended by NMED, Santa Fe, NM (Amendment No. 5 dated December 22, 2010).
Puissant 2009 Puissant, P., Statement of Work for Analytical Laboratories, Revision 4, Sandia National Laboratories/New Mexico (SNL/NM). Sandia National Laboratories, Albuquerque, NM (May 2009).
Shyr, Herrera, Shyr, L., H. Herrera, R. Haaker, Th e Role of Data Analysis in Sampling Design of Haaker 1998 Environmental Monitoring, SAND98-0612. Sandia National Laboratories, Albuquerque, NM
(March 1998).

2010 Annual Site Environmental Report8-4
SNL 2011 Sandia National Laboratories, 2010 Data Analysis in Support of the Annual Site Environmental Report, Sandia National Laboratories, Albuquerque, NM (2011).
SNL 2011a Sandia National Laboratories, NESHAP Annual Report for CY10, Sandia National Laboratories, New Mexico, Sandia National Laboratories, Albuquerque, NM (2011).
SNL 2011b Sandia National Laboratories, Chemical Inventory Report, CY 2010. Sandia National Laboratories, Albuquerque, NM (June 2011).
SNL 2010 Sandia National Laboratories, Chemical Waste Landfi ll Final Resource Conservation and Recovery Act (RCRA) Closure Report, Sandia National Laboratories, Albuquerque, NM (September 2010).
SNL 2010a Sandia National Laboratories, Corrective Action Management Unit (CAMU) Vadose Zone Monitoring System (VZMS) Annual Monitoring Results Report, Sandia National Laboratories, Albuquerque, NM (September 2010).
SNL 2010b Sandia National Laboratories, Site Treatment Plan for Mixed Waste, FY09 Update, Sandia National Laboratories, Albuquerque, NM (2010).
SNL 2010c Sandia National Laboratories, Quality Assurance Project Plan for the Sample Management Offi ce (Rev. 2), Sandia National Laboratories, Albuquerque, NM (2010).
SNL 2010d Sandia National Laboratories, Storm Water Pollution Prevention Plan (SWP3), PLA97-06, Rev. 4. Sandia National Laboratories, Albuquerque, NM (May 2010).
SNL 2009 Sandia National Laboratories, Chemical Waste Landfi ll Evapotranspirative Cover Plan, Sandia National Laboratories, Albuquerque, NM (2009).
SNL 2008 Sandia National Laboratories, Site Treatment Plan for Mixed Waste, Revision 12, Sandia National Laboratories, Albuquerque, NM (April 12, 2008).
SNL 2007 Sandia National Laboratories, Data Validation Procedure for Chemical and Radiochemical Data, Environmental Restoration Project, Sandia National Laboratories, Albuquerque, NM (2007).
SNL 2007a Sandia National Laboratories, Mixed Waste Landfi ll Long-Term Monitoring and Maintenance Plan. Environmental Restoration Project, Sandia National Laboratories, Albuquerque, NM (2007).
SNL 2006 Sandia National Laboratories, Chemical Analyses of Soil Samples Collected from the Sandia National Laboratories, New Mexico Environs, 1993-2005. SAND2006-1468, Sandia National Laboratories, Albuquerque, NM (March 2006).
SNL 2005 Sandia National Laboratories, Mixed Waste Landfi ll Corrective Measures Implementation Plan, Environmental Restoration Project, Sandia National Laboratories, Albuquerque, NM (November 2005).
SNL 2004 Sandia National Laboratories, Chemical Waste Landfi ll Corrective Measures Study Report, Sandia National Laboratories, Albuquerque, NM. (December 2004).

References, Permits, Regula ons & Standards for Environmental Programs 8-5
SNL 2003 Sandia National Laboratories, Chemical Waste Landfi ll – Landfi ll Excavation Voluntary Corrective Measure – Final Report, Sandia National Laboratories, Albuquerque, NM (April 2003).
SNL 2003a Sandia National Laboratories, Resource Conservation and Recovery Act Closure for the Corrective Action Management Unit, Technical Area III, Sandia National Laboratories/New Mexico Environmental Restoration Project, Sandia National Laboratories, Albuquerque, NM (December 2003).
SNL 2003b Sandia National Laboratories, Mixed Waste Landfi ll Corrective Measures Study, Environmental Restoration Project, Sandia National Laboratories, Albuquerque, NM (May 21, 2003).
SNL 2002 Sandia National Laboratories, Closure Plan for the Corrective Action Management Unit, Technical Area III, Sandia National Laboratories/New Mexico, Environmental Restoration Project, Sandia National Laboratories, Albuquerque, NM (October 2002).
SNL 1995 Sandia National Laboratories, Site-Wide Hydrogeologic Characterization Project, Calendar Year 1995 Annual Report, Sandia National Laboratories, Albuquerque, NM (1995).
Th orn et al. Th orn, C.R., D. P. McAda, and J.M. Kernodle, Geohydrologic Framework and Hydrologic1993 Conditions in the Albuquerque Basin, Central New Mexico, Water Resources Investigation
Report 93-4149. U.S. Geological Survey, Albuquerque, NM (1993).
USACE 1979 U.S. Army Corps of Engineers, Special Flood Hazard Information, Tijeras Arroyo and Arroyo del Coyote, Kirtland AFB, New Mexico. U.S. Army Corps of Engineers Albuquerque District, Albuquerque, NM (1979).
Van Hart Van Hart, D., Geologic Investigation: An Update of Subsurface Geology on Kirtland Air Force2003 Base, New Mexico, (SAND 2003-1869), Sandia National Laboratories, Albuquerque, NM
(2003).
Wagner 2007 Wagner, P. (U.S. Department of Energy), January 2007. Letter to J. Bearzi (New Mexico Environment Department), submitting the second response to the New Mexico Environment Department Notice of Disapproval, Mixed Waste Landfi ll Corrective Measures Implementation Plan, November 2005, and Requirement for Soil-Vapor Sampling and Analysis Plan, Sandia National Laboratories EPA ID NM5890110518, HWB-SNL-05-025 and additional information on the monitoring trigger evaluation process (January 19, 2007).
Wagner 2006 Wagner, P. (U.S. Department of Energy), December 2006. Letter to J. Bearzi (New Mexico Environment Department), submitting the fi rst response to the New Mexico Environment Department Notice of Disapproval, Mixed Waste Landfi ll Corrective Measures Implementation Plan, November 2005, and Requirement for Soil-Vapor Sampling and Analysis Plan, Sandia National Laboratories EPA ID NM5890110518, HWB-SNL-05-025 and the requested Soil Vapor Sampling and Analysis Plan (December 21, 2006).
Woodward Woodward, L. A., Tectonic Framework of Albuquerque Country, in Albuquerque1982 Country II, Guidebook - 33rd New Mexico Geological Society Field Conference. New
Mexico Geological Society, Albuquerque, NM (1982).

2010 Annual Site Environmental Report8-6
EXECUTIVE ORDERS
EO 11988 Floodplain Management, as amended (May 24, 1977).
EO 11990 Protection of Wetlands, as amended (May 24, 1977).
EO 12898 Federal Actions To Address Environmental Justice in Minority Populations and Low-Income Populations, as amended (February 11, 1994).
EO 13423 Strengthening Federal Environmental, Energy, and Transportation Management (January 2007).
EO 13514 Leadership in Environmental, Energy, and Economic Performance (October 2009).
DOE DIRECTIVES
DOE 2008 U.S. Department of Energy, Departmental Energy, Renewable Energy and Transportation Management, DOE Order 430.2B, U.S. Department of Energy, Washington, DC (February 27, 2008).
DOE 2008a U.S. Department of Energy, Environmental Protection Program, DOE Order 450.1A, U.S. Department of Energy, Washington, DC (6/4/2008).
DOE 2007 U.S. Department of Energy, Environment, Safety, and Health Reporting Manual, DOE Manual 231.1-1A, Change 2. U.S. Department of Energy, Washington, DC (6/12/2007).
DOE 2005 U.S. Department of Energy, Quality Assurance, DOE Order 414.1C, U.S. Department of Energy, Washington, DC (6/17/2005).
DOE 2003 U.S. Department of Energy, Occurrence Reporting and Processing of Operations Information, DOE Manual 231.1-2. U.S. Department of Energy, Washington, DC (8/19/2003).
DOE 2001 U.S. Department of Energy, Radioactive Waste Management, DOE Order 435.1, Change 1. U.S. Department of Energy, Washington, DC (8/28/2001).
DOE 1993 U.S. Department of Energy, Radiation Protection of the Public and the Environment, DOE Order 5400.5, Change 2. U.S. Department of Energy, Washington, DC (1/7/1993).
CODE OF FEDERAL REGULATIONS
10 CFR 830 Nuclear Safety Management
40 CFR 50 National Primary and Secondary Ambient Air Quality Standards
40 CFR 60 Standards of Performance for New Stationary Sources
40 CFR 61 National Emission Standards for Hazardous Air Pollutants (NESHAP) Subpart H, “National Emission Standards for Emissions of Radionuclides Other Th an Radon from Department of Energy Facilities”
40 CFR 82 Protection of Stratospheric Ozone

References, Permits, Regula ons & Standards for Environmental Programs 8-7
40 CFR 112 Oil Pollution Prevention
40 CFR 122 EPA Administered Permit Programs: Th e National Pollutant Discharge Elimination System (NPDES)
40 CFR 265 Interim Status Standards for Owners and Operators of Hazardous Waste Treatment, Storage, and Disposal Facilities
40 CFR 268 Land Disposal Restrictions
40 CFR 280 Technical Standards and Corrective Action Requirements for Owners and Operators of Underground Storage Tanks
40 CFR 302 Designation, Reportable Quantities, and Notifi cation (CERCLA Implementing Regulation)
40 CFR 355 Emergency Planning and Notifi cation
40 CFR 370 Hazardous Chemical Reporting: Community Right-To-Know
40 CFR 372 Toxic Chemical Release Reporting: Community Right-to-Know (EPCRA Implementing Regulation)
FEDERAL ACTS AND STATUTES
• American Indian Religious Freedom Act (AIRFA) of 1978 (42 U.S.C. §1996)• Archaeological Resources Protection Act (ARPA) of 1979 (16 U.S.C. §470aa )• Atomic Energy Act (AEA) of 1954 (42 U.S.C. §2011 et seq.) (Amended by the Price-Anderson Act)• Clean Air Act (CAA) and CAA Amendments (CAAA) of 1990 (42 U.S.C. §7401)• Clean Water Act (CWA) of 1977 (the Federal Water Pollution Control Act) (33 U.S.C. §1251) • Comprehensive Environmental Response, Compensation, and Liability Act (CERCLA) of 1980 (42 U.S.C. §9601) Amended by the Superfund Amendments and Reauthorization Act (SARA)• Emergency Planning and Community Right to Know Act (EPCRA) of 1986 (42 U.S.C. §11001 et seq.) (Also known as SARA Title III.)• Endangered Species Act (ESA) (16 U.S.C. §1531 et seq.)• Federal Facility Compliance Act (FFCA) of 1992 (42 U.S.C. §6961)• Federal Insecticide, Fungicide, and Rodenticide Act (FIFRA) (7 U.S.C. §136)• Migratory Bird Treaty Act (MBTA) of 1918, as amended (16 U.S.C. §703 et seq.)• National Environmental Policy Act (NEPA) of 1969 (42 U.S.C. §4321)• National Historic Preservation Act of 1966, as amended (16 U.S.C. §470 et seq.)• Pollution Prevention Act of 1990 (42 U.S.C. §13101 et seq.• Price-Anderson Amendments Act (PAAA) (42 U.S.C. §2282 et seq.) (see Atomic Energy Act)• Resource Conservation and Recovery Act (RCRA) of 1976 (42 U.S.C. §6901 et seq.)• Safe Drinking Water Act (SDWA) (42 U.S.C §300f )• Superfund Amendments and Reauthorization Act (SARA) of 1986 (see CERCLA)• Toxic Substances Control Act (TSCA) of 1976 (15 U.S.C. §2601 et seq.)______________________________Note: U.S.C. = United States Code

2010 Annual Site Environmental Report8-8
APPLICABLE LOCAL AND STATE LAWS AND REGULATIONS FOR ENVIRONMENTAL PROGRAMS
Water Quality
20.6.2 NMAC, Ground and Surface Water Protection 20.6.4 NMAC, Standards for Interstate and Intrastate Surface Waters 20.7.10 NMAC, Drinking Water Albuquerque/Bernalillo County Water Utility Authority, Sewer Use and Wastewater Control Ordinance Air Quality
20.11.2 NMAC, Fees 20.11.8 NMAC, New Mexico Ambient Air Quality Standards 20.11.20 NMAC, Fugitive Dust Control 20.11.21 NMAC, Open Burning 20.11.100 NMAC, Motor Vehicle Inspection
Miscellaneous
NMSA 76-4-1 et seq. New Mexico Pesticide Control Act 21.17.50 NMAC, Pesticides
Oil Storage and Spill Containment
Oil Storage Programs 20.5 NMAC, Petroleum Storage Tanks
Waste Management Hazardous Waste Management Program New Mexico Hazardous Waste Act (NMSA 1978, §74-4-1 et seq.) 20.4.1 NMAC, Hazardous Waste Management Solid Waste Program New Mexico Solid Waste Act (NMSA 1978, §74-9-1 et seq.) 20.9 NMAC, Solid Waste Management

References, Permits, Regula ons & Standards for Environmental Programs 8-9
TABLE 8-1. Summary of Environmental Permits and Registra ons in Eff ect During Calendar Year 2010
Permit Type and/or Facility Name
Location Permit Number Issue Date
Expiration Date
Regulatory Agency
SEWER WASTEWATERGeneral WW001 Station Manhole,
south of TA-IV at Tijeras Arroyo
2069 A 7/17/08 2/28/13 ABCWUA
General WW006 Station Manhole, at Pennsylvania Avenue
2069 F 6/17/10 3/31/14 ABCWUA
Microelectronics Development Laboratory (MDL)
WW007 Station Manhole, TA-I
2069 G 5/5/10 2/28/15 ABCWUA
General WW008 Station Manhole, south of TA-II at Tijeras Arroyo
2069 I 6/15/10 8/31/14 ABCWUA
General WW011 Station Manhole, north of TA-III (includes TAs-III and V, and Coyote Test Field sewer lines)
2069 K 5/25/10 10/31/14 ABCWUA
Center for IntegratedNanotechnologies (CINT)
CINT 2238A 1/5/07 4/30/11 ABCWUA
SURFACE DISCHARGE Pulsed Power Development Facilities (Discharge Plan)
TA-IV, Lagoons I and II DP-530 9/21/07 9/21/12 NMED
UNDERGROUND STORAGE TANKS (UST)UST (20,000 gallons) TA-I 1368 6/1/09 6/01/10 NMED UST (20,000 gallons) TA-I 1369 6/1/09 6/01/10 NMED ABOVE GROUND STORAGE TANKS (AST)AST / 2,000 TA-I 1370 6/1/09 6/01/10 NMED AST / 5,000 TA-III 1370 6/1/09 6/01/10 NMED AST / 5,500 CTF 1370 6/1/09 6/01/10 NMED STORM WATERNPDES INDUSTRIAL PERMITS National Pollution Discharge Elimination System (NPDES) “Multi-sector General” Permit
Storm water discharges from Industrial Activities at SNL/NM on KAFB
SNL/NM – NMR05GQ63 DOE/SSO – NMR05GP29
10/09 11/09
9/13 9/13
EPA
National Pollution Discharge Elimination System (NPDES) “Multi-sector General” Permit
Storm water discharges from Industrial Activities at the FAA/AANC/NDI Validation Center
SNL/NM – NMR05GL17 DOE/SSO – NMR05GH54
6/09 6/09
6/14 6/14
EPAEPA

2010 Annual Site Environmental Report8-10
TABLE 8-1. Summary of Environmental Permits and Registra ons in Eff ect During Calendar Year 2010 (Con nued)
Permit Type and/or Facility Name
Location Permit Number Issue Date
Expiration Date
Regulatory Agency
NPDES CONSTRUCTION PERMITS20th Street Stockpile Area
TA-I SNL/NM - NMR15E764 DOE/SSO - NMR15EB81
04/29/05 Active until terminated
EPA
Mixed Waste Landfill Cover
TA-III SNL/NM -NMR15EZ15 DOE/SSO - NMR15EZ62
05/18/06 Active until terminated
EPA
Technical Area III Concrete Recycle/Borrow
TA-III SNL/NM -NMR15F015 DOE/SSO -NMR15F012
5/31/06 Active until terminated
EPA
I Ave and 11th Street Mall Waterline Project
TA-I SNL/NM -NMR10GE04 DOE/SSO -NMR10GJ52
2/9/09 Active until terminated
EPA
Heating Systems Modernization (HSM)
TA-I SNL/NM -NMR15FK02 5/11/07 Active until terminated
EPA
Liquid Natural Gas TA-III SNL/NM -NMR10G703 10/31/08 Active until terminated
EPA
Thunder Range Range 2, 5, 6 Site 91 Breaching Site Site 9965
SNL/NM -NMR15G365 DOE/SSO -NMR15G366
6/03/08 Active until terminated
EPA
TA II Escarpment TA-II SNL/NM -NMR10G475 08/12/08 Active until terminated
EPA
Ion Beam Laboratory TA-I SNL/NM -NMR10G588 10/01/08 Active until terminated
EPA
9940 Complex Coyote SNL/NM - NMR10GO81 DOE/SSO -NMR15G366
9/1/09 Active until terminated
EPA
Building 957 Parking Lot
TA-I SNL/NM -NMR10GS55 12/14/09 Active until terminated
EPA
National Solar Thermal Test
Coyote SNL/NM -NMR10H626 12/7/10 Active until terminated
EPA
Test Capabilities Revitalization (TCR) Phase II
TA-III SNL/NM -NMR10GV578 4/1/10 Active until terminated
EPA
12th Street Roadway TA-I SNL/NM - NMR10H419 DOE/SSO -NMR10H422
9/14/10 Active until terminated
EPA
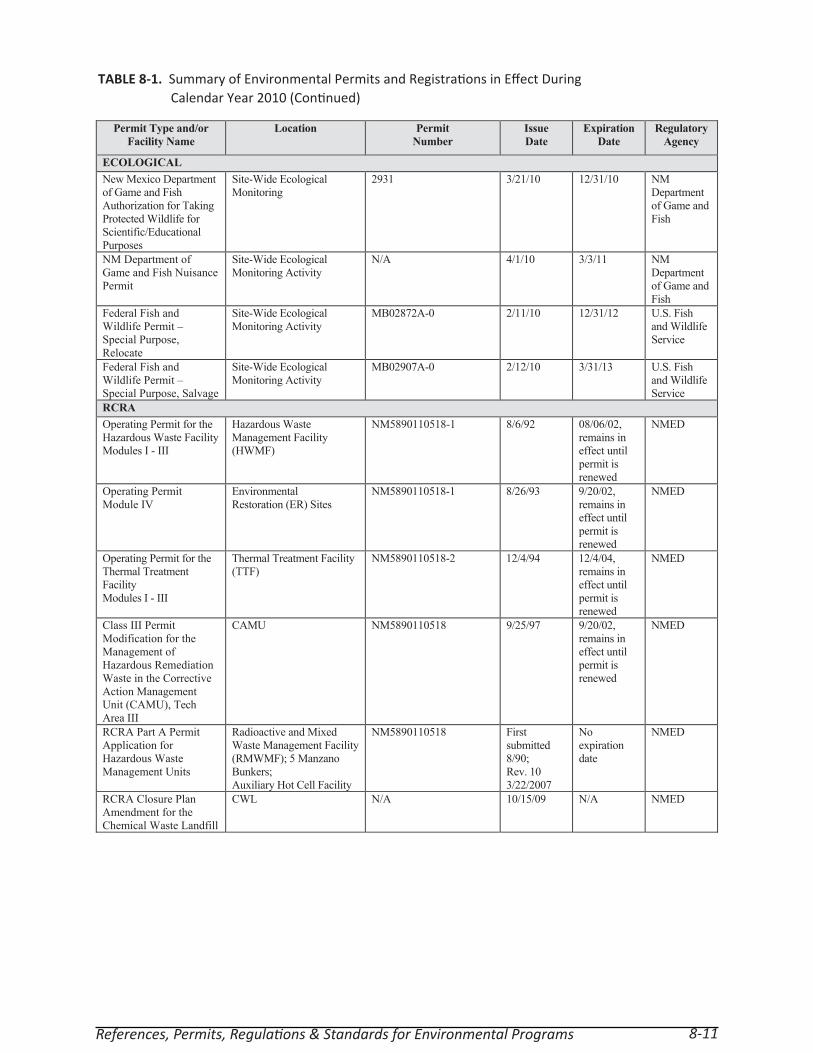
References, Permits, Regula ons & Standards for Environmental Programs 8-11
TABLE 8-1. Summary of Environmental Permits and Registra ons in Eff ect During Calendar Year 2010 (Con nued)
Permit Type and/or Facility Name
Location Permit Number
Issue Date
Expiration Date
Regulatory Agency
ECOLOGICAL New Mexico Department of Game and Fish Authorization for Taking Protected Wildlife for Scientific/Educational Purposes
Site-Wide Ecological Monitoring
2931 3/21/10 12/31/10 NM Department of Game and Fish
NM Department of Game and Fish Nuisance Permit
Site-Wide Ecological Monitoring Activity
N/A 4/1/10 3/3/11 NM Department of Game and Fish
Federal Fish and Wildlife Permit – Special Purpose, Relocate
Site-Wide Ecological Monitoring Activity
MB02872A-0 2/11/10 12/31/12 U.S. Fish and Wildlife Service
Federal Fish and Wildlife Permit – Special Purpose, Salvage
Site-Wide Ecological Monitoring Activity
MB02907A-0 2/12/10 3/31/13 U.S. Fish and Wildlife Service
RCRA Operating Permit for the Hazardous Waste Facility Modules I - III
Hazardous Waste Management Facility (HWMF)
NM5890110518-1 8/6/92 08/06/02, remains in effect until permit is renewed
NMED
Operating Permit Module IV
Environmental Restoration (ER) Sites
NM5890110518-1 8/26/93 9/20/02, remains in effect until permit is renewed
NMED
Operating Permit for the Thermal Treatment Facility Modules I - III
Thermal Treatment Facility (TTF)
NM5890110518-2 12/4/94 12/4/04, remains in effect until permit is renewed
NMED
Class III Permit Modification for the Management of Hazardous Remediation Waste in the Corrective Action Management Unit (CAMU), Tech Area III
CAMU NM5890110518 9/25/97 9/20/02, remains in effect until permit is renewed
NMED
RCRA Part A Permit Application for Hazardous Waste Management Units
Radioactive and Mixed Waste Management Facility (RMWMF); 5 Manzano Bunkers; Auxiliary Hot Cell Facility
NM5890110518 First submitted 8/90; Rev. 10 3/22/2007
Noexpiration date
NMED
RCRA Closure Plan Amendment for the Chemical Waste Landfill
CWL N/A 10/15/09 N/A NMED
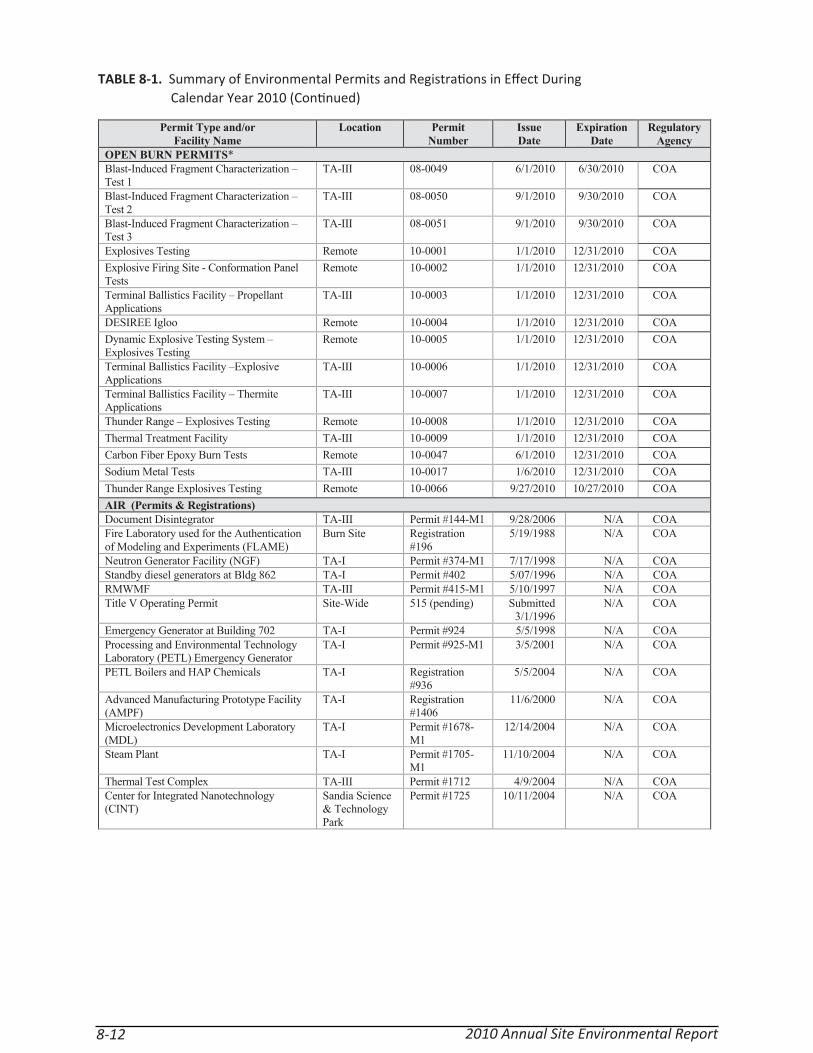
2010 Annual Site Environmental Report8-12
TABLE 8-1. Summary of Environmental Permits and Registra ons in Eff ect During Calendar Year 2010 (Con nued)
Permit Type and/or Facility Name
Location Permit Number
Issue Date
Expiration Date
Regulatory Agency
OPEN BURN PERMITS*Blast-Induced Fragment Characterization – Test 1
TA-III 08-0049 6/1/2010 6/30/2010 COA
Blast-Induced Fragment Characterization – Test 2
TA-III 08-0050 9/1/2010 9/30/2010 COA
Blast-Induced Fragment Characterization – Test 3
TA-III 08-0051 9/1/2010 9/30/2010 COA
Explosives Testing Remote 10-0001 1/1/2010 12/31/2010 COA Explosive Firing Site - Conformation Panel Tests
Remote 10-0002 1/1/2010 12/31/2010 COA
Terminal Ballistics Facility – Propellant Applications
TA-III 10-0003 1/1/2010 12/31/2010 COA
DESIREE Igloo Remote 10-0004 1/1/2010 12/31/2010 COA Dynamic Explosive Testing System – Explosives Testing
Remote 10-0005 1/1/2010 12/31/2010 COA
Terminal Ballistics Facility –Explosive Applications
TA-III 10-0006 1/1/2010 12/31/2010 COA
Terminal Ballistics Facility – Thermite Applications
TA-III 10-0007 1/1/2010 12/31/2010 COA
Thunder Range – Explosives Testing Remote 10-0008 1/1/2010 12/31/2010 COA Thermal Treatment Facility TA-III 10-0009 1/1/2010 12/31/2010 COA Carbon Fiber Epoxy Burn Tests Remote 10-0047 6/1/2010 12/31/2010 COA Sodium Metal Tests TA-III 10-0017 1/6/2010 12/31/2010 COA Thunder Range Explosives Testing Remote 10-0066 9/27/2010 10/27/2010 COA AIR (Permits & Registrations)Document Disintegrator TA-III Permit #144-M1 9/28/2006 N/A COA Fire Laboratory used for the Authentication of Modeling and Experiments (FLAME)
Burn Site Registration #196
5/19/1988 N/A COA
Neutron Generator Facility (NGF) TA-I Permit #374-M1 7/17/1998 N/A COA Standby diesel generators at Bldg 862 TA-I Permit #402 5/07/1996 N/A COA RMWMF TA-III Permit #415-M1 5/10/1997 N/A COA Title V Operating Permit Site-Wide 515 (pending) Submitted
3/1/1996 N/A COA
Emergency Generator at Building 702 TA-I Permit #924 5/5/1998 N/A COA Processing and Environmental Technology Laboratory (PETL) Emergency Generator
TA-I Permit #925-M1 3/5/2001 N/A COA
PETL Boilers and HAP Chemicals TA-I Registration #936
5/5/2004 N/A COA
Advanced Manufacturing Prototype Facility (AMPF)
TA-I Registration #1406
11/6/2000 N/A COA
Microelectronics Development Laboratory (MDL)
TA-I Permit #1678-M1
12/14/2004 N/A COA
Steam Plant TA-I Permit #1705-M1
11/10/2004 N/A COA
Thermal Test Complex TA-III Permit #1712 4/9/2004 N/A COA Center for Integrated Nanotechnology (CINT)
Sandia Science & Technology Park
Permit #1725 10/11/2004 N/A COA

References, Permits, Regula ons & Standards for Environmental Programs 8-13
TABLE 8-1. Summary of Environmental Permits and Registra ons in Eff ect During Calendar Year 2010 (Con nued)
Permit Type and/or Facility Name
Location Permit Number
Issue Date
Expiration Date
Regulatory Agency
AIR (Permits & Registrations) (concluded)MESA Facility Central Utility Building 858J TA-I Permit #1820 9/28/2006 N/A COA Building 899A Boilers TA-I Registration
#1823 4/1/2008 N/A COA
South East Tech Area I TA-I Permit #1828 9/28/2006 N/A COA Heating System Modernization Boilers TA-I Permit #1830 3/23/2007 N/A COA Building 878 HAP Chemical Registration TA-I Registration
#1888 5/28/2008 N/A COA
Strategic Defense Facility, Building 963 TA-IV Permit#1900 1/11/2008 N/A COA Miscellaneous HAP Registration Site Wide Permit Registration
#1901 5/28/2008 N/A COA
Building 865 HAP Registration TA-I Registration #1902
5/28/2008 N/A COA
Solar Tower HAP Registration Remote Registration #1903
5/28/2008 N/A COA
Building 869 HAP Registration TA-I Registration #1905
5/28/2008 N/A COA
Advanced Materials Laboratory (AML) HAP Registration
Offsite Registration #1906
5/28/2008 N/A COA
Building 962 Generator TA-IV Permit #1930 4/8/2009 N/A COA Building 833 Generator TA-I Permit #2097 9/1/2010 N/A COA Building 802 Boiler Registration TA-I Registration
#2109 10/28/2010 N/A COA
Building 804 Boiler Registration TA-I Registration #2110
11/8/2010 N/A COA
Building 810 Boiler Registration TA-I Registration #2111
11/8/2010 N/A COA
Building 823 Boiler Registration TA-I Registration #2112
11/8/2010 N/A COA
Building 840 Boiler Registration TA-I Registration #2113
11/8/2010 N/A COA
Building 857 Boiler Registration TA-I Registration #2114
11/8/2010 N/A COA
Building 860 Boiler Registration TA-I Registration #2115
11/8/2010 N/A COA
Building 880 Boiler Registration TA-I Registration #2116
11/30/2010 N/A COA
Building 890 Boiler Registration TA-I Registration #2117
11/29/2010 N/A COA
Building 887 Boiler Registration TA-I Registration #2118
11/29/2010 N/A COA
Building 891 Boiler Registration TA-I Registration #2119
11/29/2010 N/A COA
Building 892 Boiler Registration TA-I Registration #2120
11/30/2010 N/A COA
Building 894 Boiler Registration TA-I Registration #2121
11/30/2010 N/A COA
Building 897 Boiler Registration TA-I Registration #2122
11/30/2010 N/A COA

2010 Annual Site Environmental Report8-14
TABLE 8-1. Summary of Environmental Permits and Registra ons in Eff ect During Calendar Year 2010 (Concluded)
Permit Type and/or Facility Name
Location Permit Number
Issue Date
Expiration Date
Regulatory Agency
FUGITIVE DUST CONTROL AND DEMOLITION PERMIT FILE** (Permits & Registrations)Borrow Site – Cell 1 Programmatic TA-III P08-0005 12/10/2007 12/10/2012 COA Moving Vehicle Test Track Programmatic TA-III P08-0004 12/11/2007 12/11/2012 COA Thunder Range – Range 6 programmatic Remote P08-0061 8/7/2008 8/7/2013 COA Thunder Range – Range 1 Programmatic Remote P08-0062 8/7/2008 8/7/2013 COA Thunder Range – Range 2 Programmatic Remote P08-0064 8/7/2008 8/7/2013 COA Thunder Range – Range 5 Programmatic Remote P08-0063 8/7/2008 8/7/2013 COA Thunder Range – Range 7 Programmatic Remote P09-0021 12/22/2009 12/22/2014 COA Thunder Range – Range 4 Programmatic Remote P09-0022 12/22/2009 12/22/2014 COA Thunder Range – Range 8 Programmatic Remote P09-0018 8/14/2009 8/14/2014 COA DETS Complex/Building 9940 (Modification/Expansion)
Remote P09-0014 7/8/2009 7/8/2014 COA
DETS – East Remote P09-0016 7/9/2009 7/9/2014 COA DETS – West Remote P09-0015 7/9/2009 7/9/2014 COA DETS – South Remote P10-0018 12/2/2010 12/2/2015 COA Large Scale LNG Test Site TA-III 1009-626-3732 5/5/2007 5/5/2012 COA HSM Project TA-I 10-10-3726 5/14/2007 12/31/2010 COA Ion Beam Lab Construction TA-I 10-204-4014 6/30/2008 6/30/2013 COA TA-I Water Main Replacement TA-I 10-344-4141 3/23/2009 3/23/2010 COA Building 919 Demolition TA-II 10-210-4142 3/23/2009 3/23/2010 COA Steam Plant Tank Farm Removal TA-I 10-210-4147 4/3/2009 4/3/2010 COA Tank Farm Fuel Line Removal TA-I 10-354-4148 4/3/2009 4/3/2010 COA Mixed Waste Landfill Cover TA-III 10-683-4161 4/28/2009 4/28/2014 COA Borrow Pit Cell 3 TA-III 10-683-4160 4/28/2009 4/28/2014 COA 9920 Berm Construction TA-III 10-62-4169 5/6/2009 5/6/2010 COA Substation 16 Replacement Remote 10-469-4170 5/15/2009 5/15/2014 COA 14th Street Channel Repairs TA-II 10-564-4208 7/27/2009 7/27/2010 COA Building 957 Parking Lot Repairs TA-II 1009-720-4284 12/11/2009 12/11/2010 COA Building 605 – Steam Plant TA-I 10-210-4316 3/30/2010 3/30/2012 COA Building 6570 TCR Updates TA-III 10-720-4320 4/5/2010 4/5/2010 COA Building 884 Demolition TA-I 10-210-4398 10/1/2010 10/1/2012 COA ARRA Projects at the National Solar Thermal Test Facility
Remote 10-564-4405 10/20/2010 10/20/2015 COA
Pedestrian Pathway to TA-IV TA-II & TA-IV
1339-786-4439 1/3/2010 1/3/2012 COA
NOTES: *Open Burn Permits are issued by the City of Albuquerque for no more than a year at any one time. **Permits are obtained by general contractors directly from City of Albuquerque COA = City of Albuquerque CTF = Coyote Test Field TA= technical area SNL/NM = Sandia National Laboratories, New Mexico EPA = U.S. Environmental Protection Agency KAFB = Kirtland Air Force Base N/A = not applicable NM = New Mexico NMED = New Mexico Environment Department CWL = Classified Waste Landfill RCRA = Resource Conservation and Recovery Act HAP = hazardous air pollutant N/A = not applicable U.S. = United States LNG = Liquefied Natural Gas DETS = Dynamic Explosives Test Site DOE = Department of Energy ABCWUA = Albuquerque Bernalillo County Water Utility Authority FAA = Federal Aviation Administration SSO = Sandia Site Office AANC = Airworthiness Assurance NDI Validation Center NDI = Non-destructive Inspection ARRA = American Recovery and Reinvestment Act

References, Permits, Regula ons & Standards for Environmental Programs 8-15
TABLE 8-2. Federal and State Air Regula ons Applicable to SNL/NM
CAA Title
CAA Section
Federal Regulation
Local Regulation
Subject
I 176(c) 40 CFR 51 40 CFR 93
20 NMAC 11.04 20 NMAC 11.03
Conformity of Federal Actions (State and Federal Plans) General and Transportation
110 40 CFR 53 40 CFR 58
N/A Ambient Air Quality Surveillance
109 40 CFR 50 20 NMAC 11.08 National Primary and Secondary Ambient Air Quality Standards (NAAQS)
114 40 CFR 98 Mandatory Greenhouse Gas Reporting 165-166 40 CFR 52 20 NMAC 11.02 Permit Fees
40 CFR 52 20 NMAC 11.05 Visible Air Contaminants 40 CFR 52 20 NMAC 11.06 Emergency Action Plan 40 CFR 52 20 NMAC 11.07 Variance Procedure 40 CFR 52 20 NMAC 11.20 Fugitive Dust Control 40 CFR 52 20 NMAC 11.21 Open Burning 40 CFR 51–52 20 NMAC 11.40 Source Registration 40 CFR 51–52 20 NMAC 11.41 Authority-to-Construct 40 CFR 51.100 20 NMAC 11.43 Stack Height Requirements 40 CFR 51 20 NMAC 11.44 Emissions Trading
171-193 40 CFR 51–52 20 NMAC 11.60 Permitting in Nonattainment Areas 160-169 40 CFR 52 20 NMAC 11.61 Prevention of Significant Deterioration 165-166 40 CFR 60
40 CFR 63 20 NMAC 11.65 Volatile Organic Compounds (VOC)
40 CFR 60 20 NMAC 11.66 Process Equipment 40 CFR 60 20 NMAC 11.22 Wood Burning 40 CFR 60 20 NMAC 11.63 New Source Performance Standards (NSPS) 40 CFR 60 20 NMAC 11.67 Equipment, Emissions and Limitations(stationary
combustion sources) 40 CFR 60 20 NMAC 11.68 Incinerators 40 CFR 60 20 NMAC 11.69 Pathological Waste Destructors 40 CFR 61 40 CFR 63
20 NMAC 11.64 National Emission Standards for Hazardous Air Pollutants (NESHAP) Subpart H – Radionuclides Subpart M – Asbestos Subpart ZZZZ – Stationary Reciprocating Internal Combustion Engines Subpart CCCCCC – Gasoline Dispensing Facilities
II 202-211 40 CFR 80 20 NMAC 11.101 Motor Vehicle Inspection: Centralized 20 NMAC 11.102 Oxygenated Fuels 20 NMAC 11.103 Motor Vehicle Visible Emissions
213-219 40 CFR 85-86 20 NMAC 11.100 Motor Vehicle Inspection: Decentralized III 319 40 CFR 53 20 NMAC 2.3
20 NMAC 2.5 Air Quality Monitoring
IV 401-416 40 CFR 72-78 20 NMAC 11.62 Acid Rain V 501-507 40 CFR 70-71 20 NMAC 11.42 Operating Permits VI 601-618 40 CFR 82 20 NMAC 11.23 Stratospheric Ozone Protection VII 113-114 40 CFR 64 20 NMAC 11.90 Administration, Enforcement, Inspection
NOTES: CAA = Clean Air Act NMAC = New Mexico Administrative Code
CFR = Code of Federal Regulations SNL/NM = Sandia National Laboratories, New Mexico N/A = not applicable

2010 Annual Site Environmental Report8-16
TABLE 8-3. Summary of Compliance History with Regard to Mixed Waste (MW) at SNL/NM
Date Milestone Comment
1984 Amendments to Resource Conservation and Recovery Act (RCRA) and Hazardous and Solid Waste Amendments (HSWA) in 1984
MW became an issue after amendments to RCRA and HSWA enforced Land Disposal Restrictions (LDR), including prohibition on storage of wastes for more than one year.
Aug 1990 RCRA Part A Interim Status Permit Application
Submitted RCRA Part A Interim Status Permit application for MW storage. Later revisions to the interim status permit added proposed MW treatment processes.
Oct 1992 Federal Facilities Compliance Act (FFCA) Passed
The FFCA allows storage of MW over one-year RCRA time limit. Requires U.S. Department of Energy (DOE) to submit a site treatment plan for MW.
Dec 1992 Notice of Noncompliance (NON) Issued
U.S. Environmental Protection Agency (EPA) issued a NON for storage of RCRA-regulated MW over the one-year maximum period.
Oct 1993 Conceptual Site Treatment Plan Submitted
DOE submitted Conceptual Site Treatment Plan for Mixed Waste to NMED; other drafts followed.
Mar 1995 Final Site Treatment Plan Submitted DOE submitted final Site Treatment Plan for Mixed Waste to NMED.
Jun 1995 Historical Disposal Requests Validation (HDRV) Project Initiated
The HDRV Project was initiated to characterize and sort legacy MW. Project continued into 1997, when it was replaced with new sorting procedures.
Oct 1995 Federal Facility Compliance Order (FFCO) Signed
The FFCO, an agreement between State, DOE, and Sandia Corporation, details specific actions required with regard to MW management, including the requirement to develop of a Site Treatment Plan (STP), to be updated annually.
Mar 1996 STP Milestones Met Updated STP to reflect FY 1995 activities.
Sep 1996 First MW Shipment
FFCO Amendment No. 1
First MW shipment made, MW sent to Perma-Fix/DSSI for treatment.
FFCO amended.
Dec 1996 Revisions to Proposed Treatment Methods DOE and Sandia re-submitted Part A and B permit application, to reflect revisions to proposed on-site treatment methods.
May 1997 FFCO Amendment No. 2 FFCO amended.
Dec 1997 On-site MW Treatment Onsite treatment of MW began at the RMWMF in Bldg. 6920. Additionally, Bldg. 6921 was converted to a laboratory for the treatment of certain types of MW.
1997 STP Milestones Met Treated wastes on site and shipped mixed wastes to off-site treatment and disposal facilities, meeting all treatment and disposal milestones. Updated STP to reflect FY 1996 activities and changes to proposed treatment technologies. NMED approved Revision 1 to STP, revising waste volumes and treatment/disposal technologies, and establishing new deadlines.
1998 STP Milestones Met Treated wastes on site and shipped mixed wastes to off-site treatment and disposal facilities, meeting all treatment and disposal milestones. Updated STP to reflect FY 1997 activities and changes to proposed treatment technologies. NMED approved Revision 2 to STP, revising waste volumes and treatment/disposal technologies, and establishing new deadlines.

References, Permits, Regula ons & Standards for Environmental Programs 8-17
TABLE 8-3. Summary of Compliance History with Regard to Mixed Waste (MW) at SNL/NM (Con nued)
Date Milestone Comment
1999 STP Milestones Met Treated wastes on site and shipped mixed wastes to off-site treatment and disposal facilities, meeting all treatment and disposal milestones. Updated STP to reflect FY 1998 activities and changes to proposed treatment technologies. NMED approved Revision 3 to STP, revising waste volumes and treatment/disposal technologies, and establishing new deadlines.
2000 STP Milestones Met Treated wastes on site and shipped mixed wastes to off-site treatment and disposal facilities, meeting all treatment and disposal milestones. Updated STP to reflect FY 1999 activities and changes to proposed treatment technologies. NMED approved Revision 4 to STP, revising waste volumes and treatment/disposal technologies, and establishing new deadlines.
2001 STP Milestones Met Treated wastes on site and shipped mixed wastes to off-site treatment and disposal facilities, meeting all treatment and disposal milestones. Updated STP to reflect FY 2000 activities and changes to proposed treatment technologies. NMED approved Revision 5 to STP, revising waste volumes and treatment/disposal technologies, and establishing new deadlines.
May 2001 FFCO Amendment No. 3 FFCO amended.
2002 STP Milestones Met Treated wastes on site and shipped mixed wastes to off-site treatment and disposal facilities, meeting all treatment and disposal milestones. Updated STP to reflect FY 2001 activities and changes to proposed treatment technologies. NMED approved Revision 6 to STP, revising waste volumes and treatment/disposal technologies, and establishing new deadlines.
Feb 2002 Revisions to Permit Application DOE and Sandia submitted updated Part A and B permit application to NMED to reflect revisions to on-site waste management operations. Permit application for mixed waste management units is combined with permit renewal request for hazardous waste management units at SNL/NM.
2003 STP Milestones Met Treated wastes on site and shipped mixed wastes to off-site treatment and disposal facilities, meeting all treatment and disposal milestones. Updated STP to reflect FY 2002 activities and changes to proposed treatment technologies. NMED approved Revision 7 to STP, revising waste volumes and treatment/disposal technologies, and establishing new deadlines.
Apr 2003; Nov 2003
Revisions to Permit Application DOE and Sandia revised Part A and Part B permit application in response to NMED comments.
2004 STP Milestones Met Treated wastes on site and shipped mixed wastes to off-site treatment and disposal facilities, meeting all treatment and disposal milestones. Updated STP to reflect FY 2003 activities and changes to proposed treatment technologies. NMED approved Revision 8 to STP, revising waste volumes and treatment/disposal technologies, and establishing new deadlines.
Apr 2004 FFCO Amendment No. 4 FFCO amended.

2010 Annual Site Environmental Report8-18
TABLE 8-3. Summary of Compliance History with Regard to Mixed Waste (MW) at SNL/NM (Concluded)
Date Milestone Comment
Nov 2004 Revisions to Permit Application DOE and Sandia revised Part A and Part B permit application in response to NMED comments.
2005 STP Milestones Met Treated wastes on site and shipped mixed wastes to off-site treatment and disposal facilities, meeting all treatment and disposal milestones. Updated STP to reflect FY 2004 activities and changes to proposed treatment technologies. NMED approved Revision 9 to STP, revising waste volumes and treatment/disposal technologies, and establishing new deadlines.
Jun 2005; Oct 2005
Revisions to Permit Application DOE and Sandia revised Part A and Part B permit application to reflect changes in waste management operations.
May 2006 Revisions to Permit Application DOE and Sandia revised Part B permit application to reflect changes in waste management operations.
2006 STP Milestones Met Treated wastes on site and shipped mixed wastes to off-site treatment and disposal facilities, meeting all treatment and disposal milestones. Updated STP to reflect FY 2005 activities and changes to proposed treatment technologies. NMED approved Revision 10 to STP, revising waste volumes and treatment/disposal technologies, and establishing new deadlines.
Mar 2007 Revisions to Permit Application DOE and Sandia revised Part A and Part B permit application to reflect changes in waste management operations.
Aug 2007 Draft Permit Issued NMED issued draft permit to DOE and Sandia, and made it available for public comment.
2007 STP Milestones Met Treated wastes on site and shipped mixed wastes to off-site treatment and disposal facilities, meeting all treatment and disposal milestones. Updated STP to reflect FY 2006 activities and changes to proposed treatment technologies. NMED approved Revision 11 to STP, revising waste volumes and treatment/disposal technologies, and establishing new deadlines.
Jan 2008 Comments on Draft Permit Submitted DOE and Sandia submit extensive comments on draft permit to NMED and request resolution of comments.
2008 STP Milestones Met Treated wastes on site and shipped mixed wastes to off-site treatment and disposal facilities, meeting all treatment and disposal milestones. Updated STP to reflect FY 2007 activities and changes to proposed treatment technologies. NMED approved Revision 12 to STP, revising waste volumes and treatment/disposal technologies, and establishing new deadlines.
2009 STP Milestones Met Treated wastes on site and shipped mixed wastes to off-site treatment and disposal facilities, meeting all treatment and disposal milestones. Updated STP to reflect FY 2008 activities and changes to proposed treatment technologies.
2010 STP Milestones Met Treated wastes on site and shipped mixed wastes to off-site treatment and disposal facilities, meeting all treatment and disposal milestones. Updated STP to reflect FY 2009 activities and changes to proposed treatment technologies.
Dec 2010 FFCO Amendment No. 5 FFCO amended to extend certain compliance deadlines.
NOTES: DSSI = Diversified Scientific Services, Inc. FY = fiscal year NMED = New Mexico Environment Department RMWMF = Radioactive and Mixed Waste Management Facility SNL/NM = Sandia National Laboratories/New Mexico

References, Permits, Regula ons & Standards for Environmental Programs 8-19
TABLE 8-4. Mixed Waste Treatment and Disposal Status (End of FY 2010)
Waste Category
Volume (m3)
Description Status and Plans
TG 1 0 Inorganic Debris with Explosive Component No waste currently in inventory TG 2 0 Inorganic Debris with a Water Reactive Component No waste currently in inventory TG 3 0 Reactive Metals No waste currently in inventory TG 4 0 Elemental Lead No waste currently in inventory. TG 5 0 Aqueous Liquids (Corrosive) No waste currently in inventory. TG 6 0 Elemental Mercury No waste currently in inventory. TG 7 0 Organic Liquids I No waste currently in inventory. TG 8 0 Organic Debris with Organic Contaminants TG 9 0 Inorganic Debris with TCLP Metals No waste currently in inventory TG 10 0 Heterogeneous Debris No waste currently in inventory TG 11 0 Organic Liquids II No waste currently in inventory. TG 12 0 Organic Debris with TCLP Metals No waste currently in inventory. TG 13 0 Oxidizers No waste currently in inventory. TG 14 0 Aqueous Liquids with Organic Contaminants No waste currently in inventory. TG 15 0 Soils <50 percent Debris & Particulates with TCLP
Metals No waste currently in inventory.
TG 16 0 Cyanide Waste No waste currently in inventory. TG 17 0 Liquid/Solid with Organic and/or Metal
Contaminants No waste currently in inventory.
TG 18 0 Particulates with Organic Contaminants No waste currently in inventory. TG 19 0 Liquids with Metals No waste currently in inventory. TG 20 0 Propellant with TCLP Metals No waste currently in inventory. TG 21 0.003 Sealed Sources with TCLP Metals Utilizing on-site treatment or shipping to
off-site treatment and disposal facilities. aTG 22 0 Reserved Not Applicable TG 23 0 Thermal Batteries No waste currently in inventory. TG 24 0 Spark Gap Tubes with TCLP Metals No waste currently in inventory. TG 25 0 Classified Items with TCLP Metals No waste currently in inventory TG 26 0 Debris Items with Reactive Compounds & TCLP
Metals No waste currently in inventory.
TG 27 0 High Mercury Solids & Liquids No waste currently in inventory TRU/MW 0.92 TRU/MW Investigating off-site treatment and
disposal options.
NOTES: a Treatment and/or disposal at one or more permitted off-site mixed waste management facilities. Treatments are detailed in the Site Treatment Plan for Mixed Waste, Sandia National Laboratories, New Mexico, Revision 12, Sandia National Laboratories, New Mexico (April 4, 2008) (SNL 2008) and the Site Treatment Plan for MW, FY09 Update (SNL 2010b). TCLP = toxicity characteristic leaching procedure m3 = cubic meters TRU/MW = transuranic/mixed waste TG = Treatability Group *At the end of 2010.
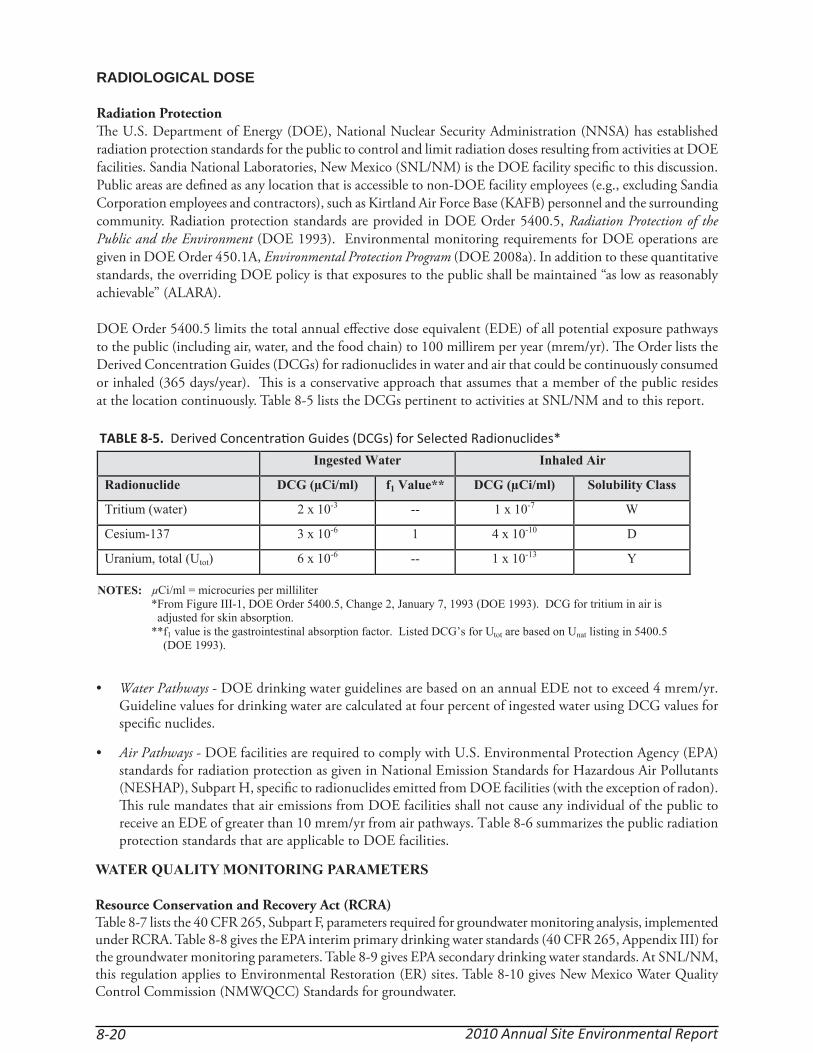
2010 Annual Site Environmental Report8-20
RADIOLOGICAL DOSE
Radiation ProtectionTh e U.S. Department of Energy (DOE), National Nuclear Security Administration (NNSA) has established radiation protection standards for the public to control and limit radiation doses resulting from activities at DOE facilities. Sandia National Laboratories, New Mexico (SNL/NM) is the DOE facility specifi c to this discussion. Public areas are defi ned as any location that is accessible to non-DOE facility employees (e.g., excluding Sandia Corporation employees and contractors), such as Kirtland Air Force Base (KAFB) personnel and the surrounding community. Radiation protection standards are provided in DOE Order 5400.5, Radiation Protection of the Public and the Environment (DOE 1993). Environmental monitoring requirements for DOE operations are given in DOE Order 450.1A, Environmental Protection Program (DOE 2008a). In addition to these quantitative standards, the overriding DOE policy is that exposures to the public shall be maintained “as low as reasonably achievable” (ALARA).
DOE Order 5400.5 limits the total annual eff ective dose equivalent (EDE) of all potential exposure pathways to the public (including air, water, and the food chain) to 100 millirem per year (mrem/yr). Th e Order lists the Derived Concentration Guides (DCGs) for radionuclides in water and air that could be continuously consumed or inhaled (365 days/year). Th is is a conservative approach that assumes that a member of the public resides at the location continuously. Table 8-5 lists the DCGs pertinent to activities at SNL/NM and to this report.
• Water Pathways - DOE drinking water guidelines are based on an annual EDE not to exceed 4 mrem/yr. Guideline values for drinking water are calculated at four percent of ingested water using DCG values for specifi c nuclides.
• Air Pathways - DOE facilities are required to comply with U.S. Environmental Protection Agency (EPA) standards for radiation protection as given in National Emission Standards for Hazardous Air Pollutants (NESHAP), Subpart H, specifi c to radionuclides emitted from DOE facilities (with the exception of radon). Th is rule mandates that air emissions from DOE facilities shall not cause any individual of the public to receive an EDE of greater than 10 mrem/yr from air pathways. Table 8-6 summarizes the public radiation protection standards that are applicable to DOE facilities.
WATER QUALITY MONITORING PARAMETERS
Resource Conservation and Recovery Act (RCRA)Table 8-7 lists the 40 CFR 265, Subpart F, parameters required for groundwater monitoring analysis, implemented under RCRA. Table 8-8 gives the EPA interim primary drinking water standards (40 CFR 265, Appendix III) for the groundwater monitoring parameters. Table 8-9 gives EPA secondary drinking water standards. At SNL/NM, this regulation applies to Environmental Restoration (ER) sites. Table 8-10 gives New Mexico Water Quality Control Commission (NMWQCC) Standards for groundwater.
TABLE 8-5. Derived Concentra on Guides (DCGs) for Selected Radionuclides*Ingested Water Inhaled Air
Radionuclide DCG (μCi/ml) f1 Value** DCG (μCi/ml) Solubility Class
Tritium (water) 2 x 10⁻³ -- 1 x 10⁻⁷ W
Cesium-137 3 x 10⁻⁶ 1 4 x 10⁻¹⁰ D
Uranium, total (Utot) 6 x 10⁻⁶ -- 1 x 10-13 Y
NOTES: μCi/ml = microcuries per milliliter *From Figure III-1, DOE Order 5400.5, Change 2, January 7, 1993 (DOE 1993). DCG for tritium in air is adjusted for skin absorption. **f1 value is the gastrointestinal absorption factor. Listed DCG’s for Utot are based on Unat listing in 5400.5 (DOE 1993).

References, Permits, Regula ons & Standards for Environmental Programs 8-21
TABLE 8-6. General Dose Limits to the Public from DOE Facili es
TABLE 8-7. Groundwater Monitoring Parameters Required by 40 CFR 265, Subpart F*
Pathway Equivalent (EDE) Limit Comments
All Pathways* 100 mrem/yr 1 mSv/yr
The EDE for any member of the public from all routine DOE operations (normal planned activities including remedial actions). Radiation dose occurring from natural background and medical exposures are not included in the total allowed dose from all pathways.
Air Pathway** 10 mrem/yr 0.10 mSv/yr
Sandia calculates doses resulting from all potential air depositions and direct inhalation (e.g., emissions, ground shine, food crops).
NOTES: *DOE Order 5400.5, Chapters I and II (DOE 1993) **40 CFR 61, Subpart H for radionuclides, National Emission Standards for Hazardous Air Pollutants (NESHAP) mrem/yr = millirem per year mSv/yr = millisievert per year DOE = U.S. Department of Energy EDE = effective dose equivalent
Contamination Indicator
Groundwater Quality
Appendix III†
Drinking Water Supply
pH Chloride ArsenicSpecific Conductivity Iron BariumTotal Organic Halogen (TOX) Manganese CadmiumTotal Organic Carbon (TOC) Phenol Chromium
Sodium FluorideSulfate Lead
MercuryNitrate (as N)SeleniumSilverEndrinLindaneMethoxychlorToxaphene2,4-D2,4,5-TP SilvexRadiumGross AlphaGross BetaColiform BacteriaTurbidity
NOTES: *Resource Conservation and Recovery Act (RCRA) †40 CFR 265, Appendix III.
pH = potential hydrogen (acidity)

2010 Annual Site Environmental Report8-22
TABLE 8-8. EPA Primary Drinking Water Supply Standards/New Mexico Drinking Water Standards
Inorganic Chemicals MCL UnitsAntimony 0.006 mg/LArsenic 0.010 mg/LAsbestos 7 MFLBarium 2.0 mg/LBeryllium 0.004 mg/LCadmium 0.005 mg/LChromium 0.1 mg/LCopper 1.3* mg/LCyanide (free cyanide) 0.2 mg/LFluoride 4.0 mg/LLead 0.015 mg/LMercury (inorganic) 0.002 mg/LNickel (New Mexico only) 0.2 mg/LNitrate (measured as N) 10 mg/LNitrite (measured as N) 1 mg/LSelenium 0.05 mg/LThallium 0.002 mg/L
Organic Chemicals MCL UnitsAlachlor 0.002 mg/LAtrazine 0.003 mg/LBenzene 0.005 mg/LBenzo(a)pyrene 0.0002 mg/LCarbofuran 0.04 mg/LCarbon tetrachloride 0.005 mg/LChlordane 0.002 mg/LChlorobenzene 0.1 mg/L2,4-D 0.07 mg/LDalapon 0.2 mg/L1,2-Dibromo-3-chloropropane (DBCP) 0.0002 mg/Lo-Dichlorobenzene 0.6 mg/Lp-Dichlorobenzene 0.075 mg/L1,2-Dichloroethane 0.005 mg/L1,1-Dichloroethylene 0.007 mg/Lcis-1,2-Dichloroethylene 0.07 mg/Ltrans-1,2-Dichloroethylene 0.1 mg/LDichloromethane 0.005 mg/L1,2-Dichloropropane 0.005 mg/LDi(2-ethylhexyl)adipate 0.4 mg/LDi(2ethylhexyl)phthalate 0.006 mg/LDinoseb 0.007 mg/LDioxin (2,3,7,8-TCDD) 0.00000003 mg/LDiquat 0.02 mg/LEndothall 0.1 mg/LEndrin 0.002 mg/LEthylbenzene 0.7 mg/L
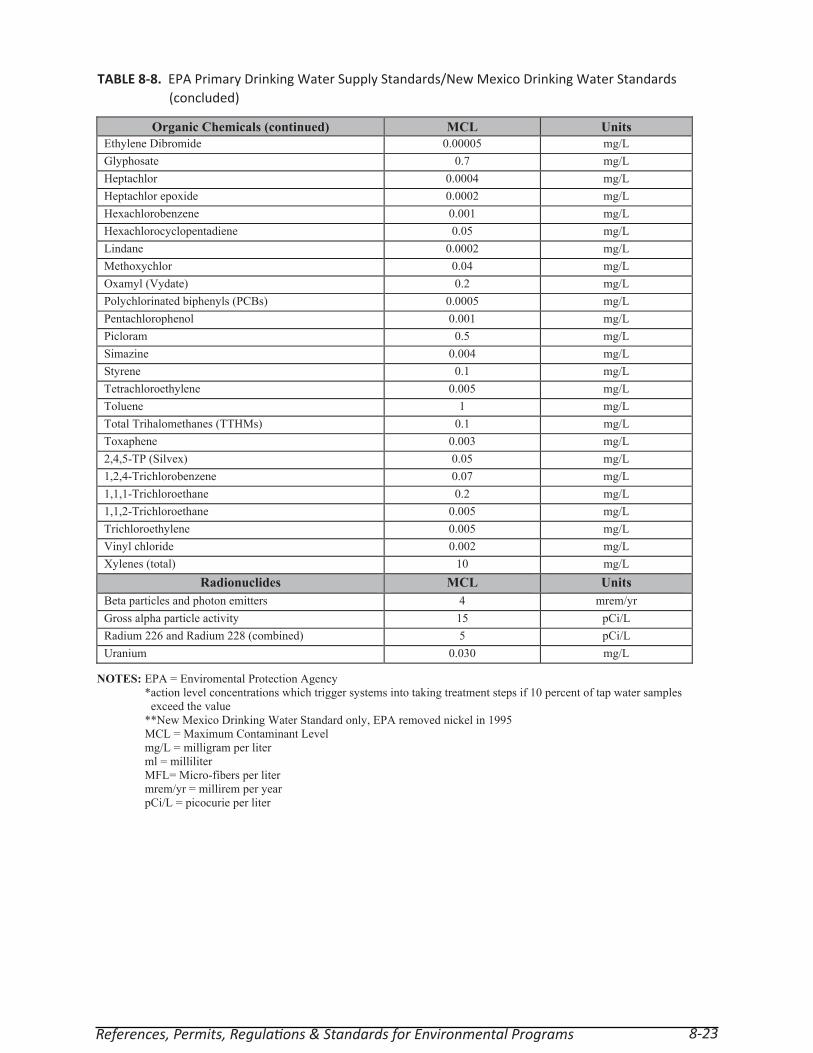
References, Permits, Regula ons & Standards for Environmental Programs 8-23
TABLE 8-8. EPA Primary Drinking Water Supply Standards/New Mexico Drinking Water Standards (concluded)
Organic Chemicals (continued) MCL UnitsEthylene Dibromide 0.00005 mg/LGlyphosate 0.7 mg/LHeptachlor 0.0004 mg/LHeptachlor epoxide 0.0002 mg/LHexachlorobenzene 0.001 mg/LHexachlorocyclopentadiene 0.05 mg/LLindane 0.0002 mg/LMethoxychlor 0.04 mg/LOxamyl (Vydate) 0.2 mg/LPolychlorinated biphenyls (PCBs) 0.0005 mg/LPentachlorophenol 0.001 mg/LPicloram 0.5 mg/LSimazine 0.004 mg/LStyrene 0.1 mg/LTetrachloroethylene 0.005 mg/LToluene 1 mg/LTotal Trihalomethanes (TTHMs) 0.1 mg/LToxaphene 0.003 mg/L2,4,5-TP (Silvex) 0.05 mg/L1,2,4-Trichlorobenzene 0.07 mg/L1,1,1-Trichloroethane 0.2 mg/L1,1,2-Trichloroethane 0.005 mg/LTrichloroethylene 0.005 mg/LVinyl chloride 0.002 mg/LXylenes (total) 10 mg/L
Radionuclides MCL UnitsBeta particles and photon emitters 4 mrem/yrGross alpha particle activity 15 pCi/LRadium 226 and Radium 228 (combined) 5 pCi/LUranium 0.030 mg/L
NOTES: EPA = Enviromental Protection Agency*action level concentrations which trigger systems into taking treatment steps if 10 percent of tap water samples exceed the value **New Mexico Drinking Water Standard only, EPA removed nickel in 1995MCL = Maximum Contaminant Levelmg/L = milligram per liter ml = milliliter MFL= Micro-fibers per liter mrem/yr = millirem per year pCi/L = picocurie per liter

2010 Annual Site Environmental Report8-24
TABLE 8-9. EPA Secondary Drinking Water Supply Standards
Contaminant LevelAluminum 0.05 to 0.2 mg/LChloride 250 mg/LColor 15 color unitsCopper 1.0 mg/LCorrosivity Non-corrosiveFluoride 2.0 mg/LFoaming agents 0.5 mg/LIron 0.3 mg/LManganese 0.05 mg/LOdor 3 threshold odor numberpH 6.5-8.5Silver 0.1 mg/LSulfate 250 mg/LTotal dissolved solids (TDS) 500 mg/LZinc 5 mg/L
NOTES: EPA = Environmental Protection Agency mg/L = milligram per liter pH = potential hydrogen (acidity)

References, Permits, Regula ons & Standards for Environmental Programs 8-25
TABLE 8-10. New Mexico Water Quality Control Commission (NMWQCC) Standards for Groundwater of 10,000 mg/L total dissolved solid (TDS) Concentra on or Less
ContaminantNMWQCC Standard
Units
A. Human Health StandardsArsenic 0.1 mg/LBarium 1.0 mg/LCadmium 0.01 mg/LChromium 0.05 mg/LCyanide 0.2 mg/LFluoride 1.6 mg/LLead 0.05 mg/LTotal Mercury 0.002 mg/LNitrate (as N) 10.0 mg/LSelenium 0.05 mg/LSilver 0.05 mg/LUranium 5.0 mg/LRadioactivity: Radium-226 & Radium 228 30.0 pCi/LBenzene 0.01 mg/LPolychlorinated biphenyls (PCB’s) 0.001 mg/LToluene 0.75 mg/LCarbon Tetrachloride 0.01 mg/L1,2-dichloroethane (EDC) 0.01 mg/L1,1-dichloroethylene (1,1-DCE) 0.005 mg/L1,1,2,2-tetrachloroethylene (PCE) 0.02 mg/L1,1,2- trichloroethylene (TCE) 0.1 mg/LEthylbenzene 0.75 mg/LTotal Xylene 0.62 mg/LMethylene Chloride 0.1 mg/LChloroform 0.1 mg/L1,1 –dichloroethane 0.025 mg/LEthylene dibromide (EDB) 0.0001 mg/L1,1,1 –trichloroethane 0.06 mg/L1,1,2 –trichloroethane 0.01 mg/L1,2,2,2 –tetrachloroethane 0.01 mg/LVinyl Chloride 0.001 mg/LPAHs: total naphtalene + monomethylnapthalenes 0.03 mg/LBenzo(a)pyrene 0.0007 mg/L

2010 Annual Site Environmental Report8-26
TABLE 8-10. New Mexico Water Quality Control Commission (NMWQCC) Standards for Groundwater of 10,000 mg/L total dissolved solid (TDS) Concentra on or Less (Concluded)
ContaminantNMWQCC Standard
Units
B. Other Standards for Domestic Water SupplyChloride 250.0 mg/LCopper 1.0 mg/LIron 1.0 mg/LManganese 0.2 mg/LPhenols 0.005 mg/LSulfate 600.0 mg/LTotal Disolved Solids 1000.0 mg/LZinc 10.0 mg/LpH Between 6 and 9
C. Standards for Irrigation Use – Groundwater shall meet the standards of Subsection A,B, and C unless other wise provided
Aluminum 5.0 mg/LBoron 0.75 mg/LCobalt 0.05 mg/LMolybdenum 1.0 mg/LNickel 0.2 mg/L
NOTES: mg/L = milligram per liter MAC = maximum allowable concentration pCi/L = picocurie per liter pH = potential hydrogen (acidity)

A
Abatement – Reducing the degree or intensity of, or eliminating, pollution.
Absorption – Th e uptake of water, other fl uids, or dissolved chemicals by a cell or an organism (as tree roots absorb dissolved nutrients in soil.)
Alluvial – Relating to and/or sand deposited by fl owing water.
Ambient air – Any unconfi ned portion of the atmosphere: open air, surrounding air.
Analyte – A substance or chemical constituent that is undergoing analysis.
Antimony – A metallic element having four allotropic forms, the most common of which is a hard, extremely brittle, lustrous, silver-white, crystalline material. It is used in a wide variety of alloys, especially with lead in battery plates, and in the manufacture of fl ame-proofi ng compounds, paint, semiconductor devices, and ceramic products.
Appraisal – A documented activity performed according to written procedures and specifi ed criteria to evaluate the compliance and conformance of an organization with programs, standards, and other requirements contained in orders, laws, and regulations, or other requirements invoked by SNL.
Aquifer – An underground geological formation, or group of formations, containing water. A source of groundwater for wells and springs.
Arroyo – A deep gully cut by an intermittent stream; a dry gulch.
Asbestos – A mineral fi ber that can pollute air or water and cause cancer or asbestosis when inhaled. Uses for asbestos-containing material include, but are not limited to, electrical and heat insulation, paint fi ller, reinforcing agents in rubber and plastics (e.g., tile mastic), and cement reinforcement.
Audit – 1. An examination of records or fi nancial accounts to check their accuracy. 2. An adjustment or correction of accounts. 3. An examined and verifi ed account.
B Background radiation – Relatively constant low-level radiation from environmental sources such as building materials, cosmic rays, and ingested radionuclides in the body.
Basin – 1. A low-lying area, wholly or largely surrounded by higher land, that varies from a small, nearly enclosed valley to an extensive, mountain-rimmed depression. 2. An entire area drained by a given stream and its tributaries. 3. An area in which the rock strata are inclined downward from all sides toward the center. 4. An area in which sediments accumulate.
Best Management Practice (BMP) – Th e preferred methods and practices for managing operations.
Biological niche – A role played by a species in the environment.
Biota – Th e animal and plant life of a given region.
Borehole – A hole created or enlarged by a drill or auger. Also known as drill hole.
Glossary
Glossary 9-1
C Catchment basin – Th e geographical area draining into a river or reservoir.
Cesium-137 – A radioactive isotope of cesium used in radiation therapy and found in atmospheric fallout.
Coniferous forest – A type of forest characterized by cone-bearing, needle-leaved trees.
Containment – An enclosed space or facility to contain and prevent the escape of hazardous material.
Containment cell – An engineered structure designed to contain and prevent the migration of hazardous waste.
Contamination – Introduction into water, air, and soil of microorganisms, chemicals, toxic substances, wastes, or wastewater in a concentration that makes the medium unfi t for its next intended use. Also applies to surfaces of objects, buildings, and various household and agricultural use products.
Corporate Work Process (CWP) – A fi ve-element process for managing and performing work that applies to all activities, facilities, organizations, and employees.
Corrective action – 1. EPA can require treatment, storage and disposal (TSDF) facilities handling hazardous waste to undertake corrective actions to clean up spills resulting from failure to follow hazardous waste management procedures or other mistakes. Th e process includes cleanup procedures designed to guide TSDFs toward in spills. 2. An action identifi ed to correct a fi nding that, when completed, fi xes the problem or prevents recurrence.
D Data Quality Objectives (DQO) – Following a strategic, systematic process for planning scientifi c data collection eff orts.
Decontamination – Removal of harmful substances such as noxious chemicals, harmful bacteria or other organisms, or radioactive material from exposed individuals, rooms and furnishings in buildings, or the exterior environment.
Demolition – Th e act or process of wrecking or destroying, especially destruction by explosives.
Discharge – Any liquid or solid that fl ows or is placed on or onto any land or into any water. Th is includes precipitation discharges to the storm drains, accidental or intentional spilling, leaking, pumping, pouring, emitting, emptying, or dumping of any material or substance on or into any land or water.
Discharge limits – Th e maximum concentration of a specifi ed pollutant allowed to be discharged in a volume of water or wastewater.
Discharge point – Th e site or location of a release, fl ow or runoff of any waste governed by regulation.
Diurnal – 1. Relating to or occurring in a 24-hour period; daily. 2. Occurring or active during the daytime rather than at night: diurnal animals.
Dosimeter – A device used to measure the dose of ionizing radiation received by an individual.
E Ecology – Th e relationship of living things to one another and their environment, or the study of such relationships.
Ecosystem – Th e interacting system of a biological community and its non-living environmental surroundings.
Eff ective Dose Equivalent (EDE) – Th e weighted average of dose equivalents in certain organs or tissues of the body; this can be used to estimate the health-eff ects risk of the exposed individual.
Effl uent – Wastewater (treated or untreated) that fl ows out of a treatment plant, sewer, or industrial outfall. Generally refers to wastes discharged into surface waters.
2010 Annual Site Environmental Report9-2

Electronic Product Environmental Assessment Tool (EPEAT) - Is a set of criteria in eight diff erent electronic to determine the environmental attributes of a particular electronic offi ce product. At this point, EPEAT is only targeting computer desktops/towers, notebook computers (laptops) and monitors.
Electroplating – To coat or cover with a thin layer of metal by electrodeposition.
Energy Star Operations - means the equipment (monitors) go into “sleep” (low energy) mode when inactive for a set period of time. (CSU enabled)
Environment – Th e sum of all external conditions aff ecting the life, development and survival of an organism.
Environment, Safety and Health (ES&H) – A program designed to protect and preserve the environment and to ensure the safety and health of its employees, contractors, visitors, and the public.
Environmental Assessment (EA) – An environmental analysis prepared pursuant to the National Environmental Policy Act (NEPA) to determine whether a federal action would signifi cantly aff ect the environment and thus require a more detailed environmental impact statement.
Environmental Impact Statement (EIS) – A document required of federal agencies by the National Environmental Policy Act for major projects or legislative proposals signifi cantly aff ecting the environment. A tool for decision making, it describes the positive and negative eff ects of the undertaking and cites alternative actions.
Environmental Management – A program designed to maintain compliance with EPA, state, local and DOE requirements.
Environmental Management System (EMS) – A continuing cycle of planning, evaluating, implementing, and improving processes and actions undertaken to achieve environmental goals.
Environmental Monitoring – Th e collection and analysis of samples or direct measurements of environmental media such as air, water, and soil.
Environmental Restoration (ER) – A project chartered with the assessment and, if necessary, the remediation of inactive waste sites.
Environmental surveillance – A program including surveys of soil and vegetation, water sampling and analysis, in an attempt to identify and quantify long-term eff ects of pollutants resulting from SNL operations.
Ephemeral stream – A stream channel which carries water only during and immediately after periods of rainfall or snowmelt.
ER site – Any location listed on the environmental restoration ER site list that has been identifi ed as an area that is (or may be) contaminated-either on or beneath the land surface-as a result of SNL operations. Contaminants may be chemicals, radioactive material, or both.
Exceedance – Violation of the pollutant levels permitted by environmental protection standards.
Explosive waste – Any explosive substance, article, or explosive-contaminated item that cannot be used for its intended purpose and does not have a legitimate investigative or research use.
F Fault – A fracture in the continuity of a rock formation caused by a shifting or dislodging of the earth’s crust, in which adjacent surfaces are displaced relative to one another and parallel to the plane of fracture.
Fauna – 1. Animals, especially the animals of a particular region or period, considered as a group. 2. A catalog of the animals of a specifi c region or period.
Flora – 1. Plants. 2. Th e plant life characterizing a specifi c geographic region or environment.
Glossary 9-3
G Gamma Radiation – very high-energy/high-frequency electromagnetic radiation that is emitted by the nuclei of radioactive substances during decay, or by the interactions of high-energy electrons with matter. Th ey are similar to, but have a shorter wavelength, than X-rays.
Geology – Th e scientifi c study of the origin, history, and structure of the earth.
Groundwater – Th e supply of fresh water found beneath the Earth’s surface, usually in aquifers, which supply wells and springs. Because ground water is a major source of drinking water, there is growing concern over contamination from leaching agricultural or industrial pollutants or leaking underground storage tanks.
H Hazardous substance – 1. Any material that poses a threat to human health and/or the environment. Typical hazardous substances are toxic, corrosive, ignitable, explosive, or chemically reactive. 2. Any substance designated by EPA to be reported if a designated quantity of the substance is spilled in the waters of the United States or is otherwise released into the environment.
Hazardous waste – Waste that meets any of the following conditions:
Hazardous waste landfi ll – An excavated or engineered site where hazardous waste is deposited and covered.
Hazardous waste site – Any facility or location at which hazardous waste operations take place.
Herbicides – A chemical pesticide designed to control or destroy plants, weeds, or grasses.
High-Level Radioactive Waste (HLW) – Waste generated in core fuel of a nuclear reactor, found at nuclear reactors or by nuclear fuel reprocessing; is a serious threat to anyone who comes near the waste without shielding.
Hydrology – Th e science dealing with the properties, distribution, and circulation of water.
I Illicit discharges – Th e absolute prohibitions against the release of certain substances.
Implementation Plan (IP) – Th e plan developed by the Operational Readiness Review (ORR) or Readiness Assessment (RA) team that describes the specifi cs of approach, schedule, methodology, team members and their qualifi cations, and reporting requirements of the ORR or RA. Th e Implementation Plan (IP) is used by the team leader to execute the ORR or RA.
Industrial discharges – Th e absolute prohibitions against the release of certain substances.
Inertial-confi nement fusion – A method of controlled fusion in which the rapid implosion of a fuel pellet, produced by laser, electron, or ion beams, raises the temperature and density of the pellet core to levels at which nuclear fusion can take place before the pellet fl ies apart.
Inhalation hazard – Risk from materials or chemicals that present a hazard if respired (inhaled) into the lungs.
Insecticides – A pesticide compound specifi cally used to kill or prevent the growth of insects.
Integrated Laboratories Management System (ILMS) – Framework for all management requirements for Sandia. It represents the complete set of policy, business rules, practices, and information that establishes Sandia’s business expectations and intent.
Integrated Safety Management System (ISMS) Systematically integrates safety into management and work practices at all levels so that missions are accomplished while protecting the worker, the public, and the environment.
2010 Annual Site Environmental Report9-4

L Lagoons – 1. A shallow pond where sunlight, bacterial action, and oxygen work to purify wastewater; also used for storage of wastewater. 2. Shallow body of water, often separated from the sea by coral reefs or sandbars.
Landfi ll – 1. Sanitary landfi lls are disposal sites for non-hazardous solid wastes spread in layers, compacted to the smallest practical volume, and covered by material applied at the end of each operating day. 2. Secure chemical landfi lls are disposal sites for hazardous waste, selected and designed to minimize the chance of release of hazardous substances into the environment.
Leachate – Water that collects contaminants as it trickles through wastes, pesticides or fertilizers. Leaching may occur in farming areas, feedlots, and landfi lls, and may result in hazardous substances entering surface water, ground water, or soil.
Legacy contamination – Contamination that remains after facilities, operations, or activities that created it have gone out of existence or ceased, often resulting in an orphan site in need of remediation or institutional control.
Line management – Th e process of managing workers through individual Integrated Job Structure assignments (i.e., work titles) and contractor positions that support SNL’s mission core processes and enabling processes.
Long-Term Environmental Stewardship (LTES)– Activities necessary to maintain long-term protection of human health and the environment from hazards posed by residual radioactivity and chemically hazardous materials.
Low-Level Radioactive Waste (LLW) – Wastes less hazardous than most of those associated with a nuclear reactor; generated by hospitals, research laboratories, and certain industries. Th e Department of Energy, Nuclear Regulatory Commission, and EPA share responsibilities for managing them.
Low-Temperature Th ermal Desorption (LTTD) – A process of removing organic compounds from soil by heating it and causing the organics to volatilize and/or decompose. Th e volatilized compounds may be further degraded by after burning or catalysis.
M Maximally Exposed Individual (MEI) – Th e location of a member of the public which receives or has the potential to receive the maximum radiological dose from air emissions of a National Emissions Standards for Hazardous Air Pollutants (NESHAP) radionuclide source. Th e dose estimates are based on realistic, yet conservative input parameters.
Migratory birds – All birds listed within the Migratory Bird Treaty Act, 50 CFR 10.13, or which are a mutation or hybrid of any such species, including any part, nest, or egg.
Mixed Analyte Performance Evaluation Program (MAPEP) – Th e MAPEP is used by the DOE as a quality assurance tool for environmental analytical services across the DOE Complex. It includes radiological, stable inorganic, and organic constituents (i.e., mixed analytes) in the same single-blind sample for analytical performance evaluation. Th e samples use various matrices including soils, water, vegetation, and air fi lters. MAPEP samples are not a mixed waste.
Mixed waste – Radioactive waste that contains both source material, special nuclear material, or by-product material subject to the Atomic Energy Act of 1954, as amended; and a hazardous component subject to the Resource Conservation and Recovery Act (RCRA), as amended.
Mixed waste generator – Any person or organization generating mixed waste or causing a material to be subject to mixed waste regulations. Generators are responsible for the generation and subsequent management of mixed waste as part of their occupation or position. Generators may include managers, their employees, and contractors.
Glossary 9-5
N National Emissions Standards for Hazardous Air Pollutants (NESHAP) – Emissions standards set by EPA for an air pollutant not covered by NAAQS that may cause an increase in fatalities or in serious, irreversible, or incapacitating illness. Primary standards are designed to protect human health, secondary standards to protect public welfare (e.g. building facades, visibility, crops, and domestic animals).
National Environmental Policy Act (NEPA) – Th e basic national charter for protection of the environment. It establishes policy, sets goals, and provides means for carrying out the policy.
National Pollutant Discharge Elimination System (NPDES) – A provision of the Clean Water Act which prohibits discharge of pollutants into waters of the United States unless a special permit is issued by EPA, a state, or, where delegated, a tribal government on an Indian reservation.
Natural resources – Resources (actual and potential) supplied by nature.
Nitrates – A compound containing nitrogen that can exist in the atmosphere or as a dissolved gas in water and which can have harmful eff ects on humans and animals. Nitrates in water can cause severe illness in infants and domestic animals. A plant nutrient and inorganic fertilizer, nitrate is found in septic systems, animal feed lots, agricultural fertilizers, manure, industrial waste waters, sanitary landfi lls, and garbage dumps.
Nitrites – 1. An intermediate in the process of nitrifi cation. 2. Nitrous oxide salts used in food preservation.
Nitrogen Dioxide – A poisonous brown gas, NO2, often found in smog and automobile exhaust fumes and synthesized for use as a nitrating agent, a catalyst, and an oxidizing agent.
Non-Methane Hydrocarbon (NMHC) – Th e sum of all hydrocarbon air pollutants except methane; signifi cant precursors to ozone formation.
Non-radiological contaminants – A source of contamination that has no radiological components.
Nuclear energy – Th e energy released by a nuclear reaction.
Nuclear particle acceleration – Imparting large kinetic energy to electrically charged sub-atomic nuclear particles (e.g., protons, deuterons, electrons) by applying electrical potential diff erences for the purpose of physics experiments.
OOutfalls – Th e place where effl uent is discharged into receiving waters.
Ozone – A colorless gas (O3) soluble in alkalis and cold water; a strong oxidizing agent; can be produced by electric discharge in oxygen or by the action of ultraviolet radiation on oxygen in the stratosphere (where it acts as a screen for ultraviolet radiation).
P Perched groundwater – Groundwater that is unconfi ned and separated from an underlying main body of groundwater by an unsaturated zone (also known as perched water).
Perennial spring – A spring that fl ows continuously, as opposed to an intermittent spring or periodic spring.
Physiography – Th e study of the natural features of the earth’s surface, especially in its current aspects, including land formation, climate, currents, and distribution of fl ora and fauna (also called physical geography).
Piezometer – An instrument for measuring pressure, especially high pressure.
PM10 – Particulate matter (diameter equal to or less than 10 microns).
2010 Annual Site Environmental Report9-6

PM2.5 – Respirable particulate matter (diameter equal to or less than 2.5 microns)
Point source – A stationary location or fi xed facility from which pollutants are discharged; any single identifi able source of pollution; e.g. a pipe, ditch, ship, ore pit, factory smokestack.
Point source discharges – Any discernible, confi ned, and discrete conveyance from which pollutants are or may be discharged.
Pollutant – Generally, any substance introduced into the environment that adversely aff ects the usefulness of a resource or the health of humans, animals, or ecosystems.
Pollutant, water – Defi ned by the Environmental Protection Agency (EPA) as any physical, chemical, biological, or radiological substance that has an adverse aff ect on water.
Pollution Prevention (P2) – Th e use of materials, processes, and practices that reduce or eliminate the generation and release of pollutants, contaminants, hazardous substances, and waste into land, water, and air. For DOE, this includes recycling.
Polychlorinated biphenyls – “PCB” and “PCBs” are chemical terms limited to the biphenyl molecule that has been chlorinated to varying degrees or any combination of substances that contains such substance. Because of their persistence, toxicity, and ecological damage via water pollution, their manufacture was discontinued in the U.S. in 1976.
Potable Water – Water free from impurities present in quantities suffi cient to cause disease or harmful physiological eff ects.
Practical Quantitation Limit (PQL) – Th e lowest level of analytical determination that can be reliably achieved within specifi ed limits of precision and accuracy during routine laboratory operating conditions.
Pulsed power – Technology is used to generate and apply energetic beams and high-power energy pulses.
Q Quality Assurance (QA) – A system of procedures, checks, audits, and corrective actions to ensure that all EPA research design and performance, environmental monitoring and sampling, and other technical and reporting activities are of the highest achievable quality.
Quality Control (QC) – Used in determining analytical accuracy, precision, and contamination when samples are collected , and to assess the quality and usability of the data.
RRadioactive waste – Any waste that emits energy as rays, waves, streams or energetic particles. Radioactive materials are often mixed with hazardous waste, from nuclear reactors, research institutions, or hospitals.
Radiological Contaminants – Radioactive material deposited in any place where it is not desired, particularly where its presence may be harmful.
Radionuclide – Radioactive particle, man-made (anthropogenic) or natural, with a distinct atomic weight number. Can have a long life as soil or water pollutant.
Radon – A colorless naturally occurring, radioactive, inert gas formed by radioactive decay of radium atoms in soil or rocks.
Reportable quantity (RQ) – Quantity of material or product compound or contaminant which when released to the environment is reportable to a regulatory agency.
Rodenticides – A chemical or agent used to destroy rats or other rodent pests, or to prevent them from damaging food, crops, etc.
Glossary 9-7

SSample Management Offi ce (SMO) – An SNL offi ce that manages environmental analytical laboratory contracts and assists with the processing and tracking of samples undergoing chemical and radiochemical analyses performed at these laboratories.
Sampling and Analysis Plan (SAP) – A plan containing various criteria required for conducting sampling activities.
Sanitary discharges – Th e portion of liquid effl uent exclusive of industrial wastewater and storm water. Th e liquid discharges from rest rooms and food preparation activities.
Screened intervals – Th e section of water well piping below ground that is perforated or in some manner made porous to allow water to enter the interior of the casing and prohibit the entry of sand and rocks.
Seasonal recharge – Recharge of groundwater during and after a wet season, with a rise in the level of the water table.
Secondary containment – Any structure or device that has been installed to prevent leaks, spills, or other discharges of stored chemicals, waste, oil, or fuel from storage, transfer, or end-use equipment from being released to the environment. Examples of secondary containment include pans, basins, sumps, dikes, berms, or curbs.
Semi-volatile organic compounds – Organic compounds that volatilize slowly at standard temperature (20 degrees C and 1 atm pressure).
Site-Wide Environmental Impact Statement (SWEIS) – A detailed public document, for which a federal agency is responsible, that provides analysis of the expected impacts on the human environment of a proposed action and alternatives to the proposed action.
Solid waste – Any garbage, refuse, sludge from a waste treatment plant, water supply treatment plant, or air pollution control facility and other discarded material including solid, liquid, semisolid, or contained gaseous material resulting from industrial, commercial, mining, and agricultural operations and from community activities.
Statement Of Work (SOW) – A comprehensive description of the goods, services, or combination of goods and services for which SNL contracts.
Storm water – Water runoff from rainfall or snowmelt, including that discharged to the sanitary sewer system.
Sulfur Dioxide (SO2) – A colorless, extremely irritating gas or liquid, SO2, used in many industrial processes, especially the manufacture of sulfuric acid.
Surface discharge – Spilling, leaking, pumping, pouring, emitting, emptying, or dumping into water or in a location and manner where there is a reasonable probability that the discharged substance will reach surface or subsurface water.
T Th ermoluminescent Dosimeters (TLD) – A device that monitors both the whole body and skin radiation dose to which a person has been exposed during the course of work. Th ese same devices can also be used to measure environmental exposure rates.
Th reatened and endangered species – A species present in such small numbers that it is at risk of extinction.
Time-weighted composites – A sample consisting of several portions of the user’s discharge collected during a 24-hour period in which each portion of the sample is collected with a specifi c time frame that is irrespective of fl ow.
Topography – Th e physical features of a surface area including relative elevations and the position of natural and man-made (anthropogenic) features.
Toxic (chemicals) – Any chemical listed in EPA rules as “Toxic Chemicals Subject to Section 313 of the Emergency Planning and Community Right-to-Know Act of 1986.”
2010 Annual Site Environmental Report9-8

Transuranic waste (TRU) – Radioactive waste containing alpha-emitting radionuclides having an atomic number greater than 92, and a half-life greater than 20 years, in concentrations greater than 100 nCi/g.
Trihalomethanes – A chemical compound containing three halogen atoms substituted for the three hydrogen atoms normally present in a methane molecule. It can occur in chlorinated water as a result of reaction between organic materials in the water and chlorine added as a disinfectant.
Tritium – A radioactive hydrogen isotope with atomic mass 3 and half-life 12.5 years, prepared artifi cially for use as a tracer and as a constituent of hydrogen bombs.
Turbidity – 1. Haziness in air caused by the presence of particles and pollutants. 2. A cloudy condition in water due to suspended silt or organic matter.
U Unconsolidated basin sediment – 1. A sediment that is loosely arranged or unstratifi ed, or whose particles are not cemented together, occurring either at the surface or at depth. 2. Soil material that is in a loosely aggregated form.
Underground Storage Tank (UST) – A single tank or a combination of tanks, including underground pipes connected thereto, which are used to contain an accumulation of regulated substances, such as petroleum products, mineral oil, and chemicals, and the volume of which, including the volume of underground pipes connected thereto, is 10% or more beneath the surface of the ground.
Up-gradient – In the direction of higher water levels.
Upstream – In, at, or toward the source of a stream.
Uranium – A heavy silvery-white metallic element, radioactive and toxic, easily oxidized, and having 14 known isotopes of which U 238 is the most abundant in nature. Th e element occurs in several minerals, including uraninite and carnotite, from which it is extracted and processed for use in research, nuclear fuels, and nuclear weapons.
USFS (U.S. Forest Service) Withdrawn Area – A portion of Kirtland Air Force Base consisting of land within the Cibola National Forest, which has been withdrawn from public access for use by the US Air Force and the US Department of Energy.
V Vadose zone – Th e zone between land surface and the water table within which the moisture content is less than saturation (except in the capillary fringe) and pressure is less than atmospheric. Soil pore space also typically contains air or other gases. Th e capillary fringe is included in the vadose zone.
Vanadium – A bright white, soft, ductile metallic element found in several minerals, notably vanadinite and carnotite, having good structural strength and used in rust-resistant high-speed tools, as a carbon stabilizer in some steels, as a titanium-steel bonding agent, and as a catalyst.
Volatile Organic Compound (VOC) – Any organic compound that participates in atmospheric photochemical reactions except those designated by EPA as having negligible photochemical reactivity.
W Waste characterization – Identifi cation of chemical and microbiological constituents of a waste material.
Waste management – Th e processes involved in dealing with the waste of humans and organisms, including minimization, handling, processing, storage, recycling, transport, and fi nal disposal.
Wastewater – Th e spent or used water from a home, community, farm, or industry that contains dissolved or suspended matter.
Glossary 9-9

Water Pollution - Th e presence in water of enough harmful or objectionable material to damage the water’s quality.
Water table – Th e level of groundwater.
Watershed – Th e land area that drains into a stream; the watershed for a major river may encompass a number of smaller watersheds that ultimately combine at a common point.
Wetland – An area that is saturated by surface or ground water with vegetation adapted for life under those soil conditions, as swamps, bogs, fens, marshes, and estuaries.
Wind rose – A graphical presentation of wind speed and direction frequency distribution.
2010 Annual Site Environmental Report9-10

Distribu on Dist-1
UNLIMITED RELEASE DISTRIBUTION
U.S. Department of Energy
U.S. Department of Energy/NNSA (5*/10**/2***)Sandia Site Operations Offi ce of Environment, Safety and HealthAttn: Karen AgoginoP.O. Box 5400, MS 0184Albuquerque, NM 87185-5400
U.S. Department of Energy/HQ (1*/1**)Offi ce of Analysis HS-24/Forrestal BuildingAttn: Ross Natoli1000 Independence Ave. SWWashington, DC 20585
U.S. Department of Energy/HQ (1**)Chief Health, Safety and Security Offi cerHS-1/Forrestal BuildingAttn: Glenn S. Podonsky1000 Independence Ave., SWWashington, DC 20585
U.S. Department of Energy/HQ (1*)Associate Administrator for Defense Nuclear SecurityNA-70/Forrestal BuildingAttn: Bradley A. Peterson1000 Independence Ave., SWWashington, DC 20585
U.S. Department of Energy/HQ (1**)Director, Offi ce of Environmental Protection SustainabilityHS-20/Forrestal BuildingAttn: Andrew C. Lawrence1000 Independence Ave., SWWashington, DC 20585
U.S. Department of Energy/HQ (1*)Director, Offi ce of Scientifi c and Technical Information SC-44/Germantown BuildingAttn: Walter Warnick1000 Independence Ave., SWWashington, DC 20585
U.S. Department of Energy/HQ (1**)Director, Offi ce of Operations OversightEM-22/Cloverleaf BuildingAttn: Robert Goldsmith1000 Independence Ave., SWWashington, DC 20585
U.S. Department of Energy/HQ (2*)Director of Environmental OperationsNA-173/Germantown BuildingAttn: Randal S. Scott1000 Independence Ave., SWWashington, DC 20585
U.S. Department of Energy/NNSA (1*/1**)NNSA Service Center Environmental Safety and Health Department Attn: Steven R. BlackP.O. Box 5400Albuquerque, NM 87185-5400
U.S. Department of Energy/HQ (1***)Offi ce of Groundwater and Soil RemediationEM-32/Cloverleaf BuildingAttn: Justin Marble1000 Independence Ave., SWWashington, DC 20585-2040
U.S. Department of Energy/NNSA (1*)Senior Advisor, Environment, Safety and Health Offi ce of Safety and HealthNA-SH-20/NNSA Service CenterAttention: Deborah D. MonetteP.O. Box 5400Albuquerque, NM 87185-5400

2010 Annual Site Environmental ReportDist-2
UNLIMITED RELEASE DISTRIBUTION (continued)
Federal, State, and Other Agencies
U.S. Environmental Protection Agency (1***)Region VI Offi ceAttn: Laurie KingFountain Place 12th FloorMail Code: 6PDF1445 Ross Ave., Suite 1200Dallas, TX 75202-2733
Mark Kelly, P.E. (1**)Industrial Waste EngineerAlbuquerque Bernalillo County Water Utility AuthorityEnvironmental Compliance DivisionIndustrial Pretreatment4201 Second Street, SWAlbuquerque, NM 87105
Brent A. Pulsipher (1**)Pacifi c Northwest National Laboratory902 Battelle Blvd. P.O. Box 999 / MS K5-12Richland, WA 99352
Norbert Golchert (1**)Argonne National Laboratory9700 South Cass AvenueBuilding 200, Room B-11Argonne, Illinois 60439
William Moats (1***)Hazardous Waste Bureau/ Permits Management Program5500 San Antonio, NEAlbuquerque, NM 87109
New Mexico Environment Department (1***) Hazardous Waste BureauAttn: John Kieling2905 Rodeo Park Rd. E Bldg. 1Santa Fe, New Mexico 87505
Albuquerque City Environmental (1**)Health Department1 Civic Plaza NWAlbuquerque, NM 87102
Jim Piatt, Director (1**)Isleta Environment DepartmentP.O. Box 1270Isleta, NM 87022
Hon. Robert Benevides (1**)GovernorPueblo of IsletaP.O. Box 1270Isleta Pueblo, NM 87022
Linda Weiss (1*)USGS-WRD-NM District5338 Montgomery NESuite 400/300Albuquerque, NM 87109-1311
U.S. Environmental Protection Agency (1**)Headquarters Offi ceAriel Rios Building1200 Pennsylvania Avenue, NWWashington, DC 20460
New Mexico Environment Department (1***)Attn: Th omas SkibitskiDOE Oversight Bureau Mail Stop 1396P.O. Box 5400Albuquerque, NM 87185-5400

Distribu on Dist-3
UNLIMITED RELEASE DISTRIBUTION (continued)
Other Individuals and Organizations
John Pike (1**)377 SPTG/CEVQ2050 Wyoming Blvd. SE Kirtland AFB, NM 87117-5270
Steve Rohrer (1**)Lovelace Respiratory Research Institute2425 Ridgecrest Drive SEAlbuquerque, NM 87108-5127
Priscilla McIntosh (1**)Congressional Information Service, Inc.4520 East West HighwaySuite 800Bethesda, MD 20814-3389
Eva Hickey (1**)Battelle Pacifi c Northwest LaboratoriesP.O. Box 999, MS K-3-66Richland, WA 99352
Margaret Lindeman (2**)Lockheed-Martin Corporation6801 Rockledge DriveMail Drop 246Bethesda, MD 20817
Roger Dirkes (1**)Battelle Pacifi c Northwest LaboratoriesP.O. Box 999Richland, WA 99352
UNM – Valencia Campus (1**)280 La EntradaLos Lunas, NM 87031
UNM – Los Alamos Branch Campus (1**)4000 University DriveLos Alamos, NM 87544
Anderson School of Management (1**)1 University of New Mexico, MSC05 3090 Albuquerque, NM 87131-0001
CNM – Montoya Campus (1**)4700 Morris NE Albuquerque, NM 87111
CNM – Main Campus (1**)525 Buena Vista SEAlbuquerque, NM 87106-4096
CNM – South Valley Campus (1**)5816 Isleta Boulevard SWAlbuquerque, NM 87105
Mark Holmes (1**)Installation Restoration Program377 SPTG/CEVR2050 Wyoming Blvd. SESuite 122Kirtland AFB, NM 87118-5270
Alex Mora (1*)City of Albuquerque Environmental Health Department1 Civic Plaza NW3rd Floor, Rm 3023Albuquerque, NM 87103
Peggy Johnson (1*)New Mexico Bureau of Mines and Mineral Resources801 Leroy PlaceSocorro, NM 87801
Penny H. Holeman (1*)Director, ES&HLovelace Respiratory Research Institute2425 Ridgecrest Dr. SEAlbuquerque, NM 87108
College of Santa Fe (1**)1600 St. Michael’s DriveSanta Fe, NM 87505
Robert Garcia (1*)Bernalillo County Environmental Health Dept. 111 Union Square SE Suite 300Albuquerque, NM 87102

2010 Annual Site Environmental ReportDist-4
UNLIMITED RELEASE DISTRIBUTION (continued)
Other Individuals and Organizations
Christopher Segura (1*)Environmental Management Division377 SPTG/CEVCSuite 1122050 Wyoming Blvd. Kirtland AFB, NM 87117-5270
Dan Barkley (1*)Government Information DepartmentZimmerman Library-UNM 1 University of New Mexico MSC05 3020Albuquerque, NM 87131-0001
William Walker (1*)U.S. Department of the InteriorBureau of Indian Aff airs, Southwest Region Albuquerque Area Offi cePO Box 26567Albuquerque, NM 87125-6567
Distribu on Dist-5
UNLIMITED RELEASE DISTRIBUTION (concluded)
Sandia National Laboratories Distribution
1 (MS 0141) A. Blumberg, 11100*
1 (MS 0651) ES&H Customer-Funded Record Center, 9532
1 (MS 0774) A. Bendure, 4135
1 (MS 0777) R. Goetsch, 4135*
1 (MS 0899) Technical Library, 9536*
1 (MS 0729) R. Deola, 4143*
1 (MS 0729) M. L. du Mond, 4143*
1 (MS 0730) N. White, 4143
1 (MS 0729) M. L. Miller, 4143**
1 (MS 0729) J. Payne, 4143
2 (MS 1043) ES&H Library, 4135
15 (MS 0730) R. V. Sanchez, 4143
1 (MS 0729) T. Jackson, 4142***
1 (MS 0718) M. Skelly, 6234***
1 (MS 1112) D. Castillo, 4144
2 (MS 1117) L. Gonzales, 4144*
1 (MS 1151) J. Jarry, 4139
1 (MS 1172) A. Lopez, 5419**
1 (MS 1172) N. Nitta, 54191
1 (MS 1392) W. Forston, 2915
1 (MS 0651) D. Castellano, 9532*
1 (MS 0729) A. Reiser, 4144
1 (MS 0730) K. Wagner, 4143
1 (MS 0730) K. Turnham, 4143***
NOTE: *Requires CD copies of this report **Requires published copies of this report. ***Requires CD, published copies of this report including a hardcopy of Appendix B.
2010 Annual Site Environmental ReportDist-6
Th is page intentionally left blank.

APPENDIX A2010 WASTEWATER
MONITORING RESULTS

StationPermit
NumberDate
Collected Sample ID Analyte Result MDLLab Data Qualifier Units
Regulatory Limit (COA)
CINT 2238A 24-Feb-10 088052-001 Aluminum 0.068 U mg/L 900CINT 2238A 24-Feb-10 088052-001 Arsenic 0.00552 0.005 J mg/L 0.051CINT 2238A 24-Feb-10 088052-001 Boron 0.0808 0.015 mg/LCINT 2238A 24-Feb-10 088052-001 Cadmium 0.001 U mg/L 0.5CINT 2238A 24-Feb-10 088052-001 Chromium 0.00393 0.001 J mg/L 4.1CINT 2238A 24-Feb-10 088052-001 Copper 0.00577 0.003 J mg/L 5.3CINT 2238A 24-Feb-10 088051-001 Cyanide, total 0.00166 U mg/L 0.45CINT 2238A 24-Feb-10 088051-002 Cyanide, total 0.0123 0.00166 mg/L 0.45CINT 2238A 24-Feb-10 088051-003 Cyanide, total 0.00166 U mg/L 0.45CINT 2238A 24-Feb-10 088051-004 Cyanide, total 0.00166 U mg/L 0.45CINT 2238A 24-Feb-10 088052-002 Fluoride 0.948 0.033 mg/L 36CINT 2238A 24-Feb-10 088052-001 Lead 0.0033 U mg/L 1CINT 2238A 24-Feb-10 088052-001 Molybdenum 0.0692 0.002 mg/L 2CINT 2238A 24-Feb-10 088052-001 Nickel 0.0015 U mg/L 2CINT 2238A 24-Feb-10 088052-001 Selenium 0.005 U mg/L 0.46CINT 2238A 24-Feb-10 088052-001 Silver 0.001 U mg/L 5CINT 2238A 24-Feb-10 088052-001 Zinc 0.00651 0.0033 J mg/L 2.2CINT 2238A 25-Feb-10 088053-001 Aluminum 0.068 U mg/L 900CINT 2238A 25-Feb-10 088053-001 Arsenic 0.00589 0.005 J mg/L 0.051CINT 2238A 25-Feb-10 088053-001 Boron 0.0935 0.015 mg/LCINT 2238A 25-Feb-10 088053-001 Cadmium 0.001 U mg/L 0.5CINT 2238A 25-Feb-10 088053-001 Chromium 0.00236 0.001 J mg/L 4.1CINT 2238A 25-Feb-10 088053-001 Copper 0.016 0.003 mg/L 5.3CINT 2238A 25-Feb-10 088053-002 Fluoride 0.759 0.033 mg/L 36CINT 2238A 25-Feb-10 088053-001 Lead 0.00451 0.0033 J mg/L 1CINT 2238A 25-Feb-10 088053-001 Molybdenum 0.0771 0.002 mg/L 2CINT 2238A 25-Feb-10 088053-001 Nickel 0.0015 U mg/L 2CINT 2238A 25-Feb-10 088053-001 Selenium 0.005 U mg/L 0.46CINT 2238A 25-Feb-10 088053-001 Silver 0.001 U mg/L 5CINT 2238A 25-Feb-10 088053-001 Zinc 0.00831 0.0033 J mg/L 2.2CINT 2238A 20-Apr-10 088060-005 Ammonia 0.152 0.016 mg/LCINT 2238A 21-Apr-10 088066-001 Ammonia 0.172 0.016 mg/LWW001 2069-A 20-Apr-10 088054-001 Aluminum 0.114 0.068 J mg/L 900WW001 2069-A 20-Apr-10 088054-007 Ammonia 10.3 0.16 mg/LWW001 2069-A 20-Apr-10 088054-001 Arsenic 0.0106 0.005 J mg/L 0.051WW001 2069-A 20-Apr-10 088054-001 Boron 0.0999 0.015 mg/LWW001 2069-A 20-Apr-10 088054-001 Cadmium 0.001 U mg/L 0.5WW001 2069-A 20-Apr-10 088054-001 Chromium 0.00443 0.001 J mg/L 4.1
TABLE A-1. Permitted Sanitary Outfalls of Inorganic Analyses, February 2010 and April 2010

StationPermit
NumberDate
Collected Sample ID Analyte Result MDLLab Data Qualifier Units
Regulatory Limit (COA)
TABLE A-1. Permitted Sanitary Outfalls of Inorganic Analyses, February 2010 and April 2010
WW001 2069-A 20-Apr-10 088054-001 Copper 0.0524 0.003 mg/L 5.3WW001 2069-A 20-Apr-10 088054-002 Fluoride 2.99 0.033 mg/L 36WW001 2069-A 20-Apr-10 088054-001 Lead 0.0112 0.0033 mg/L 1WW001 2069-A 20-Apr-10 088054-001 Molybdenum 0.12 0.002 mg/L 2WW001 2069-A 20-Apr-10 088054-001 Nickel 0.00341 0.0015 J mg/L 2WW001 2069-A 20-Apr-10 088054-001 Selenium 0.005 U mg/L 0.46WW001 2069-A 20-Apr-10 088054-001 Silver 0.001 U mg/L 5WW001 2069-A 20-Apr-10 088054-001 Zinc 0.0632 0.0033 mg/L 2.2WW001 2069-A 21-Apr-10 088061-001 Aluminum 0.068 U mg/L 900WW001 2069-A 21-Apr-10 088061-003 Ammonia 0.999 0.016 mg/LWW001 2069-A 21-Apr-10 088061-001 Arsenic 0.0456 0.005 mg/L 0.051WW001 2069-A 21-Apr-10 088061-001 Boron 0.142 0.015 mg/LWW001 2069-A 21-Apr-10 088061-001 Cadmium 0.001 U mg/L 0.5WW001 2069-A 21-Apr-10 088061-001 Chromium 0.00488 0.001 J mg/L 4.1WW001 2069-A 21-Apr-10 088061-001 Copper 0.0337 0.003 mg/L 5.3WW001 2069-A 21-Apr-10 088061-002 Fluoride 3.21 0.033 mg/L 36WW001 2069-A 21-Apr-10 088061-001 Lead 0.0146 0.0033 mg/L 1WW001 2069-A 21-Apr-10 088061-001 Molybdenum 0.15 0.002 mg/L 2WW001 2069-A 21-Apr-10 088061-001 Nickel 0.00209 0.0015 J mg/L 2WW001 2069-A 21-Apr-10 088061-001 Selenium 0.005 U mg/L 0.46WW001 2069-A 21-Apr-10 088061-001 Silver 0.001 U mg/L 5WW001 2069-A 21-Apr-10 088061-001 Zinc 0.0531 0.0033 mg/L 2.2WW006 2069F-4 19-Apr-10 088067-001 Cyanide, total 0.0017 U mg/L 0.45WW006 2069F-4 19-Apr-10 088067-002 Cyanide, total 0.0017 U mg/L 0.45WW006 2069F-4 19-Apr-10 088067-003 Cyanide, total 0.0017 U mg/L 0.45WW006 2069F-4 19-Apr-10 088067-004 Cyanide, total 0.00389 0.0017 J mg/L 0.45WW006 2069F-4 20-Apr-10 088055-001 Aluminum 0.138 0.068 J mg/L 900WW006 2069F-4 20-Apr-10 088055-007 Ammonia 24.8 0.4 mg/LWW006 2069F-4 20-Apr-10 088055-001 Arsenic 0.0102 0.005 J mg/L 0.051WW006 2069F-4 20-Apr-10 088055-001 Boron 0.125 0.015 mg/LWW006 2069F-4 20-Apr-10 088055-001 Cadmium 0.001 U mg/L 0.5WW006 2069F-4 20-Apr-10 088055-001 Chromium 0.00295 0.001 J mg/L 4.1WW006 2069F-4 20-Apr-10 088055-001 Copper 0.0103 0.003 mg/L 5.3WW006 2069F-4 20-Apr-10 088055-002 Fluoride 0.849 0.033 mg/L 36WW006 2069F-4 20-Apr-10 088055-001 Lead 0.00368 0.0033 J mg/L 1WW006 2069F-4 20-Apr-10 088055-001 Molybdenum 0.15 0.002 mg/L 2WW006 2069F-4 20-Apr-10 088055-001 Nickel 0.00217 0.0015 J mg/L 2WW006 2069F-4 20-Apr-10 088055-001 Selenium 0.005 U mg/L 0.46

StationPermit
NumberDate
Collected Sample ID Analyte Result MDLLab Data Qualifier Units
Regulatory Limit (COA)
TABLE A-1. Permitted Sanitary Outfalls of Inorganic Analyses, February 2010 and April 2010
WW006 2069F-4 20-Apr-10 088055-001 Silver 0.005 U mg/L 5WW006 2069F-4 20-Apr-10 088055-001 Zinc 0.0608 0.0033 mg/L 2.2WW006 2069F-4 21-Apr-10 088062-001 Aluminum 0.141 0.068 J mg/L 900WW006 2069F-4 21-Apr-10 088062-003 Ammonia 11.2 0.16 mg/LWW006 2069F-4 21-Apr-10 088062-001 Arsenic 0.00977 0.005 J mg/L 0.051WW006 2069F-4 21-Apr-10 088062-001 Boron 0.128 0.015 mg/LWW006 2069F-4 21-Apr-10 088062-001 Cadmium 0.001 U mg/L 0.5WW006 2069F-4 21-Apr-10 088062-001 Chromium 0.00244 0.001 J mg/L 4.1WW006 2069F-4 21-Apr-10 088062-001 Copper 0.0136 0.003 mg/L 5.3WW006 2069F-4 21-Apr-10 088062-002 Fluoride 0.908 0.033 mg/L 36WW006 2069F-4 21-Apr-10 088062-001 Lead 0.00542 0.0033 J mg/L 1WW006 2069F-4 21-Apr-10 088062-001 Molybdenum 0.0997 0.002 mg/L 2WW006 2069F-4 21-Apr-10 088062-001 Nickel 0.00218 0.0015 J mg/L 2WW006 2069F-4 21-Apr-10 088062-001 Selenium 0.005 U mg/L 0.46WW006 2069F-4 21-Apr-10 088062-001 Silver 0.001 U mg/L 5WW006 2069F-4 21-Apr-10 088062-001 Zinc 0.0803 0.0033 mg/L 2.2WW006 #2 2069F-4 20-Apr-10 088070-001 Cyanide, total 0.0017 U mg/L 0.45WW006 #2 2069F-4 20-Apr-10 088070-002 Cyanide, total 0.0017 U mg/L 0.45WW006 #2 2069F-4 20-Apr-10 088070-003 Cyanide, total 0.0017 U mg/L 0.45WW006 #2 2069F-4 20-Apr-10 088070-004 Cyanide, total 0.00235 0.0017 J mg/L 0.45WW007 2069G-2 19-Apr-10 088068-001 Cyanide, total 0.0017 U mg/L 0.45WW007 2069G-2 19-Apr-10 088068-002 Cyanide, total 0.0017 U mg/L 0.45WW007 2069G-2 19-Apr-10 088068-003 Cyanide, total 0.0017 U mg/L 0.45WW007 2069G-2 19-Apr-10 088068-004 Cyanide, total 0.0017 U mg/L 0.45WW007 2069G-2 20-Apr-10 088056-001 Aluminum 0.068 U mg/L 900WW007 2069G-2 20-Apr-10 088056-004 Ammonia 0.951 0.016 mg/LWW007 2069G-2 20-Apr-10 088056-001 Arsenic 0.005 U mg/L 0.051WW007 2069G-2 20-Apr-10 088056-001 Boron 0.032 0.015 J mg/LWW007 2069G-2 20-Apr-10 088056-001 Cadmium 0.001 U mg/L 0.5WW007 2069G-2 20-Apr-10 088056-001 Chromium 0.00187 0.001 J mg/L 4.1WW007 2069G-2 20-Apr-10 088056-001 Copper 0.003 U mg/L 5.3WW007 2069G-2 20-Apr-10 088056-002 Fluoride 1.39 0.033 mg/L 36WW007 2069G-2 20-Apr-10 088056-001 Lead 0.0033 U mg/L 1WW007 2069G-2 20-Apr-10 088056-001 Molybdenum 0.0232 0.002 mg/L 2WW007 2069G-2 20-Apr-10 088056-001 Nickel 0.0015 U mg/L 2WW007 2069G-2 20-Apr-10 088056-001 Selenium 0.005 U mg/L 0.46WW007 2069G-2 20-Apr-10 088056-001 Silver 0.001 U mg/L 5WW007 2069G-2 20-Apr-10 088056-001 Zinc 0.0033 U mg/L 2.2

StationPermit
NumberDate
Collected Sample ID Analyte Result MDLLab Data Qualifier Units
Regulatory Limit (COA)
TABLE A-1. Permitted Sanitary Outfalls of Inorganic Analyses, February 2010 and April 2010
WW007 2069G-2 21-Apr-10 088063-001 Aluminum 0.068 U mg/L 900WW007 2069G-2 21-Apr-10 088063-003 Ammonia 1.01 0.016 mg/LWW007 2069G-2 21-Apr-10 088063-001 Arsenic 0.132 0.005 mg/L 0.051WW007 2069G-2 21-Apr-10 088063-001 Boron 0.132 0.015 mg/LWW007 2069G-2 21-Apr-10 088063-001 Cadmium 0.001 U mg/L 0.5WW007 2069G-2 21-Apr-10 088063-001 Chromium 0.00139 0.001 J mg/L 4.1WW007 2069G-2 21-Apr-10 088063-001 Copper 0.003 U mg/L 5.3WW007 2069G-2 21-Apr-10 088063-002 Fluoride 1.16 0.033 mg/L 36WW007 2069G-2 21-Apr-10 088063-001 Lead 0.0033 U mg/L 1WW007 2069G-2 21-Apr-10 088063-001 Molybdenum 0.0215 0.002 mg/L 2WW007 2069G-2 21-Apr-10 088063-001 Nickel 0.0015 U mg/L 2WW007 2069G-2 21-Apr-10 088063-001 Selenium 0.005 U mg/L 0.46WW007 2069G-2 21-Apr-10 088063-001 Silver 0.001 U mg/L 5WW007 2069G-2 21-Apr-10 088063-001 Zinc 0.0033 U mg/L 2.2WW008 2069I-3 19-Apr-10 088069-001 Cyanide, total 0.0017 U mg/L 0.45WW008 2069I-3 19-Apr-10 088069-002 Cyanide, total 0.0017 U mg/L 0.45WW008 2069I-3 19-Apr-10 088069-003 Cyanide, total 0.00442 0.0017 J mg/L 0.45WW008 2069I-3 19-Apr-10 088069-004 Cyanide, total 0.0017 U mg/L 0.45WW008 2069I-3 20-Apr-10 088057-001 Aluminum 0.149 0.068 J mg/L 900WW008 2069I-3 20-Apr-10 088057-007 Ammonia 0.135 0.016 mg/LWW008 2069I-3 20-Apr-10 088057-001 Arsenic 0.00702 0.005 J mg/L 0.051WW008 2069I-3 20-Apr-10 088057-001 Boron 0.0842 0.015 mg/LWW008 2069I-3 20-Apr-10 088057-001 Cadmium 0.001 U mg/L 0.5WW008 2069I-3 20-Apr-10 088057-001 Chromium 0.00215 0.001 J mg/L 4.1WW008 2069I-3 20-Apr-10 088057-001 Copper 0.034 0.003 mg/L 5.3WW008 2069I-3 20-Apr-10 088057-002 Fluoride 0.653 0.033 mg/L 36WW008 2069I-3 20-Apr-10 088057-001 Lead 0.0033 U mg/L 1WW008 2069I-3 20-Apr-10 088057-001 Molybdenum 0.00904 0.002 J mg/L 2WW008 2069I-3 20-Apr-10 088057-001 Nickel 0.0037 0.0015 J mg/L 2WW008 2069I-3 20-Apr-10 088057-001 Selenium 0.005 U mg/L 0.46WW008 2069I-3 20-Apr-10 088057-001 Silver 0.001 U mg/L 5WW008 2069I-3 20-Apr-10 088057-001 Zinc 0.104 0.0033 mg/L 2.2WW008 2069I-3 21-Apr-10 088064-001 Aluminum 0.13 0.068 J mg/L 900WW008 2069I-3 21-Apr-10 088064-003 Ammonia 28.7 0.4 mg/LWW008 2069I-3 21-Apr-10 088064-001 Arsenic 0.00977 0.005 J mg/L 0.051WW008 2069I-3 21-Apr-10 088064-001 Boron 0.0825 0.015 mg/LWW008 2069I-3 21-Apr-10 088064-001 Cadmium 0.001 U mg/L 0.5WW008 2069I-3 21-Apr-10 088064-001 Chromium 0.00256 0.001 J mg/L 4.1

StationPermit
NumberDate
Collected Sample ID Analyte Result MDLLab Data Qualifier Units
Regulatory Limit (COA)
TABLE A-1. Permitted Sanitary Outfalls of Inorganic Analyses, February 2010 and April 2010
WW008 2069I-3 21-Apr-10 088064-001 Copper 0.0325 0.003 mg/L 5.3WW008 2069I-3 21-Apr-10 088064-002 Fluoride 0.756 0.033 mg/L 36WW008 2069I-3 21-Apr-10 088064-001 Lead 0.0033 U mg/L 1WW008 2069I-3 21-Apr-10 088064-001 Molybdenum 0.0831 0.002 mg/L 2WW008 2069I-3 21-Apr-10 088064-001 Nickel 0.0027 0.0015 J mg/L 2WW008 2069I-3 21-Apr-10 088064-001 Selenium 0.005 U mg/L 0.46WW008 2069I-3 21-Apr-10 088064-001 Silver 0.001 U mg/L 5WW008 2069I-3 21-Apr-10 088064-001 Zinc 0.0815 0.0033 mg/L 2.2WW011 2069-K 20-Apr-10 088058-001 Aluminum 0.136 0.068 J mg/L 900WW011 2069-K 20-Apr-10 088058-007 Ammonia 14.9 0.16 mg/LWW011 2069-K 20-Apr-10 088058-001 Arsenic 0.00915 0.005 J mg/L 0.051WW011 2069-K 20-Apr-10 088058-001 Boron 0.0913 0.015 mg/LWW011 2069-K 20-Apr-10 088058-001 Cadmium 0.001 U mg/L 0.5WW011 2069-K 20-Apr-10 088058-001 Chromium 0.0048 0.001 J mg/L 4.1WW011 2069-K 20-Apr-10 088058-001 Copper 0.0275 0.003 mg/L 5.3WW011 2069-K 20-Apr-10 088058-002 Fluoride 0.656 0.033 mg/L 36WW011 2069-K 20-Apr-10 088058-001 Lead 0.0033 U mg/L 1WW011 2069-K 20-Apr-10 088058-001 Molybdenum 0.0145 0.002 mg/L 2WW011 2069-K 20-Apr-10 088058-001 Nickel 0.00215 0.0015 J mg/L 2WW011 2069-K 20-Apr-10 088058-001 Selenium 0.005 U mg/L 0.46WW011 2069-K 20-Apr-10 088058-001 Silver 0.001 U mg/L 5WW011 2069-K 20-Apr-10 088058-001 Zinc 0.077 0.0033 mg/L 2.2WW011 2069-K 21-Apr-10 088065-001 Aluminum 0.433 0.068 mg/L 900WW011 2069-K 21-Apr-10 088065-003 Ammonia 9.87 0.16 mg/LWW011 2069-K 21-Apr-10 088065-001 Arsenic 0.00771 0.005 J mg/L 0.051WW011 2069-K 21-Apr-10 088065-001 Boron 0.0856 0.015 mg/LWW011 2069-K 21-Apr-10 088065-001 Cadmium 0.001 U mg/L 0.5WW011 2069-K 21-Apr-10 088065-001 Chromium 0.00868 0.001 mg/L 4.1WW011 2069-K 21-Apr-10 088065-001 Copper 0.0689 0.003 mg/L 5.3WW011 2069-K 21-Apr-10 088065-002 Fluoride 0.659 0.033 mg/L 36WW011 2069-K 21-Apr-10 088065-001 Lead 0.00634 0.0033 J mg/L 1WW011 2069-K 21-Apr-10 088065-001 Molybdenum 0.0557 0.002 mg/L 2WW011 2069-K 21-Apr-10 088065-001 Nickel 0.00483 0.0015 J mg/L 2

StationPermit
NumberDate
Collected Sample ID Analyte Result MDLLab Data Qualifier Units
Regulatory Limit (COA)
TABLE A-1. Permitted Sanitary Outfalls of Inorganic Analyses, February 2010 and April 2010
WW011 2069-K 21-Apr-10 088065-001 Selenium 0.005 U mg/L 0.46WW011 2069-K 21-Apr-10 088065-001 Silver 0.001 U mg/L 5WW011 2069-K 21-Apr-10 088065-001 Zinc 0.221 0.0033 mg/L 2.2
NOTES:COA = City of AlbuquerqueMDL = Method detection limitmg/L = milligrams per literJ = Estimated value, the analyte concentration fell above the effective MDL and below the effective (PQL) practical quantitation limitU = The analyte was analyzed for, but not detected. For organic and inorganic analytes the result is less than the effective
MDL concentration

StationPermit
NumberDate
Collected Sample ID Analyte ActivityTwo Sigma
ErrorLab Data Qualifier MDA Units
Regulatory Sewer Release Limits*
(Monthly Avg)CINT 2238A 20-Apr-10 088060-002 Actinium-228 -1.15 13.9 U 13.3 pCi/L 300000CINT 2238A 20-Apr-10 088060-001 Alpha, gross 1.99 0.948 1.21 pCi/LCINT 2238A 20-Apr-10 088060-002 Americium-241 -3.73 5.31 U 8.78 pCi/L 200CINT 2238A 20-Apr-10 088060-002 Beryllium-7 -4.07 16.5 U 26.7 pCi/LCINT 2238A 20-Apr-10 088060-001 Beta, gross 3.25 0.825 0.773 pCi/LCINT 2238A 20-Apr-10 088060-002 Bismuth-212 29.7 25.2 U 44.5 pCi/LCINT 2238A 20-Apr-10 088060-002 Bismuth-214 7.29 4 U 7.29 pCi/LCINT 2238A 20-Apr-10 088060-002 Cesium-137 0.193 1.83 U 3.12 pCi/L 10000CINT 2238A 20-Apr-10 088060-002 Cobalt-60 -0.0175 1.95 U 3.27 pCi/L 30000CINT 2238A 20-Apr-10 088060-002 Lead-212 3.53 5.06 U 6.29 pCi/L 20000CINT 2238A 20-Apr-10 088060-002 Lead-214 -3.37 5.97 U 6.62 pCi/L 1000000CINT 2238A 20-Apr-10 088060-002 Neptunium-237 -20.1 14.4 U 16 pCi/LCINT 2238A 20-Apr-10 088060-002 Potassium-40 8.92 35.9 U 46.6 pCi/L 40000CINT 2238A 20-Apr-10 088060-002 Radium-223 13.9 739 U 56.6 pCi/LCINT 2238A 20-Apr-10 088060-002 Radium-224 -102 36.2 U 55.6 pCi/LCINT 2238A 20-Apr-10 088060-002 Radium-226 -1.54 62.5 U 67.6 pCi/L 600CINT 2238A 20-Apr-10 088060-002 Radium-228 -1.15 13.9 U 13.3 pCi/L 600CINT 2238A 20-Apr-10 088060-002 Sodium-22 1.88 1.86 U 3.35 pCi/LCINT 2238A 20-Apr-10 088060-002 Thorium-227 1.51 81.1 U 21.4 pCi/LCINT 2238A 20-Apr-10 088060-002 Thorium-231 -21.6 26.4 U 31.5 pCi/L 300CINT 2238A 20-Apr-10 088060-002 Thorium-234 -10.7 89 U 93.6 pCi/L 50000CINT 2238A 20-Apr-10 088060-003 Tritium -19.1 90.1 U 157 pCi/L 10000000CINT 2238A 20-Apr-10 088060-002 Uranium-235 4.49 15.6 U 17.3 pCi/L 3000CINT 2238A 20-Apr-10 088060-002 Uranium-238 -10.7 89 U 93.6 pCi/L 3000WW001 2069-A 20-Apr-10 088054-004 Actinium-228 -20.4 14.6 U 17.2 pCi/L 300000WW001 2069-A 20-Apr-10 088054-003 Alpha, gross 2.65 1.28 1.56 pCi/LWW001 2069-A 20-Apr-10 088054-004 Americium-241 4.26 2.96 U 5.29 pCi/L 200WW001 2069-A 20-Apr-10 088054-004 Beryllium-7 -6.21 17.3 U 28.5 pCi/LWW001 2069-A 20-Apr-10 088054-003 Beta, gross 11.7 2.48 2.01 pCi/LWW001 2069-A 20-Apr-10 088054-004 Bismuth-212 -44.7 49.4 U 53 pCi/LWW001 2069-A 20-Apr-10 088054-004 Bismuth-214 1.41 9.46 U 9.27 pCi/LWW001 2069-A 20-Apr-10 088054-004 Cesium-137 0.111 2.41 U 3.94 pCi/L 10000WW001 2069-A 20-Apr-10 088054-004 Cobalt-60 2.77 2.36 U 4.37 pCi/L 30000
TABLE A-2. Summary of Sanitary Outfalls of Radiological Analyses, April 2010
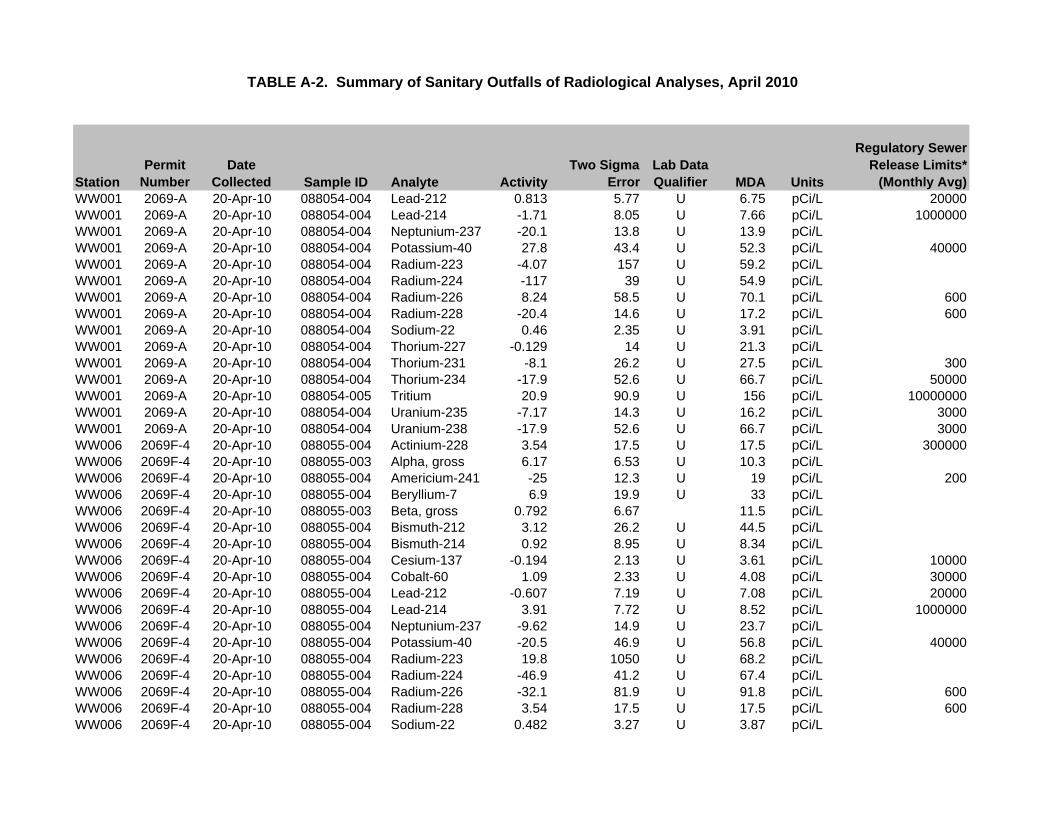
StationPermit
NumberDate
Collected Sample ID Analyte ActivityTwo Sigma
ErrorLab Data Qualifier MDA Units
Regulatory Sewer Release Limits*
(Monthly Avg)
TABLE A-2. Summary of Sanitary Outfalls of Radiological Analyses, April 2010
WW001 2069-A 20-Apr-10 088054-004 Lead-212 0.813 5.77 U 6.75 pCi/L 20000WW001 2069-A 20-Apr-10 088054-004 Lead-214 -1.71 8.05 U 7.66 pCi/L 1000000WW001 2069-A 20-Apr-10 088054-004 Neptunium-237 -20.1 13.8 U 13.9 pCi/LWW001 2069-A 20-Apr-10 088054-004 Potassium-40 27.8 43.4 U 52.3 pCi/L 40000WW001 2069-A 20-Apr-10 088054-004 Radium-223 -4.07 157 U 59.2 pCi/LWW001 2069-A 20-Apr-10 088054-004 Radium-224 -117 39 U 54.9 pCi/LWW001 2069-A 20-Apr-10 088054-004 Radium-226 8.24 58.5 U 70.1 pCi/L 600WW001 2069-A 20-Apr-10 088054-004 Radium-228 -20.4 14.6 U 17.2 pCi/L 600WW001 2069-A 20-Apr-10 088054-004 Sodium-22 0.46 2.35 U 3.91 pCi/LWW001 2069-A 20-Apr-10 088054-004 Thorium-227 -0.129 14 U 21.3 pCi/LWW001 2069-A 20-Apr-10 088054-004 Thorium-231 -8.1 26.2 U 27.5 pCi/L 300WW001 2069-A 20-Apr-10 088054-004 Thorium-234 -17.9 52.6 U 66.7 pCi/L 50000WW001 2069-A 20-Apr-10 088054-005 Tritium 20.9 90.9 U 156 pCi/L 10000000WW001 2069-A 20-Apr-10 088054-004 Uranium-235 -7.17 14.3 U 16.2 pCi/L 3000WW001 2069-A 20-Apr-10 088054-004 Uranium-238 -17.9 52.6 U 66.7 pCi/L 3000WW006 2069F-4 20-Apr-10 088055-004 Actinium-228 3.54 17.5 U 17.5 pCi/L 300000WW006 2069F-4 20-Apr-10 088055-003 Alpha, gross 6.17 6.53 U 10.3 pCi/LWW006 2069F-4 20-Apr-10 088055-004 Americium-241 -25 12.3 U 19 pCi/L 200WW006 2069F-4 20-Apr-10 088055-004 Beryllium-7 6.9 19.9 U 33 pCi/LWW006 2069F-4 20-Apr-10 088055-003 Beta, gross 0.792 6.67 11.5 pCi/LWW006 2069F-4 20-Apr-10 088055-004 Bismuth-212 3.12 26.2 U 44.5 pCi/LWW006 2069F-4 20-Apr-10 088055-004 Bismuth-214 0.92 8.95 U 8.34 pCi/LWW006 2069F-4 20-Apr-10 088055-004 Cesium-137 -0.194 2.13 U 3.61 pCi/L 10000WW006 2069F-4 20-Apr-10 088055-004 Cobalt-60 1.09 2.33 U 4.08 pCi/L 30000WW006 2069F-4 20-Apr-10 088055-004 Lead-212 -0.607 7.19 U 7.08 pCi/L 20000WW006 2069F-4 20-Apr-10 088055-004 Lead-214 3.91 7.72 U 8.52 pCi/L 1000000WW006 2069F-4 20-Apr-10 088055-004 Neptunium-237 -9.62 14.9 U 23.7 pCi/LWW006 2069F-4 20-Apr-10 088055-004 Potassium-40 -20.5 46.9 U 56.8 pCi/L 40000WW006 2069F-4 20-Apr-10 088055-004 Radium-223 19.8 1050 U 68.2 pCi/LWW006 2069F-4 20-Apr-10 088055-004 Radium-224 -46.9 41.2 U 67.4 pCi/LWW006 2069F-4 20-Apr-10 088055-004 Radium-226 -32.1 81.9 U 91.8 pCi/L 600WW006 2069F-4 20-Apr-10 088055-004 Radium-228 3.54 17.5 U 17.5 pCi/L 600WW006 2069F-4 20-Apr-10 088055-004 Sodium-22 0.482 3.27 U 3.87 pCi/L

StationPermit
NumberDate
Collected Sample ID Analyte ActivityTwo Sigma
ErrorLab Data Qualifier MDA Units
Regulatory Sewer Release Limits*
(Monthly Avg)
TABLE A-2. Summary of Sanitary Outfalls of Radiological Analyses, April 2010
WW006 2069F-4 20-Apr-10 088055-004 Thorium-227 -3.61 194 U 26.9 pCi/LWW006 2069F-4 20-Apr-10 088055-004 Thorium-231 -12.4 44 U 47.8 pCi/L 300WW006 2069F-4 20-Apr-10 088055-004 Thorium-234 -34.9 160 U 189 pCi/L 50000WW006 2069F-4 20-Apr-10 088055-005 Tritium -53.1 88.1 U 156 pCi/L 10000000WW006 2069F-4 20-Apr-10 088055-004 Uranium-235 2.32 22.2 U 22.5 pCi/L 3000WW006 2069F-4 20-Apr-10 088055-004 Uranium-238 -34.9 160 U 189 pCi/L 3000WW008 2069I-3 20-Apr-10 088057-004 Actinium-228 -0.671 9.61 U 11.3 pCi/L 300000WW008 2069I-3 20-Apr-10 088057-003 Alpha, gross 1.41 1.04 1.19 pCi/LWW008 2069I-3 20-Apr-10 088057-004 Americium-241 3.55 5.69 U 8.74 pCi/L 200WW008 2069I-3 20-Apr-10 088057-004 Beryllium-7 -2.46 13.7 U 22.5 pCi/LWW008 2069I-3 20-Apr-10 088057-003 Beta, gross 21 3.61 0.952 pCi/LWW008 2069I-3 20-Apr-10 088057-004 Bismuth-212 0.238 30.2 U 35.9 pCi/LWW008 2069I-3 20-Apr-10 088057-004 Bismuth-214 2.28 5.65 U 6 pCi/LWW008 2069I-3 20-Apr-10 088057-004 Cesium-137 1.26 1.45 U 2.6 pCi/L 10000WW008 2069I-3 20-Apr-10 088057-004 Cobalt-60 0.0096 1.71 U 2.8 pCi/L 30000WW008 2069I-3 20-Apr-10 088057-004 Lead-212 3.17 4.34 U 5.27 pCi/L 20000WW008 2069I-3 20-Apr-10 088057-004 Lead-214 0.14 5.72 U 5.74 pCi/L 1000000WW008 2069I-3 20-Apr-10 088057-004 Neptunium-237 -6.72 12.5 U 14.8 pCi/LWW008 2069I-3 20-Apr-10 088057-004 Potassium-40 54.4 42.7 23.9 pCi/L 40000WW008 2069I-3 20-Apr-10 088057-004 Radium-223 -5.34 286 U 46.1 pCi/LWW008 2069I-3 20-Apr-10 088057-004 Radium-224 -53 29.5 U 47.1 pCi/LWW008 2069I-3 20-Apr-10 088057-004 Radium-226 -12.4 60.8 U 65.4 pCi/L 600WW008 2069I-3 20-Apr-10 088057-004 Radium-228 -0.671 9.61 U 11.3 pCi/L 600WW008 2069I-3 20-Apr-10 088057-004 Sodium-22 1.68 1.48 U 2.65 pCi/LWW008 2069I-3 20-Apr-10 088057-004 Thorium-227 -4.55 243 U 17.9 pCi/LWW008 2069I-3 20-Apr-10 088057-004 Thorium-231 -19.3 25.6 U 28.2 pCi/L 300WW008 2069I-3 20-Apr-10 088057-004 Thorium-234 9.48 88.9 U 103 pCi/L 50000WW008 2069I-3 20-Apr-10 088057-005 Tritium -81.6 87.2 U 156 pCi/L 10000000WW008 2069I-3 20-Apr-10 088057-004 Uranium-235 -0.559 14.5 U 15.2 pCi/L 3000WW008 2069I-3 20-Apr-10 088057-004 Uranium-238 9.48 88.9 U 103 pCi/L 3000WW011 2069-K 20-Apr-10 088058-004 Actinium-228 -6.61 14.1 U 15.6 pCi/L 300000WW011 2069-K 20-Apr-10 088058-003 Alpha, gross 2.27 1.6 1.81 pCi/LWW011 2069-K 20-Apr-10 088058-004 Americium-241 -7.51 10.6 U 17.6 pCi/L 200
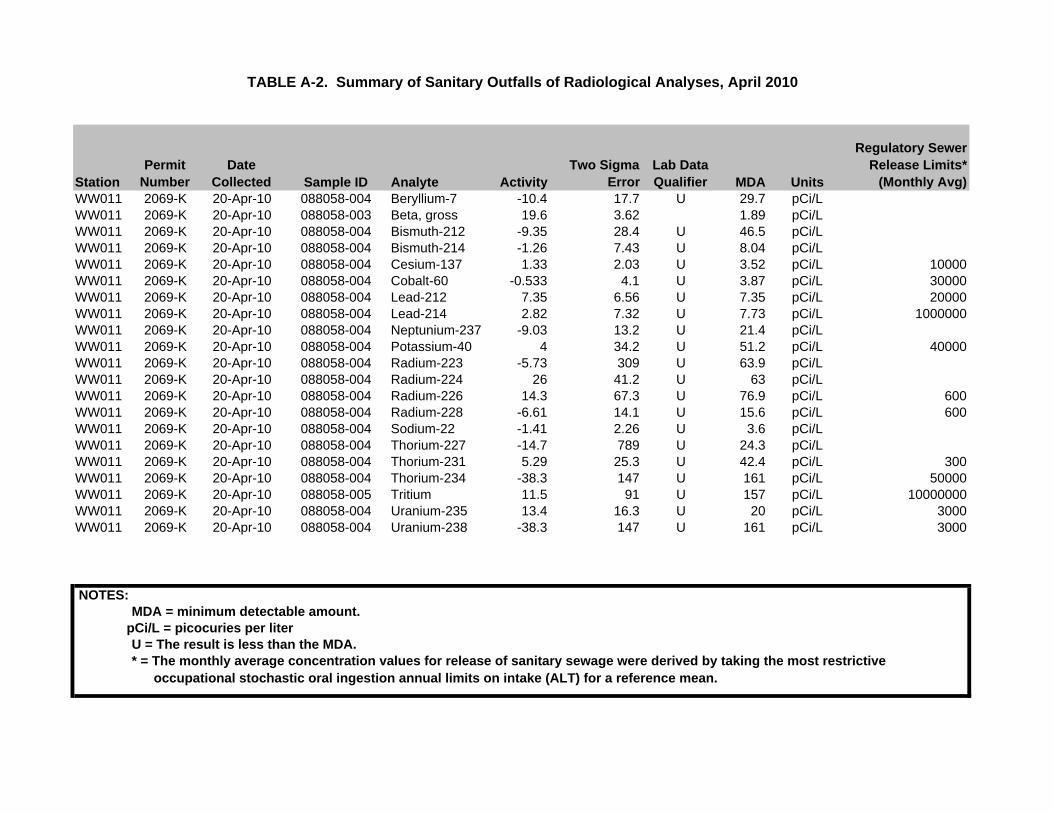
StationPermit
NumberDate
Collected Sample ID Analyte ActivityTwo Sigma
ErrorLab Data Qualifier MDA Units
Regulatory Sewer Release Limits*
(Monthly Avg)
TABLE A-2. Summary of Sanitary Outfalls of Radiological Analyses, April 2010
WW011 2069-K 20-Apr-10 088058-004 Beryllium-7 -10.4 17.7 U 29.7 pCi/LWW011 2069-K 20-Apr-10 088058-003 Beta, gross 19.6 3.62 1.89 pCi/LWW011 2069-K 20-Apr-10 088058-004 Bismuth-212 -9.35 28.4 U 46.5 pCi/LWW011 2069-K 20-Apr-10 088058-004 Bismuth-214 -1.26 7.43 U 8.04 pCi/LWW011 2069-K 20-Apr-10 088058-004 Cesium-137 1.33 2.03 U 3.52 pCi/L 10000WW011 2069-K 20-Apr-10 088058-004 Cobalt-60 -0.533 4.1 U 3.87 pCi/L 30000WW011 2069-K 20-Apr-10 088058-004 Lead-212 7.35 6.56 U 7.35 pCi/L 20000WW011 2069-K 20-Apr-10 088058-004 Lead-214 2.82 7.32 U 7.73 pCi/L 1000000WW011 2069-K 20-Apr-10 088058-004 Neptunium-237 -9.03 13.2 U 21.4 pCi/LWW011 2069-K 20-Apr-10 088058-004 Potassium-40 4 34.2 U 51.2 pCi/L 40000WW011 2069-K 20-Apr-10 088058-004 Radium-223 -5.73 309 U 63.9 pCi/LWW011 2069-K 20-Apr-10 088058-004 Radium-224 26 41.2 U 63 pCi/LWW011 2069-K 20-Apr-10 088058-004 Radium-226 14.3 67.3 U 76.9 pCi/L 600WW011 2069-K 20-Apr-10 088058-004 Radium-228 -6.61 14.1 U 15.6 pCi/L 600WW011 2069-K 20-Apr-10 088058-004 Sodium-22 -1.41 2.26 U 3.6 pCi/LWW011 2069-K 20-Apr-10 088058-004 Thorium-227 -14.7 789 U 24.3 pCi/LWW011 2069-K 20-Apr-10 088058-004 Thorium-231 5.29 25.3 U 42.4 pCi/L 300WW011 2069-K 20-Apr-10 088058-004 Thorium-234 -38.3 147 U 161 pCi/L 50000WW011 2069-K 20-Apr-10 088058-005 Tritium 11.5 91 U 157 pCi/L 10000000WW011 2069-K 20-Apr-10 088058-004 Uranium-235 13.4 16.3 U 20 pCi/L 3000WW011 2069-K 20-Apr-10 088058-004 Uranium-238 -38.3 147 U 161 pCi/L 3000
NOTES:MDA = minimum detectable amount.
pCi/L = picocuries per literU = The result is less than the MDA.* = The monthly average concentration values for release of sanitary sewage were derived by taking the most restrictive
occupational stochastic oral ingestion annual limits on intake (ALT) for a reference mean.

Station Permit Number Date Collected Sample ID Analyte Result MDL Lab Data Qualifier UnitsCINT 2238A 21-Apr-10 088066-002 Acenaphthene 0.292 U ug/LCINT 2238A 21-Apr-10 088066-002 Acenaphthylene 0.189 U ug/LCINT 2238A 21-Apr-10 088066-002 Anthracene 0.189 U ug/LCINT 2238A 21-Apr-10 088066-002 Benzo(a)anthracene 0.189 U ug/LCINT 2238A 21-Apr-10 088066-002 Benzo(a)pyrene 0.189 U ug/LCINT 2238A 21-Apr-10 088066-002 Benzo(b)fluoranthene 0.189 U ug/LCINT 2238A 21-Apr-10 088066-002 Benzo(ghi)perylene 0.189 U ug/LCINT 2238A 21-Apr-10 088066-002 Benzo(k)fluoranthene 0.189 U ug/LCINT 2238A 21-Apr-10 088066-002 Bromophenyl phenyl ether, 4- 1.89 U ug/LCINT 2238A 21-Apr-10 088066-002 Butylbenzyl phthalate 1.89 U ug/LCINT 2238A 21-Apr-10 088066-002 Carbazole 0.189 U ug/LCINT 2238A 21-Apr-10 088066-002 Chloro-3-methylphenol, 4- 1.89 U ug/LCINT 2238A 21-Apr-10 088066-002 Chlorobenzenamine, 4- 1.89 U ug/LCINT 2238A 21-Apr-10 088066-002 Chloroethoxy)methane, bis(2- 2.83 U ug/LCINT 2238A 21-Apr-10 088066-002 Chloroethyl)ether, bis(2- 1.89 U ug/LCINT 2238A 21-Apr-10 088066-002 Chloroisopropyl ether, bis- 1.89 U ug/LCINT 2238A 21-Apr-10 088066-002 Chloronaphthalene, 2- 0.283 U ug/LCINT 2238A 21-Apr-10 088066-002 Chlorophenol, 2- 1.89 U ug/LCINT 2238A 21-Apr-10 088066-002 Chlorophenyl phenyl ether, 4- 1.89 U ug/LCINT 2238A 21-Apr-10 088066-002 Chrysene 0.189 U ug/LCINT 2238A 21-Apr-10 088066-002 Cresol, m,p- 2.83 U ug/LCINT 2238A 21-Apr-10 088066-002 Cresol, o- 1.89 U ug/LCINT 2238A 21-Apr-10 088066-002 Di-n-butyl phthalate 1.89 U ug/LCINT 2238A 21-Apr-10 088066-002 Di-n-octyl phthalate 2.83 U ug/LCINT 2238A 21-Apr-10 088066-002 Dibenz[a,h]anthracene 0.189 U ug/LCINT 2238A 21-Apr-10 088066-002 Dibenzofuran 1.89 U ug/LCINT 2238A 21-Apr-10 088066-002 Dichlorobenzene, 1,2- 1.89 U ug/LCINT 2238A 21-Apr-10 088066-002 Dichlorobenzene, 1,3- 1.89 U ug/LCINT 2238A 21-Apr-10 088066-002 Dichlorobenzene, 1,4- 1.89 U ug/LCINT 2238A 21-Apr-10 088066-002 Dichlorobenzidine, 3,3'- 1.89 U ug/LCINT 2238A 21-Apr-10 088066-002 Dichlorophenol, 2,4- 1.89 U ug/LCINT 2238A 21-Apr-10 088066-002 Diethylphthalate 1.89 U ug/LCINT 2238A 21-Apr-10 088066-002 Dimethylphenol, 2,4- 1.89 U ug/L
TABLE A-3. Summary of Sanitary Outfalls of Semi-Volitile Organic Compounds, April 2010

Station Permit Number Date Collected Sample ID Analyte Result MDL Lab Data Qualifier Units
TABLE A-3. Summary of Sanitary Outfalls of Semi-Volitile Organic Compounds, April 2010
CINT 2238A 21-Apr-10 088066-002 Dimethylphthalate 1.89 U ug/LCINT 2238A 21-Apr-10 088066-002 Dinitro-o-cresol 2.83 U ug/LCINT 2238A 21-Apr-10 088066-002 Dinitrophenol, 2,4- 4.72 U ug/LCINT 2238A 21-Apr-10 088066-002 Dinitrotoluene, 2,4- 1.89 U ug/LCINT 2238A 21-Apr-10 088066-002 Dinitrotoluene, 2,6- 1.89 U ug/LCINT 2238A 21-Apr-10 088066-002 Diphenyl amine 2.83 U ug/LCINT 2238A 21-Apr-10 088066-002 Ethylhexyl)phthalate, bis(2- 1.89 U ug/LCINT 2238A 21-Apr-10 088066-002 Fluoranthene 0.189 U ug/LCINT 2238A 21-Apr-10 088066-002 Fluorene 0.189 U ug/LCINT 2238A 21-Apr-10 088066-002 Hexachlorobenzene 1.89 U ug/LCINT 2238A 21-Apr-10 088066-002 Hexachlorobutadiene 1.89 U ug/LCINT 2238A 21-Apr-10 088066-002 Hexachlorocyclopentadiene 2.83 U ug/LCINT 2238A 21-Apr-10 088066-002 Hexachloroethane 1.89 U ug/LCINT 2238A 21-Apr-10 088066-002 Indeno(1,2,3-c,d)pyrene 0.189 U ug/LCINT 2238A 21-Apr-10 088066-002 Isophorone 2.83 U ug/LCINT 2238A 21-Apr-10 088066-002 Methylnaphthalene, 2- 0.283 U ug/LCINT 2238A 21-Apr-10 088066-002 Naphthalene 0.283 U ug/LCINT 2238A 21-Apr-10 088066-002 Nitro-benzene 2.83 U ug/LCINT 2238A 21-Apr-10 088066-002 Nitroaniline, 2- 1.89 U ug/LCINT 2238A 21-Apr-10 088066-002 Nitroaniline, 3- 1.89 U ug/LCINT 2238A 21-Apr-10 088066-002 Nitroaniline, 4- 2.83 U ug/LCINT 2238A 21-Apr-10 088066-002 Nitrophenol, 2- 1.89 U ug/LCINT 2238A 21-Apr-10 088066-002 Nitrophenol, 4- 1.89 U ug/LCINT 2238A 21-Apr-10 088066-002 Nitrosodipropylamine, n- 1.89 U ug/LCINT 2238A 21-Apr-10 088066-002 Pentachlorophenol 1.89 U ug/LCINT 2238A 21-Apr-10 088066-002 Phenanthrene 0.189 U ug/LCINT 2238A 21-Apr-10 088066-002 Phenol 0.943 U ug/LCINT 2238A 21-Apr-10 088066-002 Pyrene 0.283 U ug/LCINT 2238A 21-Apr-10 088066-002 Trichlorobenzene, 1,2,4- 1.89 U ug/LCINT 2238A 21-Apr-10 088066-002 Trichlorophenol, 2,4,5- 1.89 U ug/LCINT 2238A 21-Apr-10 088066-002 Trichlorophenol, 2,4,6- 1.89 U ug/LWW001 2069-A 21-Apr-10 088061-004 Acenaphthene 1.11 U ug/LWW001 2069-A 21-Apr-10 088061-004 Acenaphthylene 0.714 U ug/L

Station Permit Number Date Collected Sample ID Analyte Result MDL Lab Data Qualifier Units
TABLE A-3. Summary of Sanitary Outfalls of Semi-Volitile Organic Compounds, April 2010
WW001 2069-A 21-Apr-10 088061-004 Anthracene 0.714 U ug/LWW001 2069-A 21-Apr-10 088061-004 Benzo(a)anthracene 0.714 U ug/LWW001 2069-A 21-Apr-10 088061-004 Benzo(a)pyrene 0.714 U ug/LWW001 2069-A 21-Apr-10 088061-004 Benzo(b)fluoranthene 0.714 U ug/LWW001 2069-A 21-Apr-10 088061-004 Benzo(ghi)perylene 0.714 U ug/LWW001 2069-A 21-Apr-10 088061-004 Benzo(k)fluoranthene 0.714 U ug/LWW001 2069-A 21-Apr-10 088061-004 Bromophenyl phenyl ether, 4- 7.14 U ug/LWW001 2069-A 21-Apr-10 088061-004 Butylbenzyl phthalate 7.14 U ug/LWW001 2069-A 21-Apr-10 088061-004 Carbazole 0.714 U ug/LWW001 2069-A 21-Apr-10 088061-004 Chloro-3-methylphenol, 4- 7.14 U ug/LWW001 2069-A 21-Apr-10 088061-004 Chlorobenzenamine, 4- 7.14 U ug/LWW001 2069-A 21-Apr-10 088061-004 Chloroethoxy)methane, bis(2- 10.7 U ug/LWW001 2069-A 21-Apr-10 088061-004 Chloroethyl)ether, bis(2- 7.14 U ug/LWW001 2069-A 21-Apr-10 088061-004 Chloroisopropyl ether, bis- 7.14 U ug/LWW001 2069-A 21-Apr-10 088061-004 Chloronaphthalene, 2- 1.07 U ug/LWW001 2069-A 21-Apr-10 088061-004 Chlorophenol, 2- 7.14 U ug/LWW001 2069-A 21-Apr-10 088061-004 Chlorophenyl phenyl ether, 4- 7.14 U ug/LWW001 2069-A 21-Apr-10 088061-004 Chrysene 0.714 U ug/LWW001 2069-A 21-Apr-10 088061-004 Cresol, m,p- 10.7 U ug/LWW001 2069-A 21-Apr-10 088061-004 Cresol, o- 7.14 U ug/LWW001 2069-A 21-Apr-10 088061-004 Di-n-butyl phthalate 7.14 U ug/LWW001 2069-A 21-Apr-10 088061-004 Di-n-octyl phthalate 10.7 U ug/LWW001 2069-A 21-Apr-10 088061-004 Dibenz[a,h]anthracene 0.714 U ug/LWW001 2069-A 21-Apr-10 088061-004 Dibenzofuran 7.14 U ug/LWW001 2069-A 21-Apr-10 088061-004 Dichlorobenzene, 1,2- 7.14 U ug/LWW001 2069-A 21-Apr-10 088061-004 Dichlorobenzene, 1,3- 7.14 U ug/LWW001 2069-A 21-Apr-10 088061-004 Dichlorobenzene, 1,4- 7.14 U ug/LWW001 2069-A 21-Apr-10 088061-004 Dichlorobenzidine, 3,3'- 7.14 U ug/LWW001 2069-A 21-Apr-10 088061-004 Dichlorophenol, 2,4- 7.14 U ug/LWW001 2069-A 21-Apr-10 088061-004 Diethylphthalate 7.14 U ug/LWW001 2069-A 21-Apr-10 088061-004 Dimethylphenol, 2,4- 7.14 U ug/LWW001 2069-A 21-Apr-10 088061-004 Dimethylphthalate 7.14 U ug/LWW001 2069-A 21-Apr-10 088061-004 Dinitro-o-cresol 10.7 U ug/L

Station Permit Number Date Collected Sample ID Analyte Result MDL Lab Data Qualifier Units
TABLE A-3. Summary of Sanitary Outfalls of Semi-Volitile Organic Compounds, April 2010
WW001 2069-A 21-Apr-10 088061-004 Dinitrophenol, 2,4- 17.9 U ug/LWW001 2069-A 21-Apr-10 088061-004 Dinitrotoluene, 2,4- 7.14 U ug/LWW001 2069-A 21-Apr-10 088061-004 Dinitrotoluene, 2,6- 7.14 U ug/LWW001 2069-A 21-Apr-10 088061-004 Diphenyl amine 10.7 U ug/LWW001 2069-A 21-Apr-10 088061-004 Ethylhexyl)phthalate, bis(2- 7.14 U ug/LWW001 2069-A 21-Apr-10 088061-004 Fluoranthene 0.714 U ug/LWW001 2069-A 21-Apr-10 088061-004 Fluorene 0.714 U ug/LWW001 2069-A 21-Apr-10 088061-004 Hexachlorobenzene 7.14 U ug/LWW001 2069-A 21-Apr-10 088061-004 Hexachlorobutadiene 7.14 U ug/LWW001 2069-A 21-Apr-10 088061-004 Hexachlorocyclopentadiene 10.7 U ug/LWW001 2069-A 21-Apr-10 088061-004 Hexachloroethane 7.14 U ug/LWW001 2069-A 21-Apr-10 088061-004 Indeno(1,2,3-c,d)pyrene 0.714 U ug/LWW001 2069-A 21-Apr-10 088061-004 Isophorone 10.7 U ug/LWW001 2069-A 21-Apr-10 088061-004 Methylnaphthalene, 2- 1.07 U ug/LWW001 2069-A 21-Apr-10 088061-004 Naphthalene 1.07 U ug/LWW001 2069-A 21-Apr-10 088061-004 Nitro-benzene 10.7 U ug/LWW001 2069-A 21-Apr-10 088061-004 Nitroaniline, 2- 7.14 U ug/LWW001 2069-A 21-Apr-10 088061-004 Nitroaniline, 3- 7.14 U ug/LWW001 2069-A 21-Apr-10 088061-004 Nitroaniline, 4- 10.7 U ug/LWW001 2069-A 21-Apr-10 088061-004 Nitrophenol, 2- 7.14 U ug/LWW001 2069-A 21-Apr-10 088061-004 Nitrophenol, 4- 7.14 U ug/LWW001 2069-A 21-Apr-10 088061-004 Nitrosodipropylamine, n- 7.14 U ug/LWW001 2069-A 21-Apr-10 088061-004 Pentachlorophenol 7.14 U ug/LWW001 2069-A 21-Apr-10 088061-004 Phenanthrene 0.714 U ug/LWW001 2069-A 21-Apr-10 088061-004 Phenol 3.57 U ug/LWW001 2069-A 21-Apr-10 088061-004 Pyrene 1.07 U ug/LWW001 2069-A 21-Apr-10 088061-004 Trichlorobenzene, 1,2,4- 7.14 U ug/LWW001 2069-A 21-Apr-10 088061-004 Trichlorophenol, 2,4,5- 7.14 U ug/LWW001 2069-A 21-Apr-10 088061-004 Trichlorophenol, 2,4,6- 7.14 U ug/LWW006 2069F-4 21-Apr-10 088062-004 Acenaphthene 1.19 U ug/LWW006 2069F-4 21-Apr-10 088062-004 Acenaphthylene 0.769 U ug/LWW006 2069F-4 21-Apr-10 088062-004 Anthracene 0.769 U ug/LWW006 2069F-4 21-Apr-10 088062-004 Benzo(a)anthracene 0.769 U ug/L

Station Permit Number Date Collected Sample ID Analyte Result MDL Lab Data Qualifier Units
TABLE A-3. Summary of Sanitary Outfalls of Semi-Volitile Organic Compounds, April 2010
WW006 2069F-4 21-Apr-10 088062-004 Benzo(a)pyrene 0.769 U ug/LWW006 2069F-4 21-Apr-10 088062-004 Benzo(b)fluoranthene 0.769 U ug/LWW006 2069F-4 21-Apr-10 088062-004 Benzo(ghi)perylene 0.769 U ug/LWW006 2069F-4 21-Apr-10 088062-004 Benzo(k)fluoranthene 0.769 U ug/LWW006 2069F-4 21-Apr-10 088062-004 Bromophenyl phenyl ether, 4- 7.69 U ug/LWW006 2069F-4 21-Apr-10 088062-004 Butylbenzyl phthalate 7.69 U ug/LWW006 2069F-4 21-Apr-10 088062-004 Carbazole 0.769 U ug/LWW006 2069F-4 21-Apr-10 088062-004 Chloro-3-methylphenol, 4- 7.69 U ug/LWW006 2069F-4 21-Apr-10 088062-004 Chlorobenzenamine, 4- 7.69 U ug/LWW006 2069F-4 21-Apr-10 088062-004 Chloroethoxy)methane, bis(2- 11.5 U ug/LWW006 2069F-4 21-Apr-10 088062-004 Chloroethyl)ether, bis(2- 7.69 U ug/LWW006 2069F-4 21-Apr-10 088062-004 Chloroisopropyl ether, bis- 7.69 U ug/LWW006 2069F-4 21-Apr-10 088062-004 Chloronaphthalene, 2- 1.15 U ug/LWW006 2069F-4 21-Apr-10 088062-004 Chlorophenol, 2- 7.69 U ug/LWW006 2069F-4 21-Apr-10 088062-004 Chlorophenyl phenyl ether, 4- 7.69 U ug/LWW006 2069F-4 21-Apr-10 088062-004 Chrysene 0.769 U ug/LWW006 2069F-4 21-Apr-10 088062-004 Cresol, m,p- 11.5 U ug/LWW006 2069F-4 21-Apr-10 088062-004 Cresol, o- 7.69 U ug/LWW006 2069F-4 21-Apr-10 088062-004 Di-n-butyl phthalate 7.69 U ug/LWW006 2069F-4 21-Apr-10 088062-004 Di-n-octyl phthalate 11.5 U ug/LWW006 2069F-4 21-Apr-10 088062-004 Dibenz[a,h]anthracene 0.769 U ug/LWW006 2069F-4 21-Apr-10 088062-004 Dibenzofuran 7.69 U ug/LWW006 2069F-4 21-Apr-10 088062-004 Dichlorobenzene, 1,2- 7.69 U ug/LWW006 2069F-4 21-Apr-10 088062-004 Dichlorobenzene, 1,3- 7.69 U ug/LWW006 2069F-4 21-Apr-10 088062-004 Dichlorobenzene, 1,4- 7.69 U ug/LWW006 2069F-4 21-Apr-10 088062-004 Dichlorobenzidine, 3,3'- 7.69 U ug/LWW006 2069F-4 21-Apr-10 088062-004 Dichlorophenol, 2,4- 7.69 U ug/LWW006 2069F-4 21-Apr-10 088062-004 Diethylphthalate 7.69 U ug/LWW006 2069F-4 21-Apr-10 088062-004 Dimethylphenol, 2,4- 7.69 U ug/LWW006 2069F-4 21-Apr-10 088062-004 Dimethylphthalate 7.69 U ug/LWW006 2069F-4 21-Apr-10 088062-004 Dinitro-o-cresol 11.5 U ug/LWW006 2069F-4 21-Apr-10 088062-004 Dinitrophenol, 2,4- 19.2 U ug/LWW006 2069F-4 21-Apr-10 088062-004 Dinitrotoluene, 2,4- 7.69 U ug/L

Station Permit Number Date Collected Sample ID Analyte Result MDL Lab Data Qualifier Units
TABLE A-3. Summary of Sanitary Outfalls of Semi-Volitile Organic Compounds, April 2010
WW006 2069F-4 21-Apr-10 088062-004 Dinitrotoluene, 2,6- 7.69 U ug/LWW006 2069F-4 21-Apr-10 088062-004 Diphenyl amine 11.5 U ug/LWW006 2069F-4 21-Apr-10 088062-004 Ethylhexyl)phthalate, bis(2- 12.5 7.69 J ug/LWW006 2069F-4 21-Apr-10 088062-004 Fluoranthene 0.769 U ug/LWW006 2069F-4 21-Apr-10 088062-004 Fluorene 0.769 U ug/LWW006 2069F-4 21-Apr-10 088062-004 Hexachlorobenzene 7.69 U ug/LWW006 2069F-4 21-Apr-10 088062-004 Hexachlorobutadiene 7.69 U ug/LWW006 2069F-4 21-Apr-10 088062-004 Hexachlorocyclopentadiene 11.5 U ug/LWW006 2069F-4 21-Apr-10 088062-004 Hexachloroethane 7.69 U ug/LWW006 2069F-4 21-Apr-10 088062-004 Indeno(1,2,3-c,d)pyrene 0.769 U ug/LWW006 2069F-4 21-Apr-10 088062-004 Isophorone 11.5 U ug/LWW006 2069F-4 21-Apr-10 088062-004 Methylnaphthalene, 2- 1.15 U ug/LWW006 2069F-4 21-Apr-10 088062-004 Naphthalene 1.15 U ug/LWW006 2069F-4 21-Apr-10 088062-004 Nitro-benzene 11.5 U ug/LWW006 2069F-4 21-Apr-10 088062-004 Nitroaniline, 2- 7.69 U ug/LWW006 2069F-4 21-Apr-10 088062-004 Nitroaniline, 3- 7.69 U ug/LWW006 2069F-4 21-Apr-10 088062-004 Nitroaniline, 4- 11.5 U ug/LWW006 2069F-4 21-Apr-10 088062-004 Nitrophenol, 2- 7.69 U ug/LWW006 2069F-4 21-Apr-10 088062-004 Nitrophenol, 4- 7.69 U ug/LWW006 2069F-4 21-Apr-10 088062-004 Nitrosodipropylamine, n- 7.69 U ug/LWW006 2069F-4 21-Apr-10 088062-004 Pentachlorophenol 7.69 U ug/LWW006 2069F-4 21-Apr-10 088062-004 Phenanthrene 0.769 U ug/LWW006 2069F-4 21-Apr-10 088062-004 Phenol 3.85 U ug/LWW006 2069F-4 21-Apr-10 088062-004 Pyrene 1.15 U ug/LWW006 2069F-4 21-Apr-10 088062-004 Trichlorobenzene, 1,2,4- 7.69 U ug/LWW006 2069F-4 21-Apr-10 088062-004 Trichlorophenol, 2,4,5- 7.69 U ug/LWW006 2069F-4 21-Apr-10 088062-004 Trichlorophenol, 2,4,6- 7.69 U ug/LWW007 2069G-2 21-Apr-10 088063-004 Acenaphthene 0.298 U ug/LWW007 2069G-2 21-Apr-10 088063-004 Acenaphthylene 0.192 U ug/LWW007 2069G-2 21-Apr-10 088063-004 Anthracene 0.192 U ug/LWW007 2069G-2 21-Apr-10 088063-004 Benzo(a)anthracene 0.192 U ug/LWW007 2069G-2 21-Apr-10 088063-004 Benzo(a)pyrene 0.192 U ug/LWW007 2069G-2 21-Apr-10 088063-004 Benzo(b)fluoranthene 0.192 U ug/L

Station Permit Number Date Collected Sample ID Analyte Result MDL Lab Data Qualifier Units
TABLE A-3. Summary of Sanitary Outfalls of Semi-Volitile Organic Compounds, April 2010
WW007 2069G-2 21-Apr-10 088063-004 Benzo(ghi)perylene 0.192 U ug/LWW007 2069G-2 21-Apr-10 088063-004 Benzo(k)fluoranthene 0.192 U ug/LWW007 2069G-2 21-Apr-10 088063-004 Bromophenyl phenyl ether, 4- 1.92 U ug/LWW007 2069G-2 21-Apr-10 088063-004 Butylbenzyl phthalate 1.92 U ug/LWW007 2069G-2 21-Apr-10 088063-004 Carbazole 0.192 U ug/LWW007 2069G-2 21-Apr-10 088063-004 Chloro-3-methylphenol, 4- 1.92 U ug/LWW007 2069G-2 21-Apr-10 088063-004 Chlorobenzenamine, 4- 1.92 U ug/LWW007 2069G-2 21-Apr-10 088063-004 Chloroethoxy)methane, bis(2- 2.88 U ug/LWW007 2069G-2 21-Apr-10 088063-004 Chloroethyl)ether, bis(2- 1.92 U ug/LWW007 2069G-2 21-Apr-10 088063-004 Chloroisopropyl ether, bis- 1.92 U ug/LWW007 2069G-2 21-Apr-10 088063-004 Chloronaphthalene, 2- 0.288 U ug/LWW007 2069G-2 21-Apr-10 088063-004 Chlorophenol, 2- 1.92 U ug/LWW007 2069G-2 21-Apr-10 088063-004 Chlorophenyl phenyl ether, 4- 1.92 U ug/LWW007 2069G-2 21-Apr-10 088063-004 Chrysene 0.192 U ug/LWW007 2069G-2 21-Apr-10 088063-004 Cresol, m,p- 2.88 U ug/LWW007 2069G-2 21-Apr-10 088063-004 Cresol, o- 1.92 U ug/LWW007 2069G-2 21-Apr-10 088063-004 Di-n-butyl phthalate 1.92 U ug/LWW007 2069G-2 21-Apr-10 088063-004 Di-n-octyl phthalate 2.88 U ug/LWW007 2069G-2 21-Apr-10 088063-004 Dibenz[a,h]anthracene 0.192 U ug/LWW007 2069G-2 21-Apr-10 088063-004 Dibenzofuran 1.92 U ug/LWW007 2069G-2 21-Apr-10 088063-004 Dichlorobenzene, 1,2- 1.92 U ug/LWW007 2069G-2 21-Apr-10 088063-004 Dichlorobenzene, 1,3- 1.92 U ug/LWW007 2069G-2 21-Apr-10 088063-004 Dichlorobenzene, 1,4- 1.92 U ug/LWW007 2069G-2 21-Apr-10 088063-004 Dichlorobenzidine, 3,3'- 1.92 U ug/LWW007 2069G-2 21-Apr-10 088063-004 Dichlorophenol, 2,4- 1.92 U ug/LWW007 2069G-2 21-Apr-10 088063-004 Diethylphthalate 1.92 U ug/LWW007 2069G-2 21-Apr-10 088063-004 Dimethylphenol, 2,4- 1.92 U ug/LWW007 2069G-2 21-Apr-10 088063-004 Dimethylphthalate 1.92 U ug/LWW007 2069G-2 21-Apr-10 088063-004 Dinitro-o-cresol 2.88 U ug/LWW007 2069G-2 21-Apr-10 088063-004 Dinitrophenol, 2,4- 4.81 U ug/LWW007 2069G-2 21-Apr-10 088063-004 Dinitrotoluene, 2,4- 1.92 U ug/LWW007 2069G-2 21-Apr-10 088063-004 Dinitrotoluene, 2,6- 1.92 U ug/LWW007 2069G-2 21-Apr-10 088063-004 Diphenyl amine 2.88 U ug/L
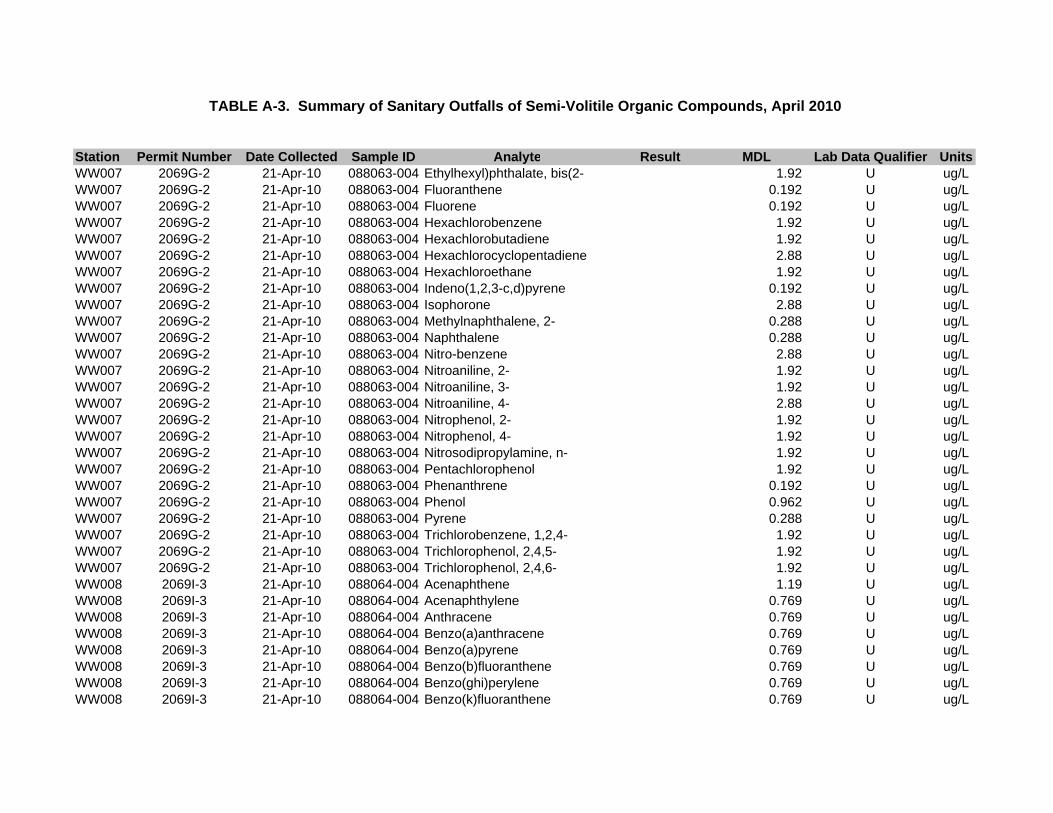
Station Permit Number Date Collected Sample ID Analyte Result MDL Lab Data Qualifier Units
TABLE A-3. Summary of Sanitary Outfalls of Semi-Volitile Organic Compounds, April 2010
WW007 2069G-2 21-Apr-10 088063-004 Ethylhexyl)phthalate, bis(2- 1.92 U ug/LWW007 2069G-2 21-Apr-10 088063-004 Fluoranthene 0.192 U ug/LWW007 2069G-2 21-Apr-10 088063-004 Fluorene 0.192 U ug/LWW007 2069G-2 21-Apr-10 088063-004 Hexachlorobenzene 1.92 U ug/LWW007 2069G-2 21-Apr-10 088063-004 Hexachlorobutadiene 1.92 U ug/LWW007 2069G-2 21-Apr-10 088063-004 Hexachlorocyclopentadiene 2.88 U ug/LWW007 2069G-2 21-Apr-10 088063-004 Hexachloroethane 1.92 U ug/LWW007 2069G-2 21-Apr-10 088063-004 Indeno(1,2,3-c,d)pyrene 0.192 U ug/LWW007 2069G-2 21-Apr-10 088063-004 Isophorone 2.88 U ug/LWW007 2069G-2 21-Apr-10 088063-004 Methylnaphthalene, 2- 0.288 U ug/LWW007 2069G-2 21-Apr-10 088063-004 Naphthalene 0.288 U ug/LWW007 2069G-2 21-Apr-10 088063-004 Nitro-benzene 2.88 U ug/LWW007 2069G-2 21-Apr-10 088063-004 Nitroaniline, 2- 1.92 U ug/LWW007 2069G-2 21-Apr-10 088063-004 Nitroaniline, 3- 1.92 U ug/LWW007 2069G-2 21-Apr-10 088063-004 Nitroaniline, 4- 2.88 U ug/LWW007 2069G-2 21-Apr-10 088063-004 Nitrophenol, 2- 1.92 U ug/LWW007 2069G-2 21-Apr-10 088063-004 Nitrophenol, 4- 1.92 U ug/LWW007 2069G-2 21-Apr-10 088063-004 Nitrosodipropylamine, n- 1.92 U ug/LWW007 2069G-2 21-Apr-10 088063-004 Pentachlorophenol 1.92 U ug/LWW007 2069G-2 21-Apr-10 088063-004 Phenanthrene 0.192 U ug/LWW007 2069G-2 21-Apr-10 088063-004 Phenol 0.962 U ug/LWW007 2069G-2 21-Apr-10 088063-004 Pyrene 0.288 U ug/LWW007 2069G-2 21-Apr-10 088063-004 Trichlorobenzene, 1,2,4- 1.92 U ug/LWW007 2069G-2 21-Apr-10 088063-004 Trichlorophenol, 2,4,5- 1.92 U ug/LWW007 2069G-2 21-Apr-10 088063-004 Trichlorophenol, 2,4,6- 1.92 U ug/LWW008 2069I-3 21-Apr-10 088064-004 Acenaphthene 1.19 U ug/LWW008 2069I-3 21-Apr-10 088064-004 Acenaphthylene 0.769 U ug/LWW008 2069I-3 21-Apr-10 088064-004 Anthracene 0.769 U ug/LWW008 2069I-3 21-Apr-10 088064-004 Benzo(a)anthracene 0.769 U ug/LWW008 2069I-3 21-Apr-10 088064-004 Benzo(a)pyrene 0.769 U ug/LWW008 2069I-3 21-Apr-10 088064-004 Benzo(b)fluoranthene 0.769 U ug/LWW008 2069I-3 21-Apr-10 088064-004 Benzo(ghi)perylene 0.769 U ug/LWW008 2069I-3 21-Apr-10 088064-004 Benzo(k)fluoranthene 0.769 U ug/L

Station Permit Number Date Collected Sample ID Analyte Result MDL Lab Data Qualifier Units
TABLE A-3. Summary of Sanitary Outfalls of Semi-Volitile Organic Compounds, April 2010
WW008 2069I-3 21-Apr-10 088064-004 Bromophenyl phenyl ether, 4- 7.69 U ug/LWW008 2069I-3 21-Apr-10 088064-004 Butylbenzyl phthalate 7.69 U ug/LWW008 2069I-3 21-Apr-10 088064-004 Carbazole 0.769 U ug/LWW008 2069I-3 21-Apr-10 088064-004 Chloro-3-methylphenol, 4- 7.69 U ug/LWW008 2069I-3 21-Apr-10 088064-004 Chlorobenzenamine, 4- 7.69 U ug/LWW008 2069I-3 21-Apr-10 088064-004 Chloroethoxy)methane, bis(2- 11.5 U ug/LWW008 2069I-3 21-Apr-10 088064-004 Chloroethyl)ether, bis(2- 7.69 U ug/LWW008 2069I-3 21-Apr-10 088064-004 Chloroisopropyl ether, bis- 7.69 U ug/LWW008 2069I-3 21-Apr-10 088064-004 Chloronaphthalene, 2- 1.15 U ug/LWW008 2069I-3 21-Apr-10 088064-004 Chlorophenol, 2- 7.69 U ug/LWW008 2069I-3 21-Apr-10 088064-004 Chlorophenyl phenyl ether, 4- 7.69 U ug/LWW008 2069I-3 21-Apr-10 088064-004 Chrysene 0.769 U ug/LWW008 2069I-3 21-Apr-10 088064-004 Cresol, m,p- 11.5 U ug/LWW008 2069I-3 21-Apr-10 088064-004 Cresol, o- 7.69 U ug/LWW008 2069I-3 21-Apr-10 088064-004 Di-n-butyl phthalate 7.69 U ug/LWW008 2069I-3 21-Apr-10 088064-004 Di-n-octyl phthalate 11.5 U ug/LWW008 2069I-3 21-Apr-10 088064-004 Dibenz[a,h]anthracene 0.769 U ug/LWW008 2069I-3 21-Apr-10 088064-004 Dibenzofuran 7.69 U ug/LWW008 2069I-3 21-Apr-10 088064-004 Dichlorobenzene, 1,2- 7.69 U ug/LWW008 2069I-3 21-Apr-10 088064-004 Dichlorobenzene, 1,3- 7.69 U ug/LWW008 2069I-3 21-Apr-10 088064-004 Dichlorobenzene, 1,4- 7.69 U ug/LWW008 2069I-3 21-Apr-10 088064-004 Dichlorobenzidine, 3,3'- 7.69 U ug/LWW008 2069I-3 21-Apr-10 088064-004 Dichlorophenol, 2,4- 7.69 U ug/LWW008 2069I-3 21-Apr-10 088064-004 Diethylphthalate 7.69 U ug/LWW008 2069I-3 21-Apr-10 088064-004 Dimethylphenol, 2,4- 7.69 U ug/LWW008 2069I-3 21-Apr-10 088064-004 Dimethylphthalate 7.69 U ug/LWW008 2069I-3 21-Apr-10 088064-004 Dinitro-o-cresol 11.5 U ug/LWW008 2069I-3 21-Apr-10 088064-004 Dinitrophenol, 2,4- 19.2 U ug/LWW008 2069I-3 21-Apr-10 088064-004 Dinitrotoluene, 2,4- 7.69 U ug/LWW008 2069I-3 21-Apr-10 088064-004 Dinitrotoluene, 2,6- 7.69 U ug/LWW008 2069I-3 21-Apr-10 088064-004 Diphenyl amine 11.5 U ug/LWW008 2069I-3 21-Apr-10 088064-004 Ethylhexyl)phthalate, bis(2- 7.69 U ug/LWW008 2069I-3 21-Apr-10 088064-004 Fluoranthene 0.769 U ug/L

Station Permit Number Date Collected Sample ID Analyte Result MDL Lab Data Qualifier Units
TABLE A-3. Summary of Sanitary Outfalls of Semi-Volitile Organic Compounds, April 2010
WW008 2069I-3 21-Apr-10 088064-004 Fluorene 0.769 U ug/LWW008 2069I-3 21-Apr-10 088064-004 Hexachlorobenzene 7.69 U ug/LWW008 2069I-3 21-Apr-10 088064-004 Hexachlorobutadiene 7.69 U ug/LWW008 2069I-3 21-Apr-10 088064-004 Hexachlorocyclopentadiene 11.5 U ug/LWW008 2069I-3 21-Apr-10 088064-004 Hexachloroethane 7.69 U ug/LWW008 2069I-3 21-Apr-10 088064-004 Indeno(1,2,3-c,d)pyrene 0.769 U ug/LWW008 2069I-3 21-Apr-10 088064-004 Isophorone 11.5 U ug/LWW008 2069I-3 21-Apr-10 088064-004 Methylnaphthalene, 2- 1.15 U ug/LWW008 2069I-3 21-Apr-10 088064-004 Naphthalene 1.15 U ug/LWW008 2069I-3 21-Apr-10 088064-004 Nitro-benzene 11.5 U ug/LWW008 2069I-3 21-Apr-10 088064-004 Nitroaniline, 2- 7.69 U ug/LWW008 2069I-3 21-Apr-10 088064-004 Nitroaniline, 3- 7.69 U ug/LWW008 2069I-3 21-Apr-10 088064-004 Nitroaniline, 4- 11.5 U ug/LWW008 2069I-3 21-Apr-10 088064-004 Nitrophenol, 2- 7.69 U ug/LWW008 2069I-3 21-Apr-10 088064-004 Nitrophenol, 4- 7.69 U ug/LWW008 2069I-3 21-Apr-10 088064-004 Nitrosodipropylamine, n- 7.69 U ug/LWW008 2069I-3 21-Apr-10 088064-004 Pentachlorophenol 7.69 U ug/LWW008 2069I-3 21-Apr-10 088064-004 Phenanthrene 0.769 U ug/LWW008 2069I-3 21-Apr-10 088064-004 Phenol 3.85 U ug/LWW008 2069I-3 21-Apr-10 088064-004 Pyrene 1.15 U ug/LWW008 2069I-3 21-Apr-10 088064-004 Trichlorobenzene, 1,2,4- 7.69 U ug/LWW008 2069I-3 21-Apr-10 088064-004 Trichlorophenol, 2,4,5- 7.69 U ug/LWW008 2069I-3 21-Apr-10 088064-004 Trichlorophenol, 2,4,6- 7.69 U ug/LWW011 2069-K 21-Apr-10 088065-004 Acenaphthene 1.18 U ug/LWW011 2069-K 21-Apr-10 088065-004 Acenaphthylene 0.762 U ug/LWW011 2069-K 21-Apr-10 088065-004 Anthracene 0.762 U ug/LWW011 2069-K 21-Apr-10 088065-004 Benzo(a)anthracene 0.762 U ug/LWW011 2069-K 21-Apr-10 088065-004 Benzo(a)pyrene 0.762 U ug/LWW011 2069-K 21-Apr-10 088065-004 Benzo(b)fluoranthene 0.762 U ug/LWW011 2069-K 21-Apr-10 088065-004 Benzo(ghi)perylene 0.762 U ug/LWW011 2069-K 21-Apr-10 088065-004 Benzo(k)fluoranthene 0.762 U ug/LWW011 2069-K 21-Apr-10 088065-004 Bromophenyl phenyl ether, 4- 7.62 U ug/LWW011 2069-K 21-Apr-10 088065-004 Butylbenzyl phthalate 7.62 U ug/L

Station Permit Number Date Collected Sample ID Analyte Result MDL Lab Data Qualifier Units
TABLE A-3. Summary of Sanitary Outfalls of Semi-Volitile Organic Compounds, April 2010
WW011 2069-K 21-Apr-10 088065-004 Carbazole 0.762 U ug/LWW011 2069-K 21-Apr-10 088065-004 Chloro-3-methylphenol, 4- 7.62 U ug/LWW011 2069-K 21-Apr-10 088065-004 Chlorobenzenamine, 4- 7.62 U ug/LWW011 2069-K 21-Apr-10 088065-004 Chloroethoxy)methane, bis(2- 11.4 U ug/LWW011 2069-K 21-Apr-10 088065-004 Chloroethyl)ether, bis(2- 7.62 U ug/LWW011 2069-K 21-Apr-10 088065-004 Chloroisopropyl ether, bis- 7.62 U ug/LWW011 2069-K 21-Apr-10 088065-004 Chloronaphthalene, 2- 1.14 U ug/LWW011 2069-K 21-Apr-10 088065-004 Chlorophenol, 2- 7.62 U ug/LWW011 2069-K 21-Apr-10 088065-004 Chlorophenyl phenyl ether, 4- 7.62 U ug/LWW011 2069-K 21-Apr-10 088065-004 Chrysene 0.762 U ug/LWW011 2069-K 21-Apr-10 088065-004 Cresol, m,p- 11.4 U ug/LWW011 2069-K 21-Apr-10 088065-004 Cresol, o- 7.62 U ug/LWW011 2069-K 21-Apr-10 088065-004 Di-n-butyl phthalate 7.62 U ug/LWW011 2069-K 21-Apr-10 088065-004 Di-n-octyl phthalate 11.4 U ug/LWW011 2069-K 21-Apr-10 088065-004 Dibenz[a,h]anthracene 0.762 U ug/LWW011 2069-K 21-Apr-10 088065-004 Dibenzofuran 7.62 U ug/LWW011 2069-K 21-Apr-10 088065-004 Dichlorobenzene, 1,2- 7.62 U ug/LWW011 2069-K 21-Apr-10 088065-004 Dichlorobenzene, 1,3- 7.62 U ug/LWW011 2069-K 21-Apr-10 088065-004 Dichlorobenzene, 1,4- 7.62 U ug/LWW011 2069-K 21-Apr-10 088065-004 Dichlorobenzidine, 3,3'- 7.62 U ug/LWW011 2069-K 21-Apr-10 088065-004 Dichlorophenol, 2,4- 7.62 U ug/LWW011 2069-K 21-Apr-10 088065-004 Diethylphthalate 7.62 U ug/LWW011 2069-K 21-Apr-10 088065-004 Dimethylphenol, 2,4- 7.62 U ug/LWW011 2069-K 21-Apr-10 088065-004 Dimethylphthalate 7.62 U ug/LWW011 2069-K 21-Apr-10 088065-004 Dinitro-o-cresol 11.4 U ug/LWW011 2069-K 21-Apr-10 088065-004 Dinitrophenol, 2,4- 19 U ug/LWW011 2069-K 21-Apr-10 088065-004 Dinitrotoluene, 2,4- 7.62 U ug/LWW011 2069-K 21-Apr-10 088065-004 Dinitrotoluene, 2,6- 7.62 U ug/LWW011 2069-K 21-Apr-10 088065-004 Diphenyl amine 11.4 U ug/LWW011 2069-K 21-Apr-10 088065-004 Ethylhexyl)phthalate, bis(2- 7.62 U ug/LWW011 2069-K 21-Apr-10 088065-004 Fluoranthene 0.762 U ug/LWW011 2069-K 21-Apr-10 088065-004 Fluorene 0.762 U ug/LWW011 2069-K 21-Apr-10 088065-004 Hexachlorobenzene 7.62 U ug/L

Station Permit Number Date Collected Sample ID Analyte Result MDL Lab Data Qualifier Units
TABLE A-3. Summary of Sanitary Outfalls of Semi-Volitile Organic Compounds, April 2010
WW011 2069-K 21-Apr-10 088065-004 Hexachlorobutadiene 7.62 U ug/LWW011 2069-K 21-Apr-10 088065-004 Hexachlorocyclopentadiene 11.4 U ug/LWW011 2069-K 21-Apr-10 088065-004 Hexachloroethane 7.62 U ug/LWW011 2069-K 21-Apr-10 088065-004 Indeno(1,2,3-c,d)pyrene 0.762 U ug/LWW011 2069-K 21-Apr-10 088065-004 Isophorone 11.4 U ug/LWW011 2069-K 21-Apr-10 088065-004 Methylnaphthalene, 2- 1.14 U ug/LWW011 2069-K 21-Apr-10 088065-004 Naphthalene 1.14 U ug/LWW011 2069-K 21-Apr-10 088065-004 Nitro-benzene 11.4 U ug/LWW011 2069-K 21-Apr-10 088065-004 Nitroaniline, 2- 7.62 U ug/LWW011 2069-K 21-Apr-10 088065-004 Nitroaniline, 3- 7.62 U ug/LWW011 2069-K 21-Apr-10 088065-004 Nitroaniline, 4- 11.4 U ug/LWW011 2069-K 21-Apr-10 088065-004 Nitrophenol, 2- 7.62 U ug/LWW011 2069-K 21-Apr-10 088065-004 Nitrophenol, 4- 7.62 U ug/LWW011 2069-K 21-Apr-10 088065-004 Nitrosodipropylamine, n- 7.62 U ug/LWW011 2069-K 21-Apr-10 088065-004 Pentachlorophenol 7.62 U ug/LWW011 2069-K 21-Apr-10 088065-004 Phenanthrene 0.762 U ug/LWW011 2069-K 21-Apr-10 088065-004 Phenol 3.81 U ug/LWW011 2069-K 21-Apr-10 088065-004 Pyrene 1.14 U ug/LWW011 2069-K 21-Apr-10 088065-004 Trichlorobenzene, 1,2,4- 7.62 U ug/LWW011 2069-K 21-Apr-10 088065-004 Trichlorophenol, 2,4,5- 7.62 U ug/LWW011 2069-K 21-Apr-10 088065-004 Trichlorophenol, 2,4,6- 7.62 U ug/L
NOTES:MDL = Minimum detection limit.J = Estimated value, the analyte concentration fell above the effective MDL and below the effective (PQL) practical quantitation limit.ug/L = micrograms per liter.U = The analyte was analyzed for, but not detected. For organic and inorganic analytes the result is less than the effective MDL concentration.
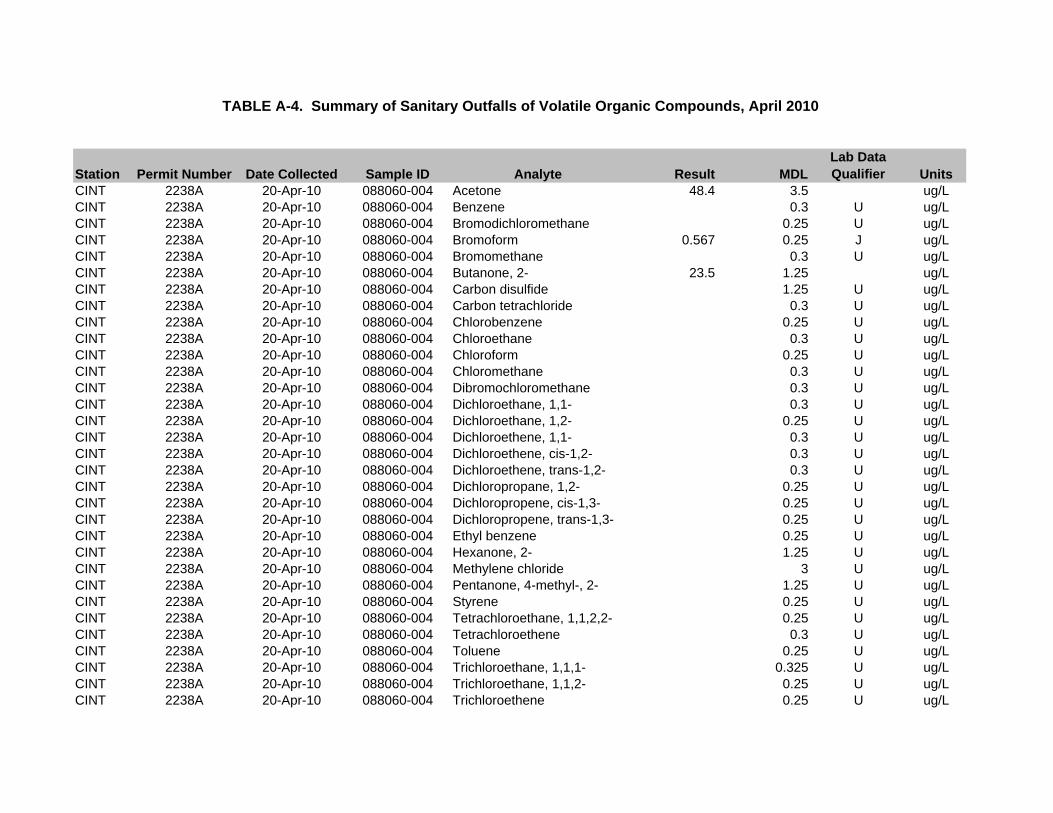
Station Permit Number Date Collected Sample ID Analyte Result MDLLab Data Qualifier Units
CINT 2238A 20-Apr-10 088060-004 Acetone 48.4 3.5 ug/LCINT 2238A 20-Apr-10 088060-004 Benzene 0.3 U ug/LCINT 2238A 20-Apr-10 088060-004 Bromodichloromethane 0.25 U ug/LCINT 2238A 20-Apr-10 088060-004 Bromoform 0.567 0.25 J ug/LCINT 2238A 20-Apr-10 088060-004 Bromomethane 0.3 U ug/LCINT 2238A 20-Apr-10 088060-004 Butanone, 2- 23.5 1.25 ug/LCINT 2238A 20-Apr-10 088060-004 Carbon disulfide 1.25 U ug/LCINT 2238A 20-Apr-10 088060-004 Carbon tetrachloride 0.3 U ug/LCINT 2238A 20-Apr-10 088060-004 Chlorobenzene 0.25 U ug/LCINT 2238A 20-Apr-10 088060-004 Chloroethane 0.3 U ug/LCINT 2238A 20-Apr-10 088060-004 Chloroform 0.25 U ug/LCINT 2238A 20-Apr-10 088060-004 Chloromethane 0.3 U ug/LCINT 2238A 20-Apr-10 088060-004 Dibromochloromethane 0.3 U ug/LCINT 2238A 20-Apr-10 088060-004 Dichloroethane, 1,1- 0.3 U ug/LCINT 2238A 20-Apr-10 088060-004 Dichloroethane, 1,2- 0.25 U ug/LCINT 2238A 20-Apr-10 088060-004 Dichloroethene, 1,1- 0.3 U ug/LCINT 2238A 20-Apr-10 088060-004 Dichloroethene, cis-1,2- 0.3 U ug/LCINT 2238A 20-Apr-10 088060-004 Dichloroethene, trans-1,2- 0.3 U ug/LCINT 2238A 20-Apr-10 088060-004 Dichloropropane, 1,2- 0.25 U ug/LCINT 2238A 20-Apr-10 088060-004 Dichloropropene, cis-1,3- 0.25 U ug/LCINT 2238A 20-Apr-10 088060-004 Dichloropropene, trans-1,3- 0.25 U ug/LCINT 2238A 20-Apr-10 088060-004 Ethyl benzene 0.25 U ug/LCINT 2238A 20-Apr-10 088060-004 Hexanone, 2- 1.25 U ug/LCINT 2238A 20-Apr-10 088060-004 Methylene chloride 3 U ug/LCINT 2238A 20-Apr-10 088060-004 Pentanone, 4-methyl-, 2- 1.25 U ug/LCINT 2238A 20-Apr-10 088060-004 Styrene 0.25 U ug/LCINT 2238A 20-Apr-10 088060-004 Tetrachloroethane, 1,1,2,2- 0.25 U ug/LCINT 2238A 20-Apr-10 088060-004 Tetrachloroethene 0.3 U ug/LCINT 2238A 20-Apr-10 088060-004 Toluene 0.25 U ug/LCINT 2238A 20-Apr-10 088060-004 Trichloroethane, 1,1,1- 0.325 U ug/LCINT 2238A 20-Apr-10 088060-004 Trichloroethane, 1,1,2- 0.25 U ug/LCINT 2238A 20-Apr-10 088060-004 Trichloroethene 0.25 U ug/L
TABLE A-4. Summary of Sanitary Outfalls of Volatile Organic Compounds, April 2010

Station Permit Number Date Collected Sample ID Analyte Result MDLLab Data Qualifier Units
TABLE A-4. Summary of Sanitary Outfalls of Volatile Organic Compounds, April 2010
CINT 2238A 20-Apr-10 088060-004 Vinyl acetate 1.5 U ug/LCINT 2238A 20-Apr-10 088060-004 Vinyl chloride 0.5 U ug/LCINT 2238A 20-Apr-10 088060-004 Xylene 0.3 U ug/LWW001 2069-A 20-Apr-10 088054-006 Acetone 27.3 3.5 ug/LWW001 2069-A 20-Apr-10 088054-006 Benzene 0.3 U ug/LWW001 2069-A 20-Apr-10 088054-006 Bromodichloromethane 0.25 U ug/LWW001 2069-A 20-Apr-10 088054-006 Bromoform 1.2 0.25 ug/LWW001 2069-A 20-Apr-10 088054-006 Bromomethane 0.3 U ug/LWW001 2069-A 20-Apr-10 088054-006 Butanone, 2- 1.55 1.25 J ug/LWW001 2069-A 20-Apr-10 088054-006 Carbon disulfide 1.25 U ug/LWW001 2069-A 20-Apr-10 088054-006 Carbon tetrachloride 0.3 U ug/LWW001 2069-A 20-Apr-10 088054-006 Chlorobenzene 0.25 U ug/LWW001 2069-A 20-Apr-10 088054-006 Chloroethane 0.3 U ug/LWW001 2069-A 20-Apr-10 088054-006 Chloroform 0.25 U ug/LWW001 2069-A 20-Apr-10 088054-006 Chloromethane 0.3 U ug/LWW001 2069-A 20-Apr-10 088054-006 Dibromochloromethane 0.346 0.3 J ug/LWW001 2069-A 20-Apr-10 088054-006 Dichloroethane, 1,1- 0.3 U ug/LWW001 2069-A 20-Apr-10 088054-006 Dichloroethane, 1,2- 0.25 U ug/LWW001 2069-A 20-Apr-10 088054-006 Dichloroethene, 1,1- 0.3 U ug/LWW001 2069-A 20-Apr-10 088054-006 Dichloroethene, cis-1,2- 0.3 U ug/LWW001 2069-A 20-Apr-10 088054-006 Dichloroethene, trans-1,2- 0.3 U ug/LWW001 2069-A 20-Apr-10 088054-006 Dichloropropane, 1,2- 0.25 U ug/LWW001 2069-A 20-Apr-10 088054-006 Dichloropropene, cis-1,3- 0.25 U ug/LWW001 2069-A 20-Apr-10 088054-006 Dichloropropene, trans-1,3- 0.25 U ug/LWW001 2069-A 20-Apr-10 088054-006 Ethyl benzene 0.25 U ug/LWW001 2069-A 20-Apr-10 088054-006 Hexanone, 2- 1.25 U ug/LWW001 2069-A 20-Apr-10 088054-006 Methylene chloride 3 U ug/LWW001 2069-A 20-Apr-10 088054-006 Pentanone, 4-methyl-, 2- 1.25 U ug/LWW001 2069-A 20-Apr-10 088054-006 Styrene 0.25 U ug/LWW001 2069-A 20-Apr-10 088054-006 Tetrachloroethane, 1,1,2,2- 0.25 U ug/LWW001 2069-A 20-Apr-10 088054-006 Tetrachloroethene 0.3 U ug/LWW001 2069-A 20-Apr-10 088054-006 Toluene 0.25 U ug/L

Station Permit Number Date Collected Sample ID Analyte Result MDLLab Data Qualifier Units
TABLE A-4. Summary of Sanitary Outfalls of Volatile Organic Compounds, April 2010
WW001 2069-A 20-Apr-10 088054-006 Trichloroethane, 1,1,1- 0.325 U ug/LWW001 2069-A 20-Apr-10 088054-006 Trichloroethane, 1,1,2- 0.25 U ug/LWW001 2069-A 20-Apr-10 088054-006 Trichloroethene 0.25 U ug/LWW001 2069-A 20-Apr-10 088054-006 Vinyl acetate 1.5 U ug/LWW001 2069-A 20-Apr-10 088054-006 Vinyl chloride 0.5 U ug/LWW001 2069-A 20-Apr-10 088054-006 Xylene 0.3 U ug/LWW006 2069F-4 20-Apr-10 088055-006 Acetone 76.4 3.5 ug/LWW006 2069F-4 20-Apr-10 088055-006 Benzene 0.3 U ug/LWW006 2069F-4 20-Apr-10 088055-006 Bromodichloromethane 0.25 U ug/LWW006 2069F-4 20-Apr-10 088055-006 Bromoform 0.25 U ug/LWW006 2069F-4 20-Apr-10 088055-006 Bromomethane 0.3 U ug/LWW006 2069F-4 20-Apr-10 088055-006 Butanone, 2- 2.38 1.25 J ug/LWW006 2069F-4 20-Apr-10 088055-006 Carbon disulfide 1.25 U ug/LWW006 2069F-4 20-Apr-10 088055-006 Carbon tetrachloride 0.3 U ug/LWW006 2069F-4 20-Apr-10 088055-006 Chlorobenzene 0.25 U ug/LWW006 2069F-4 20-Apr-10 088055-006 Chloroethane 0.3 U ug/LWW006 2069F-4 20-Apr-10 088055-006 Chloroform 0.25 U ug/LWW006 2069F-4 20-Apr-10 088055-006 Chloromethane 0.3 U ug/LWW006 2069F-4 20-Apr-10 088055-006 Dibromochloromethane 0.3 U ug/LWW006 2069F-4 20-Apr-10 088055-006 Dichloroethane, 1,1- 0.3 U ug/LWW006 2069F-4 20-Apr-10 088055-006 Dichloroethane, 1,2- 0.25 U ug/LWW006 2069F-4 20-Apr-10 088055-006 Dichloroethene, 1,1- 0.3 U ug/LWW006 2069F-4 20-Apr-10 088055-006 Dichloroethene, cis-1,2- 0.3 U ug/LWW006 2069F-4 20-Apr-10 088055-006 Dichloroethene, trans-1,2- 0.3 U ug/LWW006 2069F-4 20-Apr-10 088055-006 Dichloropropane, 1,2- 0.25 U ug/LWW006 2069F-4 20-Apr-10 088055-006 Dichloropropene, cis-1,3- 0.25 U ug/LWW006 2069F-4 20-Apr-10 088055-006 Dichloropropene, trans-1,3- 0.25 U ug/LWW006 2069F-4 20-Apr-10 088055-006 Ethyl benzene 0.25 U ug/LWW006 2069F-4 20-Apr-10 088055-006 Hexanone, 2- 1.25 U ug/LWW006 2069F-4 20-Apr-10 088055-006 Methylene chloride 3 U ug/LWW006 2069F-4 20-Apr-10 088055-006 Pentanone, 4-methyl-, 2- 1.25 U ug/LWW006 2069F-4 20-Apr-10 088055-006 Styrene 0.25 U ug/L

Station Permit Number Date Collected Sample ID Analyte Result MDLLab Data Qualifier Units
TABLE A-4. Summary of Sanitary Outfalls of Volatile Organic Compounds, April 2010
WW006 2069F-4 20-Apr-10 088055-006 Tetrachloroethane, 1,1,2,2- 0.25 U ug/LWW006 2069F-4 20-Apr-10 088055-006 Tetrachloroethene 0.3 U ug/LWW006 2069F-4 20-Apr-10 088055-006 Toluene 0.25 U ug/LWW006 2069F-4 20-Apr-10 088055-006 Trichloroethane, 1,1,1- 0.325 U ug/LWW006 2069F-4 20-Apr-10 088055-006 Trichloroethane, 1,1,2- 0.25 U ug/LWW006 2069F-4 20-Apr-10 088055-006 Trichloroethene 0.25 U ug/LWW006 2069F-4 20-Apr-10 088055-006 Vinyl acetate 1.5 U ug/LWW006 2069F-4 20-Apr-10 088055-006 Vinyl chloride 0.5 U ug/LWW006 2069F-4 20-Apr-10 088055-006 Xylene 0.3 U ug/LWW007 2069G-2 20-Apr-10 088056-003 Acetone 3.5 U ug/LWW007 2069G-2 20-Apr-10 088056-003 Benzene 0.3 U ug/LWW007 2069G-2 20-Apr-10 088056-003 Bromodichloromethane 0.25 U ug/LWW007 2069G-2 20-Apr-10 088056-003 Bromoform 0.25 U ug/LWW007 2069G-2 20-Apr-10 088056-003 Bromomethane 0.3 U ug/LWW007 2069G-2 20-Apr-10 088056-003 Butanone, 2- 1.25 U ug/LWW007 2069G-2 20-Apr-10 088056-003 Carbon disulfide 1.25 U ug/LWW007 2069G-2 20-Apr-10 088056-003 Carbon tetrachloride 0.3 U ug/LWW007 2069G-2 20-Apr-10 088056-003 Chlorobenzene 0.25 U ug/LWW007 2069G-2 20-Apr-10 088056-003 Chloroethane 0.3 U ug/LWW007 2069G-2 20-Apr-10 088056-003 Chloroform 0.25 U ug/LWW007 2069G-2 20-Apr-10 088056-003 Chloromethane 0.3 U ug/LWW007 2069G-2 20-Apr-10 088056-003 Dibromochloromethane 0.3 U ug/LWW007 2069G-2 20-Apr-10 088056-003 Dichloroethane, 1,1- 0.3 U ug/LWW007 2069G-2 20-Apr-10 088056-003 Dichloroethane, 1,2- 0.25 U ug/LWW007 2069G-2 20-Apr-10 088056-003 Dichloroethene, 1,1- 0.3 U ug/LWW007 2069G-2 20-Apr-10 088056-003 Dichloroethene, cis-1,2- 0.3 U ug/LWW007 2069G-2 20-Apr-10 088056-003 Dichloroethene, trans-1,2- 0.3 U ug/LWW007 2069G-2 20-Apr-10 088056-003 Dichloropropane, 1,2- 0.25 U ug/LWW007 2069G-2 20-Apr-10 088056-003 Dichloropropene, cis-1,3- 0.25 U ug/LWW007 2069G-2 20-Apr-10 088056-003 Dichloropropene, trans-1,3- 0.25 U ug/LWW007 2069G-2 20-Apr-10 088056-003 Ethyl benzene 0.25 U ug/LWW007 2069G-2 20-Apr-10 088056-003 Hexanone, 2- 1.25 U ug/L

Station Permit Number Date Collected Sample ID Analyte Result MDLLab Data Qualifier Units
TABLE A-4. Summary of Sanitary Outfalls of Volatile Organic Compounds, April 2010
WW007 2069G-2 20-Apr-10 088056-003 Methylene chloride 3 U ug/LWW007 2069G-2 20-Apr-10 088056-003 Pentanone, 4-methyl-, 2- 1.25 U ug/LWW007 2069G-2 20-Apr-10 088056-003 Styrene 0.25 U ug/LWW007 2069G-2 20-Apr-10 088056-003 Tetrachloroethane, 1,1,2,2- 0.25 U ug/LWW007 2069G-2 20-Apr-10 088056-003 Tetrachloroethene 0.3 U ug/LWW007 2069G-2 20-Apr-10 088056-003 Toluene 0.25 U ug/LWW007 2069G-2 20-Apr-10 088056-003 Trichloroethane, 1,1,1- 0.325 U ug/LWW007 2069G-2 20-Apr-10 088056-003 Trichloroethane, 1,1,2- 0.25 U ug/LWW007 2069G-2 20-Apr-10 088056-003 Trichloroethene 0.25 U ug/LWW007 2069G-2 20-Apr-10 088056-003 Vinyl acetate 1.5 U ug/LWW007 2069G-2 20-Apr-10 088056-003 Vinyl chloride 0.5 U ug/LWW007 2069G-2 20-Apr-10 088056-003 Xylene 0.3 U ug/LWW008 2069I-3 20-Apr-10 088057-006 Acetone 9.43 3.5 J ug/LWW008 2069I-3 20-Apr-10 088057-006 Benzene 0.3 U ug/LWW008 2069I-3 20-Apr-10 088057-006 Bromodichloromethane 0.25 U ug/LWW008 2069I-3 20-Apr-10 088057-006 Bromoform 0.339 0.25 J ug/LWW008 2069I-3 20-Apr-10 088057-006 Bromomethane 0.3 U ug/LWW008 2069I-3 20-Apr-10 088057-006 Butanone, 2- 2.46 1.25 J ug/LWW008 2069I-3 20-Apr-10 088057-006 Carbon disulfide 1.25 U ug/LWW008 2069I-3 20-Apr-10 088057-006 Carbon tetrachloride 0.3 U ug/LWW008 2069I-3 20-Apr-10 088057-006 Chlorobenzene 0.25 U ug/LWW008 2069I-3 20-Apr-10 088057-006 Chloroethane 0.3 U ug/LWW008 2069I-3 20-Apr-10 088057-006 Chloroform 0.25 U ug/LWW008 2069I-3 20-Apr-10 088057-006 Chloromethane 0.3 U ug/LWW008 2069I-3 20-Apr-10 088057-006 Dibromochloromethane 0.3 U ug/LWW008 2069I-3 20-Apr-10 088057-006 Dichloroethane, 1,1- 0.3 U ug/LWW008 2069I-3 20-Apr-10 088057-006 Dichloroethane, 1,2- 0.25 U ug/LWW008 2069I-3 20-Apr-10 088057-006 Dichloroethene, 1,1- 0.3 U ug/LWW008 2069I-3 20-Apr-10 088057-006 Dichloroethene, cis-1,2- 0.3 U ug/LWW008 2069I-3 20-Apr-10 088057-006 Dichloroethene, trans-1,2- 0.3 U ug/LWW008 2069I-3 20-Apr-10 088057-006 Dichloropropane, 1,2- 0.25 U ug/LWW008 2069I-3 20-Apr-10 088057-006 Dichloropropene, cis-1,3- 0.25 U ug/L

Station Permit Number Date Collected Sample ID Analyte Result MDLLab Data Qualifier Units
TABLE A-4. Summary of Sanitary Outfalls of Volatile Organic Compounds, April 2010
WW008 2069I-3 20-Apr-10 088057-006 Dichloropropene, trans-1,3- 0.25 U ug/LWW008 2069I-3 20-Apr-10 088057-006 Ethyl benzene 0.25 U ug/LWW008 2069I-3 20-Apr-10 088057-006 Hexanone, 2- 1.25 U ug/LWW008 2069I-3 20-Apr-10 088057-006 Methylene chloride 3 U ug/LWW008 2069I-3 20-Apr-10 088057-006 Pentanone, 4-methyl-, 2- 1.25 U ug/LWW008 2069I-3 20-Apr-10 088057-006 Styrene 0.25 U ug/LWW008 2069I-3 20-Apr-10 088057-006 Tetrachloroethane, 1,1,2,2- 0.25 U ug/LWW008 2069I-3 20-Apr-10 088057-006 Tetrachloroethene 0.3 U ug/LWW008 2069I-3 20-Apr-10 088057-006 Toluene 0.25 U ug/LWW008 2069I-3 20-Apr-10 088057-006 Trichloroethane, 1,1,1- 0.325 U ug/LWW008 2069I-3 20-Apr-10 088057-006 Trichloroethane, 1,1,2- 0.25 U ug/LWW008 2069I-3 20-Apr-10 088057-006 Trichloroethene 0.25 U ug/LWW008 2069I-3 20-Apr-10 088057-006 Vinyl acetate 1.5 U ug/LWW008 2069I-3 20-Apr-10 088057-006 Vinyl chloride 0.5 U ug/LWW008 2069I-3 20-Apr-10 088057-006 Xylene 0.3 U ug/LWW011 2069-K 20-Apr-10 088058-006 Acetone 47.4 3.5 ug/LWW011 2069-K 20-Apr-10 088058-006 Benzene 0.3 U ug/LWW011 2069-K 20-Apr-10 088058-006 Bromodichloromethane 0.25 U ug/LWW011 2069-K 20-Apr-10 088058-006 Bromoform 0.287 0.25 J ug/LWW011 2069-K 20-Apr-10 088058-006 Bromomethane 0.3 U ug/LWW011 2069-K 20-Apr-10 088058-006 Butanone, 2- 6.58 1.25 ug/LWW011 2069-K 20-Apr-10 088058-006 Carbon disulfide 1.25 U ug/LWW011 2069-K 20-Apr-10 088058-006 Carbon tetrachloride 0.3 U ug/LWW011 2069-K 20-Apr-10 088058-006 Chlorobenzene 0.25 U ug/LWW011 2069-K 20-Apr-10 088058-006 Chloroethane 0.3 U ug/LWW011 2069-K 20-Apr-10 088058-006 Chloroform 0.519 0.25 J ug/LWW011 2069-K 20-Apr-10 088058-006 Chloromethane 0.3 U ug/LWW011 2069-K 20-Apr-10 088058-006 Dibromochloromethane 0.3 U ug/LWW011 2069-K 20-Apr-10 088058-006 Dichloroethane, 1,1- 0.3 U ug/LWW011 2069-K 20-Apr-10 088058-006 Dichloroethane, 1,2- 0.25 U ug/LWW011 2069-K 20-Apr-10 088058-006 Dichloroethene, 1,1- 0.3 U ug/LWW011 2069-K 20-Apr-10 088058-006 Dichloroethene, cis-1,2- 0.3 U ug/L
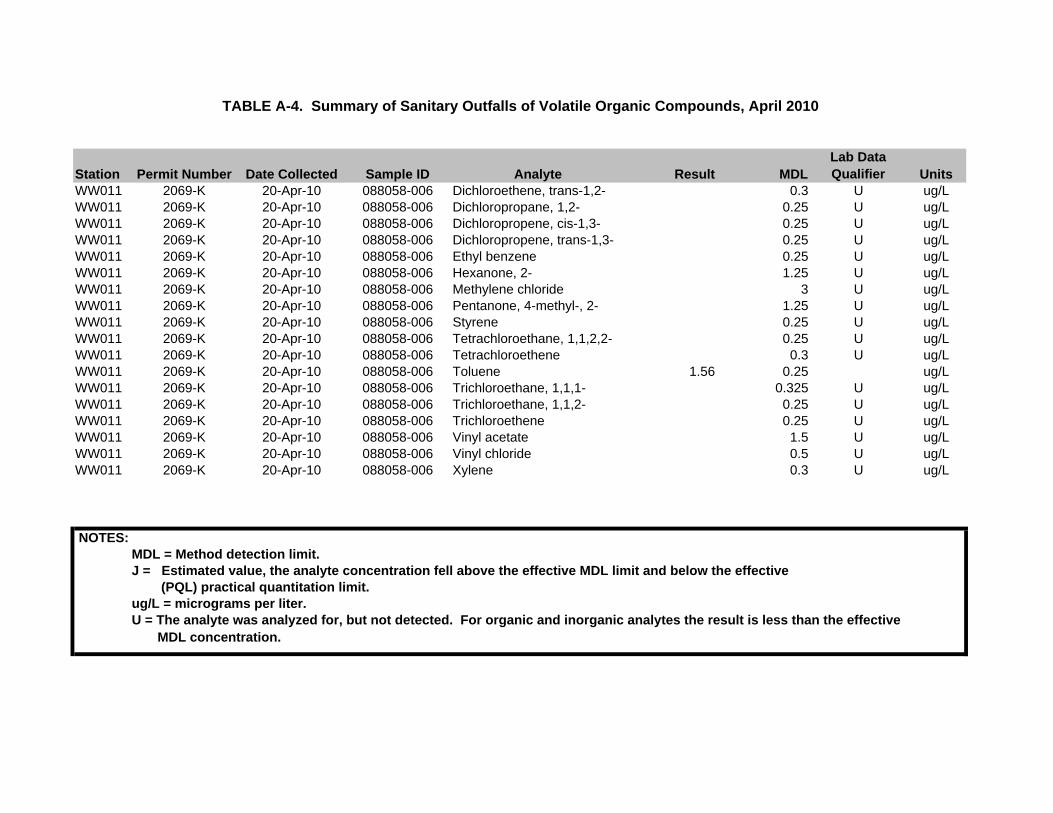
Station Permit Number Date Collected Sample ID Analyte Result MDLLab Data Qualifier Units
TABLE A-4. Summary of Sanitary Outfalls of Volatile Organic Compounds, April 2010
WW011 2069-K 20-Apr-10 088058-006 Dichloroethene, trans-1,2- 0.3 U ug/LWW011 2069-K 20-Apr-10 088058-006 Dichloropropane, 1,2- 0.25 U ug/LWW011 2069-K 20-Apr-10 088058-006 Dichloropropene, cis-1,3- 0.25 U ug/LWW011 2069-K 20-Apr-10 088058-006 Dichloropropene, trans-1,3- 0.25 U ug/LWW011 2069-K 20-Apr-10 088058-006 Ethyl benzene 0.25 U ug/LWW011 2069-K 20-Apr-10 088058-006 Hexanone, 2- 1.25 U ug/LWW011 2069-K 20-Apr-10 088058-006 Methylene chloride 3 U ug/LWW011 2069-K 20-Apr-10 088058-006 Pentanone, 4-methyl-, 2- 1.25 U ug/LWW011 2069-K 20-Apr-10 088058-006 Styrene 0.25 U ug/LWW011 2069-K 20-Apr-10 088058-006 Tetrachloroethane, 1,1,2,2- 0.25 U ug/LWW011 2069-K 20-Apr-10 088058-006 Tetrachloroethene 0.3 U ug/LWW011 2069-K 20-Apr-10 088058-006 Toluene 1.56 0.25 ug/LWW011 2069-K 20-Apr-10 088058-006 Trichloroethane, 1,1,1- 0.325 U ug/LWW011 2069-K 20-Apr-10 088058-006 Trichloroethane, 1,1,2- 0.25 U ug/LWW011 2069-K 20-Apr-10 088058-006 Trichloroethene 0.25 U ug/LWW011 2069-K 20-Apr-10 088058-006 Vinyl acetate 1.5 U ug/LWW011 2069-K 20-Apr-10 088058-006 Vinyl chloride 0.5 U ug/LWW011 2069-K 20-Apr-10 088058-006 Xylene 0.3 U ug/L
NOTES:MDL = Method detection limit.J = Estimated value, the analyte concentration fell above the effective MDL limit and below the effective (PQL) practical quantitation limit.ug/L = micrograms per liter.U = The analyte was analyzed for, but not detected. For organic and inorganic analytes the result is less than the effective MDL concentration.

Permit Number Station Analyte Result UnitsRegulatory
Limit (COA)2069-A WW001 Aluminum 0.068 mg/L 9002069-A WW001 Aluminum 0.0708 mg/L 9002069-A WW001 Aluminum 0.0971 mg/L 9002069-A WW001 Aluminum 0.114 mg/L 900
Aluminum Average 0.09Aluminum StdDev 0.02Aluminum Min 0.07Aluminum Max 0.11
2069-A WW001 Ammonia 0.999 mg/L2069-A WW001 Ammonia 8.71 mg/L2069-A WW001 Ammonia 10.3 mg/L2069-A WW001 Ammonia 11.3 mg/L
Ammonia Average 7.83Ammonia StdDev 4.68Ammonia Min 1.00Ammonia Max 11.30
2069-A WW001 Arsenic 0.00765 mg/L 0.0512069-A WW001 Arsenic 0.0106 mg/L 0.0512069-A WW001 Arsenic 0.0327 mg/L 0.0512069-A WW001 Arsenic 0.0456 mg/L 0.051
Arsenic Average 0.02Arsenic StdDev 0.02Arsenic Min 0.01Arsenic Max 0.05
2069-A WW001 Boron 0.0785 mg/L2069-A WW001 Boron 0.0869 mg/L2069-A WW001 Boron 0.0999 mg/L2069-A WW001 Boron 0.142 mg/L
Boron Average 0.10Boron StdDev 0.03Boron Min 0.08Boron Max 0.14
2069-A WW001 Cadmium 0.001 mg/L 0.52069-A WW001 Cadmium 0.001 mg/L 0.52069-A WW001 Cadmium 0.001 mg/L 0.52069-A WW001 Cadmium 0.001 mg/L 0.5
Cadmium Average 0.001Cadmium StdDev 0Cadmium Min 0.001Cadmium Max 0.001
2069-A WW001 Chromium 0.00351 mg/L 4.12069-A WW001 Chromium 0.00376 mg/L 4.12069-A WW001 Chromium 0.00443 mg/L 4.12069-A WW001 Chromium 0.00488 mg/L 4.1
Chromium Average 0.00Chromium StdDev 0.00Chromium Min 0.00Chromium Max 0.00
TABLE A-5. Permitted Sanitary Outfalls of Non-radiological (Inorganic) Analyses, CY 2010
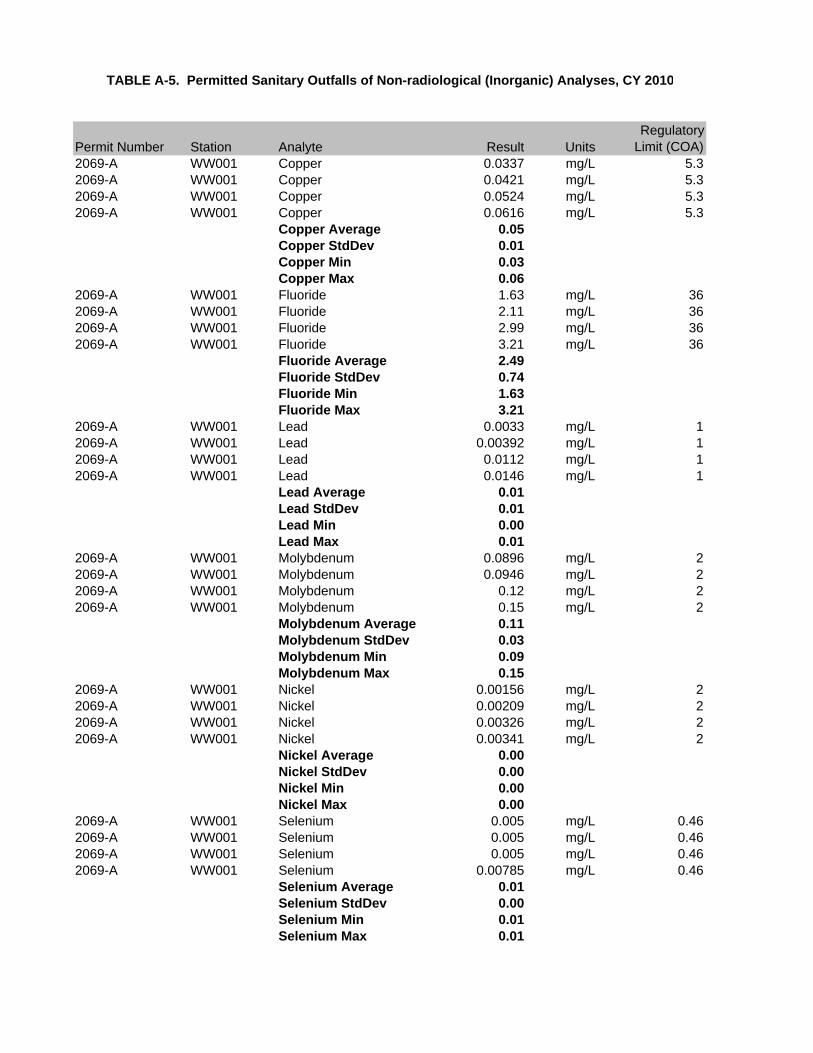
Permit Number Station Analyte Result UnitsRegulatory
Limit (COA)
TABLE A-5. Permitted Sanitary Outfalls of Non-radiological (Inorganic) Analyses, CY 2010
2069-A WW001 Copper 0.0337 mg/L 5.32069-A WW001 Copper 0.0421 mg/L 5.32069-A WW001 Copper 0.0524 mg/L 5.32069-A WW001 Copper 0.0616 mg/L 5.3
Copper Average 0.05Copper StdDev 0.01Copper Min 0.03Copper Max 0.06
2069-A WW001 Fluoride 1.63 mg/L 362069-A WW001 Fluoride 2.11 mg/L 362069-A WW001 Fluoride 2.99 mg/L 362069-A WW001 Fluoride 3.21 mg/L 36
Fluoride Average 2.49Fluoride StdDev 0.74Fluoride Min 1.63Fluoride Max 3.21
2069-A WW001 Lead 0.0033 mg/L 12069-A WW001 Lead 0.00392 mg/L 12069-A WW001 Lead 0.0112 mg/L 12069-A WW001 Lead 0.0146 mg/L 1
Lead Average 0.01Lead StdDev 0.01Lead Min 0.00Lead Max 0.01
2069-A WW001 Molybdenum 0.0896 mg/L 22069-A WW001 Molybdenum 0.0946 mg/L 22069-A WW001 Molybdenum 0.12 mg/L 22069-A WW001 Molybdenum 0.15 mg/L 2
Molybdenum Average 0.11Molybdenum StdDev 0.03Molybdenum Min 0.09Molybdenum Max 0.15
2069-A WW001 Nickel 0.00156 mg/L 22069-A WW001 Nickel 0.00209 mg/L 22069-A WW001 Nickel 0.00326 mg/L 22069-A WW001 Nickel 0.00341 mg/L 2
Nickel Average 0.00Nickel StdDev 0.00Nickel Min 0.00Nickel Max 0.00
2069-A WW001 Selenium 0.005 mg/L 0.462069-A WW001 Selenium 0.005 mg/L 0.462069-A WW001 Selenium 0.005 mg/L 0.462069-A WW001 Selenium 0.00785 mg/L 0.46
Selenium Average 0.01Selenium StdDev 0.00Selenium Min 0.01Selenium Max 0.01

Permit Number Station Analyte Result UnitsRegulatory
Limit (COA)
TABLE A-5. Permitted Sanitary Outfalls of Non-radiological (Inorganic) Analyses, CY 2010
2069-A WW001 Silver 0.001 mg/L 52069-A WW001 Silver 0.001 mg/L 52069-A WW001 Silver 0.001 mg/L 52069-A WW001 Silver 0.001 mg/L 5
Silver Average 0.00Silver StdDev 0.00Silver Min 0.00Silver Max 0.00
2069-A WW001 Zinc 0.0406 mg/L 2.22069-A WW001 Zinc 0.0419 mg/L 2.22069-A WW001 Zinc 0.0531 mg/L 2.22069-A WW001 Zinc 0.0632 mg/L 2.2
Zinc Average 0.05Zinc StdDev 0.01Zinc Min 0.04Zinc Max 0.06
2069-K WW011 Aluminum 0.12 mg/L 9002069-K WW011 Aluminum 0.136 mg/L 9002069-K WW011 Aluminum 0.25 mg/L 9002069-K WW011 Aluminum 0.433 mg/L 900
Aluminum Average 0.23Aluminum StdDev 0.14Aluminum Min 0.12Aluminum Max 0.43
2069-K WW011 Ammonia 9.87 mg/L2069-K WW011 Ammonia 12.5 mg/L2069-K WW011 Ammonia 14.9 mg/L2069-K WW011 Ammonia 21.6 mg/L
Ammonia Average 14.72Ammonia StdDev 5.03Ammonia Min 9.87Ammonia Max 21.60
2069-K WW011 Arsenic 0.005 mg/L 0.0512069-K WW011 Arsenic 0.00771 mg/L 0.0512069-K WW011 Arsenic 0.00915 mg/L 0.0512069-K WW011 Arsenic 0.0236 mg/L 0.051
Arsenic Average 0.01Arsenic StdDev 0.01Arsenic Min 0.01Arsenic Max 0.02
2069-K WW011 Boron 0.0856 mg/L2069-K WW011 Boron 0.0885 mg/L2069-K WW011 Boron 0.0913 mg/L2069-K WW011 Boron 0.113 mg/L
Boron Average 0.09Boron StdDev 0.01Boron Min 0.09Boron Max 0.11
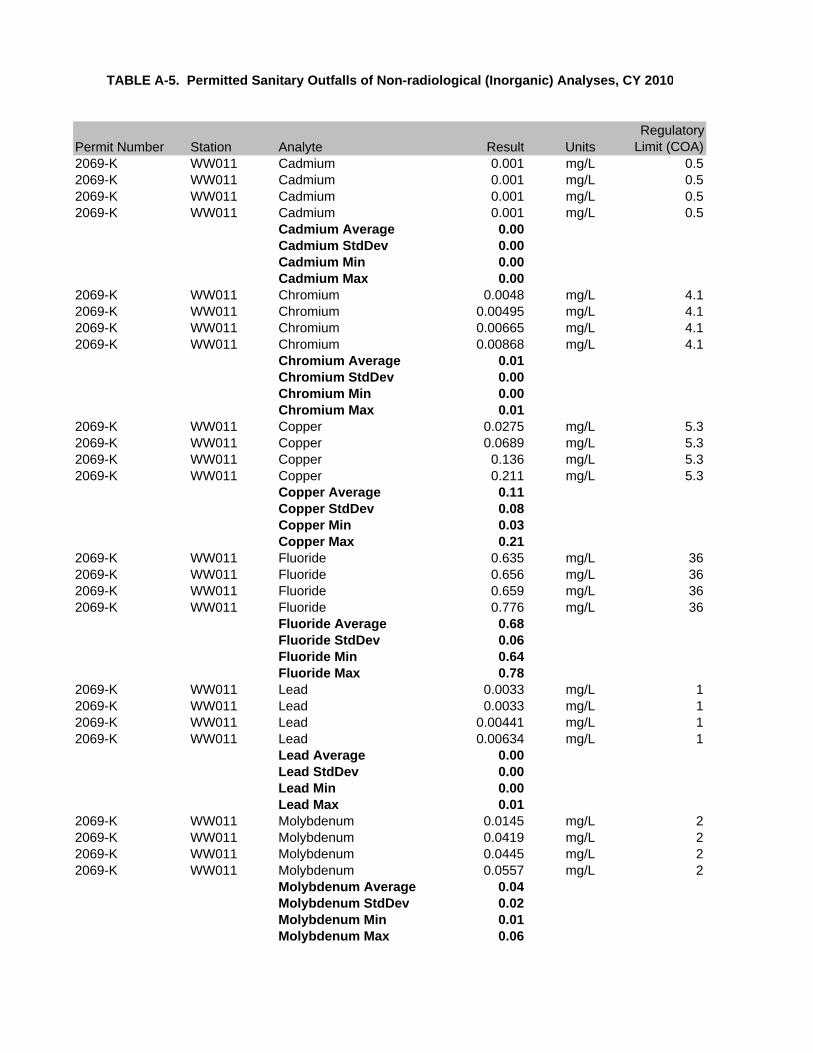
Permit Number Station Analyte Result UnitsRegulatory
Limit (COA)
TABLE A-5. Permitted Sanitary Outfalls of Non-radiological (Inorganic) Analyses, CY 2010
2069-K WW011 Cadmium 0.001 mg/L 0.52069-K WW011 Cadmium 0.001 mg/L 0.52069-K WW011 Cadmium 0.001 mg/L 0.52069-K WW011 Cadmium 0.001 mg/L 0.5
Cadmium Average 0.00Cadmium StdDev 0.00Cadmium Min 0.00Cadmium Max 0.00
2069-K WW011 Chromium 0.0048 mg/L 4.12069-K WW011 Chromium 0.00495 mg/L 4.12069-K WW011 Chromium 0.00665 mg/L 4.12069-K WW011 Chromium 0.00868 mg/L 4.1
Chromium Average 0.01Chromium StdDev 0.00Chromium Min 0.00Chromium Max 0.01
2069-K WW011 Copper 0.0275 mg/L 5.32069-K WW011 Copper 0.0689 mg/L 5.32069-K WW011 Copper 0.136 mg/L 5.32069-K WW011 Copper 0.211 mg/L 5.3
Copper Average 0.11Copper StdDev 0.08Copper Min 0.03Copper Max 0.21
2069-K WW011 Fluoride 0.635 mg/L 362069-K WW011 Fluoride 0.656 mg/L 362069-K WW011 Fluoride 0.659 mg/L 362069-K WW011 Fluoride 0.776 mg/L 36
Fluoride Average 0.68Fluoride StdDev 0.06Fluoride Min 0.64Fluoride Max 0.78
2069-K WW011 Lead 0.0033 mg/L 12069-K WW011 Lead 0.0033 mg/L 12069-K WW011 Lead 0.00441 mg/L 12069-K WW011 Lead 0.00634 mg/L 1
Lead Average 0.00Lead StdDev 0.00Lead Min 0.00Lead Max 0.01
2069-K WW011 Molybdenum 0.0145 mg/L 22069-K WW011 Molybdenum 0.0419 mg/L 22069-K WW011 Molybdenum 0.0445 mg/L 22069-K WW011 Molybdenum 0.0557 mg/L 2
Molybdenum Average 0.04Molybdenum StdDev 0.02Molybdenum Min 0.01Molybdenum Max 0.06

Permit Number Station Analyte Result UnitsRegulatory
Limit (COA)
TABLE A-5. Permitted Sanitary Outfalls of Non-radiological (Inorganic) Analyses, CY 2010
2069-K WW011 Nickel 0.00215 mg/L 22069-K WW011 Nickel 0.00326 mg/L 22069-K WW011 Nickel 0.0041 mg/L 22069-K WW011 Nickel 0.00483 mg/L 2
Nickel Average 0.00Nickel StdDev 0.00Nickel Min 0.00Nickel Max 0.00
2069-K WW011 Selenium 0.005 mg/L 0.462069-K WW011 Selenium 0.005 mg/L 0.462069-K WW011 Selenium 0.00722 mg/L 0.462069-K WW011 Selenium 0.0158 mg/L 0.46
Selenium Average 0.01Selenium StdDev 0.01Selenium Min 0.01Selenium Max 0.02
2069-K WW011 Silver 0.001 mg/L 52069-K WW011 Silver 0.001 mg/L 52069-K WW011 Silver 0.001 mg/L 52069-K WW011 Silver 0.001 mg/L 5
Silver Average 0.00Silver StdDev 0.00Silver Min 0.00Silver Max 0.00
2069-K WW011 Zinc 0.0518 mg/L 2.22069-K WW011 Zinc 0.077 mg/L 2.22069-K WW011 Zinc 0.106 mg/L 2.22069-K WW011 Zinc 0.221 mg/L 2.2
Zinc Average 0.11Zinc StdDev 0.07Zinc Min 0.05Zinc Max 0.22
2069F-4 WW006 Aluminum 0.127 mg/L 9002069F-4 WW006 Aluminum 0.138 mg/L 9002069F-4 WW006 Aluminum 0.141 mg/L 9002069F-4 WW006 Aluminum 0.145 mg/L 900
Aluminum Average 0.14Aluminum StdDev 0.01Aluminum Min 0.13Aluminum Max 0.15
2069F-4 WW006 Ammonia 11.2 mg/L2069F-4 WW006 Ammonia 24.8 mg/L2069F-4 WW006 Ammonia 30.1 mg/L2069F-4 WW006 Ammonia 37.2 mg/L
Ammonia Average 25.83Ammonia StdDev 10.99Ammonia Min 11.20Ammonia Max 37.20

Permit Number Station Analyte Result UnitsRegulatory
Limit (COA)
TABLE A-5. Permitted Sanitary Outfalls of Non-radiological (Inorganic) Analyses, CY 2010
2069F-4 WW006 Arsenic 0.00514 mg/L 0.0512069F-4 WW006 Arsenic 0.00977 mg/L 0.0512069F-4 WW006 Arsenic 0.0102 mg/L 0.0512069F-4 WW006 Arsenic 0.0295 mg/L 0.051
Arsenic Average 0.01Arsenic StdDev 0.01Arsenic Min 0.01Arsenic Max 0.03
2069F-4 WW006 Boron 0.0847 mg/L2069F-4 WW006 Boron 0.125 mg/L2069F-4 WW006 Boron 0.128 mg/L2069F-4 WW006 Boron 0.16 mg/L
Boron Average 0.12Boron StdDev 0.03Boron Min 0.08Boron Max 0.16
2069F-4 WW006 Cadmium 0.001 mg/L 0.52069F-4 WW006 Cadmium 0.001 mg/L 0.52069F-4 WW006 Cadmium 0.001 mg/L 0.52069F-4 WW006 Cadmium 0.001 mg/L 0.5
Cadmium Average 0.00Cadmium StdDev 0.00Cadmium Min 0.00Cadmium Max 0.00
2069F-4 WW006 Chromium 0.00224 mg/L 4.12069F-4 WW006 Chromium 0.00244 mg/L 4.12069F-4 WW006 Chromium 0.00295 mg/L 4.12069F-4 WW006 Chromium 0.00296 mg/L 4.1
Chromium Average 0.00Chromium StdDev 0.00Chromium Min 0.00Chromium Max 0.00
2069F-4 WW006 Copper 0.0103 mg/L 5.32069F-4 WW006 Copper 0.0136 mg/L 5.32069F-4 WW006 Copper 0.0196 mg/L 5.32069F-4 WW006 Copper 0.0335 mg/L 5.3
Copper Average 0.02Copper StdDev 0.01Copper Min 0.01Copper Max 0.03
2069F-4 WW006 Cyanide, total 0.0017 mg/L 0.452069F-4 WW006 Cyanide, total 0.0017 mg/L 0.452069F-4 WW006 Cyanide, total 0.0017 mg/L 0.452069F-4 WW006 Cyanide, total 0.0017 mg/L 0.452069F-4 WW006 Cyanide, total 0.0017 mg/L 0.452069F-4 WW006 Cyanide, total 0.00172 mg/L 0.452069F-4 WW006 Cyanide, total 0.00389 mg/L 0.452069F-4 WW006 Cyanide, total 0.00568 mg/L 0.45
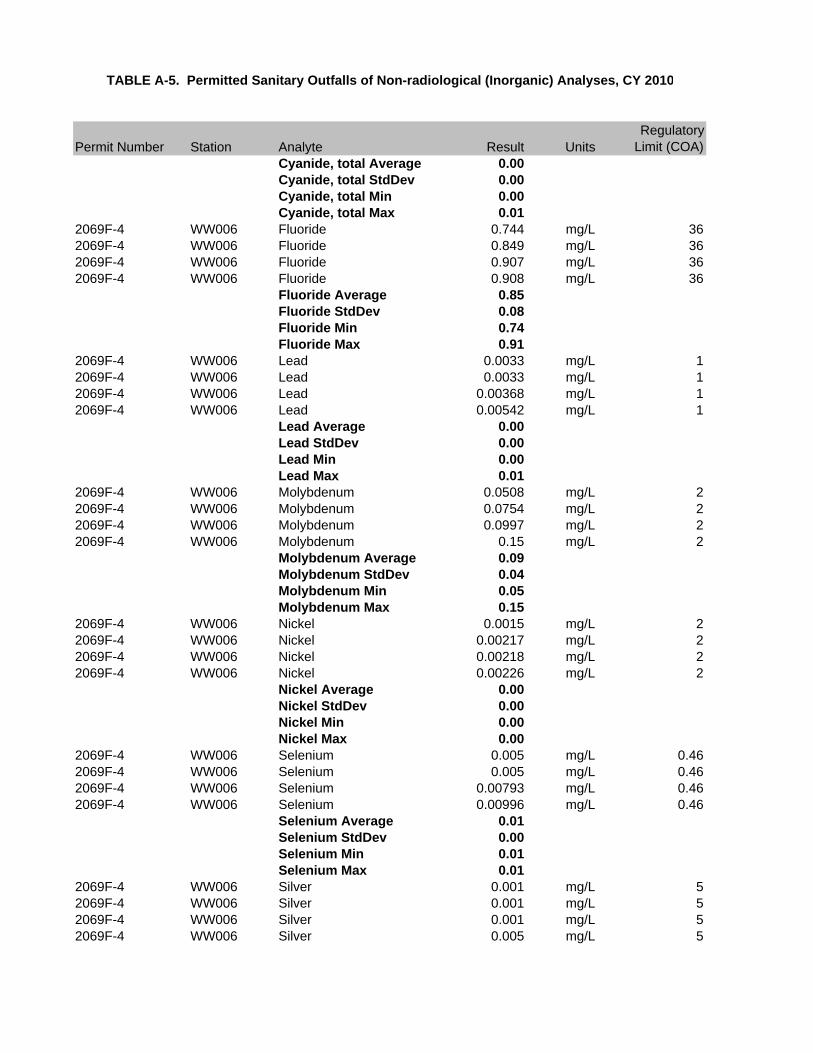
Permit Number Station Analyte Result UnitsRegulatory
Limit (COA)
TABLE A-5. Permitted Sanitary Outfalls of Non-radiological (Inorganic) Analyses, CY 2010
Cyanide, total Average 0.00Cyanide, total StdDev 0.00Cyanide, total Min 0.00Cyanide, total Max 0.01
2069F-4 WW006 Fluoride 0.744 mg/L 362069F-4 WW006 Fluoride 0.849 mg/L 362069F-4 WW006 Fluoride 0.907 mg/L 362069F-4 WW006 Fluoride 0.908 mg/L 36
Fluoride Average 0.85Fluoride StdDev 0.08Fluoride Min 0.74Fluoride Max 0.91
2069F-4 WW006 Lead 0.0033 mg/L 12069F-4 WW006 Lead 0.0033 mg/L 12069F-4 WW006 Lead 0.00368 mg/L 12069F-4 WW006 Lead 0.00542 mg/L 1
Lead Average 0.00Lead StdDev 0.00Lead Min 0.00Lead Max 0.01
2069F-4 WW006 Molybdenum 0.0508 mg/L 22069F-4 WW006 Molybdenum 0.0754 mg/L 22069F-4 WW006 Molybdenum 0.0997 mg/L 22069F-4 WW006 Molybdenum 0.15 mg/L 2
Molybdenum Average 0.09Molybdenum StdDev 0.04Molybdenum Min 0.05Molybdenum Max 0.15
2069F-4 WW006 Nickel 0.0015 mg/L 22069F-4 WW006 Nickel 0.00217 mg/L 22069F-4 WW006 Nickel 0.00218 mg/L 22069F-4 WW006 Nickel 0.00226 mg/L 2
Nickel Average 0.00Nickel StdDev 0.00Nickel Min 0.00Nickel Max 0.00
2069F-4 WW006 Selenium 0.005 mg/L 0.462069F-4 WW006 Selenium 0.005 mg/L 0.462069F-4 WW006 Selenium 0.00793 mg/L 0.462069F-4 WW006 Selenium 0.00996 mg/L 0.46
Selenium Average 0.01Selenium StdDev 0.00Selenium Min 0.01Selenium Max 0.01
2069F-4 WW006 Silver 0.001 mg/L 52069F-4 WW006 Silver 0.001 mg/L 52069F-4 WW006 Silver 0.001 mg/L 52069F-4 WW006 Silver 0.005 mg/L 5

Permit Number Station Analyte Result UnitsRegulatory
Limit (COA)
TABLE A-5. Permitted Sanitary Outfalls of Non-radiological (Inorganic) Analyses, CY 2010
Silver Average 0.00Silver StdDev 0.00Silver Min 0.00Silver Max 0.01
2069F-4 WW006 Zinc 0.0589 mg/L 2.22069F-4 WW006 Zinc 0.0608 mg/L 2.22069F-4 WW006 Zinc 0.0671 mg/L 2.22069F-4 WW006 Zinc 0.0803 mg/L 2.2
Zinc Average 0.07Zinc StdDev 0.01Zinc Min 0.06Zinc Max 0.08
2069F-4 WW006 #2 Cyanide, total 0.0017 mg/L 0.452069F-4 WW006 #2 Cyanide, total 0.0017 mg/L 0.452069F-4 WW006 #2 Cyanide, total 0.0017 mg/L 0.452069F-4 WW006 #2 Cyanide, total 0.0017 mg/L 0.452069F-4 WW006 #2 Cyanide, total 0.0017 mg/L 0.452069F-4 WW006 #2 Cyanide, total 0.0017 mg/L 0.452069F-4 WW006 #2 Cyanide, total 0.00235 mg/L 0.452069F-4 WW006 #2 Cyanide, total 0.00371 mg/L 0.45
Cyanide, total Average 0.00Cyanide, total StdDev 0.00Cyanide, total Min 0.00Cyanide, total Max 0.00
2069G-2 WW007 Aluminum 0.068 mg/L 9002069G-2 WW007 Aluminum 0.068 mg/L 9002069G-2 WW007 Aluminum 0.068 mg/L 9002069G-2 WW007 Aluminum 0.068 mg/L 900
Aluminum Average 0.07Aluminum StdDev 0.00Aluminum Min 0.07Aluminum Max 0.07
2069G-2 WW007 Ammonia 0.95 mg/L2069G-2 WW007 Ammonia 1.01 mg/L2069G-2 WW007 Ammonia 1.47 mg/L2069G-2 WW007 Ammonia 6.18 mg/L
Ammonia Average 2.40Ammonia StdDev 2.53Ammonia Min 0.95Ammonia Max 6.18
2069G-2 WW007 Arsenic 0.005 mg/L 0.0512069G-2 WW007 Arsenic 0.005 mg/L 0.0512069G-2 WW007 Arsenic 0.00971 mg/L 0.0512069G-2 WW007 Arsenic 0.0108 mg/L 0.0512069G-2 WW007 Arsenic 0.011 mg/L 0.0512069G-2 WW007 Arsenic 0.0114 mg/L 0.0512069G-2 WW007 Arsenic 0.0226 mg/L 0.0512069G-2 WW007 Arsenic 0.132 mg/L 0.051

Permit Number Station Analyte Result UnitsRegulatory
Limit (COA)
TABLE A-5. Permitted Sanitary Outfalls of Non-radiological (Inorganic) Analyses, CY 2010
Arsenic Average 0.03Arsenic StdDev 0.04Arsenic Min 0.01Arsenic Max 0.13
2069G-2 WW007 Boron 0.032 mg/L2069G-2 WW007 Boron 0.0324 mg/L2069G-2 WW007 Boron 0.0663 mg/L2069G-2 WW007 Boron 0.132 mg/L
Boron Average 0.07Boron StdDev 0.05Boron Min 0.03Boron Max 0.13
2069G-2 WW007 Cadmium 0.001 mg/L 0.52069G-2 WW007 Cadmium 0.001 mg/L 0.52069G-2 WW007 Cadmium 0.001 mg/L 0.52069G-2 WW007 Cadmium 0.001 mg/L 0.5
Cadmium Average 0.00Cadmium StdDev 0.00Cadmium Min 0.00Cadmium Max 0.00
2069G-2 WW007 Chromium 0.00139 mg/L 4.12069G-2 WW007 Chromium 0.00187 mg/L 4.12069G-2 WW007 Chromium 0.00237 mg/L 4.12069G-2 WW007 Chromium 0.00254 mg/L 4.1
Chromium Average 0.00Chromium StdDev 0.00Chromium Min 0.00Chromium Max 0.00
2069G-2 WW007 Copper 0.00 mg/L 5.32069G-2 WW007 Copper 0.003 mg/L 5.32069G-2 WW007 Copper 0.003 mg/L 5.32069G-2 WW007 Copper 0.003 mg/L 5.3
Copper Average 0.00Copper StdDev 0.00Copper Min 0.00Copper Max 0.00
2069G-2 WW007 Cyanide, total 0.0017 mg/L 0.452069G-2 WW007 Cyanide, total 0.0017 mg/L 0.452069G-2 WW007 Cyanide, total 0.0017 mg/L 0.452069G-2 WW007 Cyanide, total 0.0017 mg/L 0.452069G-2 WW007 Cyanide, total 0.0017 mg/L 0.452069G-2 WW007 Cyanide, total 0.0017 mg/L 0.452069G-2 WW007 Cyanide, total 0.0017 mg/L 0.452069G-2 WW007 Cyanide, total 0.0017 mg/L 0.45
Cyanide, total Average 0.00Cyanide, total StdDev 0.00Cyanide, total Min 0.00Cyanide, total Max 0.00

Permit Number Station Analyte Result UnitsRegulatory
Limit (COA)
TABLE A-5. Permitted Sanitary Outfalls of Non-radiological (Inorganic) Analyses, CY 2010
2069G-2 WW007 Fluoride 1.16 mg/L 362069G-2 WW007 Fluoride 1.39 mg/L 362069G-2 WW007 Fluoride 1.63 mg/L 362069G-2 WW007 Fluoride 2.06 mg/L 36
Fluoride Average 1.56Fluoride StdDev 0.38Fluoride Min 1.16Fluoride Max 2.06
2069G-2 WW007 Lead 0.0033 mg/L 12069G-2 WW007 Lead 0.0033 mg/L 12069G-2 WW007 Lead 0.0033 mg/L 12069G-2 WW007 Lead 0.0165 mg/L 1
Lead Average 0.01Lead StdDev 0.01Lead Min 0.00Lead Max 0.02
2069G-2 WW007 Molybdenum 0.0189 mg/L 22069G-2 WW007 Molybdenum 0.0215 mg/L 22069G-2 WW007 Molybdenum 0.0232 mg/L 22069G-2 WW007 Molybdenum 0.0313 mg/L 2
Molybdenum Average 0.02Molybdenum StdDev 0.01Molybdenum Min 0.02Molybdenum Max 0.03
2069G-2 WW007 Nickel 0.0015 mg/L 22069G-2 WW007 Nickel 0.0015 mg/L 22069G-2 WW007 Nickel 0.0015 mg/L 22069G-2 WW007 Nickel 0.00166 mg/L 2
Nickel Average 0.00Nickel StdDev 0.00Nickel Min 0.00Nickel Max 0.00
2069G-2 WW007 Selenium 0.005 mg/L 0.462069G-2 WW007 Selenium 0.005 mg/L 0.462069G-2 WW007 Selenium 0.0064 mg/L 0.462069G-2 WW007 Selenium 0.00732 mg/L 0.46
Selenium Average 0.01Selenium StdDev 0.00Selenium Min 0.01Selenium Max 0.01
2069G-2 WW007 Silver 0.001 mg/L 52069G-2 WW007 Silver 0.001 mg/L 52069G-2 WW007 Silver 0.001 mg/L 52069G-2 WW007 Silver 0.001 mg/L 5
Silver Average 0.00Silver StdDev 0.00Silver Min 0.00Silver Max 0.00

Permit Number Station Analyte Result UnitsRegulatory
Limit (COA)
TABLE A-5. Permitted Sanitary Outfalls of Non-radiological (Inorganic) Analyses, CY 2010
2069G-2 WW007 Zinc 0.0033 mg/L 2.22069G-2 WW007 Zinc 0.0033 mg/L 2.22069G-2 WW007 Zinc 0.0033 mg/L 2.22069G-2 WW007 Zinc 0.00423 mg/L 2.2
Zinc Average 0.00Zinc StdDev 0.00Zinc Min 0.00Zinc Max 0.00
2069I-3 WW008 Aluminum 0.0917 mg/L 9002069I-3 WW008 Aluminum 0.13 mg/L 9002069I-3 WW008 Aluminum 0.149 mg/L 9002069I-3 WW008 Aluminum 0.355 mg/L 900
Aluminum Average 0.18Aluminum StdDev 0.12Aluminum Min 0.09Aluminum Max 0.36
2069I-3 WW008 Ammonia 0.135 mg/L2069I-3 WW008 Ammonia 28.7 mg/L2069I-3 WW008 Ammonia 57.4 mg/L2069I-3 WW008 Ammonia 67 mg/L
Ammonia Average 38.31Ammonia StdDev 30.21Ammonia Min 0.14Ammonia Max 67.00
2069I-3 WW008 Arsenic 0.005 mg/L 0.0512069I-3 WW008 Arsenic 0.00702 mg/L 0.0512069I-3 WW008 Arsenic 0.00977 mg/L 0.0512069I-3 WW008 Arsenic 0.0276 mg/L 0.051
Arsenic Average 0.01Arsenic StdDev 0.01Arsenic Min 0.01Arsenic Max 0.03
2069I-3 WW008 Boron 0.0825 mg/L2069I-3 WW008 Boron 0.0842 mg/L2069I-3 WW008 Boron 0.0909 mg/L2069I-3 WW008 Boron 0.105 mg/L
Boron Average 0.09Boron StdDev 0.01Boron Min 0.08Boron Max 0.11
2069I-3 WW008 Cadmium 0.001 mg/L 0.52069I-3 WW008 Cadmium 0.001 mg/L 0.52069I-3 WW008 Cadmium 0.001 mg/L 0.52069I-3 WW008 Cadmium 0.001 mg/L 0.5
Cadmium Average 0.00Cadmium StdDev 0.00Cadmium Min 0.00Cadmium Max 0.00

Permit Number Station Analyte Result UnitsRegulatory
Limit (COA)
TABLE A-5. Permitted Sanitary Outfalls of Non-radiological (Inorganic) Analyses, CY 2010
2069I-3 WW008 Chromium 0.00197 mg/L 4.12069I-3 WW008 Chromium 0.00215 mg/L 4.12069I-3 WW008 Chromium 0.00256 mg/L 4.12069I-3 WW008 Chromium 0.00285 mg/L 4.1
Chromium Average 0.00Chromium StdDev 0.00Chromium Min 0.00Chromium Max 0.00
2069I-3 WW008 Copper 0.0238 mg/L 5.32069I-3 WW008 Copper 0.0325 mg/L 5.32069I-3 WW008 Copper 0.034 mg/L 5.32069I-3 WW008 Copper 0.0424 mg/L 5.3
Copper Average 0.03Copper StdDev 0.01Copper Min 0.02Copper Max 0.04
2069I-3 WW008 Cyanide, total 0.0017 mg/L 0.452069I-3 WW008 Cyanide, total 0.0017 mg/L 0.452069I-3 WW008 Cyanide, total 0.0017 mg/L 0.452069I-3 WW008 Cyanide, total 0.00215 mg/L 0.452069I-3 WW008 Cyanide, total 0.00231 mg/L 0.452069I-3 WW008 Cyanide, total 0.00382 mg/L 0.452069I-3 WW008 Cyanide, total 0.00442 mg/L 0.452069I-3 WW008 Cyanide, total 0.00458 mg/L 0.45
Cyanide, total Average 0.00Cyanide, total StdDev 0.00Cyanide, total Min 0.00Cyanide, total Max 0.00
2069I-3 WW008 Fluoride 0.637 mg/L 362069I-3 WW008 Fluoride 0.648 mg/L 362069I-3 WW008 Fluoride 0.653 mg/L 362069I-3 WW008 Fluoride 0.756 mg/L 36
Fluoride Average 0.67Fluoride StdDev 0.06Fluoride Min 0.64Fluoride Max 0.76
2069I-3 WW008 Lead 0.0033 mg/L 12069I-3 WW008 Lead 0.0033 mg/L 12069I-3 WW008 Lead 0.0033 mg/L 12069I-3 WW008 Lead 0.00537 mg/L 1
Lead Average 0.00Lead StdDev 0.00Lead Min 0.00Lead Max 0.01
2069I-3 WW008 Molybdenum 0.00352 mg/L 22069I-3 WW008 Molybdenum 0.00575 mg/L 22069I-3 WW008 Molybdenum 0.00904 mg/L 22069I-3 WW008 Molybdenum 0.0831 mg/L 2

Permit Number Station Analyte Result UnitsRegulatory
Limit (COA)
TABLE A-5. Permitted Sanitary Outfalls of Non-radiological (Inorganic) Analyses, CY 2010
Molybdenum Average 0.03Molybdenum StdDev 0.04Molybdenum Min 0.00Molybdenum Max 0.08
2069I-3 WW008 Nickel 0.0027 mg/L 22069I-3 WW008 Nickel 0.00295 mg/L 22069I-3 WW008 Nickel 0.0037 mg/L 22069I-3 WW008 Nickel 0.00611 mg/L 2
Nickel Average 0.00Nickel StdDev 0.00Nickel Min 0.00Nickel Max 0.01
2069I-3 WW008 Selenium 0.005 mg/L 0.462069I-3 WW008 Selenium 0.005 mg/L 0.462069I-3 WW008 Selenium 0.005 mg/L 0.462069I-3 WW008 Selenium 0.00886 mg/L 0.46
Selenium Average 0.01Selenium StdDev 0.00Selenium Min 0.01Selenium Max 0.01
2069I-3 WW008 Silver 0.001 mg/L 52069I-3 WW008 Silver 0.001 mg/L 52069I-3 WW008 Silver 0.001 mg/L 52069I-3 WW008 Silver 0.001 mg/L 5
Silver Average 0.00Silver StdDev 0.00Silver Min 0.00Silver Max 0.00
2069I-3 WW008 Zinc 0.0668 mg/L 2.22069I-3 WW008 Zinc 0.0815 mg/L 2.22069I-3 WW008 Zinc 0.104 mg/L 2.22069I-3 WW008 Zinc 0.105 mg/L 2.2
Zinc Average 0.09Zinc StdDev 0.02Zinc Min 0.07Zinc Max 0.11
2238A CINT Aluminum 0.068 mg/L 9002238A CINT Aluminum 0.068 mg/L 9002238A CINT Aluminum 0.068 mg/L 9002238A CINT Aluminum 0.068 mg/L 900
Aluminum Average 0.07Aluminum StdDev 0.00Aluminum Min 0.07Aluminum Max 0.07
2238A CINT Ammonia 0.072 mg/L2238A CINT Ammonia 0.127 mg/L2238A CINT Ammonia 0.152 mg/L2238A CINT Ammonia 0.172 mg/L

Permit Number Station Analyte Result UnitsRegulatory
Limit (COA)
TABLE A-5. Permitted Sanitary Outfalls of Non-radiological (Inorganic) Analyses, CY 2010
Ammonia Average 0.13Ammonia StdDev 0.04Ammonia Min 0.07Ammonia Max 0.17
2238A CINT Arsenic 0.00552 mg/L 0.0512238A CINT Arsenic 0.00589 mg/L 0.0512238A CINT Arsenic 0.0182 mg/L 0.0512238A CINT Arsenic 0.0195 mg/L 0.051
Arsenic Average 0.01Arsenic StdDev 0.01Arsenic Min 0.01Arsenic Max 0.02
2238A CINT Boron 0.0808 mg/L2238A CINT Boron 0.0935 mg/L2238A CINT Boron 0.155 mg/L2238A CINT Boron 0.164 mg/L
Boron Average 0.12Boron StdDev 0.04Boron Min 0.08Boron Max 0.16
2238A CINT Cadmium 0.001 mg/L 0.52238A CINT Cadmium 0.001 mg/L 0.52238A CINT Cadmium 0.001 mg/L 0.52238A CINT Cadmium 0.001 mg/L 0.5
Cadmium Average 0.00Cadmium StdDev 0.00Cadmium Min 0.00Cadmium Max 0.00
2238A CINT Chromium 0.00236 mg/L 4.12238A CINT Chromium 0.00393 mg/L 4.12238A CINT Chromium 0.00586 mg/L 4.12238A CINT Chromium 0.00613 mg/L 4.1
Chromium Average 0.00Chromium StdDev 0.00Chromium Min 0.00Chromium Max 0.01
2238A CINT Copper 0.00577 mg/L 5.32238A CINT Copper 0.0133 mg/L 5.32238A CINT Copper 0.016 mg/L 5.32238A CINT Copper 0.0162 mg/L 5.3
Copper Average 0.01Copper StdDev 0.00Copper Min 0.01Copper Max 0.02
2238A CINT Cyanide, total 0.00166 mg/L 0.452238A CINT Cyanide, total 0.00166 mg/L 0.452238A CINT Cyanide, total 0.00166 mg/L 0.452238A CINT Cyanide, total 0.0017 mg/L 0.45

Permit Number Station Analyte Result UnitsRegulatory
Limit (COA)
TABLE A-5. Permitted Sanitary Outfalls of Non-radiological (Inorganic) Analyses, CY 2010
2238A CINT Cyanide, total 0.0017 mg/L 0.452238A CINT Cyanide, total 0.0017 mg/L 0.452238A CINT Cyanide, total 0.0017 mg/L 0.452238A CINT Cyanide, total 0.0123 mg/L 0.45
Cyanide, total Average 0.00Cyanide, total StdDev 0.00Cyanide, total Min 0.00Cyanide, total Max 0.01
2238A CINT Fluoride 0.759 mg/L 362238A CINT Fluoride 0.948 mg/L 362238A CINT Fluoride 1.96 mg/L 362238A CINT Fluoride 2.02 mg/L 36
Fluoride Average 1.42Fluoride StdDev 0.66Fluoride Min 0.76Fluoride Max 2.02
2238A CINT Lead 0.0033 mg/L 12238A CINT Lead 0.0033 mg/L 12238A CINT Lead 0.0033 mg/L 12238A CINT Lead 0.00451 mg/L 1
Lead Average 0.00Lead StdDev 0.00Lead Min 0.00Lead Max 0.00
2238A CINT Molybdenum 0.0255 mg/L 22238A CINT Molybdenum 0.0302 mg/L 22238A CINT Molybdenum 0.0692 mg/L 22238A CINT Molybdenum 0.0771 mg/L 2
Molybdenum Average 0.05Molybdenum StdDev 0.03Molybdenum Min 0.03Molybdenum Max 0.08
2238A CINT Nickel 0.0015 mg/L 22238A CINT Nickel 0.0015 mg/L 22238A CINT Nickel 0.0015 mg/L 22238A CINT Nickel 0.0015 mg/L 2
Nickel Average 0.00Nickel StdDev 0.00Nickel Min 0.00Nickel Max 0.00
2238A CINT Selenium 0.005 mg/L 0.462238A CINT Selenium 0.005 mg/L 0.462238A CINT Selenium 0.005 mg/L 0.462238A CINT Selenium 0.005 mg/L 0.46
Selenium Average 0.01Selenium StdDev 0.00Selenium Min 0.01Selenium Max 0.01
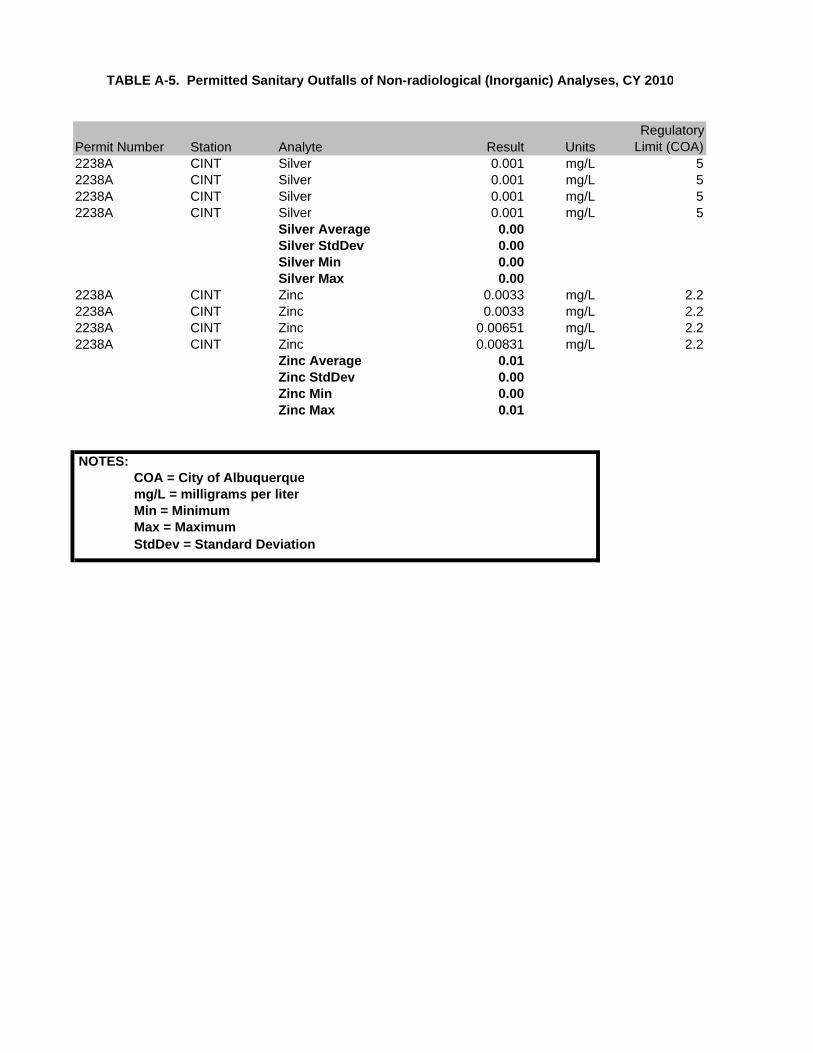
Permit Number Station Analyte Result UnitsRegulatory
Limit (COA)
TABLE A-5. Permitted Sanitary Outfalls of Non-radiological (Inorganic) Analyses, CY 2010
2238A CINT Silver 0.001 mg/L 52238A CINT Silver 0.001 mg/L 52238A CINT Silver 0.001 mg/L 52238A CINT Silver 0.001 mg/L 5
Silver Average 0.00Silver StdDev 0.00Silver Min 0.00Silver Max 0.00
2238A CINT Zinc 0.0033 mg/L 2.22238A CINT Zinc 0.0033 mg/L 2.22238A CINT Zinc 0.00651 mg/L 2.22238A CINT Zinc 0.00831 mg/L 2.2
Zinc Average 0.01Zinc StdDev 0.00Zinc Min 0.00Zinc Max 0.01
NOTES: COA = City of Albuquerque mg/L = milligrams per liter Min = Minimum Max = Maximum StdDev = Standard Deviation

Permit Number Station Analyte Activity UnitsRegulatory Sewer Release
Limits* (Monthly Avg)2069-A WW001 Actinium-228 -20.4 pCi/L 3000002069-A WW001 Actinium-228 7.74 pCi/L 300000
Actinium-228 Average -6.33Actinium-228 StdDev 19.90Actinium-228 Min -20.40Actinium-228 Max 7.74
2069-A WW001 Alpha, gross 1.6 pCi/L2069-A WW001 Alpha, gross 2.65 pCi/L
Alpha, gross Average 2.13Alpha, gross StdDev 0.74Alpha, gross Min 1.60Alpha, gross Max 2.65
2069-A WW001 Americium-241 4.26 pCi/L 2002069-A WW001 Americium-241 5.58 pCi/L 200
Americium-241 Average 4.92Americium-241 StdDev 0.93Americium-241 Min 4.26Americium-241 Max 5.58
2069-A WW001 Beryllium-7 -6.21 pCi/L2069-A WW001 Beryllium-7 2.3 pCi/L
Beryllium-7 Average -1.96Beryllium-7 StdDev 6.02Beryllium-7 Min -6.21Beryllium-7 Max 2.30
2069-A WW001 Beta, gross 8.82 pCi/L2069-A WW001 Beta, gross 11.7 pCi/L
Beta, gross Average 10.26Beta, gross StdDev 2.04Beta, gross Min 8.82Beta, gross Max 11.70
2069-A WW001 Bismuth-212 -44.7 pCi/L2069-A WW001 Bismuth-212 21 pCi/L
Bismuth-212 Average -11.85Bismuth-212 StdDev 46.46
TABLE A-6. Permitted Sanitary Outfalls of Radiological Analyses, CY 2010

Permit Number Station Analyte Activity UnitsRegulatory Sewer Release
Limits* (Monthly Avg)
TABLE A-6. Permitted Sanitary Outfalls of Radiological Analyses, CY 2010
Bismuth-212 Min -44.70Bismuth-212 Max 21.00
2069-A WW001 Bismuth-214 1.41 pCi/L2069-A WW001 Bismuth-214 13.3 pCi/L
Bismuth-214 Average 7.36Bismuth-214 StdDev 8.41Bismuth-214 Min 1.41Bismuth-214 Max 13.30
2069-A WW001 Cesium-137 0.111 pCi/L 100002069-A WW001 Cesium-137 1.76 pCi/L 10000
Cesium-137 Average 0.94Cesium-137 StdDev 1.17Cesium-137 Min 0.11Cesium-137 Max 1.76
2069-A WW001 Cobalt-60 1.61 pCi/L 300002069-A WW001 Cobalt-60 2.77 pCi/L 30000
Cobalt-60 Average 2.19Cobalt-60 StdDev 0.82Cobalt-60 Min 1.61Cobalt-60 Max 2.77
2069-A WW001 Lead-212 -1.5 pCi/L 200002069-A WW001 Lead-212 0.813 pCi/L 20000
Lead-212 Average -0.34Lead-212 StdDev 1.64Lead-212 Min -1.50Lead-212 Max 0.81
2069-A WW001 Lead-214 -1.71 pCi/L 10000002069-A WW001 Lead-214 13.2 pCi/L 1000000
Lead-214 Average 5.75Lead-214 StdDev 10.54Lead-214 Min -1.71Lead-214 Max 13.20
2069-A WW001 Neptunium-237 -20.1 pCi/L2069-A WW001 Neptunium-237 3.12 pCi/L

Permit Number Station Analyte Activity UnitsRegulatory Sewer Release
Limits* (Monthly Avg)
TABLE A-6. Permitted Sanitary Outfalls of Radiological Analyses, CY 2010
Neptunium-237 Average -8.49Neptunium-237 StdDev 16.42Neptunium-237 Min -20.10Neptunium-237 Max 3.12
2069-A WW001 Potassium-40 16.4 pCi/L 400002069-A WW001 Potassium-40 27.8 pCi/L 40000
Potassium-40 Average 22.10Potassium-40 StdDev 8.06Potassium-40 Min 16.40Potassium-40 Max 27.80
2069-A WW001 Radium-223 -5.7 pCi/L2069-A WW001 Radium-223 -4.07 pCi/L
Radium-223 Average -4.89Radium-223 StdDev 1.15Radium-223 Min -5.70Radium-223 Max -4.07
2069-A WW001 Radium-224 -117 pCi/L2069-A WW001 Radium-224 -66.1 pCi/L
Radium-224 Average -91.55Radium-224 StdDev 35.99Radium-224 Min -117.00Radium-224 Max -66.10
2069-A WW001 Radium-226 -51.5 pCi/L 6002069-A WW001 Radium-226 8.24 pCi/L 600
Radium-226 Average -21.63Radium-226 StdDev 42.24Radium-226 Min -51.50Radium-226 Max 8.24
2069-A WW001 Radium-228 -20.4 pCi/L 6002069-A WW001 Radium-228 7.74 pCi/L 600
Radium-228 Average -6.33Radium-228 StdDev 19.90Radium-228 Min -20.40Radium-228 Max 7.74

Permit Number Station Analyte Activity UnitsRegulatory Sewer Release
Limits* (Monthly Avg)
TABLE A-6. Permitted Sanitary Outfalls of Radiological Analyses, CY 2010
2069-A WW001 Sodium-22 0.46 pCi/L2069-A WW001 Sodium-22 0.554 pCi/L
Sodium-22 Average 0.51Sodium-22 StdDev 0.07Sodium-22 Min 0.46Sodium-22 Max 0.55
2069-A WW001 Thorium-227 -0.567 pCi/L2069-A WW001 Thorium-227 -0.129 pCi/L
Thorium-227 Average -0.35Thorium-227 StdDev 0.31Thorium-227 Min -0.57Thorium-227 Max -0.13
2069-A WW001 Thorium-231 -8.1 pCi/L 3002069-A WW001 Thorium-231 2.38 pCi/L 300
Thorium-231 Average -2.86Thorium-231 StdDev 7.41Thorium-231 Min -8.10Thorium-231 Max 2.38
2069-A WW001 Thorium-234 -17.9 pCi/L 500002069-A WW001 Thorium-234 45.5 pCi/L 50000
Thorium-234 Average 13.80Thorium-234 StdDev 44.83Thorium-234 Min -17.90Thorium-234 Max 45.50
2069-A WW001 Tritium 16.4 pCi/L 100000002069-A WW001 Tritium 20.9 pCi/L 10000000
Tritium Average 18.65Tritium StdDev 3.18Tritium Min 16.40Tritium Max 20.90
2069-A WW001 Uranium-235 -7.17 pCi/L 30002069-A WW001 Uranium-235 0.635 pCi/L 3000
Uranium-235 Average -3.27Uranium-235 StdDev 5.52
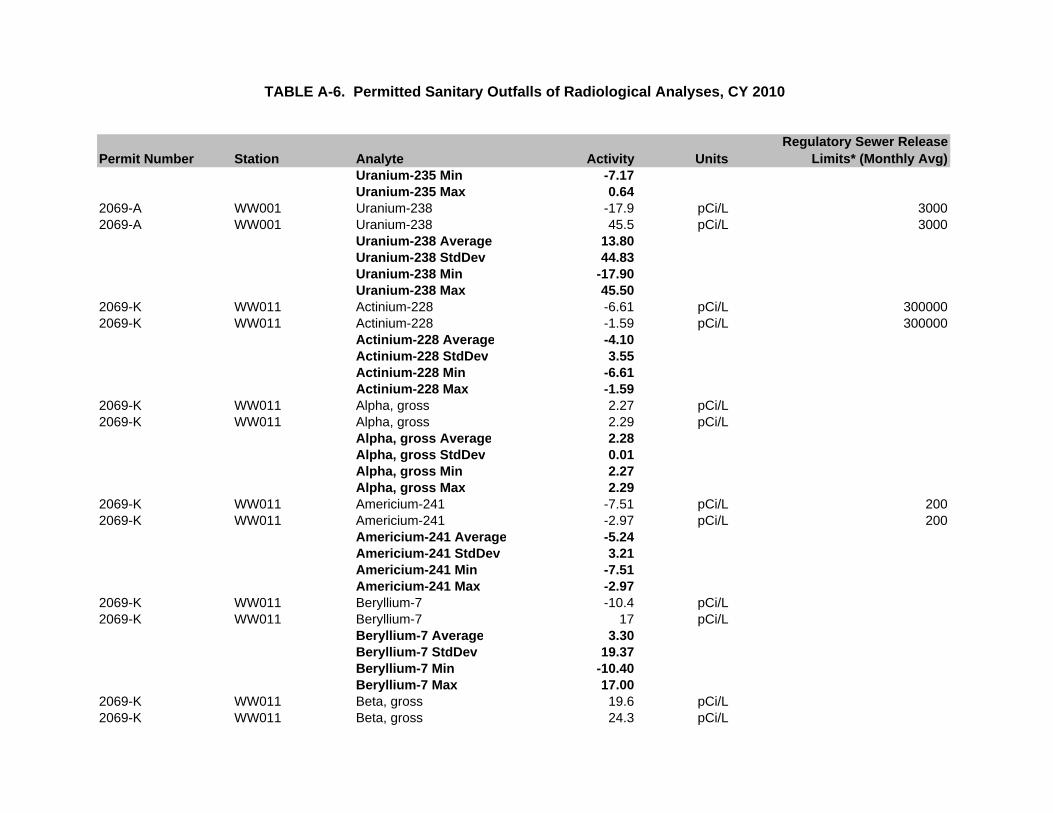
Permit Number Station Analyte Activity UnitsRegulatory Sewer Release
Limits* (Monthly Avg)
TABLE A-6. Permitted Sanitary Outfalls of Radiological Analyses, CY 2010
Uranium-235 Min -7.17Uranium-235 Max 0.64
2069-A WW001 Uranium-238 -17.9 pCi/L 30002069-A WW001 Uranium-238 45.5 pCi/L 3000
Uranium-238 Average 13.80Uranium-238 StdDev 44.83Uranium-238 Min -17.90Uranium-238 Max 45.50
2069-K WW011 Actinium-228 -6.61 pCi/L 3000002069-K WW011 Actinium-228 -1.59 pCi/L 300000
Actinium-228 Average -4.10Actinium-228 StdDev 3.55Actinium-228 Min -6.61Actinium-228 Max -1.59
2069-K WW011 Alpha, gross 2.27 pCi/L2069-K WW011 Alpha, gross 2.29 pCi/L
Alpha, gross Average 2.28Alpha, gross StdDev 0.01Alpha, gross Min 2.27Alpha, gross Max 2.29
2069-K WW011 Americium-241 -7.51 pCi/L 2002069-K WW011 Americium-241 -2.97 pCi/L 200
Americium-241 Average -5.24Americium-241 StdDev 3.21Americium-241 Min -7.51Americium-241 Max -2.97
2069-K WW011 Beryllium-7 -10.4 pCi/L2069-K WW011 Beryllium-7 17 pCi/L
Beryllium-7 Average 3.30Beryllium-7 StdDev 19.37Beryllium-7 Min -10.40Beryllium-7 Max 17.00
2069-K WW011 Beta, gross 19.6 pCi/L2069-K WW011 Beta, gross 24.3 pCi/L

Permit Number Station Analyte Activity UnitsRegulatory Sewer Release
Limits* (Monthly Avg)
TABLE A-6. Permitted Sanitary Outfalls of Radiological Analyses, CY 2010
Beta, gross Average 21.95Beta, gross StdDev 3.32Beta, gross Min 19.60Beta, gross Max 24.30
2069-K WW011 Bismuth-212 -9.35 pCi/L2069-K WW011 Bismuth-212 10.4 pCi/L
Bismuth-212 Average 0.53Bismuth-212 StdDev 13.97Bismuth-212 Min -9.35Bismuth-212 Max 10.40
2069-K WW011 Bismuth-214 -2.54 pCi/L2069-K WW011 Bismuth-214 -1.26 pCi/L
Bismuth-214 Average -1.90Bismuth-214 StdDev 0.91Bismuth-214 Min -2.54Bismuth-214 Max -1.26
2069-K WW011 Cesium-137 -0.163 pCi/L 100002069-K WW011 Cesium-137 1.33 pCi/L 10000
Cesium-137 Average 0.58Cesium-137 StdDev 1.06Cesium-137 Min -0.16Cesium-137 Max 1.33
2069-K WW011 Cobalt-60 -0.533 pCi/L 300002069-K WW011 Cobalt-60 1.49 pCi/L 30000
Cobalt-60 Average 0.48Cobalt-60 StdDev 1.43Cobalt-60 Min -0.53Cobalt-60 Max 1.49
2069-K WW011 Lead-212 1.01 pCi/L 200002069-K WW011 Lead-212 7.35 pCi/L 20000
Lead-212 Average 4.18Lead-212 StdDev 4.48Lead-212 Min 1.01Lead-212 Max 7.35

Permit Number Station Analyte Activity UnitsRegulatory Sewer Release
Limits* (Monthly Avg)
TABLE A-6. Permitted Sanitary Outfalls of Radiological Analyses, CY 2010
2069-K WW011 Lead-214 -4.8 pCi/L 10000002069-K WW011 Lead-214 2.82 pCi/L 1000000.00
Lead-214 Average -0.99Lead-214 StdDev 5.39Lead-214 Min -4.80Lead-214 Max 2.82
2069-K WW011 Neptunium-237 -9.03 pCi/L2069-K WW011 Neptunium-237 0.644 pCi/L
Neptunium-237 Average -4.19Neptunium-237 StdDev 6.84Neptunium-237 Min -9.03Neptunium-237 Max 0.64
2069-K WW011 Potassium-40 4 pCi/L 400002069-K WW011 Potassium-40 46.2 pCi/L 40000
Potassium-40 Average 25.10Potassium-40 StdDev 29.84Potassium-40 Min 4.00Potassium-40 Max 46.20
2069-K WW011 Radium-223 -5.73 pCi/L2069-K WW011 Radium-223 -1.47 pCi/L
Radium-223 Average -3.60Radium-223 StdDev 3.01Radium-223 Min -5.73Radium-223 Max -1.47
2069-K WW011 Radium-224 24.5 pCi/L2069-K WW011 Radium-224 26 pCi/L
Radium-224 Average 25.25Radium-224 StdDev 1.06Radium-224 Min 24.50Radium-224 Max 26.00
2069-K WW011 Radium-226 -13.5 pCi/L 6002069-K WW011 Radium-226 14.3 pCi/L 600
Radium-226 Average 0.40Radium-226 StdDev 19.66

Permit Number Station Analyte Activity UnitsRegulatory Sewer Release
Limits* (Monthly Avg)
TABLE A-6. Permitted Sanitary Outfalls of Radiological Analyses, CY 2010
Radium-226 Min -13.50Radium-226 Max 14.30
2069-K WW011 Radium-228 -6.61 pCi/L 6002069-K WW011 Radium-228 -1.59 pCi/L 600
Radium-228 Average -4.10Radium-228 StdDev 3.55Radium-228 Min -6.61Radium-228 Max -1.59
2069-K WW011 Sodium-22 -1.41 pCi/L2069-K WW011 Sodium-22 1.8 pCi/L
Sodium-22 Average 0.20Sodium-22 StdDev 2.27Sodium-22 Min -1.41Sodium-22 Max 1.80
2069-K WW011 Thorium-227 -14.7 pCi/L2069-K WW011 Thorium-227 -9.02 pCi/L
Thorium-227 Average -11.86Thorium-227 StdDev 4.02Thorium-227 Min -14.70Thorium-227 Max -9.02
2069-K WW011 Thorium-231 5.29 pCi/L 3002069-K WW011 Thorium-231 38.9 pCi/L 300
Thorium-231 Average 22.10Thorium-231 StdDev 23.77Thorium-231 Min 5.29Thorium-231 Max 38.90
2069-K WW011 Thorium-234 -38.3 pCi/L 500002069-K WW011 Thorium-234 40.6 pCi/L 50000
Thorium-234 Average 1.15Thorium-234 StdDev 55.79Thorium-234 Min -38.30Thorium-234 Max 40.60
2069-K WW011 Tritium -27 pCi/L 100000002069-K WW011 Tritium 11.5 pCi/L 10000000

Permit Number Station Analyte Activity UnitsRegulatory Sewer Release
Limits* (Monthly Avg)
TABLE A-6. Permitted Sanitary Outfalls of Radiological Analyses, CY 2010
Tritium Average -7.75Tritium StdDev 27.22Tritium Min -27.00Tritium Max 11.50
2069-K WW011 Uranium-235 13.3 pCi/L 30002069-K WW011 Uranium-235 13.4 pCi/L 3000
Uranium-235 Average 13.35Uranium-235 StdDev 0.07Uranium-235 Min 13.30Uranium-235 Max 13.40
2069-K WW011 Uranium-238 -38.3 pCi/L 30002069-K WW011 Uranium-238 40.6 pCi/L 3000
Uranium-238 Average 1.15Uranium-238 StdDev 55.79Uranium-238 Min -38.30Uranium-238 Max 40.60
2069F-4 WW006 Actinium-228 3.54 pCi/L 3000002069F-4 WW006 Actinium-228 10.1 pCi/L 300000
Actinium-228 Average 6.82Actinium-228 StdDev 4.64Actinium-228 Min 3.54Actinium-228 Max 10.10
2069F-4 WW006 Alpha, gross 3.03 pCi/L2069F-4 WW006 Alpha, gross 6.17 pCi/L
Alpha, gross Average 4.60Alpha, gross StdDev 2.22Alpha, gross Min 3.03Alpha, gross Max 6.17
2069F-4 WW006 Americium-241 -25 pCi/L 2002069F-4 WW006 Americium-241 0.595 pCi/L 200
Americium-241 Average -12.20Americium-241 StdDev 18.10Americium-241 Min -25.00Americium-241 Max 0.60

Permit Number Station Analyte Activity UnitsRegulatory Sewer Release
Limits* (Monthly Avg)
TABLE A-6. Permitted Sanitary Outfalls of Radiological Analyses, CY 2010
2069F-4 WW006 Beryllium-7 -5.84 pCi/L2069F-4 WW006 Beryllium-7 6.9 pCi/L
Beryllium-7 Average 0.53Beryllium-7 StdDev 9.01Beryllium-7 Min -5.84Beryllium-7 Max 6.90
2069F-4 WW006 Beta, gross 0.792 pCi/L2069F-4 WW006 Beta, gross 8.69 pCi/L
Beta, gross Average 4.74Beta, gross StdDev 5.58Beta, gross Min 0.79Beta, gross Max 8.69
2069F-4 WW006 Bismuth-212 3.12 pCi/L2069F-4 WW006 Bismuth-212 8.62 pCi/L
Bismuth-212 Average 5.87Bismuth-212 StdDev 3.89Bismuth-212 Min 3.12Bismuth-212 Max 8.62
2069F-4 WW006 Bismuth-214 -5.36 pCi/L2069F-4 WW006 Bismuth-214 0.92 pCi/L
Bismuth-214 Average -2.22Bismuth-214 StdDev 4.44Bismuth-214 Min -5.36Bismuth-214 Max 0.92
2069F-4 WW006 Cesium-137 -0.194 pCi/L 100002069F-4 WW006 Cesium-137 0.742 pCi/L 10000
Cesium-137 Average 0.27Cesium-137 StdDev 0.66Cesium-137 Min -0.19Cesium-137 Max 0.74
2069F-4 WW006 Cobalt-60 -2.65 pCi/L 300002069F-4 WW006 Cobalt-60 1.09 pCi/L 30000
Cobalt-60 Average -0.78Cobalt-60 StdDev 2.64

Permit Number Station Analyte Activity UnitsRegulatory Sewer Release
Limits* (Monthly Avg)
TABLE A-6. Permitted Sanitary Outfalls of Radiological Analyses, CY 2010
Cobalt-60 Min -2.65Cobalt-60 Max 1.09
2069F-4 WW006 Lead-212 -0.607 pCi/L 200002069F-4 WW006 Lead-212 4.42 pCi/L 20000
Lead-212 Average 1.91Lead-212 StdDev 3.55Lead-212 Min -0.61Lead-212 Max 4.42
2069F-4 WW006 Lead-214 -4.96 pCi/L 10000002069F-4 WW006 Lead-214 3.91 pCi/L 1000000
Lead-214 Average -0.53Lead-214 StdDev 6.27Lead-214 Min -4.96Lead-214 Max 3.91
2069F-4 WW006 Neptunium-237 -9.62 pCi/L2069F-4 WW006 Neptunium-237 -1.50 pCi/L
Neptunium-237 Average -5.56Neptunium-237 StdDev 5.74Neptunium-237 Min -9.62Neptunium-237 Max -1.50
2069F-4 WW006 Potassium-40 -20.5 pCi/L 400002069F-4 WW006 Potassium-40 15.5 pCi/L 40000
Potassium-40 Average -2.50Potassium-40 StdDev 25.46Potassium-40 Min -20.50Potassium-40 Max 15.50
2069F-4 WW006 Radium-223 2.47 pCi/L2069F-4 WW006 Radium-223 19.8 pCi/L
Radium-223 Average 11.14Radium-223 StdDev 12.25Radium-223 Min 2.47Radium-223 Max 19.80
2069F-4 WW006 Radium-224 -46.9 pCi/L2069F-4 WW006 Radium-224 262 pCi/L

Permit Number Station Analyte Activity UnitsRegulatory Sewer Release
Limits* (Monthly Avg)
TABLE A-6. Permitted Sanitary Outfalls of Radiological Analyses, CY 2010
Radium-224 Average 107.55Radium-224 StdDev 218.43Radium-224 Min -46.90Radium-224 Max 262.00
2069F-4 WW006 Radium-226 -61.8 pCi/L 6002069F-4 WW006 Radium-226 -32.1 pCi/L 600
Radium-226 Average -46.95Radium-226 StdDev 21.00Radium-226 Min -61.80Radium-226 Max -32.10
2069F-4 WW006 Radium-228 3.54 pCi/L 6002069F-4 WW006 Radium-228 10.1 pCi/L 600
Radium-228 Average 6.82Radium-228 StdDev 4.64Radium-228 Min 3.54Radium-228 Max 10.10
2069F-4 WW006 Sodium-22 0.404 pCi/L2069F-4 WW006 Sodium-22 0.482 pCi/L
Sodium-22 Average 0.44Sodium-22 StdDev 0.06Sodium-22 Min 0.40Sodium-22 Max 0.48
2069F-4 WW006 Thorium-227 -7.51 pCi/L2069F-4 WW006 Thorium-227 -3.61 pCi/L
Thorium-227 Average -5.56Thorium-227 StdDev 2.76Thorium-227 Min -7.51Thorium-227 Max -3.61
2069F-4 WW006 Thorium-231 -12.4 pCi/L 3002069F-4 WW006 Thorium-231 14.4 pCi/L 300
Thorium-231 Average 1.00Thorium-231 StdDev 18.95Thorium-231 Min -12.40Thorium-231 Max 14.40

Permit Number Station Analyte Activity UnitsRegulatory Sewer Release
Limits* (Monthly Avg)
TABLE A-6. Permitted Sanitary Outfalls of Radiological Analyses, CY 2010
2069F-4 WW006 Thorium-234 -34.9 pCi/L 500002069F-4 WW006 Thorium-234 131 pCi/L 50000
Thorium-234 Average 48.05Thorium-234 StdDev 117.31Thorium-234 Min -34.90Thorium-234 Max 131.00
2069F-4 WW006 Tritium -53.1 pCi/L 100000002069F-4 WW006 Tritium -13.1 pCi/L 10000000
Tritium Average -33.10Tritium StdDev 28.28Tritium Min -53.10Tritium Max -13.10
2069F-4 WW006 Uranium-235 -2.57 pCi/L 30002069F-4 WW006 Uranium-235 2.32 pCi/L 3000
Uranium-235 Average -0.13Uranium-235 StdDev 3.46Uranium-235 Min -2.57Uranium-235 Max 2.32
2069F-4 WW006 Uranium-238 -34.9 pCi/L 30002069F-4 WW006 Uranium-238 131 pCi/L 3000
Uranium-238 Average 48.05Uranium-238 StdDev 117.31Uranium-238 Min -34.90Uranium-238 Max 131.00
2069I-3 WW008 Actinium-228 -14.5 pCi/L 3000002069I-3 WW008 Actinium-228 -0.671 pCi/L 300000
Actinium-228 Average -7.59Actinium-228 StdDev 9.78Actinium-228 Min -14.50Actinium-228 Max -0.67
2069I-3 WW008 Alpha, gross 1.41 pCi/L2069I-3 WW008 Alpha, gross 1.54 pCi/L
Alpha, gross Average 1.48Alpha, gross StdDev 0.09

Permit Number Station Analyte Activity UnitsRegulatory Sewer Release
Limits* (Monthly Avg)
TABLE A-6. Permitted Sanitary Outfalls of Radiological Analyses, CY 2010
Alpha, gross Min 1.41Alpha, gross Max 1.54
2069I-3 WW008 Americium-241 -9.27 pCi/L 2002069I-3 WW008 Americium-241 3.55 pCi/L 200
Americium-241 Average -2.86Americium-241 StdDev 9.07Americium-241 Min -9.27Americium-241 Max 3.55
2069I-3 WW008 Beryllium-7 -18 pCi/L2069I-3 WW008 Beryllium-7 -2.46 pCi/L
Beryllium-7 Average -10.23Beryllium-7 StdDev 10.99Beryllium-7 Min -18.00Beryllium-7 Max -2.46
2069I-3 WW008 Beta, gross 21 pCi/L2069I-3 WW008 Beta, gross 25.2 pCi/L
Beta, gross Average 23.10Beta, gross StdDev 2.97Beta, gross Min 21.00Beta, gross Max 25.20
2069I-3 WW008 Bismuth-212 0.238 pCi/L2069I-3 WW008 Bismuth-212 28.8 pCi/L
Bismuth-212 Average 14.52Bismuth-212 StdDev 20.20Bismuth-212 Min 0.24Bismuth-212 Max 28.80
2069I-3 WW008 Bismuth-214 -5.93 pCi/L2069I-3 WW008 Bismuth-214 2.28 pCi/L
Bismuth-214 Average -1.83Bismuth-214 StdDev 5.81Bismuth-214 Min -5.93Bismuth-214 Max 2.28
2069I-3 WW008 Cesium-137 -0.295 pCi/L 100002069I-3 WW008 Cesium-137 1.26 pCi/L 10000

Permit Number Station Analyte Activity UnitsRegulatory Sewer Release
Limits* (Monthly Avg)
TABLE A-6. Permitted Sanitary Outfalls of Radiological Analyses, CY 2010
Cesium-137 Average 0.48Cesium-137 StdDev 1.10Cesium-137 Min -0.30Cesium-137 Max 1.26
2069I-3 WW008 Cobalt-60 -4.34 pCi/L 300002069I-3 WW008 Cobalt-60 0.0096 pCi/L 30000
Cobalt-60 Average -2.17Cobalt-60 StdDev 3.08Cobalt-60 Min -4.34Cobalt-60 Max 0.01
2069I-3 WW008 Lead-212 3.17 pCi/L 200002069I-3 WW008 Lead-212 4.05 pCi/L 20000
Lead-212 Average 3.61Lead-212 StdDev 0.62Lead-212 Min 3.17Lead-212 Max 4.05
2069I-3 WW008 Lead-214 -5.27 pCi/L 10000002069I-3 WW008 Lead-214 0.14 pCi/L 1000000
Lead-214 Average -2.57Lead-214 StdDev 3.83Lead-214 Min -5.27Lead-214 Max 0.14
2069I-3 WW008 Neptunium-237 -6.72 pCi/L2069I-3 WW008 Neptunium-237 3.55 pCi/L
Neptunium-237 Average -1.59Neptunium-237 StdDev 7.26Neptunium-237 Min -6.72Neptunium-237 Max 3.55
2069I-3 WW008 Potassium-40 54.4 pCi/L 400002069I-3 WW008 Potassium-40 56.8 pCi/L 40000
Potassium-40 Average 55.60Potassium-40 StdDev 1.70Potassium-40 Min 54.40Potassium-40 Max 56.80

Permit Number Station Analyte Activity UnitsRegulatory Sewer Release
Limits* (Monthly Avg)
TABLE A-6. Permitted Sanitary Outfalls of Radiological Analyses, CY 2010
2069I-3 WW008 Radium-223 -5.34 pCi/L2069I-3 WW008 Radium-223 8.85 pCi/L
Radium-223 Average 1.76Radium-223 StdDev 10.03Radium-223 Min -5.34Radium-223 Max 8.85
2069I-3 WW008 Radium-224 -53 pCi/L2069I-3 WW008 Radium-224 73.4 pCi/L
Radium-224 Average 10.20Radium-224 StdDev 89.38Radium-224 Min -53.00Radium-224 Max 73.40
2069I-3 WW008 Radium-226 -12.4 pCi/L 6002069I-3 WW008 Radium-226 24.7 pCi/L 600
Radium-226 Average 6.15Radium-226 StdDev 26.23Radium-226 Min -12.40Radium-226 Max 24.70
2069I-3 WW008 Radium-228 -14.5 pCi/L 6002069I-3 WW008 Radium-228 -0.671 pCi/L 600
Radium-228 Average -7.59Radium-228 StdDev 9.78Radium-228 Min -14.50Radium-228 Max -0.67
2069I-3 WW008 Sodium-22 -1.09 pCi/L2069I-3 WW008 Sodium-22 1.68 pCi/L
Sodium-22 Average 0.30Sodium-22 StdDev 1.96Sodium-22 Min -1.09Sodium-22 Max 1.68
2069I-3 WW008 Thorium-227 -16.6 pCi/L2069I-3 WW008 Thorium-227 -4.55 pCi/L
Thorium-227 Average -10.58Thorium-227 StdDev 8.52
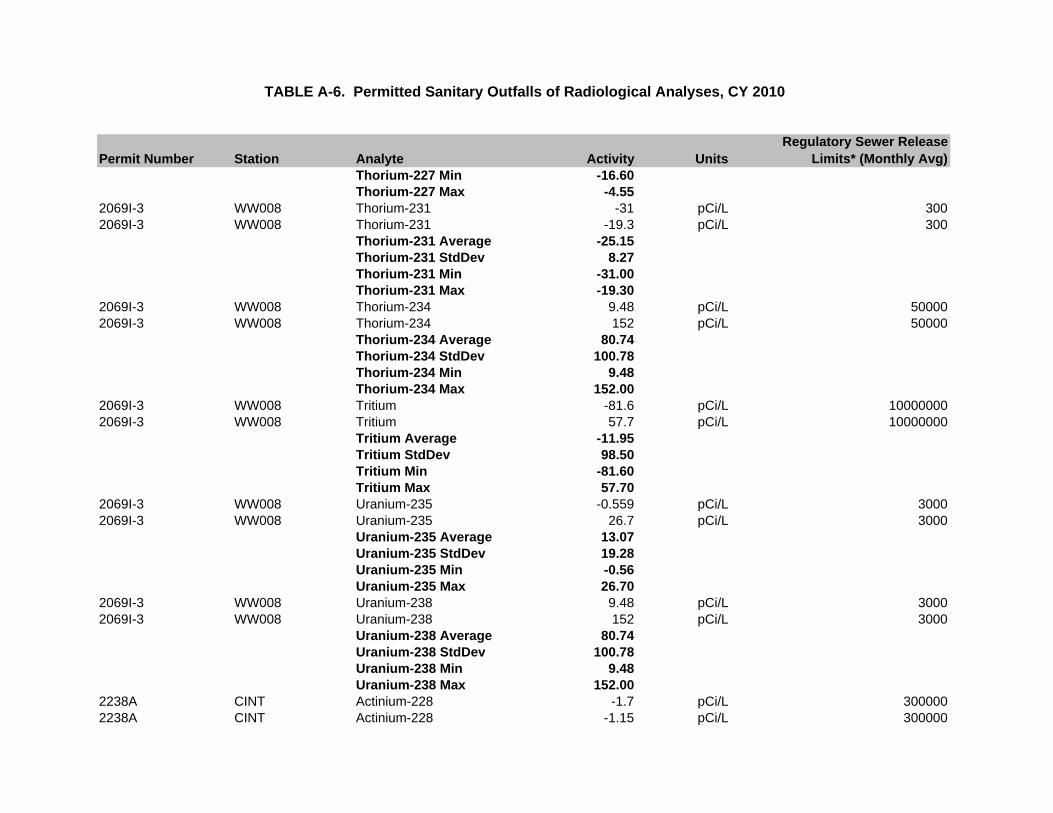
Permit Number Station Analyte Activity UnitsRegulatory Sewer Release
Limits* (Monthly Avg)
TABLE A-6. Permitted Sanitary Outfalls of Radiological Analyses, CY 2010
Thorium-227 Min -16.60Thorium-227 Max -4.55
2069I-3 WW008 Thorium-231 -31 pCi/L 3002069I-3 WW008 Thorium-231 -19.3 pCi/L 300
Thorium-231 Average -25.15Thorium-231 StdDev 8.27Thorium-231 Min -31.00Thorium-231 Max -19.30
2069I-3 WW008 Thorium-234 9.48 pCi/L 500002069I-3 WW008 Thorium-234 152 pCi/L 50000
Thorium-234 Average 80.74Thorium-234 StdDev 100.78Thorium-234 Min 9.48Thorium-234 Max 152.00
2069I-3 WW008 Tritium -81.6 pCi/L 100000002069I-3 WW008 Tritium 57.7 pCi/L 10000000
Tritium Average -11.95Tritium StdDev 98.50Tritium Min -81.60Tritium Max 57.70
2069I-3 WW008 Uranium-235 -0.559 pCi/L 30002069I-3 WW008 Uranium-235 26.7 pCi/L 3000
Uranium-235 Average 13.07Uranium-235 StdDev 19.28Uranium-235 Min -0.56Uranium-235 Max 26.70
2069I-3 WW008 Uranium-238 9.48 pCi/L 30002069I-3 WW008 Uranium-238 152 pCi/L 3000
Uranium-238 Average 80.74Uranium-238 StdDev 100.78Uranium-238 Min 9.48Uranium-238 Max 152.00
2238A CINT Actinium-228 -1.7 pCi/L 3000002238A CINT Actinium-228 -1.15 pCi/L 300000

Permit Number Station Analyte Activity UnitsRegulatory Sewer Release
Limits* (Monthly Avg)
TABLE A-6. Permitted Sanitary Outfalls of Radiological Analyses, CY 2010
Actinium-228 Average -1.43Actinium-228 StdDev 0.39Actinium-228 Min -1.70Actinium-228 Max -1.15
2238A CINT Alpha, gross 1.99 pCi/L2238A CINT Alpha, gross 5.91 pCi/L
Alpha, gross Average 3.95Alpha, gross StdDev 2.77Alpha, gross Min 1.99Alpha, gross Max 5.91
2238A CINT Americium-241 -3.73 pCi/L 2002238A CINT Americium-241 -2.69 pCi/L 200
Americium-241 Average -3.21Americium-241 StdDev 0.74Americium-241 Min -3.73Americium-241 Max -2.69
2238A CINT Beryllium-7 -4.07 pCi/L2238A CINT Beryllium-7 -2.67 pCi/L
Beryllium-7 Average -3.37Beryllium-7 StdDev 0.99Beryllium-7 Min -4.07Beryllium-7 Max -2.67
2238A CINT Beta, gross 3.25 pCi/L2238A CINT Beta, gross 7.73 pCi/L
Beta, gross Average 5.49Beta, gross StdDev 3.17Beta, gross Min 3.25Beta, gross Max 7.73
2238A CINT Bismuth-212 29.7 pCi/L2238A CINT Bismuth-212 50.1 pCi/L
Bismuth-212 Average 39.90Bismuth-212 StdDev 14.42Bismuth-212 Min 29.70Bismuth-212 Max 50.10
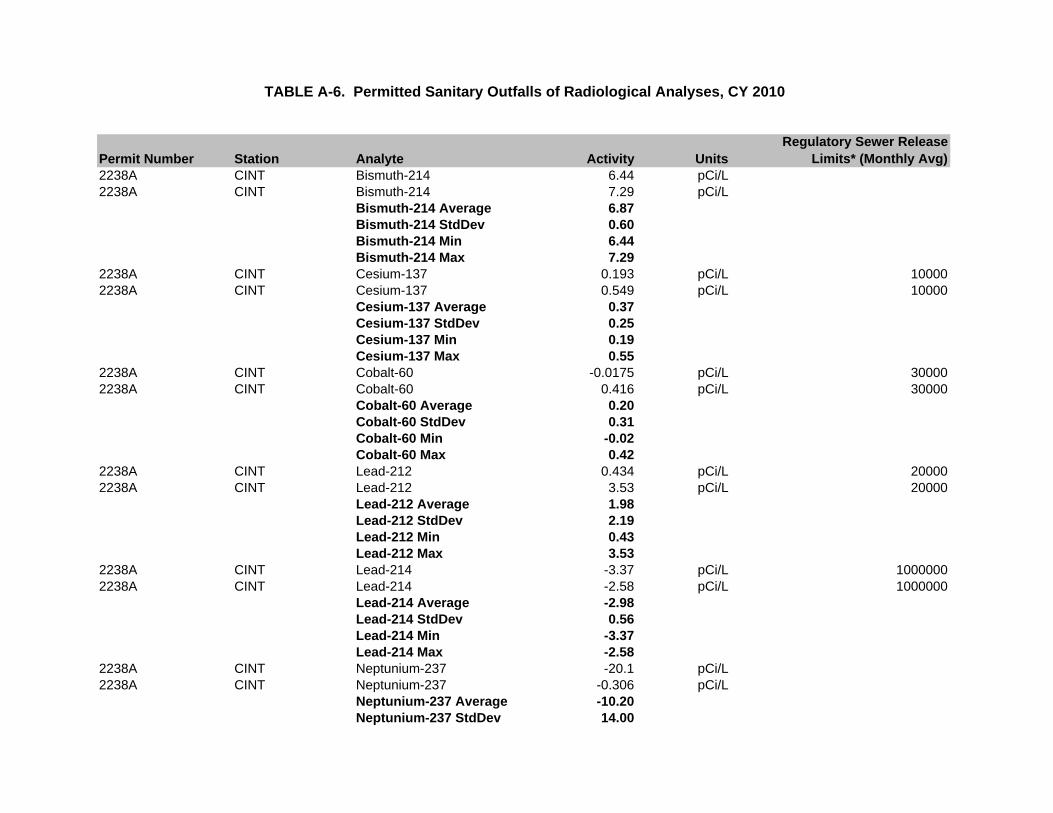
Permit Number Station Analyte Activity UnitsRegulatory Sewer Release
Limits* (Monthly Avg)
TABLE A-6. Permitted Sanitary Outfalls of Radiological Analyses, CY 2010
2238A CINT Bismuth-214 6.44 pCi/L2238A CINT Bismuth-214 7.29 pCi/L
Bismuth-214 Average 6.87Bismuth-214 StdDev 0.60Bismuth-214 Min 6.44Bismuth-214 Max 7.29
2238A CINT Cesium-137 0.193 pCi/L 100002238A CINT Cesium-137 0.549 pCi/L 10000
Cesium-137 Average 0.37Cesium-137 StdDev 0.25Cesium-137 Min 0.19Cesium-137 Max 0.55
2238A CINT Cobalt-60 -0.0175 pCi/L 300002238A CINT Cobalt-60 0.416 pCi/L 30000
Cobalt-60 Average 0.20Cobalt-60 StdDev 0.31Cobalt-60 Min -0.02Cobalt-60 Max 0.42
2238A CINT Lead-212 0.434 pCi/L 200002238A CINT Lead-212 3.53 pCi/L 20000
Lead-212 Average 1.98Lead-212 StdDev 2.19Lead-212 Min 0.43Lead-212 Max 3.53
2238A CINT Lead-214 -3.37 pCi/L 10000002238A CINT Lead-214 -2.58 pCi/L 1000000
Lead-214 Average -2.98Lead-214 StdDev 0.56Lead-214 Min -3.37Lead-214 Max -2.58
2238A CINT Neptunium-237 -20.1 pCi/L2238A CINT Neptunium-237 -0.306 pCi/L
Neptunium-237 Average -10.20Neptunium-237 StdDev 14.00

Permit Number Station Analyte Activity UnitsRegulatory Sewer Release
Limits* (Monthly Avg)
TABLE A-6. Permitted Sanitary Outfalls of Radiological Analyses, CY 2010
Neptunium-237 Min -20.10Neptunium-237 Max -0.31
2238A CINT Potassium-40 2.77 pCi/L 400002238A CINT Potassium-40 8.92 pCi/L 40000
Potassium-40 Average 5.85Potassium-40 StdDev 4.35Potassium-40 Min 2.77Potassium-40 Max 8.92
2238A CINT Radium-223 12.3 pCi/L2238A CINT Radium-223 13.9 pCi/L
Radium-223 Average 13.10Radium-223 StdDev 1.13Radium-223 Min 12.30Radium-223 Max 13.90
2238A CINT Radium-224 -102 pCi/L2238A CINT Radium-224 36.6 pCi/L
Radium-224 Average -32.70Radium-224 StdDev 98.00Radium-224 Min -102.00Radium-224 Max 36.60
2238A CINT Radium-226 -29.1 pCi/L 6002238A CINT Radium-226 -1.54 pCi/L 600
Radium-226 Average -15.32Radium-226 StdDev 19.49Radium-226 Min -29.10Radium-226 Max -1.54
2238A CINT Radium-228 -1.7 pCi/L 6002238A CINT Radium-228 -1.15 pCi/L 600
Radium-228 Average -1.43Radium-228 StdDev 0.39Radium-228 Min -1.70Radium-228 Max -1.15
2238A CINT Sodium-22 1.28 pCi/L2238A CINT Sodium-22 1.88 pCi/L

Permit Number Station Analyte Activity UnitsRegulatory Sewer Release
Limits* (Monthly Avg)
TABLE A-6. Permitted Sanitary Outfalls of Radiological Analyses, CY 2010
Sodium-22 Average 1.58Sodium-22 StdDev 0.42Sodium-22 Min 1.28Sodium-22 Max 1.88
2238A CINT Thorium-227 -6.54 pCi/L2238A CINT Thorium-227 1.51 pCi/L
Thorium-227 Average -2.52Thorium-227 StdDev 5.69Thorium-227 Min -6.54Thorium-227 Max 1.51
2238A CINT Thorium-231 -32.9 pCi/L 3002238A CINT Thorium-231 -21.6 pCi/L 300
Thorium-231 Average -27.25Thorium-231 StdDev 7.99Thorium-231 Min -32.90Thorium-231 Max -21.60
2238A CINT Thorium-234 -10.7 pCi/L 500002238A CINT Thorium-234 16.9 pCi/L 50000
Thorium-234 Average 3.10Thorium-234 StdDev 19.52Thorium-234 Min -10.70Thorium-234 Max 16.90
2238A CINT Tritium -19.1 pCi/L 100000002238A CINT Tritium -17.3 pCi/L 10000000
Tritium Average -18.20Tritium StdDev 1.27Tritium Min -19.10Tritium Max -17.30
2238A CINT Uranium-235 -12.5 pCi/L 30002238A CINT Uranium-235 4.49 pCi/L 3000
Uranium-235 Average -4.01Uranium-235 StdDev 12.01Uranium-235 Min -12.50Uranium-235 Max 4.49

Permit Number Station Analyte Activity UnitsRegulatory Sewer Release
Limits* (Monthly Avg)
TABLE A-6. Permitted Sanitary Outfalls of Radiological Analyses, CY 2010
2238A CINT Uranium-238 -10.7 pCi/L 30002238A CINT Uranium-238 16.9 pCi/L 3000
Uranium-238 Average 3.10Uranium-238 StdDev 19.52Uranium-238 Min -10.70Uranium-238 Max 16.90
NOTES: COA = City of Albuquerque Min = Minimum Max = Maximum pCi/L = picocuries per liter StdDev = Standard Deviation * = The monthly average concentration values for release of sanitary sewage were derived by taking the most
restrictive occupational stochastic oral ingestion annual limits on intake (ALT) for a reference mean.

StationPermit
NumberDate
Collected Sample ID Analyte Result MDLLab Data Qualifier Units
Regulatory Limit (COA)
CINT 2238A 24-Aug-10 089590-001 Aluminum 0.068 U mg/L 900CINT 2238A 24-Aug-10 089590-001 Arsenic 0.0195 0.005 J mg/L 0.051CINT 2238A 24-Aug-10 089590-001 Boron 0.164 0.015 mg/LCINT 2238A 24-Aug-10 089590-001 Cadmium 0.001 U mg/L 0.5CINT 2238A 24-Aug-10 089590-001 Chromium 0.00613 0.001 mg/L 4.1CINT 2238A 24-Aug-10 089590-001 Copper 0.0133 0.003 mg/L 5.3CINT 2238A 24-Aug-10 089590-002 Fluoride 2.02 0.033 mg/L 36CINT 2238A 24-Aug-10 089590-001 Lead 0.0033 U mg/L 1CINT 2238A 24-Aug-10 089590-001 Molybdenum 0.0302 0.002 mg/L 2CINT 2238A 24-Aug-10 089590-001 Nickel 0.0015 U mg/L 2CINT 2238A 24-Aug-10 089590-001 Selenium 0.005 U mg/L 0.46CINT 2238A 24-Aug-10 089590-001 Silver 0.001 U mg/L 5CINT 2238A 24-Aug-10 089590-001 Zinc 0.0033 U mg/L 2.2CINT 2238A 25-Aug-10 089591-001 Aluminum 0.068 U mg/L 900CINT 2238A 25-Aug-10 089591-001 Arsenic 0.0182 0.005 J mg/L 0.051CINT 2238A 25-Aug-10 089591-001 Boron 0.155 0.015 mg/LCINT 2238A 25-Aug-10 089591-001 Cadmium 0.001 U mg/L 0.5CINT 2238A 25-Aug-10 089591-001 Chromium 0.00586 0.001 mg/L 4.1CINT 2238A 25-Aug-10 089591-001 Copper 0.0162 0.003 mg/L 5.3CINT 2238A 25-Aug-10 089592-001 Cyanide, total 0.0017 U mg/L 0.45CINT 2238A 25-Aug-10 089592-002 Cyanide, total 0.0017 U mg/L 0.45CINT 2238A 25-Aug-10 089592-003 Cyanide, total 0.0017 U mg/L 0.45CINT 2238A 25-Aug-10 089592-004 Cyanide, total 0.0017 U mg/L 0.45CINT 2238A 25-Aug-10 089591-002 Fluoride 1.96 0.033 mg/L 36CINT 2238A 25-Aug-10 089591-001 Lead 0.0033 U mg/L 1CINT 2238A 25-Aug-10 089591-001 Molybdenum 0.0255 0.002 mg/L 2CINT 2238A 25-Aug-10 089591-001 Nickel 0.0015 U mg/L 2CINT 2238A 25-Aug-10 089591-001 Selenium 0.005 U mg/L 0.46CINT 2238A 25-Aug-10 089591-001 Silver 0.001 U mg/L 5CINT 2238A 25-Aug-10 089591-001 Zinc 0.0033 U mg/L 2.2CINT 2238A 26-Oct-10 089599-005 Ammonia 0.072 0.016 mg/LCINT 2238A 27-Oct-10 089605-001 Ammonia 0.127 0.016 mg/LWW001 2069-A 26-Oct-10 089593-001 Aluminum 0.0708 0.068 J mg/L 900WW001 2069-A 26-Oct-10 089593-007 Ammonia 8.71 0.16 mg/L
TABLE A-7. Permitted Sanitary Outfalls of Inorganic Analyses, August 2010 and October 2010

StationPermit
NumberDate
Collected Sample ID Analyte Result MDLLab Data Qualifier Units
Regulatory Limit (COA)
TABLE A-7. Permitted Sanitary Outfalls of Inorganic Analyses, August 2010 and October 2010
WW001 2069-A 26-Oct-10 089593-001 Arsenic 0.00765 0.005 J mg/L 0.051WW001 2069-A 26-Oct-10 089593-001 Boron 0.0869 0.015 mg/LWW001 2069-A 26-Oct-10 089593-001 Cadmium 0.001 U mg/L 0.5WW001 2069-A 26-Oct-10 089593-001 Chromium 0.00376 0.001 J mg/L 4.1WW001 2069-A 26-Oct-10 089593-001 Copper 0.0421 0.003 mg/L 5.3WW001 2069-A 26-Oct-10 089593-002 Fluoride 1.63 0.033 mg/L 36WW001 2069-A 26-Oct-10 089593-001 Lead 0.00392 0.0033 J mg/L 1WW001 2069-A 26-Oct-10 089593-001 Molybdenum 0.0946 0.002 mg/L 2WW001 2069-A 26-Oct-10 089593-001 Nickel 0.00326 0.0015 J mg/L 2WW001 2069-A 26-Oct-10 089593-001 Selenium 0.00785 0.005 J mg/L 0.46WW001 2069-A 26-Oct-10 089593-001 Silver 0.001 U mg/L 5WW001 2069-A 26-Oct-10 089593-001 Zinc 0.0419 0.0033 mg/L 2.2WW001 2069-A 27-Oct-10 089600-001 Aluminum 0.0971 0.068 J mg/L 900WW001 2069-A 27-Oct-10 089600-003 Ammonia 11.3 0.16 mg/LWW001 2069-A 27-Oct-10 089600-001 Arsenic 0.0327 0.005 mg/L 0.051WW001 2069-A 27-Oct-10 089600-001 Boron 0.0785 0.015 mg/LWW001 2069-A 27-Oct-10 089600-001 Cadmium 0.001 U mg/L 0.5WW001 2069-A 27-Oct-10 089600-001 Chromium 0.00351 0.001 J mg/L 4.1WW001 2069-A 27-Oct-10 089600-001 Copper 0.0616 0.003 mg/L 5.3WW001 2069-A 27-Oct-10 089600-002 Fluoride 2.11 0.033 mg/L 36WW001 2069-A 27-Oct-10 089600-001 Lead 0.0033 U mg/L 1WW001 2069-A 27-Oct-10 089600-001 Molybdenum 0.0896 0.002 mg/L 2WW001 2069-A 27-Oct-10 089600-001 Nickel 0.00156 0.0015 J mg/L 2WW001 2069-A 27-Oct-10 089600-001 Selenium 0.005 U mg/L 0.46WW001 2069-A 27-Oct-10 089600-001 Silver 0.001 U mg/L 5WW001 2069-A 27-Oct-10 089600-001 Zinc 0.0406 0.0033 mg/L 2.2WW006 2069F-4 25-Oct-10 089606-001 Cyanide, total 0.0017 U mg/L 0.45WW006 2069F-4 25-Oct-10 089606-002 Cyanide, total 0.00568 0.0017 mg/L 0.45WW006 2069F-4 25-Oct-10 089606-003 Cyanide, total 0.0017 U mg/L 0.45WW006 2069F-4 25-Oct-10 089606-004 Cyanide, total 0.00172 0.0017 J mg/L 0.45WW006 2069F-4 26-Oct-10 089594-001 Aluminum 0.127 0.068 J mg/L 900WW006 2069F-4 26-Oct-10 089594-007 Ammonia 30.1 0.8 mg/LWW006 2069F-4 26-Oct-10 089594-001 Arsenic 0.00514 0.005 J mg/L 0.051WW006 2069F-4 26-Oct-10 089594-001 Boron 0.16 0.015 mg/L

StationPermit
NumberDate
Collected Sample ID Analyte Result MDLLab Data Qualifier Units
Regulatory Limit (COA)
TABLE A-7. Permitted Sanitary Outfalls of Inorganic Analyses, August 2010 and October 2010
WW006 2069F-4 26-Oct-10 089594-001 Cadmium 0.001 U mg/L 0.5WW006 2069F-4 26-Oct-10 089594-001 Chromium 0.00296 0.001 J mg/L 4.1WW006 2069F-4 26-Oct-10 089594-001 Copper 0.0196 0.003 mg/L 5.3WW006 2069F-4 26-Oct-10 089594-002 Fluoride 0.907 0.033 mg/L 36WW006 2069F-4 26-Oct-10 089594-001 Lead 0.0033 U mg/L 1WW006 2069F-4 26-Oct-10 089594-001 Molybdenum 0.0754 0.002 mg/L 2WW006 2069F-4 26-Oct-10 089594-001 Nickel 0.00226 0.0015 J mg/L 2WW006 2069F-4 26-Oct-10 089594-001 Selenium 0.00996 0.005 J mg/L 0.46WW006 2069F-4 26-Oct-10 089594-001 Silver 0.001 U mg/L 5WW006 2069F-4 26-Oct-10 089594-001 Zinc 0.0589 0.0033 mg/L 2.2WW006 2069F-4 27-Oct-10 089601-001 Aluminum 0.145 0.068 J mg/L 900WW006 2069F-4 27-Oct-10 089601-003 Ammonia 37.2 0.8 mg/LWW006 2069F-4 27-Oct-10 089601-001 Arsenic 0.0295 0.005 J mg/L 0.051WW006 2069F-4 27-Oct-10 089601-001 Boron 0.0847 0.015 mg/LWW006 2069F-4 27-Oct-10 089601-001 Cadmium 0.001 U mg/L 0.5WW006 2069F-4 27-Oct-10 089601-001 Chromium 0.00224 0.001 J mg/L 4.1WW006 2069F-4 27-Oct-10 089601-001 Copper 0.0335 0.003 mg/L 5.3WW006 2069F-4 27-Oct-10 089601-002 Fluoride 0.744 0.033 mg/L 36WW006 2069F-4 27-Oct-10 089601-001 Lead 0.0033 U mg/L 1WW006 2069F-4 27-Oct-10 089601-001 Molybdenum 0.0508 0.002 mg/L 2WW006 2069F-4 27-Oct-10 089601-001 Nickel 0.0015 U mg/L 2WW006 2069F-4 27-Oct-10 089601-001 Selenium 0.00793 0.005 J mg/L 0.46WW006 2069F-4 27-Oct-10 089601-001 Silver 0.001 U mg/L 5WW006 2069F-4 27-Oct-10 089601-001 Zinc 0.0671 0.0033 mg/L 2.2WW006 #2 2069F-4 26-Oct-10 089643-001 Cyanide, total 0.00371 0.0017 J mg/L 0.45WW006 #2 2069F-4 26-Oct-10 089643-002 Cyanide, total 0.0017 U mg/L 0.45WW006 #2 2069F-4 26-Oct-10 089643-003 Cyanide, total 0.0017 U mg/L 0.45WW006 #2 2069F-4 26-Oct-10 089643-004 Cyanide, total 0.0017 U mg/L 0.45WW007 2069G-2 24-Aug-10 089582-001 Arsenic 0.0114 0.005 J mg/L 0.051WW007 2069G-2 25-Aug-10 089583-001 Arsenic 0.0108 0.005 J mg/L 0.051WW007 2069G-2 26-Aug-10 089584-001 Arsenic 0.00971 0.005 J mg/L 0.051WW007 2069G-2 27-Aug-10 089585-001 Arsenic 0.011 0.005 J mg/L 0.051WW007 2069G-2 25-Oct-10 089607-001 Cyanide, total 0.0017 U mg/L 0.45WW007 2069G-2 25-Oct-10 089607-002 Cyanide, total 0.0017 U mg/L 0.45

StationPermit
NumberDate
Collected Sample ID Analyte Result MDLLab Data Qualifier Units
Regulatory Limit (COA)
TABLE A-7. Permitted Sanitary Outfalls of Inorganic Analyses, August 2010 and October 2010
WW007 2069G-2 25-Oct-10 089607-003 Cyanide, total 0.0017 U mg/L 0.45WW007 2069G-2 25-Oct-10 089607-004 Cyanide, total 0.0017 U mg/L 0.45WW007 2069G-2 26-Oct-10 089595-001 Aluminum 0.068 U mg/L 900WW007 2069G-2 26-Oct-10 089595-004 Ammonia 1.47 0.016 mg/LWW007 2069G-2 26-Oct-10 089595-001 Arsenic 0.005 U mg/L 0.051WW007 2069G-2 26-Oct-10 089595-001 Boron 0.0324 0.015 J mg/LWW007 2069G-2 26-Oct-10 089595-001 Cadmium 0.001 U mg/L 0.5WW007 2069G-2 26-Oct-10 089595-001 Chromium 0.00237 0.001 J mg/L 4.1WW007 2069G-2 26-Oct-10 089595-001 Copper 0.003 U mg/L 5.3WW007 2069G-2 26-Oct-10 089595-002 Fluoride 1.63 0.033 mg/L 36WW007 2069G-2 26-Oct-10 089595-001 Lead 0.0033 U mg/L 1WW007 2069G-2 26-Oct-10 089595-001 Molybdenum 0.0313 0.002 mg/L 2WW007 2069G-2 26-Oct-10 089595-001 Nickel 0.0015 U mg/L 2WW007 2069G-2 26-Oct-10 089595-001 Selenium 0.0064 0.005 J mg/L 0.46WW007 2069G-2 26-Oct-10 089595-001 Silver 0.001 U mg/L 5WW007 2069G-2 26-Oct-10 089595-001 Zinc 0.00423 0.0033 J mg/L 2.2WW007 2069G-2 27-Oct-10 089602-001 Aluminum 0.068 U mg/L 900WW007 2069G-2 27-Oct-10 089602-003 Ammonia 6.18 0.08 mg/LWW007 2069G-2 27-Oct-10 089602-001 Arsenic 0.0226 0.005 J mg/L 0.051WW007 2069G-2 27-Oct-10 089602-001 Boron 0.0663 0.015 mg/LWW007 2069G-2 27-Oct-10 089602-001 Cadmium 0.001 U mg/L 0.5WW007 2069G-2 27-Oct-10 089602-001 Chromium 0.00254 0.001 J mg/L 4.1WW007 2069G-2 27-Oct-10 089602-001 Copper 0.003 U mg/L 5.3WW007 2069G-2 27-Oct-10 089602-002 Fluoride 2.06 0.033 mg/L 36WW007 2069G-2 27-Oct-10 089602-001 Lead 0.0165 U mg/L 1WW007 2069G-2 27-Oct-10 089602-001 Molybdenum 0.0189 0.002 mg/L 2WW007 2069G-2 27-Oct-10 089602-001 Nickel 0.00166 0.0015 J mg/L 2WW007 2069G-2 27-Oct-10 089602-001 Selenium 0.00732 0.005 J mg/L 0.46WW007 2069G-2 27-Oct-10 089602-001 Silver 0.001 U mg/L 5WW007 2069G-2 27-Oct-10 089602-001 Zinc 0.0033 U mg/L 2.2WW008 2069I-3 25-Oct-10 089608-001 Cyanide, total 0.00231 0.0017 J mg/L 0.45WW008 2069I-3 25-Oct-10 089608-002 Cyanide, total 0.00458 0.0017 J mg/L 0.45WW008 2069I-3 25-Oct-10 089608-003 Cyanide, total 0.00382 0.0017 J mg/L 0.45WW008 2069I-3 25-Oct-10 089608-004 Cyanide, total 0.00215 0.0017 J mg/L 0.45

StationPermit
NumberDate
Collected Sample ID Analyte Result MDLLab Data Qualifier Units
Regulatory Limit (COA)
TABLE A-7. Permitted Sanitary Outfalls of Inorganic Analyses, August 2010 and October 2010
WW008 2069I-3 26-Oct-10 089596-001 Aluminum 0.355 0.068 mg/L 900WW008 2069I-3 26-Oct-10 089596-007 Ammonia 67 0.8 mg/LWW008 2069I-3 26-Oct-10 089596-001 Arsenic 0.005 U mg/L 0.051WW008 2069I-3 26-Oct-10 089596-001 Boron 0.105 0.015 mg/LWW008 2069I-3 26-Oct-10 089596-001 Cadmium 0.001 U mg/L 0.5WW008 2069I-3 26-Oct-10 089596-001 Chromium 0.00285 0.001 J mg/L 4.1WW008 2069I-3 26-Oct-10 089596-001 Copper 0.0424 0.003 mg/L 5.3WW008 2069I-3 26-Oct-10 089596-002 Fluoride 0.648 0.033 mg/L 36WW008 2069I-3 26-Oct-10 089596-001 Lead 0.00537 0.0033 J mg/L 1WW008 2069I-3 26-Oct-10 089596-001 Molybdenum 0.00575 0.002 J mg/L 2WW008 2069I-3 26-Oct-10 089596-001 Nickel 0.00611 0.0015 mg/L 2WW008 2069I-3 26-Oct-10 089596-001 Selenium 0.00886 0.005 J mg/L 0.46WW008 2069I-3 26-Oct-10 089596-001 Silver 0.001 U mg/L 5WW008 2069I-3 26-Oct-10 089596-001 Zinc 0.105 0.0033 mg/L 2.2WW008 2069I-3 27-Oct-10 089603-001 Aluminum 0.0917 0.068 J mg/L 900WW008 2069I-3 27-Oct-10 089603-003 Ammonia 57.4 0.8 mg/LWW008 2069I-3 27-Oct-10 089603-001 Arsenic 0.0276 0.005 J mg/L 0.051WW008 2069I-3 27-Oct-10 089603-001 Boron 0.0909 0.015 mg/LWW008 2069I-3 27-Oct-10 089603-001 Cadmium 0.001 U mg/L 0.5WW008 2069I-3 27-Oct-10 089603-001 Chromium 0.00197 0.001 J mg/L 4.1WW008 2069I-3 27-Oct-10 089603-001 Copper 0.0238 0.003 mg/L 5.3WW008 2069I-3 27-Oct-10 089603-002 Fluoride 0.637 0.033 mg/L 36WW008 2069I-3 27-Oct-10 089603-001 Lead 0.0033 U mg/L 1WW008 2069I-3 27-Oct-10 089603-001 Molybdenum 0.00352 0.002 J mg/L 2WW008 2069I-3 27-Oct-10 089603-001 Nickel 0.00295 0.0015 J mg/L 2WW008 2069I-3 27-Oct-10 089603-001 Selenium 0.005 U mg/L 0.46WW008 2069I-3 27-Oct-10 089603-001 Silver 0.001 U mg/L 5WW008 2069I-3 27-Oct-10 089603-001 Zinc 0.0668 0.0033 mg/L 2.2WW011 2069-K 26-Oct-10 089597-001 Aluminum 0.25 0.068 mg/L 900WW011 2069-K 26-Oct-10 089597-007 Ammonia 21.6 0.8 mg/LWW011 2069-K 26-Oct-10 089597-001 Arsenic 0.005 U mg/L 0.051WW011 2069-K 26-Oct-10 089597-001 Boron 0.113 0.015 mg/LWW011 2069-K 26-Oct-10 089597-001 Cadmium 0.001 U mg/L 0.5WW011 2069-K 26-Oct-10 089597-001 Chromium 0.00665 0.001 mg/L 4.1

StationPermit
NumberDate
Collected Sample ID Analyte Result MDLLab Data Qualifier Units
Regulatory Limit (COA)
TABLE A-7. Permitted Sanitary Outfalls of Inorganic Analyses, August 2010 and October 2010
WW011 2069-K 26-Oct-10 089597-001 Copper 0.136 0.003 mg/L 5.3WW011 2069-K 26-Oct-10 089597-002 Fluoride 0.635 0.033 mg/L 36WW011 2069-K 26-Oct-10 089597-001 Lead 0.00441 0.0033 J mg/L 1WW011 2069-K 26-Oct-10 089597-001 Molybdenum 0.0445 0.002 mg/L 2WW011 2069-K 26-Oct-10 089597-001 Nickel 0.0041 0.0015 J mg/L 2WW011 2069-K 26-Oct-10 089597-001 Selenium 0.00722 0.005 J mg/L 0.46WW011 2069-K 26-Oct-10 089597-001 Silver 0.001 U mg/L 5WW011 2069-K 26-Oct-10 089597-001 Zinc 0.106 0.0033 mg/L 2.2WW011 2069-K 27-Oct-10 089604-001 Aluminum 0.12 0.068 J mg/L 900WW011 2069-K 27-Oct-10 089604-003 Ammonia 12.5 0.16 mg/LWW011 2069-K 27-Oct-10 089604-001 Arsenic 0.0236 0.005 J mg/L 0.051WW011 2069-K 27-Oct-10 089604-001 Boron 0.0885 0.015 mg/LWW011 2069-K 27-Oct-10 089604-001 Cadmium 0.001 U mg/L 0.5WW011 2069-K 27-Oct-10 089604-001 Chromium 0.00495 0.001 J mg/L 4.1WW011 2069-K 27-Oct-10 089604-001 Copper 0.211 0.003 mg/L 5.3WW011 2069-K 27-Oct-10 089604-002 Fluoride 0.776 0.033 mg/L 36WW011 2069-K 27-Oct-10 089604-001 Lead 0.0033 U mg/L 1WW011 2069-K 27-Oct-10 089604-001 Molybdenum 0.0419 0.002 mg/L 2WW011 2069-K 27-Oct-10 089604-001 Nickel 0.00326 0.0015 J mg/L 2WW011 2069-K 27-Oct-10 089604-001 Selenium 0.0158 0.005 J mg/L 0.46WW011 2069-K 27-Oct-10 089604-001 Silver 0.001 U mg/L 5WW011 2069-K 27-Oct-10 089604-001 Zinc 0.0518 0.0033 mg/L 2.2
NOTES:COA = City of AlbuquerqueMDL = Method detection limit.J = Estimated value, the analyte concentration fell above the effective MDL and below the effective (PQL) practical quantitation limit.U = The analyte was analyzed for, but not detected. For organic and inorganic analytes the result is less than the effective
MDL concentration

StationPermit
NumberDate
Collected Sample ID Analyte ActivityTwo Sigma
ErrorLab Data Qualifier MDA Units
Regulatory Sewer Release Limits*
(Monthly Avg)CINT 2238A 26-Oct-10 089599-002 Actinium-228 -1.7 18.3 U 16.5 pCi/L 300000CINT 2238A 26-Oct-10 089599-001 Alpha, gross 5.91 1.89 1.9 pCi/LCINT 2238A 26-Oct-10 089599-002 Americium-241 -2.69 5.08 U 5.02 pCi/L 200CINT 2238A 26-Oct-10 089599-002 Beryllium-7 -2.67 20.4 U 33.9 pCi/LCINT 2238A 26-Oct-10 089599-001 Beta, gross 7.73 1.68 1.37 pCi/LCINT 2238A 26-Oct-10 089599-002 Bismuth-212 50.1 57 U 57.8 pCi/LCINT 2238A 26-Oct-10 089599-002 Bismuth-214 6.44 10.3 U 9.82 pCi/LCINT 2238A 26-Oct-10 089599-002 Cesium-137 0.549 2.31 U 3.83 pCi/L 10000CINT 2238A 26-Oct-10 089599-002 Cobalt-60 0.416 2.42 U 4.19 pCi/L 30000CINT 2238A 26-Oct-10 089599-002 Lead-212 0.434 7.27 U 5.08 pCi/L 20000CINT 2238A 26-Oct-10 089599-002 Lead-214 -2.58 6.99 U 7.92 pCi/L 1000000CINT 2238A 26-Oct-10 089599-002 Neptunium-237 -0.306 3.31 U 5.67 pCi/LCINT 2238A 26-Oct-10 089599-002 Potassium-40 2.77 45.8 U 50.1 pCi/L 40000CINT 2238A 26-Oct-10 089599-002 Radium-223 12.3 995 U 60.6 pCi/LCINT 2238A 26-Oct-10 089599-002 Radium-224 36.6 36.5 U 55 pCi/LCINT 2238A 26-Oct-10 089599-002 Radium-226 -29.1 59.1 U 68.4 pCi/L 600CINT 2238A 26-Oct-10 089599-002 Radium-228 -1.7 18.3 U 16.5 pCi/L 600CINT 2238A 26-Oct-10 089599-002 Sodium-22 1.28 2.36 U 4.05 pCi/LCINT 2238A 26-Oct-10 089599-002 Thorium-227 -6.54 529 U 21.4 pCi/LCINT 2238A 26-Oct-10 089599-002 Thorium-231 -32.9 28.5 U 28 pCi/L 300CINT 2238A 26-Oct-10 089599-002 Thorium-234 16.9 68.5 U 66.4 pCi/L 50000CINT 2238A 26-Oct-10 089599-003 Tritium -17.3 91.7 U 160 pCi/L 10000000CINT 2238A 26-Oct-10 089599-002 Uranium-235 -12.5 15.3 U 16 pCi/L 3000CINT 2238A 26-Oct-10 089599-002 Uranium-238 16.9 68.5 U 66.4 pCi/L 3000WW001 2069-A 26-Oct-10 089593-004 Actinium-228 7.74 6.06 U 10.8 pCi/L 300000WW001 2069-A 26-Oct-10 089593-003 Alpha, gross 1.6 0.939 1.33 pCi/LWW001 2069-A 26-Oct-10 089593-004 Americium-241 5.58 6.11 U 9.19 pCi/L 200WW001 2069-A 26-Oct-10 089593-004 Beryllium-7 2.3 15 U 24.8 pCi/LWW001 2069-A 26-Oct-10 089593-003 Beta, gross 8.82 1.81 1.35 pCi/LWW001 2069-A 26-Oct-10 089593-004 Bismuth-212 21 22.5 U 39.6 pCi/LWW001 2069-A 26-Oct-10 089593-004 Bismuth-214 13.3 8.06 5.09 pCi/LWW001 2069-A 26-Oct-10 089593-004 Cesium-137 1.76 1.6 U 2.85 pCi/L 10000WW001 2069-A 26-Oct-10 089593-004 Cobalt-60 1.61 1.67 U 2.94 pCi/L 30000
TABLE A-8. Summary of Sanitary Outfalls of Radiological Analyses, October 2010

StationPermit
NumberDate
Collected Sample ID Analyte ActivityTwo Sigma
ErrorLab Data Qualifier MDA Units
Regulatory Sewer Release Limits*
(Monthly Avg)
TABLE A-8. Summary of Sanitary Outfalls of Radiological Analyses, October 2010
WW001 2069-A 26-Oct-10 089593-004 Lead-212 -1.5 4.9 U 5.46 pCi/L 20000WW001 2069-A 26-Oct-10 089593-004 Lead-214 13.2 6.81 5.11 pCi/L 1000000WW001 2069-A 26-Oct-10 089593-004 Neptunium-237 3.12 2.93 U 5.04 pCi/LWW001 2069-A 26-Oct-10 089593-004 Potassium-40 16.4 37.5 U 24.8 pCi/L 40000WW001 2069-A 26-Oct-10 089593-004 Radium-223 -5.7 423 U 48.7 pCi/LWW001 2069-A 26-Oct-10 089593-004 Radium-224 -66.1 31.3 U 49 pCi/LWW001 2069-A 26-Oct-10 089593-004 Radium-226 -51.5 68.3 U 65.4 pCi/L 600WW001 2069-A 26-Oct-10 089593-004 Radium-228 7.74 6.06 U 10.8 pCi/L 600WW001 2069-A 26-Oct-10 089593-004 Sodium-22 0.554 1.56 U 2.64 pCi/LWW001 2069-A 26-Oct-10 089593-004 Thorium-227 -0.567 43.4 U 18.8 pCi/LWW001 2069-A 26-Oct-10 089593-004 Thorium-231 2.38 18.2 U 29.6 pCi/L 300WW001 2069-A 26-Oct-10 089593-004 Thorium-234 45.5 84.3 U 77.4 pCi/L 50000WW001 2069-A 26-Oct-10 089593-005 Tritium 16.4 101 U 174 pCi/L 10000000WW001 2069-A 26-Oct-10 089593-004 Uranium-235 0.635 14.7 U 15.4 pCi/L 3000WW001 2069-A 26-Oct-10 089593-004 Uranium-238 45.5 84.3 U 77.4 pCi/L 3000WW006 2069F-4 26-Oct-10 089594-004 Actinium-228 10.1 12.9 U 14.5 pCi/L 300000WW006 2069F-4 26-Oct-10 089594-003 Alpha, gross 3.03 3.27 U 5.34 pCi/LWW006 2069F-4 26-Oct-10 089594-004 Americium-241 0.595 13.9 U 21 pCi/L 200WW006 2069F-4 26-Oct-10 089594-004 Beryllium-7 -5.84 19.1 U 32.3 pCi/LWW006 2069F-4 26-Oct-10 089594-003 Beta, gross 8.69 3.4 4.63 pCi/LWW006 2069F-4 26-Oct-10 089594-004 Bismuth-212 8.62 60.6 U 57.6 pCi/LWW006 2069F-4 26-Oct-10 089594-004 Bismuth-214 -5.36 7.85 U 8.19 pCi/LWW006 2069F-4 26-Oct-10 089594-004 Cesium-137 0.742 1.97 U 3.36 pCi/L 10000WW006 2069F-4 26-Oct-10 089594-004 Cobalt-60 -2.65 2.16 U 3.17 pCi/L 30000WW006 2069F-4 26-Oct-10 089594-004 Lead-212 4.42 9.2 U 5.52 pCi/L 20000WW006 2069F-4 26-Oct-10 089594-004 Lead-214 -4.96 8.17 U 7.83 pCi/L 1000000WW006 2069F-4 26-Oct-10 089594-004 Neptunium-237 -1.5 3.71 U 6.09 pCi/LWW006 2069F-4 26-Oct-10 089594-004 Potassium-40 15.5 42.5 U 32 pCi/L 40000WW006 2069F-4 26-Oct-10 089594-004 Radium-223 2.47 204 U 61.3 pCi/LWW006 2069F-4 26-Oct-10 089594-004 Radium-224 262 50.3 U 263 pCi/LWW006 2069F-4 26-Oct-10 089594-004 Radium-226 -61.8 88.4 U 88.2 pCi/L 600WW006 2069F-4 26-Oct-10 089594-004 Radium-228 10.1 12.9 U 14.5 pCi/L 600WW006 2069F-4 26-Oct-10 089594-004 Sodium-22 0.404 2.13 U 3.6 pCi/L

StationPermit
NumberDate
Collected Sample ID Analyte ActivityTwo Sigma
ErrorLab Data Qualifier MDA Units
Regulatory Sewer Release Limits*
(Monthly Avg)
TABLE A-8. Summary of Sanitary Outfalls of Radiological Analyses, October 2010
WW006 2069F-4 26-Oct-10 089594-004 Thorium-227 -7.51 609 U 24 pCi/LWW006 2069F-4 26-Oct-10 089594-004 Thorium-231 14.4 28.5 U 47.8 pCi/L 300WW006 2069F-4 26-Oct-10 089594-004 Thorium-234 131 224 U 209 pCi/L 50000WW006 2069F-4 26-Oct-10 089594-005 Tritium -13.1 92.9 U 162 pCi/L 10000000WW006 2069F-4 26-Oct-10 089594-004 Uranium-235 -2.57 20.4 U 21.7 pCi/L 3000WW006 2069F-4 26-Oct-10 089594-004 Uranium-238 131 224 U 209 pCi/L 3000WW008 2069I-3 26-Oct-10 089596-004 Actinium-228 -14.5 13.7 U 14.7 pCi/L 300000WW008 2069I-3 26-Oct-10 089596-003 Alpha, gross 1.54 1.09 U 1.65 pCi/LWW008 2069I-3 26-Oct-10 089596-004 Americium-241 -9.27 14.9 U 22 pCi/L 200WW008 2069I-3 26-Oct-10 089596-004 Beryllium-7 -18 20 U 31 pCi/LWW008 2069I-3 26-Oct-10 089596-003 Beta, gross 25.2 4.37 1.59 pCi/LWW008 2069I-3 26-Oct-10 089596-004 Bismuth-212 28.8 27.3 U 47.7 pCi/LWW008 2069I-3 26-Oct-10 089596-004 Bismuth-214 -5.93 8.09 U 8.23 pCi/LWW008 2069I-3 26-Oct-10 089596-004 Cesium-137 -0.295 1.92 U 3.21 pCi/L 10000WW008 2069I-3 26-Oct-10 089596-004 Cobalt-60 -4.34 3.07 U 3.15 pCi/L 30000WW008 2069I-3 26-Oct-10 089596-004 Lead-212 4.05 5.92 U 6.33 pCi/L 20000WW008 2069I-3 26-Oct-10 089596-004 Lead-214 -5.27 7.79 U 7.89 pCi/L 1000000WW008 2069I-3 26-Oct-10 089596-004 Neptunium-237 3.55 3.64 U 6.26 pCi/LWW008 2069I-3 26-Oct-10 089596-004 Potassium-40 56.8 55.7 29.1 pCi/L 40000WW008 2069I-3 26-Oct-10 089596-004 Radium-223 8.85 720 U 61.7 pCi/LWW008 2069I-3 26-Oct-10 089596-004 Radium-224 73.4 37.7 U 73.4 pCi/LWW008 2069I-3 26-Oct-10 089596-004 Radium-226 24.7 76.2 U 59.7 pCi/L 600WW008 2069I-3 26-Oct-10 089596-004 Radium-228 -14.5 13.7 U 14.7 pCi/L 600WW008 2069I-3 26-Oct-10 089596-004 Sodium-22 -1.09 2.02 U 3.23 pCi/LWW008 2069I-3 26-Oct-10 089596-004 Thorium-227 -16.6 1350 U 23.8 pCi/LWW008 2069I-3 26-Oct-10 089596-004 Thorium-231 -31 44 U 46 pCi/L 300WW008 2069I-3 26-Oct-10 089596-004 Thorium-234 152 220 U 196 pCi/L 50000WW008 2069I-3 26-Oct-10 089596-005 Tritium 57.7 97.5 U 165 pCi/L 10000000WW008 2069I-3 26-Oct-10 089596-004 Uranium-235 26.7 18.7 X 17 pCi/L 3000WW008 2069I-3 26-Oct-10 089596-004 Uranium-238 152 220 U 196 pCi/L 3000WW011 2069-K 26-Oct-10 089597-004 Actinium-228 -1.59 12.9 U 12.8 pCi/L 300000WW011 2069-K 26-Oct-10 089597-003 Alpha, gross 2.29 1.05 1.3 pCi/LWW011 2069-K 26-Oct-10 089597-004 Americium-241 -2.97 8.03 U 11.6 pCi/L 200

StationPermit
NumberDate
Collected Sample ID Analyte ActivityTwo Sigma
ErrorLab Data Qualifier MDA Units
Regulatory Sewer Release Limits*
(Monthly Avg)
TABLE A-8. Summary of Sanitary Outfalls of Radiological Analyses, October 2010
WW011 2069-K 26-Oct-10 089597-004 Beryllium-7 17 16.3 U 28.6 pCi/LWW011 2069-K 26-Oct-10 089597-003 Beta, gross 24.3 4.2 1.3 pCi/LWW011 2069-K 26-Oct-10 089597-004 Bismuth-212 10.4 23.4 U 39.2 pCi/LWW011 2069-K 26-Oct-10 089597-004 Bismuth-214 -2.54 6.72 U 6.96 pCi/LWW011 2069-K 26-Oct-10 089597-004 Cesium-137 -0.163 1.77 U 2.9 pCi/L 10000WW011 2069-K 26-Oct-10 089597-004 Cobalt-60 1.49 1.72 U 3.02 pCi/L 30000WW011 2069-K 26-Oct-10 089597-004 Lead-212 1.01 5.59 U 6.09 pCi/L 20000WW011 2069-K 26-Oct-10 089597-004 Lead-214 -4.8 6.68 U 6.74 pCi/L 1000000WW011 2069-K 26-Oct-10 089597-004 Neptunium-237 0.644 3.14 U 5.12 pCi/LWW011 2069-K 26-Oct-10 089597-004 Potassium-40 46.2 45.3 25.7 pCi/L 40000WW011 2069-K 26-Oct-10 089597-004 Radium-223 -1.47 124 U 52.8 pCi/LWW011 2069-K 26-Oct-10 089597-004 Radium-224 24.5 34.5 U 51.9 pCi/LWW011 2069-K 26-Oct-10 089597-004 Radium-226 -13.5 65.1 U 69.4 pCi/L 600WW011 2069-K 26-Oct-10 089597-004 Radium-228 -1.59 12.9 U 12.8 pCi/L 600WW011 2069-K 26-Oct-10 089597-004 Sodium-22 1.8 1.76 U 3.13 pCi/LWW011 2069-K 26-Oct-10 089597-004 Thorium-227 -9.02 734 U 19.8 pCi/LWW011 2069-K 26-Oct-10 089597-004 Thorium-231 38.9 26.3 X 31.6 pCi/L 300WW011 2069-K 26-Oct-10 089597-004 Thorium-234 40.6 126 U 123 pCi/L 50000WW011 2069-K 26-Oct-10 089597-005 Tritium -27 95.1 U 167 pCi/L 10000000WW011 2069-K 26-Oct-10 089597-004 Uranium-235 13.3 19.7 U 16.8 pCi/L 3000WW011 2069-K 26-Oct-10 089597-004 Uranium-238 40.6 126 U 123 pCi/L 3000
NOTES:MDA = minimum detectable activity.
pCi/L = picocuries per literU = The result is less than the MDA.X = Presumptive evidence analyte is not present.* = The monthly average concentration values for release of sanitary sewage were derived by taking the most restrictive
occupational stochastic oral ingestion annual limits on intake (ALT) for a reference mean.

Station Permit Number Date Collected Sample ID Analyte Result MDLLab Data Qualifier Units
CINT 2238A 26-Oct-10 089599-004 Acetone 416 3.5 ug/LCINT 2238A 26-Oct-10 089599-004 Benzene 0.3 U ug/LCINT 2238A 26-Oct-10 089599-004 Bromodichloromethane 0.53 0.25 J ug/LCINT 2238A 26-Oct-10 089599-004 Bromoform 0.61 0.25 J ug/LCINT 2238A 26-Oct-10 089599-004 Bromomethane 0.3 U ug/LCINT 2238A 26-Oct-10 089599-004 Butanone, 2- 1.25 U ug/LCINT 2238A 26-Oct-10 089599-004 Carbon disulfide 1.25 U ug/LCINT 2238A 26-Oct-10 089599-004 Carbon tetrachloride 0.3 U ug/LCINT 2238A 26-Oct-10 089599-004 Chlorobenzene 0.25 U ug/LCINT 2238A 26-Oct-10 089599-004 Chloroethane 0.3 U ug/LCINT 2238A 26-Oct-10 089599-004 Chloroform 0.45 0.25 J ug/LCINT 2238A 26-Oct-10 089599-004 Chloromethane 0.3 U ug/LCINT 2238A 26-Oct-10 089599-004 Dibromochloromethane 0.73 0.3 J ug/LCINT 2238A 26-Oct-10 089599-004 Dichloroethane, 1,1- 0.3 U ug/LCINT 2238A 26-Oct-10 089599-004 Dichloroethane, 1,2- 0.25 U ug/LCINT 2238A 26-Oct-10 089599-004 Dichloroethene, 1,1- 0.3 U ug/LCINT 2238A 26-Oct-10 089599-004 Dichloroethene, cis-1,2- 0.3 U ug/LCINT 2238A 26-Oct-10 089599-004 Dichloroethene, trans-1,2- 0.3 U ug/LCINT 2238A 26-Oct-10 089599-004 Dichloropropane, 1,2- 0.25 U ug/LCINT 2238A 26-Oct-10 089599-004 Dichloropropene, cis-1,3- 0.25 U ug/LCINT 2238A 26-Oct-10 089599-004 Dichloropropene, trans-1,3- 0.25 U ug/LCINT 2238A 26-Oct-10 089599-004 Ethyl benzene 0.25 U ug/LCINT 2238A 26-Oct-10 089599-004 Hexanone, 2- 1.25 U ug/LCINT 2238A 26-Oct-10 089599-004 Methylene chloride 3 U ug/LCINT 2238A 26-Oct-10 089599-004 Pentanone, 4-methyl-, 2- 1.25 U ug/LCINT 2238A 26-Oct-10 089599-004 Styrene 0.25 U ug/LCINT 2238A 26-Oct-10 089599-004 Tetrachloroethane, 1,1,2,2- 0.25 U ug/LCINT 2238A 26-Oct-10 089599-004 Tetrachloroethene 0.3 U ug/LCINT 2238A 26-Oct-10 089599-004 Toluene 0.25 U ug/LCINT 2238A 26-Oct-10 089599-004 Trichloroethane, 1,1,1- 0.325 U ug/LCINT 2238A 26-Oct-10 089599-004 Trichloroethane, 1,1,2- 0.25 U ug/LCINT 2238A 26-Oct-10 089599-004 Trichloroethene 0.25 U ug/L
TABLE A-9. Summary of Sanitary Outfalls of Volatile Organic Compounds, October 2010

Station Permit Number Date Collected Sample ID Analyte Result MDLLab Data Qualifier Units
TABLE A-9. Summary of Sanitary Outfalls of Volatile Organic Compounds, October 2010
CINT 2238A 26-Oct-10 089599-004 Vinyl acetate 1.5 U ug/LCINT 2238A 26-Oct-10 089599-004 Vinyl chloride 0.5 U ug/LCINT 2238A 26-Oct-10 089599-004 Xylene 0.3 U ug/LWW001 2069-A 26-Oct-10 089593-006 Acetone 20 3.5 ug/LWW001 2069-A 26-Oct-10 089593-006 Benzene 0.3 U ug/LWW001 2069-A 26-Oct-10 089593-006 Bromodichloromethane 0.25 U ug/LWW001 2069-A 26-Oct-10 089593-006 Bromoform 1.16 0.25 ug/LWW001 2069-A 26-Oct-10 089593-006 Bromomethane 0.3 U ug/LWW001 2069-A 26-Oct-10 089593-006 Butanone, 2- 1.25 U ug/LWW001 2069-A 26-Oct-10 089593-006 Carbon disulfide 1.25 U ug/LWW001 2069-A 26-Oct-10 089593-006 Carbon tetrachloride 0.3 U ug/LWW001 2069-A 26-Oct-10 089593-006 Chlorobenzene 0.25 U ug/LWW001 2069-A 26-Oct-10 089593-006 Chloroethane 0.3 U ug/LWW001 2069-A 26-Oct-10 089593-006 Chloroform 0.25 U ug/LWW001 2069-A 26-Oct-10 089593-006 Chloromethane 0.42 0.3 J ug/LWW001 2069-A 26-Oct-10 089593-006 Dibromochloromethane 0.49 0.3 J ug/LWW001 2069-A 26-Oct-10 089593-006 Dichloroethane, 1,1- 0.3 U ug/LWW001 2069-A 26-Oct-10 089593-006 Dichloroethane, 1,2- 0.25 U ug/LWW001 2069-A 26-Oct-10 089593-006 Dichloroethene, 1,1- 0.3 U ug/LWW001 2069-A 26-Oct-10 089593-006 Dichloroethene, cis-1,2- 0.3 U ug/LWW001 2069-A 26-Oct-10 089593-006 Dichloroethene, trans-1,2- 0.3 U ug/LWW001 2069-A 26-Oct-10 089593-006 Dichloropropane, 1,2- 0.25 U ug/LWW001 2069-A 26-Oct-10 089593-006 Dichloropropene, cis-1,3- 0.25 U ug/LWW001 2069-A 26-Oct-10 089593-006 Dichloropropene, trans-1,3- 0.25 U ug/LWW001 2069-A 26-Oct-10 089593-006 Ethyl benzene 0.25 U ug/LWW001 2069-A 26-Oct-10 089593-006 Hexanone, 2- 1.25 U ug/LWW001 2069-A 26-Oct-10 089593-006 Methylene chloride 3 U ug/LWW001 2069-A 26-Oct-10 089593-006 Pentanone, 4-methyl-, 2- 1.25 U ug/LWW001 2069-A 26-Oct-10 089593-006 Styrene 0.25 U ug/LWW001 2069-A 26-Oct-10 089593-006 Tetrachloroethane, 1,1,2,2- 0.25 U ug/LWW001 2069-A 26-Oct-10 089593-006 Tetrachloroethene 0.3 U ug/LWW001 2069-A 26-Oct-10 089593-006 Toluene 0.25 U ug/L

Station Permit Number Date Collected Sample ID Analyte Result MDLLab Data Qualifier Units
TABLE A-9. Summary of Sanitary Outfalls of Volatile Organic Compounds, October 2010
WW001 2069-A 26-Oct-10 089593-006 Trichloroethane, 1,1,1- 0.325 U ug/LWW001 2069-A 26-Oct-10 089593-006 Trichloroethane, 1,1,2- 0.25 U ug/LWW001 2069-A 26-Oct-10 089593-006 Trichloroethene 0.25 U ug/LWW001 2069-A 26-Oct-10 089593-006 Vinyl acetate 1.5 U ug/LWW001 2069-A 26-Oct-10 089593-006 Vinyl chloride 0.5 U ug/LWW001 2069-A 26-Oct-10 089593-006 Xylene 0.3 U ug/LWW006 2069F-4 26-Oct-10 089594-006 Acetone 51.3 3.5 ug/LWW006 2069F-4 26-Oct-10 089594-006 Benzene 0.3 U ug/LWW006 2069F-4 26-Oct-10 089594-006 Bromodichloromethane 0.25 U ug/LWW006 2069F-4 26-Oct-10 089594-006 Bromoform 0.25 U ug/LWW006 2069F-4 26-Oct-10 089594-006 Bromomethane 0.3 U ug/LWW006 2069F-4 26-Oct-10 089594-006 Butanone, 2- 1.25 U ug/LWW006 2069F-4 26-Oct-10 089594-006 Carbon disulfide 1.25 U ug/LWW006 2069F-4 26-Oct-10 089594-006 Carbon tetrachloride 0.3 U ug/LWW006 2069F-4 26-Oct-10 089594-006 Chlorobenzene 0.25 U ug/LWW006 2069F-4 26-Oct-10 089594-006 Chloroethane 0.3 U ug/LWW006 2069F-4 26-Oct-10 089594-006 Chloroform 0.25 U ug/LWW006 2069F-4 26-Oct-10 089594-006 Chloromethane 0.3 U ug/LWW006 2069F-4 26-Oct-10 089594-006 Dibromochloromethane 0.3 U ug/LWW006 2069F-4 26-Oct-10 089594-006 Dichloroethane, 1,1- 0.3 U ug/LWW006 2069F-4 26-Oct-10 089594-006 Dichloroethane, 1,2- 0.25 U ug/LWW006 2069F-4 26-Oct-10 089594-006 Dichloroethene, 1,1- 0.3 U ug/LWW006 2069F-4 26-Oct-10 089594-006 Dichloroethene, cis-1,2- 0.3 U ug/LWW006 2069F-4 26-Oct-10 089594-006 Dichloroethene, trans-1,2- 0.3 U ug/LWW006 2069F-4 26-Oct-10 089594-006 Dichloropropane, 1,2- 0.25 U ug/LWW006 2069F-4 26-Oct-10 089594-006 Dichloropropene, cis-1,3- 0.25 U ug/LWW006 2069F-4 26-Oct-10 089594-006 Dichloropropene, trans-1,3- 0.25 U ug/LWW006 2069F-4 26-Oct-10 089594-006 Ethyl benzene 0.25 U ug/LWW006 2069F-4 26-Oct-10 089594-006 Hexanone, 2- 1.25 U ug/LWW006 2069F-4 26-Oct-10 089594-006 Methylene chloride 3 U ug/LWW006 2069F-4 26-Oct-10 089594-006 Pentanone, 4-methyl-, 2- 1.25 U ug/LWW006 2069F-4 26-Oct-10 089594-006 Styrene 0.25 U ug/L
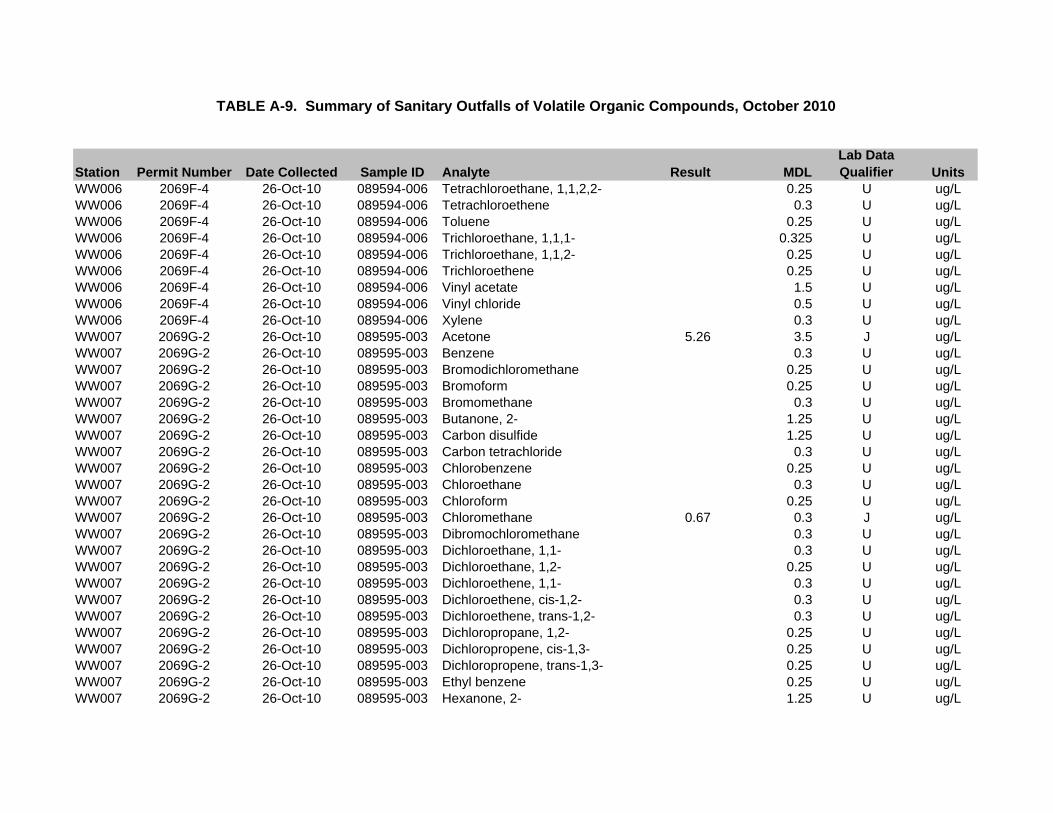
Station Permit Number Date Collected Sample ID Analyte Result MDLLab Data Qualifier Units
TABLE A-9. Summary of Sanitary Outfalls of Volatile Organic Compounds, October 2010
WW006 2069F-4 26-Oct-10 089594-006 Tetrachloroethane, 1,1,2,2- 0.25 U ug/LWW006 2069F-4 26-Oct-10 089594-006 Tetrachloroethene 0.3 U ug/LWW006 2069F-4 26-Oct-10 089594-006 Toluene 0.25 U ug/LWW006 2069F-4 26-Oct-10 089594-006 Trichloroethane, 1,1,1- 0.325 U ug/LWW006 2069F-4 26-Oct-10 089594-006 Trichloroethane, 1,1,2- 0.25 U ug/LWW006 2069F-4 26-Oct-10 089594-006 Trichloroethene 0.25 U ug/LWW006 2069F-4 26-Oct-10 089594-006 Vinyl acetate 1.5 U ug/LWW006 2069F-4 26-Oct-10 089594-006 Vinyl chloride 0.5 U ug/LWW006 2069F-4 26-Oct-10 089594-006 Xylene 0.3 U ug/LWW007 2069G-2 26-Oct-10 089595-003 Acetone 5.26 3.5 J ug/LWW007 2069G-2 26-Oct-10 089595-003 Benzene 0.3 U ug/LWW007 2069G-2 26-Oct-10 089595-003 Bromodichloromethane 0.25 U ug/LWW007 2069G-2 26-Oct-10 089595-003 Bromoform 0.25 U ug/LWW007 2069G-2 26-Oct-10 089595-003 Bromomethane 0.3 U ug/LWW007 2069G-2 26-Oct-10 089595-003 Butanone, 2- 1.25 U ug/LWW007 2069G-2 26-Oct-10 089595-003 Carbon disulfide 1.25 U ug/LWW007 2069G-2 26-Oct-10 089595-003 Carbon tetrachloride 0.3 U ug/LWW007 2069G-2 26-Oct-10 089595-003 Chlorobenzene 0.25 U ug/LWW007 2069G-2 26-Oct-10 089595-003 Chloroethane 0.3 U ug/LWW007 2069G-2 26-Oct-10 089595-003 Chloroform 0.25 U ug/LWW007 2069G-2 26-Oct-10 089595-003 Chloromethane 0.67 0.3 J ug/LWW007 2069G-2 26-Oct-10 089595-003 Dibromochloromethane 0.3 U ug/LWW007 2069G-2 26-Oct-10 089595-003 Dichloroethane, 1,1- 0.3 U ug/LWW007 2069G-2 26-Oct-10 089595-003 Dichloroethane, 1,2- 0.25 U ug/LWW007 2069G-2 26-Oct-10 089595-003 Dichloroethene, 1,1- 0.3 U ug/LWW007 2069G-2 26-Oct-10 089595-003 Dichloroethene, cis-1,2- 0.3 U ug/LWW007 2069G-2 26-Oct-10 089595-003 Dichloroethene, trans-1,2- 0.3 U ug/LWW007 2069G-2 26-Oct-10 089595-003 Dichloropropane, 1,2- 0.25 U ug/LWW007 2069G-2 26-Oct-10 089595-003 Dichloropropene, cis-1,3- 0.25 U ug/LWW007 2069G-2 26-Oct-10 089595-003 Dichloropropene, trans-1,3- 0.25 U ug/LWW007 2069G-2 26-Oct-10 089595-003 Ethyl benzene 0.25 U ug/LWW007 2069G-2 26-Oct-10 089595-003 Hexanone, 2- 1.25 U ug/L

Station Permit Number Date Collected Sample ID Analyte Result MDLLab Data Qualifier Units
TABLE A-9. Summary of Sanitary Outfalls of Volatile Organic Compounds, October 2010
WW007 2069G-2 26-Oct-10 089595-003 Methylene chloride 3 U ug/LWW007 2069G-2 26-Oct-10 089595-003 Pentanone, 4-methyl-, 2- 1.25 U ug/LWW007 2069G-2 26-Oct-10 089595-003 Styrene 0.25 U ug/LWW007 2069G-2 26-Oct-10 089595-003 Tetrachloroethane, 1,1,2,2- 0.25 U ug/LWW007 2069G-2 26-Oct-10 089595-003 Tetrachloroethene 0.3 U ug/LWW007 2069G-2 26-Oct-10 089595-003 Toluene 0.25 U ug/LWW007 2069G-2 26-Oct-10 089595-003 Trichloroethane, 1,1,1- 0.325 U ug/LWW007 2069G-2 26-Oct-10 089595-003 Trichloroethane, 1,1,2- 0.25 U ug/LWW007 2069G-2 26-Oct-10 089595-003 Trichloroethene 0.25 U ug/LWW007 2069G-2 26-Oct-10 089595-003 Vinyl acetate 1.5 U ug/LWW007 2069G-2 26-Oct-10 089595-003 Vinyl chloride 0.5 U ug/LWW007 2069G-2 26-Oct-10 089595-003 Xylene 0.3 U ug/LWW008 2069I-3 26-Oct-10 089596-006 Acetone 3.5 U ug/LWW008 2069I-3 26-Oct-10 089596-006 Benzene 0.3 U ug/LWW008 2069I-3 26-Oct-10 089596-006 Bromodichloromethane 0.25 U ug/LWW008 2069I-3 26-Oct-10 089596-006 Bromoform 0.25 U ug/LWW008 2069I-3 26-Oct-10 089596-006 Bromomethane 0.3 U ug/LWW008 2069I-3 26-Oct-10 089596-006 Butanone, 2- 1.47 1.25 J ug/LWW008 2069I-3 26-Oct-10 089596-006 Carbon disulfide 1.25 U ug/LWW008 2069I-3 26-Oct-10 089596-006 Carbon tetrachloride 0.3 U ug/LWW008 2069I-3 26-Oct-10 089596-006 Chlorobenzene 0.25 U ug/LWW008 2069I-3 26-Oct-10 089596-006 Chloroethane 0.3 U ug/LWW008 2069I-3 26-Oct-10 089596-006 Chloroform 0.25 U ug/LWW008 2069I-3 26-Oct-10 089596-006 Chloromethane 0.56 0.3 J ug/LWW008 2069I-3 26-Oct-10 089596-006 Dibromochloromethane 0.3 U ug/LWW008 2069I-3 26-Oct-10 089596-006 Dichloroethane, 1,1- 0.3 U ug/LWW008 2069I-3 26-Oct-10 089596-006 Dichloroethane, 1,2- 0.25 U ug/LWW008 2069I-3 26-Oct-10 089596-006 Dichloroethene, 1,1- 0.3 U ug/LWW008 2069I-3 26-Oct-10 089596-006 Dichloroethene, cis-1,2- 0.3 U ug/LWW008 2069I-3 26-Oct-10 089596-006 Dichloroethene, trans-1,2- 0.3 U ug/LWW008 2069I-3 26-Oct-10 089596-006 Dichloropropane, 1,2- 0.25 U ug/LWW008 2069I-3 26-Oct-10 089596-006 Dichloropropene, cis-1,3- 0.25 U ug/L
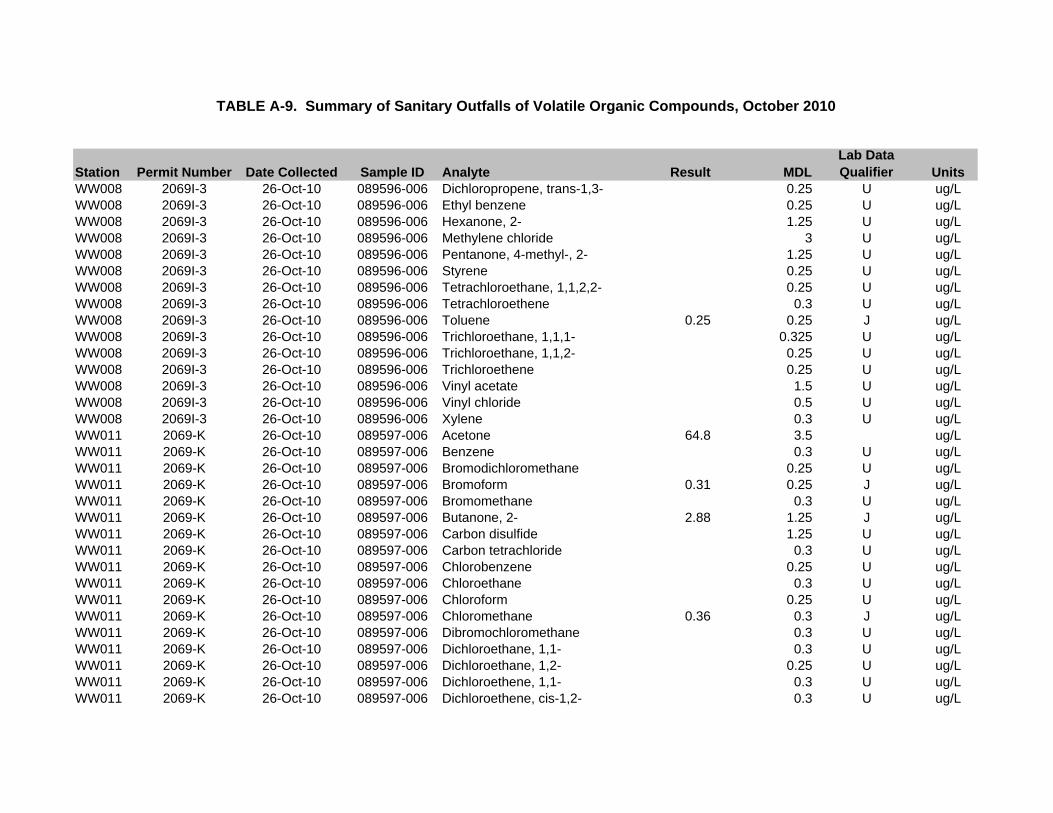
Station Permit Number Date Collected Sample ID Analyte Result MDLLab Data Qualifier Units
TABLE A-9. Summary of Sanitary Outfalls of Volatile Organic Compounds, October 2010
WW008 2069I-3 26-Oct-10 089596-006 Dichloropropene, trans-1,3- 0.25 U ug/LWW008 2069I-3 26-Oct-10 089596-006 Ethyl benzene 0.25 U ug/LWW008 2069I-3 26-Oct-10 089596-006 Hexanone, 2- 1.25 U ug/LWW008 2069I-3 26-Oct-10 089596-006 Methylene chloride 3 U ug/LWW008 2069I-3 26-Oct-10 089596-006 Pentanone, 4-methyl-, 2- 1.25 U ug/LWW008 2069I-3 26-Oct-10 089596-006 Styrene 0.25 U ug/LWW008 2069I-3 26-Oct-10 089596-006 Tetrachloroethane, 1,1,2,2- 0.25 U ug/LWW008 2069I-3 26-Oct-10 089596-006 Tetrachloroethene 0.3 U ug/LWW008 2069I-3 26-Oct-10 089596-006 Toluene 0.25 0.25 J ug/LWW008 2069I-3 26-Oct-10 089596-006 Trichloroethane, 1,1,1- 0.325 U ug/LWW008 2069I-3 26-Oct-10 089596-006 Trichloroethane, 1,1,2- 0.25 U ug/LWW008 2069I-3 26-Oct-10 089596-006 Trichloroethene 0.25 U ug/LWW008 2069I-3 26-Oct-10 089596-006 Vinyl acetate 1.5 U ug/LWW008 2069I-3 26-Oct-10 089596-006 Vinyl chloride 0.5 U ug/LWW008 2069I-3 26-Oct-10 089596-006 Xylene 0.3 U ug/LWW011 2069-K 26-Oct-10 089597-006 Acetone 64.8 3.5 ug/LWW011 2069-K 26-Oct-10 089597-006 Benzene 0.3 U ug/LWW011 2069-K 26-Oct-10 089597-006 Bromodichloromethane 0.25 U ug/LWW011 2069-K 26-Oct-10 089597-006 Bromoform 0.31 0.25 J ug/LWW011 2069-K 26-Oct-10 089597-006 Bromomethane 0.3 U ug/LWW011 2069-K 26-Oct-10 089597-006 Butanone, 2- 2.88 1.25 J ug/LWW011 2069-K 26-Oct-10 089597-006 Carbon disulfide 1.25 U ug/LWW011 2069-K 26-Oct-10 089597-006 Carbon tetrachloride 0.3 U ug/LWW011 2069-K 26-Oct-10 089597-006 Chlorobenzene 0.25 U ug/LWW011 2069-K 26-Oct-10 089597-006 Chloroethane 0.3 U ug/LWW011 2069-K 26-Oct-10 089597-006 Chloroform 0.25 U ug/LWW011 2069-K 26-Oct-10 089597-006 Chloromethane 0.36 0.3 J ug/LWW011 2069-K 26-Oct-10 089597-006 Dibromochloromethane 0.3 U ug/LWW011 2069-K 26-Oct-10 089597-006 Dichloroethane, 1,1- 0.3 U ug/LWW011 2069-K 26-Oct-10 089597-006 Dichloroethane, 1,2- 0.25 U ug/LWW011 2069-K 26-Oct-10 089597-006 Dichloroethene, 1,1- 0.3 U ug/LWW011 2069-K 26-Oct-10 089597-006 Dichloroethene, cis-1,2- 0.3 U ug/L

Station Permit Number Date Collected Sample ID Analyte Result MDLLab Data Qualifier Units
TABLE A-9. Summary of Sanitary Outfalls of Volatile Organic Compounds, October 2010
WW011 2069-K 26-Oct-10 089597-006 Dichloroethene, trans-1,2- 0.3 U ug/LWW011 2069-K 26-Oct-10 089597-006 Dichloropropane, 1,2- 0.25 U ug/LWW011 2069-K 26-Oct-10 089597-006 Dichloropropene, cis-1,3- 0.25 U ug/LWW011 2069-K 26-Oct-10 089597-006 Dichloropropene, trans-1,3- 0.25 U ug/LWW011 2069-K 26-Oct-10 089597-006 Ethyl benzene 0.25 U ug/LWW011 2069-K 26-Oct-10 089597-006 Hexanone, 2- 1.25 U ug/LWW011 2069-K 26-Oct-10 089597-006 Methylene chloride 3 U ug/LWW011 2069-K 26-Oct-10 089597-006 Pentanone, 4-methyl-, 2- 1.25 U ug/LWW011 2069-K 26-Oct-10 089597-006 Styrene 0.25 U ug/LWW011 2069-K 26-Oct-10 089597-006 Tetrachloroethane, 1,1,2,2- 0.25 U ug/LWW011 2069-K 26-Oct-10 089597-006 Tetrachloroethene 0.3 U ug/LWW011 2069-K 26-Oct-10 089597-006 Toluene 0.25 U ug/LWW011 2069-K 26-Oct-10 089597-006 Trichloroethane, 1,1,1- 0.325 U ug/LWW011 2069-K 26-Oct-10 089597-006 Trichloroethane, 1,1,2- 0.25 U ug/LWW011 2069-K 26-Oct-10 089597-006 Trichloroethene 0.25 U ug/LWW011 2069-K 26-Oct-10 089597-006 Vinyl acetate 1.5 U ug/LWW011 2069-K 26-Oct-10 089597-006 Vinyl chloride 0.5 U ug/LWW011 2069-K 26-Oct-10 089597-006 Xylene 0.3 U ug/L
NOTES: MDL = Method detection limit. J = Estimated value, the analyte concentration fell above the effective MDL limit and below the effective (PQL) practical quantitation limit.ug/L = micrograms per liter. U = The analyte was analyzed for, but not detected. For organic and inorganic analytes the result is less than the effective MDL concentration.

StationPermit
Number Date Collected Sample ID Analyte Result MDLLab Data Qualifier Units
CINT 2238A 27-Oct-10 089605-002 Acenaphthene 0.292 U ug/LCINT 2238A 27-Oct-10 089605-002 Acenaphthylene 0.189 U ug/LCINT 2238A 27-Oct-10 089605-002 Anthracene 0.189 U ug/LCINT 2238A 27-Oct-10 089605-002 Benzo(a)anthracene 0.189 U ug/LCINT 2238A 27-Oct-10 089605-002 Benzo(a)pyrene 0.189 U ug/LCINT 2238A 27-Oct-10 089605-002 Benzo(b)fluoranthene 0.189 U ug/LCINT 2238A 27-Oct-10 089605-002 Benzo(ghi)perylene 0.189 U ug/LCINT 2238A 27-Oct-10 089605-002 Benzo(k)fluoranthene 0.189 U ug/LCINT 2238A 27-Oct-10 089605-002 Bromophenyl phenyl ether, 4- 1.89 U ug/LCINT 2238A 27-Oct-10 089605-002 Butylbenzyl phthalate 1.89 U ug/LCINT 2238A 27-Oct-10 089605-002 Carbazole 0.189 U ug/LCINT 2238A 27-Oct-10 089605-002 Chloro-3-methylphenol, 4- 1.89 U ug/LCINT 2238A 27-Oct-10 089605-002 Chlorobenzenamine, 4- 1.89 U ug/LCINT 2238A 27-Oct-10 089605-002 Chloroethoxy)methane, bis(2- 2.83 U ug/LCINT 2238A 27-Oct-10 089605-002 Chloroethyl)ether, bis(2- 1.89 U ug/LCINT 2238A 27-Oct-10 089605-002 Chloroisopropyl ether, bis- 1.89 U ug/LCINT 2238A 27-Oct-10 089605-002 Chloronaphthalene, 2- 0.283 U ug/LCINT 2238A 27-Oct-10 089605-002 Chlorophenol, 2- 1.89 U ug/LCINT 2238A 27-Oct-10 089605-002 Chlorophenyl phenyl ether, 4- 1.89 U ug/LCINT 2238A 27-Oct-10 089605-002 Chrysene 0.189 U ug/LCINT 2238A 27-Oct-10 089605-002 Cresol, m,p- 2.83 U ug/LCINT 2238A 27-Oct-10 089605-002 Cresol, o- 1.89 U ug/LCINT 2238A 27-Oct-10 089605-002 Di-n-butyl phthalate 1.89 U ug/LCINT 2238A 27-Oct-10 089605-002 Di-n-octyl phthalate 2.83 U ug/LCINT 2238A 27-Oct-10 089605-002 Dibenz[a,h]anthracene 0.189 U ug/LCINT 2238A 27-Oct-10 089605-002 Dibenzofuran 1.89 U ug/LCINT 2238A 27-Oct-10 089605-002 Dichlorobenzene, 1,2- 1.89 U ug/LCINT 2238A 27-Oct-10 089605-002 Dichlorobenzene, 1,3- 1.89 U ug/LCINT 2238A 27-Oct-10 089605-002 Dichlorobenzene, 1,4- 1.89 U ug/LCINT 2238A 27-Oct-10 089605-002 Dichlorobenzidine, 3,3'- 1.89 U ug/LCINT 2238A 27-Oct-10 089605-002 Dichlorophenol, 2,4- 1.89 U ug/LCINT 2238A 27-Oct-10 089605-002 Diethylphthalate 1.89 U ug/LCINT 2238A 27-Oct-10 089605-002 Dimethylphenol, 2,4- 1.89 U ug/LCINT 2238A 27-Oct-10 089605-002 Dimethylphthalate 1.89 U ug/L
TABLE A-10. Summary of Sanitary Outfalls of Semi-Volitile Organic Compounds, October 2010

StationPermit
Number Date Collected Sample ID Analyte Result MDLLab Data Qualifier Units
TABLE A-10. Summary of Sanitary Outfalls of Semi-Volitile Organic Compounds, October 2010
CINT 2238A 27-Oct-10 089605-002 Dinitro-o-cresol 2.83 U ug/LCINT 2238A 27-Oct-10 089605-002 Dinitrophenol, 2,4- 4.72 U ug/LCINT 2238A 27-Oct-10 089605-002 Dinitrotoluene, 2,4- 1.89 U ug/LCINT 2238A 27-Oct-10 089605-002 Dinitrotoluene, 2,6- 1.89 U ug/LCINT 2238A 27-Oct-10 089605-002 Diphenyl amine 2.83 U ug/LCINT 2238A 27-Oct-10 089605-002 Ethylhexyl)phthalate, bis(2- 1.89 U ug/LCINT 2238A 27-Oct-10 089605-002 Fluoranthene 0.189 U ug/LCINT 2238A 27-Oct-10 089605-002 Fluorene 0.189 U ug/LCINT 2238A 27-Oct-10 089605-002 Hexachlorobenzene 1.89 U ug/LCINT 2238A 27-Oct-10 089605-002 Hexachlorobutadiene 1.89 U ug/LCINT 2238A 27-Oct-10 089605-002 Hexachlorocyclopentadiene 2.83 U ug/LCINT 2238A 27-Oct-10 089605-002 Hexachloroethane 1.89 U ug/LCINT 2238A 27-Oct-10 089605-002 Indeno(1,2,3-c,d)pyrene 0.189 U ug/LCINT 2238A 27-Oct-10 089605-002 Isophorone 2.83 U ug/LCINT 2238A 27-Oct-10 089605-002 Methylnaphthalene, 2- 0.283 U ug/LCINT 2238A 27-Oct-10 089605-002 Naphthalene 0.283 U ug/LCINT 2238A 27-Oct-10 089605-002 Nitro-benzene 2.83 U ug/LCINT 2238A 27-Oct-10 089605-002 Nitroaniline, 2- 1.89 U ug/LCINT 2238A 27-Oct-10 089605-002 Nitroaniline, 3- 1.89 U ug/LCINT 2238A 27-Oct-10 089605-002 Nitroaniline, 4- 2.83 U ug/LCINT 2238A 27-Oct-10 089605-002 Nitrophenol, 2- 1.89 U ug/LCINT 2238A 27-Oct-10 089605-002 Nitrophenol, 4- 1.89 U ug/LCINT 2238A 27-Oct-10 089605-002 Nitrosodipropylamine, n- 1.89 U ug/LCINT 2238A 27-Oct-10 089605-002 Pentachlorophenol 1.89 U ug/LCINT 2238A 27-Oct-10 089605-002 Phenanthrene 0.189 U ug/LCINT 2238A 27-Oct-10 089605-002 Phenol 0.943 U ug/LCINT 2238A 27-Oct-10 089605-002 Pyrene 0.283 U ug/LCINT 2238A 27-Oct-10 089605-002 Trichlorobenzene, 1,2,4- 1.89 U ug/LCINT 2238A 27-Oct-10 089605-002 Trichlorophenol, 2,4,5- 1.89 U ug/LCINT 2238A 27-Oct-10 089605-002 Trichlorophenol, 2,4,6- 1.89 U ug/LWW001 2069-A 27-Oct-10 089600-004 Acenaphthene 0.292 U ug/LWW001 2069-A 27-Oct-10 089600-004 Acenaphthylene 0.189 U ug/LWW001 2069-A 27-Oct-10 089600-004 Anthracene 0.189 U ug/LWW001 2069-A 27-Oct-10 089600-004 Benzo(a)anthracene 0.189 U ug/L

StationPermit
Number Date Collected Sample ID Analyte Result MDLLab Data Qualifier Units
TABLE A-10. Summary of Sanitary Outfalls of Semi-Volitile Organic Compounds, October 2010
WW001 2069-A 27-Oct-10 089600-004 Benzo(a)pyrene 0.189 U ug/LWW001 2069-A 27-Oct-10 089600-004 Benzo(b)fluoranthene 0.189 U ug/LWW001 2069-A 27-Oct-10 089600-004 Benzo(ghi)perylene 0.189 U ug/LWW001 2069-A 27-Oct-10 089600-004 Benzo(k)fluoranthene 0.189 U ug/LWW001 2069-A 27-Oct-10 089600-004 Bromophenyl phenyl ether, 4- 1.89 U ug/LWW001 2069-A 27-Oct-10 089600-004 Butylbenzyl phthalate 1.89 U ug/LWW001 2069-A 27-Oct-10 089600-004 Carbazole 0.189 U ug/LWW001 2069-A 27-Oct-10 089600-004 Chloro-3-methylphenol, 4- 1.89 U ug/LWW001 2069-A 27-Oct-10 089600-004 Chlorobenzenamine, 4- 1.89 U ug/LWW001 2069-A 27-Oct-10 089600-004 Chloroethoxy)methane, bis(2- 2.83 U ug/LWW001 2069-A 27-Oct-10 089600-004 Chloroethyl)ether, bis(2- 1.89 U ug/LWW001 2069-A 27-Oct-10 089600-004 Chloroisopropyl ether, bis- 1.89 U ug/LWW001 2069-A 27-Oct-10 089600-004 Chloronaphthalene, 2- 0.283 U ug/LWW001 2069-A 27-Oct-10 089600-004 Chlorophenol, 2- 1.89 U ug/LWW001 2069-A 27-Oct-10 089600-004 Chlorophenyl phenyl ether, 4- 1.89 U ug/LWW001 2069-A 27-Oct-10 089600-004 Chrysene 0.189 U ug/LWW001 2069-A 27-Oct-10 089600-004 Cresol, m,p- 2.83 U ug/LWW001 2069-A 27-Oct-10 089600-004 Cresol, o- 1.89 U ug/LWW001 2069-A 27-Oct-10 089600-004 Di-n-butyl phthalate 1.89 U ug/LWW001 2069-A 27-Oct-10 089600-004 Di-n-octyl phthalate 2.83 U ug/LWW001 2069-A 27-Oct-10 089600-004 Dibenz[a,h]anthracene 0.189 U ug/LWW001 2069-A 27-Oct-10 089600-004 Dibenzofuran 1.89 U ug/LWW001 2069-A 27-Oct-10 089600-004 Dichlorobenzene, 1,2- 1.89 U ug/LWW001 2069-A 27-Oct-10 089600-004 Dichlorobenzene, 1,3- 1.89 U ug/LWW001 2069-A 27-Oct-10 089600-004 Dichlorobenzene, 1,4- 1.89 U ug/LWW001 2069-A 27-Oct-10 089600-004 Dichlorobenzidine, 3,3'- 1.89 U ug/LWW001 2069-A 27-Oct-10 089600-004 Dichlorophenol, 2,4- 1.89 U ug/LWW001 2069-A 27-Oct-10 089600-004 Diethylphthalate 1.89 U ug/LWW001 2069-A 27-Oct-10 089600-004 Dimethylphenol, 2,4- 1.89 U ug/LWW001 2069-A 27-Oct-10 089600-004 Dimethylphthalate 1.89 U ug/LWW001 2069-A 27-Oct-10 089600-004 Dinitro-o-cresol 2.83 U ug/LWW001 2069-A 27-Oct-10 089600-004 Dinitrophenol, 2,4- 4.72 U ug/LWW001 2069-A 27-Oct-10 089600-004 Dinitrotoluene, 2,4- 1.89 U ug/LWW001 2069-A 27-Oct-10 089600-004 Dinitrotoluene, 2,6- 1.89 U ug/L

StationPermit
Number Date Collected Sample ID Analyte Result MDLLab Data Qualifier Units
TABLE A-10. Summary of Sanitary Outfalls of Semi-Volitile Organic Compounds, October 2010
WW001 2069-A 27-Oct-10 089600-004 Diphenyl amine 2.83 U ug/LWW001 2069-A 27-Oct-10 089600-004 Ethylhexyl)phthalate, bis(2- 3.05 1.89 J ug/LWW001 2069-A 27-Oct-10 089600-004 Fluoranthene 0.189 U ug/LWW001 2069-A 27-Oct-10 089600-004 Fluorene 0.189 U ug/LWW001 2069-A 27-Oct-10 089600-004 Hexachlorobenzene 1.89 U ug/LWW001 2069-A 27-Oct-10 089600-004 Hexachlorobutadiene 1.89 U ug/LWW001 2069-A 27-Oct-10 089600-004 Hexachlorocyclopentadiene 2.83 U ug/LWW001 2069-A 27-Oct-10 089600-004 Hexachloroethane 1.89 U ug/LWW001 2069-A 27-Oct-10 089600-004 Indeno(1,2,3-c,d)pyrene 0.189 U ug/LWW001 2069-A 27-Oct-10 089600-004 Isophorone 2.83 U ug/LWW001 2069-A 27-Oct-10 089600-004 Methylnaphthalene, 2- 0.283 U ug/LWW001 2069-A 27-Oct-10 089600-004 Naphthalene 0.283 U ug/LWW001 2069-A 27-Oct-10 089600-004 Nitro-benzene 2.83 U ug/LWW001 2069-A 27-Oct-10 089600-004 Nitroaniline, 2- 1.89 U ug/LWW001 2069-A 27-Oct-10 089600-004 Nitroaniline, 3- 1.89 U ug/LWW001 2069-A 27-Oct-10 089600-004 Nitroaniline, 4- 2.83 U ug/LWW001 2069-A 27-Oct-10 089600-004 Nitrophenol, 2- 1.89 U ug/LWW001 2069-A 27-Oct-10 089600-004 Nitrophenol, 4- 1.89 U ug/LWW001 2069-A 27-Oct-10 089600-004 Nitrosodipropylamine, n- 1.89 U ug/LWW001 2069-A 27-Oct-10 089600-004 Pentachlorophenol 1.89 U ug/LWW001 2069-A 27-Oct-10 089600-004 Phenanthrene 0.189 U ug/LWW001 2069-A 27-Oct-10 089600-004 Phenol 0.943 U ug/LWW001 2069-A 27-Oct-10 089600-004 Pyrene 0.283 U ug/LWW001 2069-A 27-Oct-10 089600-004 Trichlorobenzene, 1,2,4- 1.89 U ug/LWW001 2069-A 27-Oct-10 089600-004 Trichlorophenol, 2,4,5- 1.89 U ug/LWW001 2069-A 27-Oct-10 089600-004 Trichlorophenol, 2,4,6- 1.89 U ug/LWW006 2069F-4 27-Oct-10 089601-004 Acenaphthene 0.292 U ug/LWW006 2069F-4 27-Oct-10 089601-004 Acenaphthylene 0.189 U ug/LWW006 2069F-4 27-Oct-10 089601-004 Anthracene 0.189 U ug/LWW006 2069F-4 27-Oct-10 089601-004 Benzo(a)anthracene 0.189 U ug/LWW006 2069F-4 27-Oct-10 089601-004 Benzo(a)pyrene 0.189 U ug/LWW006 2069F-4 27-Oct-10 089601-004 Benzo(b)fluoranthene 0.189 U ug/LWW006 2069F-4 27-Oct-10 089601-004 Benzo(ghi)perylene 0.189 U ug/LWW006 2069F-4 27-Oct-10 089601-004 Benzo(k)fluoranthene 0.189 U ug/L

StationPermit
Number Date Collected Sample ID Analyte Result MDLLab Data Qualifier Units
TABLE A-10. Summary of Sanitary Outfalls of Semi-Volitile Organic Compounds, October 2010
WW006 2069F-4 27-Oct-10 089601-004 Bromophenyl phenyl ether, 4- 1.89 U ug/LWW006 2069F-4 27-Oct-10 089601-004 Butylbenzyl phthalate 1.89 U ug/LWW006 2069F-4 27-Oct-10 089601-004 Carbazole 0.189 U ug/LWW006 2069F-4 27-Oct-10 089601-004 Chloro-3-methylphenol, 4- 1.89 U ug/LWW006 2069F-4 27-Oct-10 089601-004 Chlorobenzenamine, 4- 1.89 U ug/LWW006 2069F-4 27-Oct-10 089601-004 Chloroethoxy)methane, bis(2- 2.83 U ug/LWW006 2069F-4 27-Oct-10 089601-004 Chloroethyl)ether, bis(2- 1.89 U ug/LWW006 2069F-4 27-Oct-10 089601-004 Chloroisopropyl ether, bis- 1.89 U ug/LWW006 2069F-4 27-Oct-10 089601-004 Chloronaphthalene, 2- 0.283 U ug/LWW006 2069F-4 27-Oct-10 089601-004 Chlorophenol, 2- 1.89 U ug/LWW006 2069F-4 27-Oct-10 089601-004 Chlorophenyl phenyl ether, 4- 1.89 U ug/LWW006 2069F-4 27-Oct-10 089601-004 Chrysene 0.189 U ug/LWW006 2069F-4 27-Oct-10 089601-004 Cresol, m,p- 2.83 U ug/LWW006 2069F-4 27-Oct-10 089601-004 Cresol, o- 1.89 U ug/LWW006 2069F-4 27-Oct-10 089601-004 Di-n-butyl phthalate 1.89 U ug/LWW006 2069F-4 27-Oct-10 089601-004 Di-n-octyl phthalate 2.83 U ug/LWW006 2069F-4 27-Oct-10 089601-004 Dibenz[a,h]anthracene 0.189 U ug/LWW006 2069F-4 27-Oct-10 089601-004 Dibenzofuran 1.89 U ug/LWW006 2069F-4 27-Oct-10 089601-004 Dichlorobenzene, 1,2- 1.89 U ug/LWW006 2069F-4 27-Oct-10 089601-004 Dichlorobenzene, 1,3- 1.89 U ug/LWW006 2069F-4 27-Oct-10 089601-004 Dichlorobenzene, 1,4- 1.89 U ug/LWW006 2069F-4 27-Oct-10 089601-004 Dichlorobenzidine, 3,3'- 1.89 U ug/LWW006 2069F-4 27-Oct-10 089601-004 Dichlorophenol, 2,4- 1.89 U ug/LWW006 2069F-4 27-Oct-10 089601-004 Diethylphthalate 1.89 U ug/LWW006 2069F-4 27-Oct-10 089601-004 Dimethylphenol, 2,4- 1.89 U ug/LWW006 2069F-4 27-Oct-10 089601-004 Dimethylphthalate 1.89 U ug/LWW006 2069F-4 27-Oct-10 089601-004 Dinitro-o-cresol 2.83 U ug/LWW006 2069F-4 27-Oct-10 089601-004 Dinitrophenol, 2,4- 4.72 U ug/LWW006 2069F-4 27-Oct-10 089601-004 Dinitrotoluene, 2,4- 1.89 U ug/LWW006 2069F-4 27-Oct-10 089601-004 Dinitrotoluene, 2,6- 1.89 U ug/LWW006 2069F-4 27-Oct-10 089601-004 Diphenyl amine 2.83 U ug/LWW006 2069F-4 27-Oct-10 089601-004 Ethylhexyl)phthalate, bis(2- 20.6 1.89 ug/LWW006 2069F-4 27-Oct-10 089601-004 Fluoranthene 0.189 U ug/LWW006 2069F-4 27-Oct-10 089601-004 Fluorene 0.189 U ug/L
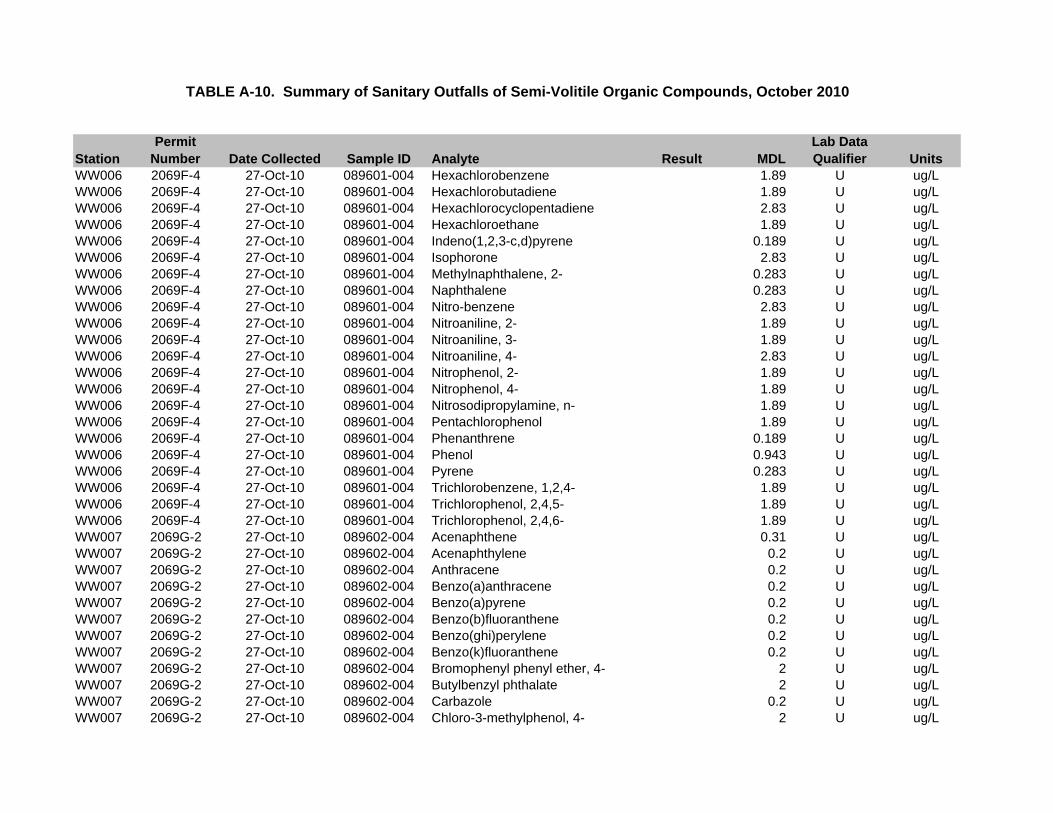
StationPermit
Number Date Collected Sample ID Analyte Result MDLLab Data Qualifier Units
TABLE A-10. Summary of Sanitary Outfalls of Semi-Volitile Organic Compounds, October 2010
WW006 2069F-4 27-Oct-10 089601-004 Hexachlorobenzene 1.89 U ug/LWW006 2069F-4 27-Oct-10 089601-004 Hexachlorobutadiene 1.89 U ug/LWW006 2069F-4 27-Oct-10 089601-004 Hexachlorocyclopentadiene 2.83 U ug/LWW006 2069F-4 27-Oct-10 089601-004 Hexachloroethane 1.89 U ug/LWW006 2069F-4 27-Oct-10 089601-004 Indeno(1,2,3-c,d)pyrene 0.189 U ug/LWW006 2069F-4 27-Oct-10 089601-004 Isophorone 2.83 U ug/LWW006 2069F-4 27-Oct-10 089601-004 Methylnaphthalene, 2- 0.283 U ug/LWW006 2069F-4 27-Oct-10 089601-004 Naphthalene 0.283 U ug/LWW006 2069F-4 27-Oct-10 089601-004 Nitro-benzene 2.83 U ug/LWW006 2069F-4 27-Oct-10 089601-004 Nitroaniline, 2- 1.89 U ug/LWW006 2069F-4 27-Oct-10 089601-004 Nitroaniline, 3- 1.89 U ug/LWW006 2069F-4 27-Oct-10 089601-004 Nitroaniline, 4- 2.83 U ug/LWW006 2069F-4 27-Oct-10 089601-004 Nitrophenol, 2- 1.89 U ug/LWW006 2069F-4 27-Oct-10 089601-004 Nitrophenol, 4- 1.89 U ug/LWW006 2069F-4 27-Oct-10 089601-004 Nitrosodipropylamine, n- 1.89 U ug/LWW006 2069F-4 27-Oct-10 089601-004 Pentachlorophenol 1.89 U ug/LWW006 2069F-4 27-Oct-10 089601-004 Phenanthrene 0.189 U ug/LWW006 2069F-4 27-Oct-10 089601-004 Phenol 0.943 U ug/LWW006 2069F-4 27-Oct-10 089601-004 Pyrene 0.283 U ug/LWW006 2069F-4 27-Oct-10 089601-004 Trichlorobenzene, 1,2,4- 1.89 U ug/LWW006 2069F-4 27-Oct-10 089601-004 Trichlorophenol, 2,4,5- 1.89 U ug/LWW006 2069F-4 27-Oct-10 089601-004 Trichlorophenol, 2,4,6- 1.89 U ug/LWW007 2069G-2 27-Oct-10 089602-004 Acenaphthene 0.31 U ug/LWW007 2069G-2 27-Oct-10 089602-004 Acenaphthylene 0.2 U ug/LWW007 2069G-2 27-Oct-10 089602-004 Anthracene 0.2 U ug/LWW007 2069G-2 27-Oct-10 089602-004 Benzo(a)anthracene 0.2 U ug/LWW007 2069G-2 27-Oct-10 089602-004 Benzo(a)pyrene 0.2 U ug/LWW007 2069G-2 27-Oct-10 089602-004 Benzo(b)fluoranthene 0.2 U ug/LWW007 2069G-2 27-Oct-10 089602-004 Benzo(ghi)perylene 0.2 U ug/LWW007 2069G-2 27-Oct-10 089602-004 Benzo(k)fluoranthene 0.2 U ug/LWW007 2069G-2 27-Oct-10 089602-004 Bromophenyl phenyl ether, 4- 2 U ug/LWW007 2069G-2 27-Oct-10 089602-004 Butylbenzyl phthalate 2 U ug/LWW007 2069G-2 27-Oct-10 089602-004 Carbazole 0.2 U ug/LWW007 2069G-2 27-Oct-10 089602-004 Chloro-3-methylphenol, 4- 2 U ug/L

StationPermit
Number Date Collected Sample ID Analyte Result MDLLab Data Qualifier Units
TABLE A-10. Summary of Sanitary Outfalls of Semi-Volitile Organic Compounds, October 2010
WW007 2069G-2 27-Oct-10 089602-004 Chlorobenzenamine, 4- 2 U ug/LWW007 2069G-2 27-Oct-10 089602-004 Chloroethoxy)methane, bis(2- 3 U ug/LWW007 2069G-2 27-Oct-10 089602-004 Chloroethyl)ether, bis(2- 2 U ug/LWW007 2069G-2 27-Oct-10 089602-004 Chloroisopropyl ether, bis- 2 U ug/LWW007 2069G-2 27-Oct-10 089602-004 Chloronaphthalene, 2- 0.3 U ug/LWW007 2069G-2 27-Oct-10 089602-004 Chlorophenol, 2- 2 U ug/LWW007 2069G-2 27-Oct-10 089602-004 Chlorophenyl phenyl ether, 4- 2 U ug/LWW007 2069G-2 27-Oct-10 089602-004 Chrysene 0.2 U ug/LWW007 2069G-2 27-Oct-10 089602-004 Cresol, m,p- 3 U ug/LWW007 2069G-2 27-Oct-10 089602-004 Cresol, o- 2 U ug/LWW007 2069G-2 27-Oct-10 089602-004 Di-n-butyl phthalate 2 U ug/LWW007 2069G-2 27-Oct-10 089602-004 Di-n-octyl phthalate 3 U ug/LWW007 2069G-2 27-Oct-10 089602-004 Dibenz[a,h]anthracene 0.2 U ug/LWW007 2069G-2 27-Oct-10 089602-004 Dibenzofuran 2 U ug/LWW007 2069G-2 27-Oct-10 089602-004 Dichlorobenzene, 1,2- 2 U ug/LWW007 2069G-2 27-Oct-10 089602-004 Dichlorobenzene, 1,3- 2 U ug/LWW007 2069G-2 27-Oct-10 089602-004 Dichlorobenzene, 1,4- 2 U ug/LWW007 2069G-2 27-Oct-10 089602-004 Dichlorobenzidine, 3,3'- 2 U ug/LWW007 2069G-2 27-Oct-10 089602-004 Dichlorophenol, 2,4- 2 U ug/LWW007 2069G-2 27-Oct-10 089602-004 Diethylphthalate 2 U ug/LWW007 2069G-2 27-Oct-10 089602-004 Dimethylphenol, 2,4- 2 U ug/LWW007 2069G-2 27-Oct-10 089602-004 Dimethylphthalate 2 U ug/LWW007 2069G-2 27-Oct-10 089602-004 Dinitro-o-cresol 3 U ug/LWW007 2069G-2 27-Oct-10 089602-004 Dinitrophenol, 2,4- 5 U ug/LWW007 2069G-2 27-Oct-10 089602-004 Dinitrotoluene, 2,4- 2 U ug/LWW007 2069G-2 27-Oct-10 089602-004 Dinitrotoluene, 2,6- 2 U ug/LWW007 2069G-2 27-Oct-10 089602-004 Diphenyl amine 3 U ug/LWW007 2069G-2 27-Oct-10 089602-004 Ethylhexyl)phthalate, bis(2- 2 U ug/LWW007 2069G-2 27-Oct-10 089602-004 Fluoranthene 0.2 U ug/LWW007 2069G-2 27-Oct-10 089602-004 Fluorene 0.2 U ug/LWW007 2069G-2 27-Oct-10 089602-004 Hexachlorobenzene 2 U ug/LWW007 2069G-2 27-Oct-10 089602-004 Hexachlorobutadiene 2 U ug/LWW007 2069G-2 27-Oct-10 089602-004 Hexachlorocyclopentadiene 3 U ug/LWW007 2069G-2 27-Oct-10 089602-004 Hexachloroethane 2 U ug/L

StationPermit
Number Date Collected Sample ID Analyte Result MDLLab Data Qualifier Units
TABLE A-10. Summary of Sanitary Outfalls of Semi-Volitile Organic Compounds, October 2010
WW007 2069G-2 27-Oct-10 089602-004 Indeno(1,2,3-c,d)pyrene 0.2 U ug/LWW007 2069G-2 27-Oct-10 089602-004 Isophorone 3 U ug/LWW007 2069G-2 27-Oct-10 089602-004 Methylnaphthalene, 2- 0.3 U ug/LWW007 2069G-2 27-Oct-10 089602-004 Naphthalene 0.3 U ug/LWW007 2069G-2 27-Oct-10 089602-004 Nitro-benzene 3 U ug/LWW007 2069G-2 27-Oct-10 089602-004 Nitroaniline, 2- 2 U ug/LWW007 2069G-2 27-Oct-10 089602-004 Nitroaniline, 3- 2 U ug/LWW007 2069G-2 27-Oct-10 089602-004 Nitroaniline, 4- 3 U ug/LWW007 2069G-2 27-Oct-10 089602-004 Nitrophenol, 2- 2 U ug/LWW007 2069G-2 27-Oct-10 089602-004 Nitrophenol, 4- 2 U ug/LWW007 2069G-2 27-Oct-10 089602-004 Nitrosodipropylamine, n- 2 U ug/LWW007 2069G-2 27-Oct-10 089602-004 Pentachlorophenol 2 U ug/LWW007 2069G-2 27-Oct-10 089602-004 Phenanthrene 0.2 U ug/LWW007 2069G-2 27-Oct-10 089602-004 Phenol 1 U ug/LWW007 2069G-2 27-Oct-10 089602-004 Pyrene 0.3 U ug/LWW007 2069G-2 27-Oct-10 089602-004 Trichlorobenzene, 1,2,4- 2 U ug/LWW007 2069G-2 27-Oct-10 089602-004 Trichlorophenol, 2,4,5- 2 U ug/LWW007 2069G-2 27-Oct-10 089602-004 Trichlorophenol, 2,4,6- 2 U ug/LWW008 2069I-3 27-Oct-10 089603-004 Acenaphthene 0.292 U ug/LWW008 2069I-3 27-Oct-10 089603-004 Acenaphthylene 0.189 U ug/LWW008 2069I-3 27-Oct-10 089603-004 Anthracene 0.189 U ug/LWW008 2069I-3 27-Oct-10 089603-004 Benzo(a)anthracene 0.189 U ug/LWW008 2069I-3 27-Oct-10 089603-004 Benzo(a)pyrene 0.189 U ug/LWW008 2069I-3 27-Oct-10 089603-004 Benzo(b)fluoranthene 0.189 U ug/LWW008 2069I-3 27-Oct-10 089603-004 Benzo(ghi)perylene 0.189 U ug/LWW008 2069I-3 27-Oct-10 089603-004 Benzo(k)fluoranthene 0.189 U ug/LWW008 2069I-3 27-Oct-10 089603-004 Bromophenyl phenyl ether, 4- 1.89 U ug/LWW008 2069I-3 27-Oct-10 089603-004 Butylbenzyl phthalate 1.89 U ug/LWW008 2069I-3 27-Oct-10 089603-004 Carbazole 0.189 U ug/LWW008 2069I-3 27-Oct-10 089603-004 Chloro-3-methylphenol, 4- 1.89 U ug/LWW008 2069I-3 27-Oct-10 089603-004 Chlorobenzenamine, 4- 1.89 U ug/LWW008 2069I-3 27-Oct-10 089603-004 Chloroethoxy)methane, bis(2- 2.83 U ug/LWW008 2069I-3 27-Oct-10 089603-004 Chloroethyl)ether, bis(2- 1.89 U ug/LWW008 2069I-3 27-Oct-10 089603-004 Chloroisopropyl ether, bis- 1.89 U ug/L

StationPermit
Number Date Collected Sample ID Analyte Result MDLLab Data Qualifier Units
TABLE A-10. Summary of Sanitary Outfalls of Semi-Volitile Organic Compounds, October 2010
WW008 2069I-3 27-Oct-10 089603-004 Chloronaphthalene, 2- 0.283 U ug/LWW008 2069I-3 27-Oct-10 089603-004 Chlorophenol, 2- 1.89 U ug/LWW008 2069I-3 27-Oct-10 089603-004 Chlorophenyl phenyl ether, 4- 1.89 U ug/LWW008 2069I-3 27-Oct-10 089603-004 Chrysene 0.189 U ug/LWW008 2069I-3 27-Oct-10 089603-004 Cresol, m,p- 2.83 U ug/LWW008 2069I-3 27-Oct-10 089603-004 Cresol, o- 1.89 U ug/LWW008 2069I-3 27-Oct-10 089603-004 Di-n-butyl phthalate 1.89 U ug/LWW008 2069I-3 27-Oct-10 089603-004 Di-n-octyl phthalate 2.83 U ug/LWW008 2069I-3 27-Oct-10 089603-004 Dibenz[a,h]anthracene 0.189 U ug/LWW008 2069I-3 27-Oct-10 089603-004 Dibenzofuran 1.89 U ug/LWW008 2069I-3 27-Oct-10 089603-004 Dichlorobenzene, 1,2- 1.89 U ug/LWW008 2069I-3 27-Oct-10 089603-004 Dichlorobenzene, 1,3- 1.89 U ug/LWW008 2069I-3 27-Oct-10 089603-004 Dichlorobenzene, 1,4- 1.89 U ug/LWW008 2069I-3 27-Oct-10 089603-004 Dichlorobenzidine, 3,3'- 1.89 U ug/LWW008 2069I-3 27-Oct-10 089603-004 Dichlorophenol, 2,4- 1.89 U ug/LWW008 2069I-3 27-Oct-10 089603-004 Diethylphthalate 1.89 U ug/LWW008 2069I-3 27-Oct-10 089603-004 Dimethylphenol, 2,4- 1.89 U ug/LWW008 2069I-3 27-Oct-10 089603-004 Dimethylphthalate 1.89 U ug/LWW008 2069I-3 27-Oct-10 089603-004 Dinitro-o-cresol 2.83 U ug/LWW008 2069I-3 27-Oct-10 089603-004 Dinitrophenol, 2,4- 4.72 U ug/LWW008 2069I-3 27-Oct-10 089603-004 Dinitrotoluene, 2,4- 1.89 U ug/LWW008 2069I-3 27-Oct-10 089603-004 Dinitrotoluene, 2,6- 1.89 U ug/LWW008 2069I-3 27-Oct-10 089603-004 Diphenyl amine 2.83 U ug/LWW008 2069I-3 27-Oct-10 089603-004 Ethylhexyl)phthalate, bis(2- 1.89 U ug/LWW008 2069I-3 27-Oct-10 089603-004 Fluoranthene 0.189 U ug/LWW008 2069I-3 27-Oct-10 089603-004 Fluorene 0.189 U ug/LWW008 2069I-3 27-Oct-10 089603-004 Hexachlorobenzene 1.89 U ug/LWW008 2069I-3 27-Oct-10 089603-004 Hexachlorobutadiene 1.89 U ug/LWW008 2069I-3 27-Oct-10 089603-004 Hexachlorocyclopentadiene 2.83 U ug/LWW008 2069I-3 27-Oct-10 089603-004 Hexachloroethane 1.89 U ug/LWW008 2069I-3 27-Oct-10 089603-004 Indeno(1,2,3-c,d)pyrene 0.189 U ug/LWW008 2069I-3 27-Oct-10 089603-004 Isophorone 2.83 U ug/LWW008 2069I-3 27-Oct-10 089603-004 Methylnaphthalene, 2- 0.283 U ug/LWW008 2069I-3 27-Oct-10 089603-004 Naphthalene 0.283 U ug/L

StationPermit
Number Date Collected Sample ID Analyte Result MDLLab Data Qualifier Units
TABLE A-10. Summary of Sanitary Outfalls of Semi-Volitile Organic Compounds, October 2010
WW008 2069I-3 27-Oct-10 089603-004 Nitro-benzene 2.83 U ug/LWW008 2069I-3 27-Oct-10 089603-004 Nitroaniline, 2- 1.89 U ug/LWW008 2069I-3 27-Oct-10 089603-004 Nitroaniline, 3- 1.89 U ug/LWW008 2069I-3 27-Oct-10 089603-004 Nitroaniline, 4- 2.83 U ug/LWW008 2069I-3 27-Oct-10 089603-004 Nitrophenol, 2- 1.89 U ug/LWW008 2069I-3 27-Oct-10 089603-004 Nitrophenol, 4- 1.89 U ug/LWW008 2069I-3 27-Oct-10 089603-004 Nitrosodipropylamine, n- 1.89 U ug/LWW008 2069I-3 27-Oct-10 089603-004 Pentachlorophenol 1.89 U ug/LWW008 2069I-3 27-Oct-10 089603-004 Phenanthrene 0.189 U ug/LWW008 2069I-3 27-Oct-10 089603-004 Phenol 0.943 U ug/LWW008 2069I-3 27-Oct-10 089603-004 Pyrene 0.283 U ug/LWW008 2069I-3 27-Oct-10 089603-004 Trichlorobenzene, 1,2,4- 1.89 U ug/LWW008 2069I-3 27-Oct-10 089603-004 Trichlorophenol, 2,4,5- 1.89 U ug/LWW008 2069I-3 27-Oct-10 089603-004 Trichlorophenol, 2,4,6- 1.89 U ug/LWW011 2069-K 27-Oct-10 089604-004 Acenaphthene 0.292 U ug/LWW011 2069-K 27-Oct-10 089604-004 Acenaphthylene 0.189 U ug/LWW011 2069-K 27-Oct-10 089604-004 Anthracene 0.189 U ug/LWW011 2069-K 27-Oct-10 089604-004 Benzo(a)anthracene 0.189 U ug/LWW011 2069-K 27-Oct-10 089604-004 Benzo(a)pyrene 0.189 U ug/LWW011 2069-K 27-Oct-10 089604-004 Benzo(b)fluoranthene 0.189 U ug/LWW011 2069-K 27-Oct-10 089604-004 Benzo(ghi)perylene 0.189 U ug/LWW011 2069-K 27-Oct-10 089604-004 Benzo(k)fluoranthene 0.189 U ug/LWW011 2069-K 27-Oct-10 089604-004 Bromophenyl phenyl ether, 4- 1.89 U ug/LWW011 2069-K 27-Oct-10 089604-004 Butylbenzyl phthalate 1.89 U ug/LWW011 2069-K 27-Oct-10 089604-004 Carbazole 0.189 U ug/LWW011 2069-K 27-Oct-10 089604-004 Chloro-3-methylphenol, 4- 1.89 U ug/LWW011 2069-K 27-Oct-10 089604-004 Chlorobenzenamine, 4- 1.89 U ug/LWW011 2069-K 27-Oct-10 089604-004 Chloroethoxy)methane, bis(2- 2.83 U ug/LWW011 2069-K 27-Oct-10 089604-004 Chloroethyl)ether, bis(2- 1.89 U ug/LWW011 2069-K 27-Oct-10 089604-004 Chloroisopropyl ether, bis- 1.89 U ug/LWW011 2069-K 27-Oct-10 089604-004 Chloronaphthalene, 2- 0.283 U ug/LWW011 2069-K 27-Oct-10 089604-004 Chlorophenol, 2- 1.89 U ug/LWW011 2069-K 27-Oct-10 089604-004 Chlorophenyl phenyl ether, 4- 1.89 U ug/LWW011 2069-K 27-Oct-10 089604-004 Chrysene 0.189 U ug/L
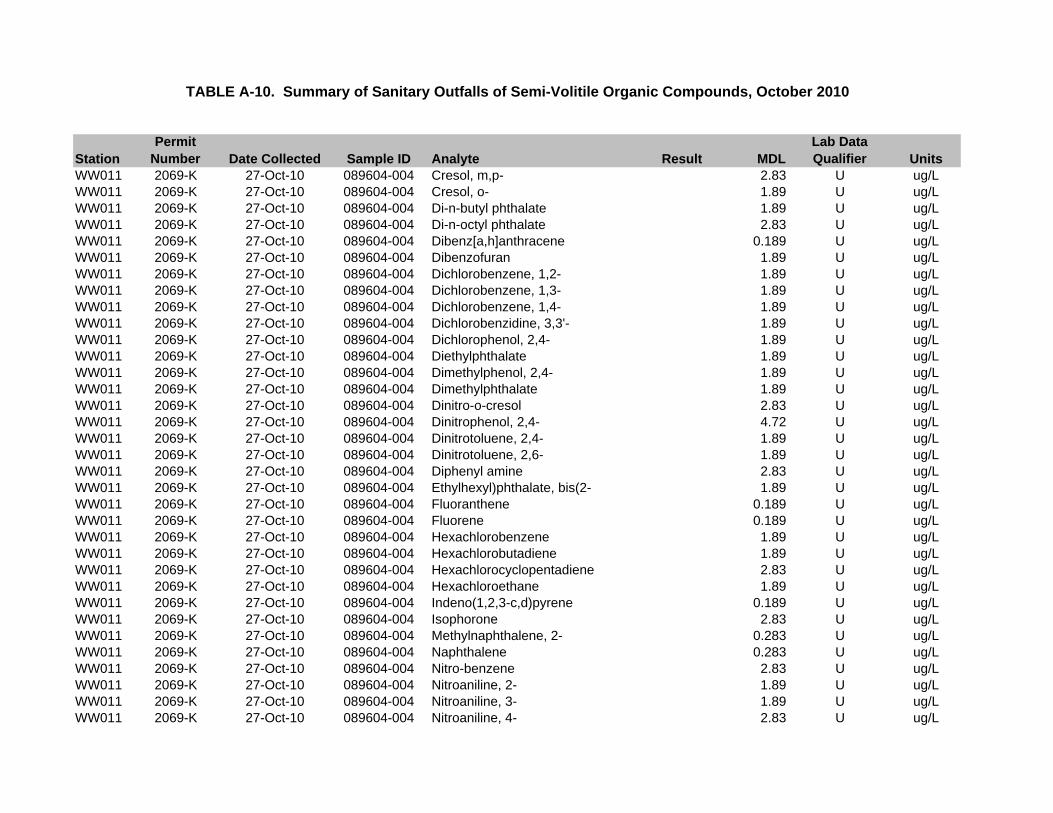
StationPermit
Number Date Collected Sample ID Analyte Result MDLLab Data Qualifier Units
TABLE A-10. Summary of Sanitary Outfalls of Semi-Volitile Organic Compounds, October 2010
WW011 2069-K 27-Oct-10 089604-004 Cresol, m,p- 2.83 U ug/LWW011 2069-K 27-Oct-10 089604-004 Cresol, o- 1.89 U ug/LWW011 2069-K 27-Oct-10 089604-004 Di-n-butyl phthalate 1.89 U ug/LWW011 2069-K 27-Oct-10 089604-004 Di-n-octyl phthalate 2.83 U ug/LWW011 2069-K 27-Oct-10 089604-004 Dibenz[a,h]anthracene 0.189 U ug/LWW011 2069-K 27-Oct-10 089604-004 Dibenzofuran 1.89 U ug/LWW011 2069-K 27-Oct-10 089604-004 Dichlorobenzene, 1,2- 1.89 U ug/LWW011 2069-K 27-Oct-10 089604-004 Dichlorobenzene, 1,3- 1.89 U ug/LWW011 2069-K 27-Oct-10 089604-004 Dichlorobenzene, 1,4- 1.89 U ug/LWW011 2069-K 27-Oct-10 089604-004 Dichlorobenzidine, 3,3'- 1.89 U ug/LWW011 2069-K 27-Oct-10 089604-004 Dichlorophenol, 2,4- 1.89 U ug/LWW011 2069-K 27-Oct-10 089604-004 Diethylphthalate 1.89 U ug/LWW011 2069-K 27-Oct-10 089604-004 Dimethylphenol, 2,4- 1.89 U ug/LWW011 2069-K 27-Oct-10 089604-004 Dimethylphthalate 1.89 U ug/LWW011 2069-K 27-Oct-10 089604-004 Dinitro-o-cresol 2.83 U ug/LWW011 2069-K 27-Oct-10 089604-004 Dinitrophenol, 2,4- 4.72 U ug/LWW011 2069-K 27-Oct-10 089604-004 Dinitrotoluene, 2,4- 1.89 U ug/LWW011 2069-K 27-Oct-10 089604-004 Dinitrotoluene, 2,6- 1.89 U ug/LWW011 2069-K 27-Oct-10 089604-004 Diphenyl amine 2.83 U ug/LWW011 2069-K 27-Oct-10 089604-004 Ethylhexyl)phthalate, bis(2- 1.89 U ug/LWW011 2069-K 27-Oct-10 089604-004 Fluoranthene 0.189 U ug/LWW011 2069-K 27-Oct-10 089604-004 Fluorene 0.189 U ug/LWW011 2069-K 27-Oct-10 089604-004 Hexachlorobenzene 1.89 U ug/LWW011 2069-K 27-Oct-10 089604-004 Hexachlorobutadiene 1.89 U ug/LWW011 2069-K 27-Oct-10 089604-004 Hexachlorocyclopentadiene 2.83 U ug/LWW011 2069-K 27-Oct-10 089604-004 Hexachloroethane 1.89 U ug/LWW011 2069-K 27-Oct-10 089604-004 Indeno(1,2,3-c,d)pyrene 0.189 U ug/LWW011 2069-K 27-Oct-10 089604-004 Isophorone 2.83 U ug/LWW011 2069-K 27-Oct-10 089604-004 Methylnaphthalene, 2- 0.283 U ug/LWW011 2069-K 27-Oct-10 089604-004 Naphthalene 0.283 U ug/LWW011 2069-K 27-Oct-10 089604-004 Nitro-benzene 2.83 U ug/LWW011 2069-K 27-Oct-10 089604-004 Nitroaniline, 2- 1.89 U ug/LWW011 2069-K 27-Oct-10 089604-004 Nitroaniline, 3- 1.89 U ug/LWW011 2069-K 27-Oct-10 089604-004 Nitroaniline, 4- 2.83 U ug/L
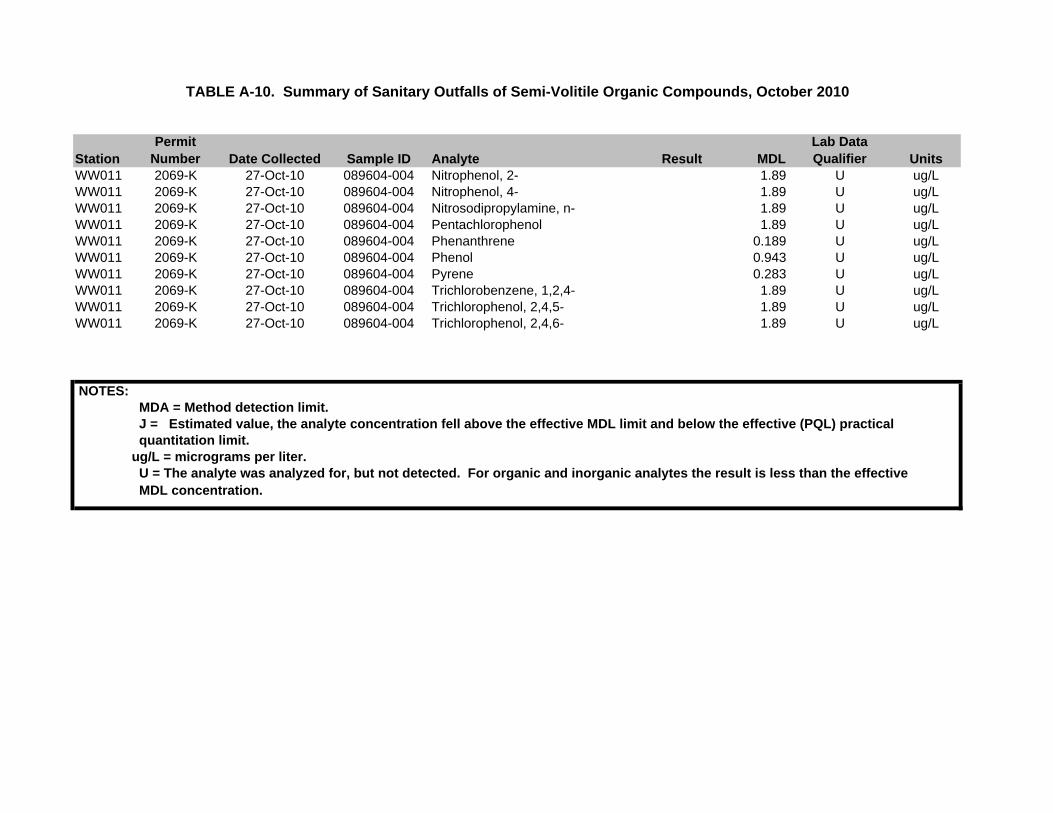
StationPermit
Number Date Collected Sample ID Analyte Result MDLLab Data Qualifier Units
TABLE A-10. Summary of Sanitary Outfalls of Semi-Volitile Organic Compounds, October 2010
WW011 2069-K 27-Oct-10 089604-004 Nitrophenol, 2- 1.89 U ug/LWW011 2069-K 27-Oct-10 089604-004 Nitrophenol, 4- 1.89 U ug/LWW011 2069-K 27-Oct-10 089604-004 Nitrosodipropylamine, n- 1.89 U ug/LWW011 2069-K 27-Oct-10 089604-004 Pentachlorophenol 1.89 U ug/LWW011 2069-K 27-Oct-10 089604-004 Phenanthrene 0.189 U ug/LWW011 2069-K 27-Oct-10 089604-004 Phenol 0.943 U ug/LWW011 2069-K 27-Oct-10 089604-004 Pyrene 0.283 U ug/LWW011 2069-K 27-Oct-10 089604-004 Trichlorobenzene, 1,2,4- 1.89 U ug/LWW011 2069-K 27-Oct-10 089604-004 Trichlorophenol, 2,4,5- 1.89 U ug/LWW011 2069-K 27-Oct-10 089604-004 Trichlorophenol, 2,4,6- 1.89 U ug/L
NOTES: MDA = Method detection limit. J = Estimated value, the analyte concentration fell above the effective MDL limit and below the effective (PQL) practical quantitation limit.ug/L = micrograms per liter. U = The analyte was analyzed for, but not detected. For organic and inorganic analytes the result is less than the effective MDL concentration.

SANDIA REPORT Calendar Year 2010 Unlimited Release SAND2011-5781P Printed September 2011
Annual Groundwater Monitoring Report
Prepared by Sandia National Laboratories, Albuquerque, New Mexico
Sandia National Laboratories is a multi-program laboratory managed and operated by Sandia Corporation, a wholly owned subsidiary of Lockheed Martin Corporation, for the U.S. Department of Energy’s National Nuclear Security
Administration under contract DE-AC04-94AL85000.
Approved for public release; further dissemination unlimited


Annual Groundwater Monitoring Report Calendar Year 2010 Groundwater Protection Program Sandia National Laboratories, New Mexico
September 2011 Prepared by: Long Term Stewardship Department (4142) and Environmental Programs (4143) Groundwater Protection Program (GWPP) in coordination with Environmental Restoration (ER) Operations (6234) Environmental Programs (4143) Sandia National Laboratories, New Mexico Albuquerque, New Mexico 87185-1054
SANDIA REPORT Unlimited Release SAND2011-5781P Printed September 2011

This page intentionally left blank.

Acknowledgments The production of this document is a joint effort between the Sandia National Laboratories, New Mexico (SNL/NM) Groundwater Protection Program (GWPP) and Environmental Restoration (ER) Operations.
Contributing Authors
Jackson, Tim Lauffer, Franz
Mitchell, Michael Skelly, Michael
Abstract Sandia National Laboratories, New Mexico (SNL/NM) is a government-owned/contractor-operated laboratory. Sandia Corporation (Sandia), a wholly-owned subsidiary of Lockheed Martin Corporation, manages and operates SNL/NM for the U.S. Department of Energy (DOE), National Nuclear Security Administration (NNSA). The DOE/NNSA Sandia Site Office administers the contract and oversees contractor operations at the site. Sandia conducts general groundwater surveillance monitoring at SNL/NM on a site-wide basis as part of the SNL/NM Groundwater Protection Program (GWPP) and site-specific groundwater monitoring at Environmental Restoration (ER) Operations sites with ongoing groundwater investigations. This annual groundwater monitoring report summarizes GWPP and ER Operations data collected during groundwater monitoring events conducted at the following SNL/NM sites through December 31, 2010: Chemical Waste Landfill; Mixed Waste Landfill; Technical Area V study area; Tijeras Arroyo Groundwater study area; and Burn Site Groundwater study area. Environmental monitoring and surveillance programs are required by DOE Order 450.1A, Environmental Protection Program, and DOE Manual 231-1A, Environmental, Safety, and Health Reporting Manual.

This page intentionally left blank.

CONTENT v
EXECUTIVE SUMMARY .......................................................................................................ES-1 1.0 INTRODUCTION ........................................................................................................... 1-1
1.1 Site Description .................................................................................................... 1-1
1.1.1 Climate ..................................................................................................... 1-1 1.1.2 Geologic Setting....................................................................................... 1-1 1.1.3 Hydrogeology .......................................................................................... 1-3 1.1.4 Surface Water Hydrology ........................................................................ 1-6
1.2 Groundwater Monitoring ..................................................................................... 1-7
1.2.1 Environmental Restoration Operations Monitoring................................. 1-7 1.2.2 Groundwater Protection Program Monitoring ......................................... 1-7 1.2.3 Groundwater Monitoring Regulatory Criteria and DOE Orders ........... 1-13
1.3 References .......................................................................................................... 1-14
2.0 GROUNDWATER PROTECTION PROGRAM ........................................................... 2-1
2.1 Introduction .......................................................................................................... 2-1 2.2 Regulatory Criteria............................................................................................... 2-2 2.3 Scope of Activities ............................................................................................... 2-3
2.3.1 Groundwater Quality Surveillance Monitoring ....................................... 2-3 2.3.2 Monitoring Well Installation.................................................................... 2-4
2.4 Field Methods and Measurements ....................................................................... 2-4
2.4.1 Groundwater Sampling ............................................................................ 2-4 2.4.2 Sample Collection, Handling, and Analysis ............................................ 2-5 2.4.3 Field Water Quality Measurements ......................................................... 2-5 2.4.4 Water Level Measurements ..................................................................... 2-5
2.5 Analytical Methods .............................................................................................. 2-6
2.6 Summary of Monitoring Results .......................................................................... 2-6
2.6.1 Analytical Results .................................................................................... 2-6 2.6.2 Water Level Measurements ..................................................................... 2-8
2.6.2.1 Groundwater Recharge and Withdrawal ................................... 2-9 2.6.2.2 Water Table Elevations ........................................................... 2-10
2.7 Quality Control Results...................................................................................... 2-12

vi ANNUAL GROUNDWATER MONITORING REPORT, CALENDAR YEAR 2010
2.7.1 Field Quality Control Samples............................................................... 2-12
2.7.1.1 Duplicate Environmental Samples ................................................... 2-12 2.7.1.2 Trip Blank Samples .......................................................................... 2-12 2.7.1.3. Equipment Blank Samples ............................................................... 2-13 2.7.1.4 Field Blank Samples ......................................................................... 2-13
2.7.2 Laboratory Quality Control Samples ..................................................... 2-13
2.8 Variances and Nonconformances ...................................................................... 2-14 2.9 Summary and Conclusions ................................................................................ 2-14 2.10 References .......................................................................................................... 2-15
3.0 CHEMICAL WASTE LANDFILL ................................................................................. 3-1
3.1 Introduction .......................................................................................................... 3-1
3.1.1 Monitoring History .................................................................................. 3-3 3.1.2 Monitoring Network ................................................................................ 3-4 3.1.3 Summary of Activities ............................................................................. 3-4 3.1.4 Summary of Future Activities .................................................................. 3-7 3.1.5 Conceptual Site Model ............................................................................. 3-7
3.2 Regulatory Criteria............................................................................................... 3-7 3.3 Scope of Activities ............................................................................................... 3-8 3.4 Field Methods and Measurements ....................................................................... 3-8 3.5 Analytical Methods .............................................................................................. 3-9 3.6 Summary of Analytical Results ........................................................................... 3-9
3.6.1 Volatile Organic Compounds ................................................................ 3-10 3.6.2 Total Metals ........................................................................................... 3-10 3.6.3 Water Quality Parameters ...................................................................... 3-10
3.7 Quality Control Results...................................................................................... 3-10
3.7.1 Field Quality Control Samples............................................................... 3-11
3.7.1.1 Duplicate Environmental Samples .......................................... 3-11 3.7.1.2 Field Blank Samples ............................................................... 3-11 3.7.1.3 Trip Blank Samples................................................................. 3-11
3.7.2 Laboratory Quality Control Samples ..................................................... 3-11
3.8 Variances and Nonconformances ...................................................................... 3-12 3.9 Summary and Conclusions ................................................................................ 3-12 3.10 References .......................................................................................................... 3-13

CONTENT vii
4.0 MIXED WASTE LANDFILL ......................................................................................... 4-1
4.1 Introduction .......................................................................................................... 4-1 4.1.1 Monitoring History .................................................................................. 4-3 4.1.2 Monitoring Network ................................................................................ 4-5 4.1.3 Summary of Activities ............................................................................. 4-5 4.1.4 Summary of Future Activities .................................................................. 4-5 4.1.5 Conceptual Site Model ............................................................................. 4-5
4.2 Regulatory Criteria............................................................................................... 4-6 4.3 Scope of Activities ............................................................................................... 4-8 4.4 Field Methods and Measurements ....................................................................... 4-8 4.5 Analytical Methods ............................................................................................ 4-10 4.6 Summary of Analytical Results ......................................................................... 4-10
4.6.1 Volatile and Semivolatile Organic Compounds .................................... 4-11 4.6.2 General Chemistry Parameters .............................................................. 4-11 4.6.3 Metals ..................................................................................................... 4-11 4.6.4 Radiological Parameters ........................................................................ 4-11 4.6.5 Water Quality Parameters ...................................................................... 4-12
4.7 Quality Control Results...................................................................................... 4-12
4.7.1 Field Quality Control Samples............................................................... 4-12
4.7.1.1 Duplicate Environmental Samples .......................................... 4-12 4.7.1.2 Equipment Blank Samples ...................................................... 4-13 4.7.1.3 Field Blank Samples ............................................................... 4-13 4.7.1.4 Trip Blank Samples................................................................. 4-14
4.7.2 Laboratory Quality Control Samples ..................................................... 4-14
4.8 Variances and Nonconformances ...................................................................... 4-15 4.9 Summary and Conclusions ................................................................................ 4-15 4.10 References .......................................................................................................... 4-15
5.0 TECHNICAL AREA V GROUNDWATER ................................................................... 5-1
5.1 Introduction .......................................................................................................... 5-1
5.1.1 Location ................................................................................................... 5-1 5.1.2 Site History .............................................................................................. 5-1 5.1.3 Monitoring History .................................................................................. 5-1 5.1.4 Current Monitoring Network ................................................................... 5-7 5.1.5 Summary of Calendar Year Activities ..................................................... 5-7 5.1.6 Summary of Future Activities .................................................................. 5-9 5.1.7 Current Conceptual Model ....................................................................... 5-9

viii ANNUAL GROUNDWATER MONITORING REPORT, CALENDAR YEAR 2010
5.1.7.1 Regional Hydrogeologic Conditions ....................................... 5-10 5.1.7.2 Hydrologic Conditions at the TA-V Study Area .................... 5-11 5.1.7.3 Local Direction of Flow .......................................................... 5-12 5.1.7.4 Contaminant Sources .............................................................. 5-12 5.1.7.5 Contaminant Distribution and Transport in Groundwater ...... 5-16
5.2 Regulatory Criteria............................................................................................. 5-16 5.3 Scope of Activities ............................................................................................. 5-19 5.4 Field Methods and Measurements ..................................................................... 5-21
5.4.1 Groundwater Elevation .......................................................................... 5-21 5.4.2 Well Purging and Water Quality Measurements ................................... 5-21 5.4.3 Pump Decontamination .......................................................................... 5-21 5.4.4 Sample Collection Sampling Procedures ............................................... 5-21 5.4.5 Sample Handling and Shipment ............................................................. 5-21 5.4.6 Waste Management ................................................................................ 5-22
5.5 Analytical Methods ............................................................................................ 5-22 5.6 Summary of Analytical Results ......................................................................... 5-23 5.7 Quality Control Results...................................................................................... 5-24
5.7.1 Field Quality Control Samples............................................................... 5-24
5.7.1.1 Duplicate Environmental Samples .......................................... 5-24 5.7.1.2 Equipment Blank Samples ...................................................... 5-24 5.7.1.3 Trip Blank Samples................................................................. 5-25
5.7.2 Laboratory Quality Control Samples ..................................................... 5-25
5.8 Variances and Nonconformances ...................................................................... 5-25 5.9 Summary and Conclusions ................................................................................ 5-25 5.10 References .......................................................................................................... 5-27
6.0 TIJERAS ARROYO GROUNDWATER STUDY AREA .............................................. 6-1
6.1 Introduction .......................................................................................................... 6-1
6.1.1 Location ................................................................................................... 6-1 6.1.2 Site History .............................................................................................. 6-1 6.1.3 Monitoring History .................................................................................. 6-3 6.1.4 Current Monitoring Network ................................................................... 6-6 6.1.5 Summary of Calendar Year 2010 Activities ............................................ 6-8 6.1.6 Summary of Future Activities. ................................................................. 6-9 6.1.7 Current Conceptual Model ....................................................................... 6-9
6.1.7.1 Regional Hydrogeologic Conditions ....................................... 6-11

CONTENT ix
6.1.7.2 Hydrologic Conditions at the TAG Study Area ...................... 6-12 6.1.7.3 Local Direction of Flow .......................................................... 6-12 6.1.7.4 Contaminant Sources .............................................................. 6-17 6.1.7.5 Contaminant Distribution and Transport in Groundwater ...... 6-21
6.2 Regulatory Criteria............................................................................................. 6-22 6.3 Scope of Activities ............................................................................................. 6-23 6.4 Field Methods and Measurements ..................................................................... 6-23
6.4.1 Groundwater Elevation .......................................................................... 6-23 6.4.2 Well Purging and Water Quality Measurements ................................... 6-23 6.4.3 Pump Decontamination .......................................................................... 6-25 6.4.4 Sample Collection Sampling Procedures ............................................... 6-25 6.4.5 Sample Handling and Shipment ............................................................. 6-26 6.4.6 Waste Management ................................................................................ 6-26
6.5 Analytical Methods ............................................................................................ 6-26 6.6 Summary of Analytical Results ......................................................................... 6-26 6.7 Quality Control Results...................................................................................... 6-28
6.7.1 Field Quality Control Samples............................................................... 6-28
6.7.1.1 Duplicate Environmental Samples .......................................... 6-28 6.7.1.2 Equipment Blank Samples ...................................................... 6-29 6.7.1.3 Trip Blank Samples................................................................. 6-30
6.7.2 Laboratory Quality Control Samples ..................................................... 6-30
6.8 Variances and Nonconformances ...................................................................... 6-30 6.9 Summary and Conclusions ................................................................................ 6-30 6.10 References .......................................................................................................... 6-32
7.0 BURN SITE GROUNDWATER STUDY AREA .......................................................... 7-1
7.1 Introduction .......................................................................................................... 7-1
7.1.1 Location ................................................................................................... 7-1 7.1.2 Site History .............................................................................................. 7-1 7.1.3 Monitoring History .................................................................................. 7-4 7.1.4 Current Monitoring Network ................................................................... 7-7 7.1.5 Summary of Calendar Year Activities ..................................................... 7-7 7.1.6 Summary of Future Activities .................................................................. 7-8 7.1.7 Current Conceptual Model ....................................................................... 7-8

x ANNUAL GROUNDWATER MONITORING REPORT, CALENDAR YEAR 2010
7.1.7.1 Regional Hydrogeologic Conditions ......................................... 7-8 7.1.7.2 Hydrogeologic Conditions at the BSG Study Area .................. 7-9 7.1.7.3 Local Direction of Flow ............................................................ 7-9 7.1.7.4 Contaminant Sources .............................................................. 7-11 7.1.7.5 Contaminant Distribution and Transport in Groundwater ...... 7-12
7.2 Regulatory Criteria............................................................................................. 7-12 7.3 Scope of Activities ............................................................................................. 7-14 7.4 Field Methods and Measurements ..................................................................... 7-17
7.4.1 Groundwater Elevation .......................................................................... 7-17 7.4.2 Well Purging and Water Quality Measurements ................................... 7-17 7.4.3 Pump Decontamination .......................................................................... 7-17 7.4.4 Sample Collection Sampling Procedures ............................................... 7-17 7.4.5 Sample Handling and Shipment ............................................................. 7-18 7.4.6 Waste Management ................................................................................ 7-18
7.5 Analytical Methods ............................................................................................ 7-18 7.6 Summary of Analytical Results ......................................................................... 7-19 7.7 Quality Control Results...................................................................................... 7-21
7.7.1 Field Quality Control Samples............................................................... 7-21
7.7.1.1 Duplicate Environmental Samples .......................................... 7-21 7.7.1.2 Equipment Blank Samples ...................................................... 7-21 7.7.1.3 Trip Blank Samples................................................................. 7-22 7.7.1.4 Field Blank Samples ............................................................... 7-23
7.7.2 Laboratory Quality Control Samples ..................................................... 7-23
7.8 Variances and Nonconformances ...................................................................... 7-24 7.9 Summary and Conclusions ................................................................................ 7-24 7.10 References .......................................................................................................... 7-25
ATTACHMENT 2A Groundwater Protection Program Analytical Results Tables ......... 2A-1 ATTACHMENT 2B Groundwater Protection Program Monitoring Network Map and Plots ...........................................................................................2B-1 ATTACHMENT 2C Groundwater Protection Program Charts, Maps, and Hydrographs .....................................................................................2C-1 ATTACHMENT 3A Chemical Waste Landfill Analytical Results Tables ...................... 3A-1 ATTACHMENT 3B Chemical Waste Landfill Hydrographs ...........................................3B-1 ATTACHMENT 4A Mixed Waste Landfill Analytical Results Tables ........................... 4A-1 ATTACHMENT 4B Mixed Waste Landfill Hydrographs ...............................................4B-1 ATTACHMENT 5A Technical Area V Analytical Results Tables .................................. 5A-1 ATTACHMENT 5B Technical Area V Plots ....................................................................5B-1 ATTACHMENT 5C Technical Area V Hydrographs .......................................................5C-1

CONTENT xi
ATTACHMENT 6A Tijeras Arroyo Groundwater Analytical Results Tables ................. 6A-1 ATTACHMENT 6B Tijeras Arroyo Groundwater Plots ...................................................6B-1 ATTACHMENT 6C Tijeras Arroyo Groundwater Hydrographs ......................................6C-1 ATTACHMENT 7A Burn Site Groundwater Analytical Results Tables ......................... 7A-1 ATTACHMENT 7B Burn Site Groundwater Plots ...........................................................7B-1 ATTACHMENT 7C Burn Site Groundwater Hydrographs ..............................................7C-1

xii ANNUAL GROUNDWATER MONITORING REPORT, CALENDAR YEAR 2010
Chapter Tables
1-1 Sample Collection Events for Groundwater Quality Monitoring at SNL/NM from January through December 2010 ..................................................................................... 1-7
1-2 Summary of SNL/NM Groundwater Monitoring Results during CY 2010 .................... 1-9
1-3 Summary of Exceedances for SNL/NM Groundwater Monitoring Wells Sampled from January through December 2010 .......................................................................... 1-12
2-1 Groundwater Quality Regulations ................................................................................... 2-3
2-2 Field Water Quality Parameters Measured at GWPP Monitoring Wells ........................ 2-6
2-3 Water Levels Measured in Monitoring Wells by SNL/NM and Other Organizations .... 2-9
2-4 CY 2009–CY 2010 Precipitation Data at KAFB ........................................................... 2-10
2-5 Total KAFB Groundwater Well Production .................................................................. 2-10
2-6 QC Sample Types for Groundwater Sampling and Analysis ........................................ 2-14
3-1 Monitoring Wells at the CWL ......................................................................................... 3-5
3-2 Analytical Parameters at CWL Monitoring Wells for Each Sampling Period ................ 3-8
3-3 CWL Analyses, Methods, Sample Containers, Preservatives, and Holding Times ...... 3-10
4-1 Calendar Year 2010 Groundwater Sampling Events, Mixed Waste Landfill .................. 4-5
4-2 Analytical Parameters at MWL Monitoring Wells for Each Sampling Period ............... 4-9
4-3 MWL Analyses, Methods, Sample Containers, Preservatives, and Holding Times ...... 4-10
5-1 Historical Timeline of the TA-V Study Area .................................................................. 5-3
5-2 Groundwater Monitoring Wells at the TA-V Study Area ............................................... 5-9
5-3 Wastewater Disposal History at TA-V .......................................................................... 5-15
5-4 Groundwater Monitoring Well Network and Sampling Dates for the TA-V Study Area, Calendar Year 2010 .............................................................................................. 5-19
5-5 Parameters Sampled at TA-V Wells(1) for Each Sampling Event, Calendar Year 2010 ....................................................................................................................... 5-20
5-6 TA-V Study Area Chemical Analytical Methods .......................................................... 5-22
5-7 TA-V Study Area Radiochemical Analytical Methods ................................................. 5-23

CONTENT xiii
Chapter Tables (continued)
6-1 Historical Timeline of the TAG Study Area .................................................................... 6-4
6-2 Groundwater Monitoring Wells in the TAG Study Area ................................................ 6-8
6-3 Comparison of the Perched Groundwater System and the Regional Aquifer in the Tijeras Arroyo Groundwater Study Area (SNL November 2005) ................................. 6-13
6-4 Groundwater Monitoring Well Network and Sampling Dates for the TAG Study Area, Calendar Year 2010 .............................................................................................. 6-24
6-5 Parameters Sampled at TAG Wells(1) for Each Sampling Event, Calendar Year 2010 ....................................................................................................................... 6-25
6-6 TAG Study Area Chemical Analytical Methods ........................................................... 6-27
6-7 TAG Study Area Radiochemical Analytical Methods ................................................... 6-27
7-1 Historical Timeline of the Burn Site Groundwater Study Area ....................................... 7-3
7-2 Groundwater Monitoring Wells and Piezometers at the Burn Site Groundwater Study Area ....................................................................................................................... 7-5
7-3 Groundwater Monitoring Well Network and Sampling Dates for the Burn Site Groundwater Study Area, Calendar Year 2010 ............................................................. 7-15
7-4 Parameters Sampled at Burn Site Groundwater Study Area Wells(1) for Each Sampling Event, Calendar Year 2010 ............................................................................ 7-16
7-5 Burn Site Groundwater Study Area Chemical Analytical Methods .............................. 7-19
7-6 Burn Site Groundwater Study Area Radiochemical Analytical Methods ..................... 7-19
Chapter Figures
1-1 Albuquerque Basin, North-Central New Mexico ............................................................ 1-2
1-2 Generalized Geology in the Vicinity of SNL/NM and KAFB (Van Hart 2003) ............. 1-4
1-3 Hydrogeologically Distinct Areas Primarily Controlled by Faults (Modified from SNL 1995) ........................................................................................................................ 1-5
1-4 Wells and Springs within SNL/NM and KAFB .............................................................. 1-8
3-1 Location of the Chemical Waste Landfill within Technical Area III .............................. 3-2

xiv ANNUAL GROUNDWATER MONITORING REPORT, CALENDAR YEAR 2010
Chapter Figures (continued)
3-2 Chemical Waste Landfill Monitoring Well Locations and Potentiometric Surface Map ..................................................................................................................... 3-6
4-1 Location of the Mixed Waste Landfill within Technical Area III ................................... 4-2
4-2 Location of Groundwater Monitoring Wells at the Mixed Waste Landfill ..................... 4-4
4-3 Localized Potentiometric Surface of the Basin Fill Aquifer at the Mixed Waste Landfill .................................................................................................................. 4-7
5-1 Location of the TA-V Study Area ................................................................................... 5-2
5-2 TA-V Monitoring Well Locations (12 Active Wells)...................................................... 5-8
5-3 TA-V Study Area Potentiometric Surface Map (October 2010) ................................... 5-13
5-4 Distribution of TCE in Groundwater at SNL/NM TA-V, October 2010 ....................... 5-17
6-1 Location of the TAG Study Area ..................................................................................... 6-2
6-2 Tijeras Arroyo Groundwater (TAG) Investigation Monitoring Well Locations (30 Active Wells) ............................................................................................................. 6-7
6-3 TAG Conceptual Model Illustration .............................................................................. 6-10
6-4 Tijeras Arroyo Groundwater Investigation Potentiometric Surface Map for the Perched Groundwater System (October 2010) .............................................................. 6-15
6-5 Tijeras Arroyo Groundwater Investigation Potentiometric Surface Map for the Regional Aquifer (October 2010) .................................................................................. 6-19
7-1 Location of the Burn Site Groundwater Study Area ........................................................ 7-2
7-2 Wells and Piezometers in the Burn Site Groundwater Study Area (10 Active Wells) .... 7-6
7-3 Burn Site Groundwater Potentiometric Surface Map (October 2010) ........................... 7-10

CONTENT xv
Abbreviations and Acronyms
Airport Albuquerque International Sunport amsl above mean sea level AOC area of concern AOP Administrative Operating Procedure ARG Ancestral Rio Grande bgs below ground surface BSG Burn Site Groundwater CFR Code of Federal Regulations CME Corrective Measures Evaluation CMI Corrective Measures Implementation CMIP Corrective Measures Implementation Plan CMS Corrective Measures Study COA City of Albuquerque COC constituent of concern CWL Chemical Waste Landfill CY Calendar Year DI deionized DO dissolved oxygen DOE U.S. Department of Energy DRO diesel range organics DSS Drain and Septic System EB equipment blank EDMS Environmental Data Management System EPA U.S. Environmental Protection Agency ER Environmental Restoration ET evapotranspirative FB field blank FOP Field Operating Procedure FSO Field Support Operations FY Fiscal Year GEL GEL Laboratories, Inc. GRO gasoline range organics GWPP Groundwater Protection Program HE high explosive(s) HPT High Performance Team HSWA Hazardous and Solid Waste Amendments HWB Hazardous Waste Bureau IMWP Interim Measures Work Plan IRP Installation Restoration Program (U.S. Air Force) “J” data qualifier (indicating an estimated constituent concentration that was detected
but is below the laboratory practical quantitation limit)

xvi ANNUAL GROUNDWATER MONITORING REPORT, CALENDAR YEAR 2010
Abbreviations and Acronyms (continued)
KAFB Kirtland Air Force Base LCS laboratory control sample LE Landfill Excavation LWDS Liquid Waste Disposal System Ma Mega Annum MAC maximum allowable concentration (established by the NMED) MCL maximum contaminant level MDA minimum detectable activity MDL method detection limit MWL Mixed Waste Landfill NAD83 North American Datum of 1983 NAVD88 North American Vertical Datum of 1988 NMAC New Mexico Administrative Code NMED New Mexico Environment Department NMWQCC New Mexico Water Quality Control Commission NNSA National Nuclear Security Administration NOD Notice of Disapproval NPN nitrate plus nitrite OB Oversight Bureau ORP oxidation-reduction potential PCB polychlorinated biphenyl PCE tetrachloroethene PGWS perched groundwater system PQL practical quantitation limit PVC polyvinyl chloride QC quality control QED™ MicroPurge, low-flow sampling method RCRA Resource Conservation and Recovery Act RDX hexahydro-trinitro-triazine RFI RCRA Facility Investigation RPD relative percent difference Sandia Sandia Corporation SAP Sampling and Analysis Plan SC specific conductance SDWA Safe Drinking Water Act SMO Sample Management Office SNL/NM Sandia National Laboratories, New Mexico SVOC semivolatile organic compound SWMU Solid Waste Management Unit TA Technical Area TAG Tijeras Arroyo Groundwater (Investigation) TAL Target Analyte List TB trip blank TCE trichloroethene (equivalent to trichloroethylene)
CONTENT xvii
Abbreviations and Acronyms (concluded)
TOX total organic halogens TPH total petroleum hydrocarbons USAF U.S. Air Force USGS U.S. Geological Survey VA Veterans Administration VCM Voluntary Corrective Measure VE Vapor Extraction VOC volatile organic compound

xviii ANNUAL GROUNDWATER MONITORING REPORT, CALENDAR YEAR 2010
Monitoring Well Location Descriptions
AVN-# Area V (North) CTF-# Coyote Test Field CWL-# Chemical Waste Landfill CYN-# Lurance Canyon LWDS-# Liquid Waste Disposal MP-# Montessa Park MRN-# Magazine Road North MVMWJ Mountain View Monitoring
Well J MVMWK Mountain View Monitoring
Well K MWL-# Mixed Waste Landfill NMED-# New Mexico Environment
Department NWTA3-# Northwest Technical Area III PGS-# Parade Ground South PL-# Power Line Road SFR-# South Fence Road
STW-# Solar Tower (West) SWTA-# Southwest Technical Area III TA1-W-# Technical Area I (Well) TA2-NW-# Technical Area II
(Northwest) TA2-SW-# Technical Area II
(Southwest) TA2-W-# Technical Area II (Well) TAV-# Technical Area V TJA-# Tijeras Arroyo TRE-# Thunder Road East TRN-# Target Road North TRS-# Target Road South TSA-# Transportation Safeguards
Academy WYO-# Wyoming 12AUP-# ER Site 12A Underflow
Piezometer * Meteorological Towers * SC1 School House * A-21 TA-I
* A-36 TA-III and TA-V
Units °C degree Celsius μg/L microgram(s) per liter μmhos/cm microhm(s) per centimeter
(unit of specific conductance) ac-ft acre feet ft foot (feet) ft3 cubic feet ft3/yr cubic feet per year ft/ft feet/foot ft/yr feet per year gal. gallon(s) gpm gallons per minute in./yr inches per year m meter(s)
mg/L milligram(s) per liter mL milliliter(s) mrem/yr millirem per year mV millivolt(s) NTU nephelometric turbidity units pCi/g picocuries per gram pCi/L picocuries per liter pH potential of hydrogen ppb part(s) per billion, equivalent
to μg/L in water ppbv part(s) per billion by volume sq km square kilometer(s) sq mi square mile(s) yr year(s)
EXECUTIVE SUMMARY ES-1
Annual Groundwater Monitoring Report Executive Summary Sandia Corporation (Sandia) conducts general groundwater surveillance monitoring at Sandia National Laboratories, New Mexico (SNL/NM) on a site-wide basis as part of the SNL/NM Groundwater Protection Program (GWPP) and site-specific groundwater monitoring at Environmental Restoration (ER) Operations sites with an ongoing groundwater investigation. The SNL/NM facility is located on Kirtland Air Force Base (KAFB). Sandia National Laboratories is a multi-program laboratory managed and operated by Sandia, a wholly owned subsidiary of Lockheed Martin Corporation, for the U.S. Department of Energy’s (DOE) National Nuclear Security Administration under contract DE-AC04-94AL85000. This Annual Groundwater Monitoring Report documents the results of Sandia’s groundwater monitoring activities for Calendar Year (CY) 2010. This report is being prepared to meet the environmental reporting requirements for the CY 2010 Annual Site Environmental Report, reporting to regulators and outside agencies as well as a valuable tool to inform the public about the groundwater quality at SNL/NM. This report includes both water quality sampling results and water level measurements. Separate chapters focus on the investigation activities at each of the following monitoring networks maintained by Sandia: GWPP site-wide surveillance (Chapter 2.0); Chemical Waste Landfill (CWL) (Chapter 3.0); Mixed Waste Landfill (MWL) (Chapter 4.0); Technical Area (TA)-V (Chapter 5.0); Tijeras Arroyo Groundwater (TAG) (Chapter 6.0); and Burn Site Groundwater (BSG) (Chapter 7.0). Chapter 1.0 provides the general site description for the SNL/NM facility and describes the regulatory criteria for SNL/NM groundwater monitoring tasks. The regional aquifer supplying the City of Albuquerque (COA) and KAFB is located within the Albuquerque Basin. The regional aquifer is mostly contained within the upper unit and, to some extent, the middle unit of the Santa Fe Group. The edge of the basin on the east side is defined by the Sandia, Manzanita, and Manzano Mountains, which have uplifted along normal faults. KAFB straddles the east side of the basin and is divided approximately in half by bounding faults. On KAFB, the basin is primarily defined by the north-south–trending Sandia fault and the Hubbell Springs fault. The Tijeras fault, a strike-slip fault that trends northeast-southwest, intersects the Sandia and Hubbell Springs faults forming a system of faults collectively referred to as the Tijeras fault complex. The faults form a distinct hydrogeological boundary between the regional aquifer within the basin (approximately 500 feet [ft] below ground surface [bgs]) and the more shallow bedrock aquifer systems within the uplifted areas (generally between 50 to 325 ft bgs). Currently there are five ER Operations groundwater monitoring networks: (1) TA-V; (2) TAG; (3) CWL; (4) MWL; and (5) BSG. At SNL/NM, solid waste management units (SWMUs) are regulated under the Hazardous and Solid Waste Amendment (HSWA) module of the Resource Conservation and Recovery (RCRA) Permit. In the HSWA module, a SWMU is defined as “any discernible unit at which solid wastes have been placed at any time, irrespective of whether the unit was intended for the management of solid or hazardous waste.” Monitoring and/or corrective action requirements generally are determined on a SWMU-specific basis following a site investigation. Monitoring performed at the MWL and the three ER Operations groundwater investigations (TA-V, TAG, and BSG Study Areas) are subject to the direction provided by the Compliance Order on Consent (the Order) between the New Mexico Environment Department (NMED), the DOE, and Sandia (NMED April 2004). The CWL is an interim status landfill that has undergone closure in accordance with 20.4.1.600 New Mexico Administrative Code (NMAC), incorporating 40 Code of Federal Regulations (CFR) 265, Subpart G, and the CWL Closure Plan (SNL December 1992, as amended).

ES-2 ANNUAL GROUNDWATER MONITORING REPORT, CALENDAR YEAR 2010
Groundwater Quality Monitoring Activities and Results During CY 2010, groundwater samples were collected from GWPP, CWL, MWL, TA-V, TAG, and BSG monitoring wells. The analytical results for samples from all monitoring wells were compared with maximum contaminant levels (MCLs) established by the U.S. Environmental Protection Agency (EPA). The results for GWPP monitoring wells were also compared with NMED maximum allowable concentrations (MACs) promulgated for groundwater by the State of New Mexico Water Quality Control Commission (NMWQCC). The results are summarized in the following sections, and the data are presented in the attachments following each chapter. Groundwater Protection Program Chapter 2.0 documents the results of the CY 2010 groundwater surveillance monitoring activities conducted as part of the SNL/NM GWPP. The surveillance activities include the annual collection and analysis of groundwater samples from 16 monitoring wells and 1 surface water sample from a spring. Water levels were measured at 78 monitoring wells. Water level measurements were obtained either monthly or quarterly depending on the response characteristics of the groundwater system at each well location to pumping or other stresses. Annual sampling of groundwater was conducted during March 2010. Samples collected from all locations were analyzed for Safe Drinking Water Act list volatile organic compounds (VOCs); total organic halogens; total phenols; total alkalinity; nitrate plus nitrite (NPN); total cyanide; major anions; Target Analyte List (TAL) metals plus uranium-234, uranium-235, and uranium-238; mercury; gamma spectroscopy; gross alpha/beta activity; radium-226; and radium-228. Additional samples were collected at selected monitoring wells for analysis of high explosives (HE) and isotopic uranium. The analytical results for the groundwater samples are similar to the results reported for previous years. No analytical parameters exceed established MCLs or MACs, except for arsenic, beryllium, fluoride, and combined radium-226 and radium-228. No VOCs or HE compounds were detected above established MCLs or MACs. The HE compound RDX [hexahydro-trinitro-triazine] was detected in the groundwater sample from monitoring well CTF-MW2 at a concentration of 0.170 micrograms per liter (µg/L). Fluoride was detected above the NMWQCC groundwater protection MAC of 1.6 milligrams per liter (mg/L) at four sampling locations. The concentrations range from 1.62 to 2.44 mg/L. The EPA MCL for fluoride is 4.0 mg/L. Arsenic was detected above the MCL of 0.01 mg/L in the groundwater sample from CTF-MW2 at a concentration of 0.0535 mg/L. Beryllium was detected in the surface water sample from Coyote Springs at a concentration of 0.00713 mg/L. The MCL for beryllium is 0.004 mg/L. Beryllium has been consistently detected in the surface water samples from the springs and is considered to be of natural origin. Combined radium-226 and radium-228 activity levels in the CTF-MW2 sample exceed the MCL of 5.0 pCi/L. Activity for radium-226 was reported in the sample from CTF-MW2 at 2.16 ± 0.0854 pCi/L and for radium-228 at 7.94 ± 2.10 pCi/L. Water table elevation measurements were obtained throughout CY 2010 at 78 locations on a monthly and quarterly basis. Water level elevation measurements obtained from 32 representative monitoring wells located west of both the Tijeras fault zone and Sandia fault at KAFB and vicinity were used to construct contours of water table elevation. The contours display a pattern that reflects the impact of the groundwater withdrawal by water supply wells located in the northwestern portion of KAFB and COA wells located north of the base. A contour map of the differences in the regional water table elevations between the same periods for CY 2010 and CY 2009 indicate the area of greatest decline is in the southeast quadrant of the mapped area.

EXECUTIVE SUMMARY ES-3
Water level elevations were also obtained from 19 wells completed in the perched groundwater system (PGWS) to construct a water level elevation contour map. The contours indicate groundwater flow in the PGWS is from the northwest to southeast. Water levels are declining in the northwest and increasing slightly in the east presumably due to the drainage of the system to the east and perhaps some additional recharge from the Tijeras Arroyo. Chemical Waste Landfill Chapter 3.0 discusses the CWL semiannual groundwater monitoring activities performed during April and in November and December 2010. Groundwater samples were collected from six monitoring wells in April (CWL-MW2BL, CWL-MW4, CWL-MW5L, CWL-MW5U, CWL-MW6L, and CWL-MW6U) and from four new wells in November and December (CWL-BW5, CWL-MW9, CWL-MW10, CWL-MW11). The samples were analyzed for Title 40, CFR, Section 264, Appendix IX VOCs and total metals plus iron. The NMED DOE Oversight Bureau (OB) participated in both April and November-December 2010 sampling events and received split samples from three CWL monitoring wells (CWL-MW2BL, CWL-MW4, and CWL-MW5U) in April, and from three monitoring wells (CWL-MW9, CWL-MW10, and CWL-MW11) in November and December. Additional samples were collected for total aluminum, calcium, magnesium, manganese, potassium, and sodium at selected well locations to duplicate the NMED DOE OB analyses. No analytes were detected at concentrations exceeding the associated EPA MCLs in any CWL groundwater samples. The analytical results are comparable to historical values. The negotiations on the NMED Draft Post-Closure Care Permit for the CWL were completed on October 15, 2009, and documented in the settlement agreement and Final Order In the Matter of Application for a Post-Closure Care Hazardous Waste Permit for the Chemical Waste Landfill, Sandia National Laboratories No. NM5890110518 (Final Order). On October 16, 2009, the NMED issued a Notice of Approval, Final Remedy and Closure Plan Amendment, Chemical Waste Landfill. The NMED approval covers the CWL Closure Plan amendment that addresses the replacement of four groundwater monitoring wells (two of which are dual completion wells), the CWL Post-Closure Care Permit, and the CWL Final Remedy. As agreed to in the negotiations and documented in the NMED-approved CWL Closure Plan amendment, monitoring wells CWL-MW4, CWL-MW5L, CWL-MW5U, CWL-MW6L, CWL-MW6U, and CWL-BW4A were decommissioned and new monitoring wells CWL-MW9, CWL-MW10, CWL-MW11, and CWL-BW5 were installed in 2010. The CWL Post-Closure Care Permit takes effect and supersedes the CWL Closure Plan (SNL December 1992) immediately upon NMED approval of the Final CWL RCRA Closure Report. All future groundwater monitoring will be performed in accordance with the requirements in the approved Permit. As defined in Title 20.4.1.500, NMAC, incorporating 40 CFR 264.117(a)(1), the post-closure care period is 30 years. The NMED may shorten or extend this period under 20.4.1.500 NMAC, incorporating 40 CFR 264.117(a)(2). Mixed Waste Landfill Chapter 4.0 discusses the MWL quarterly and annual groundwater sampling activities conducted in January, April, and July 2010. Groundwater samples were collected from seven monitoring wells and analyzed for volatile organic compounds (VOCs), Target Analyte List (TAL) metals plus uranium, anions (as bromide, chloride, fluoride, and sulfate), total alkalinity, nitrate plus nitrite (NPN), gamma spectroscopy, gross alpha, gross beta, and tritium. Additional samples were collected and analyzed for SVOCs (January and April), low-level tritium (April), and isotopic uranium and radon-222 (July). The NMED DOE OB participated in all sampling events and received split samples that were submitted to a different laboratory for analysis. During April, the NMED DOE OB requested additional samples for low-level tritium analysis at each location except MWL-BW2. Additional samples were collected for low-level tritium at selected well locations to duplicate the NMED DOE OB analyses. No analytes were

ES-4 ANNUAL GROUNDWATER MONITORING REPORT, CALENDAR YEAR 2010
detected at concentrations exceeding the associated EPA MCLs in any MWL groundwater samples. The analytical results are comparable to historical values. Wells MWL-MW7, MWL-MW8, MWL-MW9, and MWL-BW2 were considered new wells and, as required by the Compliance Order on Consent (the Order) (NMED 2004), were sampled a minimum of eight consecutive quarters for a defined suite of parameters in addition to sampling for perchlorate for at least four consecutive quarters. The four consecutive quarters of perchlorate sampling were completed in CY 2009 with no detections at or above the screening level of 4 micrograms per liter (µg/L); therefore, these wells have been removed from the perchlorate monitoring network. The required eight quarterly sampling events were completed in CY 2010. Wells MWL-MW4, MWL-MW5, and MWL-MW6 are preexisting wells and are sampled on an annual basis. All MWL wells are now being sampled annually as required by the Order. In April 2010 the DOE and Sandia received a letter from the NMED entitled Toluene Detections in Groundwater, which required further investigation to determine the source of very low toluene concentrations in some MWL 2008 through early 2010 groundwater samples, including conducting a purging/sampling study of the groundwater along with any other studies necessary to determine the source. DOE/Sandia submitted the MWL Toluene Investigation Report in August 2010 and received an NOD with two comments from the NMED in September 2010. The DOE/Sandia NOD response submitted in October 2010 included a revised version of the report and was approved by NMED in January 2011. The MWL Corrective Measures Implementation (CMI) Report documents the construction of the MWL ET cover and was submitted to the NMED on January 26, 2010. After NMED approval of the CMI Report, DOE and Sandia will revise the 2007 MWL Long-Term Monitoring and Maintenance Plan and submit the revised plan to the NMED for review and approval. The plan will define the long-term monitoring, maintenance, inspection, and repair requirements for the MWL. Technical Area V Study Area Chapter 5.0 discusses the TA-V groundwater monitoring activities conducted during CY 2010. Trichloroethene (TCE) and nitrate have been identified as constituents of concern (COCs) in groundwater at the TA-V Groundwater Investigation study area based on detections above the EPA MCL in samples collected from monitoring wells. Currently 12 wells in the TA-V study area are being monitored for water quality and water levels. Table XI-1 of the Order specifies that the sampling frequency for groundwater monitoring at TA-V is quarterly. Unique features of the TA-V study area include low concentrations of TCE and nitrate in a deep alluvial aquifer. The conceptual site model of contaminant transport at TA-V includes release from the source term, migration through the vadose zone, and movement in groundwater. The potential sources of TCE and/or nitrate in the TA-V study area include wastewater disposal systems and seepage pits. Based on the historical use and disposal of chlorinated solvents, the extent of TCE in groundwater is probably associated with multiple aqueous releases of solvents and subsequent vapor-phase transport through the vadose zone. The slow rate of groundwater flow (4 to 20 ft/yr) is responsible for the present distribution of TCE in the aquifer. Only NPN and TCE were detected above MCLs in the TA-V study area wells. NPN concentrations exceed the MCL of 10 mg/L in samples from LWDS-MW1 and TAV-MW10, with a maximum concentration of 13.7 mg/L in the sample collected from TAV-MW10 in October 2010. During CY 2010, TCE exceeded the MCL of 5 g/L in samples from three wells (LWDS-MW1, TAV-MW6, and TAV-MW10). The maximum concentration of TCE detected during this reporting period is 18.6 g/L in the sample collected from LWDS-MW1 in October 2010.

EXECUTIVE SUMMARY ES-5
The analytical results for this reporting period are consistent with historical concentrations. The current conceptual site model for the TA-V study area does not require modification based on the sampling results for CY 2010. The following activities took place for the TA-V study area during CY 2010:
Monthly water level measurements were obtained for all TA-V wells. Quarterly groundwater sampling events were conducted at 12 wells in February 2010,
May 2010, August/September 2010, and October 2010.
Quarterly perchlorate screening groundwater sampling and reporting were performed for LWDS-MW1 in February 2010.
Installed groundwater monitoring wells TAV-MW11, TAV-MW12, TAV-MW13, and
TAV-MW14. Tijeras Arroyo Groundwater Study Area Chapter 6.0 addresses groundwater monitoring activities conducted during CY 2010 at the TAG study area. Currently, 21 wells in the TAG study area are being monitored for water quality, and 27 wells are monitored for water levels. Two groundwater systems are present in the TAG study area: the PGWS at approximately 220 to 330 ft bgs, and the regional aquifer groundwater system at approximately 440 to 570 ft bgs. Groundwater monitoring wells are completed either in the PGWS or regional aquifer. Unique features of the TAG area include low concentrations of TCE at scattered locations in the PGWS, and low concentrations of nitrate at scattered locations in the PGWS and regional aquifer. For CY 2010, wells were sampled in January/February, May, July/August, and October/November. The samples were analyzed for VOCs, NPN, anions, perchlorate, TAL metals (plus uranium), gross alpha/beta activity, tritium, and radionuclides by gamma spectroscopy. Depending on their locations and historical concentrations of COCs, wells were sampled quarterly, semiannually, or annually during this reporting period. Both TCE and nitrate have been identified as COCs in groundwater at the TAG study area based on historical groundwater monitoring results. Only NPN and TCE were detected above MCLs in samples from TAG study area wells. In CY 2010, NPN concentrations exceeded the MCL of 10 mg/L in samples from TA2-SW1-320, TJA-4, and TJA-7 during all sampling events, with a maximum concentration of 33.3 mg/L in the sample from TJA-7 collected during the October/November 2010 sampling event. NPN concentrations occasionally exceeded the MCL in samples from TJA-2 and TA2-W-19. During CY 2010, TCE exceeded the MCL of 5 g/L in one PGWS well, WYO-4. The maximum concentration of TCE detected during this reporting period is 8.94 µg/L in the sample from WYO-4 collected during the October/November 2010 sampling event. TCE concentrations in samples from WYO-4 have slightly exceeded the MCL, and trends are level to slightly increasing over time. The analytical results for this reporting period are consistent with historical concentrations. The current conceptual site model for the TAG study area does not require modification based on the sampling results for CY 2010.

ES-6 ANNUAL GROUNDWATER MONITORING REPORT, CALENDAR YEAR 2010
The following activities took place for the TAG study area during CY 2010:
Monthly water level measurements were obtained from TAG wells.
Quarterly groundwater sampling events were conducted at seven wells (TA2-SW1-320, TA2-W-19, TA2-W-26, TJA-2, TJA-4, TJA-7, and WYO-4) in January/February 2010, May 2010, July/August 2010, and October/November 2010.
Semiannual groundwater sampling was conducted at four wells (TA2-W-01, TA2-W-27,
TJA-3, and TJA-6) in January/February 2010 and July/August 2010.
Annual groundwater sampling was conducted at nine wells (PGS-2, TA1-W-01, TA1-W-02, TA1-W-04, TA1-W-05, TA1-W-06, TA1-W-08, TA2-NW1-595, and WYO-3) in July/August 2010.
Quarterly perchlorate screening groundwater sampling was conducted at up to five wells
(TA1-W-03, TA1-W-06, TA1-W-08, TA2-W-01, and TA2-W-27) in January/February 2010, May 2010, July/August 2010, and October/November 2010.
Burn Site Groundwater Study Area Chapter 7.0 discusses the groundwater monitoring activities conducted during CY 2010 at the BSG study area, which is located around the active Lurance Canyon Burn Site facility. Groundwater investigations were initiated in 1997 at the request of the NMED after elevated nitrate levels were discovered in the Burn Site Well (a nonpotable production well used for fire suppression). The study area consists of 10 monitoring wells, and samples were collected and analyzed for VOCs, total petroleum hydrocarbons (TPH)-diesel range organics, TPH-gasoline range organics, anions, NPN, TAL metals (plus uranium), gross alpha/beta activity, tritium, and radionuclides by gamma spectroscopy. As required by the NMED, semiannual sampling for perchlorate was conducted at CYN-MW6, and quarterly sampling for perchlorate was conducted at CYN-MW9, CYN-MW10, CYN-MW11, and CYN-MW12. Only NPN was detected above MCLs in samples from study area wells. NPN results exceed the MCL of 10 mg/L in samples from CYN-MW1D, CYN-MW3, CYN-MW6, CYN-MW9, CYN-MW10, CYN-MW11, and CYN-MW12, with a maximum concentration of 36.6 mg/L in the sample from CYN-MW9 collected during the October 2010 sampling event. Perchlorate was detected above the MDL of 4 µg/L only in samples collected from CYN-MW6. Perchlorate concentrations range from 4.59 to 6.14 µg/L, with all results qualified with “J” by the laboratory as estimated concentrations. Currently, no MCL is established for perchlorate but it is considered a COC because it exceeds the specified screening level/MDL of 4 µg/L in samples from CYN-MW6 (NMED April 2004) The analytical results for this reporting period are consistent with historical concentrations. The current conceptual site model does not require modification based on the sampling results for CY 2010.

EXECUTIVE SUMMARY ES-7
The following activities took place for the BSG study area during CY 2010:
Quarterly groundwater sampling events were conducted at four wells (CYN-MW9, CYN-MW10, CYN-MW11, and CYN-MW12) in September 2010 and October/November 2010.
Semiannual groundwater sampling was conducted at six wells (CYN-MW1D, CYN-MW3,
CYN-MW4, CYN-MW6, CYN-MW7, and CYN-MW8) in February/March 2010, May/June 2010, and September 2010.
Soil sampling activities were completed in July 2010 at 10 deep soil boring locations to determine contaminant sources.
Four groundwater monitoring wells (CYN-MW9, CYN-MW10, CYN-MW11,
CYN-MW12) were installed in July 2010 to determine the extent of groundwater contamination.
Future Groundwater Monitoring Events The groundwater monitoring events conducted on a site-wide basis as part of the SNL/NM GWPP and at site-specific ER Operations sites will continue on a quarterly, semiannual, annual, and biannual basis during CY 2011, as specified by regulatory guidance. The results for these monitoring events will be presented in the Annual Groundwater Monitoring Report for CY 2011.

ES-8 ANNUAL GROUNDWATER MONITORING REPORT, CALENDAR YEAR 2010
This page intentionally left blank.

INTRODUCTION 1-1
1.0 Introduction Sandia Corporation (Sandia) conducts general groundwater surveillance monitoring at Sandia National Laboratories, New Mexico (SNL/NM) on a site-wide basis as part of the SNL/NM Groundwater Protection Program (GWPP) and site-specific groundwater monitoring at Environmental Restoration (ER) Operations (formerly ER Project) sites with ongoing groundwater investigations. The purpose of this document is to report to regulators and other stakeholders the results of Sandia’s groundwater monitoring activities for Calendar Year 2010. Separate chapters focus on the investigation activities at each of the following monitoring networks maintained by Sandia: GWPP site-wide surveillance (Chapter 2.0); Chemical Waste Landfill (CWL) (Chapter 3.0); Mixed Waste Landfill (MWL) (Chapter 4.0), Technical Area (TA)-V (Chapter 5.0), Tijeras Arroyo Groundwater (TAG) (Chapter 6.0), and the Burn Site Groundwater (BSG) (Chapter 7.0).
1.1 Site Description
The SNL/NM facility is located on Kirtland Air Force Base (KAFB), New Mexico. KAFB is a 51,559-acre military installation that includes 20,486 acres withdrawn from the Cibola National Forest through an agreement with the U.S. Forest Service. Located at the foot of the Manzanita Mountains, KAFB has a mean elevation of 5,384 feet (ft) above mean sea level (amsl) and a maximum elevation of 7,986 ft amsl. KAFB and SNL/NM are located adjacent to the City of Albuquerque (COA), which borders KAFB on its north, northeast, west, and southwest boundaries (Figure 1-1). SNL/NM is a multi-program laboratory managed and operated by Sandia, a wholly owned subsidiary of Lockheed Martin Corporation, for the U.S. Department of Energy’s (DOE) National Nuclear Security Administration (NNSA) under contract DE-AC04-94AL85000.
1.1.1 Climate
The Albuquerque area is characterized by low precipitation and wide temperature extremes that are typical of high-altitude, dry, continental climates. The average annual precipitation measured at Albuquerque International Sunport is 9.47 inches (National Oceanic and Atmospheric Administration National Weather Service station); half of this precipitation occurs from June through August in the form of brief but intense thunderstorms. Because of the low humidity and generally warm temperatures, the evaporation potential is high.
1.1.2 Geologic Setting
SNL/NM is located near the east-central edge of the Albuquerque Basin on KAFB. The Albuquerque Basin (also known as the Middle Rio Grande Basin) is one of a series of north-south–trending basins that was formed during the extension of the Rio Grande Rift. The basin is approximately 3,000 square miles (sq mi) in area. Rift formation initiated in the late Oligocene and continued into the early Pleistocene, with the primary period of extension occurring between 30 and 5 Mega Annum (Ma). Tectonic activity, which began uplifting the Sandia, Manzanita, and Manzano Mountains, was most prevalent from about 15 to 5 Ma (Thorn et al. 1993). The rift today extends from southern Colorado to northern Mexico. The vertical displacement between the rock units exposed at the top of Sandia Crest and the equivalent units located at the bottom of the basin is more than 3 miles. As shown in Figure 1-1, the structural boundaries of the Albuquerque Basin are as follows:
Colorado Plateau on the west Nacimiento Uplift and the Jemez Mountains to the north La Bajada Escarpment to the northeast

1-2 ANNUAL GROUNDWATER MONITORING REPORT, CALENDAR YEAR 2010
Figure 1-1. Albuquerque Basin, North-Central New Mexico

INTRODUCTION 1-3
Sandia, Manzanita, Manzano, and Los Pinos mountains to the east Joyita and Socorro uplifts to the south Ladron and Lucero uplifts to the southwest
As the Rio Grande Rift continued to expand, the Albuquerque Basin subsided. Over the last 30 Ma, the Ancestral Rio Grande meandered across the valley formed by the subsidence and deposited sediments in broad stream channels and floodplains derived from sources to the north. The basin also filled with eolian deposits and alluvial materials shed from surrounding uplifts (Hawley and Haase 1992). This sequence of sediments is called the Santa Fe Group. The thickness of the Santa Fe Group is up to 16,400 ft (5,000 meters [m]) at the deepest part of the basin (Lozinsky, 1994). The entire sequence consists of unconsolidated sediments, which thin toward the edge of the basin and are truncated by normal faults at the bounding uplifts. Units overlying the Santa Fe Group include Pliocene Ortiz gravel and Rio Grande fluvial deposits, which are interbedded with Tertiary and Quaternary basaltic and pyroclastic materials. As shown in Figures 1-2 and 1-3, the four primary faults on the east side of KAFB are (1) the Sandia fault, (2) the West Sandia fault, (3) the Hubbell Springs fault, and (4) the Tijeras fault. The Sandia fault is thought to be the primary boundary between the Sandia Mountains and the Albuquerque Basin. The Hubbell Springs fault extends northward from Socorro County and terminates on KAFB in the vicinity of the Tijeras fault. The Sandia and the Hubbell Springs faults are north-south–trending, down-to-the-west, en-echelon normal faults bounding the east side of the Albuquerque Basin. The Tijeras fault is an ancient strike-slip fault that developed in the Precambrian or early Paleozoic (approximately 600 Ma) and was reactivated in association with the Laramide Orogeny during the Cretaceous period (Kelley 1977). The fault also demonstrates Quaternary movement (Kelson et al. 1999; GRAM 1995). This fault has been traced at least as far north as Madrid, New Mexico, and continues into the Sangre de Cristo Mountains as the Cañoncito fault. Preferential erosion along the fault formed Tijeras Canyon, which divides the Sandia and Manzanita Mountains. The fault trends southwest from Tijeras Canyon, intersects the northeast boundary of KAFB, and crosses KAFB east of Manzano Base. Manzano Base occupies an uplift of four peaks defined by the Tijeras fault on the east side and the Sandia fault on the west side. Strike-slip motion along the Tijeras fault is thought to be expressed by southwesterly movement of the northern block (left lateral). The Sandia, Hubbell Springs, and Tijeras faults converge near the southeast end of TA-III. This complicated system of faults, defining the east edge of the basin, is referred to collectively as the Tijeras fault complex.
1.1.3 Hydrogeology
Figure 1-3 shows three different hydrogeologic regions for the KAFB area: (1) the Albuquerque Basin, (2) the Tijeras fault complex, and (3) the foothills and canyons region. The primary division is between the east and west sides of the Tijeras fault complex, which is the transitional zone. This division marks the boundary between the two regional aquifer systems. It is important to note that the boundaries shown on the map are somewhat arbitrary but identify the approximate hydrologic settings. A deep aquifer is present within the Albuquerque Basin where the regional water table lies at approximately 500 ft (152 m) below ground surface (bgs). A perched groundwater system (perched system) also lies above the regional aquifer in the vicinity of TA-I, TA-II, and TA-IV in the TAG area of concern (AOC). The perched system extends south to the KAFB Golf Course area, north to portions of TA-I, west of TA-II, and east of the KAFB Landfill. Possible explanations for the existence of a perched system are inter-arroyo recharge, irrigation of the golf course and other vegetated areas, water leakage from utility distribution lines, and infiltration from an unlined sewage lagoon system (SNL 1998).

1-4 ANNUAL GROUNDWATER MONITORING REPORT, CALENDAR YEAR 2010
Figure 1-2. Generalized Geology in the Vicinity of SNL/NM and KAFB (Van Hart 2003)
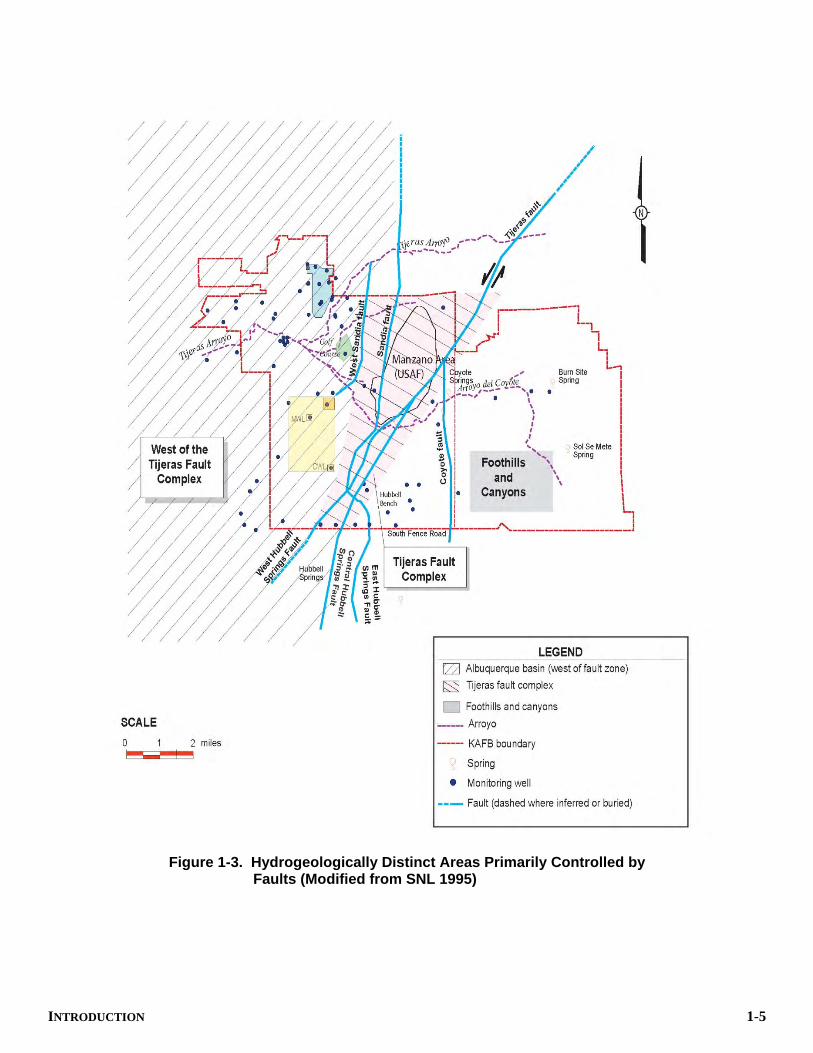
INTRODUCTION 1-5
Figure 1-3. Hydrogeologically Distinct Areas Primarily Controlled by Faults (Modified from SNL 1995)

1-6 ANNUAL GROUNDWATER MONITORING REPORT, CALENDAR YEAR 2010
East of the Tijeras fault complex, a thin layer of alluvium covers the bedrock. The hydrogeology in this area is poorly understood due to the complex geology created by the fault systems. On the east side of the Tijeras fault complex the depth to groundwater ranges from about 45 to 325 ft (14 to 99 m) bgs. Most of the water supply and monitoring wells east of the faults are completed in fractured bedrock at relatively shallow depths and produce modest yields of groundwater. Groundwater in the bedrock aquifers on the east side of KAFB generally flows west out of the canyons toward the Tijeras fault complex. The groundwater gradient is relatively steep, 0.03 feet per foot (ft/ft), in crossing the Tijeras fault complex from east to west. The elevation change in the water levels is 350 ft (106 m) over 15,840 ft (4,828 m). The steep gradient suggests that westward groundwater flow is retarded by the Tijeras fault complex. Within the sediments of the Albuquerque Basin, the gradient flattens out quickly to about 0.005 ft/ft. The historic direction of regional groundwater flow within the basin was westward from the mountains toward the Rio Grande. However, due to groundwater pumping by KAFB and COA, a depression in the water table has created a broad trough originating at the well fields in the northwest end of KAFB. The impact of the seasonal variation in water production by both KAFB and COA wells can be observed as fluctuations in the water levels of some SNL/NM and KAFB monitoring wells as far east and south as TA-III.
1.1.4 Surface Water Hydrology
The Rio Grande, located approximately 8 miles west of KAFB, is the major surface hydrologic feature in central New Mexico. The Rio Grande originates in the San Juan Mountains of Colorado and terminates at the Gulf of Mexico, near Brownsville, Texas. The Rio Grande has a total length of 1,760 miles (2,832 kilometers) and is the third longest river system in North America. Surface water (with the exception of several springs) within the boundaries of KAFB is found only as ephemeral streams that flow for short periods from runoff after storm events or during the spring melt of mountain snow packs. The primary surface water feature that drains the eastern foothills on KAFB is the Tijeras Arroyo. The Arroyo del Coyote joins Tijeras Arroyo just south of TA-IV (about 1 mile west of the golf course [Figure 1-3]). Both Tijeras Arroyo and Arroyo del Coyote carry significant runoff after heavy storms that usually occur from June through August. The Tijeras Arroyo, above the confluence with Arroyo del Coyote, drains about 80 sq mi (207 square kilometer [sq km]), while Arroyo del Coyote drains about 39 sq mi (101 sq km) (USACE 1979). The total watershed for the Tijeras Arroyo, which includes the Sandia and Manzanita Mountains and portions of KAFB, is approximately 126 sq mi (336 sq km). All active SNL/NM facilities are located outside the 100-year floodplain of both Tijeras Arroyo and Arroyo del Coyote (USACE 1979). Several springs on KAFB are associated with the uplifts on the east side of the basin: (1) Coyote Springs and G-Spring within Arroyo del Coyote, (2) Burn Site Spring in Lurance Canyon, and (3) Sol se Mete Spring within the Manzanita Mountains. Coyote Springs and Sol se Mete are perennial springs (continuously flowing), while the others are ephemeral springs. Hubbell Springs (a perennial spring) is located just south of KAFB on Isleta Pueblo. The wetland areas created by these springs, though very limited in extent, provide a unique ecological niche in an otherwise arid habitat. Groundwater recharge in the vicinity of KAFB is primarily derived from the eastern mountain front and within the major arroyos. However, the amount of recharge occurring in the foothills and canyons is not well characterized. The estimated recharge for that portion of Tijeras Arroyo on KAFB is estimated to be up to 2.2 million cubic feet per year (ft3/yr) (50 acre ft [ac-ft]/yr) (SNL 1998). The best estimate for the groundwater recharge associated with Arroyo del Coyote is 0.4 million ft3/yr (9.2 ac-ft/yr). Infiltration studies conducted by the ER Site-Wide Hydrogeologic Characterization Project determined that recharge is negligible due to the high rate of evapotranspiration for most other areas on KAFB, generally alluvial slopes and flat areas within the basin (SNL 1998).

INTRODUCTION 1-7
1.2 Groundwater Monitoring
Extensive groundwater monitoring is conducted at KAFB. The U.S. Air Force (USAF) Installation Restoration Program has a large monitoring well network associated with several closed landfills and a closed sewage lagoon. Additional KAFB wells are sited to monitor and characterize several nitrate plumes and an extensive jet fuel/aviation gasoline plume on the base. Sandia monitors groundwater on KAFB at locations associated with DOE-owned facilities and sites permitted by the USAF for DOE use. Groundwater monitoring by Sandia is conducted by ER Operations and the GWPP. Figure 1-4 illustrates the extensive monitoring well network at KAFB. Table 1-1 lists the CY 2010 sampling events conducted at the GWPP and ER Operations monitoring networks maintained at SNL/NM.
Table 1-1. Sample Collection Events for Groundwater Quality Monitoring at SNL/NM from January through December 2010
Sampling Event GWPP CWL MWL TA-V TAG BSG
Jan 10 √ √ Feb 10 √ √ √ Mar 10 √ √ Apr 10 √ √ May 10 √ √ Jun 10 √ √ Jul 10 √ √ Aug 10 √ √ Sep 10 √ √ Oct 10 √ √ Nov 10 √ √ √ Dec 10 √
NOTES: BSG = Burn Site Groundwater. CWL = Chemical Waste Landfill. GWPP = Groundwater Protection Program. MWL = Mixed Waste Landfill. SNL/NM = Sandia National Laboratories, New Mexico. TA-V = Technical Area Five. TAG = Tijeras Area Groundwater. Water quality and groundwater analytical results for the GWPP and SNL/NM ER Operations monitoring activities are summarized in Table 1-2. Detected analytes that exceed the EPA drinking water regulatory criteria for samples collected by SNL/NM personnel during groundwater monitoring activities in CY 2010 are listed in Table 1-3.
1.2.1 Environmental Restoration Operations Monitoring
SNL/NM ER Operations conducts groundwater monitoring where groundwater contamination is documented or in areas where the potential exists for groundwater contamination from legacy surface or near-surface contamination. Currently there are five ER Operations groundwater monitoring networks: (1) CWL; (2) MWL; (3) TA-V; (4) TAG; and (5) BSG. The ER Operations groundwater monitoring wells are located upgradient and downgradient of known legacy surface contamination sites with associated groundwater contamination.
1.2.2 Groundwater Protection Program Monitoring
The SNL/NM GWPP conducts groundwater surveillance monitoring through a network of wells on KAFB, most of which are located in areas near SNL/NM operational test facilities. Groundwater surveillance monitoring allows the detection and evaluation of the impacts (if any) of SNL/NM operations on groundwater.

1-8 A
NN
UA
L G
RO
UN
DW
AT
ER
MO
NIT
OR
ING
RE
PO
RT, C
AL
EN
DA
R Y
EA
R 2010
Figure 1-4. Wells and Springs within SNL/NM and KAFB

GR
OU
ND
WA
TE
R P
RO
TE
CT
ION
PR
OG
RA
M
1-9
Table 1-2. Summary of SNL/NM Groundwater Monitoring Results during CY 2010 SNL/NM Groundwater Monitoring
Number of Active Wells Monitored 76 Number of Analyses Performed 13,038 Percent of Nondetected Results 81.45 %
Analyte Number of Detects
Number of Non-Detects
Minimum Detected Value
Maximum Detected Value
Mean Detected Value
Standard Deviation for
Detected Values
MCL
Summary of Field Water Quality Parameters (units as indicated below) pH in SU 171 0 5.95 8.98 7.39 0.3496 NE Specific Conductivity in mhos/cm
171 0 379 4274 768.1 498.1 NE
Temperature in °C 171 0 12.09 25.66 18.97 2.779 NE Turbidity in NTU 171 0 0.07 132 3.25 14.75 NE Detected Organic Compounds in g/L Acetone 1 163 7.91 7.91 7.91 N/A NE Bromodichloromethane 1 183 0.530 0.530 0.530 N/A NE Carbon disulfide 2 166 1.58 2.00 1.79 0.297 NE Chloroform 10 174 0.250 0.730 0.479 0.1777 NE Chloromethane 9 175 0.320 31.8 3.87 10.47 NE Dibromochloromethane 1 183 0.390 0.390 0.390 N/A NE 1,1-Dichloroethane 11 173 0.390 1.17 0.667 0.2769 NE 1,1-Dichloroethene 1 183 0.640 0.640 0.640 N/A 7.0 cis-1,2-Dichloroethene 33 138 0.310 3.63 1.79 0.963 70 Gasoline Range Organics 5 30 17.6 27.6 21.3 4.48 NE RDX 1 16 0.170 0.170 0.170 N/A NE Tetrachloroethene 9 175 0.320 1.23 0.804 0.2896 5.0 Toluene 9 175 0.250 1.45 0.539 0.429 1,000 Trichloroethene 66 118 0.353 18.6 5.62 5.815 5.0
Refer to footnotes at end of table.
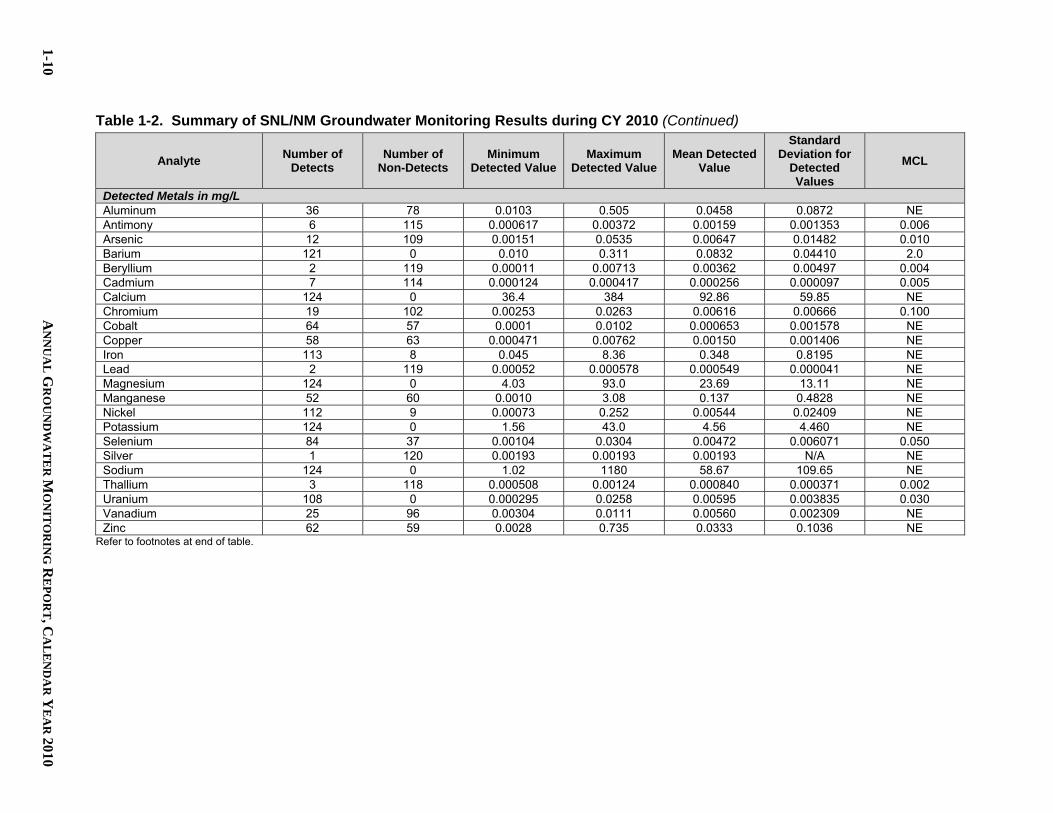
1-10 A
NN
UA
L G
RO
UN
DW
AT
ER
MO
NIT
OR
ING
RE
PO
RT, C
AL
EN
DA
R Y
EA
R 2010
Table 1-2. Summary of SNL/NM Groundwater Monitoring Results during CY 2010 (Continued)
Analyte Number of Detects
Number of Non-Detects
Minimum Detected Value
Maximum Detected Value
Mean Detected Value
Standard Deviation for
Detected Values
MCL
Detected Metals in mg/L Aluminum 36 78 0.0103 0.505 0.0458 0.0872 NE Antimony 6 115 0.000617 0.00372 0.00159 0.001353 0.006 Arsenic 12 109 0.00151 0.0535 0.00647 0.01482 0.010 Barium 121 0 0.010 0.311 0.0832 0.04410 2.0 Beryllium 2 119 0.00011 0.00713 0.00362 0.00497 0.004 Cadmium 7 114 0.000124 0.000417 0.000256 0.000097 0.005 Calcium 124 0 36.4 384 92.86 59.85 NE Chromium 19 102 0.00253 0.0263 0.00616 0.00666 0.100 Cobalt 64 57 0.0001 0.0102 0.000653 0.001578 NE Copper 58 63 0.000471 0.00762 0.00150 0.001406 NE Iron 113 8 0.045 8.36 0.348 0.8195 NE Lead 2 119 0.00052 0.000578 0.000549 0.000041 NE Magnesium 124 0 4.03 93.0 23.69 13.11 NE Manganese 52 60 0.0010 3.08 0.137 0.4828 NE Nickel 112 9 0.00073 0.252 0.00544 0.02409 NE Potassium 124 0 1.56 43.0 4.56 4.460 NE Selenium 84 37 0.00104 0.0304 0.00472 0.006071 0.050 Silver 1 120 0.00193 0.00193 0.00193 N/A NE Sodium 124 0 1.02 1180 58.67 109.65 NE Thallium 3 118 0.000508 0.00124 0.000840 0.000371 0.002 Uranium 108 0 0.000295 0.0258 0.00595 0.003835 0.030 Vanadium 25 96 0.00304 0.0111 0.00560 0.002309 NE Zinc 62 59 0.0028 0.735 0.0333 0.1036 NE
Refer to footnotes at end of table.

GR
OU
ND
WA
TE
R P
RO
TE
CT
ION
PR
OG
RA
M
1-11
Table 1-2. Summary of SNL/NM Groundwater Monitoring Results during CY 2010 (Concluded)
Analyte Number of Detects
Number of Non-Detects
Minimum Detected Value
Maximum Detected Value
Mean Detected Value
Standard Deviation for
Detected Values
MCL
Detected Inorganic Parameters in mg/L Nitrate plus nitrite as N 167 7 0.149 36.6 7.84 7.808 10 Bromide 88 2 0.138 3.32 0.620 0.6343 NE Chloride 90 0 9.51 489 64.71 76.61 NE Fluoride 90 0 0.227 2.44 0.846 0.4413 4.0 Sulfate 90 0 13.8 1810 118.4 214.5 NE Total Organic Halogens 4 16 0.00868 0.0567 0.0306 0.01975 NE Total phenols 5 15 0.00176 0.0036 0.00232 0.000759 NE Perchlorate 2 25 0.00459 0.00614 0.00537 0.001096 NE Alkalinity as CACO3 63 0 69.0 1490 221.6 211.6 NE Alkalinity, Bicarbonate 12 0 72.9 296 230.3 53.3 NE Detected Radiochemistry Activities in pCi/L Alpha, gross (uncorrected) 79 10 1.59 76.2 9.40 10.62 15.0 Beta, gross 77 12 1.47 50.9 5.85 6.071 4 mrem/yr Potassium-40 5 83 40.3 93.9 58.8 20.60 NE Radium-226 9 11 0.319 2.16 0.703 0.581 5.0 Radium-228 11 9 0.472 7.94 1.37 2.235 5.0 Radon-222 11 2 82.0 2100 532 558 NE Uranium-233/234 25 0 0.510 56.2 14.11 12.65 NE Uranium-235/236 23 2 0.0413 0.721 0.261 0.1572 NE Uranium-238 25 0 0.110 8.59 2.98 1.692 NE
NOTES: °C = Degree(s) Celsius. g/L = Microgram(s) per liter. µmhos/cm = Micromhos per centimeter. 4 mrem/yr = Any combination of beta- and/or gamma-emitting radionuclides (as dose rate). CACO3 = Calcium as carbon carbonate. MCL = Maximum contaminant level. Established by the U.S. Environmental Protection Agency Primary Water Regulations (40 CFR 141.11(b)),
National Primary Drinking Water Standards (EPA, July 2010). mg/L = Milligram(s) per liter. N = Nitrogen. N/A = Not applicable. NE = Not established. NTU = Nephelometric turbidity units. pCi/L = Picocurie(s) per liter. pH = Potential of hydrogen (negative logarithm of the hydrogen ion concentration). uncorrected = Gross alpha results reported as uncorrected values (result includes the uranium and radon activities). RDX = Hexahydro-trinitro-triazine. SNL/NM = Sandia National Laboratories, New Mexico. SU = Standard Unit(s).
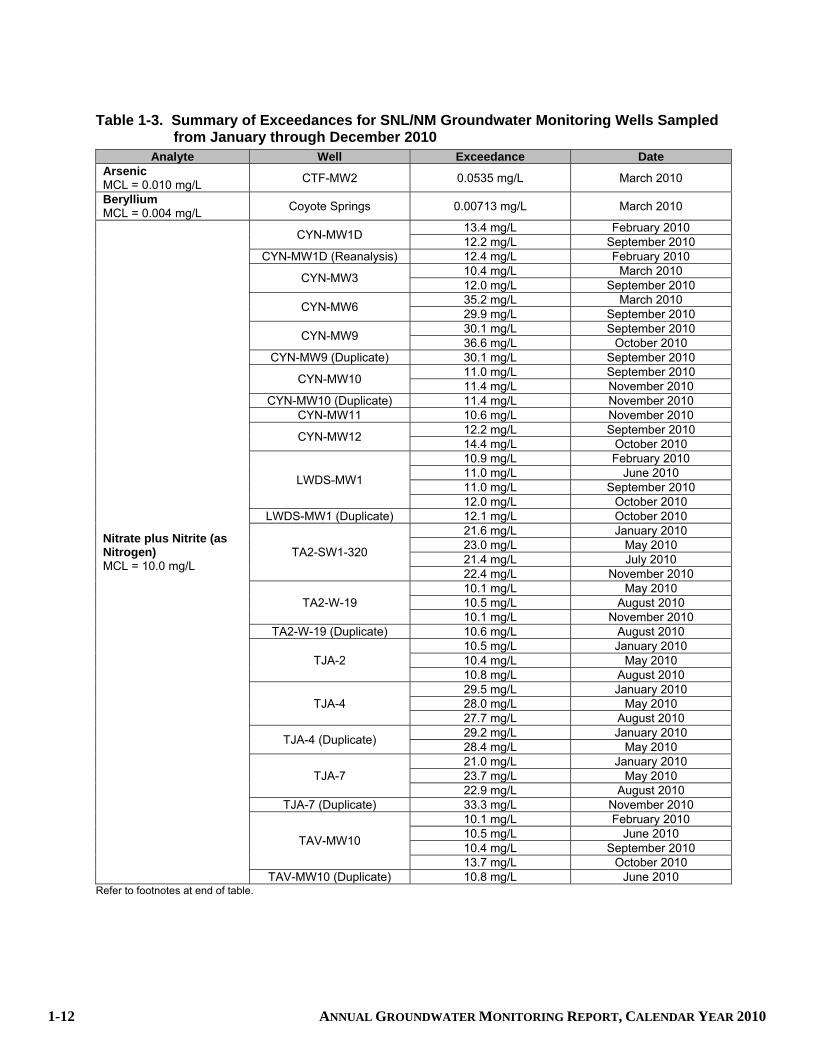
1-12 ANNUAL GROUNDWATER MONITORING REPORT, CALENDAR YEAR 2010
Table 1-3. Summary of Exceedances for SNL/NM Groundwater Monitoring Wells Sampled from January through December 2010
Analyte Well Exceedance DateArsenic MCL = 0.010 mg/L
CTF-MW2 0.0535 mg/L March 2010
Beryllium MCL = 0.004 mg/L
Coyote Springs 0.00713 mg/L March 2010
Nitrate plus Nitrite (as Nitrogen) MCL = 10.0 mg/L
CYN-MW1D 13.4 mg/L February 2010 12.2 mg/L September 2010
CYN-MW1D (Reanalysis) 12.4 mg/L February 2010
CYN-MW3 10.4 mg/L March 2010 12.0 mg/L September 2010
CYN-MW6 35.2 mg/L March 2010 29.9 mg/L September 2010
CYN-MW9 30.1 mg/L September 2010 36.6 mg/L October 2010
CYN-MW9 (Duplicate) 30.1 mg/L September 2010
CYN-MW10 11.0 mg/L September 2010 11.4 mg/L November 2010
CYN-MW10 (Duplicate) 11.4 mg/L November 2010 CYN-MW11 10.6 mg/L November 2010
CYN-MW12 12.2 mg/L September 2010 14.4 mg/L October 2010
LWDS-MW1
10.9 mg/L February 2010 11.0 mg/L June 2010 11.0 mg/L September 2010 12.0 mg/L October 2010
LWDS-MW1 (Duplicate) 12.1 mg/L October 2010
TA2-SW1-320
21.6 mg/L January 2010 23.0 mg/L May 2010 21.4 mg/L July 2010 22.4 mg/L November 2010
TA2-W-19 10.1 mg/L May 2010 10.5 mg/L August 2010 10.1 mg/L November 2010
TA2-W-19 (Duplicate) 10.6 mg/L August 2010
TJA-2 10.5 mg/L January 2010 10.4 mg/L May 2010 10.8 mg/L August 2010
TJA-4 29.5 mg/L January 2010 28.0 mg/L May 2010 27.7 mg/L August 2010
TJA-4 (Duplicate) 29.2 mg/L January 2010 28.4 mg/L May 2010
TJA-7 21.0 mg/L January 2010 23.7 mg/L May 2010 22.9 mg/L August 2010
TJA-7 (Duplicate) 33.3 mg/L November 2010
TAV-MW10
10.1 mg/L February 2010 10.5 mg/L June 2010 10.4 mg/L September 2010 13.7 mg/L October 2010
TAV-MW10 (Duplicate) 10.8 mg/L June 2010 Refer to footnotes at end of table.

INTRODUCTION 1-13
Table 1-3. Summary of Exceedances for SNL/NM Groundwater Monitoring Wells Sampled from January through December 2010 (Concluded)
Analyte Well Exceedance Date
Trichloroethene MCL = 5.0 µg/L
LWDS-MW1
16.9 µg/L February 2010 14.4 µg/L June 2010 12.6 µg/L September 2010 18.5 µg/L October 2010
LWDS-MW1 (Duplicate) 18.6 µg/L October 2010
TAV-MW6
12.6 µg/L February 2010 11.9 µg/L June 2010 12.0 µg/L September 2010 11.8 µg/L October 2010
TAV-MW10
14.8 µg/L February 2010 14.7 µg/L June 2010 14.9 µg/L September 2010 13.1 µg/L October 2010
TAV-MW10 (Duplicate) 14.7 µg/L February 2010 14.7 µg/L June 2010
WYO-4
8.34 µg/L January 2010 6.47 µg/L May 2010 8.80 µg/L August 2010 8.94 µg/L November 2010
Radium-226/228 MCL = 5.0 pCi/L
CTF-MW2 10.10 pCi/L March 2010
NOTES: µg/L = Microgram(s) per liter. mg/L = Milligram(s) per liter. MCL = Maximum contaminant level. pCi/L = Picocuries per liter. SNL/NM = Sandia National Laboratories, New Mexico.
1.2.3 Groundwater Monitoring Regulatory Criteria and DOE Orders
Groundwater monitoring performed by GWPP and ER Operations are directed based on three different sets of regulations and requirements. Groundwater surveillance conducted by the GWPP is directed by DOE Order 450.1A, Environmental Protection Program (DOE 2008) and DOE Manual 231.1A, Environmental, Safety, and Health Reporting Manual (DOE 2004). Groundwater monitoring results for both GWPP and ER Operations are compared with federal and state water quality standards and DOE drinking water guidelines, where established. In addition to the DOE Directives, ER sites at SNL/NM are identified, characterized, and remediated (if required) under the Resource Conservation and Recovery Act (RCRA) regulations. In 1984, RCRA was supplemented by the Hazardous and Solid Waste Amendments (HSWA), which specifically addressed remediation of legacy contamination including groundwater at solid waste management units (SWMUs). At SNL/NM, SWMUs are regulated under the HSWA module of the RCRA permit. In the HSWA module, a SWMU is defined as “any discernible unit at which solid wastes have been placed at any time, irrespective of whether the unit was intended for the management of solid or hazardous waste.” Monitoring and/or corrective action requirements generally are determined on a SWMU-specific basis following a site investigation. Monitoring performed at the MWL and other groundwater monitoring activities (e.g., TA-V, TAG, and BSG investigations) are currently performed in compliance with the requirements of the Order.

1-14 ANNUAL GROUNDWATER MONITORING REPORT, CALENDAR YEAR 2010
The CWL is being closed as a regulated unit that operated under an interim RCRA permit. Groundwater monitoring at the CWL is currently conducted according to the requirements of the New Mexico Environment Department (NMED)-approved closure plan for the unit. Three of the ER Operations groundwater investigations are under the direction of the Compliance Order on Consent (the Order) between the NMED, Sandia, and the DOE (NMED 2004). The three AOCs (TA-V, TAG, and BSG) must comply with requirements set forth in the Order for site characterization and the development of a Corrective Measures Evaluation (CME) for each of these sites. The Order also contains schedules that define dates for the delivery of plans and reports related to the TA-V, TAG, and BSG AOCs, and, accordingly, the DOE/NNSA and Sandia were required to complete CME Reports for the TA-V, TAG, and BSG AOCs by September 30, 2005. The NMED is the regulatory agency responsible for enforcing the requirements identified in the Order for each of the three CMEs. During Fiscal Year 2004, CME Work Plans were submitted to the NMED for each of these three sites that summarize prior work, identify potential source areas, and conduct screening of technologies that result in identification of remedial alternatives that will undergo a full evaluation during the CME process (SNL 2004a, 2004b, and 2004c). The Order also extends NMED regulatory jurisdiction to the siting and installation of new groundwater monitoring wells and the abandonment of existing wells at SNL/NM.
1.3 References
DOE 2008 U.S. Department of Energy (DOE), 2008. Environmental Protection Program, DOE Order 450.1A, U.S. Department of Energy, Washington, D.C., June 4.
DOE 2004 U.S. Department of Energy (DOE), 2004. Environment, Safety, and Health
Reporting Manual, DOE Order 231.1A Chg. 2, U.S. Department of Energy, Washington, D.C., March 19 2004
GRAM 1995 GRAM, Inc., 1995. Conceptual Geological Model of the Sandia National
Laboratories and Kirtland Air Force Base, Environmental Restoration Program, Sandia National Laboratories, New Mexico, prepared by GRAM, Inc. and William Lettis & Associates, Inc., December.
Hawley and Haase 1992 Hawley, J.W., and C.S. Haase, 1992. Hydrogeologic Framework of the
Northern Albuquerque Basin, Open File Report 387, New Mexico Bureau of Mines and Mineral Resources, Socorro, New Mexico.
Kelley 1977 Kelley, V.C., 1977. Geology of Albuquerque Basin, New Mexico, Memoir 33,
New Mexico Bureau of Mines and Mineral Resources, Socorro, New Mexico. Kelson et al. 1999 Kelson, K.I., C.S. Hitchcock, and J.B.J. Harrison, 1999. “Paleoseismology of
the Tijeras Fault Near Golden, New Mexico.” Albuquerque Geology, F.J. Pazzagua and S. Lucas (eds.), New Mexico Geological Society, Fiftieth Annual Field Conference, New Mexico Geological Society, Socorro, New Mexico, September.
Lozinsky 1994 Lozinsky, R.P., 1994. Cenozoic stratigraphy, sandstone petrology, and
depositional history of the Albuquerque basin, central New Mexico, Geological Society of America, Special Paper 291, p. 73-82

INTRODUCTION 1-15
NMED 2004 New Mexico Environment Department (NMED), 2004. Compliance Order on Consent Pursuant to the New Mexico Hazardous Waste Act 74-4-10: Sandia National Laboratories Consent Order, New Mexico Environment Department, Santa Fe, New Mexico, April 29.
SNL 2004a Sandia National Laboratories/New Mexico (SNL/NM), 2004. Corrective
Measures Evaluation Work Plan, Tijeras Arroyo Groundwater, Environmental Restoration Project, Sandia National Laboratories, Albuquerque, New Mexico, July.
SNL 2004b Sandia National Laboratories/New Mexico (SNL/NM), 2004. Corrective
Measures Evaluation Work Plan, Technical Area V Groundwater, Revision 0, SAND Report SAND2004-6113, Sandia National Laboratories, Albuquerque, New Mexico, December.
SNL 2004c Sandia National Laboratories/New Mexico (SNL/NM), 2004. Corrective
Measures Evaluation Work Plan for Sandia National Laboratories/New Mexico Burn Site, Environmental Restoration Project, Sandia National Laboratories, Albuquerque, New Mexico, June.
SNL 1998 Sandia National Laboratories/New Mexico (SNL/NM), 1998. Site-Wide
Hydrogeologic Characterization Project, Calendar Year 1995 Annual Report, Revised February 1998, Environmental Restoration Project, Sandia National Laboratories, Albuquerque, New Mexico, February.
SNL 1995 Sandia National Laboratories/New Mexico (SNL/NM), 1995. Site-Wide
Hydrogeologic Characterization Project, Calendar Year 1995 Annual Report, Sandia National Laboratories, Albuquerque, New Mexico.
Thorn et al. 1993 Thorn, C.R., D.P. McAda, and J.M. Kernodle, 1993. Geohydrologic
Framework and Hydrologic Conditions in the Albuquerque Basin, Central New Mexico, USGS Water Resources Investigation Report 93 4149, U.S. Geological Survey, Albuquerque, New Mexico.
USACE 1979 U.S. Army Corps of Engineers (USACE), 1979. Special Flood Hazard
Information: Tijeras Arroyo and Arroyo del Coyote, Kirtland AFB, New Mexico, U.S. Army Corps of Engineers, Albuquerque District, Albuquerque, New Mexico.
Van Hart June 2003 Van Hart, D., June 2003. Geologic Investigation: An Update of Subsurface
Geology on Kirtland Air Force Base, New Mexico, SAND Report SAND2003-1869, Sandia National Laboratories, Albuquerque, New Mexico.

1-16 ANNUAL GROUNDWATER MONITORING REPORT, CALENDAR YEAR 2010
This page intentionally left blank.
GROUNDWATER PROTECTION PROGRAM 2-1
2.0 Groundwater Protection Program
2.1 Introduction
This chapter documents the results of the Calendar Year (CY) 2010 groundwater surveillance monitoring activities conducted as part of the Sandia National Laboratories, New Mexico (SNL/NM) Groundwater Protection Program (GWPP). The surveillance activities include the annual collection and analysis of groundwater samples from 16 monitoring wells and 1 surface water sample from a spring. Water levels were measured at 78 monitoring wells. Water level measurements were obtained either monthly or quarterly depending on the response characteristics of the groundwater system at each well location to pumping or other stresses. The purpose of the GWPP is to protect groundwater resources at SNL/NM and the surrounding area by identifying potential sources of contamination, working with other SNL/NM organizations to prevent groundwater contamination, implementing effective groundwater surveillance to detect contamination if it should occur, and initiating abatement or remedial action where necessary. To accomplish this mission, the GWPP performs the following tasks:
Determines the effects of SNL/NM operations on groundwater through groundwater quality sampling and analysis and water level measurements.
Records and maintains groundwater data in a database. Maintains GWPP documents and records and ensures that all necessary reports are
submitted to the appropriate agencies in a timely manner. Prepares and maintains Administrative (AOP) and Field Operating Procedures (FOPs) for
groundwater monitoring activities. Provides assistance to well owners in the areas of well installation, well inspection and
maintenance, and well plugging and abandonment. Establishes requirements for well registration and well construction data tracking. Coordinates with the surface Discharge Program to prevent groundwater contamination. Develops groundwater education and community outreach programs. Provides stakeholders an annual update of groundwater data at SNL/NM through the
Annual Groundwater Monitoring Report. The groundwater surveillance monitoring involves completing the following objectives:
Establishing baseline water quality and groundwater flow information for the groundwater system at SNL/NM.
Determining the impact, if any, of SNL/NM’s operations on the quality and quantity of
groundwater. Demonstrating compliance with all federal, state, and local groundwater requirements.

2-2 ANNUAL GROUNDWATER MONITORING REPORT, CALENDAR YEAR 2010
The GWPP is responsible for tracking information on all wells operated by Sandia Corporation (Sandia), including Environmental Restoration (ER) Operations (formerly ER Project) monitoring wells and characterization boreholes. The GWPP Well Registry and Oversight Task were established to ensure that all wells operated by Sandia are properly constructed and maintained to protect groundwater resources (NMOSE 2005). The GWPP Project Lead works with well owners to review new well installation plans, record construction information, track well ownership and maintenance records, perform annual well inspections, and consult with owners when plugging and abandoning or replacing of a well or borehole is required. The goal is to provide full life-cycle management of monitoring wells and boreholes. Additional information for the GWPP is provided in the SNL/NM GWPP Plan (SNL 2009a)
2.2 Regulatory Criteria
Sandia is required by U.S. Department of Energy (DOE) Order 450.1A to develop and implement a site-wide Groundwater Protection Management Program (DOE 2008). Groundwater surveillance is one element within DOE’s overall Environmental Protection Program. The implementation of a successful GWPP includes all elements of the Integrated Safety Management System and relevant elements of the facilities Environmental Management System to ensure that:
Possible sources of current and future groundwater contamination are identified and the potential for future contamination is evaluated.
All applicable federal, state, and DOE requirements are met.
Appropriate groundwater protection goals are established for all affected or potentially affected groundwater consistent with water quality and current or likely future use.
Strategies for predicting and preventing future contamination and for controlling existing contamination are developed.
The history of GWPP activities is documented for future site management.
The quality of ambient groundwater and vadose zone conditions at the site are documented.
Environmental monitoring with surveillance program elements for the groundwater and the vadose zone, including ambient subsurface conditions, are described.
The way the monitoring program provides the information needed to predict and respond to potential contamination associated with significant site aspects and to achieve groundwater protection goals is prescribed.
In April 2004, a Compliance Order on Consent (the Order) (NMED 2004) became effective between the DOE, Sandia and the New Mexico Environment Department (NMED). Among other requirements primarily affecting ER sites, the Order mandates four continuous quarters of sampling and analysis for perchlorate for newly constructed monitoring wells. The protocol establishes a screening level/method detection limit (MDL) of 4 micrograms per liter (µg/L). If the sampling results indicate the presence of perchlorate either at or greater than 4 µg/L, then the DOE and Sandia are required to evaluate the nature and extent of perchlorate contamination and report the results in a Resource Conservation and Recovery Act Corrective Measures Evaluation. Sampling and analysis of the noncompliant well will continue on a quarterly basis until at least four consecutive nondetections are obtained (NMED 2004).

GROUNDWATER PROTECTION PROGRAM 2-3
The NMED DOE Oversight Bureau (OB) splits groundwater samples collected by the GWPP. The samples are analyzed by laboratories under contract to the NMED DOE OB. The NMED DOE OB provides independent verification of environmental monitoring results obtained by Sandia on behalf of the DOE Sandia Site Office. Additional requirements associated with groundwater quality regulations are presented in Table 2-1.
Table 2-1. Groundwater Quality Regulations Regulation/Requirements Standards and Guides Regulating Agency
National Primary Drinking Water Regulations (40 CFR 141) MCL EPA
NMWQCC(1) Standards for Groundwater (20 6.2.3103A NMAC Human Health Standards) (NMED 2001)
MAC NMWQCC
DOE Drinking Water Guidelines for Radioisotopes(2) (DOE Order 5400.5) DCG DOE (1993)
NOTES: (1) MACs for Human Health and Domestic Water Supply Standards are identified in the analytical results tables in Attachment 2A. Domestic water supply standards are based on aesthetic considerations, not on direct human health risks. (2) DOE drinking water guidelines set allowable radionuclide levels in drinking water (DOE, 1993, Drinking Water Guidelines for Radioisotopes). The levels are calculated based on published DCGs and correspond to a 4 mrem/yr dose from chronic exposures. This is equivalent to 4 percent of the DCG for ingestion, which is based on an exposure of 100 mrem/yr. These may be different than EPA’s standards, where established. CFR = Code of Federal Regulations. DCG = Derived concentration guide. DOE = U.S. Department of Energy. EPA = U.S. Environmental Protection Agency. MAC = Maximum allowable concentration. MCL = Maximum contaminant level. mrem/yr = Millirem per year. NMAC = New Mexico Administrative Code. NMED = New Mexico Environment Department. NMWQCC = New Mexico Water Quality Control Commission.
2.3 Scope of Activities
2.3.1 Groundwater Quality Surveillance Monitoring
Annual sampling of groundwater was conducted during the period from March 5 to March 29, 2010. Samples were collected from 16 wells and 1 spring. Groundwater surveillance samples were collected from the following monitoring wells: CTF-MW1, CTF-MW2, CTF-MW3, Eubank-1, Greystone-MW2, MRN-2, MRN-3D, NWTA3-MW3D, PL-2, PL-4, SFR-2S, SFR-4T, SWTA3-MW2, SWTA3-MW3, SWTA3-MW4, and TRE-1. A water sample was collected from Coyote Springs. The analytical results for the groundwater samples are presented in Attachment 2A. Well locations are shown in Figure 2B-1 (Attachment 2B). Samples collected from all locations were analyzed for the following analytes:
Safe Drinking Water Act (SDWA) list volatile organic compounds (VOCs) Total organic halogens (TOX) Total phenols Total alkalinity Nitrate plus nitrite (NPN) Total cyanide

2-4 ANNUAL GROUNDWATER MONITORING REPORT, CALENDAR YEAR 2010
Major anions (chloride, bromide, fluoride, and sulfate) Target Analyte List (TAL) metals plus uranium-234, uranium-235, and uranium-238 Mercury Gamma spectroscopy Gross alpha and beta activity Radium-226 and radium-228 Isotopic uranium (U-234, U-235, and U-238), selected wells only Radon 222, selected wells only
Analysis for high explosive (HE) compounds was conducted on groundwater samples collected from wells CTF-MW2, CTF-MW3, SFR-2S, SWTA3-MW3, SWTA3-MW4, and TRE-1. These wells are associated with the Dynamic Explosives Test Site located in the Coyote Canyon Test Field. All samples were filtered in the field using in-line filters of 0.45-micron pore size, except those for VOCs, HE, and mercury fractions. Duplicate samples were submitted for all analyses from NWTA3-MW3D and SWTA3-MW3. The NMED DOE OB collected split samples with Sandia at Coyote Springs, CTF-MW2, SFR-2S, and TRE-1. The NMED DOE OB analytical results are not reported in this document but are available through the DOE/Sandia Site Office. Groundwater level monitoring is a means to assess the physical changes of the groundwater system over time. This includes changes in the local water table, the quantity of water available, as well as the direction and speed of groundwater movement. The GWPP gathers groundwater level measurements from a large network of wells within and around Kirtland Air Force Base (KAFB). In addition to wells owned by the DOE, data is solicited for U.S. Air Force (USAF) Installation Restoration Program (IRP), City of Albuquerque (COA), and U.S. Geological Service (USGS) wells (Figure 1-4). Water levels in wells were measured quarterly or monthly during CY 2010, depending on the data source and well characteristics. The water table elevation provides a direct measure of the amount of water in storage in the aquifer. Changing water table elevations reflect the difference between recharge and withdrawal from the aquifer. In addition, the rate of change of water levels at a monitoring well screened across the water table provides a reliable measure of the useful lifetime of the well. Groundwater recharge is difficult to measure directly. Precipitation can be used as an indirect measure of recharge potential. Available precipitation also impacts demand on groundwater withdrawal. Water quantities pumped by the KAFB and COA water supply wells represent the primary groundwater withdrawal from the regional aquifer at this location. Water level elevation data collected during a common time period at a group of representative wells are analyzed, and the data are interpolated and plotted as groundwater elevation contours. From this water table map, groundwater flow directions can be identified and horizontal gradients can be determined. Specific results for annual precipitation, water production, and the impact on the water table are discussed in Section 2.6.2.
2.3.2 Monitoring Well Installation
No new monitoring wells were installed by the GWPP during CY 2010.
2.4 Field Methods and Measurements
2.4.1 Groundwater Sampling
The GWPP monitoring procedures, as required by the Groundwater Surveillance Task, are consistent with procedures identified in the U.S. Environmental Protection Agency (EPA) technical enforcement
GROUNDWATER PROTECTION PROGRAM 2-5
guidance document (EPA 1986). The EPA procedures are included in the GWPP Sampling and Analysis Plan (SAP) (SNL 2006), which provides general requirements for data quality objectives, field operations, sample documentation and custody, quality control (QC), reporting, and data management. Specific sampling instructions for the annual surveillance monitoring event are conveyed to the SNL/NM Field Support Operations (FSO) and Sample Management Office (SMO) as provided in the Mini-SAP (SNL 2010). The Mini-SAP is prepared by the Sampling Coordinator at the request of the GWPP Project Lead and provides detailed information on the wells to be sampled, the analyses to be conducted, the methods to be used, and any special conditions that may apply.
2.4.2 Sample Collection, Handling, and Analysis
Groundwater samples are collected using a nitrogen gas-powered, portable, piston pump (Bennett™). Surface water samples from Coyote Springs are collected using a peristaltic pump. With the exception of samples collected for HE compound, VOC, and mercury analyses, samples are filtered through a 0.45-micron cartridge filter inserted into the pump discharge line. Samples are filtered to determine dissolved constituents in the groundwater to compare with New Mexico Water Quality Control Commission (NMWQCC) groundwater standards, which are based on dissolved contaminants (Section 20.6.2, New Mexico Administrative Code). Sampling is conducted annually. Sample collection is conducted according to the instructions and requirements specified in FOP 05-01, Long-Term Environmental Stewardship Groundwater Monitoring Well Sampling and Field Analytical Measurements (SNL 2007a). The SNL/NM SMO processes environmental samples collected by both the GWPP and ER Operations. The SMO orders sample containers, issues sample control and tracking numbers, tracks the chain-of-custody, and reviews analytical results returned from the laboratories for laboratory contract compliance (SNL 2007b). All groundwater samples are analyzed by off-site laboratories using EPA-specified protocols.
2.4.3 Field Water Quality Measurements
Field water quality measurements are obtained at the time of sample collection. Groundwater is pumped to the surface and into a flow-through cell containing measurement probes for various field instruments. Table 2-2 lists the field parameters. Consecutive measurements of temperature, pH, turbidity, and specific conductance (SC) are collected until these values are within the acceptance range of the stabilization parameters shown in Table 2-2. Stability of the measured parameters indicates sufficient water has been removed from the well to replace water that may have stagnated in the well bore with formation water, and a representative groundwater sample can be collected. In addition to groundwater stability measurements, other field parameters measured include alkalinity, dissolved oxygen (DO), and oxidation-reduction potential (ORP). All purge water is placed into 55-gallon containers and stored at the FSO facility waste accumulation area pending analysis of groundwater samples and subsequent determination of the appropriate disposal path for the water.
2.4.4 Water Level Measurements
Water level measurements are conducted at a frequency of monthly or quarterly for a network of 78 SNL/NM monitoring wells located on DOE property and on permitted land from KAFB. Sampling frequency for each well is determined by the response of the local water table to well pumping or other temporal stresses. Where seasonal pumping stresses impose a periodic response on the local water table, the measurement frequency is monthly. If the water table is relatively stable, the measurement frequency for wells is quarterly. Water level measurements are conducted according to the instructions and requirements specified in FOP 03-02, Groundwater Level Data Acquisition and Management, Rev. 02 (SNL 2007c)

2-6 ANNUAL GROUNDWATER MONITORING REPORT, CALENDAR YEAR 2010
Table 2-2. Field Water Quality Parameters Measured at GWPP Monitoring Wells
Field Parameter CommentspH Stability measure: Four consecutive measures within 0.1 pH units Temperature (°C) Stability measure: Four consecutive measures within 1°C Specific Conductance (µmhos/cm) Stability measure: Four consecutive measurements within 5%. Turbidity (NTU) Stability measure: Four consecutive measurements within 10% or < 5 NTU.
Alkalinity(1) Measured in mL CaCO3. Alkalinity titrations are performed in the field at the time of sample collection.
Sample Flow Rate Measured in gpm Dissolved Oxygen Percentage of saturation value and/or measured in mg/L Oxidation-Reduction Potential Measured in mV
NOTE: (1)Alkalinity results for field measurements are provided in Attachment 2A, Table 2A-8, and laboratory-derived alkalinity values are reported in Table 2A-3 for comparison. °C = Degree(s) Celsius. CaCO3 = Calcium carbonate. gpm = Gallon(s) per minute. GWPP = Groundwater Protection Program. µmhos/cm = Microhm(s) per centimeter. mg/L = Milligram(s) per liter. mL = Milliliter(s). mV = Millivolt(s). NTU = Nephelometric turbidity units.
2.5 Analytical Methods
Analytical methods for groundwater samples are identified in the Mini-SAP for the specific analytes for the CY 2010 sampling event (SNL 2010). The methods are defined in EPA SW-846, Test Methods for Evaluating Solid Waste, Physical/Chemical Methods, Update IV of the Third Edition (EPA 2008). Other analyses are conducted using methods developed by the EPA Office of Groundwater and Drinking Water. The SMO provides oversight of the contract laboratories to ensure that proper methods are applied within SMO-specified performance criteria (SNL 2007b).
2.6 Summary of Monitoring Results
2.6.1 Analytical Results
Groundwater and surface water samples were submitted to GEL Laboratories, Inc. (GEL) for both chemical and radiological analysis. In addition, SNL/NM FSO personnel performed field alkalinity measurements. Samples submitted to GEL were analyzed in accordance with applicable EPA analytical methods. Groundwater sampling results are compared with EPA maximum contaminant levels (MCLs) for drinking water supplies and NMED maximum allowable concentrations (MACs) for human health standards of groundwater as promulgated by the NMWQCC (NMED 2001). Analytical reports from GEL, including certificates of analyses, analytical methods, MDLs, practical quantitation limits (PQLs), minimal detectable activity (MDA) values, critical levels, dates of analyses, results of QC analyses, and data validation findings are filed in the SNL/NM Customer Funded Records Center. Analytical results, laboratory QC qualifiers, and third-party validation qualifiers are posted to the Environmental Data Management System (EDMS) electronic database. Table 2A-1 (Attachment 2A) summarizes detected VOC and HE compound results for groundwater samples collected in March 2010. No VOCs or HE compounds were detected at concentrations above established MCLs or MACs in any groundwater sample. Chloroform, chloromethane, bromodichloromethane, and dibromochloromethane were the only VOCs detected above the laboratory

GROUNDWATER PROTECTION PROGRAM 2-7
MDLs but below reporting limits or PQLs. Consequently the concentration values reported by the laboratory are qualified with “J” as estimated concentrations. Chloroform was detected at a concentration of 0.730 g/L in the sample from CTF-MW3 and at 0.600 g/L in the sample from TRE-1. Chloromethane was detected in the PL-4 and SWTA3-MW3 samples at concentrations of 0.320 and 0.400 g/L, respectively. The duplicate sample from PL-4 contained no chloromethane at a detectable level. Toluene was qualified as not detected during data validation in samples from Coyote Springs, PL-4, and SFR-2S due to the presence of toluene in associated laboratory method blank samples. Therefore, a validation qualifier of “U” is assigned to the data. The only HE compound detected was hexahydro-trinitro-triazine (RDX). The concentration of RDX detected in the sample from CTF-MW2 was reported at 0.170 g/L; however, this value was qualified as estimated with “J” as detected but not reliably quantifiable. Table 2A-2 (Attachment 2A) lists the laboratory MDLs for VOC and HE compounds associated with the applied analytical methods. Table 2A-3 (Attachment 2A) summarizes alkalinity, major anions (as bromide, chloride, fluoride, and sulfate), NPN, TOX, total phenols, and total cyanide results. None of the analytes listed were detected above established MCLs or MACs, except fluoride. Fluoride was detected above the MAC of 1.6 milligrams per liter (mg/L) in samples from Coyote Springs, CTF-MW2, CTF-MW3, and SFR-4T at concentrations ranging from 1.62 to 2.44 mg/L. Elevated fluoride concentrations are routinely observed in monitoring wells in the eastern half of KAFB. This is an area of shallow groundwater and elevated bedrock containing fluoride-bearing minerals. The time trend plots for wells exceeding the MCL for fluoride concentrations are presented in Figures 2B-2 through 2B-5 (Attachment 2B). Detections of TOX were reported in samples from six wells and Coyote Springs. The results for TOX were qualified during data validation as not detected in samples from three of the wells due to contamination in initial calibration and continuing calibration blank samples. The surviving validated TOX detections occurred in Coyote Springs, CTF-MW2, Greystone-MW2, and SFR-4T samples at concentrations of 0.0567, 0.0289, 0.00868, and 0.0283 mg/L respectively. The result for the Greystone-MW2 sample is “J” qualified because the concentration is less than the PQL but greater than the MDL. Total phenol was detected in the samples from Eubank-1, Greystone-MW2, MRN-3D, SWTA3-MW2, and TRE-1 at “J” level concentrations. The results for PL-4 were qualified as not detected during data validation due to contamination in the associated equipment blank sample. NPN was detected in all the well samples above associated MDLs, except for the sample obtained from CTF-MW2. The NPN results for SWTA3-MW3 were qualified as not detected during data validation because the associated equipment blank (EB) was found to be contaminated. None of the well samples yielded detections for total cyanide. Samples from GWPP monitoring wells were analyzed for TAL metals plus uranium. No metal parameters, other than arsenic and beryllium, were detected above established regulatory limits in any groundwater sample. Arsenic was detected above the MCL of 0.01 mg/L in the sample from CTF-MW2 at a concentration of 0.0535 mg/L. The time trend plot for arsenic concentrations in well CTF-MW2 is shown in Figure 2B-6 (Attachment 2B). Beryllium was detected above the MCL of 0.004 mg/L in the sample from Coyote Springs at a concentration of 0.00713 mg/L. The time trend plot for beryllium concentrations in Coyote Springs is shown in Figure 2B-7 (Attachment 2B). Dissolved TAL metal results are summarized in Table 2A-4 (Attachment 2A). Both the arsenic result for CTF-MW2 and the beryllium result for Coyote Springs are consistent with prior years of monitoring data as is demonstrated in the trend plots.

2-8 ANNUAL GROUNDWATER MONITORING REPORT, CALENDAR YEAR 2010
Mercury was analyzed from unfiltered samples and reported as total mercury. Mercury was not detected above associated laboratory MDLs in any groundwater sample. Total mercury results are summarized in Table 2A-5 (Attachment 2A). Gamma spectroscopy results for short-list of gamma radiation emitting radioisotopes (americium-241, cesium-137, cobalt-60, and potassium-40) are summarized in Table 2A-6 (Attachment 2A). All isotope activities are less than associated MDA values, except for potassium-40. Potassium-40 was reported above the MDA in the samples from CTF-MW1, CTF-MW3, PL-4 (duplicate), and SFR-2S at activities of 56.4 ± 24.7, 54.7 ± 18.6, 48.8 ± 22.7, and 93.9 ± 26.8 picoCuries/liter (pCi/L). Radioisotopic results are summarized in Table 2A-7 (Attachment 2A). Analyses for alpha- and beta-emitting radioisotopes included gross alpha and gross beta activity, radium-226, radium-228, and radon-222. Isotopic uranium (U-233/234, U-235/236, and U-238) analysis was conducted on those samples from wells that previously had high gross alpha activity or are located where groundwater is in contact with bedrock which contains minerals that are high in naturally occurring radioisotopes. The MCL value of 15 pCi/L does not include the contribution of the uranium or radon activity. The analytical procedure removes the radon from the sample; hence, the laboratory-reported gross alpha result must be corrected by removing only the uranium activity in the sample. For wells where isotopic uranium activity was measured, the activity value was subtracted directly to correct the gross alpha results. For other wells, the uranium concentration obtained from the TAL metal analysis was converted to uranium activity using a conversion factor of 670 picocuries per milligram (EPA 2000). The corrected gross alpha activity results are all below the MCL of 15 pCi/L, with a maximum value of 10.76 pCi/L. Gross beta activity results do not exceed established MCLs. Combined radium-226 and radium-228 activity results from the CTF-MW2 sample exceed the MCL of 5.0 pCi/L. Activity for radium-226 was reported at 2.16 ± 0.0854 pCi/L and for radium-228 at 7.94 ± 2.10 pCi/L in the sample from CTF-MW2. Figure 2B-8 (Attachment 2B) shows the time trend plot for radium-226 and radium-228 activity levels in CTF-MW2. The NMED DOE OB representatives collected additional samples for isotopic uranium at Coyote Springs and monitoring wells CTF-MW2, SFR-2S, and TRE-1 at the same time SNL/NM personnel collected samples from these wells. SNL/NM personnel collected samples for isotopic uranium at these wells to ensure a consistent level of quality with the NMED DOE OB. Table 2A-8 (Attachment 2A) summarizes field water quality measurements collected prior to sampling and field alkalinity titration results. Field water quality measurements include water level, turbidity, pH, temperature, SC, ORP, and DO. The water level was measured with a Solinst® water level indicator. Groundwater temperature, SC, ORP, DO, and pH were measured using an YSITM Model 620 water quality meter. Turbidity was measured with a HACHTM Model 2100P portable turbidity meter.
2.6.2 Water Level Measurements
During CY 2010, water levels were measured in 189 monitoring wells; SNL/NM GWPP personnel measured levels in 78 of these wells. Data were provided by the USAF IRP, the COA, and the USGS for the remainder of the wells. The water level data are maintained in the EDMS. Water level data for CY 2010 for SNL/NM wells is provided in Table 2A-9 (Attachment 2A). The total number of wells represented in the database, listed by the respective organization, is provided in Table 2-3.
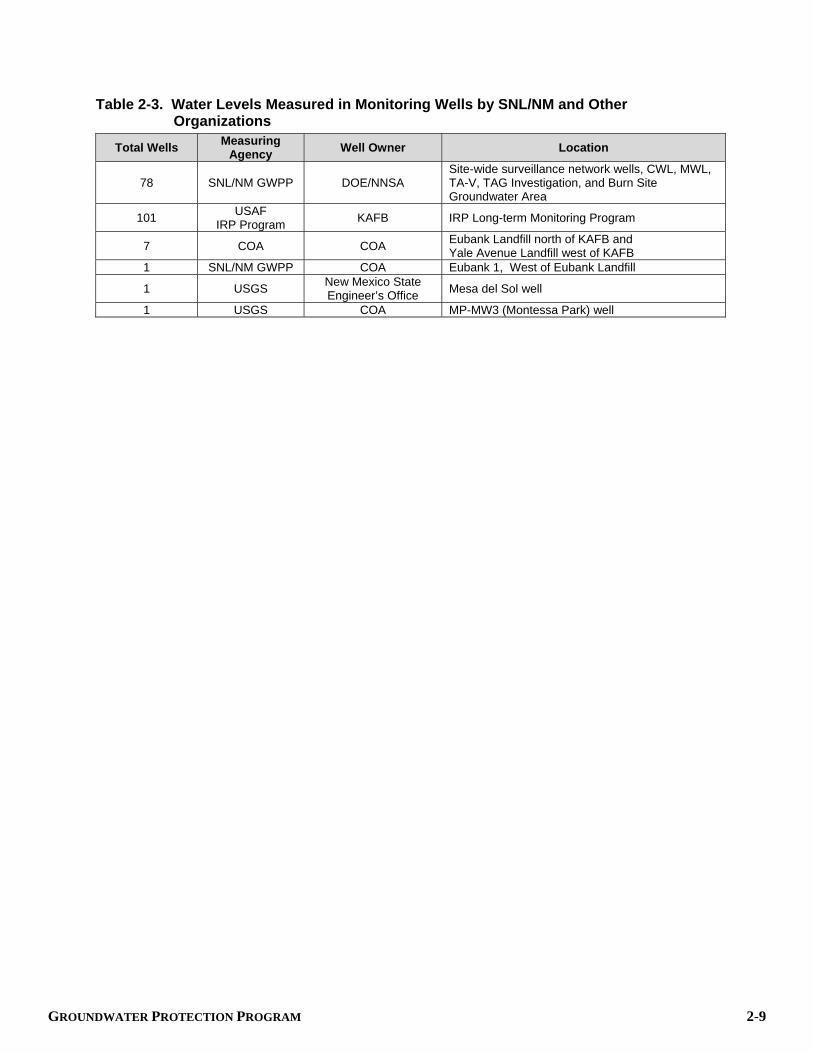
GROUNDWATER PROTECTION PROGRAM 2-9
Table 2-3. Water Levels Measured in Monitoring Wells by SNL/NM and Other Organizations
Total Wells Measuring Agency Well Owner Location
78 SNL/NM GWPP DOE/NNSA Site-wide surveillance network wells, CWL, MWL, TA-V, TAG Investigation, and Burn Site Groundwater Area
101 USAF IRP Program KAFB IRP Long-term Monitoring Program
7 COA COA Eubank Landfill north of KAFB and Yale Avenue Landfill west of KAFB
1 SNL/NM GWPP COA Eubank 1, West of Eubank Landfill
1 USGS New Mexico State Engineer’s Office Mesa del Sol well
1 USGS COA MP-MW3 (Montessa Park) well
2-10 ANNUAL GROUNDWATER MONITORING REPORT, CALENDAR YEAR 2010
NOTES: COA = City of Albuquerque. CWL = Chemical Waste Landfill. DOE = U.S. Department of Energy. GWPP = Groundwater Protection Program. IRP = Installation Restoration Program. KAFB = Kirtland Air Force Base. MWL = Mixed Waste Landfill. NNSA = National Nuclear Security Administration. SNL/NM = Sandia National Laboratories, New Mexico. TA-V = Technical Area V. TAG = Tijeras Arroyo Groundwater. USAF = U.S. Air Force. USGS = U.S. Geological Survey.
2.6.2.1 Groundwater Recharge and Withdrawal
Factors influencing water level elevation changes include potential recharge from precipitation and groundwater withdrawal by production wells. Annual Precipitation
The regional climate for the Albuquerque Basin area is semiarid. Long-term average precipitation ranges from 9.0 inches per year (in./yr) (30-year norm) at Albuquerque International Sunport (Airport) up to 35 in./yr at the crest of the Sandia Mountains. The normal seasonal distribution of precipitation in the Albuquerque area is for the majority to occur during the months of June through August. For CY 2010, the wettest months were June through October. Precipitation data relevant to KAFB hydrogeology are available from four locations. Three meteorological towers are used to measure on-site precipitation at KAFB: the A21 tower located in Technical Area (TA)-II; the A36 tower located in TA-III; and the SC1 tower located near Schoolhouse Well in the foothills of the Manzanita Mountains (Figure 1-4). The fourth source is the National Weather Service station at the Airport, adjacent to KAFB. Annual precipitation during CY 2010 at the four sites is shown in Table 2-4. Data for CY 2009 is also presented for comparison. The 8.96 inches of precipitation measured at the Airport during CY 2010 is 2.29 inches greater than the corresponding period for the previous year; it is also 0.51 inches below the 30-year norm of 9.47 inches. Monthly distribution of precipitation during CY 2010 at the four locations is shown in Figure 2C-1 (Attachment 2C). Figure 2C-2 shows the annual distribution of precipitation at these four locations for the period from January 2002 to December 2010.

GROUNDWATER PROTECTION PROGRAM 2-11
Table 2-4. CY 2009–CY 2010 Precipitation Data at KAFB Site A21 A36 SC1 Airport
CY09 6.83 7.97 9.24 6.67 CY10 9.47 9.67 11.17 8.96
NOTES: Data are in inches of rainfall. Airport = Albuquerque International Sunport. CY = Calendar Year. KAFB = Kirtland Air Force Base.
Groundwater Withdrawal
KAFB production wells are screened over a depth from about 500 to 2,000 feet (ft) below ground surface (bgs) and extract groundwater from the upper and middle unit of the Santa Fe Group. During CY 2010, KAFB pumped groundwater primarily from seven water supply wells. KAFB supplies all the water for SNL/NM and other DOE facilities located on KAFB. Figure 2C-3 (Attachment 2C) shows the CY 2010 monthly production for KAFB water supply wells. The highest level of production was in July at 124,551,000 gallons (gal.); the lowest occurred in February at 34,537,000 gal. The variability in production in response to demand is reflected in the cyclic fluctuation of water levels in monitoring wells within the region of influence of these pumping wells and is evident when shown in hydrographs. Figure 2C-4 shows the CY 2010 monthly production for each KAFB water supply well. Figure 2C-5 shows the trend of total annual groundwater production at KAFB for all wells, starting with 2001. Table 2-5 provides a comparison of water pumped during CY 2010 to the previous year.
Table 2-5. Total KAFB Groundwater Well Production Units CY 2009 CY 2010
Million gal. 890 900 ac-ft 2,731 2,763
NOTES: ac-ft = 325,851 gal. CY = Calendar Year. gal. = Gallon(s). KAFB = Kirtland Air Force Base.
2.6.2.2 Water Table Elevations
Construction of Regional Water Table Elevation Contour Map
Water level data for monitoring wells installed by the DOE and Sandia, USAF IRP, COA, and the State of New Mexico were used to construct the CY 2010 regional water table elevation contour map shown in Figure 2C-6 (Attachment 2C). The extent of the contoured area was constructed using September through October 2010 static water level elevation data from 32 wells completed in the regional aquifer underlying the western portion of KAFB. These wells are screened across the regional water table in the upper unit of the Santa Fe Group. The West Sandia Fault and the Tijeras fault complex (Figures 1-2 and 1-3) approximate the eastern boundary of the area in Figure 2C-6. These bounding faults are assumed to act as barriers to groundwater flow into the central basin from foothills to the east. The contours are developed using Surfer software (Golden 2002). The wells and the relevant data used to construct the contour map are listed in Table 2C-1 in Attachment 2C. Four-year hydrographs for these wells are provided in Figures 2C-8 through 2C-10.

2-12 ANNUAL GROUNDWATER MONITORING REPORT, CALENDAR YEAR 2010
Regional Groundwater Flow System
In general, the open-to-the-north, U-shaped contour lines depicted in Figure 2C-6 (Attachment 2C) define an elongated depression in the water table with a north-south orientation. This depression or trough extends as far south as Isleta Pueblo Reservation. The KAFB and COA Ridgecrest production well fields are located near the northern boundary of KAFB. The depression of the water table is the result of the withdrawal of groundwater by the water supply wells. The contour line gradient indicates groundwater flow towards these supply wells. The flat gradient in the middle of the trough is characteristic of flow through the highly permeable sediments of the Ancestral Rio Grande fluvial deposits, which are the most productive aquifer material in this area. The contours define the collective zones of influence of these large well fields. The direction of groundwater flow in the vicinity of KAFB (west of the Tijeras fault complex), as inferred from the contour lines, is toward the center of the trough and then to the north. The relatively steep gradients in the water table along the eastern edge of the map are partially due to increased ground surface elevation defining the eastern extent of the Albuquerque Basin and the presence of faults, shown in Figures 1-2 and 1-3. The faults also present a hydrologic barrier to the westward movement of groundwater. The dashed contour lines in the southeast corner of Figure 2C-6 are inferred contours of groundwater elevations impacted by the Tijeras fault zone, which intersects the map at this location. Very little change is apparent when comparing the contours mapped in CY 2009 to those of the current reporting year, CY 2010. Figure 2C-7 (Attachment 2C) maps contours of changes in water level elevations in the regional aquifer observed during CY 2010 from the same period of measurement in CY 2009. Areas of greatest declines in the water table are in the southeast quadrant of the mapped area. The water level decline over the past year in monitoring well CWL-BW3 was 1.26 ft. The four-year trend for this well is approximately 0.58 ft/year (ft/yr) as determined from the hydrograph presented in Figure 2C-8. The wells in the northern and western portions of KAFB in Figure 2C-7 show an increase in groundwater elevation. The area of increasing water levels has expanded significantly from the previous year. In the northeast, the water level in well Eubank-5 is up 1.49 ft from the corresponding period in CY 2009 (Figure 2C-9). This increase may be attributed to recharge from Tijeras Arroyo or resulting from draining of the perched groundwater system (PGWS) described in the following section. In the northwest, the water level in monitoring well KAFB-0118 is up 1.37 ft over the level measured in October 2009. The four-year trend for this well shows a decrease of 0.47 ft/yr. Perched Groundwater System
During monitoring well installation for groundwater characterization at TA-II in 1993, a shallow water-bearing zone was encountered at a depth of 300 ft bgs. This was 200 ft above the regional water table at this location. The installation of additional wells completed in this shallow water-bearing zone defined the boundaries of the extent of the PGWS, which is approximately 3.5 square miles. The western extent is to the west side of the former KAFB sewage lagoons. The northern limits coincide with the northern edge of TA-I. To the east, the PGWS has been confirmed in the USAF IRP monitoring wells east of the KAFB Landfill. The southern extent appears to be south of the golf course along the north side of Pennsylvania Avenue. The elevation data to the first water level of the PGWS are contoured in Figure 2C-11 (Attachment 2C). The contour map was constructed using data from 19 monitoring wells (Table 2C-2) completed in the defined area. The contours indicate a gradient in the PGWS to the east-southeast. Correlation of lithologic information obtained from boreholes drilled during monitoring well installations indicates a layer of fine sediments that dips to the southeast (Van Hart 2001) and may serve as the perching horizon.
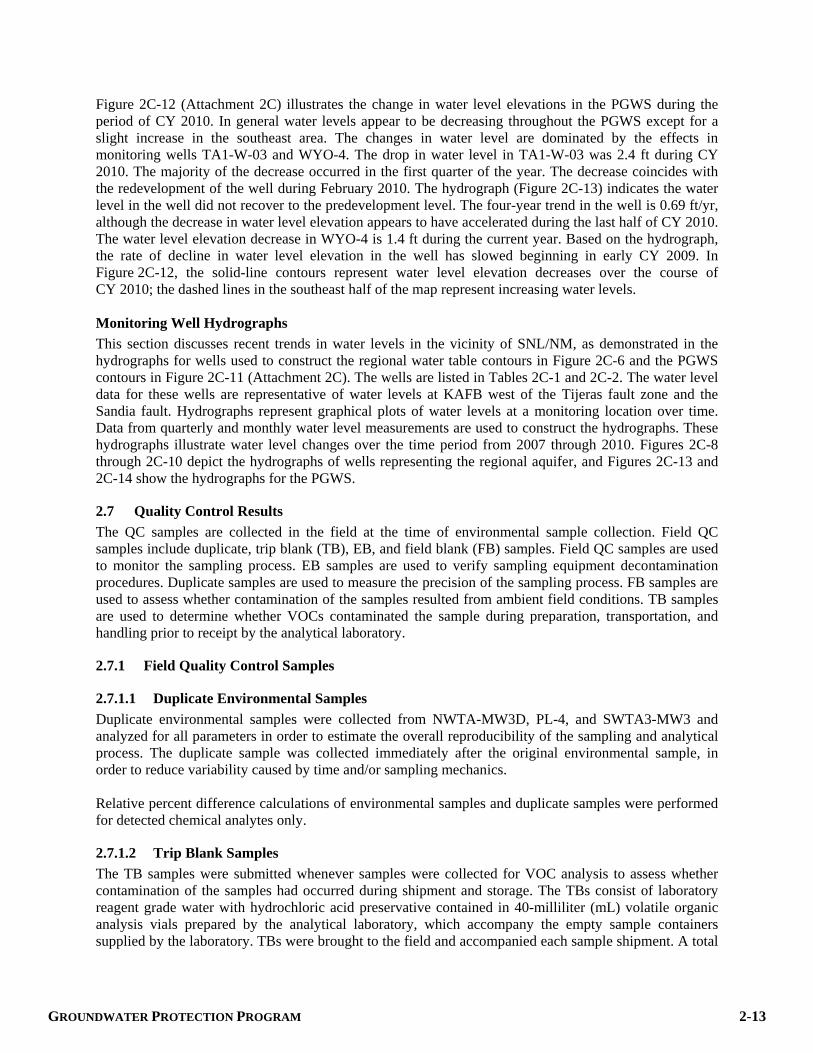
GROUNDWATER PROTECTION PROGRAM 2-13
Figure 2C-12 (Attachment 2C) illustrates the change in water level elevations in the PGWS during the period of CY 2010. In general water levels appear to be decreasing throughout the PGWS except for a slight increase in the southeast area. The changes in water level are dominated by the effects in monitoring wells TA1-W-03 and WYO-4. The drop in water level in TA1-W-03 was 2.4 ft during CY 2010. The majority of the decrease occurred in the first quarter of the year. The decrease coincides with the redevelopment of the well during February 2010. The hydrograph (Figure 2C-13) indicates the water level in the well did not recover to the predevelopment level. The four-year trend in the well is 0.69 ft/yr, although the decrease in water level elevation appears to have accelerated during the last half of CY 2010. The water level elevation decrease in WYO-4 is 1.4 ft during the current year. Based on the hydrograph, the rate of decline in water level elevation in the well has slowed beginning in early CY 2009. In Figure 2C-12, the solid-line contours represent water level elevation decreases over the course of CY 2010; the dashed lines in the southeast half of the map represent increasing water levels. Monitoring Well Hydrographs
This section discusses recent trends in water levels in the vicinity of SNL/NM, as demonstrated in the hydrographs for wells used to construct the regional water table contours in Figure 2C-6 and the PGWS contours in Figure 2C-11 (Attachment 2C). The wells are listed in Tables 2C-1 and 2C-2. The water level data for these wells are representative of water levels at KAFB west of the Tijeras fault zone and the Sandia fault. Hydrographs represent graphical plots of water levels at a monitoring location over time. Data from quarterly and monthly water level measurements are used to construct the hydrographs. These hydrographs illustrate water level changes over the time period from 2007 through 2010. Figures 2C-8 through 2C-10 depict the hydrographs of wells representing the regional aquifer, and Figures 2C-13 and 2C-14 show the hydrographs for the PGWS.
2.7 Quality Control Results
The QC samples are collected in the field at the time of environmental sample collection. Field QC samples include duplicate, trip blank (TB), EB, and field blank (FB) samples. Field QC samples are used to monitor the sampling process. EB samples are used to verify sampling equipment decontamination procedures. Duplicate samples are used to measure the precision of the sampling process. FB samples are used to assess whether contamination of the samples resulted from ambient field conditions. TB samples are used to determine whether VOCs contaminated the sample during preparation, transportation, and handling prior to receipt by the analytical laboratory.
2.7.1 Field Quality Control Samples
2.7.1.1 Duplicate Environmental Samples
Duplicate environmental samples were collected from NWTA-MW3D, PL-4, and SWTA3-MW3 and analyzed for all parameters in order to estimate the overall reproducibility of the sampling and analytical process. The duplicate sample was collected immediately after the original environmental sample, in order to reduce variability caused by time and/or sampling mechanics. Relative percent difference calculations of environmental samples and duplicate samples were performed for detected chemical analytes only.
2.7.1.2 Trip Blank Samples
The TB samples were submitted whenever samples were collected for VOC analysis to assess whether contamination of the samples had occurred during shipment and storage. The TBs consist of laboratory reagent grade water with hydrochloric acid preservative contained in 40-milliliter (mL) volatile organic analysis vials prepared by the analytical laboratory, which accompany the empty sample containers supplied by the laboratory. TBs were brought to the field and accompanied each sample shipment. A total
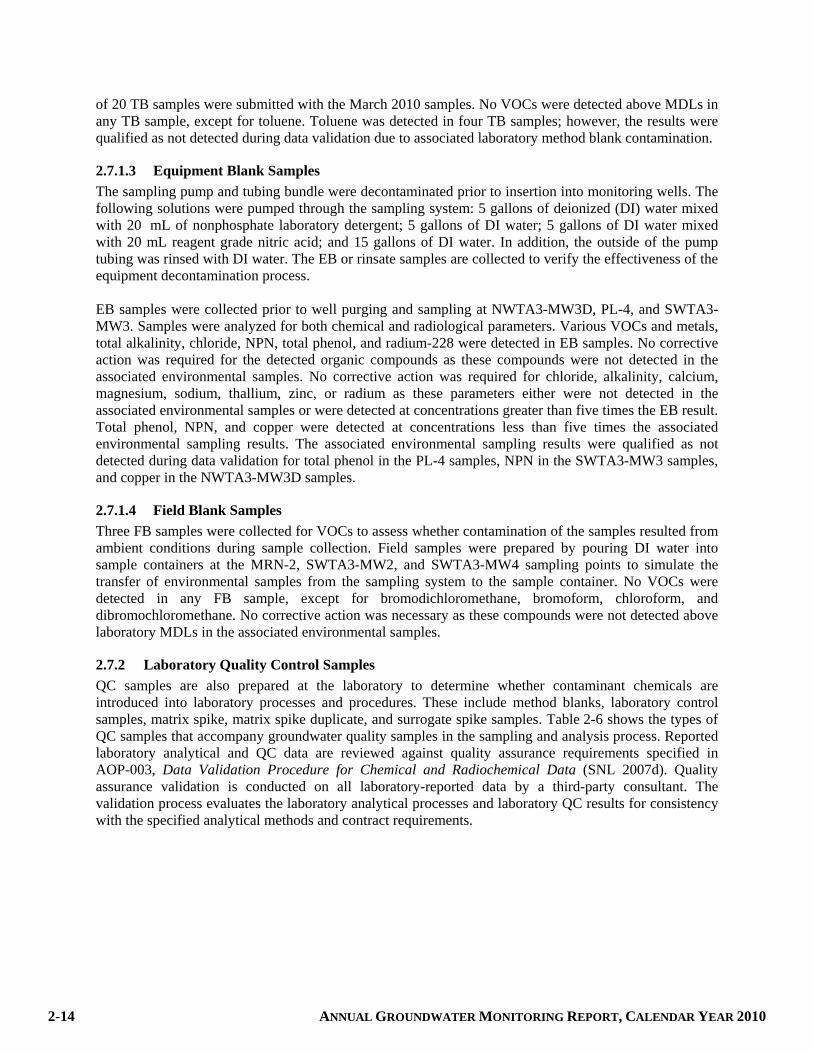
2-14 ANNUAL GROUNDWATER MONITORING REPORT, CALENDAR YEAR 2010
of 20 TB samples were submitted with the March 2010 samples. No VOCs were detected above MDLs in any TB sample, except for toluene. Toluene was detected in four TB samples; however, the results were qualified as not detected during data validation due to associated laboratory method blank contamination.
2.7.1.3 Equipment Blank Samples
The sampling pump and tubing bundle were decontaminated prior to insertion into monitoring wells. The following solutions were pumped through the sampling system: 5 gallons of deionized (DI) water mixed with 20 mL of nonphosphate laboratory detergent; 5 gallons of DI water; 5 gallons of DI water mixed with 20 mL reagent grade nitric acid; and 15 gallons of DI water. In addition, the outside of the pump tubing was rinsed with DI water. The EB or rinsate samples are collected to verify the effectiveness of the equipment decontamination process. EB samples were collected prior to well purging and sampling at NWTA3-MW3D, PL-4, and SWTA3-MW3. Samples were analyzed for both chemical and radiological parameters. Various VOCs and metals, total alkalinity, chloride, NPN, total phenol, and radium-228 were detected in EB samples. No corrective action was required for the detected organic compounds as these compounds were not detected in the associated environmental samples. No corrective action was required for chloride, alkalinity, calcium, magnesium, sodium, thallium, zinc, or radium as these parameters either were not detected in the associated environmental samples or were detected at concentrations greater than five times the EB result. Total phenol, NPN, and copper were detected at concentrations less than five times the associated environmental sampling results. The associated environmental sampling results were qualified as not detected during data validation for total phenol in the PL-4 samples, NPN in the SWTA3-MW3 samples, and copper in the NWTA3-MW3D samples.
2.7.1.4 Field Blank Samples
Three FB samples were collected for VOCs to assess whether contamination of the samples resulted from ambient conditions during sample collection. Field samples were prepared by pouring DI water into sample containers at the MRN-2, SWTA3-MW2, and SWTA3-MW4 sampling points to simulate the transfer of environmental samples from the sampling system to the sample container. No VOCs were detected in any FB sample, except for bromodichloromethane, bromoform, chloroform, and dibromochloromethane. No corrective action was necessary as these compounds were not detected above laboratory MDLs in the associated environmental samples.
2.7.2 Laboratory Quality Control Samples
QC samples are also prepared at the laboratory to determine whether contaminant chemicals are introduced into laboratory processes and procedures. These include method blanks, laboratory control samples, matrix spike, matrix spike duplicate, and surrogate spike samples. Table 2-6 shows the types of QC samples that accompany groundwater quality samples in the sampling and analysis process. Reported laboratory analytical and QC data are reviewed against quality assurance requirements specified in AOP-003, Data Validation Procedure for Chemical and Radiochemical Data (SNL 2007d). Quality assurance validation is conducted on all laboratory-reported data by a third-party consultant. The validation process evaluates the laboratory analytical processes and laboratory QC results for consistency with the specified analytical methods and contract requirements.
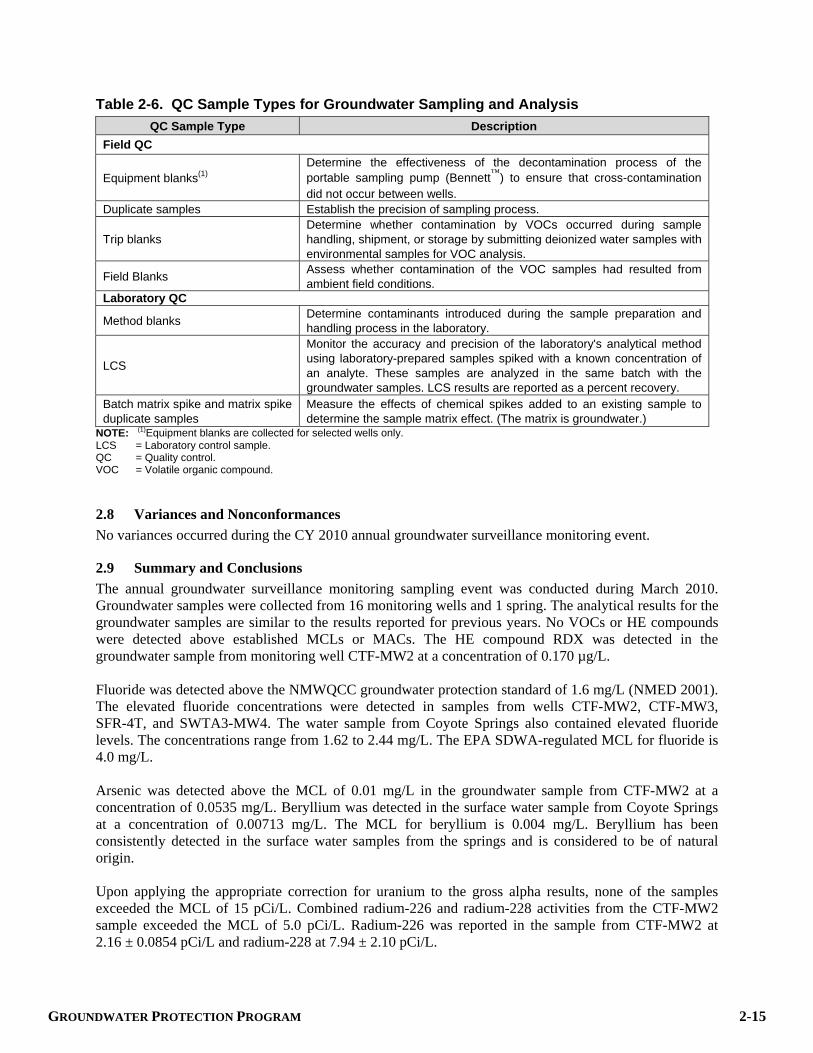
GROUNDWATER PROTECTION PROGRAM 2-15
Table 2-6. QC Sample Types for Groundwater Sampling and Analysis QC Sample Type Description
Field QC
Equipment blanks(1) Determine the effectiveness of the decontamination process of the portable sampling pump (Bennett™) to ensure that cross-contamination did not occur between wells.
Duplicate samples Establish the precision of sampling process.
Trip blanks Determine whether contamination by VOCs occurred during sample handling, shipment, or storage by submitting deionized water samples with environmental samples for VOC analysis.
Field Blanks Assess whether contamination of the VOC samples had resulted from ambient field conditions.
Laboratory QC
Method blanks Determine contaminants introduced during the sample preparation and handling process in the laboratory.
LCS
Monitor the accuracy and precision of the laboratory's analytical method using laboratory-prepared samples spiked with a known concentration of an analyte. These samples are analyzed in the same batch with the groundwater samples. LCS results are reported as a percent recovery.
Batch matrix spike and matrix spike duplicate samples
Measure the effects of chemical spikes added to an existing sample to determine the sample matrix effect. (The matrix is groundwater.)
NOTE: (1)Equipment blanks are collected for selected wells only. LCS = Laboratory control sample. QC = Quality control. VOC = Volatile organic compound.
2.8 Variances and Nonconformances
No variances occurred during the CY 2010 annual groundwater surveillance monitoring event.
2.9 Summary and Conclusions
The annual groundwater surveillance monitoring sampling event was conducted during March 2010. Groundwater samples were collected from 16 monitoring wells and 1 spring. The analytical results for the groundwater samples are similar to the results reported for previous years. No VOCs or HE compounds were detected above established MCLs or MACs. The HE compound RDX was detected in the groundwater sample from monitoring well CTF-MW2 at a concentration of 0.170 µg/L. Fluoride was detected above the NMWQCC groundwater protection standard of 1.6 mg/L (NMED 2001). The elevated fluoride concentrations were detected in samples from wells CTF-MW2, CTF-MW3, SFR-4T, and SWTA3-MW4. The water sample from Coyote Springs also contained elevated fluoride levels. The concentrations range from 1.62 to 2.44 mg/L. The EPA SDWA-regulated MCL for fluoride is 4.0 mg/L. Arsenic was detected above the MCL of 0.01 mg/L in the groundwater sample from CTF-MW2 at a concentration of 0.0535 mg/L. Beryllium was detected in the surface water sample from Coyote Springs at a concentration of 0.00713 mg/L. The MCL for beryllium is 0.004 mg/L. Beryllium has been consistently detected in the surface water samples from the springs and is considered to be of natural origin. Upon applying the appropriate correction for uranium to the gross alpha results, none of the samples exceeded the MCL of 15 pCi/L. Combined radium-226 and radium-228 activities from the CTF-MW2 sample exceeded the MCL of 5.0 pCi/L. Radium-226 was reported in the sample from CTF-MW2 at 2.16 ± 0.0854 pCi/L and radium-228 at 7.94 ± 2.10 pCi/L.

2-16 ANNUAL GROUNDWATER MONITORING REPORT, CALENDAR YEAR 2010
Water table elevation measurements were obtained throughout CY 2010 at 78 locations on a monthly and quarterly basis. Water level elevation measurements obtained from 32 representative monitoring wells west of the Tijeras fault zone and west of the Sandia fault at KAFB and vicinity were used to construct contours of water table elevation. The contours display a pattern that reflects the impact of the groundwater withdrawal by water supply wells located in the northwestern portion of KAFB and COA wells north of the base. A contour map of the differences in the regional water table between the same periods in CY 2010 and CY 2009 indicate the area of greatest decline is in the southeast quadrant of the mapped area. The water level decline over the past year in monitoring well CWL-BW3 is 1.26 ft. The area of increasing water levels has expanded significantly from the previous year. In the northeast, the water level in well Eubank-5 is up 1.49 ft from the corresponding period in CY 2009 (Figure 2C-7). In the northwest, the water level in monitoring well KAFB-0118 is up 1.37 ft over the level measured in October 2009 (Figure 2C-7). Water level elevations were also obtained for wells completed in the PGWS. Nineteen wells were used to construct a water level elevation contour map for the PGWS. The contours indicate groundwater flow in the PGWS is from the northwest to the southeast. Water levels are declining in the northwest and increasing slightly in the east (Figure 2C-12) presumably due to the drainage of the system to the east and perhaps some additional recharge from the Tijeras Arroyo.
2.10 References
DOE 2008 U.S. Department of Energy (DOE), 2008. Environmental Protection Program, DOE Order 450.1A, U.S. Department of Energy, Washington, D.C., June 4.
DOE 1993 U.S. Department of Energy (DOE), 1993. Drinking Water Guidelines for
Radioisotopes, DOE Order 5400.5, U.S. Department of Energy, Washington, D.C.
EPA 2008 U.S. Environmental Protection Agency (EPA), 2008. Test Methods for
Evaluating Solid Waste, Physical/Chemical Methods, SW-846, Update IV of 3rd ed., U.S. Environmental Protection Agency, Washington, D.C.
EPA 2000 U.S. Environmental Protection Agency (EPA). National Drinking Water
Regulations, Final Rule 65 FR236; December 7. EPA 1986 U.S. Environmental Protection Agency (EPA), 1986. RCRA Groundwater
Monitoring Technical Enforcement Guidance Document (TEGD), Office of Solid Waste, OSWER-9950.1, U.S. Environmental Protection Agency, Washington, D.C., September.
Golden 2002 Golden Software, Inc, 2002. Surface Mapping System, V. 8, Golden
Software, Inc. NMED 2004 New Mexico Environment Department (NMED), 2004. Compliance Order
on Consent Pursuant to the New Mexico Hazardous Waste Act 74-4-10: Sandia National Laboratories Consent Order, New Mexico Environment Department, Santa Fe, New Mexico, April 29.

GROUNDWATER PROTECTION PROGRAM 2-17
NMED 2001 New Mexico Environment Department (NMED), 2001. New Mexico Water
Quality Control Commission Regulations, Section 20.6.2 of the New Mexico Administrative Code, Environmental Protection, Water Quality, Groundwater and Surface Water Protection, New Mexico Environment Department, Santa Fe, New Mexico, January 15.
NMOSE 2005 New Mexico Office of the State Engineer (NMOSE), 2005. Rules and
Regulations Governing Well Driller Licensing; Construction, Repair and Plugging of Wells, Office of the State Engineer, Santa Fe, New Mexico, August 31.
SNL 2010 Sandia National Laboratories/New Mexico (SNL/NM), 2010. Groundwater
Protection Program Mini-SAP for FY10 Annual Groundwater Surveillance, Sandia National Laboratories, Albuquerque, New Mexico, March.
SNL 2009a Sandia National Laboratories/New Mexico (SNL/NM), 2009. SNL/NM
Groundwater Protection Program Plan, Sandia National Laboratories, Albuquerque, New Mexico, September.
SNL 2009b Sandia National Laboratories/New Mexico (SNL/NM), 2009. Summary
Report for Monitoring Well Plug and Abandonment and Installation, Decommissioning of Groundwater Monitoring Wells PL-1 and PL-3, Installation of Groundwater Groundwater Monitoring Well PL-4, Sandia National Laboratories, Albuquerque, New Mexico, November.
SNL 2007a Sandia National Laboratories/New Mexico (SNL/NM), 2007. Long-Term
Environmental Stewardship Groundwater Monitoring Well Sampling and Field Analytical Measurements, FOP 05-01, Revision 00, Sandia National Laboratories, Albuquerque, New Mexico, August.
SNL 2007b Sandia National Laboratories/New Mexico (SNL/NM), 2007. Procedure for
Completing the Contract Verification Review, SMO-05-03, Issue 03, Sandia National Laboratories, Albuquerque, New Mexico, April 30.
SNL 2007c Sandia National Laboratories/New Mexico (SNL/NM), 2007. Groundwater
Level Data Acquisition and Management, FOP 03-02, Rev. 02, Sandia National Laboratories, Albuquerque, New Mexico, November 26.
SNL 2007d Sandia National Laboratories/New Mexico (SNL/NM), 2007. Data
Validation Procedure for Chemical and Radiochemical Data, AOP 00-03, Revision 2, Sandia National Laboratories, Albuquerque, New Mexico, July 16.
SNL 2006 Sandia National Laboratories/New Mexico (SNL/NM), 2006. Sampling and
Analysis Plan, FY06, SNL/NM Groundwater Protection Program, Annual Groundwater Surveillance, Sandia National Laboratories, Albuquerque, New Mexico, January 18.

2-18 ANNUAL GROUNDWATER MONITORING REPORT, CALENDAR YEAR 2010
Van Hart 2001 Van Hart, D., 2001, Shallow Groundwater System Investigation – Tijeras Arroyo and Vicinity, Consultant’s Report by GRAM, Inc., prepared for Sandia National Laboratories, Albuquerque, New Mexico.

GROUNDWATER PROTECTION PROGRAM 2A-1
Attachment 2A Groundwater Protection Program
Analytical Results Tables

2A-2 ANNUAL GROUNDWATER MONITORING REPORT, CALENDAR YEAR 2010
This page intentionally left blank.

GROUNDWATER PROTECTION PROGRAM 2A-3
Attachment 2A Tables 2A-1 Summary of Detected Volatile Organic and High Explosive Compounds,
Groundwater Protection Program Groundwater Surveillance Task, Sandia National Laboratories/New Mexico, Calendar Year 2010 ............................................ 2A-5
2A-2 Method Detection Limits for Volatile Organic and High Explosive
Compounds, Groundwater Protection Program Groundwater Surveillance Task, Sandia National Laboratories/New Mexico, Calendar Year 2010 ................................ 2A-6
2A-3 Summary of Alkalinity, Anions, Nitrate plus Nitrate, Total Organic Halogens,
Total Phenols, and Total Cyanide Results, Groundwater Protection Program Groundwater Surveillance Task, Sandia National Laboratories/New Mexico, Calendar Year 2010 ...................................................................................................... 2A-8
2A-4 Summary of Dissolved (Filtered) Metal Results, Groundwater Protection
Program Groundwater Surveillance Task, Sandia National Laboratories/New Mexico, Calendar Year 2010 ...................................................................................... 2A-13
2A-5 Summary of Total (Unfiltered) Mercury Results (EPA Methodg SW846-7470),
Groundwater Protection Program Groundwater Surveillance Task, Sandia National Laboratories/New Mexico, Calendar Year 2010 .......................................... 2A-33
2A-6 Summary of Gamma-Emitting Radionuclides/Short List (EPA Methodg 901.0),
Groundwater Protection Program Groundwater Surveillance Task, Sandia National Laboratories/New Mexico, Calendar Year 2010 .......................................... 2A-34
2A-7 Summary of Radioisotopic Results, Groundwater Protection Program
Groundwater Surveillance Task, Sandia National Laboratories/ New Mexico, Calendar Year 2010 .................................................................................................... 2A-37
2A-8 Summary of Field Water Quality Measurementsh, Groundwater Protection
Program Groundwater Surveillance Task, Sandia National Laboratories/ New Mexico, Calendar Year 2010 ...................................................................................... 2A-41
2A-9 Calendar Year 2010 Groundwater Levels, Groundwater Protection Program
Groundwater Surveillance Task, Sandia National Laboratories/ New Mexico, Calendar Year 2010 .................................................................................................... 2A-42
Footnotes for Groundwater Protection Program Groundwater Surveillance Task Tables .................... 2A-47

2A-4 ANNUAL GROUNDWATER MONITORING REPORT, CALENDAR YEAR 2010
This page intentionally left blank.

GR
OU
ND
WA
TE
R P
RO
TE
CT
ION
PR
OG
RA
M
2A-5
Table 2A-1 Summary of Detected Volatile Organic and High Explosive Compounds,
Groundwater Protection Program Groundwater Surveillance Task, Sandia National Laboratories/New Mexico
Calendar Year 2010
Well ID Analyte Resulta (g/L)
MDLb (g/L)
PQLc (g/L)
MCL/MACd (g/L)
Laboratory Qualifiere
Validation Qualifierf Sample No. Analytical
Methodg Coyote Spring 29-Mar-10 Toluene 0.440 0.250 1.00 1000 750 B, J 1.0U 088545-001 SW846-8260
CTF-MW2 15-Mar-10 RDX 0.170 0.104 0.325 NE NE J J+ 088516-024 SW846-8330
CTF-MW3 Bromodichloromethane 0.530 0.250 1.00 NE NE J 088507-001 SW846-8260 10-Mar-10 Chloroform 0.730 0.250 1.00 NE 100 J 088507-001 SW846-8260 Dibromochloromethane 0.390 0.300 1.00 NE NE J 088507-001 SW846-8260 PL-4 Chloromethane 0.320 0.300 1.00 NE NE J 088511-001 SW846-8260 11-Mar-10 Toluene 0.430 0.250 1.00 1000 750 B, J 1.0U 088511-001 SW846-8260 PL-4 (Duplicate) 11-Mar-10 Toluene 0.360 0.250 1.00 1000 750 B, J 1.0U 088512-001 SW846-8260
SFR-2S 08-Mar-10 Toluene 0.360 0.250 1.00 1000 750 B, J 1.0U 088503-001 SW846-8260
SWTA3-MW3 16-Mar-10 Chloromethane 0.400 0.300 1.00 NE NE J 088520-001 SW846-8260
TRE-1 09-Mar-10 Chloroform 0.600 0.250 1.00 NE 100 J 088505-001 SW846-8260
Refer to footnotes on page 2A-47.

2A-6
AN
NU
AL
GR
OU
ND
WA
TE
R M
ON
ITO
RIN
G R
EP
OR
T, CA
LE
ND
AR
YE
AR
2010
Table 2A-2 Method Detection Limits for Volatile Organic and High Explosive Compounds,
Groundwater Protection Program Groundwater Surveillance Task, Sandia National Laboratories/New Mexico
Calendar Year 2010
Analyte Method Detection Limit (g/L) Analytical Methodg Analyte Method Detection Limit
(g/L) Analytical Methodg
1,1,1,2-Tetrachloroethane 0.300 SW846-8260 Dibromomethane 0.300 SW846-8260 1,1,1-Trichloroethane 0.325 SW846-8260 Dichlorodifluoromethane 0.300 SW846-8260 1,1,2,2-Tetrachloroethane 0.250 SW846-8260 Ethyl benzene 0.250 SW846-8260 1,1,2-Trichloroethane 0.250 SW846-8260 Hexachlorobutadiene 0.300 SW846-8260 1,1-Dichloroethane 0.300 SW846-8260 Isopropylbenzene 0.250 SW846-8260 1,1-Dichloroethene 0.300 SW846-8260 Methylene chloride 3.00 SW846-8260 1,1-Dichloropropene 0.250 SW846-8260 Naphthalene 0.250 SW846-8260 1,2,3-Trichlorobenzene 0.332 SW846-8260 Styrene 0.250 SW846-8260 1,2,3-Trichloropropane 0.300 SW846-8260 Tert-butyl methyl ether 0.250 SW846-8260 1,2,4-Trichlorobenzene 0.300 SW846-8260 Tetrachloroethene 0.300 SW846-8260 1,2,4-Trimethylbenzene 0.250 SW846-8260 Toluene 0.250 SW846-8260 1,2-Dibromo-3-chloropropane 0.300 SW846-8260 Trichloroethene 0.250 SW846-8260 1,2-Dibromoethane 0.250 SW846-8260 Trichlorofluoromethane 0.300 SW846-8260 1,2-Dichlorobenzene 0.250 SW846-8260 Vinyl acetate 1.50 SW846-8260 1,2-Dichloroethane 0.250 SW846-8260 Vinyl chloride 0.500 SW846-8260 1,2-Dichloropropane 0.250 SW846-8260 cis-1,2-Dichloroethene 0.300 SW846-8260 1,3,5-Trimethylbenzene 0.250 SW846-8260 cis-1,3-Dichloropropene 0.250 SW846-8260 1,3-Dichlorobenzene 0.250 SW846-8260 m-, p-Xylene 0.500 SW846-8260 1,3-Dichloropropane 0.300 SW846-8260 n-Butylbenzene 0.250 SW846-8260 1,4-Dichlorobenzene 0.250 SW846-8260 n-Propylbenzene 0.250 SW846-8260 2,2-Dichloropropane 0.300 SW846-8260 o-Xylene 0.300 SW846-8260 2-Butanone 1.25 SW846-8260 sec-Butylbenzene 0.250 SW846-8260 2-Chlorotoluene 0.250 SW846-8260 tert-Butylbenzene 0.250 SW846-8260 2-Hexanone 1.25 SW846-8260 trans-1,2-Dichloroethene 0.300 SW846-8260 4-Chlorotoluene 0.250 SW846-8260 trans-1,3-Dichloropropene 0.250 SW846-8260 4-Isopropyltoluene 0.250 SW846-8260 1,3,5-Trinitrobenzene 0.104 SW846-8321A 4-Methyl-, 2-Pentanone 1.25 SW846-8260 1,3-Dinitrobenzene 0.104 SW846-8321A Benzene 0.300 SW846-8260 2,4,6-Trinitrotoluene 0.104 SW846-8321A Bromobenzene 0.250 SW846-8260 2,4-Dinitrotoluene 0.104 SW846-8321A Bromochloromethane 0.300 SW846-8260 2,6-Dinitrotoluene 0.0779 SW846-8321A Bromodichloromethane 0.250 SW846-8260 2-Amino-4,6-dinitrotoluene 0.104 SW846-8321A Bromoform 0.250 SW846-8260 2-Nitrotoluene 0.104 SW846-8321A Bromomethane 0.300 SW846-8260 3-Nitrotoluene 0.104 SW846-8321A
Refer to footnotes on page 2A-47.
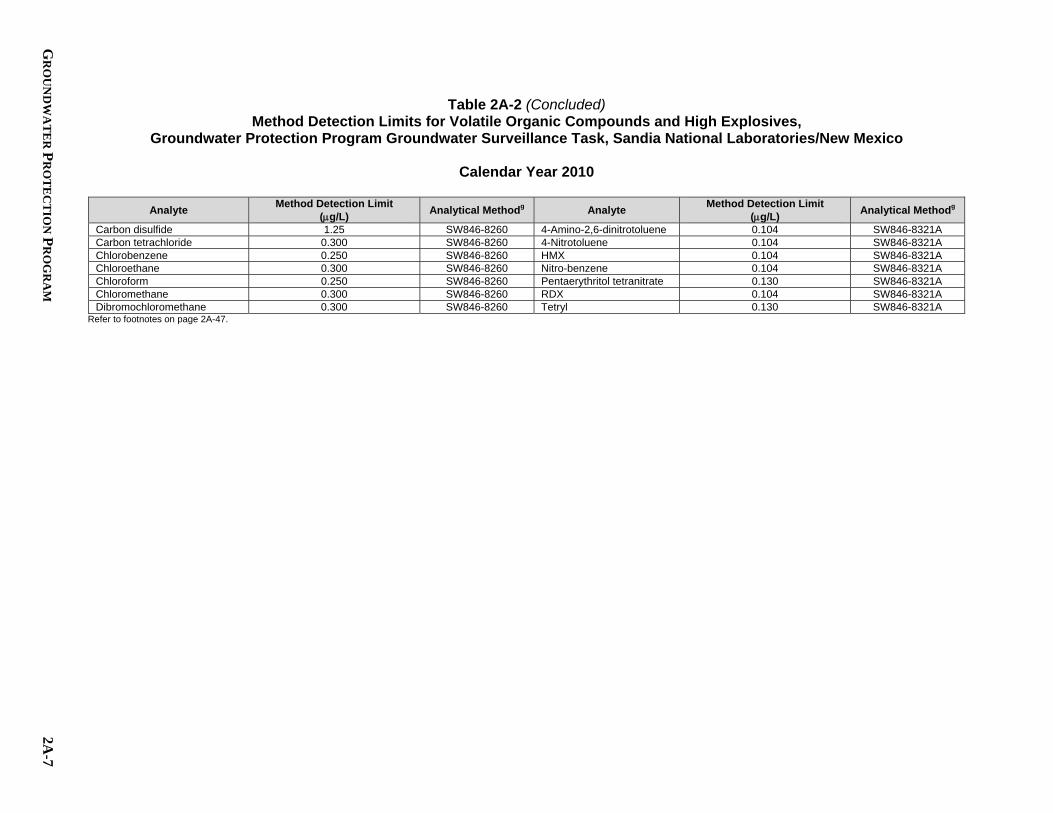
GR
OU
ND
WA
TE
R P
RO
TE
CT
ION
PR
OG
RA
M
2A-7
Table 2A-2 (Concluded) Method Detection Limits for Volatile Organic Compounds and High Explosives,
Groundwater Protection Program Groundwater Surveillance Task, Sandia National Laboratories/New Mexico
Calendar Year 2010
Analyte Method Detection Limit (g/L) Analytical Methodg Analyte Method Detection Limit
(g/L) Analytical Methodg
Carbon disulfide 1.25 SW846-8260 4-Amino-2,6-dinitrotoluene 0.104 SW846-8321A Carbon tetrachloride 0.300 SW846-8260 4-Nitrotoluene 0.104 SW846-8321A Chlorobenzene 0.250 SW846-8260 HMX 0.104 SW846-8321A Chloroethane 0.300 SW846-8260 Nitro-benzene 0.104 SW846-8321A Chloroform 0.250 SW846-8260 Pentaerythritol tetranitrate 0.130 SW846-8321A Chloromethane 0.300 SW846-8260 RDX 0.104 SW846-8321A Dibromochloromethane 0.300 SW846-8260 Tetryl 0.130 SW846-8321A
Refer to footnotes on page 2A-47.

2A-8
AN
NU
AL
GR
OU
ND
WA
TE
R M
ON
ITO
RIN
G R
EP
OR
T, CA
LE
ND
AR
YE
AR
2010
Table 2A-3 Summary of Alkalinity, Anions, Nitrate plus Nitrate,
Total Organic Halogens, Total Phenols, and Total Cyanide Results, Groundwater Protection Program Groundwater Surveillance Task, Sandia National Laboratories/New Mexico
Calendar Year 2010
Well ID Analyte Resulta
(mg/L) MDLb (mg/L)
PQLc (mg/L)
MCL/MACd (mg/L)
Laboratory Qualifiere
Validation Qualifierf Sample No. Analytical
Methodg Coyote Spring Alkalinity as CaCO3 1030 0.725 1.00 NE NE B 088545-016 SM 2320B 29-Mar-10 Bromide 2.07 0.066 0.200 NE NE 088545-016 SW846 9056 Chloride 489 3.30 10.0 NE NE 088545-016 SW846 9056 Fluoride 1.62 0.033 0.100 4.00 1.60 088545-016 SW846 9056 Sulfate 129 5.00 20.0 NE NE 088545-016 SW846 9056 Nitrate plus nitrite 0.414 0.050 0.250 10.0 10.0 088545-018 EPA 353.2 Total Organic Halogens 0.0567 0.00312 0.010 NE NE 088545-003 SW846 9020 Total Phenol ND 0.0016 0.005 NE NE U UJ 088545-026 SW846 9066 Total Cyanide ND 0.0017 0.005 0.200 0.200 U 088545-027 SW846 9012CTF-MW1 Alkalinity as CaCO3 193 0.725 1.00 NE NE B 088526-016 SM 2320B 18-Mar-10 Bromide 0.626 0.066 0.200 NE NE 088526-016 SW846 9056 Chloride 37.2 0.660 2.00 NE NE 088526-016 SW846 9056 Fluoride 1.29 0.033 0.100 4.00 1.60 088526-016 SW846 9056 Sulfate 74.6 1.00 4.00 NE NE 088526-016 SW846 9056 Nitrate plus nitrite 7.58 0.250 1.25 10.0 10.0 088526-018 EPA 353.2 Total Organic Halogens ND 0.00312 0.010 NE NE U 088526-003 SW846 9020 Total Phenol ND 0.0017 0.005 NE NE U UJ 088526-026 SW846 9066 Total Cyanide ND 0.00166 0.005 0.200 0.200 U 088526-027 SW846 9012CTF-MW2 Alkalinity as CaCO3 1490 0.725 1.00 NE NE B 088516-016 SM 2320B 15-Mar-10 Bromide 0.291 0.066 0.200 NE NE 088516-016 SW846 9056 Chloride 403 3.30 10.0 NE NE J 088516-016 SW846 9056 Fluoride 1.71 0.033 0.100 4.00 1.60 088516-016 SW846 9056 Sulfate 150 5.00 20.0 NE NE J 088516-016 SW846 9056 Nitrate plus nitrite ND 0.050 0.250 10.0 10.0 U 088516-018 EPA 353.2 Total Organic Halogens 0.0289 0.00312 0.010 NE NE 088516-003 SW846 9020 Total Phenol ND 0.0017 0.005 NE NE U UJ 088516-026 SW846 9066 Total Cyanide ND 0.00166 0.005 0.200 0.200 U 088516-027 SW846 9012CTF-MW3 Alkalinity as CaCO3 345 0.725 1.00 NE NE 088507-016 SM 2320B 10-Mar-10 Bromide 1.14 0.066 0.200 NE NE 088507-016 SW846 9056 Chloride 110 6.60 20.0 NE NE J 088507-016 SW846 9056 Fluoride 2.21 0.033 0.100 4.00 1.60 088507-016 SW846 9056 Sulfate 452 10.0 40.0 NE NE J 088507-016 SW846 9056 Nitrate plus nitrite 5.54 0.100 0.500 10.0 10.0 088507-018 EPA 353.2 Total Organic Halogens 0.0101 0.00312 0.010 NE NE 0.018UJ 088507-003 SW846 9020 Total Phenol ND 0.0017 0.005 NE NE U 088507-026 SW846 9066 Total Cyanide ND 0.00166 0.005 0.200 0.200 U UJ 088507-027 SW846 9012Refer to footnotes on page 2A-47.

GR
OU
ND
WA
TE
R P
RO
TE
CT
ION
PR
OG
RA
M
2A-9
Table 2A-3 (Continued) Summary of Alkalinity, Anions, Nitrate plus Nitrate,
Total Organic Halogens, Total Phenols, and Total Cyanide Results, Groundwater Protection Program Groundwater Surveillance Task, Sandia National Laboratories/New Mexico
Calendar Year 2010
Well ID Analyte Resulta
(mg/L) MDLb (mg/L)
PQLc (mg/L)
MCL/MACd (mg/L)
Laboratory Qualifiere
Validation Qualifierf Sample No. Analytical
Methodg Eubank-1 Alkalinity as CaCO3 176 0.725 1.00 NE NE 088501-016 SM 2320B 05-Mar-10 Bromide 0.206 0.066 0.200 NE NE 088501-016 SW846 9056 Chloride 12.1 0.066 0.200 NE NE 088501-016 SW846 9056 Fluoride 0.416 0.033 0.100 4.00 1.60 088501-016 SW846 9056 Sulfate 67.5 1.00 4.00 NE NE 088501-016 SW846 9056 Nitrate plus nitrite 2.14 0.050 0.250 10.0 10.0 088501-018 EPA 353.2 Total Organic Halogens ND 0.00312 0.010 NE NE U 088501-003 SW846 9020 Total Phenol 0.00176 0.0017 0.005 NE NE J 088501-026 SW846 9066 Total Cyanide ND 0.00166 0.005 0.200 0.200 U UJ 088501-027 SW846 9012Greystone-MW2 Alkalinity as CaCO3 441 0.725 1.00 NE NE 088531-016 SM 2320B 22-Mar-10 Bromide 0.651 0.066 0.200 NE NE 088531-016 SW846 9056 Chloride 106 0.660 2.00 NE NE 088531-016 SW846 9056 Fluoride 0.776 0.033 0.100 4.00 1.60 088531-016 SW846 9056 Sulfate 47.2 1.00 4.00 NE NE 088531-016 SW846 9056 Nitrate plus nitrite 4.30 0.250 1.25 10.0 10.0 088531-018 EPA 353.2 Total Organic Halogens 0.00868 0.00312 0.010 NE NE J 088531-003 SW846 9020 Total Phenol 0.00206 0.0016 0.005 NE NE J NJ- 088531-026 SW846 9066 Total Cyanide ND 0.00166 0.005 0.200 0.200 U 088531-027 SW846 9012MRN-2 Alkalinity as CaCO3 151 0.725 1.00 NE NE 088535-016 SM 2320B 24-Mar-10 Bromide 0.200 0.066 0.200 NE NE J 088535-016 SW846 9056 Chloride 13.8 0.066 0.200 NE NE 088535-016 SW846 9056 Fluoride 0.581 0.033 0.100 4.00 1.60 088535-016 SW846 9056 Sulfate 47.9 0.500 2.00 NE NE 088535-016 SW846 9056 Nitrate plus nitrite 4.30 0.250 1.25 10.0 10.0 088535-018 EPA 353.2 Total Organic Halogens ND 0.00312 0.010 NE NE U 088535-003 SW846 9020 Total Phenol ND 0.0016 0.005 NE NE U UJ 088535-026 SW846 9066 Total Cyanide ND 0.00166 0.005 0.200 0.200 U 088535-027 SW846 9012MRN-3D Alkalinity as CaCO3 161 0.725 1.00 NE NE 088538-016 SM 2320B 25-Mar-10 Bromide 0.241 0.066 0.200 NE NE 088538-016 SW846 9056 Chloride 14.6 0.066 0.200 NE NE 088538-016 SW846 9056 Fluoride 0.469 0.033 0.100 4.00 1.60 088538-016 SW846 9056 Sulfate 69.9 0.500 2.00 NE NE 088538-016 SW846 9056 Nitrate plus nitrite 1.79 0.100 0.500 10.0 10.0 088538-018 EPA 353.2 Total Organic Halogens ND 0.00312 0.010 NE NE U 088538-003 SW846 9020 Total Phenol 0.00179 0.0016 0.005 NE NE J NJ- 088538-026 SW846 9066 Total Cyanide ND 0.00166 0.005 0.200 0.200 U 088538-027 SW846 9012Refer to footnotes on page 2A-47.

2A-10
AN
NU
AL
GR
OU
ND
WA
TE
R M
ON
ITO
RIN
G R
EP
OR
T, CA
LE
ND
AR
YE
AR
2010
Table 2A-3 (Continued) Summary of Alkalinity, Anions, Nitrate plus Nitrate,
Total Organic Halogens, Total Phenols, and Total Cyanide Results, Groundwater Protection Program Groundwater Surveillance Task, Sandia National Laboratories/New Mexico
Calendar Year 2010
Well ID Analyte Resulta
(mg/L) MDLb (mg/L)
PQLc (mg/L)
MCL/MACd (mg/L)
Laboratory Qualifiere
Validation Qualifierf Sample No. Analytical
Methodg NWTA3-MW3D Alkalinity as CaCO3 132 0.725 1.00 NE NE B, H 088542-016 SM 2320B 26-Mar-10 Bromide 0.158 0.066 0.200 NE NE J 088542-016 SW846 9056 Chloride 11.0 0.066 0.200 NE NE 088542-016 SW846 9056 Fluoride 0.720 0.033 0.100 4.00 1.60 088542-016 SW846 9056 Sulfate 51.7 0.200 0.800 NE NE 088542-016 SW846 9056 Nitrate plus nitrite 1.01 0.050 0.250 10.0 10.0 088542-018 EPA 353.2 Total Organic Halogens ND 0.00312 0.010 NE NE U 088542-003 SW846 9020 Total Phenol ND 0.0016 0.005 NE NE U UJ 088542-026 SW846 9066 Total Cyanide ND 0.0017 0.005 0.200 0.200 U 088542-027 SW846 9012NWTA3-MW3D (Duplicate) Alkalinity as CaCO3 131 0.725 1.00 NE NE B, H 088543-016 SM 2320B 26-Mar-10 Bromide 0.160 0.066 0.200 NE NE J 088543-016 SW846 9056 Chloride 11.0 0.066 0.200 NE NE 088543-016 SW846 9056 Fluoride 0.793 0.033 0.100 4.00 1.60 088543-016 SW846 9056 Sulfate 51.6 0.200 0.800 NE NE 088543-016 SW846 9056 Nitrate plus nitrite 1.01 0.050 0.250 10.0 10.0 088543-018 EPA 353.2 Total Organic Halogens ND 0.00312 0.010 NE NE U 088543-003 SW846 9020 Total Phenol ND 0.0016 0.005 NE NE U UJ 088543-026 SW846 9066 Total Cyanide ND 0.0017 0.005 0.200 0.200 U 088543-027 SW846 9012PL-2 Alkalinity as CaCO3 146 0.725 1.00 NE NE B 088514-016 SM 2320B 12-Mar-10 Bromide 0.213 0.066 0.200 NE NE 088514-016 SW846 9056 Chloride 14.3 0.066 0.200 NE NE 088514-016 SW846 9056 Fluoride 0.513 0.033 0.100 4.00 1.60 088514-016 SW846 9056 Sulfate 64.1 0.500 2.00 NE NE 088514-016 SW846 9056 Nitrate plus nitrite 2.55 0.100 0.500 10.0 10.0 088514-018 EPA 353.2 Total Organic Halogens ND 0.00312 0.010 NE NE U 088514-003 SW846 9020 Total Phenol ND 0.0017 0.005 NE NE U UJ 088514-026 SW846 9066 Total Cyanide ND 0.00166 0.005 0.200 0.200 U 088514-027 SW846 9012PL-4 Alkalinity as CaCO3 170 0.725 1.00 NE NE 088511-016 SM 2320B 11-Mar-10 Bromide 0.236 0.066 0.200 NE NE 088511-016 SW846 9056 Chloride 16.0 0.066 0.200 NE NE 088511-016 SW846 9056 Fluoride 0.416 0.033 0.100 4.00 1.60 088511-016 SW846 9056 Sulfate 57.8 1.00 4.00 NE NE 088511-016 SW846 9056 Nitrate plus nitrite 3.52 0.100 0.500 10.0 10.0 088511-018 EPA 353.2 Total Organic Halogens ND 0.00312 0.010 NE NE U 088511-003 SW846 9020 Total Phenol 0.0025 0.0017 0.005 NE NE J 0.013U 088511-026 SW846 9066 Total Cyanide ND 0.00166 0.005 0.200 0.200 U UJ 088511-027 SW846 9012Refer to footnotes on page 2A-47.
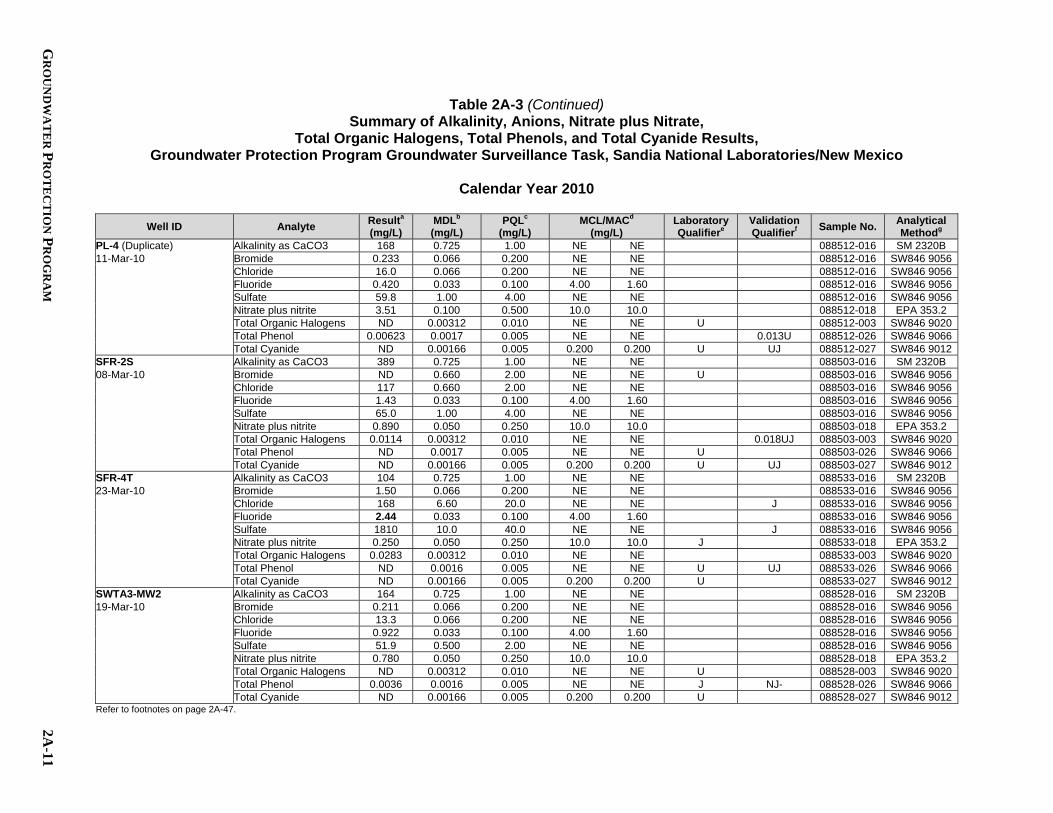
GR
OU
ND
WA
TE
R P
RO
TE
CT
ION
PR
OG
RA
M
2A-11
Table 2A-3 (Continued) Summary of Alkalinity, Anions, Nitrate plus Nitrate,
Total Organic Halogens, Total Phenols, and Total Cyanide Results, Groundwater Protection Program Groundwater Surveillance Task, Sandia National Laboratories/New Mexico
Calendar Year 2010
Well ID Analyte Resulta
(mg/L) MDLb (mg/L)
PQLc (mg/L)
MCL/MACd (mg/L)
Laboratory Qualifiere
Validation Qualifierf Sample No. Analytical
Methodg PL-4 (Duplicate) Alkalinity as CaCO3 168 0.725 1.00 NE NE 088512-016 SM 2320B 11-Mar-10 Bromide 0.233 0.066 0.200 NE NE 088512-016 SW846 9056 Chloride 16.0 0.066 0.200 NE NE 088512-016 SW846 9056 Fluoride 0.420 0.033 0.100 4.00 1.60 088512-016 SW846 9056 Sulfate 59.8 1.00 4.00 NE NE 088512-016 SW846 9056 Nitrate plus nitrite 3.51 0.100 0.500 10.0 10.0 088512-018 EPA 353.2 Total Organic Halogens ND 0.00312 0.010 NE NE U 088512-003 SW846 9020 Total Phenol 0.00623 0.0017 0.005 NE NE 0.013U 088512-026 SW846 9066 Total Cyanide ND 0.00166 0.005 0.200 0.200 U UJ 088512-027 SW846 9012SFR-2S Alkalinity as CaCO3 389 0.725 1.00 NE NE 088503-016 SM 2320B 08-Mar-10 Bromide ND 0.660 2.00 NE NE U 088503-016 SW846 9056 Chloride 117 0.660 2.00 NE NE 088503-016 SW846 9056 Fluoride 1.43 0.033 0.100 4.00 1.60 088503-016 SW846 9056 Sulfate 65.0 1.00 4.00 NE NE 088503-016 SW846 9056 Nitrate plus nitrite 0.890 0.050 0.250 10.0 10.0 088503-018 EPA 353.2 Total Organic Halogens 0.0114 0.00312 0.010 NE NE 0.018UJ 088503-003 SW846 9020 Total Phenol ND 0.0017 0.005 NE NE U 088503-026 SW846 9066 Total Cyanide ND 0.00166 0.005 0.200 0.200 U UJ 088503-027 SW846 9012SFR-4T Alkalinity as CaCO3 104 0.725 1.00 NE NE 088533-016 SM 2320B 23-Mar-10 Bromide 1.50 0.066 0.200 NE NE 088533-016 SW846 9056 Chloride 168 6.60 20.0 NE NE J 088533-016 SW846 9056 Fluoride 2.44 0.033 0.100 4.00 1.60 088533-016 SW846 9056 Sulfate 1810 10.0 40.0 NE NE J 088533-016 SW846 9056 Nitrate plus nitrite 0.250 0.050 0.250 10.0 10.0 J 088533-018 EPA 353.2 Total Organic Halogens 0.0283 0.00312 0.010 NE NE 088533-003 SW846 9020 Total Phenol ND 0.0016 0.005 NE NE U UJ 088533-026 SW846 9066 Total Cyanide ND 0.00166 0.005 0.200 0.200 U 088533-027 SW846 9012SWTA3-MW2 Alkalinity as CaCO3 164 0.725 1.00 NE NE 088528-016 SM 2320B 19-Mar-10 Bromide 0.211 0.066 0.200 NE NE 088528-016 SW846 9056 Chloride 13.3 0.066 0.200 NE NE 088528-016 SW846 9056 Fluoride 0.922 0.033 0.100 4.00 1.60 088528-016 SW846 9056 Sulfate 51.9 0.500 2.00 NE NE 088528-016 SW846 9056 Nitrate plus nitrite 0.780 0.050 0.250 10.0 10.0 088528-018 EPA 353.2 Total Organic Halogens ND 0.00312 0.010 NE NE U 088528-003 SW846 9020 Total Phenol 0.0036 0.0016 0.005 NE NE J NJ- 088528-026 SW846 9066 Total Cyanide ND 0.00166 0.005 0.200 0.200 U 088528-027 SW846 9012Refer to footnotes on page 2A-47.

2A-12
AN
NU
AL
GR
OU
ND
WA
TE
R M
ON
ITO
RIN
G R
EP
OR
T, CA
LE
ND
AR
YE
AR
2010
Table 2A-3 (Concluded) Summary of Alkalinity, Anions, Nitrate plus Nitrate,
Total Organic Halogens, Total Phenols, and Total Cyanide Results, Groundwater Protection Program Groundwater Surveillance Task, Sandia National Laboratories/New Mexico
Calendar Year 2010
Well ID Analyte Resulta
(mg/L) MDLb (mg/L)
PQLc (mg/L)
MCL/MACd (mg/L)
Laboratory Qualifiere
Validation Qualifierf Sample No. Analytical
Methodg SWTA3-MW3 Alkalinity as CaCO3 160 0.725 1.00 NE NE B 088520-016 SM 2320B 16-Mar-10 Bromide 0.192 0.066 0.200 NE NE J 088520-016 SW846 9056 Chloride 13.6 0.066 0.200 NE NE 088520-016 SW846 9056 Fluoride 1.19 0.033 0.100 4.00 1.60 088520-016 SW846 9056 Sulfate 59.8 0.500 2.00 NE NE 088520-016 SW846 9056 Nitrate plus nitrite 0.580 0.050 0.250 10.0 10.0 0.32U 088520-018 EPA 353.2 Total Organic Halogens ND 0.00312 0.010 NE NE U 088520-003 SW846 9020 Total Phenol ND 0.0017 0.005 NE NE U UJ 088520-026 SW846 9066 Total Cyanide ND 0.00166 0.005 0.200 0.200 U 088520-027 SW846 9012SWTA3-MW3 (Duplicate) Alkalinity as CaCO3 156 0.725 1.00 NE NE B 088521-016 SM 2320B 16-Mar-10 Bromide 0.195 0.066 0.200 NE NE J 088521-016 SW846 9056 Chloride 13.6 0.066 0.200 NE NE 088521-016 SW846 9056 Fluoride 1.21 0.033 0.100 4.00 1.60 088521-016 SW846 9056 Sulfate 58.2 0.500 2.00 NE NE 088521-016 SW846 9056 Nitrate plus nitrite 0.570 0.050 0.250 10.0 10.0 0.32U 088521-018 EPA 353.2 Total Organic Halogens ND 0.00312 0.010 NE NE U 088521-003 SW846 9020 Total Phenol ND 0.0017 0.005 NE NE U UJ 088521-026 SW846 9066 Total Cyanide ND 0.00166 0.005 0.200 0.200 U 088521-027 SW846 9012SWTA3-MW4 Alkalinity as CaCO3 170 0.725 1.00 NE NE B 088523-016 SM 2320B 17-Mar-10 Bromide 0.189 0.066 0.200 NE NE J 088523-016 SW846 9056 Chloride 14.9 0.066 0.200 NE NE 088523-016 SW846 9056 Fluoride 1.56 0.033 0.100 4.00 1.60 088523-016 SW846 9056 Sulfate 47.3 0.500 2.00 NE NE 088523-016 SW846 9056 Nitrate plus nitrite 1.23 0.100 0.500 10.0 10.0 088523-018 EPA 353.2 Total Organic Halogens ND 0.00312 0.010 NE NE U 088523-003 SW846 9020 Total Phenol ND 0.0017 0.005 NE NE U UJ 088523-026 SW846 9066 Total Cyanide ND 0.00166 0.005 0.200 0.200 U 088523-027 SW846 9012TRE-1 Alkalinity as CaCO3 485 0.725 1.00 NE NE 088505-016 SM 2320B 09-Mar-10 Bromide ND 0.660 2.00 NE NE U 088505-016 SW846 9056 Chloride 131 0.660 2.00 NE NE 088505-016 SW846 9056 Fluoride 1.37 0.033 0.100 4.00 1.60 088505-016 SW846 9056 Sulfate 95.1 1.00 4.00 NE NE 088505-016 SW846 9056 Nitrate plus nitrite 2.16 0.050 0.250 10.0 10.0 088505-018 EPA 353.2 Total Organic Halogens 0.00928 0.00312 0.010 NE NE J 0.018UJ 088505-003 SW846 9020 Total Phenol 0.00238 0.0017 0.005 NE NE J 088505-026 SW846 9066 Total Cyanide ND 0.00166 0.005 0.200 0.200 U UJ 088505-027 SW846 9012Refer to footnotes on page 2A-47.

GR
OU
ND
WA
TE
R P
RO
TE
CT
ION
PR
OG
RA
M
2A-13
Table 2A-4 Summary of Dissolved (Filtered) Metal Results,
Groundwater Protection Program Groundwater Surveillance Task, Sandia National Laboratories/New Mexico
Calendar Year 2010
Well ID Analyte Resulta (mg/L)
MDLb (mg/L)
PQLc (mg/L)
MCL/MACd (mg/L)
Laboratory Qualifiere
Validation Qualifierf Sample No. Analytical
Methodg Coyote Spring Aluminum 0.224 0.010 0.030 NE NE B 0.054U 088545-009 SW846 602029-Mar-10 Antimony ND 0.0005 0.003 0.006 NE U 088545-009 SW846 6020 Arsenic ND 0.0015 0.005 0.010 0.100 U 088545-009 SW846 6020 Barium 0.0422 0.0005 0.002 2.00 1.00 B 088545-009 SW846 6020 Beryllium 0.00713 0.0001 0.0005 0.004 NE 088545-009 SW846 6020 Cadmium ND 0.00011 0.001 0.005 0.010 U 088545-009 SW846 6020 Calcium 290 0.200 2.00 NE NE B J 088545-009 SW846 6020 Chromium ND 0.0025 0.010 0.100 0.050 U 088545-009 SW846 6020 Cobalt 0.0102 0.0001 0.001 NE NE J+ 088545-009 SW846 6020 Copper 0.0018 0.0003 0.001 NE NE J+ 088545-009 SW846 6020 Iron 1.31 0.010 0.100 NE NE 088545-009 SW846 6020 Lead ND 0.0005 0.002 NE 0.050 U 088545-009 SW846 6020 Magnesium 70.8 0.050 0.150 NE NE J 088545-009 SW846 6020 Manganese 1.51 0.010 0.050 NE NE 088545-009 SW846 6020 Mercury ND 0.000066 0.0002 0.002 0.002 U 088545-009 SW846 7470 Nickel 0.0319 0.0005 0.002 NE NE J+ 088545-009 SW846 6020 Potassium 27.9 0.080 0.300 NE NE 088545-009 SW846 6020 Selenium ND 0.001 0.005 0.050 0.050 U UJ 088545-009 SW846 6020 Silver ND 0.0002 0.001 NE 0.050 U 088545-009 SW846 6020 Sodium 449 0.800 2.50 NE NE 088545-009 SW846 6020 Thallium 0.00124 0.0003 0.001 0.002 NE 088545-009 SW846 6020 Uranium 0.00655 0.00005 0.0002 0.030 5.00 088545-009 SW846 6020 Uranium-234 ND 0.00001 0.00005 NE NE U 088545-009 SW846 6020 Uranium-235 0.000045 0.00001 0.00007 NE NE J J+ 088545-009 SW846 6020 Uranium-238 0.0065 0.00005 0.0002 NE NE 088545-009 SW846 6020 Vanadium ND 0.003 0.010 NE NE U 088545-009 SW846 6020 Zinc 0.0458 0.0026 0.010 NE NE J+ 088545-009 SW846 6020Refer to footnotes on page 2A-47.

2A-14
AN
NU
AL
GR
OU
ND
WA
TE
R M
ON
ITO
RIN
G R
EP
OR
T, CA
LE
ND
AR
YE
AR
2010
Table 2A-4 (Continued) Summary of Dissolved (Filtered) Metal Results,
Groundwater Protection Program Groundwater Surveillance Task, Sandia National Laboratories/New Mexico
Calendar Year 2010
Well ID Analyte Resulta (mg/L)
MDLb (mg/L)
PQLc (mg/L)
MCL/MACd (mg/L)
Laboratory Qualifiere
Validation Qualifierf Sample No. Analytical
Methodg CTF-MW1 Aluminum 0.0112 0.010 0.030 NE NE J 088526-009 SW846 602018-Mar-10 Antimony ND 0.0005 0.003 0.006 NE U 088526-009 SW846 6020 Arsenic 0.00224 0.0015 0.005 0.010 0.100 J 088526-009 SW846 6020 Barium 0.0479 0.0005 0.002 2.00 1.00 B 088526-009 SW846 6020 Beryllium ND 0.0001 0.0005 0.004 NE U 088526-009 SW846 6020 Cadmium ND 0.00011 0.001 0.005 0.010 U 088526-009 SW846 6020 Calcium 96.6 0.400 4.00 NE NE B 088526-009 SW846 6020 Chromium ND 0.0025 0.010 0.100 0.050 U 088526-009 SW846 6020 Cobalt 0.000373 0.0001 0.001 NE NE B, J 0.00052U 088526-009 SW846 6020 Copper 0.000623 0.0003 0.001 NE NE B, J 0.0016U 088526-009 SW846 6020 Iron 0.262 0.010 0.100 NE NE B 088526-009 SW846 6020 Lead ND 0.0005 0.002 NE 0.050 U 088526-009 SW846 6020 Magnesium 19.2 0.005 0.015 NE NE B 088526-009 SW846 6020 Manganese ND 0.001 0.005 NE NE U 088526-009 SW846 6020 Mercury ND 0.000066 0.0002 0.002 0.002 U 088526-009 SW846 7470 Nickel 0.00257 0.0005 0.002 NE NE 088526-009 SW846 6020 Potassium 1.72 0.080 0.300 NE NE 088526-009 SW846 6020 Selenium 0.00427 0.001 0.005 0.050 0.050 J 088526-009 SW846 6020 Silver ND 0.0002 0.001 NE 0.050 U 088526-009 SW846 6020 Sodium 33.8 0.080 0.250 NE NE 088526-009 SW846 6020 Thallium ND 0.0003 0.001 0.002 NE U 088526-009 SW846 6020 Uranium 0.00965 0.00005 0.0002 0.030 5.00 088526-009 SW846 6020 Uranium-234 ND 0.00001 0.00005 NE NE U 088526-009 SW846 6020 Uranium-235 0.000068 0.00001 0.00007 NE NE J 088526-009 SW846 6020 Uranium-238 0.00958 0.00005 0.0002 NE NE 088526-009 SW846 6020 Vanadium ND 0.003 0.010 NE NE U 088526-009 SW846 6020 Zinc 0.00279 0.0026 0.010 NE NE B, J 0.018U 088526-009 SW846 6020Refer to footnotes on page 2A-47.

GR
OU
ND
WA
TE
R P
RO
TE
CT
ION
PR
OG
RA
M
2A-15
Table 2A-4 (Continued) Summary of Dissolved (Filtered) Metal Results,
Groundwater Protection Program Groundwater Surveillance Task, Sandia National Laboratories/New Mexico
Calendar Year 2010
Well ID Analyte Resulta (mg/L)
MDLb (mg/L)
PQLc (mg/L)
MCL/MACd (mg/L)
Laboratory Qualifiere
Validation Qualifierf Sample No. Analytical
Methodg CTF-MW2 Aluminum 0.0942 0.010 0.030 NE NE 088516-009 SW846 602015-Mar-10 Antimony ND 0.0005 0.003 0.006 NE U 088516-009 SW846 6020 Arsenic 0.0535 0.0015 0.005 0.010 0.100 088516-009 SW846 6020 Barium 0.0747 0.0005 0.002 2.00 1.00 B 088516-009 SW846 6020 Beryllium 0.00191 0.0001 0.0005 0.004 NE 0.0026U 088516-009 SW846 6020 Cadmium ND 0.00011 0.001 0.005 0.010 U 088516-009 SW846 6020 Calcium 384 0.400 4.00 NE NE B 088516-009 SW846 6020 Chromium ND 0.0025 0.010 0.100 0.050 U 088516-009 SW846 6020 Cobalt 0.00718 0.0001 0.001 NE NE B 088516-009 SW846 6020 Copper 0.0011 0.0003 0.001 NE NE B 0.0016U 088516-009 SW846 6020 Iron 2.29 0.010 0.100 NE NE B 088516-009 SW846 6020 Lead ND 0.0005 0.002 NE 0.050 U 088516-009 SW846 6020 Magnesium 93.0 0.100 0.300 NE NE B J 088516-009 SW846 6020 Manganese 3.08 0.020 0.100 NE NE 088516-009 SW846 6020 Mercury ND 0.000066 0.0002 0.002 0.002 U 088516-009 SW846 7470 Nickel 0.0182 0.0005 0.002 NE NE 088516-009 SW846 6020 Potassium 43.0 0.080 0.300 NE NE 088516-009 SW846 6020 Selenium ND 0.001 0.005 0.050 0.050 U 088516-009 SW846 6020 Silver ND 0.0002 0.001 NE 0.050 U 088516-009 SW846 6020 Sodium 1.02 0.080 0.250 NE NE 088516-009 SW846 6020 Thallium 0.00109 0.0003 0.001 0.002 NE 0.0018U 088516-009 SW846 6020 Uranium 0.0258 0.00005 0.0002 0.030 5.00 088516-009 SW846 6020 Uranium-234 0.00001 0.00001 0.00005 NE NE J 088516-009 SW846 6020 Uranium-235 0.000181 0.00001 0.00007 NE NE 088516-009 SW846 6020 Uranium-238 0.0256 0.00005 0.0002 NE NE 088516-009 SW846 6020 Vanadium ND 0.003 0.010 NE NE U 088516-009 SW846 6020 Zinc 0.00994 0.0026 0.010 NE NE B, J 0.018U 088516-009 SW846 6020Refer to footnotes on page 2A-47.
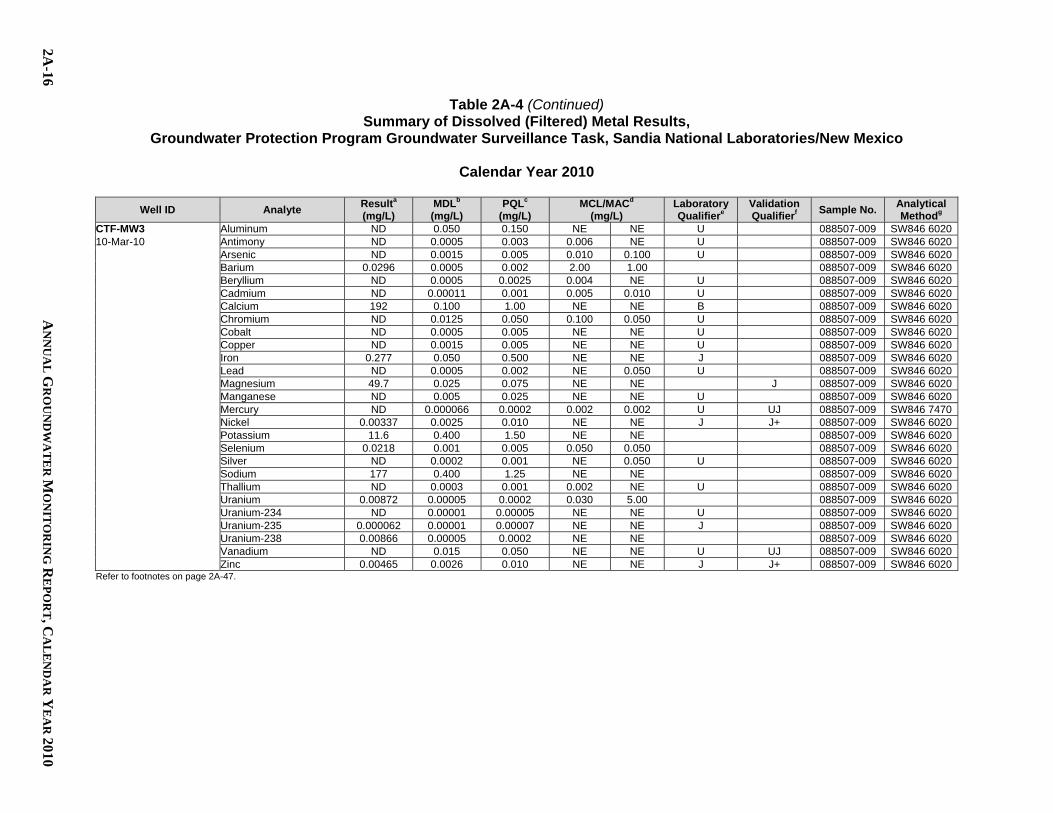
2A-16
AN
NU
AL
GR
OU
ND
WA
TE
R M
ON
ITO
RIN
G R
EP
OR
T, CA
LE
ND
AR
YE
AR
2010
Table 2A-4 (Continued) Summary of Dissolved (Filtered) Metal Results,
Groundwater Protection Program Groundwater Surveillance Task, Sandia National Laboratories/New Mexico
Calendar Year 2010
Well ID Analyte Resulta (mg/L)
MDLb (mg/L)
PQLc (mg/L)
MCL/MACd (mg/L)
Laboratory Qualifiere
Validation Qualifierf Sample No. Analytical
Methodg CTF-MW3 Aluminum ND 0.050 0.150 NE NE U 088507-009 SW846 602010-Mar-10 Antimony ND 0.0005 0.003 0.006 NE U 088507-009 SW846 6020 Arsenic ND 0.0015 0.005 0.010 0.100 U 088507-009 SW846 6020 Barium 0.0296 0.0005 0.002 2.00 1.00 088507-009 SW846 6020 Beryllium ND 0.0005 0.0025 0.004 NE U 088507-009 SW846 6020 Cadmium ND 0.00011 0.001 0.005 0.010 U 088507-009 SW846 6020 Calcium 192 0.100 1.00 NE NE B 088507-009 SW846 6020 Chromium ND 0.0125 0.050 0.100 0.050 U 088507-009 SW846 6020 Cobalt ND 0.0005 0.005 NE NE U 088507-009 SW846 6020 Copper ND 0.0015 0.005 NE NE U 088507-009 SW846 6020 Iron 0.277 0.050 0.500 NE NE J 088507-009 SW846 6020 Lead ND 0.0005 0.002 NE 0.050 U 088507-009 SW846 6020 Magnesium 49.7 0.025 0.075 NE NE J 088507-009 SW846 6020 Manganese ND 0.005 0.025 NE NE U 088507-009 SW846 6020 Mercury ND 0.000066 0.0002 0.002 0.002 U UJ 088507-009 SW846 7470 Nickel 0.00337 0.0025 0.010 NE NE J J+ 088507-009 SW846 6020 Potassium 11.6 0.400 1.50 NE NE 088507-009 SW846 6020 Selenium 0.0218 0.001 0.005 0.050 0.050 088507-009 SW846 6020 Silver ND 0.0002 0.001 NE 0.050 U 088507-009 SW846 6020 Sodium 177 0.400 1.25 NE NE 088507-009 SW846 6020 Thallium ND 0.0003 0.001 0.002 NE U 088507-009 SW846 6020 Uranium 0.00872 0.00005 0.0002 0.030 5.00 088507-009 SW846 6020 Uranium-234 ND 0.00001 0.00005 NE NE U 088507-009 SW846 6020 Uranium-235 0.000062 0.00001 0.00007 NE NE J 088507-009 SW846 6020 Uranium-238 0.00866 0.00005 0.0002 NE NE 088507-009 SW846 6020 Vanadium ND 0.015 0.050 NE NE U UJ 088507-009 SW846 6020 Zinc 0.00465 0.0026 0.010 NE NE J J+ 088507-009 SW846 6020Refer to footnotes on page 2A-47.

GR
OU
ND
WA
TE
R P
RO
TE
CT
ION
PR
OG
RA
M
2A-17
Table 2A-4 (Continued) Summary of Dissolved (Filtered) Metal Results,
Groundwater Protection Program Groundwater Surveillance Task, Sandia National Laboratories/New Mexico
Calendar Year 2010
Well ID Analyte Resulta (mg/L)
MDLb (mg/L)
PQLc (mg/L)
MCL/MACd (mg/L)
Laboratory Qualifiere
Validation Qualifierf Sample No. Analytical
Methodg Eubank-1 Aluminum ND 0.050 0.150 NE NE U 088501-009 SW846 602005-Mar-10 Antimony ND 0.0005 0.003 0.006 NE U 088501-009 SW846 6020 Arsenic ND 0.0015 0.005 0.010 0.100 U 088501-009 SW846 6020 Barium 0.0445 0.0005 0.002 2.00 1.00 088501-009 SW846 6020 Beryllium ND 0.0005 0.0025 0.004 NE U 088501-009 SW846 6020 Cadmium ND 0.00011 0.001 0.005 0.010 U 088501-009 SW846 6020 Calcium 75.5 0.100 1.00 NE NE B 088501-009 SW846 6020 Chromium ND 0.0125 0.050 0.100 0.050 U 088501-009 SW846 6020 Cobalt ND 0.0005 0.005 NE NE U 088501-009 SW846 6020 Copper 0.00377 0.0015 0.005 NE NE B, J 088501-009 SW846 6020 Iron 0.109 0.050 0.500 NE NE J 088501-009 SW846 6020 Lead ND 0.0005 0.002 NE 0.050 U 088501-009 SW846 6020 Magnesium 10.7 0.025 0.075 NE NE J 088501-009 SW846 6020 Manganese ND 0.005 0.025 NE NE U 088501-009 SW846 6020 Mercury ND 0.000066 0.0002 0.002 0.002 U UJ 088501-009 SW846 7470 Nickel 0.00563 0.0025 0.010 NE NE J 088501-009 SW846 6020 Potassium 1.73 0.400 1.50 NE NE 088501-009 SW846 6020 Selenium 0.00234 0.001 0.005 0.050 0.050 J 088501-009 SW846 6020 Silver ND 0.0002 0.001 NE 0.050 U 088501-009 SW846 6020 Sodium 25.3 0.400 1.25 NE NE 088501-009 SW846 6020 Thallium 0.000394 0.0003 0.001 0.002 NE J 0.0018U 088501-009 SW846 6020 Uranium 0.00266 0.00005 0.0002 0.030 5.00 088501-009 SW846 6020 Uranium-234 ND 0.00001 0.00005 NE NE U 088501-009 SW846 6020 Uranium-235 0.000019 0.00001 0.00007 NE NE J 088501-009 SW846 6020 Uranium-238 0.00264 0.00005 0.0002 NE NE 088501-009 SW846 6020 Vanadium ND 0.015 0.050 NE NE U UJ 088501-009 SW846 6020 Zinc 0.00452 0.0026 0.010 NE NE J J+ 088501-009 SW846 6020Refer to footnotes on page 2A-47.

2A-18
AN
NU
AL
GR
OU
ND
WA
TE
R M
ON
ITO
RIN
G R
EP
OR
T, CA
LE
ND
AR
YE
AR
2010
Table 2A-4 (Continued) Summary of Dissolved (Filtered) Metal Results,
Groundwater Protection Program Groundwater Surveillance Task, Sandia National Laboratories/New Mexico
Calendar Year 2010
Well ID Analyte Resulta (mg/L)
MDLb (mg/L)
PQLc (mg/L)
MCL/MACd (mg/L)
Laboratory Qualifiere
Validation Qualifierf Sample No. Analytical
Methodg Greystone-MW2 Aluminum ND 0.010 0.030 NE NE U 088531-009 SW846 602022-Mar-10 Antimony ND 0.0005 0.003 0.006 NE U 088531-009 SW846 6020 Arsenic ND 0.0015 0.005 0.010 0.100 U 088531-009 SW846 6020 Barium 0.144 0.0005 0.002 2.00 1.00 088531-009 SW846 6020 Beryllium 0.000105 0.0001 0.0005 0.004 NE J 088531-009 SW846 6020 Cadmium ND 0.00011 0.001 0.005 0.010 U 088531-009 SW846 6020 Calcium 144 0.100 1.00 NE NE 088531-009 SW846 6020 Chromium ND 0.0025 0.010 0.100 0.050 U 088531-009 SW846 6020 Cobalt 0.000737 0.0001 0.001 NE NE J 088531-009 SW846 6020 Copper 0.000924 0.0003 0.001 NE NE J 088531-009 SW846 6020 Iron 0.474 0.010 0.100 NE NE 088531-009 SW846 6020 Lead ND 0.0005 0.002 NE 0.050 U 088531-009 SW846 6020 Magnesium 26.6 0.005 0.015 NE NE J 088531-009 SW846 6020 Manganese ND 0.001 0.005 NE NE U 088531-009 SW846 6020 Mercury ND 0.000066 0.0002 0.002 0.002 U 088531-009 SW846 7470 Nickel 0.0044 0.0005 0.002 NE NE 088531-009 SW846 6020 Potassium 5.30 0.080 0.300 NE NE 088531-009 SW846 6020 Selenium 0.00283 0.001 0.005 0.050 0.050 J 088531-009 SW846 6020 Silver ND 0.0002 0.001 NE 0.050 U 088531-009 SW846 6020 Sodium 92.4 0.400 1.25 NE NE 088531-009 SW846 6020 Thallium ND 0.0003 0.001 0.002 NE U 088531-009 SW846 6020 Uranium 0.0077 0.00005 0.0002 0.030 5.00 088531-009 SW846 6020 Uranium-234 ND 0.00001 0.00005 NE NE U 088531-009 SW846 6020 Uranium-235 0.000054 0.00001 0.00007 NE NE J 088531-009 SW846 6020 Uranium-238 0.00765 0.00005 0.0002 NE NE 088531-009 SW846 6020 Vanadium ND 0.003 0.010 NE NE U 088531-009 SW846 6020 Zinc ND 0.0026 0.010 NE NE U 088531-009 SW846 6020Refer to footnotes on page 2A-47.

GR
OU
ND
WA
TE
R P
RO
TE
CT
ION
PR
OG
RA
M
2A-19
Table 2A-4 (Continued) Summary of Dissolved (Filtered) Metal Results,
Groundwater Protection Program Groundwater Surveillance Task, Sandia National Laboratories/New Mexico
Calendar Year 2010
Well ID Analyte Resulta (mg/L)
MDLb (mg/L)
PQLc (mg/L)
MCL/MACd (mg/L)
Laboratory Qualifiere
Validation Qualifierf Sample No. Analytical
Methodg MRN-2 Aluminum ND 0.010 0.030 NE NE U 088535-009 SW846 602024-Mar-10 Antimony ND 0.0005 0.003 0.006 NE U 088535-009 SW846 6020 Arsenic ND 0.0015 0.005 0.010 0.100 U 088535-009 SW846 6020 Barium 0.0558 0.0005 0.002 2.00 1.00 088535-009 SW846 6020 Beryllium ND 0.0001 0.0005 0.004 NE U 088535-009 SW846 6020 Cadmium ND 0.00011 0.001 0.005 0.010 U 088535-009 SW846 6020 Calcium 46.1 0.020 0.200 NE NE 088535-009 SW846 6020 Chromium ND 0.0025 0.010 0.100 0.050 U 088535-009 SW846 6020 Cobalt 0.00206 0.0001 0.001 NE NE 088535-009 SW846 6020 Copper 0.000883 0.0003 0.001 NE NE J 088535-009 SW846 6020 Iron 0.210 0.010 0.100 NE NE 088535-009 SW846 6020 Lead ND 0.0005 0.002 NE 0.050 U 088535-009 SW846 6020 Magnesium 15.5 0.005 0.015 NE NE J 088535-009 SW846 6020 Manganese 0.00361 0.001 0.005 NE NE J 088535-009 SW846 6020 Mercury ND 0.000066 0.0002 0.002 0.002 U 088535-009 SW846 7470 Nickel 0.00174 0.0005 0.002 NE NE J 088535-009 SW846 6020 Potassium 3.60 0.080 0.300 NE NE 088535-009 SW846 6020 Selenium 0.00166 0.001 0.005 0.050 0.050 J 088535-009 SW846 6020 Silver ND 0.0002 0.001 NE 0.050 U 088535-009 SW846 6020 Sodium 22.4 0.080 0.250 NE NE 088535-009 SW846 6020 Thallium ND 0.0003 0.001 0.002 NE U 088535-009 SW846 6020 Uranium 0.00361 0.00005 0.0002 0.030 5.00 088535-009 SW846 6020 Uranium-234 ND 0.00001 0.00005 NE NE U 088535-009 SW846 6020 Uranium-235 0.000024 0.00001 0.00007 NE NE J 088535-009 SW846 6020 Uranium-238 0.00358 0.00005 0.0002 NE NE 088535-009 SW846 6020 Vanadium 0.00495 0.003 0.010 NE NE J 088535-009 SW846 6020 Zinc 0.00285 0.0026 0.010 NE NE J 088535-009 SW846 6020Refer to footnotes on page 2A-47.

2A-20
AN
NU
AL
GR
OU
ND
WA
TE
R M
ON
ITO
RIN
G R
EP
OR
T, CA
LE
ND
AR
YE
AR
2010
Table 2A-4 (Continued) Summary of Dissolved (Filtered) Metal Results,
Groundwater Protection Program Groundwater Surveillance Task, Sandia National Laboratories/New Mexico
Calendar Year 2010
Well ID Analyte Resulta (mg/L)
MDLb (mg/L)
PQLc (mg/L)
MCL/MACd (mg/L)
Laboratory Qualifiere
Validation Qualifierf Sample No. Analytical
Methodg MRN-3D Aluminum ND 0.010 0.030 NE NE U 088538-009 SW846 602025-Mar-10 Antimony ND 0.0005 0.003 0.006 NE U 088538-009 SW846 6020 Arsenic ND 0.0015 0.005 0.010 0.100 U 088538-009 SW846 6020 Barium 0.119 0.0005 0.002 2.00 1.00 088538-009 SW846 6020 Beryllium ND 0.0001 0.0005 0.004 NE U 088538-009 SW846 6020 Cadmium ND 0.00011 0.001 0.005 0.010 U 088538-009 SW846 6020 Calcium 61.2 0.100 1.00 NE NE 088538-009 SW846 6020 Chromium ND 0.0025 0.010 0.100 0.050 U 088538-009 SW846 6020 Cobalt 0.000277 0.0001 0.001 NE NE J 088538-009 SW846 6020 Copper 0.00148 0.0003 0.001 NE NE 088538-009 SW846 6020 Iron 0.223 0.010 0.100 NE NE 088538-009 SW846 6020 Lead ND 0.0005 0.002 NE 0.050 U 088538-009 SW846 6020 Magnesium 13.9 0.005 0.015 NE NE J 088538-009 SW846 6020 Manganese 0.0762 0.001 0.005 NE NE 088538-009 SW846 6020 Mercury ND 0.000066 0.0002 0.002 0.002 U 088538-009 SW846 7470 Nickel 0.00261 0.0005 0.002 NE NE 088538-009 SW846 6020 Potassium 4.66 0.080 0.300 NE NE 088538-009 SW846 6020 Selenium 0.00185 0.001 0.005 0.050 0.050 J 088538-009 SW846 6020 Silver ND 0.0002 0.001 NE 0.050 U 088538-009 SW846 6020 Sodium 28.0 0.400 1.25 NE NE 088538-009 SW846 6020 Thallium ND 0.0003 0.001 0.002 NE U 088538-009 SW846 6020 Uranium 0.00365 0.00005 0.0002 0.030 5.00 088538-009 SW846 6020 Uranium-234 ND 0.00001 0.00005 NE NE U 088538-009 SW846 6020 Uranium-235 0.000027 0.00001 0.00007 NE NE J 088538-009 SW846 6020 Uranium-238 0.00362 0.00005 0.0002 NE NE 088538-009 SW846 6020 Vanadium ND 0.003 0.010 NE NE U 088538-009 SW846 6020 Zinc 0.300 0.0026 0.010 NE NE 088538-009 SW846 6020Refer to footnotes on page 2A-47.
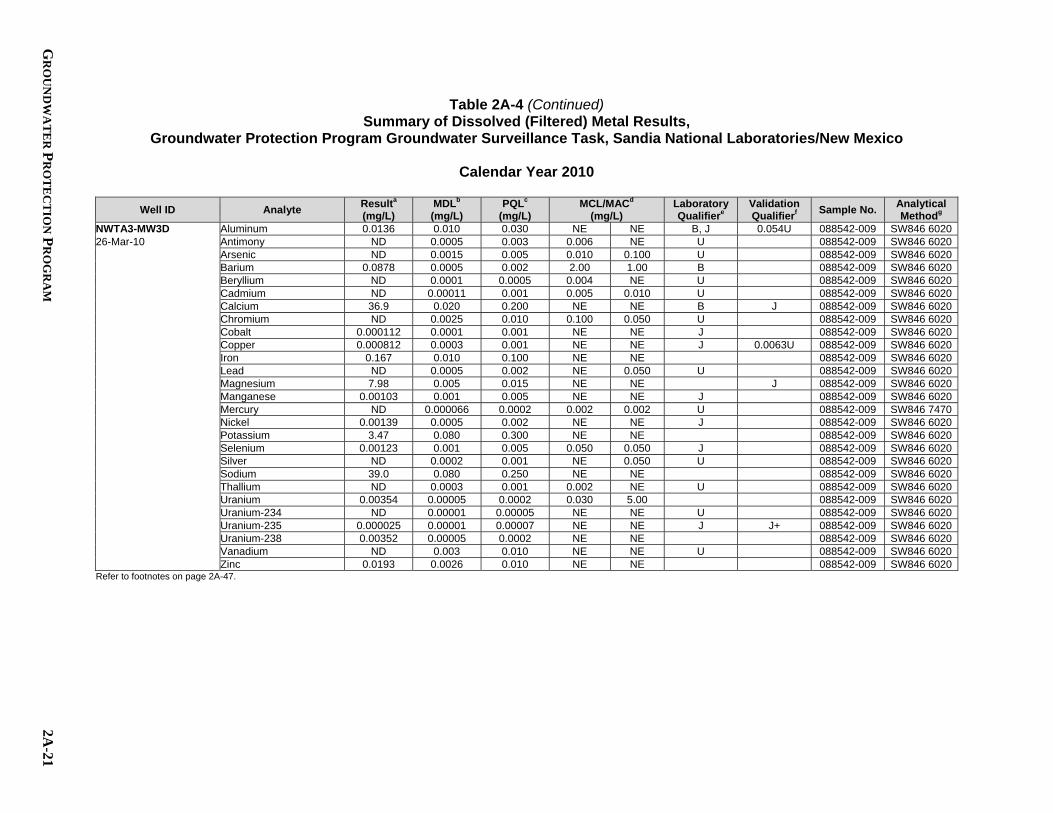
GR
OU
ND
WA
TE
R P
RO
TE
CT
ION
PR
OG
RA
M
2A-21
Table 2A-4 (Continued) Summary of Dissolved (Filtered) Metal Results,
Groundwater Protection Program Groundwater Surveillance Task, Sandia National Laboratories/New Mexico
Calendar Year 2010
Well ID Analyte Resulta (mg/L)
MDLb (mg/L)
PQLc (mg/L)
MCL/MACd (mg/L)
Laboratory Qualifiere
Validation Qualifierf Sample No. Analytical
Methodg NWTA3-MW3D Aluminum 0.0136 0.010 0.030 NE NE B, J 0.054U 088542-009 SW846 602026-Mar-10 Antimony ND 0.0005 0.003 0.006 NE U 088542-009 SW846 6020 Arsenic ND 0.0015 0.005 0.010 0.100 U 088542-009 SW846 6020 Barium 0.0878 0.0005 0.002 2.00 1.00 B 088542-009 SW846 6020 Beryllium ND 0.0001 0.0005 0.004 NE U 088542-009 SW846 6020 Cadmium ND 0.00011 0.001 0.005 0.010 U 088542-009 SW846 6020 Calcium 36.9 0.020 0.200 NE NE B J 088542-009 SW846 6020 Chromium ND 0.0025 0.010 0.100 0.050 U 088542-009 SW846 6020 Cobalt 0.000112 0.0001 0.001 NE NE J 088542-009 SW846 6020 Copper 0.000812 0.0003 0.001 NE NE J 0.0063U 088542-009 SW846 6020 Iron 0.167 0.010 0.100 NE NE 088542-009 SW846 6020 Lead ND 0.0005 0.002 NE 0.050 U 088542-009 SW846 6020 Magnesium 7.98 0.005 0.015 NE NE J 088542-009 SW846 6020 Manganese 0.00103 0.001 0.005 NE NE J 088542-009 SW846 6020 Mercury ND 0.000066 0.0002 0.002 0.002 U 088542-009 SW846 7470 Nickel 0.00139 0.0005 0.002 NE NE J 088542-009 SW846 6020 Potassium 3.47 0.080 0.300 NE NE 088542-009 SW846 6020 Selenium 0.00123 0.001 0.005 0.050 0.050 J 088542-009 SW846 6020 Silver ND 0.0002 0.001 NE 0.050 U 088542-009 SW846 6020 Sodium 39.0 0.080 0.250 NE NE 088542-009 SW846 6020 Thallium ND 0.0003 0.001 0.002 NE U 088542-009 SW846 6020 Uranium 0.00354 0.00005 0.0002 0.030 5.00 088542-009 SW846 6020 Uranium-234 ND 0.00001 0.00005 NE NE U 088542-009 SW846 6020 Uranium-235 0.000025 0.00001 0.00007 NE NE J J+ 088542-009 SW846 6020 Uranium-238 0.00352 0.00005 0.0002 NE NE 088542-009 SW846 6020 Vanadium ND 0.003 0.010 NE NE U 088542-009 SW846 6020 Zinc 0.0193 0.0026 0.010 NE NE 088542-009 SW846 6020Refer to footnotes on page 2A-47.

2A-22
AN
NU
AL
GR
OU
ND
WA
TE
R M
ON
ITO
RIN
G R
EP
OR
T, CA
LE
ND
AR
YE
AR
2010
Table 2A-4 (Continued) Summary of Dissolved (Filtered) Metal Results,
Groundwater Protection Program Groundwater Surveillance Task, Sandia National Laboratories/New Mexico
Calendar Year 2010
Well ID Analyte Resulta (mg/L)
MDLb (mg/L)
PQLc (mg/L)
MCL/MACd (mg/L)
Laboratory Qualifiere
Validation Qualifierf Sample No. Analytical
Methodg NWTA3-MW3D (Duplicate) Aluminum 0.0113 0.010 0.030 NE NE B, J 088543-009 SW846 6020
26-Mar-10 Antimony ND 0.0005 0.003 0.006 NE U 088543-009 SW846 6020 Arsenic ND 0.0015 0.005 0.010 0.100 U 088543-009 SW846 6020 Barium 0.0835 0.0005 0.002 2.00 1.00 B 088543-009 SW846 6020 Beryllium ND 0.0001 0.0005 0.004 NE U 088543-009 SW846 6020 Cadmium ND 0.00011 0.001 0.005 0.010 U 088543-009 SW846 6020 Calcium 36.4 0.020 0.200 NE NE B J 088543-009 SW846 6020 Chromium ND 0.0025 0.010 0.100 0.050 U 088543-009 SW846 6020 Cobalt 0.0001 0.0001 0.001 NE NE J 088543-009 SW846 6020 Copper 0.000804 0.0003 0.001 NE NE J 0.0063U 088543-009 SW846 6020 Iron 0.175 0.010 0.100 NE NE 088543-009 SW846 6020 Lead ND 0.0005 0.002 NE 0.050 U 088543-009 SW846 6020 Magnesium 7.82 0.005 0.015 NE NE J 088543-009 SW846 6020 Manganese 0.0011 0.001 0.005 NE NE J 088543-009 SW846 6020 Mercury ND 0.000066 0.0002 0.002 0.002 U 088543-009 SW846 7470 Nickel 0.0014 0.0005 0.002 NE NE J 088543-009 SW846 6020 Potassium 3.57 0.080 0.300 NE NE 088543-009 SW846 6020 Selenium 0.00121 0.001 0.005 0.050 0.050 J 088543-009 SW846 6020 Silver ND 0.0002 0.001 NE 0.050 U 088543-009 SW846 6020 Sodium 33.7 0.080 0.250 NE NE 088543-009 SW846 6020 Thallium ND 0.0003 0.001 0.002 NE U 088543-009 SW846 6020 Uranium 0.00338 0.00005 0.0002 0.030 5.00 088543-009 SW846 6020 Uranium-234 ND 0.00001 0.00005 NE NE U 088543-009 SW846 6020 Uranium-235 0.000023 0.00001 0.00007 NE NE J J+ 088543-009 SW846 6020 Uranium-238 0.00336 0.00005 0.0002 NE NE 088543-009 SW846 6020 Vanadium ND 0.003 0.010 NE NE U 088543-009 SW846 6020 Zinc 0.0206 0.0026 0.010 NE NE 088543-009 SW846 6020Refer to footnotes on page 2A-47.

GR
OU
ND
WA
TE
R P
RO
TE
CT
ION
PR
OG
RA
M
2A-23
Table 2A-4 (Continued) Summary of Dissolved (Filtered) Metal Results,
Groundwater Protection Program Groundwater Surveillance Task, Sandia National Laboratories/New Mexico
Calendar Year 2010
Well ID Analyte Resulta (mg/L)
MDLb (mg/L)
PQLc (mg/L)
MCL/MACd (mg/L)
Laboratory Qualifiere
Validation Qualifierf Sample No. Analytical
Methodg PL-2 Aluminum ND 0.010 0.030 NE NE U 088514-009 SW846 602012-Mar-10 Antimony ND 0.0005 0.003 0.006 NE U 088514-009 SW846 6020 Arsenic ND 0.0015 0.005 0.010 0.100 U 088514-009 SW846 6020 Barium 0.082 0.0005 0.002 2.00 1.00 B 088514-009 SW846 6020 Beryllium 0.000132 0.0001 0.0005 0.004 NE J 0.0026U 088514-009 SW846 6020 Cadmium ND 0.00011 0.001 0.005 0.010 U 088514-009 SW846 6020 Calcium 67.2 0.400 4.00 NE NE B 088514-009 SW846 6020 Chromium 0.00297 0.0025 0.010 0.100 0.050 J 088514-009 SW846 6020 Cobalt 0.000116 0.0001 0.001 NE NE B, J 0.00052U 088514-009 SW846 6020 Copper 0.000811 0.0003 0.001 NE NE B, J 0.0016U 088514-009 SW846 6020 Iron 0.141 0.010 0.100 NE NE B 0.15U 088514-009 SW846 6020 Lead ND 0.0005 0.002 NE 0.050 U 088514-009 SW846 6020 Magnesium 10.3 0.005 0.015 NE NE B 088514-009 SW846 6020 Manganese ND 0.001 0.005 NE NE U 088514-009 SW846 6020 Mercury ND 0.000066 0.0002 0.002 0.002 U 088514-009 SW846 7470 Nickel 0.00477 0.0005 0.002 NE NE 088514-009 SW846 6020 Potassium 3.32 0.080 0.300 NE NE 088514-009 SW846 6020 Selenium 0.00222 0.001 0.005 0.050 0.050 J 088514-009 SW846 6020 Silver ND 0.0002 0.001 NE 0.050 U 088514-009 SW846 6020 Sodium 30.0 0.080 0.250 NE NE 088514-009 SW846 6020 Thallium 0.000502 0.0003 0.001 0.002 NE J 0.0018U 088514-009 SW846 6020 Uranium 0.00333 0.00005 0.0002 0.030 5.00 088514-009 SW846 6020 Uranium-234 ND 0.00001 0.00005 NE NE U 088514-009 SW846 6020 Uranium-235 0.000022 0.00001 0.00007 NE NE J 088514-009 SW846 6020 Uranium-238 0.00331 0.00005 0.0002 NE NE 088514-009 SW846 6020 Vanadium ND 0.003 0.010 NE NE U 088514-009 SW846 6020 Zinc 0.0126 0.0026 0.010 NE NE B 0.018U 088514-009 SW846 6020Refer to footnotes on page 2A-47.

2A-24
AN
NU
AL
GR
OU
ND
WA
TE
R M
ON
ITO
RIN
G R
EP
OR
T, CA
LE
ND
AR
YE
AR
2010
Table 2A-4 (Continued) Summary of Dissolved (Filtered) Metal Results,
Groundwater Protection Program Groundwater Surveillance Task, Sandia National Laboratories/New Mexico
Calendar Year 2010
Well ID Analyte Resulta (mg/L)
MDLb (mg/L)
PQLc (mg/L)
MCL/MACd (mg/L)
Laboratory Qualifiere
Validation Qualifierf Sample No. Analytical
Methodg PL-4 Aluminum ND 0.050 0.150 NE NE U 088511-009 SW846 602011-Mar-10 Antimony ND 0.0005 0.003 0.006 NE U 088511-009 SW846 6020 Arsenic ND 0.0015 0.005 0.010 0.100 U 088511-009 SW846 6020 Barium 0.070 0.0005 0.002 2.00 1.00 088511-009 SW846 6020 Beryllium ND 0.0005 0.0025 0.004 NE U 088511-009 SW846 6020 Cadmium ND 0.00011 0.001 0.005 0.010 U 088511-009 SW846 6020 Calcium 66.1 0.100 1.00 NE NE B 088511-009 SW846 6020 Chromium ND 0.0125 0.050 0.100 0.050 U 088511-009 SW846 6020 Cobalt ND 0.0005 0.005 NE NE U 088511-009 SW846 6020 Copper ND 0.0015 0.005 NE NE U 088511-009 SW846 6020 Iron 0.0944 0.050 0.500 NE NE J 088511-009 SW846 6020 Lead ND 0.0005 0.002 NE 0.050 U 088511-009 SW846 6020 Magnesium 11.9 0.025 0.075 NE NE J 088511-009 SW846 6020 Manganese 0.125 0.005 0.025 NE NE 088511-009 SW846 6020 Mercury ND 0.000066 0.0002 0.002 0.002 U UJ 088511-009 SW846 7470 Nickel ND 0.0025 0.010 NE NE U 088511-009 SW846 6020 Potassium 4.88 0.400 1.50 NE NE 088511-009 SW846 6020 Selenium 0.00107 0.001 0.005 0.050 0.050 J 088511-009 SW846 6020 Silver ND 0.0002 0.001 NE 0.050 U 088511-009 SW846 6020 Sodium 24.9 0.400 1.25 NE NE 088511-009 SW846 6020 Thallium ND 0.0003 0.001 0.002 NE U 088511-009 SW846 6020 Uranium 0.00315 0.00005 0.0002 0.030 5.00 088511-009 SW846 6020 Uranium-234 ND 0.00001 0.00005 NE NE U 088511-009 SW846 6020 Uranium-235 0.000022 0.00001 0.00007 NE NE J 088511-009 SW846 6020 Uranium-238 0.00313 0.00005 0.0002 NE NE 088511-009 SW846 6020 Vanadium ND 0.015 0.050 NE NE U UJ 088511-009 SW846 6020 Zinc ND 0.0026 0.010 NE NE U 088511-009 SW846 6020Refer to footnotes on page 2A-47.

GR
OU
ND
WA
TE
R P
RO
TE
CT
ION
PR
OG
RA
M
2A-25
Table 2A-4 (Continued) Summary of Dissolved (Filtered) Metal Results,
Groundwater Protection Program Groundwater Surveillance Task, Sandia National Laboratories/New Mexico
Calendar Year 2010
Well ID Analyte Resulta (mg/L)
MDLb (mg/L)
PQLc (mg/L)
MCL/MACd (mg/L)
Laboratory Qualifiere
Validation Qualifierf Sample No. Analytical
Methodg PL-4 (Duplicate) Aluminum ND 0.050 0.150 NE NE U 088512-009 SW846 602011-Mar-10 Antimony ND 0.0005 0.003 0.006 NE U 088512-009 SW846 6020 Arsenic ND 0.0015 0.005 0.010 0.100 U 088512-009 SW846 6020 Barium 0.0717 0.0005 0.002 2.00 1.00 088512-009 SW846 6020 Beryllium ND 0.0005 0.0025 0.004 NE U 088512-009 SW846 6020 Cadmium ND 0.00011 0.001 0.005 0.010 U 088512-009 SW846 6020 Calcium 53.5 0.100 1.00 NE NE B 088512-009 SW846 6020 Chromium ND 0.0125 0.050 0.100 0.050 U 088512-009 SW846 6020 Cobalt ND 0.0005 0.005 NE NE U 088512-009 SW846 6020 Copper ND 0.0015 0.005 NE NE U 088512-009 SW846 6020 Iron 0.0811 0.050 0.500 NE NE J 088512-009 SW846 6020 Lead ND 0.0005 0.002 NE 0.050 U 088512-009 SW846 6020 Magnesium 10.7 0.025 0.075 NE NE J 088512-009 SW846 6020 Manganese 0.102 0.005 0.025 NE NE 088512-009 SW846 6020 Mercury ND 0.000066 0.0002 0.002 0.002 U UJ 088512-009 SW846 7470 Nickel ND 0.0025 0.010 NE NE U 088512-009 SW846 6020 Potassium 4.21 0.400 1.50 NE NE 088512-009 SW846 6020 Selenium 0.0015 0.001 0.005 0.050 0.050 J 088512-009 SW846 6020 Silver ND 0.0002 0.001 NE 0.050 U 088512-009 SW846 6020 Sodium 20.4 0.400 1.25 NE NE 088512-009 SW846 6020 Thallium ND 0.0003 0.001 0.002 NE U 088512-009 SW846 6020 Uranium 0.00325 0.00005 0.0002 0.030 5.00 088512-009 SW846 6020 Uranium-234 ND 0.00001 0.00005 NE NE U 088512-009 SW846 6020 Uranium-235 0.000022 0.00001 0.00007 NE NE J 088512-009 SW846 6020 Uranium-238 0.00323 0.00005 0.0002 NE NE 088512-009 SW846 6020 Vanadium ND 0.015 0.050 NE NE U UJ 088512-009 SW846 6020 Zinc 0.00302 0.0026 0.010 NE NE J J+ 088512-009 SW846 6020Refer to footnotes on page 2A-47.

2A-26
AN
NU
AL
GR
OU
ND
WA
TE
R M
ON
ITO
RIN
G R
EP
OR
T, CA
LE
ND
AR
YE
AR
2010
Table 2A-4 (Continued) Summary of Dissolved (Filtered) Metal Results,
Groundwater Protection Program Groundwater Surveillance Task, Sandia National Laboratories/New Mexico
Calendar Year 2010
Well ID Analyte Resulta (mg/L)
MDLb (mg/L)
PQLc (mg/L)
MCL/MACd (mg/L)
Laboratory Qualifiere
Validation Qualifierf Sample No. Analytical
Methodg SFR-2S Aluminum 0.0916 0.050 0.150 NE NE B, J 0.63U 088503-009 SW846 602008-Mar-10 Antimony ND 0.0005 0.003 0.006 NE U 088503-009 SW846 6020 Arsenic ND 0.0015 0.005 0.010 0.100 U 088503-009 SW846 6020 Barium 0.0575 0.0005 0.002 2.00 1.00 088503-009 SW846 6020 Beryllium ND 0.0005 0.0025 0.004 NE U 088503-009 SW846 6020 Cadmium ND 0.00011 0.001 0.005 0.010 U 088503-009 SW846 6020 Calcium 128 0.100 1.00 NE NE B 088503-009 SW846 6020 Chromium ND 0.0125 0.050 0.100 0.050 U 088503-009 SW846 6020 Cobalt 0.00076 0.0005 0.005 NE NE J 088503-009 SW846 6020 Copper 0.00362 0.0015 0.005 NE NE B, J J+ 088503-009 SW846 6020 Iron 0.172 0.050 0.500 NE NE J 088503-009 SW846 6020 Lead ND 0.0005 0.002 NE 0.050 U 088503-009 SW846 6020 Magnesium 36.8 0.025 0.075 NE NE J 088503-009 SW846 6020 Manganese 0.00582 0.005 0.025 NE NE J J+ 088503-009 SW846 6020 Mercury ND 0.000066 0.0002 0.002 0.002 U UJ 088503-009 SW846 7470 Nickel 0.0433 0.0025 0.010 NE NE J+ 088503-009 SW846 6020 Potassium 7.82 0.400 1.50 NE NE 088503-009 SW846 6020 Selenium 0.00197 0.001 0.005 0.050 0.050 J 088503-009 SW846 6020 Silver ND 0.0002 0.001 NE 0.050 U 088503-009 SW846 6020 Sodium 75.9 0.400 1.25 NE NE 088503-009 SW846 6020 Thallium ND 0.0003 0.001 0.002 NE U 088503-009 SW846 6020 Uranium 0.0154 0.00005 0.0002 0.030 5.00 088503-009 SW846 6020 Uranium-234 ND 0.00001 0.00005 NE NE U 088503-009 SW846 6020 Uranium-235 0.000109 0.00001 0.00007 NE NE 088503-009 SW846 6020 Uranium-238 0.0153 0.00005 0.0002 NE NE 088503-009 SW846 6020 Vanadium ND 0.015 0.050 NE NE U UJ 088503-009 SW846 6020 Zinc 0.00561 0.0026 0.010 NE NE J J+ 088503-009 SW846 6020Refer to footnotes on page 2A-47.

GR
OU
ND
WA
TE
R P
RO
TE
CT
ION
PR
OG
RA
M
2A-27
Table 2A-4 (Continued) Summary of Dissolved (Filtered) Metal Results,
Groundwater Protection Program Groundwater Surveillance Task, Sandia National Laboratories/New Mexico
Calendar Year 2010
Well ID Analyte Resulta (mg/L)
MDLb (mg/L)
PQLc (mg/L)
MCL/MACd (mg/L)
Laboratory Qualifiere
Validation Qualifierf Sample No. Analytical
Methodg SFR-4T Aluminum ND 0.010 0.030 NE NE U 088533-009 SW846 602023-Mar-10 Antimony ND 0.0005 0.003 0.006 NE U 088533-009 SW846 6020 Arsenic 0.00194 0.0015 0.005 0.010 0.100 J 088533-009 SW846 6020 Barium 0.010 0.0005 0.002 2.00 1.00 088533-009 SW846 6020 Beryllium ND 0.0001 0.0005 0.004 NE U 088533-009 SW846 6020 Cadmium ND 0.00011 0.001 0.005 0.010 U 088533-009 SW846 6020 Calcium 65.8 0.100 1.00 NE NE 088533-009 SW846 6020 Chromium ND 0.0025 0.010 0.100 0.050 U 088533-009 SW846 6020 Cobalt 0.00025 0.0001 0.001 NE NE J 088533-009 SW846 6020 Copper 0.00762 0.0003 0.001 NE NE 088533-009 SW846 6020 Iron 0.236 0.010 0.100 NE NE 088533-009 SW846 6020 Lead ND 0.0005 0.002 NE 0.050 U 088533-009 SW846 6020 Magnesium 4.03 0.005 0.015 NE NE J 088533-009 SW846 6020 Manganese ND 0.001 0.005 NE NE U 088533-009 SW846 6020 Mercury ND 0.000066 0.0002 0.002 0.002 U 088533-009 SW846 7470 Nickel 0.00424 0.0005 0.002 NE NE 088533-009 SW846 6020 Potassium 2.84 0.080 0.300 NE NE 088533-009 SW846 6020 Selenium 0.00282 0.001 0.005 0.050 0.050 J 088533-009 SW846 6020 Silver ND 0.0002 0.001 NE 0.050 U 088533-009 SW846 6020 Sodium 1180 4.00 12.5 NE NE J 088533-009 SW846 6020 Thallium ND 0.0003 0.001 0.002 NE U 088533-009 SW846 6020 Uranium 0.000295 0.00005 0.0002 0.030 5.00 088533-009 SW846 6020 Uranium-234 ND 0.00001 0.00005 NE NE U 088533-009 SW846 6020 Uranium-235 ND 0.00001 0.00007 NE NE U 088533-009 SW846 6020 Uranium-238 0.000295 0.00005 0.0002 NE NE 088533-009 SW846 6020 Vanadium ND 0.003 0.010 NE NE U 088533-009 SW846 6020 Zinc 0.0225 0.0026 0.010 NE NE 088533-009 SW846 6020Refer to footnotes on page 2A-47.

2A-28
AN
NU
AL
GR
OU
ND
WA
TE
R M
ON
ITO
RIN
G R
EP
OR
T, CA
LE
ND
AR
YE
AR
2010
Table 2A-4 (Continued) Summary of Dissolved (Filtered) Metal Results,
Groundwater Protection Program Groundwater Surveillance Task, Sandia National Laboratories/New Mexico
Calendar Year 2010
Well ID Analyte Resulta (mg/L)
MDLb (mg/L)
PQLc (mg/L)
MCL/MACd (mg/L)
Laboratory Qualifiere
Validation Qualifierf Sample No. Analytical
Methodg SWTA3-MW2 Aluminum ND 0.010 0.030 NE NE U 088528-009 SW846 602019-Mar-10 Antimony ND 0.0005 0.003 0.006 NE U 088528-009 SW846 6020 Arsenic ND 0.0015 0.005 0.010 0.100 U 088528-009 SW846 6020 Barium 0.074 0.0005 0.002 2.00 1.00 088528-009 SW846 6020 Beryllium ND 0.0001 0.0005 0.004 NE U 088528-009 SW846 6020 Cadmium ND 0.00011 0.001 0.005 0.010 U 088528-009 SW846 6020 Calcium 41.4 0.020 0.200 NE NE 088528-009 SW846 6020 Chromium ND 0.0025 0.010 0.100 0.050 U 088528-009 SW846 6020 Cobalt 0.000212 0.0001 0.001 NE NE J 088528-009 SW846 6020 Copper 0.000965 0.0003 0.001 NE NE J 088528-009 SW846 6020 Iron 0.174 0.010 0.100 NE NE 088528-009 SW846 6020 Lead ND 0.0005 0.002 NE 0.050 U 088528-009 SW846 6020 Magnesium 14.0 0.005 0.015 NE NE J 088528-009 SW846 6020 Manganese 0.00135 0.001 0.005 NE NE J 088528-009 SW846 6020 Mercury ND 0.000066 0.0002 0.002 0.002 U 088528-009 SW846 7470 Nickel 0.00165 0.0005 0.002 NE NE J 088528-009 SW846 6020 Potassium 4.39 0.080 0.300 NE NE 088528-009 SW846 6020 Selenium 0.00159 0.001 0.005 0.050 0.050 J 088528-009 SW846 6020 Silver ND 0.0002 0.001 NE 0.050 U 088528-009 SW846 6020 Sodium 35.1 0.080 0.250 NE NE 088528-009 SW846 6020 Thallium ND 0.0003 0.001 0.002 NE U 088528-009 SW846 6020 Uranium 0.00332 0.00005 0.0002 0.030 5.00 088528-009 SW846 6020 Uranium-234 ND 0.00001 0.00005 NE NE U 088528-009 SW846 6020 Uranium-235 0.000023 0.00001 0.00007 NE NE J 088528-009 SW846 6020 Uranium-238 0.00329 0.00005 0.0002 NE NE 088528-009 SW846 6020 Vanadium 0.00312 0.003 0.010 NE NE J 088528-009 SW846 6020 Zinc ND 0.0026 0.010 NE NE U 088528-009 SW846 6020Refer to footnotes on page 2A-47.

GR
OU
ND
WA
TE
R P
RO
TE
CT
ION
PR
OG
RA
M
2A-29
Table 2A-4 (Continued) Summary of Dissolved (Filtered) Metal Results,
Groundwater Protection Program Groundwater Surveillance Task, Sandia National Laboratories/New Mexico
Calendar Year 2010
Well ID Analyte Resulta (mg/L)
MDLb (mg/L)
PQLc (mg/L)
MCL/MACd (mg/L)
Laboratory Qualifiere
Validation Qualifierf Sample No. Analytical
Methodg SWTA3-MW3 Aluminum ND 0.010 0.030 NE NE U 088520-009 SW846 602016-Mar-10 Antimony ND 0.0005 0.003 0.006 NE U 088520-009 SW846 6020 Arsenic ND 0.0015 0.005 0.010 0.100 U 088520-009 SW846 6020 Barium 0.0599 0.0005 0.002 2.00 1.00 B 088520-009 SW846 6020 Beryllium ND 0.0001 0.0005 0.004 NE U 088520-009 SW846 6020 Cadmium ND 0.00011 0.001 0.005 0.010 U 088520-009 SW846 6020 Calcium 39.2 0.020 0.200 NE NE B 088520-009 SW846 6020 Chromium ND 0.0025 0.010 0.100 0.050 U 088520-009 SW846 6020 Cobalt 0.000154 0.0001 0.001 NE NE B, J 0.00052U 088520-009 SW846 6020 Copper 0.000571 0.0003 0.001 NE NE B, J 0.0016U 088520-009 SW846 6020 Iron 0.135 0.010 0.100 NE NE B 0.15U 088520-009 SW846 6020 Lead ND 0.0005 0.002 NE 0.050 U 088520-009 SW846 6020 Magnesium 11.6 0.005 0.015 NE NE B 088520-009 SW846 6020 Manganese ND 0.001 0.005 NE NE U 088520-009 SW846 6020 Mercury ND 0.000066 0.0002 0.002 0.002 U 088520-009 SW846 7470 Nickel 0.00112 0.0005 0.002 NE NE J 088520-009 SW846 6020 Potassium 4.60 0.080 0.300 NE NE 088520-009 SW846 6020 Selenium 0.00116 0.001 0.005 0.050 0.050 J 088520-009 SW846 6020 Silver ND 0.0002 0.001 NE 0.050 U 088520-009 SW846 6020 Sodium 47.8 1.60 5.00 NE NE 088520-009 SW846 6020 Thallium ND 0.0003 0.001 0.002 NE U 088520-009 SW846 6020 Uranium 0.00214 0.00005 0.0002 0.030 5.00 088520-009 SW846 6020 Uranium-234 ND 0.00001 0.00005 NE NE U 088520-009 SW846 6020 Uranium-235 0.000014 0.00001 0.00007 NE NE J 088520-009 SW846 6020 Uranium-238 0.00212 0.00005 0.0002 NE NE 088520-009 SW846 6020 Vanadium 0.00584 0.003 0.010 NE NE J 088520-009 SW846 6020 Zinc 0.00331 0.0026 0.010 NE NE B, J 0.018U 088520-009 SW846 6020Refer to footnotes on page 2A-47.
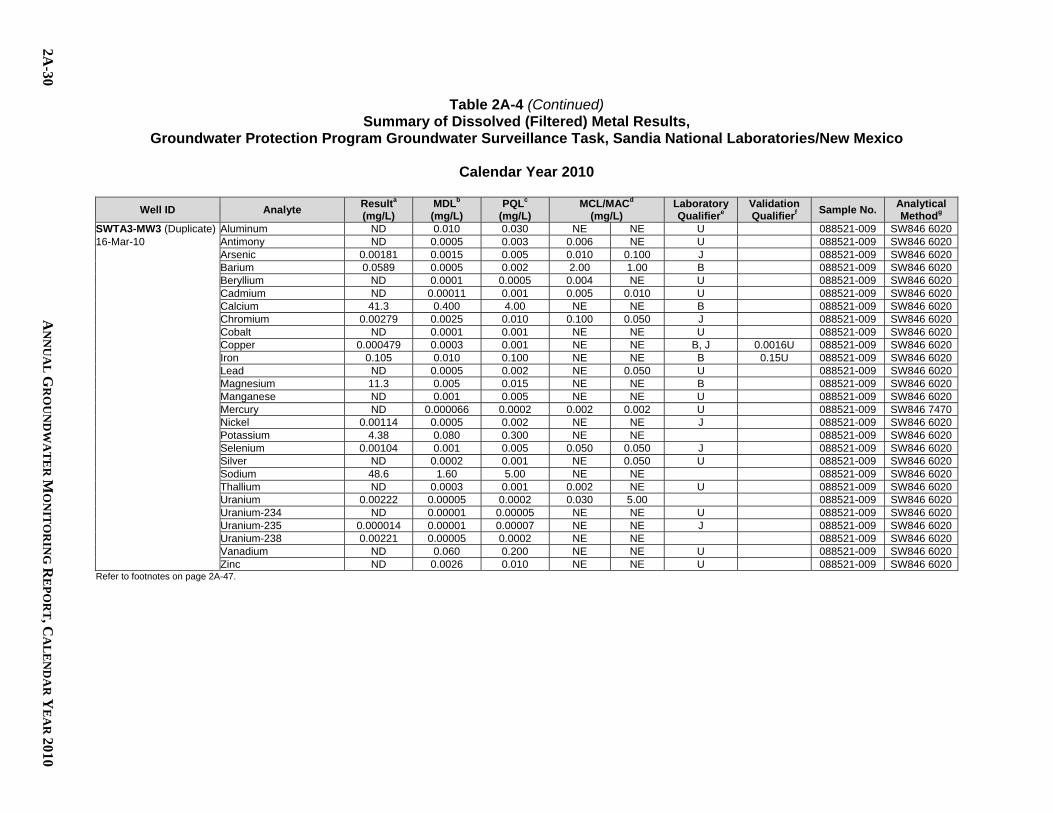
2A-30
AN
NU
AL
GR
OU
ND
WA
TE
R M
ON
ITO
RIN
G R
EP
OR
T, CA
LE
ND
AR
YE
AR
2010
Table 2A-4 (Continued) Summary of Dissolved (Filtered) Metal Results,
Groundwater Protection Program Groundwater Surveillance Task, Sandia National Laboratories/New Mexico
Calendar Year 2010
Well ID Analyte Resulta (mg/L)
MDLb (mg/L)
PQLc (mg/L)
MCL/MACd (mg/L)
Laboratory Qualifiere
Validation Qualifierf Sample No. Analytical
Methodg SWTA3-MW3 (Duplicate) Aluminum ND 0.010 0.030 NE NE U 088521-009 SW846 602016-Mar-10 Antimony ND 0.0005 0.003 0.006 NE U 088521-009 SW846 6020 Arsenic 0.00181 0.0015 0.005 0.010 0.100 J 088521-009 SW846 6020 Barium 0.0589 0.0005 0.002 2.00 1.00 B 088521-009 SW846 6020 Beryllium ND 0.0001 0.0005 0.004 NE U 088521-009 SW846 6020 Cadmium ND 0.00011 0.001 0.005 0.010 U 088521-009 SW846 6020 Calcium 41.3 0.400 4.00 NE NE B 088521-009 SW846 6020 Chromium 0.00279 0.0025 0.010 0.100 0.050 J 088521-009 SW846 6020 Cobalt ND 0.0001 0.001 NE NE U 088521-009 SW846 6020 Copper 0.000479 0.0003 0.001 NE NE B, J 0.0016U 088521-009 SW846 6020 Iron 0.105 0.010 0.100 NE NE B 0.15U 088521-009 SW846 6020 Lead ND 0.0005 0.002 NE 0.050 U 088521-009 SW846 6020 Magnesium 11.3 0.005 0.015 NE NE B 088521-009 SW846 6020 Manganese ND 0.001 0.005 NE NE U 088521-009 SW846 6020 Mercury ND 0.000066 0.0002 0.002 0.002 U 088521-009 SW846 7470 Nickel 0.00114 0.0005 0.002 NE NE J 088521-009 SW846 6020 Potassium 4.38 0.080 0.300 NE NE 088521-009 SW846 6020 Selenium 0.00104 0.001 0.005 0.050 0.050 J 088521-009 SW846 6020 Silver ND 0.0002 0.001 NE 0.050 U 088521-009 SW846 6020 Sodium 48.6 1.60 5.00 NE NE 088521-009 SW846 6020 Thallium ND 0.0003 0.001 0.002 NE U 088521-009 SW846 6020 Uranium 0.00222 0.00005 0.0002 0.030 5.00 088521-009 SW846 6020 Uranium-234 ND 0.00001 0.00005 NE NE U 088521-009 SW846 6020 Uranium-235 0.000014 0.00001 0.00007 NE NE J 088521-009 SW846 6020 Uranium-238 0.00221 0.00005 0.0002 NE NE 088521-009 SW846 6020 Vanadium ND 0.060 0.200 NE NE U 088521-009 SW846 6020 Zinc ND 0.0026 0.010 NE NE U 088521-009 SW846 6020Refer to footnotes on page 2A-47.
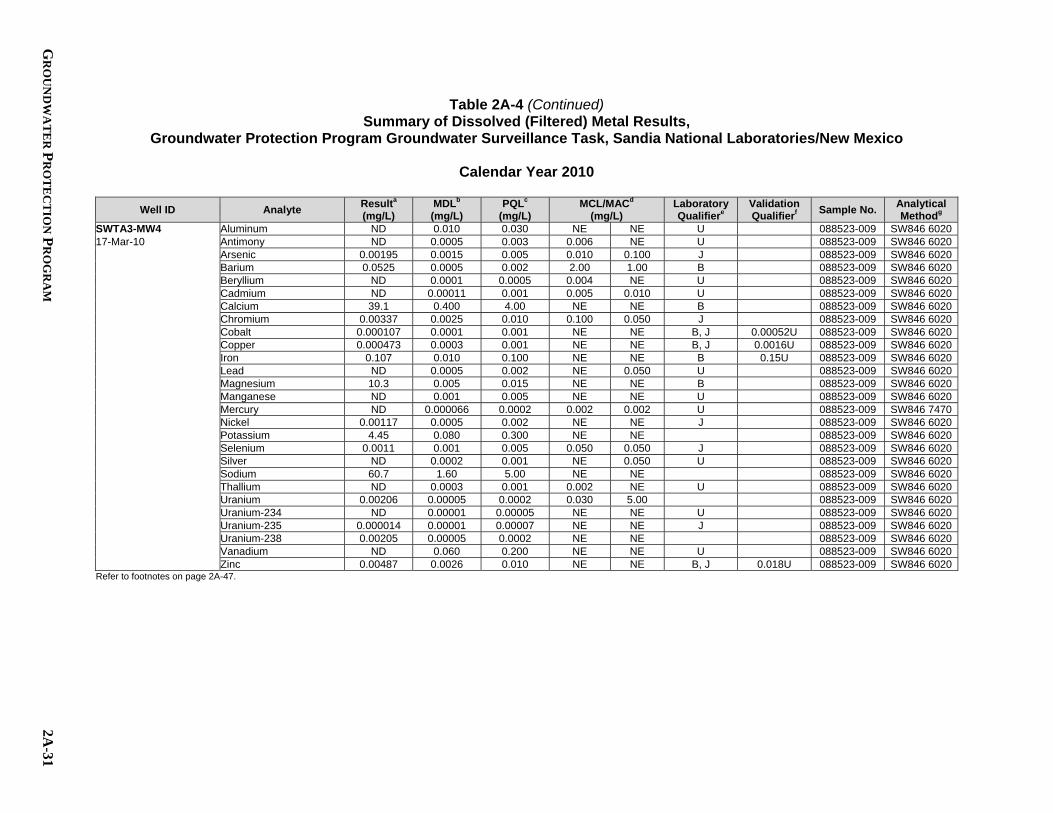
GR
OU
ND
WA
TE
R P
RO
TE
CT
ION
PR
OG
RA
M
2A-31
Table 2A-4 (Continued) Summary of Dissolved (Filtered) Metal Results,
Groundwater Protection Program Groundwater Surveillance Task, Sandia National Laboratories/New Mexico
Calendar Year 2010
Well ID Analyte Resulta (mg/L)
MDLb (mg/L)
PQLc (mg/L)
MCL/MACd (mg/L)
Laboratory Qualifiere
Validation Qualifierf Sample No. Analytical
Methodg SWTA3-MW4 Aluminum ND 0.010 0.030 NE NE U 088523-009 SW846 602017-Mar-10 Antimony ND 0.0005 0.003 0.006 NE U 088523-009 SW846 6020 Arsenic 0.00195 0.0015 0.005 0.010 0.100 J 088523-009 SW846 6020 Barium 0.0525 0.0005 0.002 2.00 1.00 B 088523-009 SW846 6020 Beryllium ND 0.0001 0.0005 0.004 NE U 088523-009 SW846 6020 Cadmium ND 0.00011 0.001 0.005 0.010 U 088523-009 SW846 6020 Calcium 39.1 0.400 4.00 NE NE B 088523-009 SW846 6020 Chromium 0.00337 0.0025 0.010 0.100 0.050 J 088523-009 SW846 6020 Cobalt 0.000107 0.0001 0.001 NE NE B, J 0.00052U 088523-009 SW846 6020 Copper 0.000473 0.0003 0.001 NE NE B, J 0.0016U 088523-009 SW846 6020 Iron 0.107 0.010 0.100 NE NE B 0.15U 088523-009 SW846 6020 Lead ND 0.0005 0.002 NE 0.050 U 088523-009 SW846 6020 Magnesium 10.3 0.005 0.015 NE NE B 088523-009 SW846 6020 Manganese ND 0.001 0.005 NE NE U 088523-009 SW846 6020 Mercury ND 0.000066 0.0002 0.002 0.002 U 088523-009 SW846 7470 Nickel 0.00117 0.0005 0.002 NE NE J 088523-009 SW846 6020 Potassium 4.45 0.080 0.300 NE NE 088523-009 SW846 6020 Selenium 0.0011 0.001 0.005 0.050 0.050 J 088523-009 SW846 6020 Silver ND 0.0002 0.001 NE 0.050 U 088523-009 SW846 6020 Sodium 60.7 1.60 5.00 NE NE 088523-009 SW846 6020 Thallium ND 0.0003 0.001 0.002 NE U 088523-009 SW846 6020 Uranium 0.00206 0.00005 0.0002 0.030 5.00 088523-009 SW846 6020 Uranium-234 ND 0.00001 0.00005 NE NE U 088523-009 SW846 6020 Uranium-235 0.000014 0.00001 0.00007 NE NE J 088523-009 SW846 6020 Uranium-238 0.00205 0.00005 0.0002 NE NE 088523-009 SW846 6020 Vanadium ND 0.060 0.200 NE NE U 088523-009 SW846 6020 Zinc 0.00487 0.0026 0.010 NE NE B, J 0.018U 088523-009 SW846 6020Refer to footnotes on page 2A-47.

2A-32
AN
NU
AL
GR
OU
ND
WA
TE
R M
ON
ITO
RIN
G R
EP
OR
T, CA
LE
ND
AR
YE
AR
2010
Table 2A-4 (Concluded) Summary of Dissolved (Filtered) Metal Results,
Groundwater Protection Program Groundwater Surveillance Task, Sandia National Laboratories/New Mexico
Calendar Year 2010
Well ID Analyte Resulta (mg/L)
MDLb (mg/L)
PQLc (mg/L)
MCL/MACd (mg/L)
Laboratory Qualifiere
Validation Qualifierf Sample No. Analytical
Methodg TRE-1 Aluminum ND 0.050 0.150 NE NE U 088505-009 SW846 602009-Mar-10 Antimony ND 0.0005 0.003 0.006 NE U 088505-009 SW846 6020 Arsenic ND 0.0015 0.005 0.010 0.100 U 088505-009 SW846 6020 Barium 0.0452 0.0005 0.002 2.00 1.00 088505-009 SW846 6020 Beryllium ND 0.0005 0.0025 0.004 NE U 088505-009 SW846 6020 Cadmium ND 0.00011 0.001 0.005 0.010 U 088505-009 SW846 6020 Calcium 166 0.100 1.00 NE NE B 088505-009 SW846 6020 Chromium ND 0.0125 0.050 0.100 0.050 U 088505-009 SW846 6020 Cobalt ND 0.0005 0.005 NE NE U 088505-009 SW846 6020 Copper ND 0.0015 0.005 NE NE U 088505-009 SW846 6020 Iron 0.216 0.050 0.500 NE NE J 088505-009 SW846 6020 Lead ND 0.0005 0.002 NE 0.050 U 088505-009 SW846 6020 Magnesium 36.8 0.025 0.075 NE NE J 088505-009 SW846 6020 Manganese ND 0.005 0.025 NE NE U 088505-009 SW846 6020 Mercury ND 0.000066 0.0002 0.002 0.002 U UJ 088505-009 SW846 7470 Nickel 0.00263 0.0025 0.010 NE NE J J+ 088505-009 SW846 6020 Potassium 6.75 0.400 1.50 NE NE 088505-009 SW846 6020 Selenium 0.00236 0.001 0.005 0.050 0.050 J 088505-009 SW846 6020 Silver ND 0.0002 0.001 NE 0.050 U 088505-009 SW846 6020 Sodium 109 0.400 1.25 NE NE 088505-009 SW846 6020 Thallium ND 0.0003 0.001 0.002 NE U 088505-009 SW846 6020 Uranium 0.0166 0.00005 0.0002 0.030 5.00 088505-009 SW846 6020 Uranium-234 ND 0.00001 0.00005 NE NE U 088505-009 SW846 6020 Uranium-235 0.000122 0.00001 0.00007 NE NE 088505-009 SW846 6020 Uranium-238 0.0165 0.00005 0.0002 NE NE 088505-009 SW846 6020 Vanadium ND 0.015 0.050 NE NE U UJ 088505-009 SW846 6020 Zinc 0.0031 0.0026 0.010 NE NE J J+ 088505-009 SW846 6020Refer to footnotes on page 2A-47.
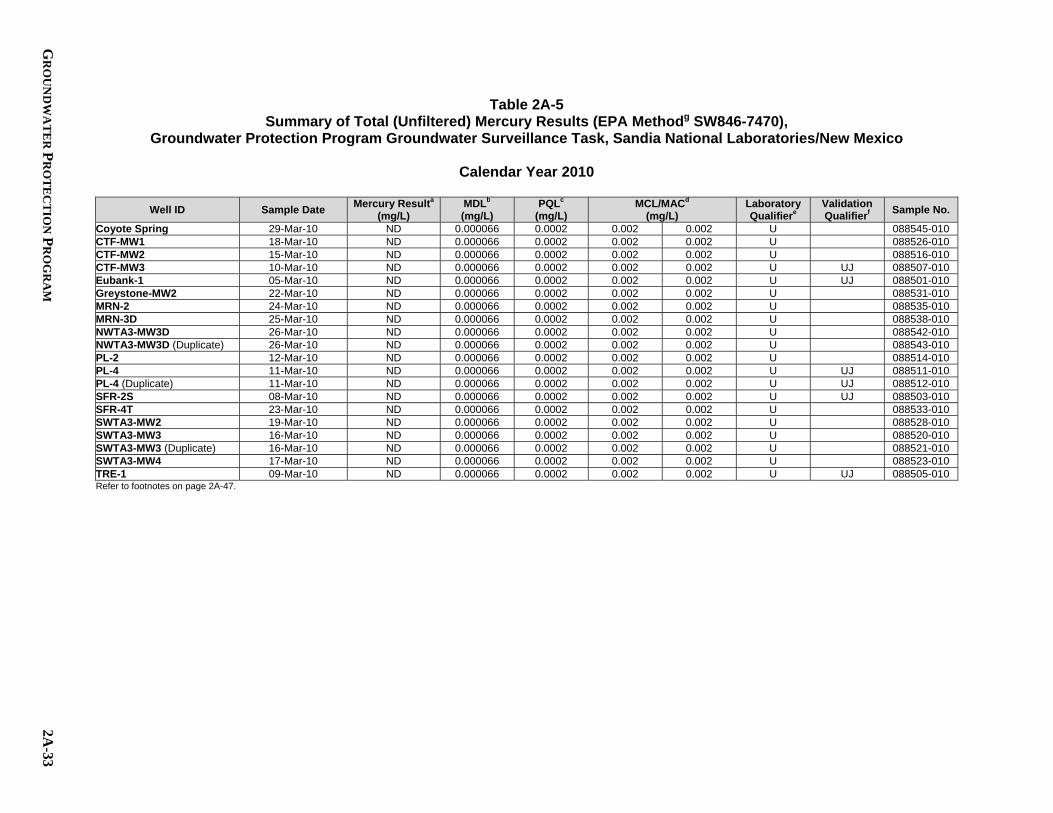
GR
OU
ND
WA
TE
R P
RO
TE
CT
ION
PR
OG
RA
M
2A-33
Table 2A-5 Summary of Total (Unfiltered) Mercury Results (EPA Methodg SW846-7470),
Groundwater Protection Program Groundwater Surveillance Task, Sandia National Laboratories/New Mexico
Calendar Year 2010
Well ID Sample Date Mercury Resulta (mg/L)
MDLb (mg/L)
PQLc (mg/L)
MCL/MACd (mg/L)
Laboratory Qualifiere
Validation Qualifierf Sample No.
Coyote Spring 29-Mar-10 ND 0.000066 0.0002 0.002 0.002 U 088545-010 CTF-MW1 18-Mar-10 ND 0.000066 0.0002 0.002 0.002 U 088526-010 CTF-MW2 15-Mar-10 ND 0.000066 0.0002 0.002 0.002 U 088516-010 CTF-MW3 10-Mar-10 ND 0.000066 0.0002 0.002 0.002 U UJ 088507-010 Eubank-1 05-Mar-10 ND 0.000066 0.0002 0.002 0.002 U UJ 088501-010 Greystone-MW2 22-Mar-10 ND 0.000066 0.0002 0.002 0.002 U 088531-010 MRN-2 24-Mar-10 ND 0.000066 0.0002 0.002 0.002 U 088535-010 MRN-3D 25-Mar-10 ND 0.000066 0.0002 0.002 0.002 U 088538-010 NWTA3-MW3D 26-Mar-10 ND 0.000066 0.0002 0.002 0.002 U 088542-010 NWTA3-MW3D (Duplicate) 26-Mar-10 ND 0.000066 0.0002 0.002 0.002 U 088543-010 PL-2 12-Mar-10 ND 0.000066 0.0002 0.002 0.002 U 088514-010 PL-4 11-Mar-10 ND 0.000066 0.0002 0.002 0.002 U UJ 088511-010 PL-4 (Duplicate) 11-Mar-10 ND 0.000066 0.0002 0.002 0.002 U UJ 088512-010 SFR-2S 08-Mar-10 ND 0.000066 0.0002 0.002 0.002 U UJ 088503-010 SFR-4T 23-Mar-10 ND 0.000066 0.0002 0.002 0.002 U 088533-010 SWTA3-MW2 19-Mar-10 ND 0.000066 0.0002 0.002 0.002 U 088528-010 SWTA3-MW3 16-Mar-10 ND 0.000066 0.0002 0.002 0.002 U 088520-010 SWTA3-MW3 (Duplicate) 16-Mar-10 ND 0.000066 0.0002 0.002 0.002 U 088521-010 SWTA3-MW4 17-Mar-10 ND 0.000066 0.0002 0.002 0.002 U 088523-010 TRE-1 09-Mar-10 ND 0.000066 0.0002 0.002 0.002 U UJ 088505-010 Refer to footnotes on page 2A-47.

2A-34
AN
NU
AL
GR
OU
ND
WA
TE
R M
ON
ITO
RIN
G R
EP
OR
T, CA
LE
ND
AR
YE
AR
2010
Table 2A-6 Summary of Gamma-Emitting Radionuclides/Short List (EPA Methodg 901.0),
Groundwater Protection Program Groundwater Surveillance Task, Sandia National Laboratories/New Mexico
Calendar Year 2010
Well ID Analyte Activitya (pCi/L)
MDAb (pCi/L)
Critical Levelc(pCi/L)
MCL/MACd (pCi/L)
Laboratory Qualifiere
Validation Qualifierf Sample No.
Coyote Spring Americium-241 -0.0669 ± 5.81 9.43 4.72 NE NE U BD 088545-033 29-Mar-10 Cesium-137 0.120 ± 1.52 2.54 1.27 NE NE U BD 088545-033 Cobalt-60 1.72 ± 1.71 3.03 1.52 NE NE U BD 088545-033 Potassium-40 6.55 ± 36.7 42.3 21.1 NE NE U BD 088545-033 CTF-MW1 Americium-241 -0.165 ± 5.32 8.93 4.47 NE NE U BD 088526-033 18-Mar-10 Cesium-137 0.829 ± 1.51 2.66 1.33 NE NE U BD 088526-033 Cobalt-60 1.86 ± 1.70 3.01 1.51 NE NE U BD 088526-033 Potassium-40 56.4 ± 24.7 25.6 12.8 NE NE J 088526-033 CTF-MW2 Americium-241 -56.2 ± 20.2 27.3 13.7 NE NE U BD 088516-033 15-Mar-10 Cesium-137 1.15 ± 2.10 3.55 1.78 NE NE U BD 088516-033 Cobalt-60 0.194 ± 2.09 3.46 1.73 NE NE U BD 088516-033 Potassium-40 12.4 ± 45.7 54.8 27.4 NE NE U BD 088516-033 CTF-MW3 Americium-241 1.75 ± 5.32 9.00 4.51 NE NE U BD 088507-033 10-Mar-10 Cesium-137 -1.72 ± 1.56 2.53 1.26 NE NE U BD 088507-033 Cobalt-60 1.40 ± 1.67 2.92 1.46 NE NE U BD 088507-033 Potassium-40 54.7 ± 18.6 54.7 18.1 NE NE J 088507-033 Eubank-1 Americium-241 -4.41 ± 13.1 22.1 11.1 NE NE U BD 088501-033 05-Mar-10 Cesium-137 1.31 ± 1.91 3.35 1.67 NE NE U BD 088501-033 Cobalt-60 0.507 ± 1.96 3.38 1.69 NE NE U BD 088501-033 Potassium-40 -34.9 ± 38.3 47.0 23.5 NE NE U BD 088501-033 Greystone-MW2 Americium-241 -2.5 ± 4.02 4.36 2.18 NE NE U BD 088531-033 22-Mar-10 Cesium-137 -4.96 ± 4.46 5.25 2.63 NE NE U BD 088531-033 Cobalt-60 -0.573 ± 3.46 3.66 1.83 NE NE U BD 088531-033 Potassium-40 8.97 ± 39.2 44.2 22.1 NE NE U BD 088531-033 MRN-2 Americium-241 -3.12 ± 4.95 5.13 2.57 NE NE U BD 088535-033 24-Mar-10 Cesium-137 0.0852 ± 2.48 4.06 2.03 NE NE U BD 088535-033 Cobalt-60 -1.11 ± 4.24 4.33 2.17 NE NE U BD 088535-033 Potassium-40 27.3 ± 25.6 46.6 23.3 NE NE U BD 088535-033 MRN-3D Americium-241 0.308 ± 5.39 9.05 4.53 NE NE U BD 088538-033 25-Mar-10 Cesium-137 -0.151 ± 1.50 2.56 1.28 NE NE U BD 088538-033 Cobalt-60 0.706 ± 1.67 2.83 1.42 NE NE U BD 088538-033 Potassium-40 10.5 ± 36.1 36.5 18.3 NE NE U BD 088538-033 NWTA3-MW3D Americium-241 -10.5 ± 10.4 17.0 8.51 NE NE U BD 088542-033 26-Mar-10 Cesium-137 -0.659 ± 2.08 3.44 1.72 NE NE U BD 088542-033 Cobalt-60 1.05 ± 2.24 3.86 1.93 NE NE U BD 088542-033 Potassium-40 -16.8 ± 39.0 45.2 22.6 NE NE U BD 088542-033 Refer to footnotes on page 2A-47.

GR
OU
ND
WA
TE
R P
RO
TE
CT
ION
PR
OG
RA
M
2A-35
Table 2A-6 (Continued) Summary of Gamma-Emitting Radionuclides/Short List (EPA Methodg 901.0),
Groundwater Protection Program Groundwater Surveillance Task, Sandia National Laboratories/New Mexico
Calendar Year 2010
Well ID Analyte Activitya (pCi/L)
MDAb (pCi/L)
Critical Levelc(pCi/L)
MCL/MACd (pCi/L)
Laboratory Qualifiere
Validation Qualifierf Sample No.
NWTA3-MW3D (Duplicate) Americium-241 5.55 ± 13.3 22.9 11.5 NE NE U BD 088543-033 26-Mar-10 Cesium-137 0.0953 ± 1.83 3.13 1.57 NE NE U BD 088543-033 Cobalt-60 0.161 ± 1.93 3.29 1.64 NE NE U BD 088543-033 Potassium-40 -37.4 ± 41.0 49.7 24.9 NE NE U BD 088543-033 PL-2 Americium-241 -33.6 ± 11.6 17.7 8.84 NE NE U BD 088514-033 12-Mar-10 Cesium-137 -0.982 ± 1.93 3.22 1.61 NE NE U BD 088514-033 Cobalt-60 0.878 ± 1.81 3.17 1.59 NE NE U BD 088514-033 Potassium-40 -22.5 ± 42.9 43.9 22.0 NE NE U BD 088514-033 PL-4 Americium-241 -32.1 ± 11.6 17.9 8.95 NE NE U BD 088511-033 11-Mar-10 Cesium-137 0.545 ± 2.01 3.46 1.73 NE NE U BD 088511-033 Cobalt-60 0.775 ± 1.85 3.23 1.61 NE NE U BD 088511-033 Potassium-40 15.6 ± 36.3 45.6 22.8 NE NE U BD 088511-033 PL-4 (Duplicate) Americium-241 -6.14 ± 11.0 18.7 9.35 NE NE U BD 088512-033 11-Mar-10 Cesium-137 -2.89 ± 3.77 4.00 2.00 NE NE U BD 088512-033 Cobalt-60 0.603 ± 1.83 3.19 1.60 NE NE U BD 088512-033 Potassium-40 48.8 ± 22.7 48.8 21.6 NE NE J 088512-033 SFR-2S Americium-241 -3.38 ± 6.20 9.04 4.52 NE NE U BD 088503-033 08-Mar-10 Cesium-137 0.097 ± 1.59 2.64 1.32 NE NE U BD 088503-033 Cobalt-60 0.600 ± 1.71 2.91 1.46 NE NE U BD 088503-033 Potassium-40 93.9 ± 26.8 25.5 12.8 NE NE 088503-033 SFR-4T Americium-241 -1.85 ± 7.69 12.9 6.46 NE NE U BD 088533-033 23-Mar-10 Cesium-137 0.319 ± 1.73 2.95 1.48 NE NE U BD 088533-033 Cobalt-60 0.779 ± 1.82 3.14 1.57 NE NE U BD 088533-033 Potassium-40 -40.1 ± 35.5 42.8 21.4 NE NE U BD 088533-033 SWTA3-MW2 Americium-241 -21.1 ± 7.63 11.7 5.85 NE NE U BD 088528-033 19-Mar-10 Cesium-137 -0.538 ± 1.86 3.04 1.52 NE NE U BD 088528-033 Cobalt-60 1.25 ± 1.84 3.24 1.62 NE NE U BD 088528-033 Potassium-40 -10.9 ± 38.2 43.5 21.8 NE NE U BD 088528-033 SWTA3-MW3 Americium-241 4.35 ± 11.3 19.7 9.87 NE NE U BD 088520-033 16-Mar-10 Cesium-137 -3.32 ± 3.41 3.90 1.95 NE NE U BD 088520-033 Cobalt-60 0.195 ± 2.01 3.45 1.73 NE NE U BD 088520-033 Potassium-40 -15 ± 37.5 42.1 21.1 NE NE U BD 088520-033 SWTA3-MW3 (Duplicate) Americium-241 -15.1 ± 7.56 12.0 5.99 NE NE U BD 088521-033 16-Mar-10 Cesium-137 1.01 ± 1.91 3.25 1.62 NE NE U BD 088521-033 Cobalt-60 1.52 ± 1.92 3.39 1.70 NE NE U BD 088521-033 Potassium-40 -2.18 ± 39.4 45.6 22.8 NE NE U BD 088521-033 Refer to footnotes on page 2A-47.

2A-36
AN
NU
AL
GR
OU
ND
WA
TE
R M
ON
ITO
RIN
G R
EP
OR
T, CA
LE
ND
AR
YE
AR
2010
Table 2A-6 (Concluded) Summary of Gamma-Emitting Radionuclides/Short List (EPA Methodg 901.0),
Groundwater Protection Program Groundwater Surveillance Task, Sandia National Laboratories/New Mexico
Calendar Year 2010
Well ID Analyte Activitya (pCi/L)
MDAb (pCi/L)
Critical Levelc(pCi/L)
MCL/MACd (pCi/L)
Laboratory Qualifiere
Validation Qualifierf Sample No.
SWTA3-MW4 Americium-241 -3.8 ± 5.00 5.04 2.52 NE NE U BD 088523-033 17-Mar-10 Cesium-137 -2.47 ± 3.66 3.98 1.99 NE NE U BD 088523-033 Cobalt-60 -1.49 ± 4.24 4.44 2.22 NE NE U BD 088523-033 Potassium-40 6.62 ± 47.0 50.1 25.1 NE NE U BD 088523-033 TRE-1 Americium-241 3.05 ± 2.97 5.26 2.63 NE NE U BD 088505-033 09-Mar-10 Cesium-137 -2.4 ± 4.27 3.95 1.98 NE NE U BD 088505-033 Cobalt-60 1.07 ± 2.41 4.26 2.13 NE NE U BD 088505-033 Potassium-40 33.5 ± 41.8 50.0 25.0 NE NE U BD 088505-033 Refer to footnotes on page 2A-47.
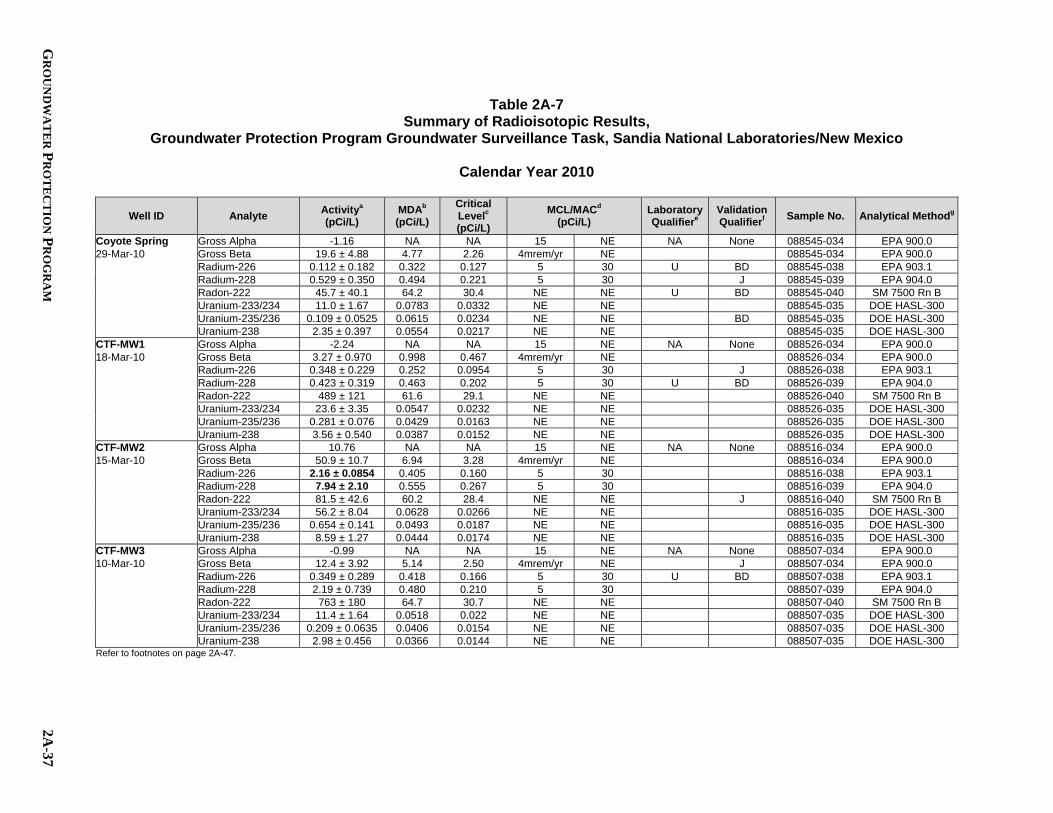
GR
OU
ND
WA
TE
R P
RO
TE
CT
ION
PR
OG
RA
M
2A-37
Table 2A-7 Summary of Radioisotopic Results,
Groundwater Protection Program Groundwater Surveillance Task, Sandia National Laboratories/New Mexico
Calendar Year 2010
Well ID Analyte Activitya (pCi/L)
MDAb (pCi/L)
Critical Levelc (pCi/L)
MCL/MACd (pCi/L)
Laboratory Qualifiere
Validation Qualifierf Sample No. Analytical Methodg
Coyote Spring Gross Alpha -1.16 NA NA 15 NE NA None 088545-034 EPA 900.0 29-Mar-10 Gross Beta 19.6 ± 4.88 4.77 2.26 4mrem/yr NE 088545-034 EPA 900.0 Radium-226 0.112 ± 0.182 0.322 0.127 5 30 U BD 088545-038 EPA 903.1 Radium-228 0.529 ± 0.350 0.494 0.221 5 30 J 088545-039 EPA 904.0 Radon-222 45.7 ± 40.1 64.2 30.4 NE NE U BD 088545-040 SM 7500 Rn B Uranium-233/234 11.0 ± 1.67 0.0783 0.0332 NE NE 088545-035 DOE HASL-300 Uranium-235/236 0.109 ± 0.0525 0.0615 0.0234 NE NE BD 088545-035 DOE HASL-300 Uranium-238 2.35 ± 0.397 0.0554 0.0217 NE NE 088545-035 DOE HASL-300 CTF-MW1 Gross Alpha -2.24 NA NA 15 NE NA None 088526-034 EPA 900.0 18-Mar-10 Gross Beta 3.27 ± 0.970 0.998 0.467 4mrem/yr NE 088526-034 EPA 900.0 Radium-226 0.348 ± 0.229 0.252 0.0954 5 30 J 088526-038 EPA 903.1 Radium-228 0.423 ± 0.319 0.463 0.202 5 30 U BD 088526-039 EPA 904.0 Radon-222 489 ± 121 61.6 29.1 NE NE 088526-040 SM 7500 Rn B Uranium-233/234 23.6 ± 3.35 0.0547 0.0232 NE NE 088526-035 DOE HASL-300 Uranium-235/236 0.281 ± 0.076 0.0429 0.0163 NE NE 088526-035 DOE HASL-300 Uranium-238 3.56 ± 0.540 0.0387 0.0152 NE NE 088526-035 DOE HASL-300 CTF-MW2 Gross Alpha 10.76 NA NA 15 NE NA None 088516-034 EPA 900.0 15-Mar-10 Gross Beta 50.9 ± 10.7 6.94 3.28 4mrem/yr NE 088516-034 EPA 900.0 Radium-226 2.16 ± 0.0854 0.405 0.160 5 30 088516-038 EPA 903.1 Radium-228 7.94 ± 2.10 0.555 0.267 5 30 088516-039 EPA 904.0 Radon-222 81.5 ± 42.6 60.2 28.4 NE NE J 088516-040 SM 7500 Rn B Uranium-233/234 56.2 ± 8.04 0.0628 0.0266 NE NE 088516-035 DOE HASL-300 Uranium-235/236 0.654 ± 0.141 0.0493 0.0187 NE NE 088516-035 DOE HASL-300 Uranium-238 8.59 ± 1.27 0.0444 0.0174 NE NE 088516-035 DOE HASL-300 CTF-MW3 Gross Alpha -0.99 NA NA 15 NE NA None 088507-034 EPA 900.0 10-Mar-10 Gross Beta 12.4 ± 3.92 5.14 2.50 4mrem/yr NE J 088507-034 EPA 900.0 Radium-226 0.349 ± 0.289 0.418 0.166 5 30 U BD 088507-038 EPA 903.1 Radium-228 2.19 ± 0.739 0.480 0.210 5 30 088507-039 EPA 904.0 Radon-222 763 ± 180 64.7 30.7 NE NE 088507-040 SM 7500 Rn B Uranium-233/234 11.4 ± 1.64 0.0518 0.022 NE NE 088507-035 DOE HASL-300 Uranium-235/236 0.209 ± 0.0635 0.0406 0.0154 NE NE 088507-035 DOE HASL-300 Uranium-238 2.98 ± 0.456 0.0366 0.0144 NE NE 088507-035 DOE HASL-300 Refer to footnotes on page 2A-47.

2A-38
AN
NU
AL
GR
OU
ND
WA
TE
R M
ON
ITO
RIN
G R
EP
OR
T, CA
LE
ND
AR
YE
AR
2010
Table 2A-7 (Continued) Summary of Radioisotopic Results,
Groundwater Protection Program Groundwater Surveillance Task, Sandia National Laboratories/New Mexico
Calendar Year 2010
Well ID Analyte Activitya (pCi/L)
MDAb (pCi/L)
Critical Levelc (pCi/L)
MCL/MACd (pCi/L)
Laboratory Qualifiere
Validation Qualifierf Sample No. Analytical Methodg
Eubank-1 Gross Alpha 2.22 NA NA 15 NE NA None 088501-034 EPA 900.0 05-Mar-10 Gross Beta 3.77 ± 1.23 1.65 0.804 4mrem/yr NE J 088501-034 EPA 900.0 Radium-226 0.994 ± 0.540 0.618 0.252 5 30 J 088501-038 EPA 903.1 Radium-228 0.472 ± 0.327 0.464 0.205 5 30 J 088501-039 EPA 904.0 Greystone-MW2 Gross Alpha -2.83 NA NA 15 NE NA None 088531-034 EPA 900.0 22-Mar-10 Gross Beta 4.09 ± 1.41 1.81 0.862 4mrem/yr NE J 088531-034 EPA 900.0 Radium-226 0.479 ± 0.259 0.241 0.0829 5 30 J 088531-038 EPA 903.1 Radium-228 0.344 ± 0.290 0.439 0.193 5 30 U BD 088531-039 EPA 904.0 Radon-222 2100 ± 468 64.0 30.4 NE NE 088531-040 SM 7500 Rn B Uranium-233/234 10.1 ± 1.46 0.054 0.0229 NE NE 088531-035 DOE HASL-300 Uranium-235/236 0.184 ± 0.0585 0.0424 0.0161 NE NE 088531-035 DOE HASL-300 Uranium-238 2.33 ± 0.366 0.0382 0.015 NE NE 088531-035 DOE HASL-300 MRN-2 Gross Alpha 2.84 NA NA 15 NE NA None 088535-034 EPA 900.0 24-Mar-10 Gross Beta 2.83 ± 0.838 0.998 0.479 4mrem/yr NE J 088535-034 EPA 900.0 Radium-226 0.0982 ± 0.215 0.403 0.152 5 30 U BD 088535-038 EPA 903.1 Radium-228 0.404 ± 0.316 0.469 0.207 5 30 U BD 088535-039 EPA 904.0 MRN-3D Gross Alpha -0.10 NA NA 15 NE NA None 088538-034 EPA 900.0 25-Mar-10 Gross Beta 4.51 ± 1.09 0.996 0.471 15 NE 088538-034 EPA 900.0 Radium-226 0.445 ± 0.251 0.237 0.0814 5 30 J 088538-038 EPA 903.1 Radium-228 0.472 ± 0.318 0.453 0.204 5 30 J 088538-039 EPA 904.0 NWTA3-MW3D Gross Alpha 2.12 NA NA 15 NE NA None 088542-034 EPA 900.0 26-Mar-10 Gross Beta 2.98 ± 0.895 0.996 0.467 15 NE J 088542-034 EPA 900.0 Radium-226 0.0861 ± 0.181 0.330 0.133 5 30 U BD 088542-038 EPA 903.1 Radium-228 0.192 ± 0.285 0.484 0.215 5 30 U BD 088542-039 EPA 904.0 NWTA3-MW3D (Duplicate) Gross Alpha 0.91 NA NA 15 NE NA None 088543-034 EPA 900.0
26-Mar-10 Gross Beta 2.81 ± 0.898 0.990 0.457 15 NE J 088543-034 EPA 900.0 Radium-226 0.145 ± 0.167 0.267 0.0972 5 30 U BD 088543-038 EPA 903.1 Radium-228 0.477 ± 0.341 0.498 0.225 5 30 U BD 088543-039 EPA 904.0 PL-2 Gross Alpha 2.53 NA NA 15 NE NA None 088514-034 EPA 900.0 12-Mar-10 Gross Beta 2.45 ± 0.866 0.982 0.445 15 NE J 088514-034 EPA 900.0 Radium-226 0.115 ± 0.189 0.333 0.132 5 30 U BD 088514-038 EPA 903.1 Radium-228 0.492 ± 0.318 0.419 0.177 5 30 J 088514-039 EPA 904.0 Refer to footnotes on page 2A-47.

GR
OU
ND
WA
TE
R P
RO
TE
CT
ION
PR
OG
RA
M
2A-39
Table 2A-7 (Continued) Summary of Radioisotopic Results,
Groundwater Protection Program Groundwater Surveillance Task, Sandia National Laboratories/New Mexico
Calendar Year 2010
Well ID Analyte Activitya (pCi/L)
MDAb (pCi/L)
Critical Levelc (pCi/L)
MCL/MACd (pCi/L)
Laboratory Qualifiere
Validation Qualifierf Sample No. Analytical Methodg
PL-4 Gross Alpha 3.67 NA NA 15 NE NA None 088511-034 EPA 900.0 11-Mar-10 Gross Beta 7.39 ± 1.71 1.74 0.849 15 NE 088511-034 EPA 900.0 Radium-226 0.245 ± 0.260 0.411 0.160 5 30 U BD 088511-038 EPA 903.1 Radium-228 0.609 ± 0.359 0.496 0.228 5 30 NJ+ 088511-039 EPA 904.0 PL-4 (Duplicate) Gross Alpha 3.07 NA NA 15 NE NA None 088512-034 EPA 900.0 11-Mar-10 Gross Beta 6.92 ± 1.67 1.80 0.880 15 NE 088512-034 EPA 900.0 Radium-226 0.496 ± 0.335 0.366 0.133 5 30 J 088512-038 EPA 903.1 Radium-228 0.746 ± 0.388 0.470 0.207 5 30 NJ+ 088512-039 EPA 904.0 SFR-2S Gross Alpha -1.29 NA NA 15 NE NA None 088503-034 EPA 900.0 08-Mar-10 Gross Beta 10.0 ± 2.99 3.68 1.79 4mrem/yr NE J 088503-034 EPA 900.0 Radium-226 0.626 ± 0.408 0.504 0.203 5 30 J 088503-038 EPA 903.1 Radium-228 0.424 ± 0.319 0.474 0.215 5 30 U BD 088503-039 EPA 904.0 Radon-222 292 ± 81.8 64.8 30.7 NE NE J 088503-040 SM 7500 Rn B Uranium-233/234 20.2 ± 2.90 0.0571 0.0242 NE NE 088503-035 DOE HASL-300 Uranium-235/236 0.337 ± 0.086 0.0448 0.017 NE NE 088503-035 DOE HASL-300 Uranium-238 5.35 ± 0.798 0.0403 0.0158 NE NE 088503-035 DOE HASL-300 SFR-4T Gross Alpha -1.46 NA NA 15 NE NA None 088533-034 EPA 900.0 23-Mar-10 Gross Beta 0.732 ± 3.32 5.78 2.74 4mrem/yr NE U BD 088533-034 EPA 900.0 Radium-226 0.0262 ± 0.171 0.351 0.136 5 30 U BD 088533-038 EPA 903.1 Radium-228 0.356 ± 0.312 0.482 0.215 5 30 U BD 088533-039 EPA 904.0 Radon-222 -41.6 ± 35.2 66.4 31.6 NE NE U BD 088533-040 SM 7500 Rn B Uranium-233/234 0.512 ± 0.110 0.0611 0.0259 NE NE 088533-035 DOE HASL-300 Uranium-235/236 0.017 ± 0.0168 0.048 0.0182 NE NE U BD 088533-035 DOE HASL-300 Uranium-238 0.110 ± 0.0412 0.0432 0.0169 NE NE J 088533-035 DOE HASL-300 SWTA3-MW2 Gross Alpha 1.68 NA NA 15 NE NA None 088528-034 EPA 900.0 19-Mar-10 Gross Beta 3.88 ± 0.992 0.993 0.472 4mrem/yr NE 088528-034 EPA 900.0 Radium-226 0.464 ± 0.302 0.395 0.159 5 30 J 088528-038 EPA 903.1 Radium-228 0.288 ± 0.292 0.468 0.212 5 30 U BD 088528-039 EPA 904.0 SWTA3-MW3 Gross Alpha 2.43 NA NA 15 NE NA None 088520-034 EPA 900.0 16-Mar-10 Gross Beta 4.06 ± 1.08 0.996 0.458 4mrem/yr NE 088520-034 EPA 900.0 Radium-226 0.0458 ± 0.191 0.370 0.151 5 30 U BD 088520-038 EPA 903.1 Radium-228 0.186 ± 0.249 0.419 0.179 5 30 U BD 088520-039 EPA 904.0 Refer to footnotes on page 2A-47.
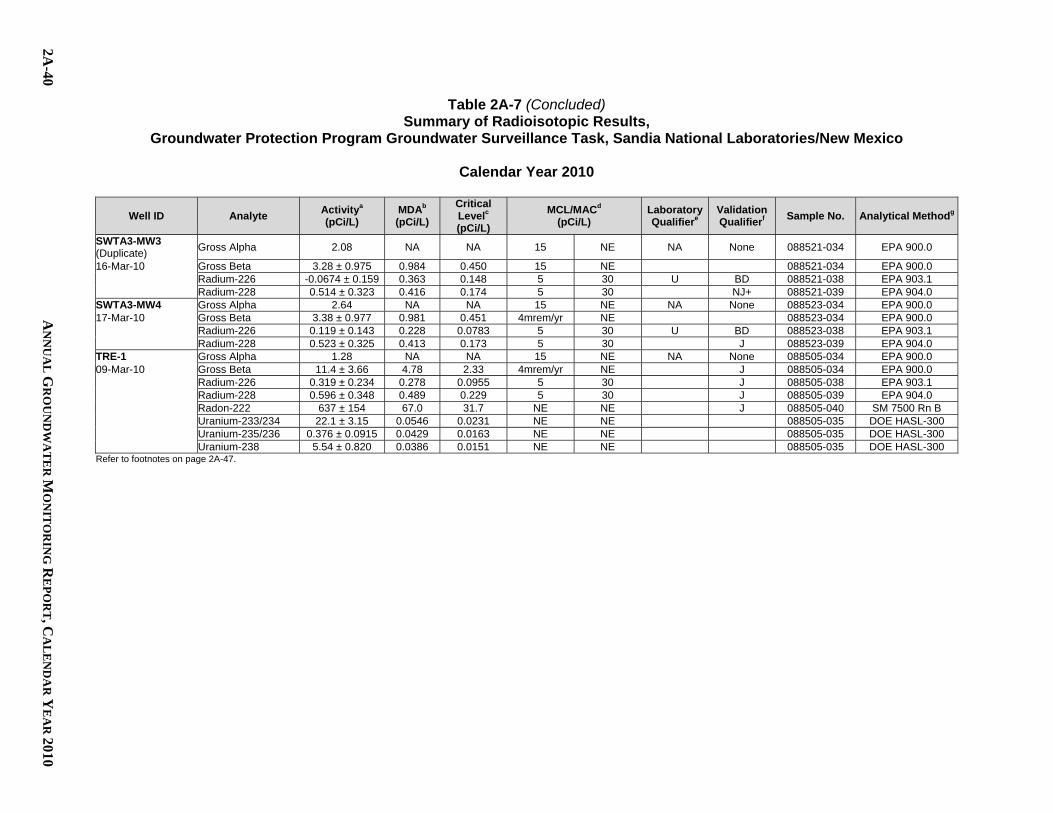
2A-40
AN
NU
AL
GR
OU
ND
WA
TE
R M
ON
ITO
RIN
G R
EP
OR
T, CA
LE
ND
AR
YE
AR
2010
Table 2A-7 (Concluded) Summary of Radioisotopic Results,
Groundwater Protection Program Groundwater Surveillance Task, Sandia National Laboratories/New Mexico
Calendar Year 2010
Well ID Analyte Activitya (pCi/L)
MDAb (pCi/L)
Critical Levelc (pCi/L)
MCL/MACd (pCi/L)
Laboratory Qualifiere
Validation Qualifierf Sample No. Analytical Methodg
SWTA3-MW3 (Duplicate) Gross Alpha 2.08 NA NA 15 NE NA None 088521-034 EPA 900.0
16-Mar-10 Gross Beta 3.28 ± 0.975 0.984 0.450 15 NE 088521-034 EPA 900.0 Radium-226 -0.0674 ± 0.159 0.363 0.148 5 30 U BD 088521-038 EPA 903.1 Radium-228 0.514 ± 0.323 0.416 0.174 5 30 NJ+ 088521-039 EPA 904.0 SWTA3-MW4 Gross Alpha 2.64 NA NA 15 NE NA None 088523-034 EPA 900.0 17-Mar-10 Gross Beta 3.38 ± 0.977 0.981 0.451 4mrem/yr NE 088523-034 EPA 900.0 Radium-226 0.119 ± 0.143 0.228 0.0783 5 30 U BD 088523-038 EPA 903.1 Radium-228 0.523 ± 0.325 0.413 0.173 5 30 J 088523-039 EPA 904.0 TRE-1 Gross Alpha 1.28 NA NA 15 NE NA None 088505-034 EPA 900.0 09-Mar-10 Gross Beta 11.4 ± 3.66 4.78 2.33 4mrem/yr NE J 088505-034 EPA 900.0 Radium-226 0.319 ± 0.234 0.278 0.0955 5 30 J 088505-038 EPA 903.1 Radium-228 0.596 ± 0.348 0.489 0.229 5 30 J 088505-039 EPA 904.0 Radon-222 637 ± 154 67.0 31.7 NE NE J 088505-040 SM 7500 Rn B Uranium-233/234 22.1 ± 3.15 0.0546 0.0231 NE NE 088505-035 DOE HASL-300 Uranium-235/236 0.376 ± 0.0915 0.0429 0.0163 NE NE 088505-035 DOE HASL-300 Uranium-238 5.54 ± 0.820 0.0386 0.0151 NE NE 088505-035 DOE HASL-300 Refer to footnotes on page 2A-47.

GR
OU
ND
WA
TE
R P
RO
TE
CT
ION
PR
OG
RA
M
2A-41
Table 2A-8 Summary of Field Water Quality Measurementsh,
Groundwater Protection Program Groundwater Surveillance Task, Sandia National Laboratories/ New Mexico
Calendar Year 2010
Well ID Sample Date Sampling Type
Initial Depth to
water (fbtoc)
Sampling Depth (fbtoc)
Purge Volume
(gal) Temperature
(0C)
Specific Conductivity (mho/cm)
Oxidation Reduction Potential
(mV) pH Turbidity
(NTU) Dissolved Oxygen (%Sat)
Alkalinity (mg/L CaCO3
at 4.5 pH)
Coyote Spring 29-Mar-10 n/a n/a n/a n/a 12.09 3175 243.7 5.95 1.09 20.0 1200 CTF-MW1 18-Mar-10 Bennett Pump 237.13 260 25 16.83 678 259.9 7.25 0.26 73.6 180 CTF-MW2 15-Mar-10 Bennett Pump 43.73 130 37 14.59 3601 99.8 6.01 1.09 0.7 1150 CTF-MW3 10-Mar-10 Bennett Pump 305.71 360 51 16.35 1711 246.8 6.84 0.42 74.5 270 Eubank-1 05-Mar-10 Bennett Pump 552.00 605 72 18.05 492 203.9 7.33 0.58 84.5 150 Greystone-MW2 22-Mar-10 Bennett Pump 51.86 80 37 15.36 1166 260.4 6.92 0.34 70.4 370 MRN-2 24-Mar-10 Bennett Pump 435.15 441 18 16.87 440 257.2 7.46 0.63 72.9 120 MRN-3D 25-Mar-10 Bennett Pump 435.79 680 41 19.10 472 128.2 7.42 2.64 43.7 130 NWTA3-MW3D 26-Mar-10 Bennett Pump 467.46 673 41 18.75 379 208.9 7.57 1.70 48.0 125 PL-2 12-Mar-10 Bennett Pump 469.84 597 41 17.97 450 242.1 7.63 0.51 64.6 130 PL-4 11-Mar-10 Bennett Pump 468.48 492 49 16.46 482 80.4 7.33 2.99 60.4 110 SFR-2S 08-Mar-10 Bennett Pump 99.57 118 28 13.16 1131 157.8 6.75 25.6 78.8 275 SFR-4T 23-Mar-10 Bennett Pump 147.77 359 48 15.37 4274 165.7 7.92 0.38 11.0 100 SWTA3-MW2 19-Mar-10 Bennett Pump 449.88 474 40 18.4 440 220.1 7.50 3.70 48.0 160 SWTA3-MW3 16-Mar-10 Bennett Pump 447.73 639 37 19.21 451 228.8 7.50 1.05 49.3 140 SWTA3-MW4 17-Mar-10 Bennett Pump 448.28 457 37 19.07 458 233.5 7.53 0.44 47.7 155 TRE-1 09-Mar-10 Bennett Pump 175.80 294 76 16.46 1345 255.7 6.59 0.27 72.1 350 Refer to footnotes on page 2A-47.

2A-42
AN
NU
AL
GR
OU
ND
WA
TE
R M
ON
ITO
RIN
G R
EP
OR
T, CA
LE
ND
AR
YE
AR
2010
Table 2A-9 Calendar Year 2010 Groundwater Levels
Groundwater Protection Program Groundwater Surveillance Task, Sandia National Laboratories/ New Mexico
Calendar Year 2010
Well Name Measurement Point* Jan Feb Mar Apr May Jun Jul Aug Sep Oct Nov Dec
AVN-1 5440.27 520.99 521.21 521.40 521.57 CTF-MW1 6079.96 236.95 237.07 237.20 237.37 CTF-MW2 5575.93 43.76 43.72 43.73 43.75 CTF-MW3 5520.15 305.94 305.95 306.14 306.36 CWL-BW3 5430.23 504.20 504.25 504.69 505.21 CWL-BW4A 5431.36 504.84 504.92 CWL-BW5 5432.12 508.11 508.63 CWL-MW10 5421.91 497.67 498.03 CWL-MW11 5420.57 496.91 497.47 CWL-MW2BL 5419.39 498.59 498.72 498.92 499.42 CWL-MW2BU 5419.42 494.04 CWL-MW4 5420.33 497.31 497.4 CWL-MW5L 5415.80 495.46 495.53 CWL-MW5U 5416.01 490.23 490.37 CWL-MW6L 5417.13 497.24 497.36 CWL-MW6U 5416.78 490.60 490.68 CWL-MW7 5419.51 512.31 512.45 512.67 513.13 CWL-MW8 5419.26 511.90 512.04 512.27 512.71 CWL-MW9 5423.45 500.78 501.26 CYN-MW10 6342.78 121.08 CYN-MW11 6371.74 96.66 CYN-MW12 6342.49 205.78 CYN-MW1D 6239.69 324.69 324.87 325.08 325.31 CYN-MW3 6313.26 125.93 126.79 127.17 127.5 CYN-MW4 6455.91 218.03 218.79 219.58 220.29 CYN-MW5 5981.56 107.00 106.87 107.19 107.24 CYN-MW6 6343.37 147.49 148.41 148.76 149.33
Refer to footnote at end of table.
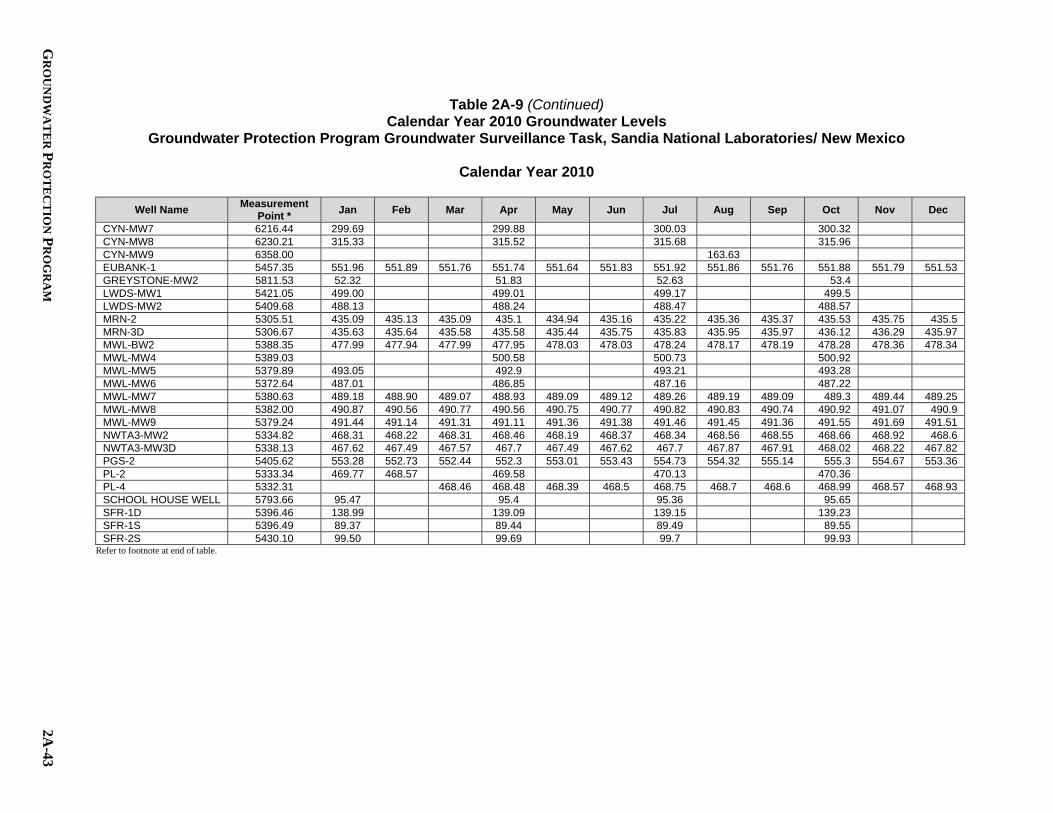
GR
OU
ND
WA
TE
R P
RO
TE
CT
ION
PR
OG
RA
M
2A-43
Table 2A-9 (Continued) Calendar Year 2010 Groundwater Levels
Groundwater Protection Program Groundwater Surveillance Task, Sandia National Laboratories/ New Mexico
Calendar Year 2010
Well Name Measurement Point * Jan Feb Mar Apr May Jun Jul Aug Sep Oct Nov Dec
CYN-MW7 6216.44 299.69 299.88 300.03 300.32 CYN-MW8 6230.21 315.33 315.52 315.68 315.96 CYN-MW9 6358.00 163.63 EUBANK-1 5457.35 551.96 551.89 551.76 551.74 551.64 551.83 551.92 551.86 551.76 551.88 551.79 551.53 GREYSTONE-MW2 5811.53 52.32 51.83 52.63 53.4 LWDS-MW1 5421.05 499.00 499.01 499.17 499.5 LWDS-MW2 5409.68 488.13 488.24 488.47 488.57 MRN-2 5305.51 435.09 435.13 435.09 435.1 434.94 435.16 435.22 435.36 435.37 435.53 435.75 435.5 MRN-3D 5306.67 435.63 435.64 435.58 435.58 435.44 435.75 435.83 435.95 435.97 436.12 436.29 435.97 MWL-BW2 5388.35 477.99 477.94 477.99 477.95 478.03 478.03 478.24 478.17 478.19 478.28 478.36 478.34 MWL-MW4 5389.03 500.58 500.73 500.92 MWL-MW5 5379.89 493.05 492.9 493.21 493.28 MWL-MW6 5372.64 487.01 486.85 487.16 487.22 MWL-MW7 5380.63 489.18 488.90 489.07 488.93 489.09 489.12 489.26 489.19 489.09 489.3 489.44 489.25 MWL-MW8 5382.00 490.87 490.56 490.77 490.56 490.75 490.77 490.82 490.83 490.74 490.92 491.07 490.9 MWL-MW9 5379.24 491.44 491.14 491.31 491.11 491.36 491.38 491.46 491.45 491.36 491.55 491.69 491.51 NWTA3-MW2 5334.82 468.31 468.22 468.31 468.46 468.19 468.37 468.34 468.56 468.55 468.66 468.92 468.6 NWTA3-MW3D 5338.13 467.62 467.49 467.57 467.7 467.49 467.62 467.7 467.87 467.91 468.02 468.22 467.82 PGS-2 5405.62 553.28 552.73 552.44 552.3 553.01 553.43 554.73 554.32 555.14 555.3 554.67 553.36 PL-2 5333.34 469.77 468.57 469.58 470.13 470.36 PL-4 5332.31 468.46 468.48 468.39 468.5 468.75 468.7 468.6 468.99 468.57 468.93 SCHOOL HOUSE WELL 5793.66 95.47 95.4 95.36 95.65 SFR-1D 5396.46 138.99 139.09 139.15 139.23 SFR-1S 5396.49 89.37 89.44 89.49 89.55 SFR-2S 5430.10 99.50 99.69 99.7 99.93
Refer to footnote at end of table.

2A-44
AN
NU
AL
GR
OU
ND
WA
TE
R M
ON
ITO
RIN
G R
EP
OR
T, CA
LE
ND
AR
YE
AR
2010
Table 2A-9 (Continued) Calendar Year 2010 Groundwater Levels
Groundwater Protection Program Groundwater Surveillance Task, Sandia National Laboratories/ New Mexico
Calendar Year 2010
Well Name Measurement Point * Jan Feb Mar Apr May Jun Jul Aug Sep Oct Nov Dec
SFR-3D 5495.27 160.74 160.74 160.75 160.87 SFR-3P 5496.96 160.65 160.85 160.84 161.07 SFR-3S 5495.57 159.86 159.84 159.84 160.03 SFR-3T 5495.99 69.97 70.29 70.06 70.03 SFR-4P 5570.66 151.67 153.93 153.54 152.56 SFR-4T 5571.28 148.28 169.9 152.09 149.83 SWTA3-MW2 5322.93 449.93 449.99 450.05 450.23 449.94 450.1 450.15 450.32 450.33 450.42 450.65 450.35 SWTA3-MW3 5321.27 447.13 447.18 447.22 447.39 447.16 447.32 447.37 447.55 447.6 447.68 447.87 447.57 SWTA3-MW4 5322.14 447.67 447.73 447.77 447.94 447.67 447.85 447.88 448.07 448.1 448.2 448.4 448.11 TA1-W-01 5401.15 544.73 544.35 544.41 544.24 543.9 544.19 544.31 544.54 544.72 544.98 544.63 544.51 TA1-W-02 5413.95 525.85 525.13 525.35 525.55 TA1-W-03 5454.36 345.29 346.6 346.94 347.23 TA1-W-04 5458.31 572.96 572.66 572.46 572.17 571.86 571.94 572.06 572.19 572.23 572.29 572.39 571.92 TA1-W-05 5431.17 572.32 571.60 571.37 571.04 572.49 573.4 575.26 574.62 575.95 576 574.76 572.72 TA1-W-06 5414.43 305.44 305.51 305.62 305.87 TA1-W-07 5402.25 285.01 285.05 285.24 285.27 285.08 285.26 285.22 285.34 285.33 285.48 285.27 285.41 TA1-W-08 5431.52 308.42 308.48 308.73 308.77 TA2-NW1-325 5419.27 315.84 315.93 316.04 316.17 TA2-NW1-595 5418.59 525.04 525.01 525.37 525.61 TA2-SW1-320 5409.18 315.63 316.25 316.39 316.52 TA2-W-01 5417.32 324.58 325.23 325.34 TA2-W-19 5348.54 269.56 269.43 269.56 269.78 269.67 269.79 269.9 269.88 269.88 269.9 270.08 269.96 TA2-W-24 5360.99 444.72 444.49 444.66 444.45 TA2-W-25 5372.19 472.31 472.00 472.09 471.8 471.74 471.95 472.2 472.09 472.05 472.16 472.16 471.76 TA2-W-26 5373.10 283.65 283.64 284.03 284.16 TA2-W-27 5360.18 277.14 277.55 277.8 277.83
Refer to footnote at end of table.

GR
OU
ND
WA
TE
R P
RO
TE
CT
ION
PR
OG
RA
M
2A-45
Table 2A-9 (Concluded) Calendar Year 2010 Groundwater Levels
Groundwater Protection Program Groundwater Surveillance Task, Sandia National Laboratories/ New Mexico
Calendar Year 2010
Well Name Measurement Point * Jan Feb Mar Apr May Jun Jul Aug Sep Oct Nov Dec
TAV-MW10 5434.30 512.71 512.61 512.7 512.77 512.92 512.87 512.9 513.1 513.05 513.23 513.11 513.26 TAV-MW2 5424.60 502.82 502.89 503.19 503.43 TAV-MW3 5461.53 541.63 541.63 542.05 542.25 TAV-MW4 5425.16 503.33 503.48 503.71 503.86 TAV-MW5 5405.98 484.87 484.96 485.2 485.24 TAV-MW6 5428.44 506.85 506.93 507.08 507.4 TAV-MW7 5427.67 509.52 509.61 509.76 510.1 TAV-MW8 5414.27 491.99 492.05 492.19 492.53 TAV-MW9 5413.54 495.72 495.79 495.96 496.21 TJA-2 5350.53 274.85 275.45 275.57 275.59 TJA-3 5387.89 498.48 498.95 499.05 499.03 TJA-4 5338.49 303.30 303.05 303.03 302.83 TJA-5 5338.66 268.81 268.93 269.07 268.97 TJA-6 5340.49 451.02 450.99 451.06 451.13 450.96 451.09 451.2 451.15 451.08 451.09 451.24 451.08 TJA-7 5388.60 302.17 302.26 302.46 302.47 TRE-1 5494.58 175.83 175.94 176.05 176.17 TRN-1 5732.95 91.74 91.86 91.89 92.01 TRS-1D 5777.13 126.52 126.7 127.1 126.69 TRS-1S 5777.40 134.00 134.11 134.22 134.23 TRS-2 5778.09 134.59 134.66 134.79 134.8 WYO-3 5389.42 532.19 531.99 531.93 531.71 531.5 531.58 531.78 531.89 532.1 532.23 532.32 532.09 WYO-4 5389.90 289.49 289.38 289.85 290.14
* Measurement point was mathematically converted to NAD27 using National Geodetic Survey approved software.
2A-46 ANNUAL GROUNDWATER MONITORING REPORT, CALENDAR YEAR 2010
This page intentionally left blank.

GROUNDWATER PROTECTION PROGRAM 2A-47
Footnotes for Groundwater Protection Program Groundwater Surveillance Task Tables
aResult and/or Activity - Values in bold exceed the established MCL and/or MAC. - ND = not detected (at method detection limit). - Activities of zero or less are considered to be not detected. - Gross alpha activity measurements were corrected by subtracting out the total uranium activity (40 CFR Parts 9,
141, and 142, Table 1-4) - g/L = micrograms per liter - mg/L = milligrams per liter - pCi/L = picocuries per liter
bMDL or MDA Method detection limit. The minimum concentration or activity that can be measured and reported with 99% confidence that the analyte is greater than zero; analyte is matrix specific. The minimal detectable activity or minimum measured activity in a sample required to ensure a 95% probability that the measured activity is accurately quantified above the critical level NA = not applicable for gross alpha activities. The MDA could not be calculated as the gross alpha activity was corrected by subtracting out the total uranium activity.
cPQL or Critical Level Practical quantitation limit. The lowest concentration of analytes in a sample that can be reliably determined within specified limits of precision and accuracy by that indicated method under routine laboratory operating conditions. The minimum activity that can be measured and reported with 99% confidence that the analyte is greater than zero; analyte is matrix specific NA = not applicable for gross alpha activities. The critical level could not be calculated as the gross alpha activity was corrected by subtracting out the total uranium activity.
dMCL/MAC - Maximum contaminant level. Established by the U.S. Environmental Protection Agency Primary Water
Regulations (40 CFR 141.11, Supbart B), National Primary Drinking Water Standards, EPA, May 2009. - Maximum Allowable Concentration in groundwater for the contaminants specified in 20 NMAC 6.2, Sec 3103,
Human Health Standards. - NE = not established. - 15 pCi/L = Gross alpha particle activity, excluding total uranium (40 CFR Parts 9, 141, and 142, Table 1-4). - 4 mrem/yr = any combination of beta and/or gamma emitting radionuclides (as dose rate). - 5 pCi/L = combined radium-226 and radium-228 activities. - 30 pCi/L = combined radium-226 and radium-228 activities.
eLaboratory Qualifier B = Analyte is detected in associated laboratory method blank. H = Analytical holding time was exceeded. J = Amount detected is below the practical quantitation limit (PQL). NA = Not applicable for gross alpha activities. U = Analyte is absent or below the method detection limit.
fValidation Qualifier If cell is blank, then all quality control samples meet acceptance criteria with respect to submitted samples. BD = Below detection limit as used in radiochemistry to identify results that are not statistically different from zero. J = The associate value is an estimated quantity. J+ = The associated numerical value is an estimated quantity with suspected positive bias.

2A-48 ANNUAL GROUNDWATER MONITORING REPORT, CALENDAR YEAR 2010
Footnotes for Groundwater Protection Program Groundwater Surveillance Task Tables (Concluded)
fValidation Qualifier (continued) None = No data validation for corrected gross alpha activity. NJ+ = Presumptive evidence of the presence of the material at an estimated quantity with a suspected positive bias. NJ- = Presumptive evidence of the presence of the material at an estimated quantity with a suspected negative bias. U = The analyte was analyzed for but was not detected. The associated numerical value is the sample quantitation limit. UJ = The analyte was analyzed for but was not detected. The associated value is an estimate and may be inaccurate or imprecise.
gAnalytical Method
- EPA, 1979, Methods for Chemical Analysis of Water and Wastes, EPA-600/4-79-020, U.S. Environmental Protection Agency, Cincinnati, Ohio..
- EPA, 1980, Prescribed Procedures for Measurement of Radioactivity in Drinking Water, EPA-600/4-80-032, U.S. Environmental Protection Agency, Cincinnati, Ohio
- EPA, 2008, Test Methods for Evaluating Solid Waste, Physical/Chemical Methods,” SW-846, Update IV of 3rd ed., U.S. Environmental Protection Agency, Washington, D.C.
- U.S. Environmental Protection Agency, Washington, D.C.; or Clesceri, Greenburg, and Eaton, 1998, Standard Methods for the Examination of Water and Wastewater, 20th ed., Method 2320B.
- U.S. Department of Energy, Environmental Measurements Laboratory, 1990, EML Procedures Manual, 27th ed., Vol. 1, Rev. 1992, HASL-300.
- Beckman, 1988, Standard Methods for the Examination of Water and Wastewater, 7500-Rn B Method, 20th eEd.,LS5000TD Liquid Scintillation System Operation Manual, May.
hField Water Quality Measurements - Field measurements collected prior to sampling. °C = degrees Celsius. % Sat = percent saturation. fbtoc = feet below top of casing. gal = gallons. mho/cm = micromhos per centimeter. mg/L = milligrams per liter. mV = millivolts. NTU = nephelometric turbidity units. pH = potential of hydrogen (negative logarithm of the hydrogen ion concentration).

GROUNDWATER PROTECTION PROGRAM 2B-1
Attachment 2B Groundwater Protection Program
Monitoring Network Map and Plots

2B-2 ANNUAL GROUNDWATER MONITORING REPORT, CALENDAR YEAR 2010
This page intentionally left blank.
GROUNDWATER PROTECTION PROGRAM 2B-3
Attachment 2B Monitoring Network Map and Plots 2B-1 Groundwater Protection Program (GWPP) Water Quality Monitoring Network ......... 2B-5 2B-2 Fluoride Concentrations, Coyote Springs ..................................................................... 2B-6 2B-3 Fluoride Concentrations, CTF-MW2 ............................................................................ 2B-7 2B-4 Fluoride Concentrations, CTF-MW3 ............................................................................ 2B-8 2B-5 Fluoride Concentrations, SFR-4T ................................................................................. 2B-9 2B-6 Arsenic Concentrations, CTF-MW2 ........................................................................... 2B-10 2B-7 Beryllium Concentrations, Coyote Springs ................................................................ 2B-11 2B-8 Radium-226/228 Activities, CTF-MW2 ..................................................................... 2B-12

2B-4 ANNUAL GROUNDWATER MONITORING REPORT, CALENDAR YEAR 2010
This page intentionally left blank.
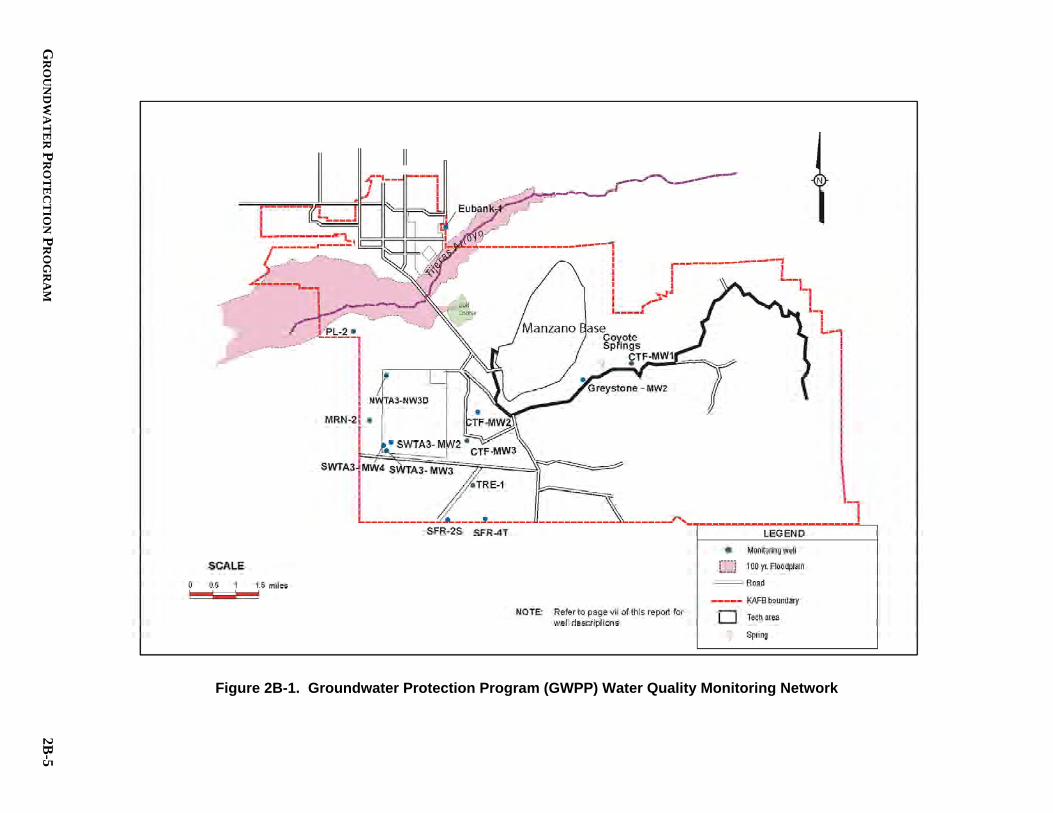
GR
OU
ND
WA
TE
R P
RO
TE
CT
ION
PR
OG
RA
M
2B-5
Figure 2B-1. Groundwater Protection Program (GWPP) Water Quality Monitoring Network

2B-6
AN
NU
AL
GR
OU
ND
WA
TE
R M
ON
ITO
RIN
G R
EP
OR
T, CA
LE
ND
AR
YE
AR
2010
Figure 2B-2. Fluoride Concentrations, Coyote Springs
0
0.5
1
1.5
2
2.5
3
3.5
4
4.5
Fluo
ride
(mg/
L)
Fluoride
MCL
MAC
MCL = 4.0 mg/L
MAC = 1.6 mg/L
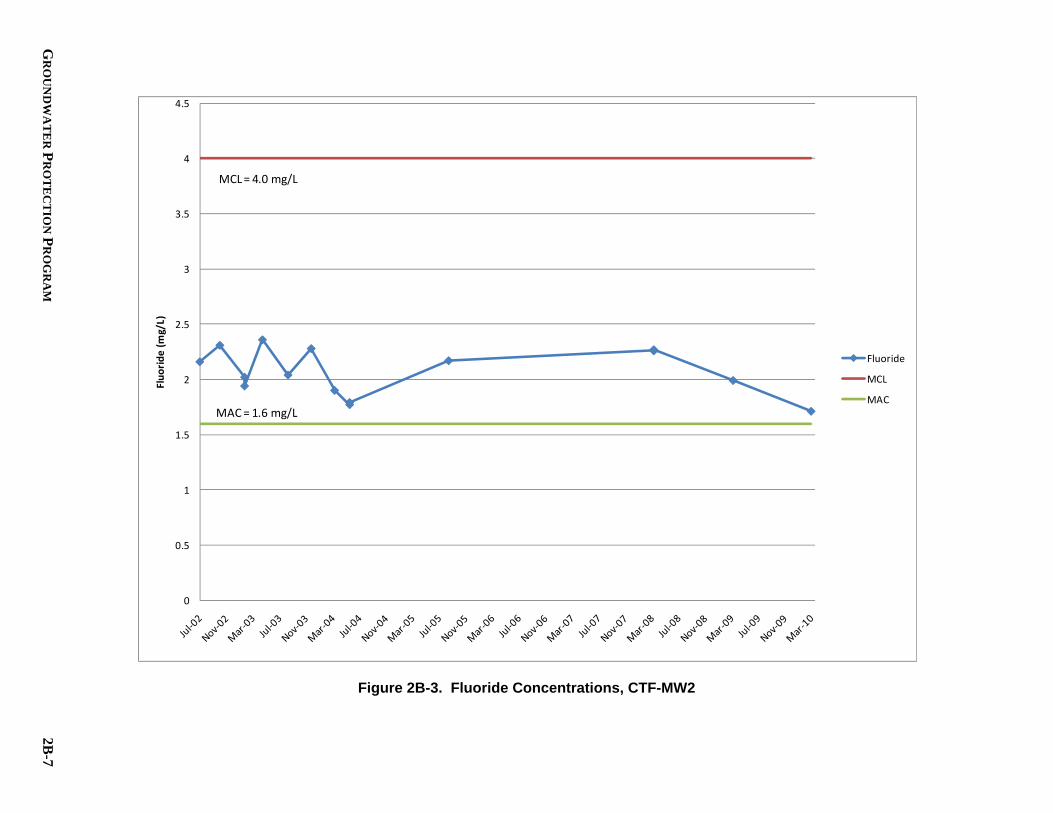
GR
OU
ND
WA
TE
R P
RO
TE
CT
ION
PR
OG
RA
M
2B-7
Figure 2B-3. Fluoride Concentrations, CTF-MW2
0
0.5
1
1.5
2
2.5
3
3.5
4
4.5
Fluo
ride
(mg/
L)
Fluoride
MCL
MAC
MCL = 4.0 mg/L
MAC = 1.6 mg/L

2B-8
AN
NU
AL
GR
OU
ND
WA
TE
R M
ON
ITO
RIN
G R
EP
OR
T, CA
LE
ND
AR
YE
AR
2010
Figure 2B-4. Fluoride Concentrations, CTF-MW3
0
0.5
1
1.5
2
2.5
3
3.5
4
4.5
Fluo
ride
(mg/
L)
Fluoride
MCL
MAC
MCL = 4.0 mg/L
MAC = 1.6 mg/L

GR
OU
ND
WA
TE
R P
RO
TE
CT
ION
PR
OG
RA
M
2B-9
Figure 2B-5. Fluoride Concentrations, SFR-4T
0
0.5
1
1.5
2
2.5
3
3.5
4
4.5
Fluo
ride
(mg/
L)
Fluoride
MCL
MAC
MCL = 4.0 mg/L
MAC = 1.6 mg/L
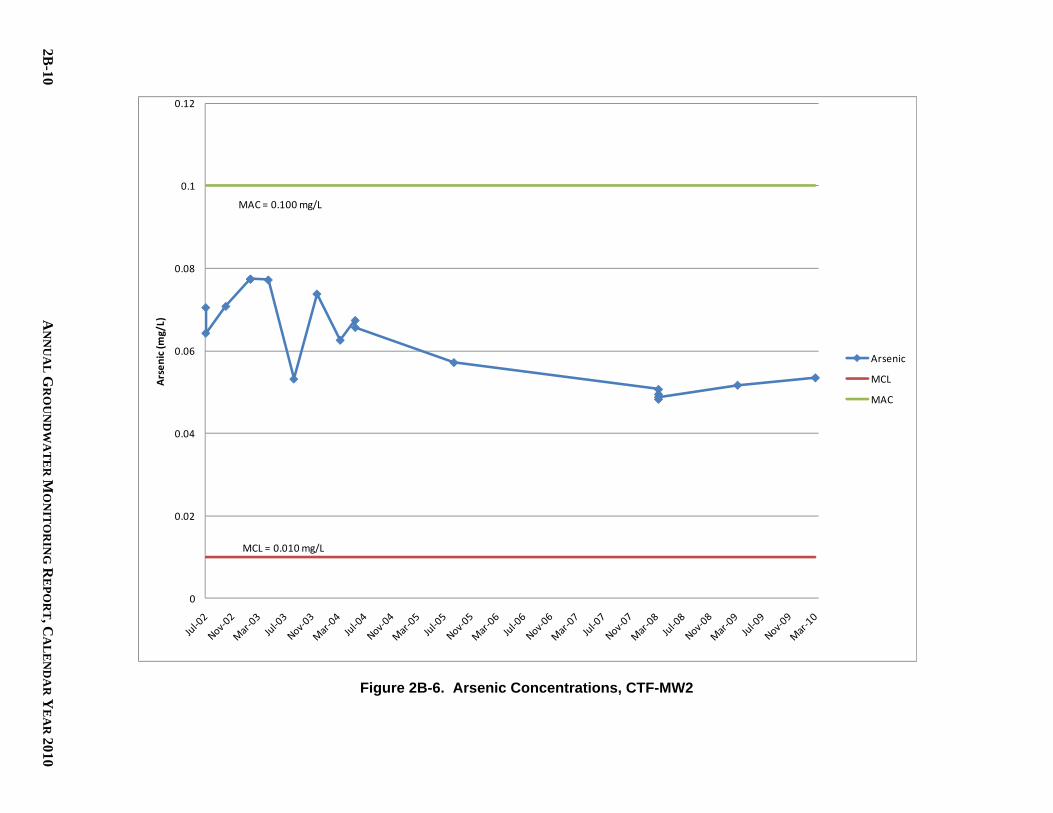
2B-10
AN
NU
AL
GR
OU
ND
WA
TE
R M
ON
ITO
RIN
G R
EP
OR
T, CA
LE
ND
AR
YE
AR
2010
Figure 2B-6. Arsenic Concentrations, CTF-MW2
0
0.02
0.04
0.06
0.08
0.1
0.12
Arse
nic (
mg/
L)
Arsenic
MCL
MAC
MAC = 0.100 mg/L
MCL = 0.010 mg/L

GR
OU
ND
WA
TE
R P
RO
TE
CT
ION
PR
OG
RA
M
2B-11
Figure 2B-7. Beryllium Concentrations, Coyote Springs
0
0.001
0.002
0.003
0.004
0.005
0.006
0.007
0.008
0.009
Bery
llium
(mg/
L)
Beryllium
MCLMCL = 0.004 mg/L

2B-12
AN
NU
AL
GR
OU
ND
WA
TE
R M
ON
ITO
RIN
G R
EP
OR
T, CA
LE
ND
AR
YE
AR
2010
Figure 2B-8. Radium-226/228 Activities, CTF-MW2
0
5
10
15
20
25
30
35
Com
bine
d Ra
dium
‐226
/228
(pCi
/L)
Radium‐226/228
MCL
MAC
MAC = 30 pCi/L
MCL = 5 pCi/L

GROUNDWATER PROTECTION PROGRAM 2C-1
Attachment 2C Groundwater Protection Program Charts, Maps, and Hydrographs

2C-2 ANNUAL GROUNDWATER MONITORING REPORT, CALENDAR YEAR 2010
This page intentionally left blank.

GROUNDWATER PROTECTION PROGRAM 2C-3
Attachment 2C Charts, Maps, and Hydrographs 2C-1 Precipitation Data for SNL/NM, CY10 ........................................................................ 2C-5 2C-2 Annual Precipitation Data for SNL/NM, January 2002 to December 2010 ................. 2C-6 2C-3 Monthly Groundwater Pumped by KAFB Water Supply Wells, CY10 ....................... 2C-7 2C-4 Groundwater Pumped by KAFB Water Supply Wells, CY10 ...................................... 2C-8 2C-5 Annual Groundwater Pumped by KAFB Water Supply Wells, 2001 to 2010 .............. 2C-9 2C-6 CY10 Regional Groundwater Water Table Elevations ............................................... 2C-10 2C-7 Regional Groundwater Table Elevation Difference, CY10–CY09 ............................ 2C-12 2C-8 Regional Water Table Hydrographs – Southeast Wells .............................................. 2C-13 2C-9 Regional Water Table Hydrographs – Northeast Wells .............................................. 2C-14 2C-10 Regional Water Table Hydrographs – West Wells ..................................................... 2C-15 2C-11 CY10 Perched Groundwater Zone Water Table Elevation ......................................... 2C-16 2C-12 Perched Groundwater Zone Water Table Elevation Difference, CY10-CY09 ........... 2C-18 2C-13 Perched Groundwater Water Table Hydrographs – Northwest Wells ........................ 2C-19 2C-14 Perched Groundwater Water Table Hydrographs – Southeast Wells ......................... 2C-20
Attachment 2C Tables 2C-1 Regional Groundwater Table Elevations, CY10......................................................... 2C-11 2C-2 Perched Groundwater System Water Table Elevations, CY10 ................................... 2C-17

2C-4 ANNUAL GROUNDWATER MONITORING REPORT, CALENDAR YEAR 2010
This page intentionally left blank.
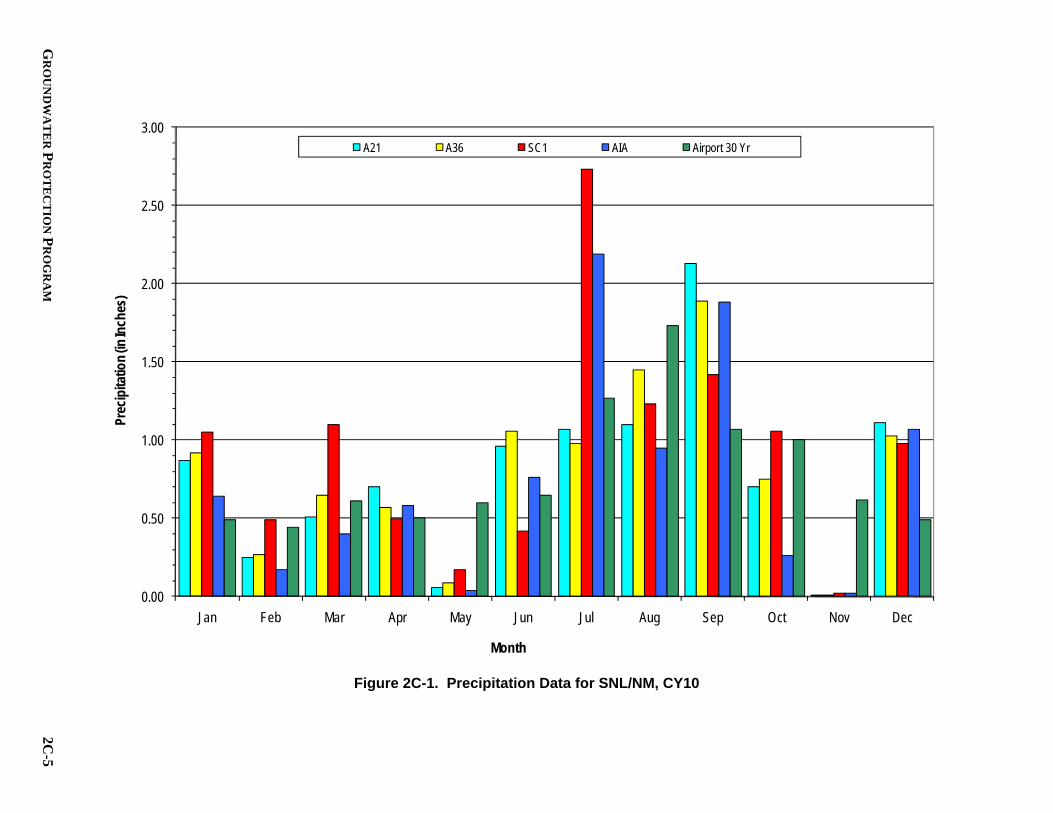
GR
OU
ND
WA
TE
R P
RO
TE
CT
ION
PR
OG
RA
M
2C-5
Figure 2C-1. Precipitation Data for SNL/NM, CY10
0.00
0.50
1.00
1.50
2.00
2.50
3.00
Jan Feb Mar Apr May Jun Jul Aug Sep Oct Nov Dec
Prec
ipita
tion (
in In
ches
)
Month
A21 A36 SC1 AIA Airport 30 Yr

2C-6
AN
NU
AL
GR
OU
ND
WA
TE
R M
ON
ITO
RIN
G R
EP
OR
T, CA
LE
ND
AR
YE
AR
2010
Figure 2C-2. Annual Precipitation Data for SNL/NM, January 2002 to December 2010
5.826.14
13.33
12.55
14.39
7.39
6.01
6.83
9.47
5.89
6.51
10.69 10.88
15.37
8.36
7.13
7.97
9.67
7.86
7.63
12.66
10.85
13.50
12.97
8.35
9.24
11.17
6.39 6.35
8.38
11.42
13.06
10.21
8.35
6.67
8.96
0
2
4
6
8
10
12
14
16
18
2002 2003 2004 2005 2006 2007 2008 2009 2010
Prec
ipita
tion
(in In
ches
)
Year
A21 (TA-II) A36 (TA-III)/V
SC1 (School House) AIA (Albuquerque Int'l Airport)

GR
OU
ND
WA
TE
R P
RO
TE
CT
ION
PR
OG
RA
M
2C-7
Figure 2C-3. Monthly Groundwater Pumped by KAFB Water Supply Wells, CY10
36,529,000 34,537,000
48,402,000
71,141,000
99,311,000
117,679,000
124,551,000
109,212,000
99,283,000
74,592,000
50,607,000
34,585,000
1,000,000
20,000,000
39,000,000
58,000,000
77,000,000
96,000,000
115,000,000
134,000,000
153,000,000
172,000,000
Jan-
10
Feb-
10
Mar
-10
Apr
-10
May
-10
Jun-
10
Jul-1
0
Aug
-10
Sep
-10
Oct
-10
Nov
-10
Dec
-10
Tota
l Pro
duct
ion
(gal
s)

2C-8
AN
NU
AL
GR
OU
ND
WA
TE
R M
ON
ITO
RIN
G R
EP
OR
T, CA
LE
ND
AR
YE
AR
2010
Figure 2C-4. Groundwater Pumped by KAFB Water Supply Wells, CY10
0
5,000,000
10,000,000
15,000,000
20,000,000
25,000,000
30,000,000
35,000,000
40,000,000
45,000,000
50,000,000
55,000,000
60,000,000
65,000,000
70,000,000
Gro
undw
ater
Pum
ped
Per
Wel
l (ga
ls)
WELL 1 WELL 2 WELL 3 WELL 4 WELL 7
WELL 11 WELL 14 WELL 15 WELL 16 WELL 20
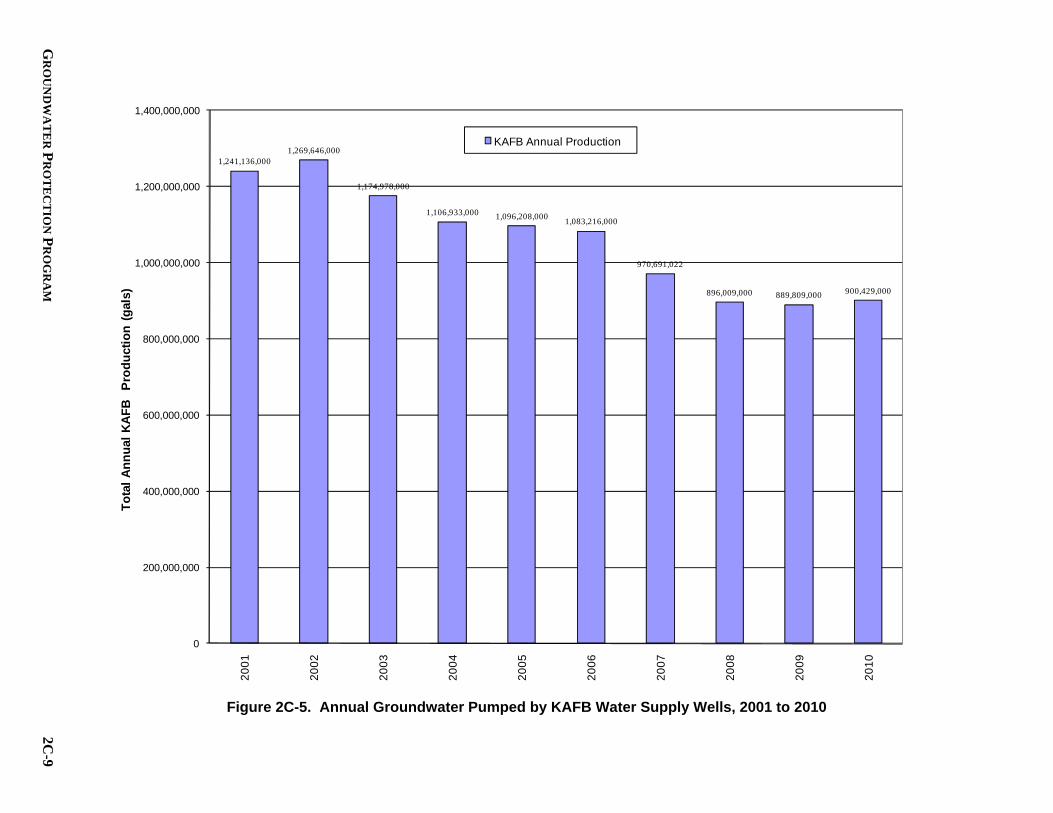
GR
OU
ND
WA
TE
R P
RO
TE
CT
ION
PR
OG
RA
M
2C-9
Figure 2C-5. Annual Groundwater Pumped by KAFB Water Supply Wells, 2001 to 2010
1,241,136,0001,269,646,000
1,174,978,000
1,106,933,000 1,096,208,0001,083,216,000
970,691,022
896,009,000 889,809,000 900,429,000
0
200,000,000
400,000,000
600,000,000
800,000,000
1,000,000,000
1,200,000,000
1,400,000,000
2001
2002
2003
2004
2005
2006
2007
2008
2009
2010
Tota
l Ann
ual K
AFB
Pr
oduc
tion
(gal
s)
KAFB Annual Production

2C-10 ANNUAL GROUNDWATER MONITORING REPORT, CALENDAR YEAR 2010
Figure 2C-6. CY10 Regional Groundwater Water Table Elevations

GROUNDWATER PROTECTION PROGRAM 2C-11
Table 2C-1. Regional Groundwater Table Elevations, CY10
Well Name X_EASTING Y_NORTHING Fall 2009 Fall 2010 CY 2010- CY 2009
CWL-BW3 414685.90 1444689.45 4,926.28 4,925.02 -1.26 EUBANK-2 416809.00 1473598.00 4,890.27 4,891.27 1.00 EUBANK-5 418625.00 1474996.00 4,885.93 4,887.42 1.49 KAFB-0118 399534.00 1470587.00 4,854.82 4,856.19 1.37 KAFB-0219 408577.24 1464046.26 4,860.62 4,860.61 -0.01 KAFB-0307 415788.78 1469357.80 4,928.94 4,929.68 0.74 KAFB-0311 415320.18 1468610.50 4,927.78 4,928.53 0.75 KAFB-0417 394402.40 1469586.90 4,857.12 4,856.96 -0.16 KAFB-0617 421324.11 1465525.50 4,941.62 4,942.17 0.55 KAFB-0901 416928.14 1470927.94 4,914.52 4,915.12 0.60 KAFB-1008 399585.21 1436306.14 4,878.50 4,877.94 -0.56 KAFB-1009 400641.89 1441800.61 4,874.62 4,874.30 -0.32 KAFB-6301 419610.17 1457740.36 4,922.20 4,921.02 -1.18 LWDS-MW1 414375.03 1455057.43 4,922.42 4,921.55 -0.87 Mesa Del Sol-S 391812.80 1443144.80 4,876.60 4,876.87 0.27 Montessa Prk-S 390193.5 1461202.5 4,877.50 4,877.79 0.29 MRN-2 405393.35 1448095.73 4,870.68 4,869.98 -0.70 MWL-MW5 411261.94 1452294.82 4,887.07 4,886.61 -0.46 NWTA3-MW3D 407349.625 1455450.75 4,870.62 4,870.11 -0.51 SWTA3-MW2 407487.74 1447230.54 4,873.06 4,872.51 -0.55 SWTA3-MW4 407465.86 1444885.57 4,874.46 4,873.94 -0.52 TA1-W-01 410373.39 1472422.88 4,856.17 4,856.17 0.00 TA1-W-04 414813.45 1474707.30 4,884.90 4,886.02 1.12 TA2-W-25 415262.01 1470439.03 4,899.74 4,900.03 0.29 TAV-MW3 416156.07 1454168.25 4,920.57 4,919.28 -1.29 TAV-MW5 413141.76 1455269.73 4,921.76 4,920.74 -1.02 YALE-MW9 389646.00 1474349.00 4,885.84 4,885.56 -0.28 KAFB-0611 415618.6 1464643.94 4,921.67 4,921.41 -0.26 KAFB-0618 418616.36 1461129.44 4,923.87 4,923.96 0.09 KAFB-0620 413010.94 1461828.18 4,889.58 4,889.67 0.09 KAFB-0621 422157.5 1468963 4,937.53 4,938.66 1.13 PL-4 405929.58 1459651.14 4,863.88 4,863.32 -0.56
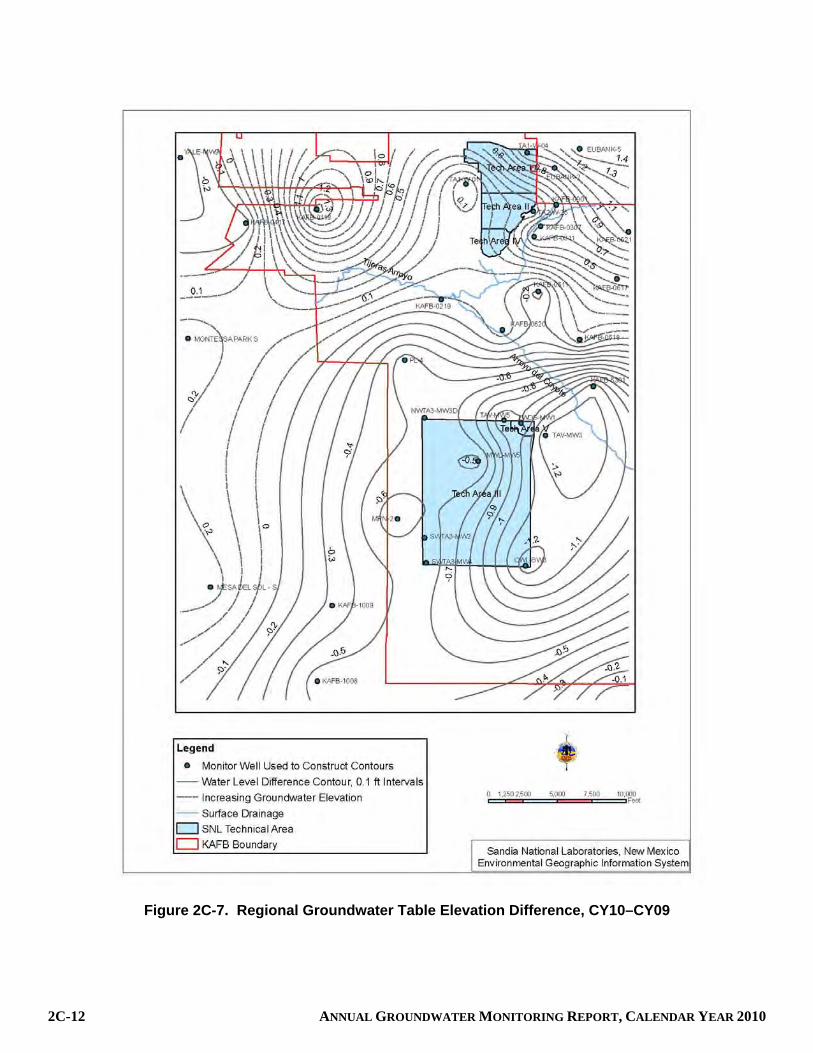
2C-12 ANNUAL GROUNDWATER MONITORING REPORT, CALENDAR YEAR 2010
Figure 2C-7. Regional Groundwater Table Elevation Difference, CY10–CY09
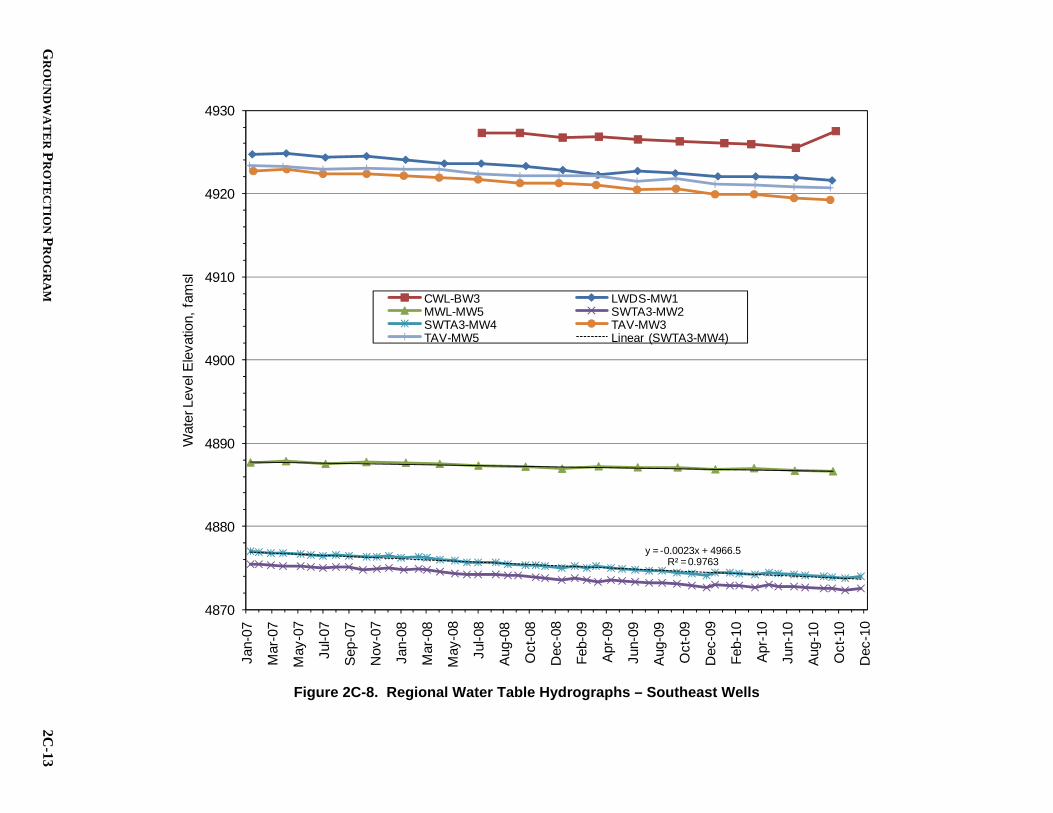
GR
OU
ND
WA
TE
R P
RO
TE
CT
ION
PR
OG
RA
M
2C-13
Figure 2C-8. Regional Water Table Hydrographs – Southeast Wells
y = -0.0023x + 4966.5R² = 0.9763
4870
4880
4890
4900
4910
4920
4930
Jan-
07
Mar
-07
May
-07
Jul-0
7
Sep-
07
Nov
-07
Jan-
08
Mar
-08
May
-08
Jul-0
8
Aug-
08
Oct
-08
Dec
-08
Feb-
09
Apr
-09
Jun-
09
Aug-
09
Oct
-09
Dec
-09
Feb-
10
Apr
-10
Jun-
10
Aug-
10
Oct
-10
Dec
-10
Wat
er L
evel
Ele
vatio
n, f
amsl
CWL-BW3 LWDS-MW1MWL-MW5 SWTA3-MW2SWTA3-MW4 TAV-MW3TAV-MW5 Linear (SWTA3-MW4)

2C-14
AN
NU
AL
GR
OU
ND
WA
TE
R M
ON
ITO
RIN
G R
EP
OR
T, CA
LE
ND
AR
YE
AR
2010
Figure 2C-9. Regional Water Table Hydrographs – Northeast Wells
y = -0.0029x + 5036.9R² = 0.9681
4880
4890
4900
4910
4920
4930
4940
4950
Jan-
07
Mar
-07
May
-07
Jul-0
7
Sep
-07
Nov
-07
Jan-
08
Mar
-08
May
-08
Jul-0
8
Aug
-08
Oct
-08
Dec
-08
Feb-
09
Apr-
09
Jun-
09
Aug
-09
Oct
-09
Dec
-09
Feb-
10
Apr-
10
Jun-
10
Aug
-10
Oct
-10
Dec
-10
Wat
er L
evel
Ele
vatio
n, f
amsl
EUBANK-2 EUBANK-5 KAFB-0307KAFB-0311 KAFB-0611 KAFB-0617KAFB-0618 KAFB-0620 KAFB-0621KAFB-0901 KAFB-6301 TA1-W-04TA2-W-25 Linear (KAFB-6301)
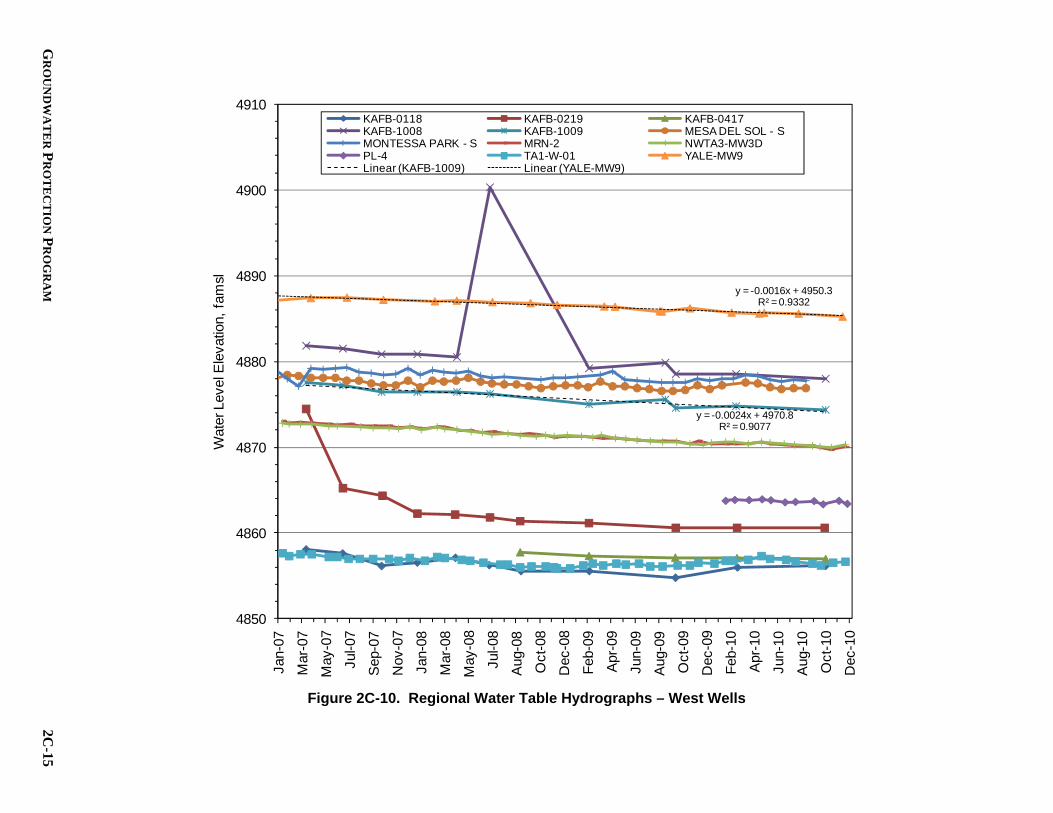
GR
OU
ND
WA
TE
R P
RO
TE
CT
ION
PR
OG
RA
M
2C-15
Figure 2C-10. Regional Water Table Hydrographs – West Wells
y = -0.0024x + 4970.8R² = 0.9077
y = -0.0016x + 4950.3R² = 0.9332
4850
4860
4870
4880
4890
4900
4910
Jan-
07
Mar
-07
May
-07
Jul-0
7
Sep
-07
Nov
-07
Jan-
08
Mar
-08
May
-08
Jul-0
8
Aug
-08
Oct
-08
Dec
-08
Feb-
09
Apr
-09
Jun-
09
Aug
-09
Oct
-09
Dec
-09
Feb-
10
Apr
-10
Jun-
10
Aug
-10
Oct
-10
Dec
-10
Wat
er L
evel
Ele
vatio
n, f
amsl
KAFB-0118 KAFB-0219 KAFB-0417KAFB-1008 KAFB-1009 MESA DEL SOL - SMONTESSA PARK - S MRN-2 NWTA3-MW3DPL-4 TA1-W-01 YALE-MW9Linear (KAFB-1009) Linear (YALE-MW9)

2C-16 ANNUAL GROUNDWATER MONITORING REPORT, CALENDAR YEAR 2010
Figure 2C-11. CY10 Perched Groundwater Zone Water Table Elevation

GROUNDWATER PROTECTION PROGRAM 2C-17
Table 2C-2. Perched Groundwater System Water Table Elevations, CY10
Well Name X_EASTING Y_NORTHING Fall 2009 Fall 2010 CY 2010- CY 2009
KAFB-0310 416967.67 1466775.83 5,062.79 5,062.26 -0.53 KAFB-0312 418411.09 1466654.48 5,009.70 5,010.20 0.50 KAFB-0313 416371.23 1467106.12 5,067.22 5,066.85 -0.37 KAFB-0314 418395.37 1468521.17 5,037.88 5,037.69 -0.19 KAFB-0315 418413.54 1469305.61 5,023.53 5,023.80 0.27 KAFB-0506 406914.23 1468667.94 5,155.40 5,154.95 -0.45 KAFB-0608 416325.83 1463923.85 5,063.30 5,062.80 -0.50 KAFB-0614 417143.96 1461770.43 5,056.17 5,055.83 -0.34 KAFB-0619 418641.29 1461099.95 5,019.30 5,020.04 0.74 KAFB-0623 414174.38 1465223.89 5,067.79 5,067.77 -0.02 KAFB-2622 406006.59 1469291.34 5,154.79 5,154.62 -0.17 KAFB-3391 409710.21 1471788.31 5,120.13 5,119.66 -0.47 TA1-W-03 415058.11 1473207.18 5,109.53 5,107.13 -2.40 TA1-W-06 412331.38 1471918.6 5,109.24 5,108.56 -0.68 TA1-W-08 412787.13 1475374.24 5,123.48 5,122.75 -0.73 TA2-W-26 415265.37 1470489.1 5,089.76 5,088.88 -0.88 TJA-5 415129.026 1467136.269 5,070.29 5,069.57 -0.72 TJA-7 411737.38 1467543.6 5,087.22 5,086.23 -0.99 WYO-4 409912.58 1470025.17 5,101.16 5,099.76 -1.40

2C-18 ANNUAL GROUNDWATER MONITORING REPORT, CALENDAR YEAR 2010
Figure 2C-12. Perched Groundwater Zone Water Table Elevation Difference,
CY10-CY09

GR
OU
ND
WA
TE
R P
RO
TE
CT
ION
PR
OG
RA
M
2C-19
Figure 2C-13. Perched Groundwater Water Table Hydrographs – Northwest Wells
y = -0.0016x + 5186.6R² = 0.9654
5080
5090
5100
5110
5120
5130
5140
5150
5160
Jan-
07
Mar
-07
May
-07
Jul-0
7
Sep
-07
Nov
-07
Jan-
08
Mar
-08
May
-08
Jul-0
8
Aug
-08
Oct
-08
Dec
-08
Feb-
09
Apr
-09
Jun-
09
Aug
-09
Oct
-09
Dec
-09
Feb-
10
Apr
-10
Jun-
10
Aug
-10
Oct
-10
Dec
-10
Wat
er L
evel
Ele
vatio
n, f
amsl
KAFB-0506 KAFB-2622 KAFB-3391TA1-W-03 TA1-W-06 TA1-W-08TJA-7 WYO-4 Linear (TA1-W-08)

2C-20
AN
NU
AL
GR
OU
ND
WA
TE
R M
ON
ITO
RIN
G R
EP
OR
T, CA
LE
ND
AR
YE
AR
2010
Figure 2C-14. Perched Groundwater Water Table Hydrographs – Southeast Wells
y = -0.0011x + 5131.6R² = 0.9119
5000
5010
5020
5030
5040
5050
5060
5070
5080
5090
5100
Jan-
07
Mar
-07
May
-07
Jul-0
7
Sep
-07
Nov
-07
Jan-
08
Mar
-08
May
-08
Jul-0
8
Aug
-08
Oct
-08
Dec
-08
Feb-
09
Apr
-09
Jun-
09
Aug
-09
Oct
-09
Dec
-09
Feb-
10
Apr
-10
Jun-
10
Aug
-10
Oct
-10
Dec
-10
Wat
er L
evel
Ele
vatio
n, f
amsl
KAFB-0310 KAFB-0312 KAFB-0313KAFB-0314 KAFB-0315 KAFB-0608KAFB-0614 KAFB-0619 KAFB-0623TA2-W-26 TJA-5 Linear (TA2-W-26)
CHEMICAL WASTE LANDFILL 3-1
3.0 Chemical Waste Landfill
3.1 Introduction
The Chemical Waste Landfill (CWL) is a 1.9-acre former disposal site located in the southeastern corner of Technical Area III at Sandia National Laboratories, New Mexico (SNL/NM) (Figure 3-1). From 1962 until 1981, the CWL was used for the disposal of chemical, radioactive, and solid waste generated by SNL/NM research activities. From 1982 through 1985, only solid waste was disposed of at the CWL. In addition, the CWL was used as a hazardous waste drum storage facility from 1981 to 1989. In 1990, trichloroethene (TCE) was identified in groundwater at a concentration exceeding the regulatory limit of 5 micrograms per liter (µg/L). This finding led to the development and incorporation of a corrective action program into the CWL Closure Plan (SNL December 1992). The SNL/NM Environmental Restoration (ER) Project implemented two voluntary corrective measures (VCMs), the Vapor Extraction (VE) and Landfill Excavation (LE) VCMs. As part of the VE VCM that was conducted from 1996 through 1998, the volatile organic compound (VOC) soil-gas plume was reduced and controlled, further degradation of groundwater beneath the CWL was prevented, and TCE concentrations in groundwater were reduced to levels below the regulatory limit. As part of the LE VCM, the CWL was excavated from September 1998 through February 2002. More than 52,000 cubic yards of contaminated soil and debris were removed from the former disposal area. In April 2004, the U.S. Department of Energy (DOE) and Sandia Corporation (Sandia) requested approval to install an at-grade vegetative soil cover as an interim measure (Wagner April 2004) while New Mexico Environment Department (NMED) comments on the April 2003 CWL Corrective Measure Study (CMS) Report were being resolved. On September 22, 2004, the NMED approved this request with conditions (Kieling September 2004). The conditions of approval were addressed in the subsequent revised Remedial Action Proposal that was submitted as Annex I of the revised CWL CMS Report (SNL December 2004). Construction of the at-grade vegetative soil cover began in March 2005 and was completed in September 2005. On May 21, 2007, the NMED issued the CWL CMS Report (SNL December 2004), Draft Post-Closure Care Permit (NMED 2007) and a Closure Plan amendment for a 60-day public comment period that was completed on August 20, 2007. The DOE and Sandia submitted comments to the NMED (Wagner July 2007) and requested a public hearing. Several citizens also provided comments and requested a public hearing. Informal negotiations were initiated by the NMED in August 2008 with all parties requesting a public hearing. The negotiations were completed on October 15, 2009, and documented in the settlement agreement and Final Order In the Matter of Application for a Post-Closure Care Hazardous Waste Permit for the Chemical Waste Landfill, Sandia National Laboratories No. NM5890110518 (Final Order), which also included the final CWL Post-Closure Care Permit (NMED October 2009a). On October 16, 2009, the NMED issued a Notice of Approval, Final Remedy and Closure Plan Amendment, Chemical Waste Landfill (NMED October 2009b). The NMED-approved CWL Closure Plan amendment addressed changes to both Chapter 12 (closure process) and Appendix G (Groundwater Sampling and Analysis Plan [SAP]). Appendix G changes were established during the 2008 through 2009 informal negotiations and included the replacement of four groundwater monitoring wells and a reduction in the number of wells required for semiannual sampling.

3-2 ANNUAL GROUNDWATER MONITORING REPORT, CALENDAR YEAR 2010
Figure 3-1. Location of the Chemical Waste Landfill within Technical Area III

CHEMICAL WASTE LANDFILL 3-3
From April through August 2010, monitoring wells CWL-MW4, CWL-MW5L, CWL-MW5U, CWL-MW6L, CWL-MW6U, and CWL-BW4A were decommissioned, and new monitoring wells CWL-MW9, CWL-MW10, CWL-MW11, and CWL-BW5 were installed. As documented in the Closure Plan amendment (NMED October 2009b), once the new monitoring wells were installed they became the exclusive groundwater monitoring network for the CWL. The Final Resource Conservation and Recovery Act (RCRA) Closure Report documenting closure in accordance with all CWL Closure Plan requirements was submitted to the NMED on September 27, 2010 (SNL September 2010a). The Well Installation and Decommissioning Report was submitted as an appendix to the CWL Final RCRA Closure Report. Approval of CWL closure will make the CWL Post-Closure Care Permit effective, superseding the CWL Closure Plan as the enforceable regulatory document.
3.1.1 Monitoring History
In 1985, groundwater monitoring began at the CWL (IT December 1985) as required by Section 20.4.1.600 of the New Mexico Administrative Code (NMAC), incorporating Title 40, Code of Federal Regulations (CFR), Part 265, Subpart F. In 1988, four additional monitoring wells were installed. In 1990, an additional downgradient well was installed. In 1994, seven more monitoring wells were installed. In response to a Notice of Violation from the NMED with regard to the inadequate design and construction of the 1985 wells, four of these wells were plugged and abandoned in 1997. To complete the ongoing chromium assessment, the NMED requested the installation of two additional deep monitoring wells to be monitored for eight quarters. These wells were installed in March and April 2003 with NMED direction regarding location, construction, and well screen placement in the regional aquifer. The results of the eight sampling events and completion of the chromium investigation were documented in the August 2005 CWL Quarterly Closure Progress Report (SNL August 2005). Monitoring well CWL-MW2A was plugged and abandoned in June 2004 due to well integrity issues (SNL July 2004). As discussed in the previous section, from April through August 2010 new monitoring wells CWL-MW9, CWL-MW10, CWL-MW11, and CWL-BW5 were installed and monitoring wells CWL-MW4, CWL-MW5L, CWL-MW5U, CWL-MW6L, CWL-MW6U, and CWL-BW4A were decommissioned based on agreements reached during Post-Closure Care Permit negotiations with NMED. Two of the decommissioned wells, CWL-MW5U/L and CWL-MW6U/L, were nested well pairs consisting of two wells installed in the same borehole. Until 1990, all groundwater sampling at the CWL was conducted on a quarterly basis in accordance with 40 CFR 265.92(c)(1). In 1990, the NMED granted a reduction in the sampling frequency from quarterly to semiannually for groundwater contamination indicator parameters and annually for groundwater quality parameters, as allowed by 40 CFR 265.92(d)(2), as no contaminants had been detected above U.S. Environmental Protection Agency (EPA) drinking water standards in samples from any well. During the following sampling quarter in March 1990, TCE was detected above the drinking water standard of 5 µg/L in the sample from CWL-MW2A. Additionally, two indicator parameters (specific conductance [SC] and pH) also exceeded state guidelines. Two months later, resampling for VOCs confirmed the presence of TCE. The NMED reinstated the quarterly sampling requirement and, thereafter, all indicator parameters have been sampled in accordance with 40 CFR 265.93(c)(2).

3-4 ANNUAL GROUNDWATER MONITORING REPORT, CALENDAR YEAR 2010
In 1995, Appendix G of the CWL Closure Plan (SNL December 1992) was revised and updated as part of a Closure Plan Amendment Request submitted to the NMED on June 30, 1995. In May 2000, the NMED approved the following changes to Appendix G of the CWL Closure Plan (Bearzi May 2000):
Biannual frequency (every other year) for agreed upon Appendix IX constituents including VOCs, semivolatile organic compounds, chlorinated herbicides, polychlorinated biphenyls, total cyanide, sulfides, dissolved chromium, and total metals plus iron.
Semiannual frequency (twice a year) for Appendix IX VOCs and metals. As part of its review of the CWL Corrective Measures Study (CMS) Report, the NMED presented general groundwater characterization requirements in December 2003 (Kieling December 2003). In March 2004, these requirements were further discussed, and it was agreed that seven sampling events using the conventional sampling method for all CWL monitoring wells with a large enough diameter to accommodate the conventional method equipment would be sufficient for the revised CMS Report. The original NMED comments and the negotiated agreements regarding the required number of events are documented in the CWL CMS Comment Response Document (SNL October 2004) and in the revised CWL CMS Report (SNL December 2004). A comprehensive summary of the CWL disposal history is presented in the NMED-approved CWL Closure Plan (SNL December 1992) and the LE VCM Final Report (SNL April 2003). Groundwater and other site investigation results from 1992 through 1995 are documented in both the Chemical Waste Landfill Unsaturated Zone Contaminant Characterization Report (SNL November 1993) and the CWL Groundwater Assessment Report (SNL October 1995). A comprehensive investigation history of the CWL is presented and summarized in the CWL CMS Report (SNL December 2004), including pre-VCM, VCM, and post-VE VCM soil, soil-gas, and groundwater monitoring results that establish current conditions.
3.1.2 Monitoring Network
The groundwater monitoring network transitioned in Calendar Year (CY) 2010 from the older network comprised of 13 wells to the new network comprised of 11 wells. Of the remaining 11 wells, semiannual sampling is only required for the four new wells installed in 2010. All wells that were part of the CWL monitoring network in CY 2010 are shown in Figure 3-2 and listed in Table 3-1. During CY 2010, six wells were sampled in April (older monitoring network), and four wells were sampled in November-December (new monitoring network).
3.1.3 Summary of Activities
CWL semiannual groundwater monitoring activities were performed during April and in November and December 2010. Groundwater samples were collected from six monitoring wells in April and from the four new wells in November and December. The samples were analyzed for 40 CFR 264 (Appendix IX) VOCs and Appendix IX total metals plus iron. Additional samples for total aluminum, calcium, magnesium, manganese, potassium, and sodium were collected from three CWL wells during the April sampling event. The SNL/NM ER Project quarterly progress reports (SNL September 2010b and March 2011) provide a complete summary of each sampling event. Attachment 3A presents tables showing the analytical results for CWL monitoring wells sampled during CY 2010.

CHEMICAL WASTE LANDFILL 3-5
Table 3-1. Monitoring Wells at the CWL
Well(1) Installation Year WQ WL Comments
Older Monitoring Well Network – April 2010 Sampling Event CWL-MW1A 1988 Dry well (filled with sediment during VE VCM) CWL-MW3A 1988 Dry well (filled with sediment during VE VCM) CWL-BW3 1988 Insufficient volume for representative sampling CWL-MW4(2) 1990 Water table well CWL-MW2BU 1994 Insufficient volume for representative sampling CWL-MW2BL 1994 Lower section of nested well CWL-MW5U(2) 1994 Upper section of nested well CWL-MW5L(2) 1994 Lower section of nested well (2-inch-diameter well) CWL-MW6U(2) 1994 Upper section of nested well CWL-MW6L(2) 1994 Lower section of nested well (2-inch-diameter well) CWL-BW4A(2) 1994 Insufficient volume for representative sampling CWL-MW7 2003 Deep monitoring well CWL-MW8 2003 Deep monitoring well
New Monitoring Well Network – November-December 2010 Sampling Event CWL-BW5 2010 Upgradient well – replaces CWL-BW4A CWL-MW9 2010 Downgradient well – new well CWL-MW10 2010 Downgradient well – new well CWL-MW11 2010 Downgradient well – new well
NOTES: (1) Refer to page xviii of this report for well descriptions. (2) Well decommissioned after April 2010 sampling event. Check marks in the WQ and WL columns indicate WQ sampling and WL measurements during the period from January to December 2010. CWL = Chemical Waste Landfill. VCM = Voluntary Corrective Measure. VE = Vapor Extraction. WL = Water level. WQ = Water quality.
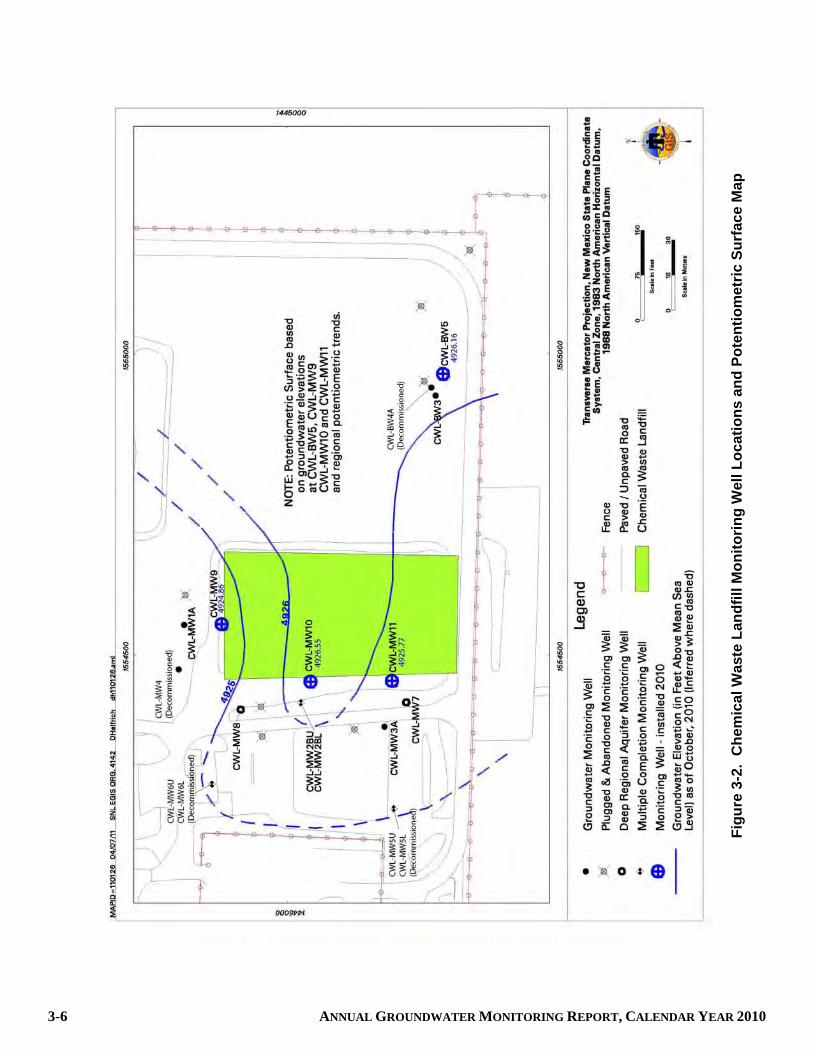
3-6 ANNUAL GROUNDWATER MONITORING REPORT, CALENDAR YEAR 2010
Figure 3-2. Chemical Waste Landfill Monitoring Well Locations
Figu
re 3
-2.
Che
mic
al W
aste
Lan
dfill
Mon
itorin
g W
ell L
ocat
ions
and
Pot
entio
met
ric S
urfa
ce M
ap

CHEMICAL WASTE LANDFILL 3-7
3.1.4 Summary of Future Activities
The NMED-approved CWL Post-Closure Care Permit (NMED October 2009a) supersedes the CWL Closure Plan (SNL December 1992) upon NMED approval of the Final CWL RCRA Closure Report. All future groundwater monitoring will be performed in accordance with the requirements in the Permit. Under the CWL Post-Closure Care Permit, groundwater sampling requirements for the four new monitoring wells (CWL-BW5, CWL-MW9, CWL-MW10, and CWL-MW11) changed. These changes include a reduction in the groundwater monitoring analyte reporting list and an annual report that is due on March 31 of each CY. The first annual report under the Permit will be submitted to NMED by March 31, 2012, and will cover monitoring conducted from June through December 2011. As required by 20.4.1.500 NMAC, incorporating 40 CFR 264.117(a)(1), the post-closure care period is 30 years. The NMED may shorten or extend this period under 20.4.1.500 NMAC, incorporating 40 CFR 264.117(a)(2).
3.1.5 Conceptual Site Model
As documented in the NMED-approved CWL Post-Closure Care Permit, TCE, chromium, and nickel are identified as the constituents of concern at the CWL (NMED October 2009a). A detailed conceptual site model is provided in Annex E of the CWL CMS Report (SNL December 2004). The regional aquifer in the area of the CWL is located within the Santa Fe Group alluvial sediments at a depth of approximately 485 to 500 feet below ground surface. Regional groundwater beneath KAFB flows generally westward toward the Rio Grande, but local perturbations in the water table occur due to pumping wells and geologic (i.e., lithologic and structural) controls. Pumping by the City of Albuquerque and KAFB have profoundly modified the natural groundwater flow regime (Reeder et al. 1967 and Kues 1987) creating a trough in the water table in the western and northeastern portions of KAFB. Water levels at the CWL have been declining since October 2004 at an approximate average rate of 0.76 feet per year. Detailed hydrographs of specific CWL wells are presented in Attachment 3B (Figures 3B-1 and 3B-2) and in the CWL-MW2A Class 2 Closure Plan Amendment Request (SNL July 2004). Historically, water levels have been measured quarterly at all CWL wells, with some exceptions. In CY 2010 water levels were measured in all wells on a quarterly basis. The potentiometric surface map of the CWL using October 2010 water level measurements (Figure 3-2) is consistent with the hydrogeologic conceptual model for the Kirtland Air Force Base (KAFB) area, which shows the local groundwater flow direction is generally to the west-northwest due to the regional gradient and influence of groundwater withdrawals by the City of Albuquerque and KAFB. As reflected in Figure 3-2, site-specific changes in the water table surface occur as a result of geologic controls (i.e., vertical and lateral lithologic changes in the saturated Santa Fe Group sediments). The trough in the regional aquifer described above is located to the west of the CWL. Groundwater travel times from the CWL to these KAFB and municipal water supply wells are on the order of hundreds to thousands of years (SNL February 2001).
3.2 Regulatory Criteria
The CWL is an interim status landfill that has undergone closure in accordance with 20.4.1.600 NMAC, incorporating 40 CFR 265 Subpart G, and the CWL Closure Plan (SNL December 1992, as amended). Monitoring details, such as specific analytes and sampling frequencies, are defined in Appendix G of the Closure Plan and subsequent amendments and revisions. When the NMED approves the CWL closure and the CWL Final RCRA Closure Report, all future monitoring will be conducted following the requirements stipulated in the CWL Post-Closure Care Permit (NMED October 2009a).
3-8 ANNUAL GROUNDWATER MONITORING REPORT, CALENDAR YEAR 2010
3.3 Scope of Activities
Groundwater monitoring performed during CY 2010 at the CWL is summarized in Section 3.1.3. The NMED DOE Oversight Bureau (OB) participated in both the April and November-December 2010 sampling events and received split samples from three CWL monitoring wells (CWL-MW2BL, CWL-MW4, and CWL-MW5U) in April, and from three monitoring wells (CWL-MW9, CWL-MW10, and CWL-MW11) in November and December. The split samples for both sampling events were submitted to a different laboratory for analysis of Appendix IX VOCs and metals. Additional samples for total aluminum, calcium, magnesium, manganese, potassium, and sodium were requested by the NMED DOE OB. To ensure a consistent level of quality assurance for these analyses, SNL/NM personnel also collected samples for total aluminum, calcium, magnesium, manganese, potassium, and sodium at the three CWL monitoring wells during the April sampling event. These additional analyses are not required by Appendix G of the CWL Closure Plan (SNL December 1992). The NMED DOE OB split sampling results are presented in a separate document and not included in this report. Table 3-2 lists the parameters and CWL monitoring wells sampled.
Table 3-2. Analytical Parameters at CWL Monitoring Wells for Each Sampling Period Parameter April 2010 November-December 2010
Appendix IX VOCs CWL-MW2BL, CWL-MW4, CWL-MW5L, CWL-MW5U, CWL-MW5U (dup), CWL-MW6L, CWL-MW6U, CWL-MW6U (dup)
CWL-BW5, CWL-MW9, CWL-MW9 (dup), CWL-MW10, CWL-MW11
Appendix IX Total Metals plus Iron
CWL-MW2BL, CWL-MW4, CWL-MW5L, CWL-MW5U, CWL-MW5U (dup), CWL-MW6L, CWL-MW6U, CWL-MW6U (dup)
CWL-BW5, CWL-MW9, CWL-MW9 (dup), CWL-MW10, CWL-MW11
NOTES: “U” and “L” denote upper and lower completions for nested wells in the same borehole. CWL = Chemical Waste Landfill. dup = Duplicate. VOC = Volatile organic compound. Groundwater samples collected for chemical analyses were submitted to GEL Laboratories, Inc. (GEL) in Charleston, South Carolina. All chemical analytical results are compared with EPA maximum contaminant levels (MCLs) for drinking water supplies. The analytical results are summarized in Attachment 3A, Tables 3A-1 through 3A-3. Field and laboratory quality control (QC) samples were prepared to determine the accuracy of the methods used and to detect inadvertent sample contamination that may have occurred during the sampling and analysis process. Field QC samples included environmental duplicate, equipment blank, field blank (FB), and trip blank (TB) samples. Laboratory QC analyses performed included method blank, laboratory control sample (LCS), matrix spike, matrix spike duplicate, and surrogate spike analyses. Water quality parameters for groundwater temperature, SC, and pH were measured using a YSITM Model 620 Water Quality Meter. Turbidity was measured with a HachTM Model 2100P portable turbidity meter. Field water quality measurements are presented in Attachment 3A, Table 3A-4.
3.4 Field Methods and Measurements
Groundwater sampling was conducted in conformance with procedures outlined in the Sampling and Analysis Plan for Groundwater Assessment Monitoring at the Chemical Waste Landfill, Appendix G, Revision 4 of the CWL Closure Plan (SNL December 1992). Groundwater elevation and water quality field measurements were obtained during groundwater sampling activities. Field water quality parameters are presented in Table 3A-4 (Attachment 3A). Depth-to-groundwater measurements were obtained using a Solinst™ depth-to-water well sounder prior to purging activities. Depth-to-groundwater measurements

CHEMICAL WASTE LANDFILL 3-9
were performed in accordance with the Field Operating Procedure (FOP), Long-Term Environmental Stewardship Groundwater Monitoring Well Sampling and Field Analytical Measurements, FOP 05-01 (SNL August 2007). Groundwater elevation measurements at the CWL monitoring wells from CY 2007 through CY 2010 are presented in Attachment 3B, Figures 3B-1 and 3B-2. A BennettTM groundwater sampling system was used to collect groundwater samples from all wells, except small-diameter wells (2 inches or less). Wells CWL-MW5L and CWL-MW6L are small-diameter wells, and dedicated sampling systems manufactured by QED™ Environmental Systems, Inc. were used to collect samples from these wells. Prior to sample collection, each monitoring well was purged to remove stagnant well casing water. More than one day was required to complete purging and sampling at CWL-MW5U and CWL-MW6U in April, and at CWL-MW10 and CWL-MW11 in November and December, due to the slow recharge rate of the monitoring wells. Monitoring wells purged to dryness were allowed to recover before sampling to ensure the most representative groundwater sample possible given the low yield of these wells. Wells CWL-MW2BL and CWL-MW4 in April, and CWL-BW5 and CWL-MW9 in November-December, were purged a minimum of three well-bore volumes prior to sampling. Wells CWL-MW5L and CWL-MW6L in April were purged a minimum of two tubing water volumes prior to sampling. Groundwater temperature, SC, and pH were measured using a YSITM Model 620 water quality meter. Turbidity was measured with a HachTM Model 2100P portable turbidity meter. Groundwater stability is considered acceptable when measurements are within 5 nephelometric turbidity units, 0.2 pH units, and 0.2 degrees Celsius (°C), and SC is within 1 percent or 10 microhms per centimeter (whichever is greater). During the purging of CWL-MW2BL and CWL-MW6L in April, the last two temperature measurements for both wells were within the 0.2°C range, but the previous measurement was slightly lower (approximately 0.4°C for CWL-MW6L and 0.25°C for CWL-MW2BL). Additional purging was not performed prior to sample collection. Groundwater samples collected after the purging process were submitted to off-site laboratories (GEL) following analysis request/chain-of-custody protocol.
3.5 Analytical Methods
The analytical laboratory analyzed samples using EPA-approved analytical methods and specified performance criteria in accordance with the SNL/NM Statement of Work for Analytical Laboratories (SNL May 2009). The analytical laboratory provided appropriate sample containers prepared with the required sample preservative. Table 3-3 summarizes analytical requirements and EPA Methods (EPA 1986) applicable to groundwater sampling at the CWL during CY 2010.
3.6 Summary of Analytical Results
The analytical results and water quality parameters are presented in Attachment 3A, Tables 3A-1 through 3A-4. Analyses for aluminum, calcium, magnesium, manganese, potassium, and sodium were also conducted for three of the well samples collected in April. All results are compared with established EPA MCLs, where applicable; no constituents were detected above established MCLs during CY 2010. Data qualifiers from the data validation process are presented with the associated results in the Attachment 3A tables. Data validation and QC sample results associated with each sampling event are discussed in Section 3.7.

3-10 ANNUAL GROUNDWATER MONITORING REPORT, CALENDAR YEAR 2010
Table 3-3. CWL Analyses, Methods, Sample Containers, Preservatives, and Holding Times
Analysis Methoda Container Type/ Volume/Preservative Holding Time
Appendix IX Volatile Organic Compounds SW846-8260B Glass; 3 x 40 mL; HCl; 4°C 14 days
Appendix IX Total metals + ironb SW846-6020/7470A Polyethylene; 500 mL; HNO3; 4°C 28 days/180 daysc NOTES: aU.S. Environmental Protection Agency, November 1986. Test Methods for Evaluating Solid, Physical/Chemical Methods, 3rd ed., (and updates), SW-846, Office of Solid Waste and Emergency Response, U.S. Environmental Protection Agency, Washington, D.C. bFor April 2010 samples collected from CWL-MW2BL, CWL-MW4, and CWL-MW5U, analyses for aluminum, calcium, magnesium, manganese, potassium, and sodium were also performed. cHolding time for mercury is 28 days; all other metals are 180 days. °C = Degree(s) Celsius. CWL = Chemical Waste Landfill. HCl = Hydrochloric acid. HNO3 = Nitric acid. mL = Milliliter(s).
3.6.1 Volatile Organic Compounds
Detected VOCs are presented in Attachment 3A, Table 3A-1. No VOCs were detected above established MCLs during CY 2010. No VOCs were detected in any sample except for toluene, chloromethane, and TCE. Toluene and chloromethane were detected below the laboratory practical quantitation limits (PQLs). Toluene was detected below the MCL of 1,000 g/L in one sample at a concentration of 0.330 g/L. TCE was detected below the MCL of 5.0 g/L at concentrations ranging from 0.450 to 2.75 g/L; three of the five results were below the laboratory PQL of 1.00 g/L. Associated laboratory method detection limits (MDLs) are presented in Attachment 3A, Table 3A-2.
3.6.2 Total Metals
As required by the NMED Hazardous Waste Bureau, all metal samples were analyzed for total metals. Metal results are presented in Attachment 3A, Table 3A-3. No total metal parameters were detected above established regulatory limits in any groundwater sample. Chromium was detected below the MCL of 0.10 milligrams per liter (mg/L) at concentrations ranging from 0.00253 to 0.00263 mg/L. Nickel was detected above the laboratory MDL in all environmental groundwater samples, except at CWL-MW5L. Detected nickel concentrations range from 0.00253 to 0.252 mg/L. No MCL is established for nickel. Additional samples were collected for total aluminum, calcium, magnesium, manganese, potassium, and sodium from CWL-MW2BL, CWL-MW4, and CWL-MW5U during the April sampling event to duplicate the analyses performed by the NMED DOE OB. No MCLs are established for these metals. Aluminum was not detected above the laboratory MDL. Reported concentrations for calcium ranged from 91.8 to 117 mg/L, magnesium from 25.3 to 36.5 mg/L, manganese at 0.0368 mg/L in the sample from CWL-MW4 only, potassium from 5.95 to 9.08 mg/L, and sodium from 74.0 to 83.0 mg/L.
3.6.3 Water Quality Parameters
Attachment 3A, Table 3A-4 summarizes field water quality measurements prior to sampling and includes temperature, SC, oxidation-reduction potential, pH, turbidity, and dissolved oxygen.
3.7 Quality Control Results
Field and laboratory QC samples were prepared to determine the accuracy of the methods used and to detect inadvertent sample contamination that may have occurred during the sampling and analysis process. All data were reviewed in accordance with AOP [Administrative Operating Procedure] 00-03, Data Validation Procedure for Chemical and Radiochemical Data (SNL July 2007). The results for each QC analysis and the impact on data quality are discussed in the following sections.
CHEMICAL WASTE LANDFILL 3-11
3.7.1 Field Quality Control Samples
Field QC samples included environmental duplicate, FB, and TB samples. TB samples are submitted whenever samples are collected for VOC analysis to assess whether contamination of the samples occurred during shipment and storage. FB samples provide a check for potential ambient sources of sample contamination during the sampling process and/or sampling error. EB samples are collected to verify the effectiveness of the sampling equipment decontamination process, and duplicate samples are collected immediately after the environmental sample to provide information about sampling variability and overall reproducibility. The field QC samples were submitted for analysis along with the groundwater samples in accordance with QC procedures specified in the SAP provided in Appendix G of the CWL Closure Plan (SNL December 1992). The following sections discuss the analytical results for each QC sample type.
3.7.1.1 Duplicate Environmental Samples
Duplicate environmental samples were collected at CWL-MW5U, CWL-MW6U, and CWL-MW9 and analyzed for all detected parameters. Relative percent difference (RPD) calculations between duplicate samples were performed for all analytes. The results show that sampling and analysis precision was in conformance with the SAP (Appendix G of the CWL Closure Plan) requirements for all measured parameters, except selenium in the April sample from CWL-MW5U. The selenium RPD was calculated at 22 and is considered an estimated value because the sampling results reported were less than the laboratory PQL.
3.7.1.2 Field Blank Samples
A total of seven FB samples were collected for VOCs to assess whether contamination of the samples resulted from ambient field conditions. During the April sampling event, an FB sample was collected at each monitoring well (six locations) because monitoring well drilling activities were being performed at the CWL during this sampling event. The FB samples were prepared by pouring deionized water into sample containers at the sample collection point to simulate the transfer of environmental samples from the sampling system into the sample container. VOCs detected above laboratory MDLs included bromodichloromethane, bromoform, chloroform, chloromethane, and dibromochloromethane. No corrective action was necessary for bromodichloromethane, bromoform, or dibromochloromethane as these compounds were not detected in the associated environmental samples. During data validation, the results for chloroform were qualified as not detected in samples from CWL-MW2BL and CWL-MW5L, and for chloromethane in the sample from CWL-MW5U because these compounds were detected at concentrations less than five times the blank concentration.
3.7.1.3 Trip Blank Samples
TB samples consist of laboratory reagent-grade water with hydrochloric acid preservative contained in 40-milliliter volatile organic analysis vials prepared by the analytical laboratory, which accompany the empty sample containers supplied by the laboratory. The TBs were brought to the field and accompanied each sample shipment. A total of 13 TBs were submitted with the CY 2010 samples. No VOCs were detected above laboratory MDLs in any TB sample.
3.7.2 Laboratory Quality Control Samples
Internal laboratory QC samples, including method blanks and duplicate LCSs, were analyzed concurrently with the groundwater samples. Additionally, batch matrix spike, matrix spike duplicate, and surrogate spike samples were analyzed. All laboratory data were reviewed and qualified in accordance with AOP [Administrative Operating Procedure] 00-03, Revision 2, Data Validation Procedure for Chemical and Radiochemical Data (SNL July 2007).

3-12 ANNUAL GROUNDWATER MONITORING REPORT, CALENDAR YEAR 2010
Although some analytical results were qualified as not detected or as estimated values during the data validation process, no significant data quality problems were noted for any CWL groundwater sample, except aluminum and vanadium. Aluminum results for CWL-MW2BL and CWL-MW5U and vanadium results for CWL-MW2BL, CWL-MW5L, CWL-MW5U, and CWL-MW6L were qualified as unusable during data validation as the matrix spike percent recoveries did not meet acceptance criteria. SNL/NM requested that GEL reanalyze these metals in the samples. Results of the reanalysis (Sample 088581-R09) are reported in Table 3A-3 (Attachment 3A), and QC measures for the reanalysis are acceptable. Chromium in CWL-MW10 was qualified as not detected during data validation because chromium was detected at a concentration less than five times the detected laboratory method blank value. Data validation reports and findings associated with CWL groundwater monitoring are filed in the SNL/NM Customer Funded Records Center.
3.8 Variances and Nonconformances
Variances and nonconformances from requirements in the CWL SAP (SNL December 1992) are identified as follows:
CWL-MW1A and CWL-MW3A are no longer sampled. Since 1998 these wells have contained no water. During the VE VCM, the wells partially filled with sediment and have not recovered. However, SNL/NM personnel lowered a water level meter to verify that these wells remain dry.
No samples were collected from CWL-BW3, CWL-BW4A, or CWL-MW2BU. SNL/NM
personnel notified the NMED that these wells did not produce sufficient water to collect a representative sample during the CY 2009 sampling events.
There was a minor variance relative to the stability target range for temperature at
monitoring wells CWL-MW2BL and CWL-MW6L during the purging process in April. The last two temperature measurements for both wells were within the stability target range of 0.2°C, but the previous measurements were slightly lower (approximately 0.4°C for CWL-MW6L and 0.25°C for CWL-MW2BL). After review of the field data and recognition of the variance, corrective action was not deemed necessary as the maximum temperature variation between the final three measurements for both wells was minimal, the last two readings met the stabilization requirement, and all other purging requirements had been met. The field sampling team was reminded of the CWL stability target range for temperature and in the future will continue purging until stability is achieved.
3.9 Summary and Conclusions
During CY 2010, samples were collected from 10 CWL monitoring wells (CWL-MW2BL, CWL-MW4, CWL-MW5L, CWL-MW5U, CWL-MW6L, and CWL-MW6U in April, and CWL-BW5, CWL-MW9, CWL-MW10, and CWL-MW11 in November and December) and analyzed for 40 CFR 264 (Appendix IX) VOCs and total metals plus iron. Analyses for aluminum, calcium, magnesium, manganese, potassium, and sodium were also performed on three of the well samples collected in April. No analytes were detected at concentrations exceeding the associated EPA MCLs in any CWL groundwater samples collected during CY 2010.

CHEMICAL WASTE LANDFILL 3-13
3.10 References
Bearzi May 2000 Bearzi, J.P. (New Mexico Environment Department), May 2000. Letter to M.J. Zamorski (U.S. Department of Energy) and R.J. Eagan (Sandia
Corporation), Class 1 Permit Modification Approval and Notice of Administrative Completeness: Request for Chemical Waste Landfill Ground-Water Monitoring Schedule Change, Sandia National Laboratories, NM58901210518, Task HWB-SNL-02-008, May 5, 2000.
EPA 1986 U.S. Environmental Protection Agency (EPA), 1986. Test Methods for
Evaluating Solid Waste, 3rd ed., and all updates, SW-846, Office of Solid Waste and Emergency Response, U.S. Environmental Protection Agency, Washington, D.C., November.
IT December 1985 IT Corporation (IT), December 1985. RCRA Interim Status Groundwater
Monitoring Plan, Chemical Waste Landfill, prepared for Environmental Impacts and Restoration Division, Sandia National Laboratories, New Mexico, IT Corporation, Albuquerque, New Mexico.
Kieling June 2011 Kieling, J.E. (New Mexico Environment Department), June 2011. Letter to
P. Wagner (U.S. Department of Energy) and S.A. Orrell (Sandia Corporation), Approval, Closure of Chemical Waste Landfill and Post-Closure Care Permit in Effect, Sandia National Laboratories, EPA ID# NM5890110518, HWB-SNL-10-013, June 2, 2011.
Kieling September 2004 Kieling, J.E. (New Mexico Environment Department), September 2004. Letter
to P. Wagner (U.S. Department of Energy) and P.B. Davies (Sandia Corporation), Approval with Conditions of the Landfill Cover Interim Measure at the Chemical Waste Landfill, Sandia National Laboratories, EPA ID# NM5890110518, HWB-SNL-04-027, September 22, 2004.
Kieling December 2003 Kieling, J.E. (New Mexico Environment Department), December 2003. Letter to K.L. Boardman (U.S. Department of Energy) and P.B. Davies (Sandia
Corporation), Chemical Waste Landfill, Corrective Measures Study, May 2003, Sandia National Laboratories NM5890110518, HWB SNL-03-013, December 12, 2003.
Kues 1987 Kues, G.E., 1987. Groundwater Level Data for Albuquerque-Belen Basin,
New Mexico, through Water Level Year 1985, USGS Open File Report 87-1 16, U.S. Geological Survey, Albuquerque, New Mexico.
NMED October 2009a New Mexico Environment Department (NMED), October 2009. Final Permit
Decision and Response to Comments, Post-Closure Care Permit for the Chemical Waste Landfill, Sandia National Laboratories, EPA ID# NM5890110518, SNL-06-002, New Mexico Environment Department Hazardous Waste Bureau, Santa Fe, New Mexico, October 15, 2009.

3-14 ANNUAL GROUNDWATER MONITORING REPORT, CALENDAR YEAR 2010
NMED October 2009b New Mexico Environment Department (NMED), October 2009. Notice of Approval, Final Remedy and Closure Plan Amendment, Chemical Waste Landfill, Sandia National Laboratories, EPA ID No. NM5890110518, NMED-HWB-05-016, New Mexico Environment Department Hazardous Waste Bureau, Santa Fe, New Mexico, October 16, 2009.
NMED 2007 New Mexico Environment Department (NMED), May 2007. Resource
Conservation and Recovery Act, Post-Closure Care Operating Permit, EPA ID No. NM5890110518, to the U.S. Department of Energy/Sandia Corporation, for the Sandia National Laboratories Chemical Waste Landfill, New Mexico Environment Department Hazardous Waste Bureau, Santa Fe, New Mexico, May 21, 2007.
Reeder et al. 1967 Reeder, H.O., L.J. Bjorklund, and G.A. Dinwiddie, 1967. Quantitative
Analysis of Water Resources in the Albuquerque Area, New Mexico: Computed Effects on the Rio Grande of Pumpage of Groundwater, 1960-2000, New Mexico State Engineer Report 33, Santa Fe, New Mexico.
SNL March 2011 Sandia National Laboratories/New Mexico (SNL/NM), March 2011.
Environmental Restoration Project Consolidated Quarterly Report, November 2010 through January 2011, Environmental Restoration Project, Sandia National Laboratories, Albuquerque, New Mexico.
SNL September 2010a Sandia National Laboratories/New Mexico (SNL/NM), September 2010.
Chemical Waste Landfill Final Resource Conservation and Recovery Act Closure Report, Sandia National Laboratories, Albuquerque, New Mexico, September 27, 2010.
SNL September 2010b Sandia National Laboratories/New Mexico (SNL/NM), September 2010.
Environmental Restoration Project Consolidated Quarterly Report, May 2010 through July 2010, Environmental Restoration Project, Sandia National Laboratories, Albuquerque, New Mexico.
SNL May 2009 Sandia National Laboratories/New Mexico (SNL/NM), May 2009. SNL/NM
Statement of Work for Analytical Laboratories, Revision 4, Sandia National Laboratories, Albuquerque, New Mexico.
SNL August 2007 Sandia National Laboratories/New Mexico (SNL/NM), August 2007. Long-
Term Environmental Stewardship Groundwater Monitoring Well Sampling and Field Analytical Measurements, FOP 05-01, Revision 00, Sandia National Laboratories, Albuquerque, New Mexico.
SNL July 2007 Sandia National Laboratories/New Mexico (SNL/NM), July 2007. Data
Validation Procedure for Chemical and Radiochemical Data, AOP 00-03, Revision 2, Sandia National Laboratories, Albuquerque, New Mexico.
SNL August 2005 Sandia National Laboratories/New Mexico (SNL/NM), August 2005.
Chemical Waste Landfill Quarterly Closure Progress Report, Sandia National Laboratories, Albuquerque, New Mexico, August 22, 2005.

CHEMICAL WASTE LANDFILL 3-15
SNL December 2004 Sandia National Laboratories/New Mexico (SNL/NM), December 2004. Chemical Waste Landfill Corrective Measures Study Report, Environmental Restoration Project, Sandia National Laboratories, Albuquerque, New Mexico.
SNL October 2004 Sandia National Laboratories/New Mexico (SNL/NM), October 2004.
Responses to NMED Comments on the CWL CMS Report, Sandia National Laboratories, Albuquerque, New Mexico.
SNL July 2004 Sandia National Laboratories/New Mexico (SNL/NM), July 2004. Class 2
Amendment to the Chemical Waste Landfill Closure Plan – Rationale for Decommissioning Monitoring Well CWL-MW2A and Plug and Abandonment Plan, Revision 1, Sandia National Laboratories, Albuquerque, New Mexico.
SNL April 2003 Sandia National Laboratories/New Mexico (SNL/NM), April 2003. Chemical
Waste Landfill – Landfill Excavation Voluntary Corrective Measure – Final Report, Sandia National Laboratories, Albuquerque, New Mexico.
SNL February 2001 Sandia National Laboratories/New Mexico (SNL/NM), February 2001. Draft Long-Term Monitoring Strategy for Groundwater, Environmental
Restoration Project, Sandia National Laboratories, Albuquerque, New Mexico.
SNL October 1995 Sandia National Laboratories/New Mexico (SNL/NM), October 1995. CWL Groundwater Assessment Report, Sandia National Laboratories, Albuquerque,
New Mexico. SNL November 1993 Sandia National Laboratories/New Mexico (SNL/NM), November 1993. The Chemical Waste Landfill Unsaturated Zone Contaminant
Characterization Report, Sandia National Laboratories, Albuquerque, New Mexico.
SNL December 1992 Sandia National Laboratories/New Mexico (SNL/NM), December 1992.
Chemical Waste Landfill Final Closure Plan and Postclosure Permit Application, Sandia National Laboratories, Albuquerque, New Mexico, amended January 2003.
Wagner July 2007 Wagner, P. (U.S. Department of Energy), July 2007. Letter to J.E. Kieling
(New Mexico Environment Department), Comments on the New Mexico Environment Department Intent to Approve a Closure Plan Amendment, Select a Final Remedy, and Issue a Post-Closure Care Permit under the New Mexico Hazardous Waste Act for the Sandia National Laboratories Chemical Waste Landfill, July 19, 2007.
Wagner April 2004 Wagner, P. (U.S. Department of Energy), April 2004. Letter to J. Kieling
(New Mexico Environment Department), Request for Approval of an Interim Measure (Cover) at the Chemical Waste Landfill, April 19, 2004.

3-16 ANNUAL GROUNDWATER MONITORING REPORT, CALENDAR YEAR 2010
This page intentionally left blank.

CHEMICAL WASTE LANDFILL 3A-1
Attachment 3A Chemical Waste Landfill Analytical Results Tables

3A-2 ANNUAL GROUNDWATER MONITORING REPORT, CALENDAR YEAR 2010
This page intentionally left blank.

CHEMICAL WASTE LANDFILL 3A-3
Attachment 3A Tables 3A-1 Summary of Detected Volatile Organic Compounds, Chemical Waste Landfill
Groundwater Monitoring, Sandia National Laboratories/New Mexico, Calendar Year 2010 ...................................................................................................................... 3A-5
3A-2 Method Detection Limits for Appendix IX Volatile Organic Compounds,
Chemical Waste Landfill Groundwater Monitoring, Sandia National Laboratories/New Mexico, Calendar Year 2010 .......................................................... 3A-6
3A-3 Summary of Total Metal Results, Chemical Waste Landfill Groundwater
Monitoring, Sandia National Laboratories/New Mexico, Calendar Year 2010 ............ 3A-7 3A-4 Summary of Field Water Quality Measurementsh, Chemical Waste Landfill
Groundwater Monitoring, Sandia National Laboratories/New Mexico, Calendar Year 2010 .................................................................................................................... 3A-20
Footnotes for Chemical Waste Landfill Groundwater Monitoring Tables ........................................... 3A-21

3A-4 ANNUAL GROUNDWATER MONITORING REPORT, CALENDAR YEAR 2010
This page intentionally left blank.

CH
EM
ICA
L W
AS
TE
LA
ND
FIL
L 3A
-5
Table 3A-1 Summary of Detected Volatile Organic Compounds,
Chemical Waste Landfill Groundwater Monitoring, Sandia National Laboratories/New Mexico
Calendar Year 2010
Well ID Analyte Resulta (g/L)
MDLb (g/L)
PQLc (g/L)
MCLd (g/L)
Laboratory Qualifiere
Validation Qualifierf Sample No. Analytical
Methodg CWL-MW2BL 12-Apr-10 Chloroform 0.640 0.250 1.00 NE J 1.0U 088581-001 SW846 8260
CWL-MW5L Chloroform 0.480 0.250 1.00 NE J 1.0U 088578-001 SW846 826013-Apr-10 Trichloroethene 0.570 0.250 1.00 5.00 J 088578-001 SW846 8260CWL-MW5U Chloromethane 0.310 0.300 1.00 NE J 1.0U 088571-001 SW846 826009-Apr-10 Trichloroethene 2.74 0.250 1.00 5.00 088571-001 SW846 8260CWL-MW5U (Duplicate) 09-Apr-10 Trichloroethene 2.75 0.250 1.00 5.00 088572-001 SW846 8260
CWL-MW6L 12-Apr-10 Trichloroethene 0.450 0.250 1.00 5.00 J 088575-001 SW846 8260
CWL-MW6U Chloromethane 0.400 0.300 1.00 NE J 088565-001 SW846 826007-Apr-10 Toluene 0.330 0.250 1.00 1,000 J 088565-001 SW846 8260CWL-MW6U (Duplicate) 07-Apr-10 Chloromethane 0.480 0.300 1.00 NE J 088566-001 SW846 8260
CWL-MW10 06-Dec-10 Trichloroethene 1.11 0.250 1.00 5.00 089885-001 SW846 8260
Refer to footnotes on page 3A-21.

3A-6
AN
NU
AL
GR
OU
ND
WA
TE
R M
ON
ITO
RIN
G R
EP
OR
T, CA
LE
ND
AR
YE
AR
2010
Table 3A-2 Method Detection Limits for Appendix IX Volatile Organic Compounds,
Chemical Waste Landfill Groundwater Monitoring, Sandia National Laboratories/New Mexico
Calendar Year 2010
Analyte MDLb (g/L)
Analytical Methodg Analyte MDLb
(g/L) Analytical Methodg
1,1,1,2-Tetrachloroethane 0.300 SW846 8260 Chloroform 0.250 SW846 8260 1,1,1-Trichloroethane 0.325 SW846 8260 Chloromethane 0.300 SW846 8260 1,1,2,2-Tetrachloroethane 0.250 SW846 8260 Chloroprene 0.300 SW846 8260 1,1,2-Trichloroethane 0.250 SW846 8260 Dibromochloromethane 0.300 SW846 8260 1,1-Dichloroethane 0.300 SW846 8260 Dibromomethane 0.300 SW846 8260 1,1-Dichloroethene 0.300 SW846 8260 Dichlorodifluoromethane 0.300 SW846 8260 1,2,3-Trichloropropane 0.300 SW846 8260 Ethyl benzene 0.250 SW846 8260 1,2,4-Trichlorobenzene 0.300 SW846 8260 Ethyl cyanide 1.50 SW846 8260 1,2-Dibromo-3-chloropropane 0.300 SW846 8260 Ethyl methacrylate 1.00 SW846 8260 1,2-Dibromoethane 0.250 SW846 8260 Iodomethane 1.25 SW846 8260 1,2-Dichloroethane 0.250 SW846 8260 Isobutanol 12.5 SW846 8260 1,2-Dichloropropane 0.250 SW846 8260 Methacrylonitrile 1.00 SW846 8260 2-Butanone 1.25 SW846 8260 Methyl methacrylate 1.00 SW846 8260 2-Hexanone 1.25 SW846 8260 Methylene chloride 3.00 SW846 8260 4-methyl-, 2-Pentanone 1.25 SW846 8260 Pentachloroethane 1.00 SW846 8260 Acetone 3.50 SW846 8260 Styrene 0.250 SW846 8260 Acetonitrile 6.25 SW846 8260 Tetrachloroethene 0.300 SW846 8260 Acrolein 1.25 SW846 8260 Toluene 0.250 SW846 8260 Acrylonitrile 1.00 SW846 8260 Trichloroethene 0.250 SW846 8260 Allyl chloride 1.50 SW846 8260 Trichlorofluoromethane 0.300 SW846 8260 Benzene 0.300 SW846 8260 Vinyl acetate 1.50 SW846 8260 Bromodichloromethane 0.250 SW846 8260 Vinyl chloride 0.500 SW846 8260 Bromoform 0.250 SW846 8260 Xylene 0.300 SW846 8260 Bromomethane 0.300 SW846 8260 bis-Chloroisopropyl ether 1.50 SW846 8260 Carbon disulfide 1.25 SW846 8260 cis-1,3-Dichloropropene 0.250 SW846 8260 Carbon tetrachloride 0.300 SW846 8260 trans-1,2-Dichloroethene 0.300 SW846 8260 Chlorobenzene 0.250 SW846 8260 trans-1,3-Dichloropropene 0.250 SW846 8260 Chloroethane 0.300 SW846 8260 trans-1,4-Dichloro-2-butene 1.00 SW846 8260
Refer to footnotes on page 3A-21.

CH
EM
ICA
L W
AS
TE
LA
ND
FIL
L 3A
-7
Table 3A-3 Summary of Total Metal Results,
Chemical Waste Landfill Groundwater Monitoring, Sandia National Laboratories/New Mexico
Calendar Year 2010
Well ID Analyte Resulta (mg/L)
MDLb (mg/L)
PQLc (mg/L)
MCLd (mg/L)
Laboratory Qualifiere
Validation Qualifierf Sample No. Analytical
Methodg CWL-MW2BL Aluminum ND 0.050 0.150 NE U R 088581-009 SW846 6020 14-Apr-10 Aluminum ND 0.010 0.030 NE U 088581-R09 SW846 6020 Antimony ND 0.0005 0.003 0.006 U 088581-009 SW846 6020 Arsenic ND 0.0015 0.005 0.010 U 088581-009 SW846 6020 Barium 0.0579 0.0005 0.002 2.00 088581-009 SW846 6020 Beryllium ND 0.0005 0.0025 0.004 U 088581-009 SW846 6020 Cadmium ND 0.00011 0.001 0.005 U 088581-009 SW846 6020 Calcium 117 0.100 1.00 NE 088581-009 SW846 6020 Chromium ND 0.0125 0.050 0.100 U 088581-009 SW846 6020 Cobalt ND 0.0005 0.005 NE U 088581-009 SW846 6020 Copper ND 0.0015 0.005 NE U 088581-009 SW846 6020 Iron 0.160 0.050 0.500 NE J 088581-009 SW846 6020 Lead ND 0.0005 0.002 NE U 088581-009 SW846 6020 Magnesium 36.5 0.025 0.075 NE 088581-009 SW846 6020 Manganese ND 0.005 0.025 NE U 088581-009 SW846 6020 Mercury ND 0.000066 0.0002 0.002 U 088581-009 SW846 6020 Nickel 0.00273 0.0025 0.010 NE J 088581-009 SW846 6020 Potassium 5.95 0.400 1.50 NE 088581-009 SW846 6020 Selenium 0.00155 0.001 0.005 0.050 J 088581-009 SW846 6020 Silver ND 0.0002 0.001 NE U 088581-009 SW846 6020 Sodium 83.0 0.400 1.25 NE 088581-009 SW846 6020 Thallium ND 0.0003 0.001 0.002 U 088581-009 SW846 6020 Tin ND 0.001 0.005 NE U 088581-009 SW846 6020 Vanadium ND 0.015 0.050 NE U R 088581-009 SW846 6020 Vanadium ND 0.015 0.050 NE U UJ 088581-R09 SW846 6020 Zinc ND 0.0026 0.010 NE U 088581-009 SW846 6020 Refer to footnotes on page 3A-21.

3A-8
AN
NU
AL
GR
OU
ND
WA
TE
R M
ON
ITO
RIN
G R
EP
OR
T, CA
LE
ND
AR
YE
AR
2010
Table 3A-3 (Continued) Summary of Total Metal Results,
Chemical Waste Landfill Groundwater Monitoring, Sandia National Laboratories/New Mexico
Calendar Year 2010
Well ID Analyte Resulta (mg/L)
MDLb (mg/L)
PQLc (mg/L)
MCLd (mg/L)
Laboratory Qualifiere
Validation Qualifierf Sample No. Analytical
Methodg CWL-MW4 Aluminum ND 0.010 0.030 NE U 088560-009 SW846 6020 05-Apr-10 Antimony ND 0.0005 0.003 0.006 U 088560-009 SW846 6020 Arsenic ND 0.0015 0.005 0.010 U 088560-009 SW846 6020 Barium 0.0597 0.0025 0.010 2.00 088560-009 SW846 6020 Beryllium ND 0.0005 0.0025 0.004 U 088560-009 SW846 6020 Cadmium ND 0.00011 0.001 0.005 U 088560-009 SW846 6020 Calcium 95.1 0.100 1.00 NE 088560-009 SW846 6020 Chromium 0.0263 0.0125 0.050 0.100 J 088560-009 SW846 6020 Cobalt 0.00331 0.0005 0.005 NE J 088560-009 SW846 6020 Copper 0.00261 0.0015 0.005 NE B, J J+ 088560-009 SW846 6020 Iron 0.771 0.050 0.500 NE 088560-009 SW846 6020 Lead ND 0.0025 0.010 NE U 088560-009 SW846 6020 Magnesium 25.3 0.005 0.015 NE 088560-009 SW846 6020 Manganese 0.0368 0.005 0.025 NE 088560-009 SW846 6020 Mercury ND 0.000066 0.0002 0.002 U 088560-009 SW846 6020 Nickel 0.252 0.0025 0.010 NE 088560-009 SW846 6020 Potassium 8.74 0.080 0.300 NE 088560-009 SW846 6020 Selenium 0.00164 0.001 0.005 0.050 J 088560-009 SW846 6020 Silver ND 0.0002 0.001 NE U 088560-009 SW846 6020 Sodium 74.0 0.400 1.25 NE 088560-009 SW846 6020 Thallium ND 0.0015 0.005 0.002 U 088560-009 SW846 6020 Tin ND 0.001 0.005 NE U 088560-009 SW846 6020 Vanadium ND 0.003 0.010 NE U 088560-009 SW846 6020 Zinc 0.00413 0.0026 0.010 NE J 088560-009 SW846 6020 Refer to footnotes on page 3A-21.

CH
EM
ICA
L W
AS
TE
LA
ND
FIL
L 3A
-9
Table 3A-3 (Continued) Summary of Total Metal Results,
Chemical Waste Landfill Groundwater Monitoring, Sandia National Laboratories/New Mexico
Calendar Year 2010
Well ID Analyte Resulta (mg/L)
MDLb (mg/L)
PQLc (mg/L)
MCLd (mg/L)
Laboratory Qualifiere
Validation Qualifierf Sample No. Analytical
Methodg CWL-MW5L Antimony ND 0.0005 0.003 0.006 U 088578-009 SW846 6020 13-Apr-10 Arsenic ND 0.0015 0.005 0.010 U 088578-009 SW846 6020 Barium 0.057 0.0005 0.002 2.00 088578-009 SW846 6020 Beryllium ND 0.0005 0.0025 0.004 U 088578-009 SW846 6020 Cadmium ND 0.00011 0.001 0.005 U 088578-009 SW846 6020 Chromium ND 0.0125 0.050 0.100 U 088578-009 SW846 6020 Cobalt ND 0.0005 0.005 NE U 088578-009 SW846 6020 Copper ND 0.0015 0.005 NE U 088578-009 SW846 6020 Iron 0.173 0.050 0.500 NE J 088578-009 SW846 6020 Lead ND 0.0005 0.002 NE U 088578-009 SW846 6020 Mercury ND 0.000066 0.0002 0.002 U 088578-009 SW846 7470 Nickel ND 0.0025 0.010 NE U 088578-009 SW846 6020 Selenium 0.00132 0.001 0.005 0.050 J 088578-009 SW846 6020 Silver ND 0.0002 0.001 NE U 088578-009 SW846 6020 Thallium ND 0.0003 0.001 0.002 U 088578-009 SW846 6020 Tin ND 0.001 0.005 NE U 088578-009 SW846 6020 Vanadium ND 0.015 0.050 NE U R 088578-009 SW846 6020 Vanadium ND 0.003 0.010 NE U 088578-R09 SW846 6020 Zinc ND 0.0026 0.010 NE U 088578-009 SW846 6020 Refer to footnotes on page 3A-21.

3A-10
AN
NU
AL
GR
OU
ND
WA
TE
R M
ON
ITO
RIN
G R
EP
OR
T, CA
LE
ND
AR
YE
AR
2010
Table 3A-3 (Continued) Summary of Total Metal Results,
Chemical Waste Landfill Groundwater Monitoring, Sandia National Laboratories/New Mexico
Calendar Year 2010
Well ID Analyte Resulta (mg/L)
MDLb (mg/L)
PQLc (mg/L)
MCLd (mg/L)
Laboratory Qualifiere
Validation Qualifierf Sample No. Analytical
Methodg CWL-MW5U Aluminum ND 0.050 0.150 NE U R 088571-009 SW846 6020 09-Apr-10 Aluminum ND 0.010 0.030 NE U 088571-R09 SW846 6020 Antimony ND 0.0005 0.003 0.006 U 088571-009 SW846 6020 Arsenic 0.00253 0.0015 0.005 0.010 J 088571-009 SW846 6020 Barium 0.0666 0.0005 0.002 2.00 088571-009 SW846 6020 Beryllium ND 0.0005 0.0025 0.004 U 088571-009 SW846 6020 Cadmium ND 0.00011 0.001 0.005 U 088571-009 SW846 6020 Calcium 91.8 0.100 1.00 NE 088571-009 SW846 6020 Chromium ND 0.0125 0.050 0.100 U 088571-009 SW846 6020 Cobalt ND 0.0005 0.005 NE U 088571-009 SW846 6020 Copper ND 0.0015 0.005 NE U 088571-009 SW846 6020 Iron 0.133 0.050 0.500 NE J 088571-009 SW846 6020 Lead ND 0.0005 0.002 NE U 088571-009 SW846 6020 Magnesium 26.0 0.025 0.075 NE 088571-009 SW846 6020 Manganese ND 0.005 0.025 NE U 088571-009 SW846 6020 Mercury ND 0.000066 0.0002 0.002 U 088571-009 SW846 6020 Nickel ND 0.0025 0.010 NE U 088571-009 SW846 6020 Potassium 9.08 0.400 1.50 NE 088571-009 SW846 6020 Selenium 0.0017 0.001 0.005 0.050 J 088571-009 SW846 6020 Silver ND 0.0002 0.001 NE U 088571-009 SW846 6020 Sodium 75.3 0.400 1.25 NE 088571-009 SW846 6020 Thallium 0.000686 0.0003 0.001 0.002 J 0.0043U 088571-009 SW846 6020 Tin ND 0.001 0.005 NE U 088571-009 SW846 6020 Vanadium ND 0.015 0.050 NE U R 088571-009 SW846 6020 Vanadium ND 0.003 0.010 NE U UJ 088571-R09 SW846 6020 Zinc 0.0309 0.0026 0.010 NE 088571-009 SW846 6020 Refer to footnotes on page 3A-21.
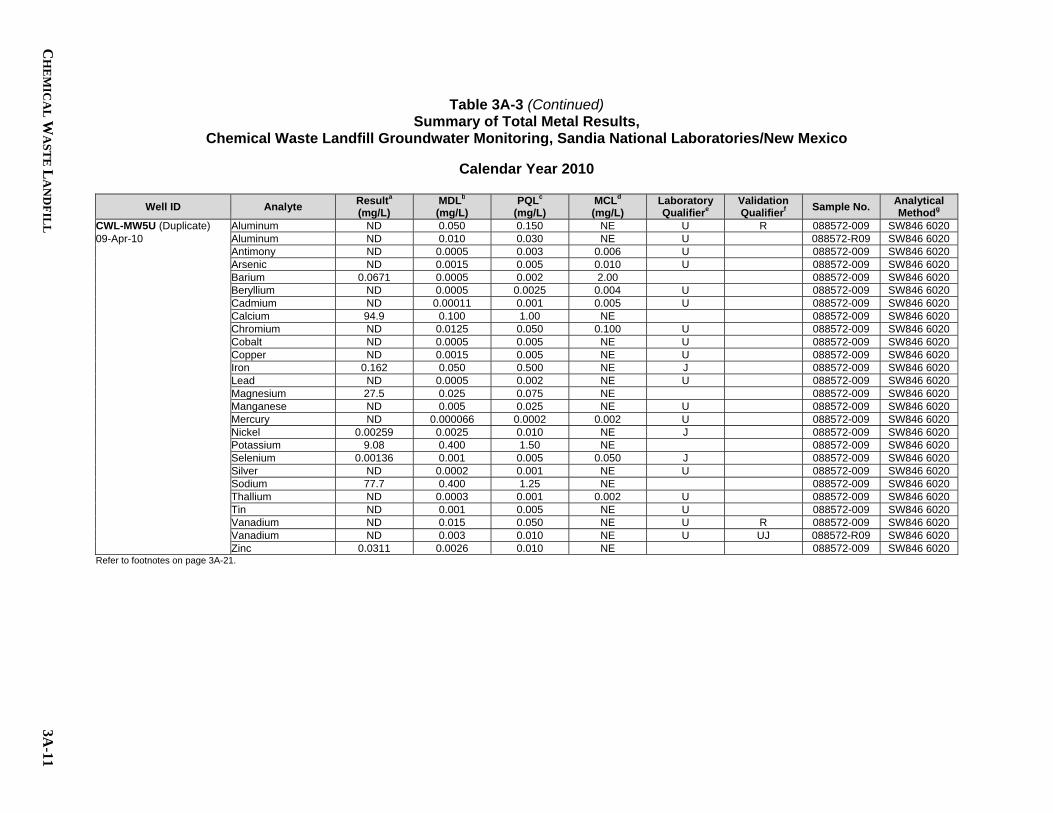
CH
EM
ICA
L W
AS
TE
LA
ND
FIL
L 3A
-11
Table 3A-3 (Continued) Summary of Total Metal Results,
Chemical Waste Landfill Groundwater Monitoring, Sandia National Laboratories/New Mexico
Calendar Year 2010
Well ID Analyte Resulta (mg/L)
MDLb (mg/L)
PQLc (mg/L)
MCLd (mg/L)
Laboratory Qualifiere
Validation Qualifierf Sample No. Analytical
Methodg CWL-MW5U (Duplicate) Aluminum ND 0.050 0.150 NE U R 088572-009 SW846 6020 09-Apr-10 Aluminum ND 0.010 0.030 NE U 088572-R09 SW846 6020 Antimony ND 0.0005 0.003 0.006 U 088572-009 SW846 6020 Arsenic ND 0.0015 0.005 0.010 U 088572-009 SW846 6020 Barium 0.0671 0.0005 0.002 2.00 088572-009 SW846 6020 Beryllium ND 0.0005 0.0025 0.004 U 088572-009 SW846 6020 Cadmium ND 0.00011 0.001 0.005 U 088572-009 SW846 6020 Calcium 94.9 0.100 1.00 NE 088572-009 SW846 6020 Chromium ND 0.0125 0.050 0.100 U 088572-009 SW846 6020 Cobalt ND 0.0005 0.005 NE U 088572-009 SW846 6020 Copper ND 0.0015 0.005 NE U 088572-009 SW846 6020 Iron 0.162 0.050 0.500 NE J 088572-009 SW846 6020 Lead ND 0.0005 0.002 NE U 088572-009 SW846 6020 Magnesium 27.5 0.025 0.075 NE 088572-009 SW846 6020 Manganese ND 0.005 0.025 NE U 088572-009 SW846 6020 Mercury ND 0.000066 0.0002 0.002 U 088572-009 SW846 6020 Nickel 0.00259 0.0025 0.010 NE J 088572-009 SW846 6020 Potassium 9.08 0.400 1.50 NE 088572-009 SW846 6020 Selenium 0.00136 0.001 0.005 0.050 J 088572-009 SW846 6020 Silver ND 0.0002 0.001 NE U 088572-009 SW846 6020 Sodium 77.7 0.400 1.25 NE 088572-009 SW846 6020 Thallium ND 0.0003 0.001 0.002 U 088572-009 SW846 6020 Tin ND 0.001 0.005 NE U 088572-009 SW846 6020 Vanadium ND 0.015 0.050 NE U R 088572-009 SW846 6020 Vanadium ND 0.003 0.010 NE U UJ 088572-R09 SW846 6020 Zinc 0.0311 0.0026 0.010 NE 088572-009 SW846 6020 Refer to footnotes on page 3A-21.

3A-12
AN
NU
AL
GR
OU
ND
WA
TE
R M
ON
ITO
RIN
G R
EP
OR
T, CA
LE
ND
AR
YE
AR
2010
Table 3A-3 (Continued) Summary of Total Metal Results,
Chemical Waste Landfill Groundwater Monitoring, Sandia National Laboratories/New Mexico
Calendar Year 2010
Well ID Analyte Resulta (mg/L)
MDLb (mg/L)
PQLc (mg/L)
MCLd (mg/L)
Laboratory Qualifiere
Validation Qualifierf Sample No. Analytical
Methodg CWL-MW6L Antimony ND 0.0005 0.003 0.006 U 088575-009 SW846 6020 12-Apr-10 Arsenic ND 0.0015 0.005 0.010 U 088575-009 SW846 6020 Barium 0.0559 0.0005 0.002 2.00 088575-009 SW846 6020 Beryllium ND 0.0005 0.0025 0.004 U 088575-009 SW846 6020 Cadmium ND 0.00011 0.001 0.005 U 088575-009 SW846 6020 Chromium ND 0.0125 0.050 0.100 U 088575-009 SW846 6020 Cobalt ND 0.0005 0.005 NE U 088575-009 SW846 6020 Copper ND 0.0015 0.005 NE U 088575-009 SW846 6020 Iron 0.185 0.050 0.500 NE J 088575-009 SW846 6020 Lead ND 0.0005 0.002 NE U 088575-009 SW846 6020 Mercury ND 0.000066 0.0002 0.002 U 088575-009 SW846 7470 Nickel 0.00253 0.0025 0.010 NE J 088575-009 SW846 6020 Selenium 0.00137 0.001 0.005 0.050 J 088575-009 SW846 6020 Silver ND 0.0002 0.001 NE U 088575-009 SW846 6020 Thallium ND 0.0003 0.001 0.002 U 088575-009 SW846 6020 Tin ND 0.001 0.005 NE U 088575-009 SW846 6020 Vanadium ND 0.015 0.050 NE U R 088575-009 SW846 6020 Vanadium ND 0.003 0.010 NE U 088575-R09 SW846 6020 Zinc ND 0.0026 0.010 NE U 088575-009 SW846 6020 Refer to footnotes on page 3A-21.
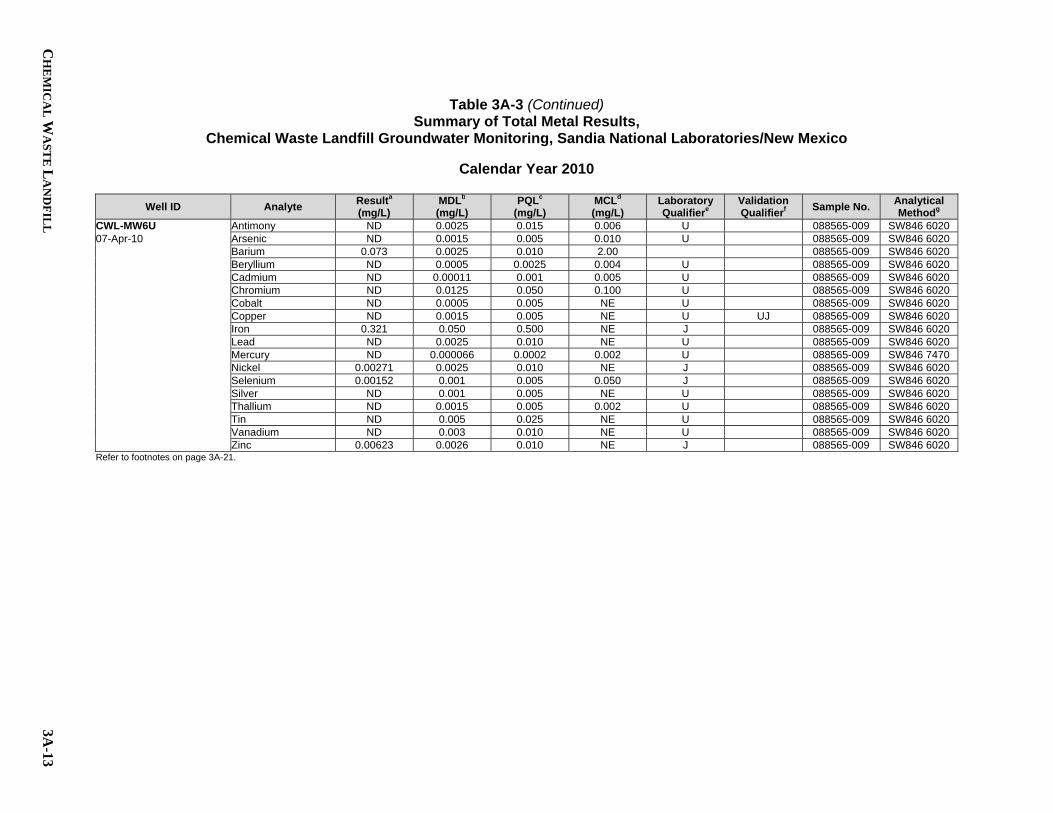
CH
EM
ICA
L W
AS
TE
LA
ND
FIL
L 3A
-13
Table 3A-3 (Continued) Summary of Total Metal Results,
Chemical Waste Landfill Groundwater Monitoring, Sandia National Laboratories/New Mexico
Calendar Year 2010
Well ID Analyte Resulta (mg/L)
MDLb (mg/L)
PQLc (mg/L)
MCLd (mg/L)
Laboratory Qualifiere
Validation Qualifierf Sample No. Analytical
Methodg CWL-MW6U Antimony ND 0.0025 0.015 0.006 U 088565-009 SW846 6020 07-Apr-10 Arsenic ND 0.0015 0.005 0.010 U 088565-009 SW846 6020 Barium 0.073 0.0025 0.010 2.00 088565-009 SW846 6020 Beryllium ND 0.0005 0.0025 0.004 U 088565-009 SW846 6020 Cadmium ND 0.00011 0.001 0.005 U 088565-009 SW846 6020 Chromium ND 0.0125 0.050 0.100 U 088565-009 SW846 6020 Cobalt ND 0.0005 0.005 NE U 088565-009 SW846 6020 Copper ND 0.0015 0.005 NE U UJ 088565-009 SW846 6020 Iron 0.321 0.050 0.500 NE J 088565-009 SW846 6020 Lead ND 0.0025 0.010 NE U 088565-009 SW846 6020 Mercury ND 0.000066 0.0002 0.002 U 088565-009 SW846 7470 Nickel 0.00271 0.0025 0.010 NE J 088565-009 SW846 6020 Selenium 0.00152 0.001 0.005 0.050 J 088565-009 SW846 6020 Silver ND 0.001 0.005 NE U 088565-009 SW846 6020 Thallium ND 0.0015 0.005 0.002 U 088565-009 SW846 6020 Tin ND 0.005 0.025 NE U 088565-009 SW846 6020 Vanadium ND 0.003 0.010 NE U 088565-009 SW846 6020 Zinc 0.00623 0.0026 0.010 NE J 088565-009 SW846 6020 Refer to footnotes on page 3A-21.

3A-14
AN
NU
AL
GR
OU
ND
WA
TE
R M
ON
ITO
RIN
G R
EP
OR
T, CA
LE
ND
AR
YE
AR
2010
Table 3A-3 (Continued) Summary of Total Metal Results,
Chemical Waste Landfill Groundwater Monitoring, Sandia National Laboratories/New Mexico
Calendar Year 2010
Well ID Analyte Resulta (mg/L)
MDLb (mg/L)
PQLc (mg/L)
MCLd (mg/L)
Laboratory Qualifiere
Validation Qualifierf Sample No. Analytical
Methodg CWL-MW6U (Duplicate) Antimony ND 0.0025 0.015 0.006 U 088566-009 SW846 6020 07-Apr-10 Arsenic ND 0.0015 0.005 0.010 U 088566-009 SW846 6020 Barium 0.0697 0.0025 0.010 2.00 088566-009 SW846 6020 Beryllium ND 0.0005 0.0025 0.004 U 088566-009 SW846 6020 Cadmium ND 0.00011 0.001 0.005 U 088566-009 SW846 6020 Chromium ND 0.0125 0.050 0.100 U 088566-009 SW846 6020 Cobalt ND 0.0005 0.005 NE U 088566-009 SW846 6020 Copper ND 0.0015 0.005 NE U UJ 088566-009 SW846 6020 Iron 0.301 0.050 0.500 NE J 088566-009 SW846 6020 Lead ND 0.0025 0.010 NE U 088566-009 SW846 6020 Mercury ND 0.000066 0.0002 0.002 U 088566-009 SW846 7470 Nickel 0.00255 0.0025 0.010 NE J 088566-009 SW846 6020 Selenium 0.00129 0.001 0.005 0.050 J 088566-009 SW846 6020 Silver ND 0.001 0.005 NE U 088566-009 SW846 6020 Thallium ND 0.0015 0.005 0.002 U 088566-009 SW846 6020 Tin ND 0.005 0.025 NE U 088566-009 SW846 6020 Vanadium ND 0.003 0.010 NE U 088566-009 SW846 6020 Zinc 0.00677 0.0026 0.010 NE J 088566-009 SW846 6020 Refer to footnotes on page 3A-21.

CH
EM
ICA
L W
AS
TE
LA
ND
FIL
L 3A
-15
Table 3A-3 (Continued) Summary of Total Metal Results,
Chemical Waste Landfill Groundwater Monitoring, Sandia National Laboratories/New Mexico
Calendar Year 2010
Well ID Analyte Resulta (mg/L)
MDLb (mg/L)
PQLc (mg/L)
MCLd (mg/L)
Laboratory Qualifiere
Validation Qualifierf Sample No. Analytical
Methodg CWL-BW5 Antimony ND 0.0005 0.003 0.006 U 089878-009 SW846 6020 29-Nov-10 Arsenic ND 0.0015 0.005 0.010 U 089878-009 SW846 6020 Barium 0.063 0.0005 0.002 2.00 089878-009 SW846 6020 Beryllium ND 0.0001 0.0005 0.004 U 089878-009 SW846 6020 Cadmium ND 0.00011 0.001 0.005 U 089878-009 SW846 6020 Chromium ND 0.0025 0.010 0.100 U 089878-009 SW846 6020 Cobalt 0.00027 0.0001 0.001 NE J J+ 089878-009 SW846 6020 Copper 0.00091 0.0003 0.001 NE J J+ 089878-009 SW846 6020 Iron 0.470 0.010 0.100 NE B 089878-009 SW846 6020 Lead 0.00052 0.0005 0.002 NE J 089878-009 SW846 6020 Mercury ND 0.000066 0.0002 0.002 U 089878-009 SW846 7470 Nickel 0.003 0.0005 0.002 NE J+ 089878-009 SW846 6020 Selenium 0.00127 0.001 0.005 0.050 J J- 089878-009 SW846 6020 Silver ND 0.0002 0.001 NE U 089878-009 SW846 6020 Thallium ND 0.0003 0.001 0.002 U 089878-009 SW846 6020 Tin ND 0.001 0.005 NE U 089878-009 SW846 6020 Vanadium ND 0.003 0.010 NE U 089878-009 SW846 6020 Zinc ND 0.0026 0.010 NE U 089878-009 SW846 6020 Refer to footnotes on page 3A-21.

3A-16
AN
NU
AL
GR
OU
ND
WA
TE
R M
ON
ITO
RIN
G R
EP
OR
T, CA
LE
ND
AR
YE
AR
2010
Table 3A-3 (Continued) Summary of Total Metal Results,
Chemical Waste Landfill Groundwater Monitoring, Sandia National Laboratories/New Mexico
Calendar Year 2010
Well ID Analyte Resulta (mg/L)
MDLb (mg/L)
PQLc (mg/L)
MCLd (mg/L)
Laboratory Qualifiere
Validation Qualifierf Sample No. Analytical
Methodg CWL-MW9 Antimony ND 0.0005 0.003 0.006 U 089882-009 SW846 6020 01-Dec-10 Arsenic ND 0.0015 0.005 0.010 U 089882-009 SW846 6020 Barium 0.148 0.0025 0.010 2.00 089882-009 SW846 6020 Beryllium ND 0.0001 0.0005 0.004 U 089882-009 SW846 6020 Cadmium ND 0.00011 0.001 0.005 U 089882-009 SW846 6020 Chromium ND 0.0025 0.010 0.100 U 089882-009 SW846 6020 Cobalt 0.00118 0.0001 0.001 NE J+ 089882-009 SW846 6020 Copper 0.000893 0.0003 0.001 NE J 0.0034U 089882-009 SW846 6020 Iron 1.06 0.010 0.100 NE B 089882-009 SW846 6020 Lead ND 0.0005 0.002 NE U 089882-009 SW846 6020 Mercury ND 0.000066 0.0002 0.002 U 089882-009 SW846 7470 Nickel 0.00329 0.0005 0.002 NE J+ 089882-009 SW846 6020 Selenium ND 0.001 0.005 0.050 U UJ 089882-009 SW846 6020 Silver ND 0.0002 0.001 NE U 089882-009 SW846 6020 Thallium ND 0.0003 0.001 0.002 U 089882-009 SW846 6020 Tin ND 0.001 0.005 NE U 089882-009 SW846 6020 Vanadium ND 0.003 0.010 NE U 089882-009 SW846 6020 Zinc 0.023 0.0026 0.010 NE J+ 089882-009 SW846 6020 Refer to footnotes on page 3A-21.

CH
EM
ICA
L W
AS
TE
LA
ND
FIL
L 3A
-17
Table 3A-3 (Continued) Summary of Total Metal Results,
Chemical Waste Landfill Groundwater Monitoring, Sandia National Laboratories/New Mexico
Calendar Year 2010
Well ID Analyte Resulta (mg/L)
MDLb (mg/L)
PQLc (mg/L)
MCLd (mg/L)
Laboratory Qualifiere
Validation Qualifierf Sample No. Analytical
Methodg CWL-MW9 (Duplicate) Antimony ND 0.0005 0.003 0.006 U 089883-009 SW846 6020 01-Dec-10 Arsenic ND 0.0015 0.005 0.010 U 089883-009 SW846 6020 Barium 0.141 0.0025 0.010 2.00 089883-009 SW846 6020 Beryllium ND 0.0001 0.0005 0.004 U 089883-009 SW846 6020 Cadmium ND 0.00011 0.001 0.005 U 089883-009 SW846 6020 Chromium ND 0.0025 0.010 0.100 U 089883-009 SW846 6020 Cobalt 0.00119 0.0001 0.001 NE J+ 089883-009 SW846 6020 Copper 0.000968 0.0003 0.001 NE J 0.0034U 089883-009 SW846 6020 Iron 1.11 0.010 0.100 NE B 089883-009 SW846 6020 Lead ND 0.0005 0.002 NE U 089883-009 SW846 6020 Mercury ND 0.000066 0.0002 0.002 U 089883-009 SW846 7470 Nickel 0.00348 0.0005 0.002 NE J+ 089883-009 SW846 6020 Selenium ND 0.001 0.005 0.050 U UJ 089883-009 SW846 6020 Silver ND 0.0002 0.001 NE U 089883-009 SW846 6020 Thallium ND 0.0003 0.001 0.002 U 089883-009 SW846 6020 Tin ND 0.001 0.005 NE U 089883-009 SW846 6020 Vanadium ND 0.003 0.010 NE U 089883-009 SW846 6020 Zinc 0.0228 0.0026 0.010 NE J+ 089883-009 SW846 6020 Refer to footnotes on page 3A-21.

3A-18
AN
NU
AL
GR
OU
ND
WA
TE
R M
ON
ITO
RIN
G R
EP
OR
T, CA
LE
ND
AR
YE
AR
2010
Table 3A-3 (Continued) Summary of Total Metal Results,
Chemical Waste Landfill Groundwater Monitoring, Sandia National Laboratories/New Mexico
Calendar Year 2010
Well ID Analyte Resulta (mg/L)
MDLb (mg/L)
PQLc (mg/L)
MCLd (mg/L)
Laboratory Qualifiere
Validation Qualifierf Sample No. Analytical
Methodg CWL-MW10 Antimony ND 0.0005 0.003 0.006 U 089885-009 SW846 6020 06-Dec-10 Arsenic ND 0.0015 0.005 0.010 U 089885-009 SW846 6020 Barium 0.311 0.0025 0.010 2.00 B 089885-009 SW846 6020 Beryllium ND 0.0001 0.0005 0.004 U 089885-009 SW846 6020 Cadmium ND 0.00011 0.001 0.005 U 089885-009 SW846 6020 Chromium 0.00325 0.0025 0.010 0.100 B, J 0.014U 089885-009 SW846 6020 Cobalt 0.00185 0.0001 0.001 NE J+ 089885-009 SW846 6020 Copper 0.00201 0.0003 0.001 NE J+ 089885-009 SW846 6020 Iron 1.07 0.010 0.100 NE B 089885-009 SW846 6020 Lead ND 0.0005 0.002 NE U 089885-009 SW846 6020 Mercury ND 0.000066 0.0002 0.002 U UJ 089885-009 SW846 7470 Nickel 0.00707 0.0005 0.002 NE B J+ 089885-009 SW846 6020 Selenium ND 0.001 0.005 0.050 U 089885-009 SW846 6020 Silver ND 0.0002 0.001 NE U 089885-009 SW846 6020 Thallium ND 0.0003 0.001 0.002 U 089885-009 SW846 6020 Tin ND 0.001 0.005 NE U 089885-009 SW846 6020 Vanadium ND 0.003 0.010 NE U 089885-009 SW846 6020 Zinc 0.0682 0.0026 0.010 NE J+ 089885-009 SW846 6020 Refer to footnotes on page 3A-21.

CH
EM
ICA
L W
AS
TE
LA
ND
FIL
L 3A
-19
Table 3A-3 (Concluded) Summary of Total Metal Results,
Chemical Waste Landfill Groundwater Monitoring, Sandia National Laboratories/New Mexico
Calendar Year 2010
Well ID Analyte Resulta (mg/L)
MDLb (mg/L)
PQLc (mg/L)
MCLd (mg/L)
Laboratory Qualifiere
Validation Qualifierf Sample No. Analytical
Methodg CWL-MW11 Antimony 0.000659 0.0005 0.003 0.006 B, J 0.0075U 089888-009 SW846 6020 14-Dec-10 Arsenic ND 0.0015 0.005 0.010 U 089888-009 SW846 6020 Barium 0.0818 0.0005 0.002 2.00 089888-009 SW846 6020 Beryllium ND 0.0001 0.0005 0.004 U 089888-009 SW846 6020 Cadmium ND 0.00011 0.001 0.005 U 089888-009 SW846 6020 Chromium 0.00253 0.0025 0.010 0.100 J J+ 089888-009 SW846 6020 Cobalt 0.000489 0.0001 0.001 NE J J+ 089888-009 SW846 6020 Copper 0.00129 0.0003 0.001 NE 089888-009 SW846 6020 Iron 0.531 0.010 0.100 NE B 089888-009 SW846 6020 Lead 0.000578 0.0005 0.002 NE J 089888-009 SW846 6020 Mercury ND 0.000066 0.0002 0.002 U 089888-009 SW846 7470 Nickel 0.00449 0.0005 0.002 NE J+ 089888-009 SW846 6020 Selenium 0.00257 0.001 0.005 0.050 J 089888-009 SW846 6020 Silver ND 0.0002 0.001 NE U 089888-009 SW846 6020 Thallium 0.000424 0.0003 0.001 0.002 J 0.0019U 089888-009 SW846 6020 Tin ND 0.001 0.005 NE U 089888-009 SW846 6020 Vanadium ND 0.003 0.010 NE U 089888-009 SW846 6020 Zinc 0.0222 0.0026 0.010 NE J+ 089888-009 SW846 6020 Refer to footnotes on page 3A-21.

3A-20
AN
NU
AL
GR
OU
ND
WA
TE
R M
ON
ITO
RIN
G R
EP
OR
T, CA
LE
ND
AR
YE
AR
2010
Table 3A-4 Summary of Field Water Quality Measurementsh,
Chemical Waste Landfill Groundwater Monitoring, Sandia National Laboratories/New Mexico
Calendar Year 2010
Well ID Sample Date Temperature (0C)
Specific Conductivity (mho/cm)
Oxidation Reduction Potential
(mV) pH Turbidity
(NTU) Dissolved Oxygen (% Sat)
Dissolved Oxygen (mg/L)
CWL-MW2BL 14-Apr-10 22.10 1107 204.5 6.70 0.12 80.1 7.09 CWL-MW4 05-Apr-10 18.14 960 59.9 6.86 4.45 63.9 6.03 CWL-MW5L 13-Apr-10 18.22 1083 177.8 6.74 0.20 83.8 7.99 CWL-MW5U 09-Apr-10 17.48 919 179.0 6.93 0.23 63.7 6.08 CWL-MW6L 12-Apr-10 20.59 1042 173.4 6.79 2.77 78.8 7.21 CWL-MW6U 07-Apr-10 16.33 914 189.6 6.93 0.43 59.7 5.82
CWL-BW5 29-Nov-10 18.79 1050 202.0 6.97 1.59 70.9 6.60 CWL-MW9 01-Dec-10 19.62 924 -6.7 7.11 0.94 22.4 2.05 CWL-MW10 06-Dec-10 18.25 880 375.2 7.24 8.45 20.3 1.90 CWL-MW11 14-Dec-10 19.05 982 395.2 7.05 4.09 57.2 5.29 Refer to footnotes on page 3A-21.

CHEMICAL WASTE LANDFILL 3A-21
Footnotes for Chemical Waste Landfill Groundwater Monitoring Tables
aResult - Values in bold exceed the established MCL. - ND = not detected (at method detection limit). - g/L = micrograms per liter. - mg/L = milligrams per liter.
bMDL Method detection limit. The minimum concentration or activity that can be measured and reported with 99% confidence that the analyte is greater than zero, analyte is matrix specific.
cPQL Practical quantitation limit. The lowest concentration of analytes in a sample that can be reliably determined within specified limits of precision and accuracy by that indicated method under routine laboratory operating conditions.
dMCL - Maximum contaminant level. Established by the U.S. Environmental Protection Agency Primary
Water Regulations (40 CFR 141.11[b]), National Primary Drinking Water Standards, EPA, May 2009.
- NE = not established. eLaboratory Qualifier B = Analyte is detected in associated laboratory method blank. J = Amount detected is below the practical quantitation limit (PQL). U = Analyte is absent or below the method detection limit.
fValidation Qualifier If cell is blank, then all quality control samples met acceptance criteria with respect to submitted samples. J+ = The associated numerical value is an estimated quantity with suspected positive bias. J- = The associated numerical value is an estimated quantity with a suspected negative bias. U = The analyte was analyzed for but was not detected. The associated numerical value is the sample quantitation limit. UJ = The analyte was analyzed for but was not detected. The associated value is an estimate and may be inaccurate or imprecise. R = The data are unusable. Re-sampling and re-analysis are necessary for verification.
gAnalytical Method
- EPA, 1979, “Methods for Chemical Analysis of Water and Wastes,” EPA-600/4-79-020, U.S. Environmental Protection Agency, Cincinnati, Ohio.
- EPA, 1986, “Test Methods for Evaluating Solid Waste, Physical/Chemical Methods,” SW-846, 3rd ed., Rev. 1, U.S. Environmental Protection Agency, Washington, D.C.
- U.S. Environmental Protection Agency, Washington, D.C. hField Water Quality Measurements - Field measurements collected prior to sampling. °C = degrees Celsius. % Sat = present saturation. mho/cm = micromhos per centimeter. mg/L = milligrams per liter. mV = millivolts. NTU = nephelometric turbidity units. pH = potential of hydrogen (negative logarithm of the hydrogen ion concentration).
3A-22 ANNUAL GROUNDWATER MONITORING REPORT, CALENDAR YEAR 2010
This page intentionally left blank.

CHEMICAL WASTE LANDFILL 3B-1
Attachment 3B Chemical Waste Landfill
Hydrographs

3B-2 ANNUAL GROUNDWATER MONITORING REPORT, CALENDAR YEAR 2010
This page intentionally left blank.

CHEMICAL WASTE LANDFILL 3B-3
Attachment 3B Hydrographs 3B-1 CWL Water Table Hydrographs for the April 2010 Monitoring Wells ........................ 3B-5 3B-2 CWL Water Table Hydrographs for the November-December 2010 Monitoring
Wells ............................................................................................................................. 3B-6

3B-4 ANNUAL GROUNDWATER MONITORING REPORT, CALENDAR YEAR 2010
This page intentionally left blank.

CH
EM
ICA
L W
AS
TE
LA
ND
FIL
L 3B
-5
Figure 3B-1. CWL Water Table Hydrographs for the April 2010 Monitoring Wells
4914
4916
4918
4920
4922
4924
4926
4928
4930
Grou
ndw
ater El
evat
ion
(FAM
SL)
CWL‐MW2BL_GWPP CWL‐MW4_Field Log CWL‐MW4_GWPP
CWL‐MW5L_Field Log CWL‐MW5L_GWPP CWL‐MW5U_GWPP
CWL‐MW6L_Field Log CWL‐MW6L_GWPP CWL‐MW6U_GWPP
WL_GWPP = water level measurements performed in accordance with the Groundwater Protection Programs Groundwater Level Data Acquistion and Management.
WL_Field Measurment = water level measurement obtained from Field Measurment Log for Groundwater Sample Collection.
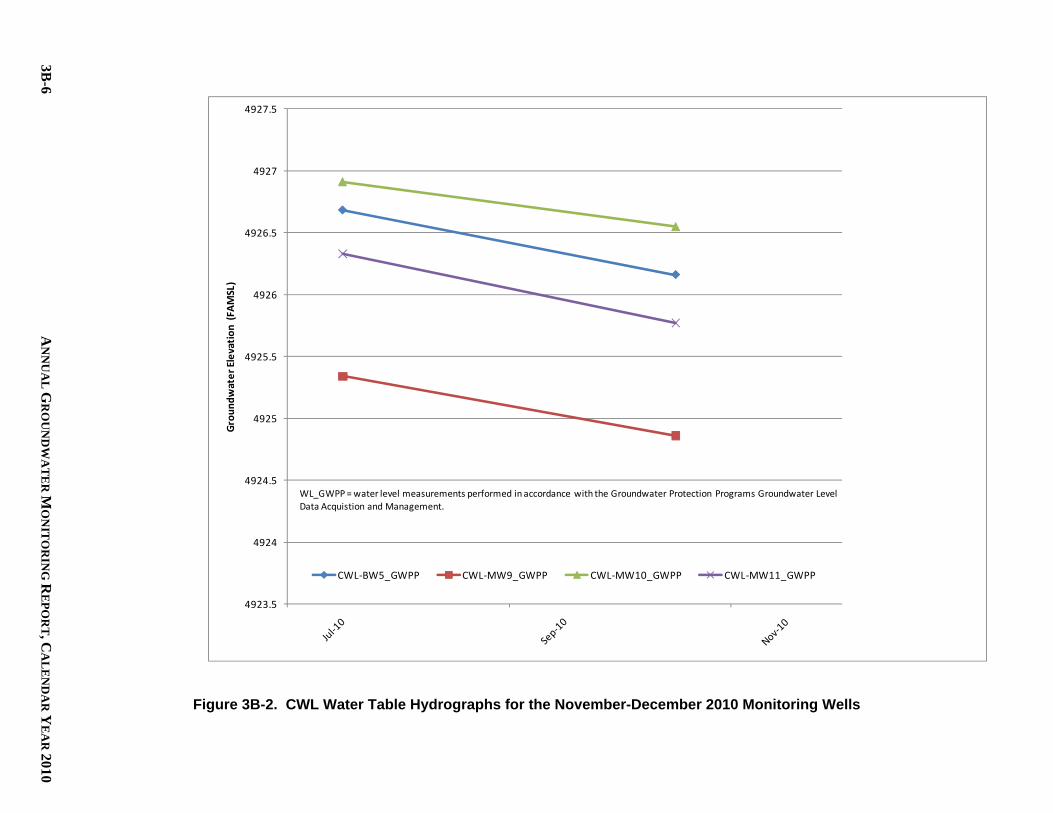
CH
EM
ICA
L W
AS
TE
LA
ND
FIL
L
3B-6
AN
NU
AL
GR
OU
ND
WA
TE
R M
ON
ITO
RIN
G R
EP
OR
T, CA
LE
ND
AR
YE
AR
2010
Figure 3B-2. CWL Water Table Hydrographs for the November-December 2010 Monitoring Wells
4923.5
4924
4924.5
4925
4925.5
4926
4926.5
4927
4927.5
Grou
ndw
ater El
evat
ion
(FAM
SL)
CWL‐BW5_GWPP CWL‐MW9_GWPP CWL‐MW10_GWPP CWL‐MW11_GWPP
WL_GWPP = water level measurements performed in accordance with the Groundwater Protection Programs Groundwater Level Data Acquistion and Management.

MIXED WASTE LANDFILL 4-1
4.0 Mixed Waste Landfill
4.1 Introduction
The Mixed Waste Landfill (MWL) is a 2.6-acre site in the north-central portion of Technical Area III at Sandia National Laboratories, New Mexico (SNL/NM) (Figure 4-1). The MWL consists of two distinct disposal areas: the classified area (occupying 0.6 acres) and the unclassified area (occupying 2.0 acres). Approximately 100,000 cubic feet of low-level radioactive and mixed waste containing approximately 6,300 curies (at the time of disposal) of activity were disposed of in the MWL from March 1959 through December 1988. Classified wastes were buried in cylindrical pits in the classified area and unclassified wastes were buried in shallow trenches in the unclassified area. The Phase 1 Resource Conservation and Recovery Act (RCRA) Facility Investigation (RFI) was conducted in 1989 and 1990 to determine whether a release of RCRA contaminants had occurred at the MWL (SNL September 1990). The Phase 1 RFI indicated that tritium had been released to the environment. A Phase 2 RFI was conducted from 1992 to 1995 to determine the contaminant source, define the nature and extent of contamination, identify potential contaminant transport pathways, evaluate potential risks, and provide remedial action alternatives for the MWL (Peace et al. 2002). The Phase 2 RFI confirmed tritium as the constituent of concern (COC) in soil at the MWL. Tritium occurs in surface and near-surface soil in and around the classified area. Tritium levels range from 1,100 picocuries per gram (pCi/g) in surface soil to 206 pCi/g in subsurface soil. The highest tritium levels have been found within 30 feet (ft) below ground surface (bgs) in soil adjacent to and directly below classified area disposal pits. At depths greater than 30 ft bgs, tritium levels decrease rapidly. At approximately 100 ft bgs, the highest tritium level detected has been 0.074 pCi/g, and at 120 to 140 ft bgs, maximum tritium levels have been 0.029 pCi/g. On October 11, 2001, the New Mexico Environment Department (NMED) directed the U.S. Department of Energy (DOE) and Sandia Corporation (Sandia) to conduct a Corrective Measures Study (CMS) for the MWL (SNL December 2001a). The MWL CMS Report (SNL/NM May 2003) was submitted to the NMED on May 21, 2003, for technical review and comment and recommended that an alternative vegetative soil cover (i.e., evapotranspirative [ET] cover) be deployed as the preferred corrective measure for the MWL. The NMED held a public comment period on the MWL CMS from August 11 to December 9, 2004, and a public hearing was held from December 2 to December 3 and December 8 to December 9, 2004. On May 26, 2005, the Secretary of the NMED selected a vegetative ET cover with a biointrusion barrier as the final remedy for the MWL. The selection was documented in the NMED Final Order, State of New Mexico Before the Secretary of the Environment In the Matter of Request for a Class 3 Permit Modification for Corrective Measures for the Mixed Waste Landfill (NMED May 2005), which also required a Corrective Measures Implementation Plan (CMIP). The MWL CMIP (SNL/NM November 2005) was submitted to the NMED in November 2005. The NMED conditionally approved the CMIP in December 2008 after resolution of two Notices of Disapproval (NODs) (Bearzi December 2008). The MWL ET cover construction was completed from May through September 2009.

4-2 ANNUAL GROUNDWATER MONITORING REPORT, CALENDAR YEAR 2010
Figure 4-1. Location of the Mixed Waste Landfill within Technical Area III
MIXED WASTE LANDFILL 4-3
4.1.1 Monitoring History
The original groundwater monitoring well network at the MWL (MWL-BW1, MWL-MW1, MWL-MW2, and MWL-MW3) was installed in 1989. In 1993 MWL-MW4 was completed at an angle of 6 degrees from vertical and was screened at two discrete intervals 20 ft apart to evaluate vertical potentiometric gradients and changes in aquifer parameters with depth. An inflatable packer separates the screened intervals, and pressure is maintained in the packer to prevent combining water from the two screened sections of the aquifer. Monitoring wells MWL-MW5 and MWL-MW6 were installed in 2000 at a distance of approximately 200 and 500 ft west of the landfill, respectively, with their screened intervals placed below the top of the regional water table in the coarse-grained Ancestral Rio Grande (ARG) deposits. The MWL groundwater monitoring network was modified in 2008 (SNL May 2009a). Due to the declining water table and stainless screen corrosion, four monitoring wells were plugged and abandoned (MWL-BW1, MWL-MW1, MWL-MW2, and MWL-MW3) and four new monitoring wells were installed (MWL-BW2, MWL-MW7, MWL-MW8, and MWL-MW9) (SNL April 2008 and September 2008). The four wells installed in 2008 comprise the MWL groundwater monitoring network for the uppermost part of the regional aquifer and were approved by the NMED (Bearzi October 2008 and January 2009). Wells MWL-MW7, MWL-MW8, MWL-MW9, and MWL-BW2 were considered new wells and, as required by the Compliance Order on Consent (the Order) (NMED 2004), were sampled a minimum of eight consecutive quarters for a defined suite of parameters in addition to sampling for perchlorate for at least four consecutive quarters. The four consecutive quarters of perchlorate sampling were completed in Calendar Year (CY) 2009 with no detections at or above the screening level of 4 micrograms per liter (µg/L); therefore, these wells have been removed from the perchlorate monitoring network. The required eight quarterly sampling events were completed in CY 2010. Wells MWL-MW4, MWL-MW5, and MWL-MW6 are preexisting wells and are sampled on an annual basis. All MWL wells are now being sampled annually as required by the Order. Figure 4-2 shows the current groundwater monitoring network consisting of seven wells completed within the interfingering, fine-grained, alluvial fan deposits (MWL-BW2, MWL-MW4 uppermost screened interval, MWL-MW7, MWL-MW8, and MWL-MW9) and coarse-grained ARG alluvial deposits (MWL-MW4 lower screened interval, MWL-MW5, and MWL-MW6). All seven MWL wells are constructed of 5-inch, Schedule 80 polyvinyl chloride (PVC) casing and have screens composed of slotted Schedule 80 PVC. During construction of the ET cover on May 27, 2009, the packer at MWL-MW4 was removed to allow the well casing to be extended. The packer was serviced and reinstalled on March 4, 2010. References in this report to groundwater samples and water levels from MWL-MW4 refer to groundwater withdrawn or measured from the upper screened interval, and references made to the bottom of this well refer to the depth to the top of the packer. In April 2010 the DOE and Sandia received a letter from the NMED entitled Toluene Detections in Groundwater, which required further investigation to determine the source of very low toluene concentrations in some groundwater samples collected from the MWL in 2008 through early 2010, including conducting a purging/sampling study of the groundwater along with any other studies necessary to determine the source (Bearzi April 2010). DOE/Sandia submitted the MWL Toluene Investigation Report in August 2010 and received an NOD with two comments from the NMED in September 2010 (Bearzi September 2010). The DOE/Sandia NOD response (Wagner October 2010) that included a revised version of the report (SNL/NM October 2010) was submitted to the NMED in October 2010 and was approved in January 2011 (Bearzi January 2011).

4-4 ANNUAL GROUNDWATER MONITORING REPORT, CALENDAR YEAR 2010
Figure 4-2. Location of Groundwater Monitoring Wells at the Mixed Waste Landfill

MIXED WASTE LANDFILL 4-5
Groundwater at the MWL has been extensively characterized since 1990 for major ion chemistry, volatile organic compounds (VOCs), semivolatile organic compounds (SVOCs), nitrate, metals, radionuclides, and perchlorate. Twenty years of data indicate that groundwater has not been contaminated by releases from the MWL (Goering et al. 2002; SNL December 2001b, January 2002, July 2002, October 2002, June 2003, September 2003, July 2004; Lyon and Goering January 2006; SNL November 2006, January 2008, May 2009a, June 2010, and October 2010).
4.1.2 Monitoring Network
The current groundwater monitoring network at the MWL consists of seven wells, as shown in Figure 4-2 and listed in Table 4-1. The upper interval of monitoring well MWL-MW4 was sampled in 2010, as this interval represents the uppermost portion of the regional aquifer beneath the MWL. Table 4-1 shows the quarterly and annual monitoring events conducted during CY 2010 for each of the MWL wells. Table 4-1. Calendar Year 2010 Groundwater Sampling Events, Mixed Waste Landfill
Well ID Installation Year WQ WL January 2010 April 2010 July 2010
MWL-BW2 2008 8th quarter sampling 9th quarter sampling 10th quarter sampling MWL-MW4 1993 – Annual sampling – MWL-MW5 2000 – Annual sampling – MWL-MW6 2000 – Annual sampling – MWL-MW7 2008 7th quarter sampling 8th quarter sampling 9th quarter sampling MWL-MW8 2008 7th quarter sampling 8th quarter sampling 9th quarter sampling MWL-MW9 2008 7th quarter sampling 8th quarter sampling 9th quarter sampling
NOTES: (1) Refer to page xviii of this report for well descriptions. Check marks in the WQ and WL columns indicate WQ sampling and WL measurements during the period from January to December 2010. MWL = Mixed Waste Landfill. ID = Identification. WL = Water level. WQ = Water quality.
4.1.3 Summary of Activities
Quarterly and annual groundwater sampling were conducted during CY 2010 at the MWL in January, April, and July as summarized in Table 4-1. Groundwater samples were collected from seven monitoring wells and analyzed for VOCs, Target Analyte List (TAL) metals plus uranium, anions (as bromide, chloride, fluoride, and sulfate), total alkalinity, nitrate plus nitrite (NPN), gamma spectroscopy, gross alpha, gross beta, and tritium. Additional samples were collected and analyzed for SVOCs (January and April), low-level tritium (April), and isotopic uranium and radon-222 (July). Attachment 4A provides summary tables for the CY 2010 analytical results. The July sampling event was the last quarterly event for the wells installed in 2008 (MWL-BW2, MWL-MW7, MWL-MW8, and MWL-MW9). This report and the Environmental Restoration MWL Annual Groundwater Monitoring Report for CY 2010 (SNL July 2011, in preparation) provide a complete summary of the CY 2010 sampling events.
4.1.4 Summary of Future Activities
The MWL Corrective Measures Implementation (CMI) Report (SNL January 2010a) documents the construction of the MWL ET cover and was submitted to the NMED on January 26, 2010. The topography of the ET cover and side slopes is shown in Figure 4-2. After NMED approval of the CMI Report, DOE and Sandia will revise the 2007 MWL Long-Term Monitoring and Maintenance Plan and submit the revised plan to the NMED for review and approval. The plan will define the long-term monitoring, maintenance, inspection, and repair requirements for the MWL.
4.1.5 Conceptual Site Model
Tritium and VOCs are identified as the COCs at the MWL based upon the Phase 2 RFI, CMIP, and more than 20 years of groundwater monitoring. A detailed conceptual site model is provided in the
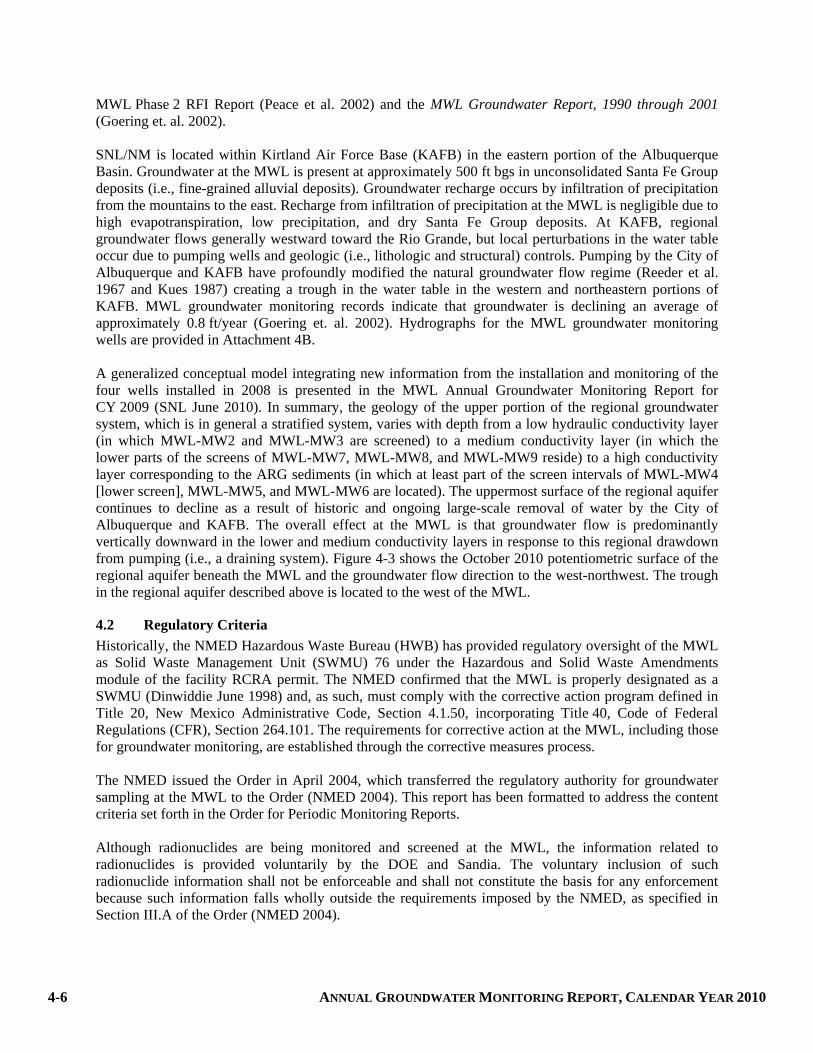
4-6 ANNUAL GROUNDWATER MONITORING REPORT, CALENDAR YEAR 2010
MWL Phase 2 RFI Report (Peace et al. 2002) and the MWL Groundwater Report, 1990 through 2001 (Goering et. al. 2002). SNL/NM is located within Kirtland Air Force Base (KAFB) in the eastern portion of the Albuquerque Basin. Groundwater at the MWL is present at approximately 500 ft bgs in unconsolidated Santa Fe Group deposits (i.e., fine-grained alluvial deposits). Groundwater recharge occurs by infiltration of precipitation from the mountains to the east. Recharge from infiltration of precipitation at the MWL is negligible due to high evapotranspiration, low precipitation, and dry Santa Fe Group deposits. At KAFB, regional groundwater flows generally westward toward the Rio Grande, but local perturbations in the water table occur due to pumping wells and geologic (i.e., lithologic and structural) controls. Pumping by the City of Albuquerque and KAFB have profoundly modified the natural groundwater flow regime (Reeder et al. 1967 and Kues 1987) creating a trough in the water table in the western and northeastern portions of KAFB. MWL groundwater monitoring records indicate that groundwater is declining an average of approximately 0.8 ft/year (Goering et. al. 2002). Hydrographs for the MWL groundwater monitoring wells are provided in Attachment 4B. A generalized conceptual model integrating new information from the installation and monitoring of the four wells installed in 2008 is presented in the MWL Annual Groundwater Monitoring Report for CY 2009 (SNL June 2010). In summary, the geology of the upper portion of the regional groundwater system, which is in general a stratified system, varies with depth from a low hydraulic conductivity layer (in which MWL-MW2 and MWL-MW3 are screened) to a medium conductivity layer (in which the lower parts of the screens of MWL-MW7, MWL-MW8, and MWL-MW9 reside) to a high conductivity layer corresponding to the ARG sediments (in which at least part of the screen intervals of MWL-MW4 [lower screen], MWL-MW5, and MWL-MW6 are located). The uppermost surface of the regional aquifer continues to decline as a result of historic and ongoing large-scale removal of water by the City of Albuquerque and KAFB. The overall effect at the MWL is that groundwater flow is predominantly vertically downward in the lower and medium conductivity layers in response to this regional drawdown from pumping (i.e., a draining system). Figure 4-3 shows the October 2010 potentiometric surface of the regional aquifer beneath the MWL and the groundwater flow direction to the west-northwest. The trough in the regional aquifer described above is located to the west of the MWL.
4.2 Regulatory Criteria
Historically, the NMED Hazardous Waste Bureau (HWB) has provided regulatory oversight of the MWL as Solid Waste Management Unit (SWMU) 76 under the Hazardous and Solid Waste Amendments module of the facility RCRA permit. The NMED confirmed that the MWL is properly designated as a SWMU (Dinwiddie June 1998) and, as such, must comply with the corrective action program defined in Title 20, New Mexico Administrative Code, Section 4.1.50, incorporating Title 40, Code of Federal Regulations (CFR), Section 264.101. The requirements for corrective action at the MWL, including those for groundwater monitoring, are established through the corrective measures process. The NMED issued the Order in April 2004, which transferred the regulatory authority for groundwater sampling at the MWL to the Order (NMED 2004). This report has been formatted to address the content criteria set forth in the Order for Periodic Monitoring Reports. Although radionuclides are being monitored and screened at the MWL, the information related to radionuclides is provided voluntarily by the DOE and Sandia. The voluntary inclusion of such radionuclide information shall not be enforceable and shall not constitute the basis for any enforcement because such information falls wholly outside the requirements imposed by the NMED, as specified in Section III.A of the Order (NMED 2004).
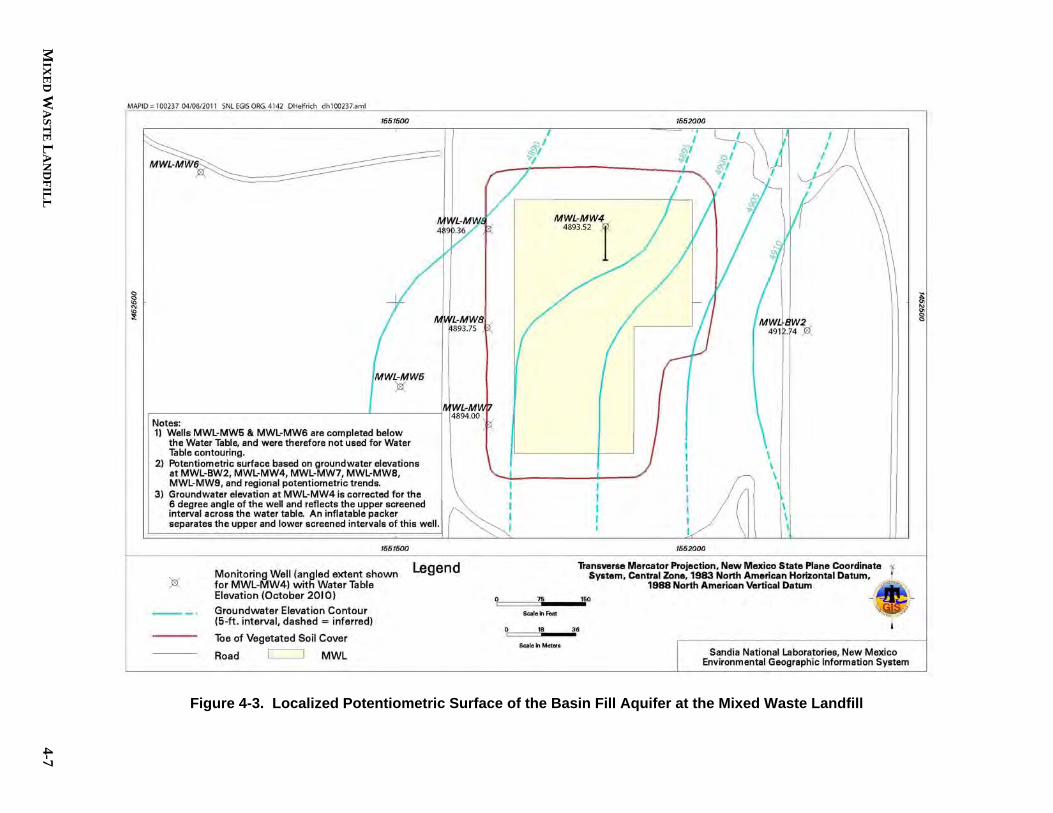
MIX
ED
WA
ST
E L
AN
DF
ILL
4-7
Figure 4-3. Localized Potentiometric Surface of the Basin Fill Aquifer at the Mixed Waste Landfill
4-8 ANNUAL GROUNDWATER MONITORING REPORT, CALENDAR YEAR 2010
4.3 Scope of Activities
Quarterly and annual groundwater sampling are summarized in Section 4.1.3 for CY 2010. As part of the toluene investigation discussed in Section 4.1.1, additional VOC samples were collected during the purging process at each well in April. The April VOC purging/sampling study results are presented in the MWL Toluene Investigation Report (SNL October 2010). The NMED DOE Oversight Bureau (OB) participated in all sampling events and received split samples that were submitted to a different laboratory for analysis. During April, the NMED DOE OB requested additional samples for low-level tritium analysis at each location except MWL-BW2. To ensure a consistent level of quality assurance for these analyses, SNL/NM personnel also collected samples for low-level tritium at these MWL monitoring wells. The NMED DOE OB split sampling results are presented in a separate report and not included in this report. Table 4-2 lists the analytical parameters and MWL wells sampled. The MWL groundwater samples were submitted for analysis to GEL Laboratories, Inc. (GEL) in Charleston, South Carolina, except for the low-level tritium samples that were sent to GEL in Richland, Washington. All groundwater sampling results are compared with U.S. Environmental Protection Agency (EPA) maximum contaminant levels (MCLs) for drinking water supplies (EPA 2001 and 2009). The analytical results are summarized in Attachment 4A, Tables 4A-1 through 4A-7. Field and laboratory quality control (QC) samples were prepared to determine the accuracy of the methods used and to detect inadvertent sample contamination that may have occurred during the sampling and analysis process. Field QC samples included environmental duplicate, equipment blank (EB), field blank (FB), and trip blank (TB) samples. Laboratory QC analyses performed included method blank, laboratory control sample, matrix spike, matrix spike duplicate, and surrogate spike analyses. Water quality parameters for groundwater temperature, specific conductance (SC), and pH were measured using a YSITM Model 620 Water Quality Meter during the purging process. Turbidity was measured with a HachTM Model 2100P portable turbidity meter. 4.4 Field Methods and Measurements Groundwater elevation and water quality field measurements were obtained during groundwater sampling activities. Field water quality parameters are presented in Table 4A-8 (Attachment 4A). Depth-to-groundwater measurements were obtained using a Solinst™ depth-to-water well sounder prior to purging activities. Depth-to-groundwater measurements were performed in accordance with the Field Operating Procedure (FOP), Long-Term Environmental Stewardship Groundwater Monitoring Well Sampling and Field Analytical Measurements, FOP 05-01 (SNL August 2007). Groundwater elevation measurements at the MWL monitoring wells from CY 2007 through CY 2010 are presented in Attachment 4B, Figure 4B-1. The October 2010 potentiometric surface for the regional aquifer beneath the MWL is shown in Figure 4-3.

MIXED WASTE LANDFILL 4-9
Table 4-2. Analytical Parameters at MWL Monitoring Wells for Each Sampling Period Analytical Parameter January April July
Total Metals TAL and Uranium
MWL–BW2, MWL–MW7,
MWL–MW7 (dup), MWL–MW8, and
MWL–MW9
MWL–BW2, MWL–BW2 (dup), MWL–MW4,
MWL–MW5, MWL–MW5 (dup), MWL–MW6,
MWL–MW7, MWL–MW8, and MWL–MW9
MWL–BW2, MWL–MW7, MWL–MW7 (dup), MWL–MW8, and
MWL–MW9 Volatile Organic Compounds
Semivolatile Organic Compounds MWL–MW7, MWL–MW8, and MWL–MW9 NA
Nitrate plus Nitrite (as nitrogen)
MWL–BW2, MWL–BW2 (dup), MWL–MW4,
MWL–MW5, MWL–MW5 (dup), MWL–MW6,
MWL–MW7, MWL–MW8, and MWL–MW9
MWL–BW2, MWL–MW7, MWL–MW7 (dup), MWL–MW8, and
MWL–MW9
Major Anions Bromide, Fluoride, Chloride,
and Sulfate Total Alkalinity as Calcium Carbonate Radionuclides Gamma-Emitting Radionuclides Gross Alpha Activity Gross Beta Activity Tritium Isotopic Uranium NA NA Radon-222 NA NA
Low-Level Tritium NA All wells except MWL–BW2
NA
NOTES: dup = Duplicate. MWL = Mixed Waste Landfill. NA = Not analyzed. TAL = Target Analyte List. A Bennett™ sampling system was used to collect the groundwater samples from all MWL monitoring wells. The pump intake was set near or at the bottom of the screened interval. The minimum flow rate, given limitations of equipment and well characteristics, was used for all purging and sampling activities. Minimum purge requirements for wells that do not produce one saturated casing volume of water before going dry are different; these monitoring wells were purged to dryness, allowed to recover, and then sampled to collect the most representative groundwater sample possible given the low yield of the wells. During CY 2010, monitoring wells MWL-MW4, MWL-MW8 and MWL-MW9 were purged to dryness prior to removing one saturated casing volume and obtaining one set of four stable water quality measurements. The wells were allowed to recover and then sampled in accordance with the Mini-Sampling and Analysis Plans (SAPs) (SNL January 2010b, April 2010, and July 2010). In accordance with procedures described in SNL/NM FOP 05-01 (SNL August 2007), all other wells were purged a minimum of one saturated casing volume (the volume of one length of the saturated screen plus the borehole annulus around the saturated screen interval). Purging continued until four stable water quality measurements for turbidity, pH, temperature, and SC were obtained from the well prior to the collection of groundwater samples. Groundwater stability is considered acceptable when measurements are equal to or within 10 percent of 5 nephelometric turbidity units, pH is within 0.1 units, temperature is within 1.0 degree Celsius, and SC is within 5 percent. Groundwater samples collected after the purging process were submitted to off-site laboratories (GEL) following analysis request/chain of custody protocol.

4-10 ANNUAL GROUNDWATER MONITORING REPORT, CALENDAR YEAR 2010
4.5 Analytical Methods
The analytical laboratory analyzed samples using EPA-approved analytical methods (EPA 1979 and 1986) and specified performance criteria in accordance with the SNL/NM Statement of Work for Analytical Laboratories (SNL May 2009b). Prior to each sampling event, the analytical laboratory provided appropriate sample containers prepared with the required sample preservative. Table 4-3 summarizes analytical parameters, EPA Methods (EPA 1986), container types, and holding times applicable to groundwater sampling at the MWL during CY 2010.
Table 4-3. MWL Analyses, Methods, Sample Containers, Preservatives, and Holding Times
Analysis Methoda Container Type/ Volume/Preservative Holding Time
Total Metals (TAL and Uranium) SW846-6020/7470A Polyethylene; 500 mL; HNO3; 4°C 28 days/180 daysb Volatile Organic Compounds SW846-8260B Glass; 3 x 40 mL; HCl; 4°C 14 days Semivolatile Organic Compounds SW846-8270 Amber Glass, 3 x 1 L; None; 4°C 7 days Nitrate plus Nitrite (as nitrogen) EPA 353.2 Polyethylene; 250 mL; H2SO4; 4°C 28 days Major Anions Total Alkalinity
EPA 353.2 SM2320B Polyethylene; 500 mL; None; 4°C 28 days Anions
14 days Alkalinity Gamma-Emitting Radionuclides EPA 901.1 Polyethylene; 1 L; HNO3 180 days Gross Alpha/Beta EPA 900.0 Polyethylene; 1 L; HNO3 180 days Tritium EPA 906.0 Amber Glass; 250 mL; None 180 days Isotopic Uranium HASL-300 Polyethylene; 1 L; None 180 days Radon-222 SM 7500-RnB Glass; 2 x 40 mL; None 4 days
Low-Level Tritium Liquid Scintillation Method Glass; 2 x 1 L; None 365 days
NOTES: aU.S. Environmental Protection Agency, 1979, Methods for Chemical Analysis of Water and Wastes, EPA-600/4-79-020, U.S. Environmental Protection Agency, Cincinnati, Ohio. U.S. Environmental Protection Agency, 1980, Prescribed Procedures for Measurement of Radioactivity in Drinking Water, EPA-600/4-80-032, U.S. Environmental Protection Agency, Cincinnati, Ohio U.S. Environmental Protection Agency, November 1986, Test Methods for Evaluating Solid, Physical/Chemical Methods, 3rd ed., (and updates), SW-846, Office of Solid Waste and Emergency Response, U.S. Environmental Protection Agency, Washington, D.C.; or Clesceri, Greenburg, and Eaton, 1998, Standard Methods for the Examination of Water and Wastewater, 20th ed., Method 2320B. U.S. Department of Energy, Environmental Measurements Laboratory, 1990, EML Procedures Manual, 27th ed., Vol. 1, Rev. 1992, HASL-300. Beckman, 1998, Standard Methods for the Examination of Water and Wastewater, 7500-Rn B Method, 20th ed., Beckman LS5000TD Liquid Scintillation System Operation Manual, May 1988. bHolding time for mercury is 28 days; all other metals are 180 days. °C = Degree(s) Celsius. EPA = U.S. Environmental Protection Agency. H2SO4 = Sulfuric acid. HCl = Hydrochloric acid. HNO3 = Nitric acid. L = Liter(s). mL = Milliliter(s). MWL = Mixed Waste Landfill. SM = Standard Method. TAL = Target Analyte List.
4.6 Summary of Analytical Results
The results for chemical, general chemistry, and radiological constituent analyses are presented in Attachment 4A, Tables 4A-1 through 4A-7. Field water quality measurements are presented in Attachment 4A, Table 4A-8. All results are compared with established EPA MCLs where applicable; no constituents were detected above established MCLs during CY 2010. Data qualifiers from the data validation process are presented with the associated results in the Attachment 4A tables. Data validation and QC sample results associated with each sampling event are discussed in Section 4.7.

MIXED WASTE LANDFILL 4-11
4.6.1 Volatile and Semivolatile Organic Compounds
Detected VOCs and SVOCs are presented in Attachment 4A, Table 4A-1. No VOCs or SVOCs were detected in any sample except for the VOCs toluene, chloromethane, and acetone. Toluene was detected in five January samples (one of which was a duplicate sample) including the sample from the background well MWL-BW2. Toluene concentrations ranged from 0.285 to 1.45 g/L. All detections were very low concentrations and, of the five sample results, three were below the practical quantitation limit (PQL) of 1.00 g/L. No toluene detections were reported for the April and July samples, including the April purging/sampling study samples (34 samples and 14 field QC samples; SNL October 2010). Chloromethane was detected in two samples below the PQL of 1.00 g/L, and acetone was detected below the PQL of 10.0 g/L. Neither constituent has an established MCL.
During the April groundwater sampling event, two detections of methylene chloride (MWL-MW5 primary and duplicate samples) and one detection of toluene were qualified as not detected during data validation due to associated laboratory method blank contamination (Section 4.7). Laboratory method detection limits (MDLs) for all VOCs and SVOCs are presented in Attachment 4A, Table 4A-2.
4.6.2 General Chemistry Parameters
The general chemistry analytical results are presented in Attachment 4A, Tables 4A-3 and 4A-4. No general chemistry parameters exceed established MCLs in the groundwater samples. The only two parameters that have established MCLs are NPN (as nitrogen) and fluoride (10 and 4 milligrams per liter [mg/L], respectively). Concentrations of NPN (as nitrogen) ranged from 0.900 mg/L in the July MWL-MW8 sample to 3.59 mg/L in the April MWL-MW7 sample. Fluoride was detected at concentrations ranging from 0.642 mg/L in the January MWL-BW2 sample to 1.05 mg/L in the April MWL-MW9 sample.
4.6.3 Metals
Metal analysis includes two sets of analyses and results, filtered and unfiltered. Groundwater samples obtained for total metal analyses are collected without filtering. Dissolved metal samples are collected by filtering the sample prior to analysis (SNL August 2007). The difference in concentrations between the total and dissolved fraction may be attributed to the original metallic ion content of the particles and any sorption of ions to the suspended particles. Table 4A-5 (Attachment 4A) summarizes the metal results, including total uranium, from all unfiltered groundwater samples collected during the CY 2010 groundwater monitoring events at the MWL. Samples were analyzed for TAL metals according to EPA Method 6020 (EPA 1986). No metals were detected in the unfiltered samples at concentrations that exceeded the established MCLs, and the results are consistent with those for previous sampling events at the MWL. Table 4A-6 (Attachment 4A) summarizes the metal results, including total uranium, for the filtered samples collected during the CY 2010 groundwater monitoring events. No detections of any metals in the filtered samples exceeded the respective MCLs, and the results are consistent with those for previous sampling events at the MWL.
4.6.4 Radiological Parameters
Groundwater samples from the MWL monitoring wells were screened for gamma-emitting radionuclides, gross alpha/beta activity, and tritium. The results for tritium, gross alpha/beta, gamma spectroscopy, and low-level tritium (April only) analyses are presented in Table 4A-7 (Attachment 4A) and are compared with the established EPA MCLs (no MCL has been established for tritium).

4-12 ANNUAL GROUNDWATER MONITORING REPORT, CALENDAR YEAR 2010
Gamma spectroscopy activity levels for short-list radionuclides are less than the associated minimum detectable activity (MDA). Potassium-40 in the January MWL-MW7 environmental sample was qualified as unusable during data validation as the laboratory rejected the result due to the peak not meeting identification criteria. The potassium-40 activity in the MWL-MW7 duplicate sample was less than the associated MDA. Radioisotopic analyses included gross alpha/beta activity and tritium analyses (all sampling events) and isotopic uranium and radon-222 (July). The gross alpha measurements were corrected for naturally occurring uranium activity according to 40 CFR Parts 9, 141, and 142, Table I-4. No gross alpha results exceeded the MCL of 15 picocuries per liter (pCi/L), and gross beta activity screening results did not exceed established limits. Isotopic uranium activities were below NMED HWB background concentrations. Radon-222 was reported below the NMED HWB background of 300 pCi/L in all groundwater samples, except the July sample from MWL-BW2 that had an activity of 494 ± 132 pCi/L. Tritium activity levels were below laboratory MDAs in all groundwater samples (i.e., tritium was not detected). However, as it is a COC at the MWL, the results are presented in Table 4A-7. All April low-level tritium results were reported as nondetections except for the MWL-MW6 sample result (1.22 pCi/L). This result was slightly higher than the PQL of 1.18 pCi/L, but was qualified as estimated during data validation.
4.6.5 Water Quality Parameters
The field water quality parameters represent readings measured immediately before sampling. The CY 2010 results for MWL wells are presented in Attachment 4A, Table 4A-8.
4.7 Quality Control Results
Field and laboratory QC samples were used to determine the accuracy of the methods used and to monitor for inadvertent sample contamination that can occur during the sampling and analysis process. All data were reviewed in accordance with AOP [Administrative Operating Procedure] 00-03, Data Validation Procedure for Chemical and Radiochemical Data (SNL July 2007). The results for each QC analysis and the impact on data quality are discussed in the following sections.
4.7.1 Field Quality Control Samples
The QC samples collected in the field included EB, TB, FB, and field duplicate samples. TB samples are submitted whenever samples are collected for VOC analysis to assess whether contamination of the samples occurred during shipment and storage. FB samples provide a check for potential ambient sources of sample contamination during the sampling process and/or sampling error. EB samples are collected to verify the effectiveness of the sampling equipment decontamination process, and duplicate samples are collected immediately after the environmental sample to provide information about sampling variability. The field QC samples were submitted for analysis along with the groundwater samples in accordance with the MWL Mini-SAPs (SNL January 2010b, April 2010, and July 2010). The following sections discuss the analytical results for each QC sample type.
4.7.1.1 Duplicate Environmental Samples
Duplicate groundwater samples were collected at MWL-MW7 (January and July) and MWL-BW2 and MWL-MW5 (April). Relative percent difference (RPD) calculations were performed for all detected chemical analytes for duplicate samples to measure sample variability.

MIXED WASTE LANDFILL 4-13
The MWL Mini-SAPs (SNL January 2010b, April 2010, and July 2010) do not specify QC acceptance criteria for duplicate sample data; however, duplicate sampling results show good correlation (low RPD values less than or equal to 20) for all calculated parameters, except aluminum, nickel, vanadium, and zinc. The RPD values for aluminum and vanadium were calculated at 58 and 90, respectively, for the unfiltered MWL-BW2 sample in April; the RPD for zinc was calculated at 44 in the filtered MWL-MW5 sample in April; and the RPD values for nickel and vanadium were calculated at 97 and 23, respectively, for the filtered MWL-MW7 sample in July. The RPD values for these metal parameters are considered estimated values, as reported concentrations are below associated PQLs.
4.7.1.2 Equipment Blank Samples
A total of seven EB samples were collected during the CY 2010 sampling events at the MWL to verify the equipment decontamination process. The EB sampling results are summarized in this section by sampling event. In January four EB samples were collected prior to sampling each monitoring well. The EB collected prior to sampling MWL-MW7 was submitted for all analytical parameters. EB samples associated with MWL-BW2, MWL-MW8, and MWL-MW9 were submitted for a limited set of parameters including VOCs, SVOCs, and metals. Various organic and inorganic parameters were detected in EB samples. No corrective action was required except for metals. Detected metals included aluminum, arsenic, barium, calcium, chromium, cobalt, copper, iron, lead, magnesium, manganese, nickel, potassium, sodium, and zinc. Metals in associated environmental samples detected at concentrations less than five times the EB result were qualified as not detected during data validation. The number of metals detected in the EB samples may be attributed to new stainless steel water lines installed inside the sampling truck prior to this sampling event as part of the toluene investigation (Section 4.1.1), deionized water quality, sampling equipment, and/or the analytical laboratory. In April two EB samples were collected prior to sampling monitoring wells MWL-BW2 and MWL-MW5 and submitted for all analyses. Various VOCs, chloride, alkalinity, calcium, chromium, cobalt, copper, iron, magnesium, manganese, sodium, and vanadium were detected in the EB samples. No corrective action was required for detected organic compounds as these compounds were not detected in associated environmental samples. No corrective action was required for chloride, alkalinity, calcium, chromium, iron, magnesium, manganese, or sodium because these parameters either were not detected in the associated environmental samples or were detected in the environmental sample at concentrations greater than five times the blank result. Filtered fractions of cobalt, copper, and vanadium, and unfiltered fractions of copper in associated environmental samples were detected at concentrations less than five times the EB result and were qualified as not detected during data validation. In July one EB sample was collected prior to sampling monitoring well MWL-MW7 and submitted for all analyses. Bromodichloromethane, chloroform, cadmium, calcium, cobalt, copper, iron, magnesium, zinc, and gross alpha were detected in the EB sample. No corrective action was required for bromodichloromethane, chloroform, cadmium, or zinc as these analytes were not detected in the associated environmental sample. No corrective action was required for calcium, cobalt, or magnesium because these parameters were detected in the environmental sample at concentrations greater than five times the blank result. The environmental sample results for copper, iron, and gross alpha were qualified as not detected during data validation as the results were less than five times the EB result.
4.7.1.3 Field Blank Samples
FB samples were collected at the various sampling locations, stored with the associated environmental samples throughout the sampling process, and returned to the laboratory for VOC analyses with the associated environmental samples to assess whether contamination of the samples resulted from ambient
4-14 ANNUAL GROUNDWATER MONITORING REPORT, CALENDAR YEAR 2010
field conditions. The FB samples are prepared by pouring deionized water into sample containers at the sampling point (i.e., in the sampling truck at the well location) to simulate the transfer of environmental samples from the sampling system to the sample container. Based on a recommendation presented in the MWL Toluene Investigation Report (SNL October 2010), an FB sample was collected for each MWL sampling location starting with the July sampling event. In January and April an FB sample was collected at MWL-MW9, and in July four FB samples were collected (MWL-BW2, MWL-MW7, MWL-MW8 and MWL-MW9). Bromodichloromethane, chloroform, and dibromochloromethane were detected in the FB samples. No corrective action was required as these compounds were not detected in the associated environmental samples.
4.7.1.4 Trip Blank Samples
TB samples consist of laboratory reagent grade water with hydrochloric acid preservative contained in 40-milliliter volatile organic analysis vials prepared by the analytical laboratory. These samples accompany the empty sample containers supplied by the laboratory and are brought to the field and accompany each VOC sample shipment. TB sample results are summarized in this section by sampling event. A total of seven TB samples were submitted with the January samples. No VOCs were detected above associated laboratory MDLs, except chloromethane. Chloromethane was detected in TB samples associated with three EB samples and the MWL-BW2 environmental sample. No corrective action was required as chloromethane was not detected in associated EB samples or the MWL-BW2 environmental sample.
A total of 10 TB samples were submitted with the April samples. No VOCs were detected above associated laboratory MDLs. During data validation, methylene chloride and toluene results were qualified as not detected in TB samples associated with MWL-MW5, MWL-MW8, and both EB samples due to associated laboratory method blank contamination. A total of five TB samples were submitted with the July 2010 samples. No VOCs were detected above associated laboratory MDLs.
4.7.2 Laboratory Quality Control Samples
Internal laboratory QC samples, including method blanks and duplicate laboratory control samples, were analyzed concurrently with the groundwater samples. Additionally, batch matrix spike, matrix spike duplicate, and surrogate spike samples were analyzed. All environmental sample, field QC sample, and laboratory QC sample results were reviewed and qualified in accordance with AOP 00-03, Data Validation Procedure for Chemical and Radiochemical Data (SNL July 2007). Although some analytical results were qualified as not detected or as estimated values during the data validation process, no significant data quality problems were noted for any CY 2010 MWL groundwater monitoring samples. The most significant issue involved the potassium-40 isotope result for the January MWL-MW7 environmental sample, which was qualified as unusable during data validation because the peak did not meet identification criteria. Corrective action was not initiated as potassium-40 is not a primary COC at the MWL, and the result for the corresponding duplicate sample was nondetect. Data validation reports and findings associated with MWL groundwater monitoring are filed in the SNL/NM Customer Funded Records Center.

MIXED WASTE LANDFILL 4-15
4.8 Variances and Nonconformances
All analytical and field methods were performed according to the requirements specified in the MWL groundwater monitoring Mini-SAPs for Fiscal Year 2010 (SNL January 2010b, April 2010, and July 2010), and there were no variances from the plans. As addressed in Section 4.7, various parameters have been detected in field QC samples since SNL/NM changed suppliers for deionized water. In particular, various metals and the VOCs bromodichloromethane, chloroform, and dibromochloromethane continue to be detected in the FB samples. DOE and Sandia continue to test and investigate the quality of deionized water currently in use and will make adjustments as necessary.
4.9 Summary and Conclusions
Groundwater sampling and analysis were conducted at the MWL during three quarters in 2010 according to the Mini-SAPs generated for each sampling event (SNL January 2010b, April 2010, and July 2010). No organic, inorganic, general chemistry, or radiological constituents were detected at concentrations/activities that exceed the respective established MCLs (where applicable) in the groundwater samples. The groundwater monitoring results for the CY 2010 sampling events are consistent with data from previous sampling events, within the range of historical MWL groundwater data, and indicate the MWL has not impacted groundwater beneath the site. The field and laboratory QC sample and data validation results indicate that the CY 2010 groundwater monitoring data are defensible and representative. Toluene was detected at very low concentrations in all the groundwater samples in January, but was not detected in any of the samples collected in April and July. The only toluene concentrations detected in the April groundwater and field QC samples, including some of the samples associated with the toluene investigation purging/sampling study, were related to contamination introduced into the samples during the analytical process at the off-site laboratory.
4.10 References
Bearzi January 2011 Bearzi, J.P. (New Mexico Environment Department), January 2011. Letter to P. Wagner (U.S. Department of Energy) and J. Hruby (Sandia Corporation), Notice of Approval, Mixed Waste Landfill Toluene Investigation Report, Revised October 2010, Sandia National Laboratories, EPA ID No. NM5890110518, HWB-SNL-10-011, New Mexico Environment Department Hazardous Waste Bureau, Santa Fe, New Mexico, January 13, 2011.
Bearzi September 2010 Bearzi, J.P. (New Mexico Environment Department), September 2010. Letter
to P. Wagner (U.S. Department of Energy) and M. Walck (Sandia Corporation), Notice of Disapproval, Mixed Waste Landfill Toluene Investigation Report, August 2010, New Mexico Environment Department Hazardous Waste Bureau, Santa Fe, New Mexico, September 30, 2010.
Bearzi April 2010 Bearzi, J.P. (New Mexico Environment Department), April 2010. Letter to P.
Wagner (U.S. Department of Energy) and M. Walck (Sandia Corporation), Toluene Detections in Groundwater, Sandia National Laboratories Mixed Waste Landfill, New Mexico Environment Department Hazardous Waste Bureau, Santa Fe, New Mexico, April 30, 2010.

4-16 ANNUAL GROUNDWATER MONITORING REPORT, CALENDAR YEAR 2010
Bearzi January 2009 Bearzi, J.P. (New Mexico Environment Department), January 2009. Letter to K. Davis (U.S. Department of Energy) and F. Nimick (Sandia Corporation), Notice of Approval: Summary Report for the Mixed Waste Landfill Monitoring Well Plug and Abandonment and Installation – Decommissioning of Groundwater Monitoring Wells MWL-MW1, MWL-MW2, and MWL-MW3, Installation of Groundwater Monitoring Wells MWL-MW7, MWL-MW8, and MWL-MW9, September, 2008, Sandia National Laboratories EPA ID#NM5890110518, HWB-SNL-08-020, January 15, 2009.
Bearzi December 2008 Bearzi, J.P. (New Mexico Environment Department), December 2008. Letter
to K. Davis (U.S. Department of Energy) and F. Nimick (Sandia Corporation), Conditional Approval, Mixed Waste Landfill Corrective Measures Implementation Plan, November 2005, Sandia National Laboratories NM5890110518, SNL-05-025, December 22, 2008.
Bearzi October 2008 Bearzi, J.P. (New Mexico Environment Department), October 2008. Letter to
P. Wagner (U.S. Department of Energy) and F. Nimick (Sandia Corporation), Notice of Approval: Summary Report for the Mixed Waste Landfill Monitoring Well Plug and Abandonment and Installation – Decommissioning of Groundwater Monitoring Well MWL-BW-1, Installation of Groundwater Monitoring Well MWL-BW2, April, 2008, Sandia National Laboratories EPA ID#NM5890110518, HWB-SNL-08-015, October 31, 2008.
Dinwiddie June 1998 Dinwiddie, R.S. (New Mexico Environment Department), June 1998. Letter
to M.J. Zamorski (U.S. Department of Energy), Mixed Waste Landfill: Regulatory Status, SNL/KAFB, June 11, 1998.
EPA 2009 U.S. Environmental Protection Agency (EPA), 2009. National Primary
Drinking Water Regulations, EPA 816-F 09-004, U.S. Environmental Protection Agency, Washington, D.C.
EPA 2001 U.S. Environmental Protection Agency (EPA), 2001. National Primary
Drinking Water Regulations, Title 40, Code of Federal Regulations, Part 141, Subpart B, Office of Water, U.S. Environmental Protection Agency, Washington, D.C.
EPA 1986 U.S. Environmental Protection Agency (EPA), November 1986. Test
Methods for Evaluating Solid Waste,” SW-846, 3rd ed., and all updates, Office of Solid Waste and Emergency Response, U.S. Environmental Protection Agency, Washington, D.C.
EPA 1979 U.S. Environmental Protection Agency (EPA), 1979. Methods for Chemical
Analysis of Water and Wastes, EPA-600/4-79-020, U.S. Environmental Protection Agency, Cincinnati, Ohio.
Goering et al. 2002 Goering, T.J., G.M. Haggerty, D. Van Hart, and J.L. Peace, 2002. Mixed
Waste Landfill Groundwater Report, 1990 through 2001, Sandia National Laboratories, Albuquerque, New Mexico, SAND2002-4098, Sandia National Laboratories, Albuquerque, New Mexico.

MIXED WASTE LANDFILL 4-17
Kues 1987 Kues, G.E., 1987, Groundwater Level Data for Albuquerque-Belen Basin, New Mexico, through Water Level Year 1985, USGS Open File Report 87-1 16, U.S. Geological Survey, Albuquerque, New Mexico.
Lyon and Goering 2006 Lyon, M.L., and T.J. Goering, January 2006. Mixed Waste Landfill Annual
Groundwater Monitoring Report, April 2005, SAND2006-0391, Sandia National Laboratories, Albuquerque, New Mexico.
NMED May 2005 New Mexico Environment Department (NMED), May 2005. Final Order,
State of New Mexico Before the Secretary of the Environment in the Matter of Request for a Class 3 Permit Modification for Corrective Measures for the Mixed Waste Landfill, Sandia National Laboratories, Bernalillo County, New Mexico, EPA ID #5890110518, New Mexico Environment Department, Santa Fe, New Mexico, May 26, 2005.
NMED 2004 New Mexico Environment Department (NMED), 2004. Compliance Order
on Consent Pursuant to the New Mexico Hazardous Waste Act 74-4-10: Sandia National Laboratories Consent Order, New Mexico Environment Department, Santa Fe, New Mexico, April 29, 2004.
Peace et al. 2002 Peace, J.L., T.J. Goering, and M.D. McVey, 2002. Report of the Mixed Waste
Landfill Phase 2 RCRA Facility Investigation, Sandia National Laboratories, Albuquerque, New Mexico, SAND Report SAND2002-2997, prepared by Sandia National Laboratories, Albuquerque, New Mexico for the U.S. Department of Energy under Contract DE-AC04-94AL85000, September.
Reeder et al. 1967 Reeder, H.O., L.J. Bjorklund, and G.A. Dinwiddie, 1967, Quantitative
Analysis of Water Resources in the Albuquerque Area, New Mexico: Computed Effects on the Rio Grande of Pumpage of Groundwater, 1960-2000, New Mexico State Engineer Report 33, Santa Fe, New Mexico.
SNL July 2011 Sandia National Laboratories, New Mexico (SNL/NM), July 2011. Mixed
Waste Landfill Annual Groundwater Monitoring Report, Calendar Year 2010, Environmental Restoration Operations, Sandia National Laboratories, Albuquerque, New Mexico, in preparation.
SNL October 2010 Sandia National Laboratories, New Mexico (SNL/NM), October 2010. Mixed
Waste Landfill Toluene Investigation Report, Environmental Restoration Project, Sandia National Laboratories, Albuquerque, New Mexico.
SNL July 2010 Sandia National Laboratories, New Mexico (SNL/NM), July 2010. Mixed
Waste Landfill Groundwater Monitoring, Mini-SAP for FY10, 4th Quarter Sampling, July 2010, Environmental Restoration Project, Sandia National Laboratories, Albuquerque, New Mexico.
SNL June 2010 Sandia National Laboratories, New Mexico (SNL/NM), June 2009. Mixed
Waste Landfill Annual Groundwater Monitoring Report, Calendar Year 2009, Environmental Restoration Project, Sandia National Laboratories, Albuquerque, New Mexico.

4-18 ANNUAL GROUNDWATER MONITORING REPORT, CALENDAR YEAR 2010
SNL April 2010 Sandia National Laboratories, New Mexico (SNL/NM), April 2010. Mixed Waste Landfill Groundwater Monitoring, Mini-SAP for FY10 3rd Quarter Sampling, April 2010, Environmental Restoration Project, Sandia National Laboratories, Albuquerque, New Mexico.
SNL January 2010a Sandia National Laboratories, New Mexico (SNL/NM), January 2010. Mixed
Waste Landfill Corrective Measures Implementation Report, Environmental Restoration Project, Sandia National Laboratories, New Mexico.
SNL January 2010b Sandia National Laboratories, New Mexico (SNL/NM), January 2010. Mixed
Waste Landfill Groundwater Monitoring Mini-SAP for FY10, 2nd Quarter Sampling, January 2010, Sandia National Laboratories, New Mexico Environmental Restoration Project.
SNL May 2009a Sandia National Laboratories, New Mexico (SNL/NM), May 2009. Mixed
Waste Landfill Annual Groundwater Monitoring Report, Calendar Year 2008, Environmental Restoration Project, Sandia National Laboratories, Albuquerque, New Mexico.
SNL May 2009b Sandia National Laboratories/New Mexico (SNL/NM), May 2009. SNL/NM
Statement of Work for Analytical Laboratories, Revision 4, Sandia National Laboratories, Albuquerque, New Mexico.
SNL September 2008 Sandia National Laboratories/New Mexico (SNL/NM), September 2008.
Summary Report for Mixed Waste Landfill Monitoring Well Plug and Abandonment and Installation: Decommissioning of Groundwater Monitoring Wells MWL-MW1, MWL-MW2, and MWL-MW3; Installation of Groundwater Monitoring Wells MWL-MW7, MWL-MW8, and MWL-MW9, Environmental Restoration Project, Sandia National Laboratories, Albuquerque, New Mexico.
SNL April 2008 Sandia National Laboratories/New Mexico (SNL/NM), April 2008. Summary
Report for Mixed Waste Landfill Monitoring Well Plug and Abandonment and Installation: Decommissioning of Groundwater Monitoring Well MWL-BW1; Installation of Groundwater Monitoring Well MWL-BW2, Environmental Restoration Project, Sandia National Laboratories, Albuquerque, New Mexico.
SNL January 2008 Sandia National Laboratories/New Mexico (SNL/NM), January 2008. Mixed
Waste Landfill Annual Groundwater Monitoring Report, Spring 2007 Sampling Event, Environmental Restoration Project, Sandia National Laboratories, Albuquerque, New Mexico.
SNL August 2007 Sandia National Laboratories/New Mexico (SNL/NM), August 2007. Long-
Term Environmental Stewardship (LTES) Groundwater Monitoring Well Sampling and Field Analytical Measurements, FOP 05-01, Revision 00, Sandia National Laboratories, Albuquerque, New Mexico.

MIXED WASTE LANDFILL 4-19
SNL July 2007 Sandia National Laboratories, New Mexico (SNL/NM), July 2007. Data Validation Procedure for Chemical and Radiochemical Data, AOP 00-03, Revision 2, Sample Management Office, Sandia National Laboratories, Albuquerque, New Mexico, July 16, 2007.
SNL November 2006 Sandia National Laboratories/New Mexico (SNL/NM), November 2006.
Mixed Waste Landfill Annual Groundwater Monitoring Report, April 2006 Sampling Event, Sandia National Laboratories/New Mexico, prepared by Shaw Environmental, Inc. for Environmental Restoration Project, Sandia National Laboratories, Albuquerque, New Mexico.
SNL November 2005 Sandia National Laboratories/New Mexico (SNL/NM), November 2005.
Mixed Waste Landfill Corrective Measures Implementation Plan, Environmental Restoration Project, Sandia National Laboratories, Albuquerque, New Mexico.
SNL July 2004 Sandia National Laboratories/New Mexico (SNL/NM), July 2004. Mixed
Waste Landfill Annual Groundwater Monitoring Report, April 2004, Environmental Restoration Project, Sandia National Laboratories, Albuquerque, New Mexico.
SNL September 2003 Sandia National Laboratories/New Mexico (SNL/NM), September 2003.
Mixed Waste Landfill Annual Groundwater Monitoring Report, April 2003, Addendum – Cadmium Verification Sampling, September 2003, Environmental Restoration Project, Sandia National Laboratories, Albuquerque, New Mexico.
SNL June 2003 Sandia National Laboratories/New Mexico (SNL/NM), June 2003. Mixed
Waste Landfill Annual Groundwater Monitoring Report, April 2003, Environmental Restoration Project, Sandia National Laboratories, Albuquerque, New Mexico.
SNL May 2003 Sandia National Laboratories/New Mexico (SNL/NM), May 2003. Mixed
Waste Landfill Corrective Measures Study, Environmental Restoration Project, Sandia National Laboratories, Albuquerque, New Mexico, May 21, 2003.
SNL October 2002 Sandia National Laboratories/New Mexico (SNL/NM), October 2002. Mixed
Waste Landfill Quarterly Groundwater Monitoring Report, MWL-MW5 and MWL-MW6, October 2002, Environmental Restoration Project, Sandia National Laboratories, Albuquerque, New Mexico.
SNL July 2002 Sandia National Laboratories/New Mexico (SNL/NM), July 2002. Mixed
Waste Landfill Quarterly Groundwater Monitoring Report, MWL-MW5 and MWL-MW6, July 2002, Environmental Restoration Project, Sandia National Laboratories, Albuquerque, New Mexico.

4-20 ANNUAL GROUNDWATER MONITORING REPORT, CALENDAR YEAR 2010
SNL January 2002 Sandia National Laboratories/New Mexico (SNL/NM), January 2002. Mixed Waste Landfill Quarterly Groundwater Monitoring Report, MWL-MW4, MWL-MW5 and MWL-MW6, January 2002, Environmental Restoration Project, Sandia National Laboratories, Albuquerque, New Mexico.
SNL December 2001a Sandia National Laboratories/New Mexico (SNL/NM), December 2001.
Mixed Waste Landfill Corrective Measures Study Workplan, Environmental Restoration Project, Sandia National Laboratories, Albuquerque, New Mexico.
SNL December 2001b Sandia National Laboratories/New Mexico (SNL/NM), December 2001.
Mixed Waste Landfill Quarterly Groundwater Monitoring Report for Monitoring Wells MWL-MW5 and MWL-MW6, July 2001, Sandia National Laboratories/New Mexico, prepared by IT Corporation for Environmental Restoration Project, Sandia National Laboratories, Albuquerque, New Mexico.
SNL September 1990 Sandia National Laboratories/New Mexico (SNL/NM), September 1990.
Report of the Phase 1 RCRA Facility Investigation of the Mixed Waste Landfill, Environmental Impact and Restoration Division, Sandia National Laboratories, Albuquerque, New Mexico.
Wagner October 2010 Wagner, P. (U.S. Department of Energy), October 2010. Letter to J.P. Bearzi
(New Mexico Environment Department), Response to September 28, 2010 New Mexico Environment Department Comments on the Mixed Waste Landfill (MWL) Toluene Investigation Report, Sandia National Laboratories, Albuquerque, New Mexico, October 14, 2010.

MIXED WASTE LANDFILL 4A-1
Attachment 4A Mixed Waste Landfill
Analytical Results Tables

4A-2 ANNUAL GROUNDWATER MONITORING REPORT, CALENDAR YEAR 2010
This page intentionally left blank.
MIXED WASTE LANDFILL 4A-3
Attachment 4A Tables 4A-1 Summary of Detected Volatile and Semivolatile Organic Compounds, Mixed
Waste Landfill Groundwater Monitoring, Sandia National Laboratories/New Mexico, Calendar Year 2010 ........................................................................................ 4A-5
4A-2 Method Detection Limits for Volatile and Semivolatile Organic Compounds,
Mixed Waste Landfill Groundwater Monitoring, Sandia National Laboratories/New Mexico, Calendar Year 2010 .......................................................... 4A-6
4A-3 Summary of Nitrate plus Nitrite Results, Mixed Waste Landfill Groundwater
Monitoring, Sandia National Laboratories/New Mexico, Calendar Year 2010 ............ 4A-7 4A-4 Summary of Alkalinity and Anion Results, Mixed Waste Landfill Groundwater
Monitoring, Sandia National Laboratories/New Mexico, Calendar Year 2010 ............ 4A-9 4A-5 Summary of Total Metal Results (Unfiltered), Mixed Waste Landfill
Groundwater Monitoring, Sandia National Laboratories/New Mexico, Calendar Year 2010 .................................................................................................................... 4A-12
4A-6 Summary of Total Metal Results (Filtered), Mixed Waste Landfill
Groundwater Monitoring, Sandia National Laboratories/New Mexico, Calendar Year 2010 .................................................................................................................... 4A-31
4A-7 Summary of Tritium, Gross Alpha, Gross Beta, Gamma Spectroscopy, Isotopic
Uranium, and Radon-222 Results, Mixed Waste Landfill Groundwater Monitoring, Sandia National Laboratories/New Mexico, Calendar Year 2010 .......... 4A-50
4A-8 Summary of Field Water Quality Measurementsi, Mixed Waste Landfill
Groundwater Monitoring, Sandia National Laboratories/New Mexico, Calendar Year 2010 .................................................................................................................... 4A-55
Footnotes for Mixed Waste Landfill Groundwater Monitoring ............................................................ 4A-57
4A-4 ANNUAL GROUNDWATER MONITORING REPORT, CALENDAR YEAR 2010
This page intentionally left blank.

MIX
ED
WA
ST
E L
AN
DF
ILL
4A-5
Table 4A-1 Summary of Detected Volatile and Semivolatile Organic Compounds,
Mixed Waste Landfill Groundwater Monitoring, Sandia National Laboratories/New Mexico
Calendar Year 2010
Well ID Analyte Resulta (g/L)
MDLb (g/L)
PQLc (g/L)
MCLd (g/L)
Laboratory Qualifierf
Validation Qualifierg Sample No. Analytical
Methodh MWL-BW2 04-Jan-10 Toluene 0.438 0.250 1.00 1000 J 087998-001 SW846-8260B
MWL-MW7 05-Jan-10 Toluene 0.320 0.250 1.00 1000 J 088002-001 SW846-8260B
MWL-MW7 (Duplicate) 05-Jan-10 Toluene 0.285 0.250 1.00 1000 J 088003-001 SW846-8260B
MWL-MW8 Chloromethane 0.338 0.300 1.00 NE J 088007-001 SW846-8260B06-Jan-10 Toluene 1.45 0.250 1.00 1000 088007-001 SW846-8260BMWL-MW9 07-Jan-10 Toluene 1.10 0.250 1.00 1000 088011-001 SW846-8260B
MWL-MW5 20-Apr-10 Methylene Chloride 3.95 3.00 10.0 5.00 B, J 10.0U 088918-001 SW846-8260B
MWL-MW5 (Duplicate) 20-Apr-10 Methylene Chloride 3.95 3.00 10.0 5.00 B, J 10.0U 088919-001 SW846-8260B
MWL-MW6 19-Apr-10 Acetone 7.91 3.50 10.0 NE J 088909-001 SW846-8260B
MWL-MW8 26-Apr-10 Toluene 0.260 0.250 1.00 1000 B, J 1.0U 088934-001 SW846-8260B
MWL-MW8 12-Jul-10 Chloromethane 0.370 0.300 1.00 NE J 089411-001 SW846-8260B
Refer to footnotes on page 4A-57.

4A-6
AN
NU
AL
GR
OU
ND
WA
TE
R M
ON
ITO
RIN
G R
EP
OR
T, CA
LE
ND
AR
YE
AR
2010
Table 4A-2 Method Detection Limits for Volatile and Semivolatile Organic Compounds,
Mixed Waste Landfill Groundwater Monitoring, Sandia National Laboratories/New Mexico
Calendar Year 2010
Analyte MDLb (g/L)
Analytical Methodg Analyte MDLb
(g/L) Analytical Methodg Analyte MDLb
(g/L) Analytical Methodg
1,1,1-Trichloroethane 0.325 8260 1,2,4-Trichlorobenzene 2.00 - 2.38 8270 Di-n-butyl phthalate 2.00 - 2.38 8270 1,1,2,2-Tetrachloroethane 0.250 8260 1,2-Dichlorobenzene 2.00 - 2.38 8270 Di-n-octyl phthalate 3.00 - 3.57 8270 1,1,2-Trichloroethane 0.250 8260 1,3-Dichlorobenzene 2.00 - 2.38 8270 Dibenz[a,h]anthracene 0.200 - 0.238 8270 1,1-Dichloroethane 0.300 8260 1,4-Dichlorobenzene 2.00 - 2.38 8270 Dibenzofuran 2.00 - 2.38 8270 1,1-Dichloroethene 0.300 8260 2,4,5-Trichlorophenol 2.00 - 2.38 8270 Diethylphthalate 2.00 - 2.38 8270 1,2-Dichloroethane 0.250 8260 2,4,6-Trichlorophenol 2.00 - 2.38 8270 Dimethylphthalate 2.00 - 2.38 8270 1,2-Dichloropropane 0.250 8260 2,4-Dichlorophenol 2.00 - 2.38 8270 Dinitro-o-cresol 3.00 - 3.57 8270 2-Butanone 1.25 8260 2,4-Dimethylphenol 2.00 - 2.38 8270 Diphenyl amine 3.00 - 3.57 8270 2-Hexanone 1.25 8260 2,4-Dinitrophenol 5.00 - 5.95 8270 Fluoranthene 0.200 - 0.238 8270 4-methyl-, 2-Pentanone 1.25 8260 2,4-Dinitrotoluene 2.00 - 2.38 8270 Fluorene 0.200 - 0.238 8270 Acetone 3.50 8260 2,6-Dinitrotoluene 2.00 - 2.38 8270 Hexachlorobenzene 2.00 - 2.38 8270 Benzene 0.300 8260 2-Chloronaphthalene 0.300 - 0.357 8270 Hexachlorobutadiene 2.00 - 2.38 8270 Bromodichloromethane 0.250 8260 2-Chlorophenol 2.00 - 2.38 8270 Hexachlorocyclopentadiene 3.00 - 3.57 8270 Bromoform 0.250 8260 2-Methylnaphthalene 0.300 - 0.357 8270 Hexachloroethane 2.00 - 2.38 8270 Bromomethane 0.300 8260 2-Nitroaniline 2.00 - 2.38 8270 Indeno(1,2,3-c,d)pyrene 0.200 - 0.238 8270 Carbon disulfide 1.25 8260 2-Nitrophenol 2.00 - 2.38 8270 Isophorone 3.00 - 3.57 8270 Carbon tetrachloride 0.300 8260 3,3'-Dichlorobenzidine 2.00 - 2.38 8270 Naphthalene 0.300 - 0.357 8270 Chlorobenzene 0.250 8260 3-Nitroaniline 2.00 - 2.38 8270 Nitro-benzene 3.00 - 3.57 8270 Chloroethane 0.300 8260 4-Bromophenyl phenyl ether 2.00 - 2.38 8270 Pentachlorophenol 2.00 - 2.38 8270 Chloroform 0.250 8260 4-Chloro-3-methylphenol 2.00 - 2.38 8270 Phenanthrene 0.200 - 0.238 8270 Chloromethane 0.300 8260 4-Chlorobenzenamine 2.00 - 2.38 8270 Phenol 1.00 - 1.19 8270 Dibromochloromethane 0.300 8260 4-Chlorophenyl phenyl ether 2.00 - 2.38 8270 Pyrene 0.300 - 0.357 8270 Ethyl benzene 0.250 8260 4-Nitroaniline 3.00 - 3.57 8270 bis(2-Chloroethoxy)methane 3.00 - 3.57 8270 Methylene chloride 3.00 8260 4-Nitrophenol 2.00 - 2.38 8270 bis(2-Chloroethyl)ether 2.00 - 2.38 8270 Styrene 0.250 8260 Acenaphthene 0.310 - 0.369 8270 bis(2-Ethylhexyl)phthalate 2.00 - 2.38 8270 Tetrachloroethene 0.300 8260 Acenaphthylene 0.200 - 0.238 8270 bis-Chloroisopropyl ether 2.00 - 2.38 8270 Toluene 0.250 8260 Anthracene 0.200 - 0.238 8270 m,p-Cresol 3.00 - 3.57 8270 Trichloroethene 0.250 8260 Benzo(a)anthracene 0.200 - 0.238 8270 n-Nitrosodipropylamine 2.00 - 2.38 8270 Vinyl acetate 1.50 8260 Benzo(a)pyrene 0.200 - 0.238 8270 o-Cresol 2.00 - 2.38 8270 Vinyl chloride 0.500 8260 Benzo(b)fluoranthene 0.200 - 0.238 8270
Xylene 0.300 8260 Benzo(ghi)perylene 0.200 - 0.238 8270 cis-1,2-Dichloroethene 0.300 8260 Benzo(k)fluoranthene 0.200 - 0.238 8270 cis-1,3-Dichloropropene 0.250 8260 Butylbenzyl phthalate 2.00 - 2.38 8270 trans-1,2-Dichloroethene 0.300 8260 Carbazole 0.200 - 0.238 8270 trans-1,3-Dichloropropene 0.250 8260 Chrysene 0.200 - 0.238 8270
Refer to footnotes on page 4A-57.

MIX
ED
WA
ST
E L
AN
DF
ILL
4A-7
Table 4A-3 Summary of Nitrate plus Nitrite Results,
Mixed Waste Landfill Groundwater Monitoring, Sandia National Laboratories/New Mexico
Calendar Year 2010
Well ID Analyte Resulta (mg/L)
MDLb (mg/L)
PQLc (mg/L)
MCLd (mg/L)
Laboratory Qualifierf
Validation Qualifierg Sample No. Analytical
Methodh MWL-BW2 04-Jan-10 Nitrate plus nitrite as N 2.20 0.100 0.500 10.0 087998-018 EPA 353.2
MWL-MW7 05-Jan-10 Nitrate plus nitrite as N 3.41 0.100 0.500 10.0 088002-018 EPA 353.2
MWL-MW7 (Duplicate) 05-Jan-10 Nitrate plus nitrite as N 3.29 0.100 0.500 10.0 088003-018 EPA 353.2
MWL-MW8 06-Jan-10 Nitrate plus nitrite as N 1.07 0.050 0.250 10.0 088007-018 EPA 353.2
MWL-MW9 07-Jan-10 Nitrate plus nitrite as N 2.12 0.100 0.500 10.0 088011-018 EPA 353.2
MWL-BW2 27-Apr-10 Nitrate plus nitrite as N 2.38 0.100 0.500 10.0 B 088942-018 EPA 353.2
MWL-BW2 (Duplicate) 27-Apr-10 Nitrate plus nitrite as N 2.30 0.050 0.250 10.0 B 088943-018 EPA 353.2
MWL-MW4 29-Apr-10 Nitrate plus nitrite as N 2.43 0.100 0.500 10.0 B 088949-018 EPA 353.2
MWL-MW5 20-Apr-10 Nitrate plus nitrite as N 1.45 0.050 0.250 10.0 B 088918-018 EPA 353.2
MWL-MW5 (Duplicate) 20-Apr-10 Nitrate plus nitrite as N 1.55 0.050 0.250 10.0 B 088919-018 EPA 353.2
MWL-MW6 19-Apr-10 Nitrate plus nitrite as N 1.89 0.100 0.500 10.0 B 088909-018 EPA 353.2
MWL-MW7 22-Apr-10 Nitrate plus nitrite as N 3.59 0.100 0.500 10.0 B 088929-018 EPA 353.2
MWL-MW8 26-Apr-10 Nitrate plus nitrite as N 1.32 0.050 0.250 10.0 B 088934-018 EPA 353.2
MWL-MW9 21-Apr-10 Nitrate plus nitrite as N 2.33 0.100 0.500 10.0 B 088924-018 EPA 353.2
MWL-BW2 06-Jul-10 Nitrate plus nitrite as N 2.03 0.100 0.500 10.0 089402-018 EPA 353.2
MWL-MW7 07-Jul-10 Nitrate plus nitrite as N 3.11 0.100 0.500 10.0 089407-018 EPA 353.2
MWL-MW7 (Duplicate) 07-Jul-10 Nitrate plus nitrite as N 3.11 0.050 0.250 10.0 089408-018 EPA 353.2
Refer to footnotes on page 4A-57.

4A-8
AN
NU
AL
GR
OU
ND
WA
TE
R M
ON
ITO
RIN
G R
EP
OR
T, CA
LE
ND
AR
YE
AR
2010
Table 4A-3 (Concluded) Summary of Nitrate plus Nitrite Results,
Mixed Waste Landfill Groundwater Monitoring, Sandia National Laboratories/New Mexico
Calendar Year 2010
Well ID Analyte Resulta (mg/L)
MDLb (mg/L)
PQLc (mg/L)
MCLd (mg/L)
Laboratory Qualifierf
Validation Qualifierg Sample No. Analytical
Methodh MWL-MW8 12-Jul-10 Nitrate plus nitrite as N 0.900 0.050 0.250 10.0 B 089411-018 EPA 353.2
MWL-MW9 13-Jul-10 Nitrate plus nitrite as N 2.41 0.100 0.500 10.0 B 089414-018 EPA 353.2
Refer to footnotes on page 4A-57.

MIX
ED
WA
ST
E L
AN
DF
ILL
4A-9
Table 4A-4 Summary of Alkalinity and Anion Results,
Mixed Waste Landfill Groundwater Monitoring, Sandia National Laboratories/New Mexico
Calendar Year 2010
Well ID Analyte Resulta (mg/L)
MDLb (mg/L)
PQLc (mg/L)
MCLd (mg/L)
Laboratory Qualifierf
Validation Qualifierg Sample No. Analytical
Methodh MWL-BW2 Alkalinity, total as CaCO3 236 0.725 1.00 NE 087998-016 SM 2320B 04-Jan-10 Bromide 0.361 0.066 0.200 NE 087998-016 SW846 9056 Chloride 67.3 0.660 2.00 NE 087998-016 SW846 9056 Fluoride 0.642 0.033 0.100 4.0 087998-016 SW846 9056 Sulfate 46.5 1.00 4.00 NE 087998-016 SW846 9056 MWL-MW7 Alkalinity, total as CaCO3 207 0.725 1.00 NE 088002-016 SM 2320B 05-Jan-10 Bromide 0.294 0.066 0.200 NE 088002-016 SW846 9056 Chloride 40.2 0.660 2.00 NE 088002-016 SW846 9056 Fluoride 0.903 0.033 0.100 4.0 088002-016 SW846 9056 Sulfate 36.8 0.100 0.400 NE 088002-016 SW846 9056 MWL-MW7 (Duplicate) Alkalinity, total as CaCO3 206 0.725 1.00 NE 088003-016 SM 2320B 05-Jan-10 Bromide 0.278 0.066 0.200 NE 088003-016 SW846 9056 Chloride 40.4 0.660 2.00 NE 088003-016 SW846 9056 Fluoride 0.971 0.033 0.100 4.0 088003-016 SW846 9056 Sulfate 36.8 0.100 0.400 NE 088003-016 SW846 9056 MWL-MW8 Alkalinity, total as CaCO3 217 0.725 1.00 NE 088007-016 SM 2320B 06-Jan-10 Bromide 0.325 0.066 0.200 NE 088007-016 SW846 9056 Chloride 48.7 0.660 2.00 NE 088007-016 SW846 9056 Fluoride 0.970 0.033 0.100 4.0 088007-016 SW846 9056 Sulfate 36.0 0.100 0.400 NE 088007-016 SW846 9056 MWL-MW9 Alkalinity, total as CaCO3 209 0.725 1.00 NE B 088011-016 SM 2320B 07-Jan-10 Bromide 0.279 0.066 0.200 NE 088011-016 SW846 9056 Chloride 38.9 0.660 2.00 NE 088011-016 SW846 9056 Fluoride 1.02 0.033 0.100 4.0 088011-016 SW846 9056 Sulfate 38.0 0.100 0.400 NE 088011-016 SW846 9056
MWL-BW2 Alkalinity, total as CaCO3 238 0.725 1.00 NE B 088942-016 SM 2320B 27-Apr-10 Bromide 0.399 0.066 0.200 NE 088942-016 SW846 9056 Chloride 58.4 0.660 2.00 NE 088942-016 SW846 9056 Fluoride 0.667 0.033 0.100 4.0 088942-016 SW846 9056 Sulfate 43.7 1.00 4.00 NE 088942-016 SW846 9056 MWL-BW2 (Duplicate) Alkalinity, total as CaCO3 235 0.725 1.00 NE B 088943-016 SM 2320B 27-Apr-10 Bromide 0.399 0.066 0.200 NE 088943-016 SW846 9056 Chloride 59.3 0.660 2.00 NE 088943-016 SW846 9056 Fluoride 0.675 0.033 0.100 4.0 088943-016 SW846 9056 Sulfate 44.6 1.00 4.00 NE 088943-016 SW846 9056 Refer to footnotes on page 4A-57.

4A-10
AN
NU
AL
GR
OU
ND
WA
TE
R M
ON
ITO
RIN
G R
EP
OR
T, CA
LE
ND
AR
YE
AR
2010
Table 4A-4 (Continued) Summary of Alkalinity and Anion Results,
Mixed Waste Landfill Groundwater Monitoring, Sandia National Laboratories/New Mexico
Calendar Year 2010
Well ID Analyte Resulta (mg/L)
MDLb (mg/L)
PQLc (mg/L)
MCLd (mg/L)
Laboratory Qualifierf
Validation Qualifierg Sample No. Analytical
Methodh MWL-MW4 Alkalinity, total as CaCO3 208 0.725 1.00 NE B 088949-016 SM 2320B 29-Apr-10 Bromide 0.375 0.066 0.200 NE 088949-016 SW846 9056 Chloride 47.6 0.660 2.00 NE 088949-016 SW846 9056 Fluoride 0.982 0.033 0.100 4.0 088949-016 SW846 9056 Sulfate 38.0 0.100 0.400 NE 088949-016 SW846 9056 MWL-MW5 Alkalinity, total as CaCO3 307 0.725 1.00 NE B 088918-016 SM 2320B 20-Apr-10 Bromide 0.464 0.066 0.200 NE 088918-016 SW846 9056 Chloride 84.5 0.660 2.00 NE 088918-016 SW846 9056 Fluoride 0.861 0.033 0.100 4.0 088918-016 SW846 9056 Sulfate 53.6 1.00 4.00 NE 088918-016 SW846 9056 MWL-MW5 (Duplicate) Alkalinity, total as CaCO3 310 0.725 1.00 NE B 088919-016 SM 2320B 20-Apr-10 Bromide 0.467 0.066 0.200 NE 088919-016 SW846 9056 Chloride 84.7 0.660 2.00 NE 088919-016 SW846 9056 Fluoride 0.885 0.033 0.100 4.0 088919-016 SW846 9056 Sulfate 53.9 1.00 4.00 NE 088919-016 SW846 9056 MWL-MW6 Alkalinity, total as CaCO3 289 0.725 1.00 NE B 088909-016 SM 2320B 19-Apr-10 Bromide 0.530 0.066 0.200 NE 088909-016 SW846 9056 Chloride 74.4 0.660 2.00 NE 088909-016 SW846 9056 Fluoride 0.734 0.033 0.100 4.0 088909-016 SW846 9056 Sulfate 50.2 1.00 4.00 NE 088909-016 SW846 9056 MWL-MW7 Alkalinity, total as CaCO3 209 0.725 1.00 NE B 088929-016 SM 2320B 22-Apr-10 Bromide 0.298 0.066 0.200 NE 088929-016 SW846 9056 Chloride 40.4 0.660 2.00 NE 088929-016 SW846 9056 Fluoride 1.02 0.033 0.100 4.0 088929-016 SW846 9056 Sulfate 37.1 0.100 0.400 NE 088929-016 SW846 9056 MWL-MW8 Alkalinity, total as CaCO3 220 0.725 1.00 NE B 088934-016 SM 2320B 26-Apr-10 Bromide 0.349 0.066 0.200 NE 088934-016 SW846 9056 Chloride 44.8 0.660 2.00 NE 088934-016 SW846 9056 Fluoride 0.947 0.033 0.100 4.0 088934-016 SW846 9056 Sulfate 37.1 0.100 0.400 NE 088934-016 SW846 9056 MWL-MW9 Alkalinity, total as CaCO3 316 0.725 1.00 NE B 088924-016 SM 2320B 21-Apr-10 Bromide 0.298 0.066 0.200 NE 088924-016 SW846 9056 Chloride 39.9 0.660 2.00 NE 088924-016 SW846 9056 Fluoride 1.05 0.033 0.100 4.0 088924-016 SW846 9056 Sulfate 38.5 0.100 0.400 NE 088924-016 SW846 9056 Refer to footnotes on page 4A-57.

MIX
ED
WA
ST
E L
AN
DF
ILL
4A-11
Table 4A-4 (Concluded) Summary of Alkalinity and Anion Results,
Mixed Waste Landfill Groundwater Monitoring, Sandia National Laboratories/New Mexico
Calendar Year 2010
Well ID Analyte Resulta (mg/L)
MDLb (mg/L)
PQLc (mg/L)
MCLd (mg/L)
Laboratory Qualifierf
Validation Qualifierg Sample No. Analytical
Methodh MWL-BW2 Alkalinity, total as CaCO3 250 0.725 1.00 NE B 089402-016 SM 2320B 06-Jul-10 Bromide 0.388 0.066 0.200 NE 089402-016 SW846 9056 Chloride 60.1 0.660 2.00 NE B 089402-016 SW846 9056 Fluoride 0.690 0.033 0.100 4.0 089402-016 SW846 9056 Sulfate 45.0 1.00 4.00 NE 089402-016 SW846 9056 MWL-MW7 Alkalinity, total as CaCO3 217 0.725 1.00 NE B 089407-016 SM 2320B 07-Jul-10 Bromide 0.328 0.066 0.200 NE 089407-016 SW846 9056 Chloride 37.9 0.660 2.00 NE B 089407-016 SW846 9056 Fluoride 0.919 0.033 0.100 4.0 089407-016 SW846 9056 Sulfate 37.6 0.100 0.400 NE 089407-016 SW846 9056 MWL-MW7 (Duplicate) Alkalinity, total as CaCO3 219 0.725 1.00 NE B 089408-016 SM 2320B 07-Jul-10 Bromide 0.317 0.066 0.200 NE 089408-016 SW846 9056 Chloride 39.0 0.660 2.00 NE B 089408-016 SW846 9056 Fluoride 0.948 0.033 0.100 4.0 089408-016 SW846 9056 Sulfate 37.5 0.100 0.400 NE 089408-016 SW846 9056 MWL-MW8 Alkalinity, total as CaCO3 231 0.725 1.00 NE B 089411-016 SM 2320B 12-Jul-10 Bromide 0.361 0.066 0.200 NE 089411-016 SW846 9056 Chloride 50.5 0.660 2.00 NE 089411-016 SW846 9056 Fluoride 1.01 0.033 0.100 4.0 089411-016 SW846 9056 Sulfate 35.5 0.100 0.400 NE 089411-016 SW846 9056 MWL-MW9 Alkalinity, total as CaCO3 227 0.725 1.00 NE B 089414-016 SM 2320B 13-Jul-10 Bromide 0.333 0.066 0.200 NE 089414-016 SW846 9056 Chloride 39.3 0.660 2.00 NE 089414-016 SW846 9056 Fluoride 1.04 0.033 0.100 4.0 089414-016 SW846 9056 Sulfate 38.2 0.100 0.400 NE 089414-016 SW846 9056 Refer to footnotes on page 4A-57.

4A-12
AN
NU
AL
GR
OU
ND
WA
TE
R M
ON
ITO
RIN
G R
EP
OR
T, CA
LE
ND
AR
YE
AR
2010
Table 4A-5 Summary of Total Metal Results (Unfiltered),
Mixed Waste Landfill Groundwater Monitoring, Sandia National Laboratories/New Mexico
Calendar Year 2010
Well ID Analyte Resulta (mg/L)
MDLb (mg/L)
PQLc (mg/L)
MCLd (mg/L)
Laboratory Qualifierf
Validation Qualifierg Sample No. Analytical
Methodh MWL-BW2 Aluminum ND 0.010 0.030 NE U 087998-009 SW846 6020 04-Jan-10 Antimony ND 0.0005 0.003 0.006 U 087998-009 SW846 6020 Arsenic ND 0.0015 0.005 0.010 U 087998-009 SW846 6020 Barium 0.0909 0.0005 0.002 2.00 087998-009 SW846 6020 Beryllium ND 0.0001 0.0005 0.004 U 087998-009 SW846 6020 Cadmium ND 0.00011 0.001 0.005 U 087998-009 SW846 6020 Calcium 72.3 0.100 1.00 NE 087998-009 SW846 6020 Chromium ND 0.0025 0.010 0.100 U 087998-009 SW846 6020 Cobalt 0.000132 0.0001 0.001 NE J 087998-009 SW846 6020 Copper 0.000569 0.0003 0.001 NE J 0.0039U 087998-009 SW846 6020 Iron 0.192 0.010 0.100 NE 087998-009 SW846 6020 Lead ND 0.0005 0.002 NE U 087998-009 SW846 6020 Magnesium 23.0 0.005 0.015 NE 087998-009 SW846 6020 Manganese ND 0.001 0.005 NE U 087998-009 SW846 6020 Mercury ND 0.000066 0.0002 0.002 U 087998-009 SW846 7470 Nickel 0.00277 0.0005 0.002 NE 087998-009 SW846 6020 Potassium 3.86 0.080 0.300 NE 087998-009 SW846 6020 Selenium 0.00172 0.001 0.005 0.050 J 087998-009 SW846 6020 Silver ND 0.0002 0.001 NE U 087998-009 SW846 6020 Sodium 60.6 0.400 1.25 NE 087998-009 SW846 6020 Thallium 0.000375 0.0003 0.001 0.002 J 0.0017U 087998-009 SW846 6020 Uranium 0.00686 0.00005 0.0002 0.030 087998-009 SW846 6020 Vanadium ND 0.003 0.010 NE U 087998-009 SW846 6020 Zinc ND 0.0026 0.010 NE U 087998-009 SW846 6020 Refer to footnotes on page 4A-57.
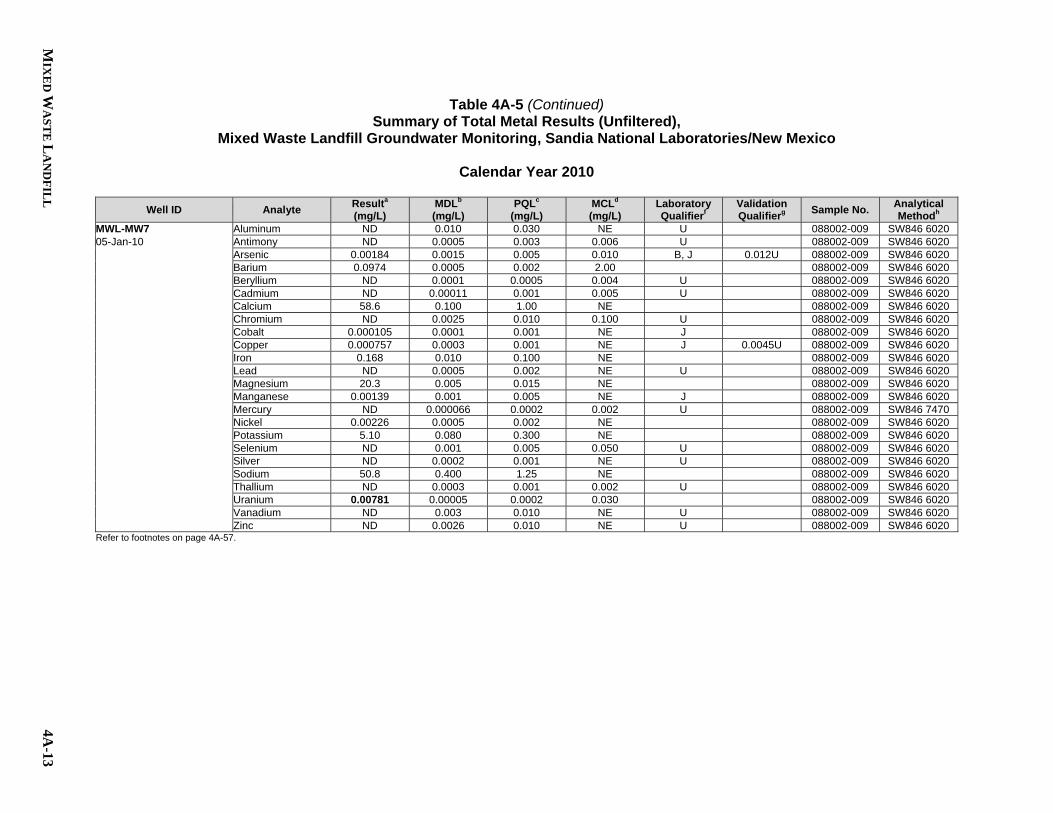
MIX
ED
WA
ST
E L
AN
DF
ILL
4A-13
Table 4A-5 (Continued) Summary of Total Metal Results (Unfiltered),
Mixed Waste Landfill Groundwater Monitoring, Sandia National Laboratories/New Mexico
Calendar Year 2010
Well ID Analyte Resulta (mg/L)
MDLb (mg/L)
PQLc (mg/L)
MCLd (mg/L)
Laboratory Qualifierf
Validation Qualifierg Sample No. Analytical
Methodh MWL-MW7 Aluminum ND 0.010 0.030 NE U 088002-009 SW846 6020 05-Jan-10 Antimony ND 0.0005 0.003 0.006 U 088002-009 SW846 6020 Arsenic 0.00184 0.0015 0.005 0.010 B, J 0.012U 088002-009 SW846 6020 Barium 0.0974 0.0005 0.002 2.00 088002-009 SW846 6020 Beryllium ND 0.0001 0.0005 0.004 U 088002-009 SW846 6020 Cadmium ND 0.00011 0.001 0.005 U 088002-009 SW846 6020 Calcium 58.6 0.100 1.00 NE 088002-009 SW846 6020 Chromium ND 0.0025 0.010 0.100 U 088002-009 SW846 6020 Cobalt 0.000105 0.0001 0.001 NE J 088002-009 SW846 6020 Copper 0.000757 0.0003 0.001 NE J 0.0045U 088002-009 SW846 6020 Iron 0.168 0.010 0.100 NE 088002-009 SW846 6020 Lead ND 0.0005 0.002 NE U 088002-009 SW846 6020 Magnesium 20.3 0.005 0.015 NE 088002-009 SW846 6020 Manganese 0.00139 0.001 0.005 NE J 088002-009 SW846 6020 Mercury ND 0.000066 0.0002 0.002 U 088002-009 SW846 7470 Nickel 0.00226 0.0005 0.002 NE 088002-009 SW846 6020 Potassium 5.10 0.080 0.300 NE 088002-009 SW846 6020 Selenium ND 0.001 0.005 0.050 U 088002-009 SW846 6020 Silver ND 0.0002 0.001 NE U 088002-009 SW846 6020 Sodium 50.8 0.400 1.25 NE 088002-009 SW846 6020 Thallium ND 0.0003 0.001 0.002 U 088002-009 SW846 6020 Uranium 0.00781 0.00005 0.0002 0.030 088002-009 SW846 6020 Vanadium ND 0.003 0.010 NE U 088002-009 SW846 6020 Zinc ND 0.0026 0.010 NE U 088002-009 SW846 6020 Refer to footnotes on page 4A-57.

4A-14
AN
NU
AL
GR
OU
ND
WA
TE
R M
ON
ITO
RIN
G R
EP
OR
T, CA
LE
ND
AR
YE
AR
2010
Table 4A-5 (Continued) Summary of Total Metal Results (Unfiltered),
Mixed Waste Landfill Groundwater Monitoring, Sandia National Laboratories/New Mexico
Calendar Year 2010
Well ID Analyte Resulta (mg/L)
MDLb (mg/L)
PQLc (mg/L)
MCLd (mg/L)
Laboratory Qualifierf
Validation Qualifierg Sample No. Analytical
Methodh MWL-MW7 (Duplicate) Aluminum ND 0.010 0.030 NE U 088003-009 SW846 6020 05-Jan-10 Antimony ND 0.0005 0.003 0.006 U 088003-009 SW846 6020 Arsenic 0.0019 0.0015 0.005 0.010 B, J 0.012U 088003-009 SW846 6020 Barium 0.104 0.0005 0.002 2.00 088003-009 SW846 6020 Beryllium ND 0.0001 0.0005 0.004 U 088003-009 SW846 6020 Cadmium ND 0.00011 0.001 0.005 U 088003-009 SW846 6020 Calcium 61.0 0.100 1.00 NE 088003-009 SW846 6020 Chromium ND 0.0025 0.010 0.100 U 088003-009 SW846 6020 Cobalt 0.000113 0.0001 0.001 NE J 088003-009 SW846 6020 Copper 0.000695 0.0003 0.001 NE J 0.0045U 088003-009 SW846 6020 Iron 0.187 0.010 0.100 NE 088003-009 SW846 6020 Lead ND 0.0005 0.002 NE U 088003-009 SW846 6020 Magnesium 22.1 0.005 0.015 NE 088003-009 SW846 6020 Manganese 0.00137 0.001 0.005 NE J 088003-009 SW846 6020 Mercury ND 0.000066 0.0002 0.002 U 088003-009 SW846 7470 Nickel 0.00244 0.0005 0.002 NE 088003-009 SW846 6020 Potassium 5.37 0.080 0.300 NE 088003-009 SW846 6020 Selenium ND 0.001 0.005 0.050 U 088003-009 SW846 6020 Silver ND 0.0002 0.001 NE U 088003-009 SW846 6020 Sodium 53.2 0.400 1.25 NE 088003-009 SW846 6020 Thallium ND 0.0003 0.001 0.002 U 088003-009 SW846 6020 Uranium 0.00833 0.00005 0.0002 0.030 088003-009 SW846 6020 Vanadium 0.0041 0.003 0.010 NE J 0.024U 088003-009 SW846 6020 Zinc ND 0.0026 0.010 NE U 088003-009 SW846 6020 Refer to footnotes on page 4A-57.

MIX
ED
WA
ST
E L
AN
DF
ILL
4A-15
Table 4A-5 (Continued) Summary of Total Metal Results (Unfiltered),
Mixed Waste Landfill Groundwater Monitoring, Sandia National Laboratories/New Mexico
Calendar Year 2010
Well ID Analyte Resulta (mg/L)
MDLb (mg/L)
PQLc (mg/L)
MCLd (mg/L)
Laboratory Qualifierf
Validation Qualifierg Sample No. Analytical
Methodh MWL-MW8 Aluminum 0.077 0.010 0.030 NE 0.18U 088007-009 SW846 6020 06-Jan-10 Antimony ND 0.0005 0.003 0.006 U 088007-009 SW846 6020 Arsenic ND 0.0015 0.005 0.010 U 088007-009 SW846 6020 Barium 0.143 0.0005 0.002 2.00 088007-009 SW846 6020 Beryllium ND 0.0001 0.0005 0.004 U 088007-009 SW846 6020 Cadmium ND 0.00011 0.001 0.005 U 088007-009 SW846 6020 Calcium 60.9 0.100 1.00 NE 088007-009 SW846 6020 Chromium ND 0.0025 0.010 0.100 U 088007-009 SW846 6020 Cobalt 0.000161 0.0001 0.001 NE J 088007-009 SW846 6020 Copper 0.000838 0.0003 0.001 NE J 0.0043U 088007-009 SW846 6020 Iron 0.275 0.010 0.100 NE 088007-009 SW846 6020 Lead ND 0.0005 0.002 NE U 088007-009 SW846 6020 Magnesium 22.1 0.005 0.015 NE 088007-009 SW846 6020 Manganese 0.227 0.001 0.005 NE 088007-009 SW846 6020 Mercury ND 0.000066 0.0002 0.002 U 088007-009 SW846 7470 Nickel 0.00279 0.0005 0.002 NE 088007-009 SW846 6020 Potassium 5.61 0.080 0.300 NE 088007-009 SW846 6020 Selenium ND 0.001 0.005 0.050 U 088007-009 SW846 6020 Silver ND 0.0002 0.001 NE U 088007-009 SW846 6020 Sodium 51.0 0.400 1.25 NE 088007-009 SW846 6020 Thallium ND 0.0003 0.001 0.002 U 088007-009 SW846 6020 Uranium 0.00789 0.00005 0.0002 0.030 088007-009 SW846 6020 Vanadium ND 0.003 0.010 NE U 088007-009 SW846 6020 Zinc 0.00496 0.0026 0.010 NE J 088007-009 SW846 6020 Refer to footnotes on page 4A-57.
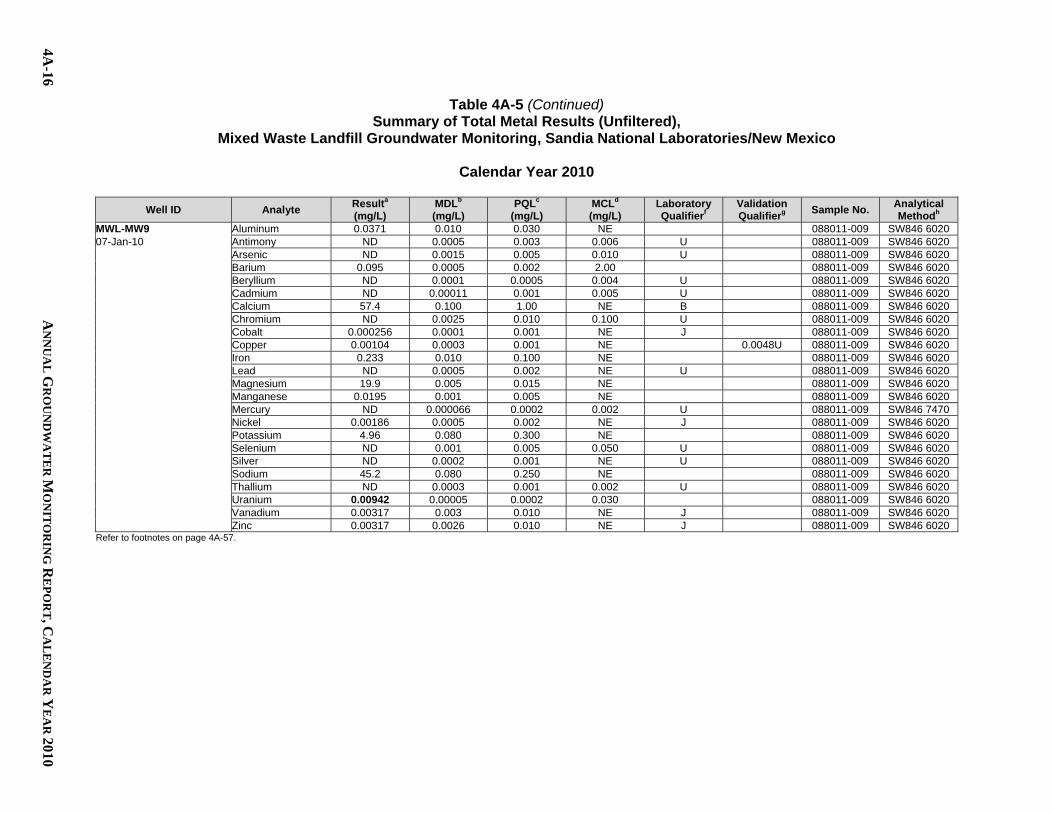
4A-16
AN
NU
AL
GR
OU
ND
WA
TE
R M
ON
ITO
RIN
G R
EP
OR
T, CA
LE
ND
AR
YE
AR
2010
Table 4A-5 (Continued) Summary of Total Metal Results (Unfiltered),
Mixed Waste Landfill Groundwater Monitoring, Sandia National Laboratories/New Mexico
Calendar Year 2010
Well ID Analyte Resulta (mg/L)
MDLb (mg/L)
PQLc (mg/L)
MCLd (mg/L)
Laboratory Qualifierf
Validation Qualifierg Sample No. Analytical
Methodh MWL-MW9 Aluminum 0.0371 0.010 0.030 NE 088011-009 SW846 6020 07-Jan-10 Antimony ND 0.0005 0.003 0.006 U 088011-009 SW846 6020 Arsenic ND 0.0015 0.005 0.010 U 088011-009 SW846 6020 Barium 0.095 0.0005 0.002 2.00 088011-009 SW846 6020 Beryllium ND 0.0001 0.0005 0.004 U 088011-009 SW846 6020 Cadmium ND 0.00011 0.001 0.005 U 088011-009 SW846 6020 Calcium 57.4 0.100 1.00 NE B 088011-009 SW846 6020 Chromium ND 0.0025 0.010 0.100 U 088011-009 SW846 6020 Cobalt 0.000256 0.0001 0.001 NE J 088011-009 SW846 6020 Copper 0.00104 0.0003 0.001 NE 0.0048U 088011-009 SW846 6020 Iron 0.233 0.010 0.100 NE 088011-009 SW846 6020 Lead ND 0.0005 0.002 NE U 088011-009 SW846 6020 Magnesium 19.9 0.005 0.015 NE 088011-009 SW846 6020 Manganese 0.0195 0.001 0.005 NE 088011-009 SW846 6020 Mercury ND 0.000066 0.0002 0.002 U 088011-009 SW846 7470 Nickel 0.00186 0.0005 0.002 NE J 088011-009 SW846 6020 Potassium 4.96 0.080 0.300 NE 088011-009 SW846 6020 Selenium ND 0.001 0.005 0.050 U 088011-009 SW846 6020 Silver ND 0.0002 0.001 NE U 088011-009 SW846 6020 Sodium 45.2 0.080 0.250 NE 088011-009 SW846 6020 Thallium ND 0.0003 0.001 0.002 U 088011-009 SW846 6020 Uranium 0.00942 0.00005 0.0002 0.030 088011-009 SW846 6020 Vanadium 0.00317 0.003 0.010 NE J 088011-009 SW846 6020 Zinc 0.00317 0.0026 0.010 NE J 088011-009 SW846 6020 Refer to footnotes on page 4A-57.

MIX
ED
WA
ST
E L
AN
DF
ILL
4A-17
Table 4A-5 (Continued) Summary of Total Metal Results (Unfiltered),
Mixed Waste Landfill Groundwater Monitoring, Sandia National Laboratories/New Mexico
Calendar Year 2010
Well ID Analyte Resulta (mg/L)
MDLb (mg/L)
PQLc (mg/L)
MCLd (mg/L)
Laboratory Qualifierf
Validation Qualifierg Sample No. Analytical
Methodh MWL-BW2 Aluminum 0.0109 0.010 0.030 NE J 088942-009 SW846 6020 27-Apr-10 Antimony ND 0.0005 0.003 0.006 U 088942-009 SW846 6020 Arsenic ND 0.0015 0.005 0.010 U 088942-009 SW846 6020 Barium 0.0938 0.0005 0.002 2.00 088942-009 SW846 6020 Beryllium ND 0.0001 0.0005 0.004 U 088942-009 SW846 6020 Cadmium ND 0.00011 0.001 0.005 U 088942-009 SW846 6020 Calcium 67.2 0.200 2.00 NE B 088942-009 SW846 6020 Chromium ND 0.0025 0.010 0.100 U 088942-009 SW846 6020 Cobalt ND 0.0001 0.001 NE U 088942-009 SW846 6020 Copper 0.000382 0.0003 0.001 NE J 0.019UJ 088942-009 SW846 6020 Iron 0.0703 0.010 0.100 NE J 088942-009 SW846 6020 Lead ND 0.0005 0.002 NE U 088942-009 SW846 6020 Magnesium 20.9 0.005 0.015 NE 088942-009 SW846 6020 Manganese ND 0.001 0.005 NE U 088942-009 SW846 6020 Mercury ND 0.000066 0.0002 0.002 U 088942-009 SW846 7470 Nickel 0.00103 0.0005 0.002 NE J 088942-009 SW846 6020 Potassium 4.14 0.080 0.300 NE 088942-009 SW846 6020 Selenium 0.00241 0.001 0.005 0.050 J 088942-009 SW846 6020 Silver ND 0.0002 0.001 NE U 088942-009 SW846 6020 Sodium 50.2 0.800 2.50 NE 088942-009 SW846 6020 Thallium ND 0.0003 0.001 0.002 U 088942-009 SW846 6020 Uranium 0.00652 0.00005 0.0002 0.030 088942-009 SW846 6020 Vanadium 0.010 0.003 0.010 NE 088942-009 SW846 6020 Zinc ND 0.0026 0.010 NE U 088942-009 SW846 6020 Refer to footnotes on page 4A-57.

4A-18
AN
NU
AL
GR
OU
ND
WA
TE
R M
ON
ITO
RIN
G R
EP
OR
T, CA
LE
ND
AR
YE
AR
2010
Table 4A-5 (Continued) Summary of Total Metal Results (Unfiltered),
Mixed Waste Landfill Groundwater Monitoring, Sandia National Laboratories/New Mexico
Calendar Year 2010
Well ID Analyte Resulta (mg/L)
MDLb (mg/L)
PQLc (mg/L)
MCLd (mg/L)
Laboratory Qualifierf
Validation Qualifierg Sample No. Analytical
Methodh MWL-BW2 (Duplicate) Aluminum 0.0197 0.010 0.030 NE J 088943-009 SW846 6020 27-Apr-10 Antimony ND 0.0005 0.003 0.006 U 088943-009 SW846 6020 Arsenic 0.00517 0.0015 0.005 0.010 B 0.014U 088943-009 SW846 6020 Barium 0.0943 0.0005 0.002 2.00 088943-009 SW846 6020 Beryllium ND 0.0001 0.0005 0.004 U 088943-009 SW846 6020 Cadmium ND 0.00011 0.001 0.005 U 088943-009 SW846 6020 Calcium 67.8 0.200 2.00 NE B 088943-009 SW846 6020 Chromium ND 0.0025 0.010 0.100 U 088943-009 SW846 6020 Cobalt ND 0.0001 0.001 NE U 088943-009 SW846 6020 Copper 0.000393 0.0003 0.001 NE J 0.019UJ 088943-009 SW846 6020 Iron 0.070 0.010 0.100 NE J 088943-009 SW846 6020 Lead ND 0.0005 0.002 NE U 088943-009 SW846 6020 Magnesium 20.5 0.005 0.015 NE 088943-009 SW846 6020 Manganese ND 0.001 0.005 NE U 088943-009 SW846 6020 Mercury ND 0.000066 0.0002 0.002 U 088943-009 SW846 7470 Nickel 0.00104 0.0005 0.002 NE J 088943-009 SW846 6020 Potassium 4.02 0.080 0.300 NE 088943-009 SW846 6020 Selenium 0.00214 0.001 0.005 0.050 J 088943-009 SW846 6020 Silver ND 0.0002 0.001 NE U 088943-009 SW846 6020 Sodium 49.8 0.800 2.50 NE 088943-009 SW846 6020 Thallium ND 0.0003 0.001 0.002 U 088943-009 SW846 6020 Uranium 0.00636 0.00005 0.0002 0.030 088943-009 SW846 6020 Vanadium 0.00378 0.003 0.010 NE J 088943-009 SW846 6020 Zinc ND 0.0026 0.010 NE U 088943-009 SW846 6020 Refer to footnotes on page 4A-57.
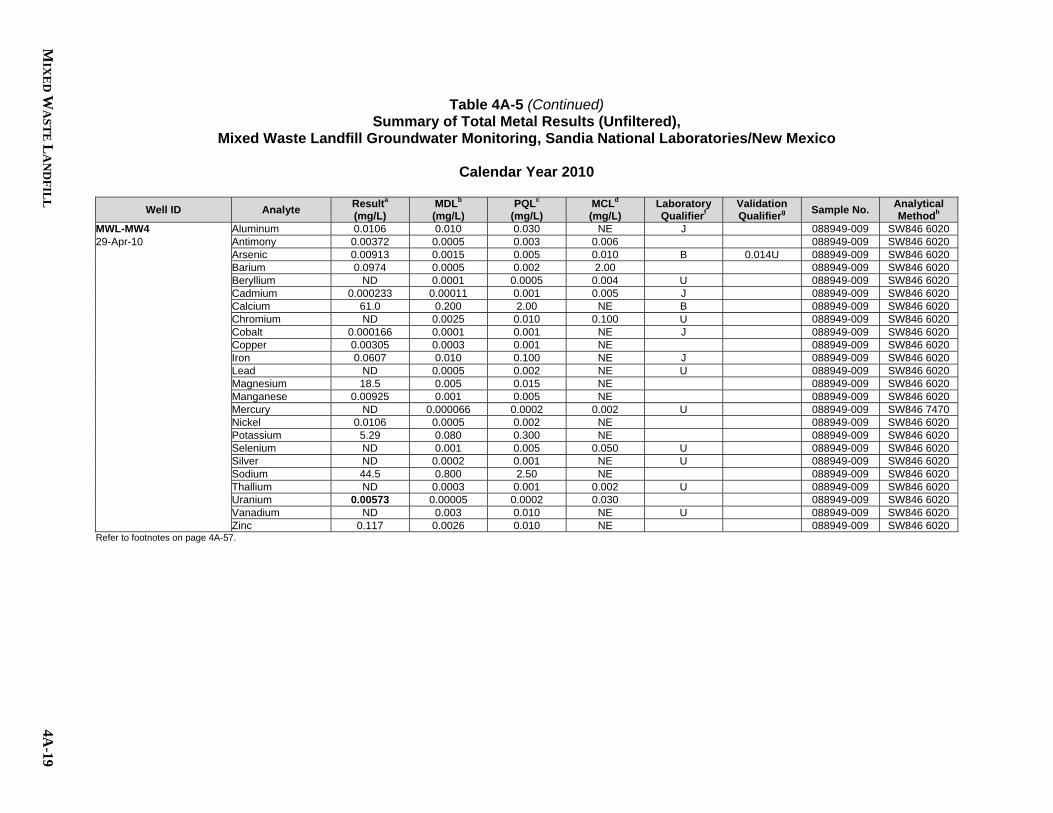
MIX
ED
WA
ST
E L
AN
DF
ILL
4A-19
Table 4A-5 (Continued) Summary of Total Metal Results (Unfiltered),
Mixed Waste Landfill Groundwater Monitoring, Sandia National Laboratories/New Mexico
Calendar Year 2010
Well ID Analyte Resulta (mg/L)
MDLb (mg/L)
PQLc (mg/L)
MCLd (mg/L)
Laboratory Qualifierf
Validation Qualifierg Sample No. Analytical
Methodh MWL-MW4 Aluminum 0.0106 0.010 0.030 NE J 088949-009 SW846 6020 29-Apr-10 Antimony 0.00372 0.0005 0.003 0.006 088949-009 SW846 6020 Arsenic 0.00913 0.0015 0.005 0.010 B 0.014U 088949-009 SW846 6020 Barium 0.0974 0.0005 0.002 2.00 088949-009 SW846 6020 Beryllium ND 0.0001 0.0005 0.004 U 088949-009 SW846 6020 Cadmium 0.000233 0.00011 0.001 0.005 J 088949-009 SW846 6020 Calcium 61.0 0.200 2.00 NE B 088949-009 SW846 6020 Chromium ND 0.0025 0.010 0.100 U 088949-009 SW846 6020 Cobalt 0.000166 0.0001 0.001 NE J 088949-009 SW846 6020 Copper 0.00305 0.0003 0.001 NE 088949-009 SW846 6020 Iron 0.0607 0.010 0.100 NE J 088949-009 SW846 6020 Lead ND 0.0005 0.002 NE U 088949-009 SW846 6020 Magnesium 18.5 0.005 0.015 NE 088949-009 SW846 6020 Manganese 0.00925 0.001 0.005 NE 088949-009 SW846 6020 Mercury ND 0.000066 0.0002 0.002 U 088949-009 SW846 7470 Nickel 0.0106 0.0005 0.002 NE 088949-009 SW846 6020 Potassium 5.29 0.080 0.300 NE 088949-009 SW846 6020 Selenium ND 0.001 0.005 0.050 U 088949-009 SW846 6020 Silver ND 0.0002 0.001 NE U 088949-009 SW846 6020 Sodium 44.5 0.800 2.50 NE 088949-009 SW846 6020 Thallium ND 0.0003 0.001 0.002 U 088949-009 SW846 6020 Uranium 0.00573 0.00005 0.0002 0.030 088949-009 SW846 6020 Vanadium ND 0.003 0.010 NE U 088949-009 SW846 6020 Zinc 0.117 0.0026 0.010 NE 088949-009 SW846 6020 Refer to footnotes on page 4A-57.

4A-20
AN
NU
AL
GR
OU
ND
WA
TE
R M
ON
ITO
RIN
G R
EP
OR
T, CA
LE
ND
AR
YE
AR
2010
Table 4A-5 (Continued) Summary of Total Metal Results (Unfiltered),
Mixed Waste Landfill Groundwater Monitoring, Sandia National Laboratories/New Mexico
Calendar Year 2010
Well ID Analyte Resulta (mg/L)
MDLb (mg/L)
PQLc (mg/L)
MCLd (mg/L)
Laboratory Qualifierf
Validation Qualifierg Sample No. Analytical
Methodh MWL-MW5 Aluminum ND 0.010 0.030 NE U 088918-009 SW846 6020 20-Apr-10 Antimony ND 0.0005 0.003 0.006 U 088918-009 SW846 6020 Arsenic 0.00326 0.0015 0.005 0.010 B, J 0.012U 088918-009 SW846 6020 Barium 0.126 0.0005 0.002 2.00 088918-009 SW846 6020 Beryllium ND 0.0001 0.0005 0.004 U 088918-009 SW846 6020 Cadmium ND 0.00011 0.001 0.005 U 088918-009 SW846 6020 Calcium 94.5 0.100 1.00 NE B 088918-009 SW846 6020 Chromium ND 0.0025 0.010 0.100 U 088918-009 SW846 6020 Cobalt 0.000141 0.0001 0.001 NE J 088918-009 SW846 6020 Copper 0.000877 0.0003 0.001 NE J 0.0092U 088918-009 SW846 6020 Iron 0.197 0.010 0.100 NE B 088918-009 SW846 6020 Lead ND 0.0005 0.002 NE U 088918-009 SW846 6020 Magnesium 31.1 0.005 0.015 NE 088918-009 SW846 6020 Manganese 0.00759 0.001 0.005 NE 088918-009 SW846 6020 Mercury ND 0.000066 0.0002 0.002 U UJ 088918-009 SW846 7470 Nickel 0.00177 0.0005 0.002 NE J 088918-009 SW846 6020 Potassium 6.39 0.400 1.50 NE 088918-009 SW846 6020 Selenium 0.00123 0.001 0.005 0.050 J NJ- 088918-009 SW846 6020 Silver ND 0.0002 0.001 NE U 088918-009 SW846 6020 Sodium 68.6 0.400 1.25 NE 088918-009 SW846 6020 Thallium ND 0.0003 0.001 0.002 U 088918-009 SW846 6020 Uranium 0.00994 0.00005 0.0002 0.030 088918-009 SW846 6020 Vanadium ND 0.003 0.010 NE U UJ 088918-009 SW846 6020 Zinc 0.00307 0.0026 0.010 NE 088918-009 SW846 6020 Refer to footnotes on page 4A-57.

MIX
ED
WA
ST
E L
AN
DF
ILL
4A-21
Table 4A-5 (Continued) Summary of Total Metal Results (Unfiltered),
Mixed Waste Landfill Groundwater Monitoring, Sandia National Laboratories/New Mexico
Calendar Year 2010
Well ID Analyte Resulta (mg/L)
MDLb (mg/L)
PQLc (mg/L)
MCLd (mg/L)
Laboratory Qualifierf
Validation Qualifierg Sample No. Analytical
Methodh MWL-MW5 (Duplicate) Aluminum ND 0.010 0.030 NE U 088919-009 SW846 6020 20-Apr-10 Antimony ND 0.0005 0.003 0.006 U 088919-009 SW846 6020 Arsenic ND 0.0015 0.005 0.010 U 088919-009 SW846 6020 Barium 0.127 0.0005 0.002 2.00 088919-009 SW846 6020 Beryllium ND 0.0001 0.0005 0.004 U 088919-009 SW846 6020 Cadmium ND 0.00011 0.001 0.005 U 088919-009 SW846 6020 Calcium 90.7 0.100 1.00 NE B 088919-009 SW846 6020 Chromium ND 0.0025 0.010 0.100 U 088919-009 SW846 6020 Cobalt 0.000122 0.0001 0.001 NE J 088919-009 SW846 6020 Copper 0.000822 0.0003 0.001 NE J 0.0092U 088919-009 SW846 6020 Iron 0.236 0.010 0.100 NE B 088919-009 SW846 6020 Lead ND 0.0005 0.002 NE U 088919-009 SW846 6020 Magnesium 30.9 0.005 0.015 NE 088919-009 SW846 6020 Manganese 0.0081 0.001 0.005 NE 088919-009 SW846 6020 Mercury ND 0.000066 0.0002 0.002 U UJ 088919-009 SW846 7470 Nickel 0.00178 0.0005 0.002 NE J 088919-009 SW846 6020 Potassium 6.43 0.400 1.50 NE 088919-009 SW846 6020 Selenium ND 0.001 0.005 0.050 U UJ 088919-009 SW846 6020 Silver ND 0.0002 0.001 NE U 088919-009 SW846 6020 Sodium 60.9 0.400 1.25 NE 088919-009 SW846 6020 Thallium ND 0.0003 0.001 0.002 U 088919-009 SW846 6020 Uranium 0.0099 0.00005 0.0002 0.030 088919-009 SW846 6020 Vanadium ND 0.003 0.010 NE U UJ 088919-009 SW846 6020 Zinc 0.00293 0.0026 0.010 NE J 088919-009 SW846 6020 Refer to footnotes on page 4A-57.

4A-22
AN
NU
AL
GR
OU
ND
WA
TE
R M
ON
ITO
RIN
G R
EP
OR
T, CA
LE
ND
AR
YE
AR
2010
Table 4A-5 (Continued) Summary of Total Metal Results (Unfiltered),
Mixed Waste Landfill Groundwater Monitoring, Sandia National Laboratories/New Mexico
Calendar Year 2010
Well ID Analyte Resulta (mg/L)
MDLb (mg/L)
PQLc (mg/L)
MCLd (mg/L)
Laboratory Qualifierf
Validation Qualifierg Sample No. Analytical
Methodh MWL-MW6 Aluminum ND 0.010 0.030 NE U 088909-009 SW846 6020 19-Apr-10 Antimony ND 0.0005 0.003 0.006 U 088909-009 SW846 6020 Arsenic 0.00288 0.0015 0.005 0.010 B, J 0.012U 088909-009 SW846 6020 Barium 0.110 0.0005 0.002 2.00 088909-009 SW846 6020 Beryllium ND 0.0001 0.0005 0.004 U 088909-009 SW846 6020 Cadmium ND 0.00011 0.001 0.005 U 088909-009 SW846 6020 Calcium 90.0 0.100 1.00 NE B 088909-009 SW846 6020 Chromium ND 0.0025 0.010 0.100 U 088909-009 SW846 6020 Cobalt ND 0.0001 0.001 NE U 088909-009 SW846 6020 Copper 0.000556 0.0003 0.001 NE J 088909-009 SW846 6020 Iron 0.0705 0.010 0.100 NE B, J 088909-009 SW846 6020 Lead ND 0.0005 0.002 NE U 088909-009 SW846 6020 Magnesium 28.7 0.005 0.015 NE 088909-009 SW846 6020 Manganese ND 0.001 0.005 NE U 088909-009 SW846 6020 Mercury ND 0.000066 0.0002 0.002 U UJ 088909-009 SW846 7470 Nickel 0.0012 0.0005 0.002 NE J 088909-009 SW846 6020 Potassium 6.08 0.400 1.50 NE 088909-009 SW846 6020 Selenium 0.0016 0.001 0.005 0.050 J NJ- 088909-009 SW846 6020 Silver ND 0.0002 0.001 NE U 088909-009 SW846 6020 Sodium 63.7 0.400 1.25 NE 088909-009 SW846 6020 Thallium 0.000771 0.0003 0.001 0.002 J 088909-009 SW846 6020 Uranium 0.00947 0.00005 0.0002 0.030 J+ 088909-009 SW846 6020 Vanadium 0.00674 0.003 0.010 NE B, J 0.022U 088909-009 SW846 6020 Zinc ND 0.0026 0.010 NE U 088909-009 SW846 6020 Refer to footnotes on page 4A-57.
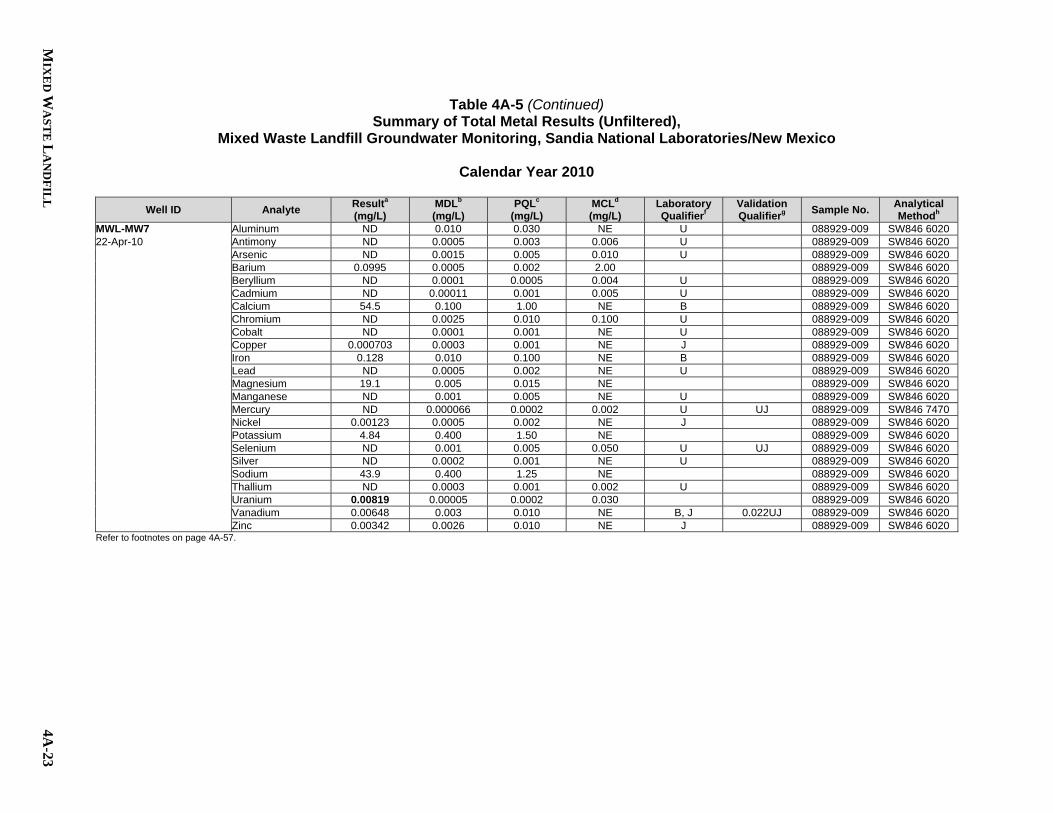
MIX
ED
WA
ST
E L
AN
DF
ILL
4A-23
Table 4A-5 (Continued) Summary of Total Metal Results (Unfiltered),
Mixed Waste Landfill Groundwater Monitoring, Sandia National Laboratories/New Mexico
Calendar Year 2010
Well ID Analyte Resulta (mg/L)
MDLb (mg/L)
PQLc (mg/L)
MCLd (mg/L)
Laboratory Qualifierf
Validation Qualifierg Sample No. Analytical
Methodh MWL-MW7 Aluminum ND 0.010 0.030 NE U 088929-009 SW846 6020 22-Apr-10 Antimony ND 0.0005 0.003 0.006 U 088929-009 SW846 6020 Arsenic ND 0.0015 0.005 0.010 U 088929-009 SW846 6020 Barium 0.0995 0.0005 0.002 2.00 088929-009 SW846 6020 Beryllium ND 0.0001 0.0005 0.004 U 088929-009 SW846 6020 Cadmium ND 0.00011 0.001 0.005 U 088929-009 SW846 6020 Calcium 54.5 0.100 1.00 NE B 088929-009 SW846 6020 Chromium ND 0.0025 0.010 0.100 U 088929-009 SW846 6020 Cobalt ND 0.0001 0.001 NE U 088929-009 SW846 6020 Copper 0.000703 0.0003 0.001 NE J 088929-009 SW846 6020 Iron 0.128 0.010 0.100 NE B 088929-009 SW846 6020 Lead ND 0.0005 0.002 NE U 088929-009 SW846 6020 Magnesium 19.1 0.005 0.015 NE 088929-009 SW846 6020 Manganese ND 0.001 0.005 NE U 088929-009 SW846 6020 Mercury ND 0.000066 0.0002 0.002 U UJ 088929-009 SW846 7470 Nickel 0.00123 0.0005 0.002 NE J 088929-009 SW846 6020 Potassium 4.84 0.400 1.50 NE 088929-009 SW846 6020 Selenium ND 0.001 0.005 0.050 U UJ 088929-009 SW846 6020 Silver ND 0.0002 0.001 NE U 088929-009 SW846 6020 Sodium 43.9 0.400 1.25 NE 088929-009 SW846 6020 Thallium ND 0.0003 0.001 0.002 U 088929-009 SW846 6020 Uranium 0.00819 0.00005 0.0002 0.030 088929-009 SW846 6020 Vanadium 0.00648 0.003 0.010 NE B, J 0.022UJ 088929-009 SW846 6020 Zinc 0.00342 0.0026 0.010 NE J 088929-009 SW846 6020 Refer to footnotes on page 4A-57.

4A-24
AN
NU
AL
GR
OU
ND
WA
TE
R M
ON
ITO
RIN
G R
EP
OR
T, CA
LE
ND
AR
YE
AR
2010
Table 4A-5 (Continued) Summary of Total Metal Results (Unfiltered),
Mixed Waste Landfill Groundwater Monitoring, Sandia National Laboratories/New Mexico
Calendar Year 2010
Well ID Analyte Resulta (mg/L)
MDLb (mg/L)
PQLc (mg/L)
MCLd (mg/L)
Laboratory Qualifierf
Validation Qualifierg Sample No. Analytical
Methodh MWL-MW8 Aluminum 0.0355 0.010 0.030 NE 088934-009 SW846 6020 26-Apr-10 Antimony ND 0.0005 0.003 0.006 U 088934-009 SW846 6020 Arsenic 0.00304 0.0015 0.005 0.010 B, J 0.014U 088934-009 SW846 6020 Barium 0.141 0.0005 0.002 2.00 088934-009 SW846 6020 Beryllium ND 0.0001 0.0005 0.004 U 088934-009 SW846 6020 Cadmium ND 0.00011 0.001 0.005 U 088934-009 SW846 6020 Calcium 57.2 0.200 2.00 NE B 088934-009 SW846 6020 Chromium ND 0.0025 0.010 0.100 U 088934-009 SW846 6020 Cobalt ND 0.0001 0.001 NE U 088934-009 SW846 6020 Copper 0.000671 0.0003 0.001 NE J 088934-009 SW846 6020 Iron 0.149 0.010 0.100 NE 088934-009 SW846 6020 Lead ND 0.0005 0.002 NE U 088934-009 SW846 6020 Magnesium 20.3 0.005 0.015 NE 088934-009 SW846 6020 Manganese 0.00703 0.001 0.005 NE 088934-009 SW846 6020 Mercury ND 0.000066 0.0002 0.002 U 088934-009 SW846 7470 Nickel 0.00109 0.0005 0.002 NE J 088934-009 SW846 6020 Potassium 5.29 0.080 0.300 NE 088934-009 SW846 6020 Selenium ND 0.001 0.005 0.050 U 088934-009 SW846 6020 Silver ND 0.0002 0.001 NE U 088934-009 SW846 6020 Sodium 42.5 0.080 0.250 NE 088934-009 SW846 6020 Thallium ND 0.0003 0.001 0.002 U 088934-009 SW846 6020 Uranium 0.00694 0.00005 0.0002 0.030 088934-009 SW846 6020 Vanadium ND 0.003 0.010 NE U 088934-009 SW846 6020 Zinc 0.00359 0.0026 0.010 NE J 088934-009 SW846 6020 Refer to footnotes on page 4A-57.

MIX
ED
WA
ST
E L
AN
DF
ILL
4A-25
Table 4A-5 (Continued) Summary of Total Metal Results (Unfiltered),
Mixed Waste Landfill Groundwater Monitoring, Sandia National Laboratories/New Mexico
Calendar Year 2010
Well ID Analyte Resulta (mg/L)
MDLb (mg/L)
PQLc (mg/L)
MCLd (mg/L)
Laboratory Qualifierf
Validation Qualifierg Sample No. Analytical
Methodh MWL-MW9 Aluminum 0.0386 0.010 0.030 NE 088924-009 SW846 6020 21-Apr-10 Antimony ND 0.0005 0.003 0.006 U 088924-009 SW846 6020 Arsenic 0.00344 0.0015 0.005 0.010 B, J 0.012U 088924-009 SW846 6020 Barium 0.102 0.0005 0.002 2.00 088924-009 SW846 6020 Beryllium ND 0.0001 0.0005 0.004 U 088924-009 SW846 6020 Cadmium ND 0.00011 0.001 0.005 U 088924-009 SW846 6020 Calcium 58.3 0.100 1.00 NE B 088924-009 SW846 6020 Chromium ND 0.0025 0.010 0.100 U 088924-009 SW846 6020 Cobalt 0.000139 0.0001 0.001 NE J 088924-009 SW846 6020 Copper 0.000816 0.0003 0.001 NE J 088924-009 SW846 6020 Iron 0.144 0.010 0.100 NE B 088924-009 SW846 6020 Lead ND 0.0005 0.002 NE U 088924-009 SW846 6020 Magnesium 19.7 0.005 0.015 NE 088924-009 SW846 6020 Manganese 0.00676 0.001 0.005 NE 088924-009 SW846 6020 Mercury ND 0.000066 0.0002 0.002 U UJ 088924-009 SW846 7470 Nickel 0.00122 0.0005 0.002 NE J 088924-009 SW846 6020 Potassium 4.90 0.400 1.50 NE 088924-009 SW846 6020 Selenium ND 0.001 0.005 0.050 U UJ 088924-009 SW846 6020 Silver ND 0.0002 0.001 NE U 088924-009 SW846 6020 Sodium 44.8 0.400 1.25 NE 088924-009 SW846 6020 Thallium ND 0.0003 0.001 0.002 U 088924-009 SW846 6020 Uranium 0.00982 0.00005 0.0002 0.030 088924-009 SW846 6020 Vanadium 0.0149 0.003 0.010 NE B 0.022UJ 088924-009 SW846 6020 Zinc 0.00441 0.0026 0.010 NE J 088924-009 SW846 6020 Refer to footnotes on page 4A-57.

4A-26
AN
NU
AL
GR
OU
ND
WA
TE
R M
ON
ITO
RIN
G R
EP
OR
T, CA
LE
ND
AR
YE
AR
2010
Table 4A-5 (Continued) Summary of Total Metal Results (Unfiltered),
Mixed Waste Landfill Groundwater Monitoring, Sandia National Laboratories/New Mexico
Calendar Year 2010
Well ID Analyte Resulta (mg/L)
MDLb (mg/L)
PQLc (mg/L)
MCLd (mg/L)
Laboratory Qualifierf
Validation Qualifierg Sample No. Analytical
Methodh MWL-BW2 Aluminum ND 0.010 0.030 NE U 089402-009 SW846 6020 06-Jul-10 Antimony ND 0.0005 0.003 0.006 U 089402-009 SW846 6020 Arsenic ND 0.0015 0.005 0.010 U 089402-009 SW846 6020 Barium 0.0961 0.0005 0.002 2.00 089402-009 SW846 6020 Beryllium ND 0.0001 0.0005 0.004 U 089402-009 SW846 6020 Cadmium ND 0.00011 0.001 0.005 U 089402-009 SW846 6020 Calcium 69.2 0.100 1.00 NE B 089402-009 SW846 6020 Chromium ND 0.0025 0.010 0.100 U 089402-009 SW846 6020 Cobalt 0.0001 0.0001 0.001 NE J 089402-009 SW846 6020 Copper 0.000576 0.0003 0.001 NE J 089402-009 SW846 6020 Iron 0.224 0.010 0.100 NE 089402-009 SW846 6020 Lead ND 0.0005 0.002 NE U 089402-009 SW846 6020 Magnesium 25.2 0.005 0.015 NE 089402-009 SW846 6020 Manganese ND 0.001 0.005 NE U 089402-009 SW846 6020 Mercury ND 0.000066 0.0002 0.002 U 089402-009 SW846 7470 Nickel 0.00173 0.0005 0.002 NE J 089402-009 SW846 6020 Potassium 3.93 0.080 0.300 NE 089402-009 SW846 6020 Selenium 0.00226 0.001 0.005 0.050 J 089402-009 SW846 6020 Silver ND 0.0002 0.001 NE U 089402-009 SW846 6020 Sodium 51.8 0.400 1.25 NE 089402-009 SW846 6020 Thallium 0.000504 0.0003 0.001 0.002 J 0.0029U 089402-009 SW846 6020 Uranium 0.00729 0.00005 0.0002 0.030 089402-009 SW846 6020 Vanadium 0.0057 0.003 0.010 NE J 089402-009 SW846 6020 Zinc ND 0.0026 0.010 NE U 089402-009 SW846 6020 Refer to footnotes on page 4A-57.
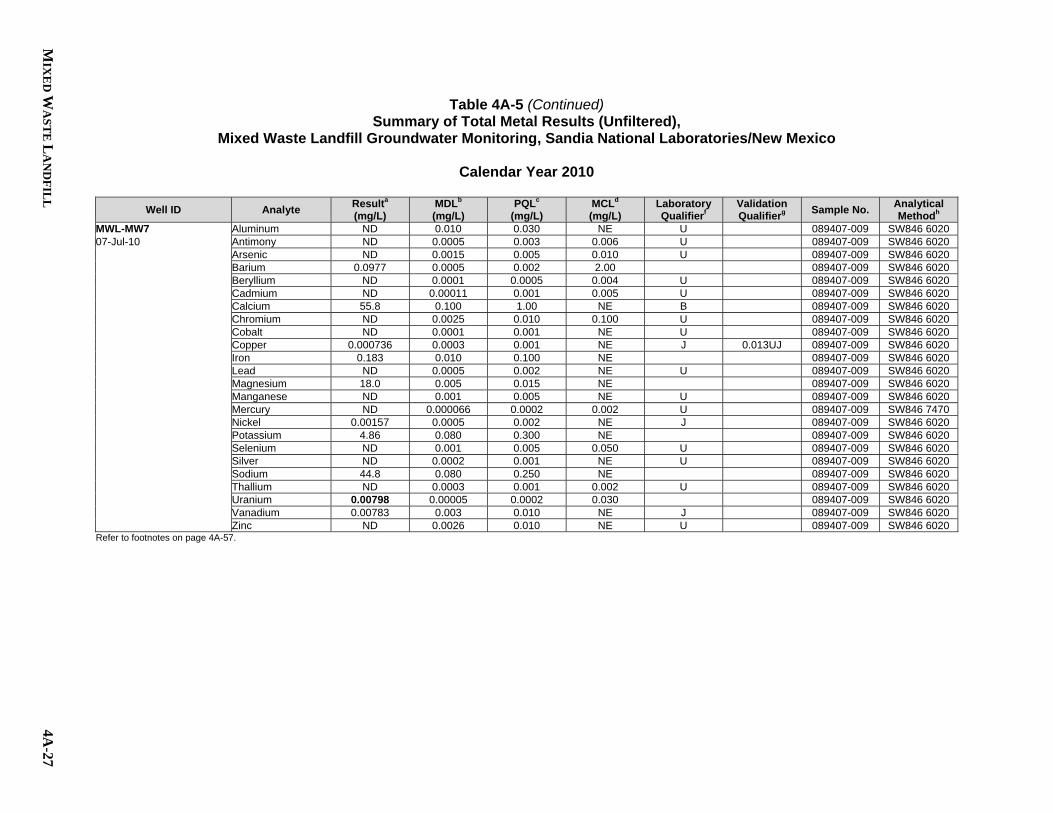
MIX
ED
WA
ST
E L
AN
DF
ILL
4A-27
Table 4A-5 (Continued) Summary of Total Metal Results (Unfiltered),
Mixed Waste Landfill Groundwater Monitoring, Sandia National Laboratories/New Mexico
Calendar Year 2010
Well ID Analyte Resulta (mg/L)
MDLb (mg/L)
PQLc (mg/L)
MCLd (mg/L)
Laboratory Qualifierf
Validation Qualifierg Sample No. Analytical
Methodh MWL-MW7 Aluminum ND 0.010 0.030 NE U 089407-009 SW846 6020 07-Jul-10 Antimony ND 0.0005 0.003 0.006 U 089407-009 SW846 6020 Arsenic ND 0.0015 0.005 0.010 U 089407-009 SW846 6020 Barium 0.0977 0.0005 0.002 2.00 089407-009 SW846 6020 Beryllium ND 0.0001 0.0005 0.004 U 089407-009 SW846 6020 Cadmium ND 0.00011 0.001 0.005 U 089407-009 SW846 6020 Calcium 55.8 0.100 1.00 NE B 089407-009 SW846 6020 Chromium ND 0.0025 0.010 0.100 U 089407-009 SW846 6020 Cobalt ND 0.0001 0.001 NE U 089407-009 SW846 6020 Copper 0.000736 0.0003 0.001 NE J 0.013UJ 089407-009 SW846 6020 Iron 0.183 0.010 0.100 NE 089407-009 SW846 6020 Lead ND 0.0005 0.002 NE U 089407-009 SW846 6020 Magnesium 18.0 0.005 0.015 NE 089407-009 SW846 6020 Manganese ND 0.001 0.005 NE U 089407-009 SW846 6020 Mercury ND 0.000066 0.0002 0.002 U 089407-009 SW846 7470 Nickel 0.00157 0.0005 0.002 NE J 089407-009 SW846 6020 Potassium 4.86 0.080 0.300 NE 089407-009 SW846 6020 Selenium ND 0.001 0.005 0.050 U 089407-009 SW846 6020 Silver ND 0.0002 0.001 NE U 089407-009 SW846 6020 Sodium 44.8 0.080 0.250 NE 089407-009 SW846 6020 Thallium ND 0.0003 0.001 0.002 U 089407-009 SW846 6020 Uranium 0.00798 0.00005 0.0002 0.030 089407-009 SW846 6020 Vanadium 0.00783 0.003 0.010 NE J 089407-009 SW846 6020 Zinc ND 0.0026 0.010 NE U 089407-009 SW846 6020 Refer to footnotes on page 4A-57.

4A-28
AN
NU
AL
GR
OU
ND
WA
TE
R M
ON
ITO
RIN
G R
EP
OR
T, CA
LE
ND
AR
YE
AR
2010
Table 4A-5 (Continued) Summary of Total Metal Results (Unfiltered),
Mixed Waste Landfill Groundwater Monitoring, Sandia National Laboratories/New Mexico
Calendar Year 2010
Well ID Analyte Resulta (mg/L)
MDLb (mg/L)
PQLc (mg/L)
MCLd (mg/L)
Laboratory Qualifierf
Validation Qualifierg Sample No. Analytical
Methodh MWL-MW7 (Duplicate) Aluminum ND 0.010 0.030 NE U 089408-009 SW846 6020 07-Jul-10 Antimony ND 0.0005 0.003 0.006 U 089408-009 SW846 6020 Arsenic ND 0.0015 0.005 0.010 U 089408-009 SW846 6020 Barium 0.0947 0.0005 0.002 2.00 089408-009 SW846 6020 Beryllium ND 0.0001 0.0005 0.004 U 089408-009 SW846 6020 Cadmium ND 0.00011 0.001 0.005 U 089408-009 SW846 6020 Calcium 54.9 0.100 1.00 NE B 089408-009 SW846 6020 Chromium ND 0.0025 0.010 0.100 U 089408-009 SW846 6020 Cobalt ND 0.0001 0.001 NE U 089408-009 SW846 6020 Copper 0.000721 0.0003 0.001 NE J 0.013UJ 089408-009 SW846 6020 Iron 0.181 0.010 0.100 NE 089408-009 SW846 6020 Lead ND 0.0005 0.002 NE U 089408-009 SW846 6020 Magnesium 17.2 0.005 0.015 NE 089408-009 SW846 6020 Manganese ND 0.001 0.005 NE U 089408-009 SW846 6020 Mercury ND 0.000066 0.0002 0.002 U 089408-009 SW846 7470 Nickel 0.00139 0.0005 0.002 NE J 089408-009 SW846 6020 Potassium 4.52 0.080 0.300 NE 089408-009 SW846 6020 Selenium ND 0.001 0.005 0.050 U 089408-009 SW846 6020 Silver ND 0.0002 0.001 NE U 089408-009 SW846 6020 Sodium 45.9 0.080 0.250 NE 089408-009 SW846 6020 Thallium ND 0.0003 0.001 0.002 U 089408-009 SW846 6020 Uranium 0.00796 0.00005 0.0002 0.030 089408-009 SW846 6020 Vanadium 0.00828 0.003 0.010 NE J 089408-009 SW846 6020 Zinc ND 0.0026 0.010 NE U 089408-009 SW846 6020 Refer to footnotes on page 4A-57.

MIX
ED
WA
ST
E L
AN
DF
ILL
4A-29
Table 4A-5 (Continued) Summary of Total Metal Results (Unfiltered),
Mixed Waste Landfill Groundwater Monitoring, Sandia National Laboratories/New Mexico
Calendar Year 2010
Well ID Analyte Resulta (mg/L)
MDLb (mg/L)
PQLc (mg/L)
MCLd (mg/L)
Laboratory Qualifierf
Validation Qualifierg Sample No. Analytical
Methodh MWL-MW8 Aluminum 0.079 0.010 0.030 NE 089411-009 SW846 6020 12-Jul-10 Antimony ND 0.0005 0.003 0.006 U 089411-009 SW846 6020 Arsenic ND 0.0015 0.005 0.010 U 089411-009 SW846 6020 Barium 0.145 0.0005 0.002 2.00 089411-009 SW846 6020 Beryllium ND 0.0001 0.0005 0.004 U 089411-009 SW846 6020 Cadmium ND 0.00011 0.001 0.005 U 089411-009 SW846 6020 Calcium 61.2 0.100 1.00 NE 089411-009 SW846 6020 Chromium ND 0.0025 0.010 0.100 U 089411-009 SW846 6020 Cobalt 0.000101 0.0001 0.001 NE J 089411-009 SW846 6020 Copper 0.000687 0.0003 0.001 NE J 089411-009 SW846 6020 Iron 0.237 0.010 0.100 NE 089411-009 SW846 6020 Lead ND 0.0005 0.002 NE U 089411-009 SW846 6020 Magnesium 21.4 0.005 0.015 NE 089411-009 SW846 6020 Manganese 0.0111 0.001 0.005 NE 089411-009 SW846 6020 Mercury ND 0.000066 0.0002 0.002 U 089411-009 SW846 7470 Nickel 0.0013 0.0005 0.002 NE J 089411-009 SW846 6020 Potassium 5.34 0.080 0.300 NE 089411-009 SW846 6020 Selenium ND 0.001 0.005 0.050 U 089411-009 SW846 6020 Silver ND 0.0002 0.001 NE U 089411-009 SW846 6020 Sodium 46.5 0.080 0.250 NE 089411-009 SW846 6020 Thallium 0.000508 0.0003 0.001 0.002 J 089411-009 SW846 6020 Uranium 0.00745 0.00005 0.0002 0.030 B 089411-009 SW846 6020 Vanadium ND 0.003 0.010 NE U 089411-009 SW846 6020 Zinc 0.0034 0.0026 0.010 NE J 089411-009 SW846 6020 Refer to footnotes on page 4A-57.

4A-30
AN
NU
AL
GR
OU
ND
WA
TE
R M
ON
ITO
RIN
G R
EP
OR
T, CA
LE
ND
AR
YE
AR
2010
Table 4A-5 (Concluded) Summary of Total Metal Results (Unfiltered),
Mixed Waste Landfill Groundwater Monitoring, Sandia National Laboratories/New Mexico
Calendar Year 2010
Well ID Analyte Resulta (mg/L)
MDLb (mg/L)
PQLc (mg/L)
MCLd (mg/L)
Laboratory Qualifierf
Validation Qualifierg Sample No. Analytical
Methodh MWL-MW9 Aluminum 0.0124 0.010 0.030 NE J 089414-009 SW846 6020 13-Jul-10 Antimony ND 0.0005 0.003 0.006 U 089414-009 SW846 6020 Arsenic 0.00316 0.0015 0.005 0.010 J 089414-009 SW846 6020 Barium 0.0959 0.0005 0.002 2.00 089414-009 SW846 6020 Beryllium ND 0.0001 0.0005 0.004 U 089414-009 SW846 6020 Cadmium ND 0.00011 0.001 0.005 U 089414-009 SW846 6020 Calcium 58.4 0.100 1.00 NE 089414-009 SW846 6020 Chromium ND 0.0025 0.010 0.100 U 089414-009 SW846 6020 Cobalt ND 0.0001 0.001 NE U 089414-009 SW846 6020 Copper 0.00102 0.0003 0.001 NE 089414-009 SW846 6020 Iron 0.165 0.010 0.100 NE 089414-009 SW846 6020 Lead ND 0.0005 0.002 NE U 089414-009 SW846 6020 Magnesium 21.5 0.005 0.015 NE 089414-009 SW846 6020 Manganese 0.00364 0.001 0.005 NE J 089414-009 SW846 6020 Mercury ND 0.000066 0.0002 0.002 U 089414-009 SW846 7470 Nickel 0.00134 0.0005 0.002 NE J 089414-009 SW846 6020 Potassium 4.81 0.080 0.300 NE 089414-009 SW846 6020 Selenium ND 0.001 0.005 0.050 U 089414-009 SW846 6020 Silver ND 0.0002 0.001 NE U 089414-009 SW846 6020 Sodium 42.4 0.080 0.250 NE 089414-009 SW846 6020 Thallium ND 0.0003 0.001 0.002 U 089414-009 SW846 6020 Uranium 0.00881 0.00005 0.0002 0.030 B 089414-009 SW846 6020 Vanadium 0.00697 0.003 0.010 NE J 089414-009 SW846 6020 Zinc ND 0.0026 0.010 NE U 089414-009 SW846 6020 Refer to footnotes on page 4A-57.

MIX
ED
WA
ST
E L
AN
DF
ILL
4A-31
Table 4A-6 Summary of Total Metal Results (Filtered),
Mixed Waste Landfill Groundwater Monitoring, Sandia National Laboratories/New Mexico
Calendar Year 2010
Well ID Analyte Resulta (mg/L)
MDLb (mg/L)
PQLc (mg/L)
MCLd (mg/L)
Laboratory Qualifierf
Validation Qualifierg Sample No. Analytical
Methodh MWL-BW2 Aluminum ND 0.010 0.030 NE U 087998-010 SW846 6020 04-Jan-10 Antimony ND 0.0005 0.003 0.006 U 087998-010 SW846 6020 Arsenic 0.0024 0.0015 0.005 0.010 B, J 0.012U 087998-010 SW846 6020 Barium 0.0949 0.0005 0.002 2.00 087998-010 SW846 6020 Beryllium ND 0.0001 0.0005 0.004 U 087998-010 SW846 6020 Cadmium ND 0.00011 0.001 0.005 U 087998-010 SW846 6020 Calcium 75.6 0.100 1.00 NE 087998-010 SW846 6020 Chromium ND 0.0025 0.010 0.100 U 087998-010 SW846 6020 Cobalt 0.000154 0.0001 0.001 NE J 0.00087U 087998-010 SW846 6020 Copper 0.000552 0.0003 0.001 NE J 0.011U 087998-010 SW846 6020 Iron 0.203 0.010 0.100 NE 087998-010 SW846 6020 Lead ND 0.0005 0.002 NE U 087998-010 SW846 6020 Magnesium 25.2 0.005 0.015 NE 087998-010 SW846 6020 Manganese 0.00101 0.001 0.005 NE J 0.063U 087998-010 SW846 6020 Mercury ND 0.000066 0.0002 0.002 U 087998-010 SW846 7470 Nickel 0.00279 0.0005 0.002 NE 0.038U 087998-010 SW846 6020 Potassium 4.27 0.080 0.300 NE 087998-010 SW846 6020 Selenium 0.00165 0.001 0.005 0.050 J 087998-010 SW846 6020 Silver ND 0.0002 0.001 NE U 087998-010 SW846 6020 Sodium 66.3 0.400 1.25 NE 087998-010 SW846 6020 Thallium ND 0.0003 0.001 0.002 U 087998-010 SW846 6020 Uranium 0.00706 0.00005 0.0002 0.030 087998-010 SW846 6020 Vanadium 0.00455 0.003 0.010 NE J 0.024U 087998-010 SW846 6020 Zinc ND 0.0026 0.010 NE U 087998-010 SW846 6020 Refer to footnotes on page 4A-57.

4A-32
AN
NU
AL
GR
OU
ND
WA
TE
R M
ON
ITO
RIN
G R
EP
OR
T, CA
LE
ND
AR
YE
AR
2010
Table 4A-6 (Continued) Summary of Total Metal Results (Filtered),
Mixed Waste Landfill Groundwater Monitoring, Sandia National Laboratories/New Mexico
Calendar Year 2010
Well ID Analyte Resulta (mg/L)
MDLb (mg/L)
PQLc (mg/L)
MCLd (mg/L)
Laboratory Qualifierf
Validation Qualifierg Sample No. Analytical
Methodh MWL-MW7 Aluminum ND 0.010 0.030 NE U 088002-010 SW846 6020 05-Jan-10 Antimony ND 0.0005 0.003 0.006 U 088002-010 SW846 6020 Arsenic ND 0.0015 0.005 0.010 U 088002-010 SW846 6020 Barium 0.0938 0.0005 0.002 2.00 088002-010 SW846 6020 Beryllium ND 0.0001 0.0005 0.004 U 088002-010 SW846 6020 Cadmium ND 0.00011 0.001 0.005 U 088002-010 SW846 6020 Calcium 59.5 0.100 1.00 NE 088002-010 SW846 6020 Chromium ND 0.0025 0.010 0.100 U 088002-010 SW846 6020 Cobalt ND 0.0001 0.001 NE U 088002-010 SW846 6020 Copper 0.000825 0.0003 0.001 NE J 0.012U 088002-010 SW846 6020 Iron 0.155 0.010 0.100 NE 088002-010 SW846 6020 Lead ND 0.0005 0.002 NE U 088002-010 SW846 6020 Magnesium 21.3 0.005 0.015 NE 088002-010 SW846 6020 Manganese ND 0.001 0.005 NE U 088002-010 SW846 6020 Mercury ND 0.000066 0.0002 0.002 U 088002-010 SW846 7470 Nickel 0.00218 0.0005 0.002 NE 088002-010 SW846 6020 Potassium 5.15 0.080 0.300 NE 088002-010 SW846 6020 Selenium ND 0.001 0.005 0.050 U 088002-010 SW846 6020 Silver ND 0.0002 0.001 NE U 088002-010 SW846 6020 Sodium 49.3 0.400 1.25 NE 088002-010 SW846 6020 Thallium ND 0.0003 0.001 0.002 U 088002-010 SW846 6020 Uranium 0.00774 0.00005 0.0002 0.030 088002-010 SW846 6020 Vanadium 0.00528 0.003 0.010 NE J 0.024U 088002-010 SW846 6020 Zinc ND 0.0026 0.010 NE U 088002-010 SW846 6020 Refer to footnotes on page 4A-57.

MIX
ED
WA
ST
E L
AN
DF
ILL
4A-33
Table 4A-6 (Continued) Summary of Total Metal Results (Filtered),
Mixed Waste Landfill Groundwater Monitoring, Sandia National Laboratories/New Mexico
Calendar Year 2010
Well ID Analyte Resulta (mg/L)
MDLb (mg/L)
PQLc (mg/L)
MCLd (mg/L)
Laboratory Qualifierf
Validation Qualifierg Sample No. Analytical
Methodh MWL-MW7 (Duplicate) Aluminum ND 0.010 0.030 NE U 088003-010 SW846 6020 05-Jan-10 Antimony ND 0.0005 0.003 0.006 U 088003-010 SW846 6020 Arsenic ND 0.0015 0.005 0.010 U 088003-010 SW846 6020 Barium 0.0961 0.0005 0.002 2.00 088003-010 SW846 6020 Beryllium ND 0.0001 0.0005 0.004 U 088003-010 SW846 6020 Cadmium ND 0.00011 0.001 0.005 U 088003-010 SW846 6020 Calcium 60.7 0.100 1.00 NE 088003-010 SW846 6020 Chromium ND 0.0025 0.010 0.100 U 088003-010 SW846 6020 Cobalt 0.000105 0.0001 0.001 NE J 088003-010 SW846 6020 Copper 0.000672 0.0003 0.001 NE J 0.012U 088003-010 SW846 6020 Iron 0.161 0.010 0.100 NE 088003-010 SW846 6020 Lead ND 0.0005 0.002 NE U 088003-010 SW846 6020 Magnesium 22.7 0.005 0.015 NE 088003-010 SW846 6020 Manganese ND 0.001 0.005 NE U 088003-010 SW846 6020 Mercury ND 0.000066 0.0002 0.002 U 088003-010 SW846 7470 Nickel 0.0023 0.0005 0.002 NE 088003-010 SW846 6020 Potassium 5.71 0.080 0.300 NE 088003-010 SW846 6020 Selenium ND 0.001 0.005 0.050 U 088003-010 SW846 6020 Silver ND 0.0002 0.001 NE U 088003-010 SW846 6020 Sodium 53.1 0.400 1.25 NE 088003-010 SW846 6020 Thallium ND 0.0003 0.001 0.002 U 088003-010 SW846 6020 Uranium 0.00792 0.00005 0.0002 0.030 088003-010 SW846 6020 Vanadium 0.00403 0.003 0.010 NE J 0.024U 088003-010 SW846 6020 Zinc ND 0.0026 0.010 NE U 088003-010 SW846 6020 Refer to footnotes on page 4A-57.

4A-34
AN
NU
AL
GR
OU
ND
WA
TE
R M
ON
ITO
RIN
G R
EP
OR
T, CA
LE
ND
AR
YE
AR
2010
Table 4A-6 (Continued) Summary of Total Metal Results (Filtered),
Mixed Waste Landfill Groundwater Monitoring, Sandia National Laboratories/New Mexico
Calendar Year 2010
Well ID Analyte Resulta (mg/L)
MDLb (mg/L)
PQLc (mg/L)
MCLd (mg/L)
Laboratory Qualifierf
Validation Qualifierg Sample No. Analytical
Methodh MWL-MW8 Aluminum ND 0.010 0.030 NE U 088007-010 SW846 6020 06-Jan-10 Antimony ND 0.0005 0.003 0.006 U 088007-010 SW846 6020 Arsenic ND 0.0015 0.005 0.010 U 088007-010 SW846 6020 Barium 0.142 0.0005 0.002 2.00 088007-010 SW846 6020 Beryllium ND 0.0001 0.0005 0.004 U 088007-010 SW846 6020 Cadmium ND 0.00011 0.001 0.005 U 088007-010 SW846 6020 Calcium 62.3 0.100 1.00 NE 088007-010 SW846 6020 Chromium ND 0.0025 0.010 0.100 U 088007-010 SW846 6020 Cobalt 0.000119 0.0001 0.001 NE J 088007-010 SW846 6020 Copper 0.000651 0.0003 0.001 NE J 0.0021U 088007-010 SW846 6020 Iron 0.179 0.010 0.100 NE 088007-010 SW846 6020 Lead ND 0.0005 0.002 NE U 088007-010 SW846 6020 Magnesium 22.2 0.005 0.015 NE 088007-010 SW846 6020 Manganese 0.224 0.001 0.005 NE 088007-010 SW846 6020 Mercury ND 0.000066 0.0002 0.002 U 088007-010 SW846 7470 Nickel 0.00269 0.0005 0.002 NE 088007-010 SW846 6020 Potassium 5.84 0.080 0.300 NE 088007-010 SW846 6020 Selenium ND 0.001 0.005 0.050 U 088007-010 SW846 6020 Silver ND 0.0002 0.001 NE U 088007-010 SW846 6020 Sodium 53.7 0.400 1.25 NE 088007-010 SW846 6020 Thallium ND 0.0003 0.001 0.002 U 088007-010 SW846 6020 Uranium 0.00779 0.00005 0.0002 0.030 088007-010 SW846 6020 Vanadium ND 0.003 0.010 NE U 088007-010 SW846 6020 Zinc 0.00492 0.0026 0.010 NE J 088007-010 SW846 6020 Refer to footnotes on page 4A-57.

MIX
ED
WA
ST
E L
AN
DF
ILL
4A-35
Table 4A-6 (Continued) Summary of Total Metal Results (Filtered),
Mixed Waste Landfill Groundwater Monitoring, Sandia National Laboratories/New Mexico
Calendar Year 2010
Well ID Analyte Resulta (mg/L)
MDLb (mg/L)
PQLc (mg/L)
MCLd (mg/L)
Laboratory Qualifierf
Validation Qualifierg Sample No. Analytical
Methodh MWL-MW9 Aluminum ND 0.010 0.030 NE U 088011-010 SW846 6020 07-Jan-10 Antimony 0.000782 0.0005 0.003 0.006 J 088011-010 SW846 6020 Arsenic 0.00175 0.0015 0.005 0.010 J 088011-010 SW846 6020 Barium 0.0945 0.0005 0.002 2.00 088011-010 SW846 6020 Beryllium ND 0.0001 0.0005 0.004 U 088011-010 SW846 6020 Cadmium ND 0.00011 0.001 0.005 U 088011-010 SW846 6020 Calcium 60.3 0.100 1.00 NE B 088011-010 SW846 6020 Chromium ND 0.0025 0.010 0.100 U 088011-010 SW846 6020 Cobalt 0.000181 0.0001 0.001 NE J 088011-010 SW846 6020 Copper 0.00081 0.0003 0.001 NE J 0.0025U 088011-010 SW846 6020 Iron 0.180 0.010 0.100 NE 088011-010 SW846 6020 Lead ND 0.0005 0.002 NE U 088011-010 SW846 6020 Magnesium 20.3 0.005 0.015 NE 088011-010 SW846 6020 Manganese 0.00407 0.001 0.005 NE J 088011-010 SW846 6020 Mercury ND 0.000066 0.0002 0.002 U 088011-010 SW846 7470 Nickel 0.00164 0.0005 0.002 NE J 088011-010 SW846 6020 Potassium 4.95 0.080 0.300 NE 088011-010 SW846 6020 Selenium ND 0.001 0.005 0.050 U 088011-010 SW846 6020 Silver ND 0.0002 0.001 NE U 088011-010 SW846 6020 Sodium 47.8 0.080 0.250 NE 088011-010 SW846 6020 Thallium ND 0.0003 0.001 0.002 U 088011-010 SW846 6020 Uranium 0.00971 0.00005 0.0002 0.030 088011-010 SW846 6020 Vanadium ND 0.003 0.010 NE U 088011-010 SW846 6020 Zinc ND 0.0026 0.010 NE U 088011-010 SW846 6020 Refer to footnotes on page 4A-57.

4A-36
AN
NU
AL
GR
OU
ND
WA
TE
R M
ON
ITO
RIN
G R
EP
OR
T, CA
LE
ND
AR
YE
AR
2010
Table 4A-6 (Continued) Summary of Total Metal Results (Filtered),
Mixed Waste Landfill Groundwater Monitoring, Sandia National Laboratories/New Mexico
Calendar Year 2010
Well ID Analyte Resulta (mg/L)
MDLb (mg/L)
PQLc (mg/L)
MCLd (mg/L)
Laboratory Qualifierf
Validation Qualifierg Sample No. Analytical
Methodh MWL-BW2 Aluminum 0.0118 0.010 0.030 NE J 088942-010 SW846 6020 27-Apr-10 Antimony ND 0.0005 0.003 0.006 U 088942-010 SW846 6020 Arsenic 0.00331 0.0015 0.005 0.010 B, J 0.014U 088942-010 SW846 6020 Barium 0.0935 0.0005 0.002 2.00 088942-010 SW846 6020 Beryllium ND 0.0001 0.0005 0.004 U 088942-010 SW846 6020 Cadmium ND 0.00011 0.001 0.005 U 088942-010 SW846 6020 Calcium 64.1 0.200 2.00 NE B 088942-010 SW846 6020 Chromium ND 0.0025 0.010 0.100 U 088942-010 SW846 6020 Cobalt 0.000305 0.0001 0.001 NE J 0.0034U 088942-010 SW846 6020 Copper 0.00044 0.0003 0.001 NE J 0.0036U 088942-010 SW846 6020 Iron 0.0625 0.010 0.100 NE J 088942-010 SW846 6020 Lead ND 0.0005 0.002 NE U 088942-010 SW846 6020 Magnesium 20.1 0.005 0.015 NE 088942-010 SW846 6020 Manganese ND 0.001 0.005 NE U 088942-010 SW846 6020 Mercury ND 0.000066 0.0002 0.002 U 088942-010 SW846 7470 Nickel 0.00108 0.0005 0.002 NE J 088942-010 SW846 6020 Potassium 3.95 0.080 0.300 NE 088942-010 SW846 6020 Selenium 0.002 0.001 0.005 0.050 J 088942-010 SW846 6020 Silver ND 0.0002 0.001 NE U 088942-010 SW846 6020 Sodium 48.0 0.800 2.50 NE 088942-010 SW846 6020 Thallium ND 0.0003 0.001 0.002 U 088942-010 SW846 6020 Uranium 0.00638 0.00005 0.0002 0.030 088942-010 SW846 6020 Vanadium 0.00856 0.003 0.010 NE J 0.074UJ 088942-010 SW846 6020 Zinc ND 0.0026 0.010 NE U 088942-010 SW846 6020 Refer to footnotes on page 4A-57.

MIX
ED
WA
ST
E L
AN
DF
ILL
4A-37
Table 4A-6 (Continued) Summary of Total Metal Results (Filtered),
Mixed Waste Landfill Groundwater Monitoring, Sandia National Laboratories/New Mexico
Calendar Year 2010
Well ID Analyte Resulta (mg/L)
MDLb (mg/L)
PQLc (mg/L)
MCLd (mg/L)
Laboratory Qualifierf
Validation Qualifierg Sample No. Analytical
Methodh MWL-BW2 (Duplicate) Aluminum ND 0.010 0.030 NE U 088943-010 SW846 6020 27-Apr-10 Antimony ND 0.0005 0.003 0.006 U 088943-010 SW846 6020 Arsenic 0.00518 0.0015 0.005 0.010 B 0.014U 088943-010 SW846 6020 Barium 0.095 0.0005 0.002 2.00 088943-010 SW846 6020 Beryllium ND 0.0001 0.0005 0.004 U 088943-010 SW846 6020 Cadmium ND 0.00011 0.001 0.005 U 088943-010 SW846 6020 Calcium 71.7 0.200 2.00 NE B 088943-010 SW846 6020 Chromium ND 0.0025 0.010 0.100 U 088943-010 SW846 6020 Cobalt 0.000139 0.0001 0.001 NE J 0.0034U 088943-010 SW846 6020 Copper 0.00043 0.0003 0.001 NE J 0.0036U 088943-010 SW846 6020 Iron 0.0648 0.010 0.100 NE J 088943-010 SW846 6020 Lead ND 0.0005 0.002 NE U 088943-010 SW846 6020 Magnesium 21.9 0.005 0.015 NE 088943-010 SW846 6020 Manganese ND 0.001 0.005 NE U 088943-010 SW846 6020 Mercury ND 0.000066 0.0002 0.002 U 088943-010 SW846 7470 Nickel 0.00113 0.0005 0.002 NE J 088943-010 SW846 6020 Potassium 4.20 0.080 0.300 NE 088943-010 SW846 6020 Selenium 0.00206 0.001 0.005 0.050 J 088943-010 SW846 6020 Silver ND 0.0002 0.001 NE U 088943-010 SW846 6020 Sodium 53.1 0.800 2.50 NE 088943-010 SW846 6020 Thallium ND 0.0003 0.001 0.002 U 088943-010 SW846 6020 Uranium 0.00642 0.00005 0.0002 0.030 088943-010 SW846 6020 Vanadium ND 0.003 0.010 NE U 0.074UJ 088943-010 SW846 6020 Zinc ND 0.0026 0.010 NE U 088943-010 SW846 6020 Refer to footnotes on page 4A-57.

4A-38
AN
NU
AL
GR
OU
ND
WA
TE
R M
ON
ITO
RIN
G R
EP
OR
T, CA
LE
ND
AR
YE
AR
2010
Table 4A-6 (Continued) Summary of Total Metal Results (Filtered),
Mixed Waste Landfill Groundwater Monitoring, Sandia National Laboratories/New Mexico
Calendar Year 2010
Well ID Analyte Resulta (mg/L)
MDLb (mg/L)
PQLc (mg/L)
MCLd (mg/L)
Laboratory Qualifierf
Validation Qualifierg Sample No. Analytical
Methodh MWL-MW4 Aluminum 0.0172 0.010 0.030 NE J 088949-010 SW846 6020 29-Apr-10 Antimony 0.00288 0.0005 0.003 0.006 J 088949-010 SW846 6020 Arsenic 0.007 0.0015 0.005 0.010 B 0.014U 088949-010 SW846 6020 Barium 0.0969 0.0005 0.002 2.00 088949-010 SW846 6020 Beryllium ND 0.0001 0.0005 0.004 U 088949-010 SW846 6020 Cadmium 0.000237 0.00011 0.001 0.005 J 088949-010 SW846 6020 Calcium 59.5 0.200 2.00 NE B 088949-010 SW846 6020 Chromium ND 0.0025 0.010 0.100 U 088949-010 SW846 6020 Cobalt 0.000137 0.0001 0.001 NE J 088949-010 SW846 6020 Copper 0.00163 0.0003 0.001 NE 088949-010 SW846 6020 Iron 0.045 0.010 0.100 NE J NJ- 088949-010 SW846 6020 Lead ND 0.0005 0.002 NE U 088949-010 SW846 6020 Magnesium 18.6 0.005 0.015 NE 088949-010 SW846 6020 Manganese 0.004 0.001 0.005 NE J 088949-010 SW846 6020 Mercury ND 0.000066 0.0002 0.002 U 088949-010 SW846 7470 Nickel 0.00976 0.0005 0.002 NE 088949-010 SW846 6020 Potassium 5.11 0.080 0.300 NE 088949-010 SW846 6020 Selenium ND 0.001 0.005 0.050 U 088949-010 SW846 6020 Silver ND 0.0002 0.001 NE U 088949-010 SW846 6020 Sodium 44.5 0.800 2.50 NE 088949-010 SW846 6020 Thallium ND 0.0003 0.001 0.002 U 088949-010 SW846 6020 Uranium 0.0058 0.00005 0.0002 0.030 088949-010 SW846 6020 Vanadium 0.0111 0.003 0.010 NE 088949-010 SW846 6020 Zinc 0.106 0.0026 0.010 NE 088949-010 SW846 6020 Refer to footnotes on page 4A-57.

MIX
ED
WA
ST
E L
AN
DF
ILL
4A-39
Table 4A-6 (Continued) Summary of Total Metal Results (Filtered),
Mixed Waste Landfill Groundwater Monitoring, Sandia National Laboratories/New Mexico
Calendar Year 2010
Well ID Analyte Resulta (mg/L)
MDLb (mg/L)
PQLc (mg/L)
MCLd (mg/L)
Laboratory Qualifierf
Validation Qualifierg Sample No. Analytical
Methodh MWL-MW5 Aluminum ND 0.010 0.030 NE U 088918-010 SW846 6020 20-Apr-10 Antimony ND 0.0005 0.003 0.006 U 088918-010 SW846 6020 Arsenic 0.004 0.0015 0.005 0.010 B, J 0.012U 088918-010 SW846 6020 Barium 0.129 0.0005 0.002 2.00 088918-010 SW846 6020 Beryllium ND 0.0001 0.0005 0.004 U 088918-010 SW846 6020 Cadmium ND 0.00011 0.001 0.005 U 088918-010 SW846 6020 Calcium 88.8 0.100 1.00 NE B 088918-010 SW846 6020 Chromium ND 0.0025 0.010 0.100 U 088918-010 SW846 6020 Cobalt 0.000134 0.0001 0.001 NE J 0.00086U 088918-010 SW846 6020 Copper 0.000791 0.0003 0.001 NE J 0.0081U 088918-010 SW846 6020 Iron 0.165 0.010 0.100 NE B 088918-010 SW846 6020 Lead ND 0.0005 0.002 NE U 088918-010 SW846 6020 Magnesium 28.7 0.005 0.015 NE 088918-010 SW846 6020 Manganese 0.00296 0.001 0.005 NE J 088918-010 SW846 6020 Mercury ND 0.000066 0.0002 0.002 U UJ 088918-010 SW846 7470 Nickel 0.00203 0.0005 0.002 NE 088918-010 SW846 6020 Potassium 5.62 0.400 1.50 NE 088918-010 SW846 6020 Selenium 0.00135 0.001 0.005 0.050 J NJ- 088918-010 SW846 6020 Silver ND 0.0002 0.001 NE U 088918-010 SW846 6020 Sodium 60.6 0.400 1.25 NE 088918-010 SW846 6020 Thallium ND 0.0003 0.001 0.002 U 088918-010 SW846 6020 Uranium 0.0102 0.00005 0.0002 0.030 088918-010 SW846 6020 Vanadium 0.00933 0.003 0.010 NE B, J 0.022UJ 088918-010 SW846 6020 Zinc 0.00443 0.0026 0.010 NE J 088918-010 SW846 6020 Refer to footnotes on page 4A-57.

4A-40
AN
NU
AL
GR
OU
ND
WA
TE
R M
ON
ITO
RIN
G R
EP
OR
T, CA
LE
ND
AR
YE
AR
2010
Table 4A-6 (Continued) Summary of Total Metal Results (Filtered),
Mixed Waste Landfill Groundwater Monitoring, Sandia National Laboratories/New Mexico
Calendar Year 2010
Well ID Analyte Resulta (mg/L)
MDLb (mg/L)
PQLc (mg/L)
MCLd (mg/L)
Laboratory Qualifierf
Validation Qualifierg Sample No. Analytical
Methodh MWL-MW5 (Duplicate) Aluminum ND 0.010 0.030 NE U 088919-010 SW846 6020 20-Apr-10 Antimony ND 0.0005 0.003 0.006 U 088919-010 SW846 6020 Arsenic 0.00234 0.0015 0.005 0.010 B, J 0.012U 088919-010 SW846 6020 Barium 0.138 0.0005 0.002 2.00 088919-010 SW846 6020 Beryllium ND 0.0001 0.0005 0.004 U 088919-010 SW846 6020 Cadmium ND 0.00011 0.001 0.005 U 088919-010 SW846 6020 Calcium 95.5 0.100 1.00 NE B 088919-010 SW846 6020 Chromium ND 0.0025 0.010 0.100 U 088919-010 SW846 6020 Cobalt 0.000126 0.0001 0.001 NE J 0.00086U 088919-010 SW846 6020 Copper 0.000843 0.0003 0.001 NE J 0.0081U 088919-010 SW846 6020 Iron 0.198 0.010 0.100 NE B 088919-010 SW846 6020 Lead ND 0.0005 0.002 NE U 088919-010 SW846 6020 Magnesium 31.2 0.005 0.015 NE 088919-010 SW846 6020 Manganese 0.00323 0.001 0.005 NE J 088919-010 SW846 6020 Mercury ND 0.000066 0.0002 0.002 U UJ 088919-010 SW846 7470 Nickel 0.00169 0.0005 0.002 NE J 088919-010 SW846 6020 Potassium 5.92 0.400 1.50 NE 088919-010 SW846 6020 Selenium 0.00155 0.001 0.005 0.050 J NJ- 088919-010 SW846 6020 Silver ND 0.0002 0.001 NE U 088919-010 SW846 6020 Sodium 65.5 0.400 1.25 NE 088919-010 SW846 6020 Thallium ND 0.0003 0.001 0.002 U 088919-010 SW846 6020 Uranium 0.0102 0.00005 0.0002 0.030 088919-010 SW846 6020 Vanadium 0.00358 0.003 0.010 NE B, J 0.022UJ 088919-010 SW846 6020 Zinc 0.00282 0.0026 0.010 NE J 088919-010 SW846 6020 Refer to footnotes on page 4A-57.

MIX
ED
WA
ST
E L
AN
DF
ILL
4A-41
Table 4A-6 (Continued) Summary of Total Metal Results (Filtered),
Mixed Waste Landfill Groundwater Monitoring, Sandia National Laboratories/New Mexico
Calendar Year 2010
Well ID Analyte Resulta (mg/L)
MDLb (mg/L)
PQLc (mg/L)
MCLd (mg/L)
Laboratory Qualifierf
Validation Qualifierg Sample No. Analytical
Methodh MWL-MW6 Aluminum ND 0.010 0.030 NE U 088909-010 SW846 6020 19-Apr-10 Antimony ND 0.0005 0.003 0.006 U 088909-010 SW846 6020 Arsenic 0.00474 0.0015 0.005 0.010 B, J 0.012U 088909-010 SW846 6020 Barium 0.109 0.0005 0.002 2.00 088909-010 SW846 6020 Beryllium ND 0.0001 0.0005 0.004 U 088909-010 SW846 6020 Cadmium ND 0.00011 0.001 0.005 U 088909-010 SW846 6020 Calcium 86.6 0.100 1.00 NE B 088909-010 SW846 6020 Chromium ND 0.0025 0.010 0.100 U 088909-010 SW846 6020 Cobalt 0.000196 0.0001 0.001 NE J 088909-010 SW846 6020 Copper 0.00102 0.0003 0.001 NE 088909-010 SW846 6020 Iron 0.184 0.010 0.100 NE B 088909-010 SW846 6020 Lead ND 0.0005 0.002 NE U 088909-010 SW846 6020 Magnesium 28.1 0.005 0.015 NE 088909-010 SW846 6020 Manganese ND 0.001 0.005 NE U 088909-010 SW846 6020 Mercury ND 0.000066 0.0002 0.002 U UJ 088909-010 SW846 7470 Nickel 0.00156 0.0005 0.002 NE J 088909-010 SW846 6020 Potassium 5.94 0.400 1.50 NE 088909-010 SW846 6020 Selenium 0.00158 0.001 0.005 0.050 J NJ- 088909-010 SW846 6020 Silver ND 0.0002 0.001 NE U 088909-010 SW846 6020 Sodium 62.8 0.400 1.25 NE 088909-010 SW846 6020 Thallium ND 0.0003 0.001 0.002 U 088909-010 SW846 6020 Uranium 0.00989 0.00005 0.0002 0.030 088909-010 SW846 6020 Vanadium 0.00826 0.003 0.010 NE B, J 0.022UJ 088909-010 SW846 6020 Zinc ND 0.0026 0.010 NE U 088909-010 SW846 6020 Refer to footnotes on page 4A-57.

4A-42
AN
NU
AL
GR
OU
ND
WA
TE
R M
ON
ITO
RIN
G R
EP
OR
T, CA
LE
ND
AR
YE
AR
2010
Table 4A-6 (Continued) Summary of Total Metal Results (Filtered),
Mixed Waste Landfill Groundwater Monitoring, Sandia National Laboratories/New Mexico
Calendar Year 2010
Well ID Analyte Resulta (mg/L)
MDLb (mg/L)
PQLc (mg/L)
MCLd (mg/L)
Laboratory Qualifierf
Validation Qualifierg Sample No. Analytical
Methodh MWL-MW7 Aluminum ND 0.010 0.030 NE U 088929-010 SW846 6020 22-Apr-10 Antimony ND 0.0005 0.003 0.006 U 088929-010 SW846 6020 Arsenic 0.00242 0.0015 0.005 0.010 B, J 0.012U 088929-010 SW846 6020 Barium 0.108 0.0005 0.002 2.00 088929-010 SW846 6020 Beryllium ND 0.0001 0.0005 0.004 U 088929-010 SW846 6020 Cadmium ND 0.00011 0.001 0.005 U 088929-010 SW846 6020 Calcium 58.5 0.100 1.00 NE B 088929-010 SW846 6020 Chromium ND 0.0025 0.010 0.100 U 088929-010 SW846 6020 Cobalt 0.000128 0.0001 0.001 NE J 088929-010 SW846 6020 Copper 0.000799 0.0003 0.001 NE J 088929-010 SW846 6020 Iron 0.159 0.010 0.100 NE B 088929-010 SW846 6020 Lead ND 0.0005 0.002 NE U 088929-010 SW846 6020 Magnesium 19.2 0.005 0.015 NE 088929-010 SW846 6020 Manganese ND 0.001 0.005 NE U 088929-010 SW846 6020 Mercury ND 0.000066 0.0002 0.002 U UJ 088929-010 SW846 7470 Nickel 0.00127 0.0005 0.002 NE J 088929-010 SW846 6020 Potassium 5.45 0.400 1.50 NE 088929-010 SW846 6020 Selenium ND 0.001 0.005 0.050 U UJ 088929-010 SW846 6020 Silver ND 0.0002 0.001 NE U 088929-010 SW846 6020 Sodium 49.8 0.400 1.25 NE 088929-010 SW846 6020 Thallium ND 0.0003 0.001 0.002 U 088929-010 SW846 6020 Uranium 0.00842 0.00005 0.0002 0.030 088929-010 SW846 6020 Vanadium 0.00828 0.003 0.010 NE B, J 0.022UJ 088929-010 SW846 6020 Zinc ND 0.0026 0.010 NE U 088929-010 SW846 6020 Refer to footnotes on page 4A-57.

MIX
ED
WA
ST
E L
AN
DF
ILL
4A-43
Table 4A-6 (Continued) Summary of Total Metal Results (Filtered),
Mixed Waste Landfill Groundwater Monitoring, Sandia National Laboratories/New Mexico
Calendar Year 2010
Well ID Analyte Resulta (mg/L)
MDLb (mg/L)
PQLc (mg/L)
MCLd (mg/L)
Laboratory Qualifierf
Validation Qualifierg Sample No. Analytical
Methodh MWL-MW8 Aluminum ND 0.010 0.030 NE U 088934-010 SW846 6020 26-Apr-10 Antimony ND 0.0005 0.003 0.006 U 088934-010 SW846 6020 Arsenic ND 0.0015 0.005 0.010 U 088934-010 SW846 6020 Barium 0.142 0.0005 0.002 2.00 088934-010 SW846 6020 Beryllium ND 0.0001 0.0005 0.004 U 088934-010 SW846 6020 Cadmium ND 0.00011 0.001 0.005 U 088934-010 SW846 6020 Calcium 56.6 0.200 2.00 NE B 088934-010 SW846 6020 Chromium ND 0.0025 0.010 0.100 U 088934-010 SW846 6020 Cobalt 0.000266 0.0001 0.001 NE J 088934-010 SW846 6020 Copper 0.000555 0.0003 0.001 NE J 088934-010 SW846 6020 Iron 0.087 0.010 0.100 NE J 088934-010 SW846 6020 Lead ND 0.0005 0.002 NE U 088934-010 SW846 6020 Magnesium 19.2 0.005 0.015 NE 088934-010 SW846 6020 Manganese 0.00265 0.001 0.005 NE J 088934-010 SW846 6020 Mercury ND 0.000066 0.0002 0.002 U 088934-010 SW846 7470 Nickel 0.00104 0.0005 0.002 NE J 088934-010 SW846 6020 Potassium 5.25 0.080 0.300 NE 088934-010 SW846 6020 Selenium ND 0.001 0.005 0.050 U 088934-010 SW846 6020 Silver ND 0.0002 0.001 NE U 088934-010 SW846 6020 Sodium 43.0 0.080 0.250 NE 088934-010 SW846 6020 Thallium ND 0.0003 0.001 0.002 U 088934-010 SW846 6020 Uranium 0.00679 0.00005 0.0002 0.030 088934-010 SW846 6020 Vanadium ND 0.003 0.010 NE U 088934-010 SW846 6020 Zinc 0.0032 0.0026 0.010 NE J 088934-010 SW846 6020 Refer to footnotes on page 4A-57.

4A-44
AN
NU
AL
GR
OU
ND
WA
TE
R M
ON
ITO
RIN
G R
EP
OR
T, CA
LE
ND
AR
YE
AR
2010
Table 4A-6 (Continued) Summary of Total Metal Results (Filtered),
Mixed Waste Landfill Groundwater Monitoring, Sandia National Laboratories/New Mexico
Calendar Year 2010
Well ID Analyte Resulta (mg/L)
MDLb (mg/L)
PQLc (mg/L)
MCLd (mg/L)
Laboratory Qualifierf
Validation Qualifierg Sample No. Analytical
Methodh MWL-MW9 Aluminum ND 0.010 0.030 NE U 088924-010 SW846 6020 21-Apr-10 Antimony ND 0.0005 0.003 0.006 U 088924-010 SW846 6020 Arsenic 0.0044 0.0015 0.005 0.010 B, J 0.012U 088924-010 SW846 6020 Barium 0.098 0.0005 0.002 2.00 088924-010 SW846 6020 Beryllium ND 0.0001 0.0005 0.004 U 088924-010 SW846 6020 Cadmium ND 0.00011 0.001 0.005 U 088924-010 SW846 6020 Calcium 58.6 0.100 1.00 NE B 088924-010 SW846 6020 Chromium ND 0.0025 0.010 0.100 U 088924-010 SW846 6020 Cobalt 0.000158 0.0001 0.001 NE J 088924-010 SW846 6020 Copper 0.000725 0.0003 0.001 NE J 088924-010 SW846 6020 Iron 0.127 0.010 0.100 NE B 088924-010 SW846 6020 Lead ND 0.0005 0.002 NE U 088924-010 SW846 6020 Magnesium 18.5 0.005 0.015 NE 088924-010 SW846 6020 Manganese 0.00168 0.001 0.005 NE J 088924-010 SW846 6020 Mercury ND 0.000066 0.0002 0.002 U UJ 088924-010 SW846 7470 Nickel 0.00129 0.0005 0.002 NE J 088924-010 SW846 6020 Potassium 5.44 0.400 1.50 NE 088924-010 SW846 6020 Selenium ND 0.001 0.005 0.050 U UJ 088924-010 SW846 6020 Silver ND 0.0002 0.001 NE U 088924-010 SW846 6020 Sodium 49.3 0.400 1.25 NE 088924-010 SW846 6020 Thallium ND 0.0003 0.001 0.002 U 088924-010 SW846 6020 Uranium 0.00959 0.00005 0.0002 0.030 088924-010 SW846 6020 Vanadium 0.012 0.003 0.010 NE B 0.022UJ 088924-010 SW846 6020 Zinc ND 0.0026 0.010 NE U 088924-010 SW846 6020 Refer to footnotes on page 4A-57.

MIX
ED
WA
ST
E L
AN
DF
ILL
4A-45
Table 4A-6 (Continued) Summary of Total Metal Results (Filtered),
Mixed Waste Landfill Groundwater Monitoring, Sandia National Laboratories/New Mexico
Calendar Year 2010
Well ID Analyte Resulta (mg/L)
MDLb (mg/L)
PQLc (mg/L)
MCLd (mg/L)
Laboratory Qualifierf
Validation Qualifierg Sample No. Analytical
Methodh MWL-BW2 Aluminum ND 0.010 0.030 NE U 089402-010 SW846 6020 06-Jul-10 Antimony ND 0.0005 0.003 0.006 U 089402-010 SW846 6020 Arsenic ND 0.0015 0.005 0.010 U 089402-010 SW846 6020 Barium 0.0948 0.0005 0.002 2.00 089402-010 SW846 6020 Beryllium ND 0.0001 0.0005 0.004 U 089402-010 SW846 6020 Cadmium ND 0.00011 0.001 0.005 U 089402-010 SW846 6020 Calcium 70.4 0.100 1.00 NE B 089402-010 SW846 6020 Chromium ND 0.0025 0.010 0.100 U 089402-010 SW846 6020 Cobalt ND 0.0001 0.001 NE U 089402-010 SW846 6020 Copper 0.000786 0.0003 0.001 NE J 089402-010 SW846 6020 Iron 0.226 0.010 0.100 NE 089402-010 SW846 6020 Lead ND 0.0005 0.002 NE U 089402-010 SW846 6020 Magnesium 25.1 0.005 0.015 NE 089402-010 SW846 6020 Manganese ND 0.001 0.005 NE U 089402-010 SW846 6020 Mercury ND 0.000066 0.0002 0.002 U 089402-010 SW846 7470 Nickel 0.00172 0.0005 0.002 NE J 089402-010 SW846 6020 Potassium 4.00 0.080 0.300 NE 089402-010 SW846 6020 Selenium 0.00228 0.001 0.005 0.050 J 089402-010 SW846 6020 Silver ND 0.0002 0.001 NE U 089402-010 SW846 6020 Sodium 54.4 0.400 1.25 NE 089402-010 SW846 6020 Thallium ND 0.0003 0.001 0.002 U 089402-010 SW846 6020 Uranium 0.0074 0.00005 0.0002 0.030 089402-010 SW846 6020 Vanadium 0.00687 0.003 0.010 NE J 089402-010 SW846 6020 Zinc ND 0.0026 0.010 NE U 089402-010 SW846 6020 Refer to footnotes on page 4A-57.

4A-46
AN
NU
AL
GR
OU
ND
WA
TE
R M
ON
ITO
RIN
G R
EP
OR
T, CA
LE
ND
AR
YE
AR
2010
Table 4A-6 (Continued) Summary of Total Metal Results (Filtered),
Mixed Waste Landfill Groundwater Monitoring, Sandia National Laboratories/New Mexico
Calendar Year 2010
Well ID Analyte Resulta (mg/L)
MDLb (mg/L)
PQLc (mg/L)
MCLd (mg/L)
Laboratory Qualifierf
Validation Qualifierg Sample No. Analytical
Methodh MWL-MW7 Aluminum ND 0.010 0.030 NE U 089407-010 SW846 6020 07-Jul-10 Antimony ND 0.0005 0.003 0.006 U 089407-010 SW846 6020 Arsenic ND 0.0015 0.005 0.010 U 089407-010 SW846 6020 Barium 0.0982 0.0005 0.002 2.00 089407-010 SW846 6020 Beryllium ND 0.0001 0.0005 0.004 U 089407-010 SW846 6020 Cadmium ND 0.00011 0.001 0.005 U 089407-010 SW846 6020 Calcium 55.6 0.100 1.00 NE B 089407-010 SW846 6020 Chromium ND 0.0025 0.010 0.100 U 089407-010 SW846 6020 Cobalt ND 0.0001 0.001 NE U 089407-010 SW846 6020 Copper 0.00246 0.0003 0.001 NE 0.0032U 089407-010 SW846 6020 Iron 0.184 0.010 0.100 NE 0.29U 089407-010 SW846 6020 Lead ND 0.0005 0.002 NE U 089407-010 SW846 6020 Magnesium 17.4 0.005 0.015 NE 089407-010 SW846 6020 Manganese ND 0.001 0.005 NE U 089407-010 SW846 6020 Mercury ND 0.000066 0.0002 0.002 U 089407-010 SW846 7470 Nickel 0.00445 0.0005 0.002 NE 089407-010 SW846 6020 Potassium 4.91 0.080 0.300 NE 089407-010 SW846 6020 Selenium ND 0.001 0.005 0.050 U 089407-010 SW846 6020 Silver ND 0.0002 0.001 NE U 089407-010 SW846 6020 Sodium 45.3 0.080 0.250 NE 089407-010 SW846 6020 Thallium ND 0.0003 0.001 0.002 U 089407-010 SW846 6020 Uranium 0.00816 0.00005 0.0002 0.030 089407-010 SW846 6020 Vanadium 0.0081 0.003 0.010 NE J 089407-010 SW846 6020 Zinc ND 0.0026 0.010 NE U 089407-010 SW846 6020 Refer to footnotes on page 4A-57.

MIX
ED
WA
ST
E L
AN
DF
ILL
4A-47
Table 4A-6 (Continued) Summary of Total Metal Results (Filtered),
Mixed Waste Landfill Groundwater Monitoring, Sandia National Laboratories/New Mexico
Calendar Year 2010
Well ID Analyte Resulta (mg/L)
MDLb (mg/L)
PQLc (mg/L)
MCLd (mg/L)
Laboratory Qualifierf
Validation Qualifierg Sample No. Analytical
Methodh MWL-MW7 (Duplicate) Aluminum ND 0.010 0.030 NE U 089408-010 SW846 6020 07-Jul-10 Antimony ND 0.0005 0.003 0.006 U 089408-010 SW846 6020 Arsenic ND 0.0015 0.005 0.010 U 089408-010 SW846 6020 Barium 0.0971 0.0005 0.002 2.00 089408-010 SW846 6020 Beryllium ND 0.0001 0.0005 0.004 U 089408-010 SW846 6020 Cadmium ND 0.00011 0.001 0.005 U 089408-010 SW846 6020 Calcium 54.8 0.100 1.00 NE B 089408-010 SW846 6020 Chromium ND 0.0025 0.010 0.100 U 089408-010 SW846 6020 Cobalt 0.000171 0.0001 0.001 NE J 0.00088U 089408-010 SW846 6020 Copper 0.000873 0.0003 0.001 NE J 0.0032U 089408-010 SW846 6020 Iron 0.198 0.010 0.100 NE 0.29U 089408-010 SW846 6020 Lead ND 0.0005 0.002 NE U 089408-010 SW846 6020 Magnesium 17.4 0.005 0.015 NE 089408-010 SW846 6020 Manganese ND 0.001 0.005 NE U 089408-010 SW846 6020 Mercury ND 0.000066 0.0002 0.002 U 089408-010 SW846 7470 Nickel 0.00155 0.0005 0.002 NE J 089408-010 SW846 6020 Potassium 4.58 0.080 0.300 NE 089408-010 SW846 6020 Selenium ND 0.001 0.005 0.050 U 089408-010 SW846 6020 Silver ND 0.0002 0.001 NE U 089408-010 SW846 6020 Sodium 46.0 0.080 0.250 NE 089408-010 SW846 6020 Thallium ND 0.0003 0.001 0.002 U 089408-010 SW846 6020 Uranium 0.008 0.00005 0.0002 0.030 089408-010 SW846 6020 Vanadium 0.00646 0.003 0.010 NE J 089408-010 SW846 6020 Zinc ND 0.0026 0.010 NE U 089408-010 SW846 6020 Refer to footnotes on page 4A-57.

4A-48
AN
NU
AL
GR
OU
ND
WA
TE
R M
ON
ITO
RIN
G R
EP
OR
T, CA
LE
ND
AR
YE
AR
2010
Table 4A-6 (Continued) Summary of Total Metal Results (Filtered),
Mixed Waste Landfill Groundwater Monitoring, Sandia National Laboratories/New Mexico
Calendar Year 2010
Well ID Analyte Resulta (mg/L)
MDLb (mg/L)
PQLc (mg/L)
MCLd (mg/L)
Laboratory Qualifierf
Validation Qualifierg Sample No. Analytical
Methodh MWL-MW8 Aluminum ND 0.010 0.030 NE U 089411-010 SW846 6020 12-Jul-10 Antimony 0.000927 0.0005 0.003 0.006 J 089411-010 SW846 6020 Arsenic ND 0.0015 0.005 0.010 U 089411-010 SW846 6020 Barium 0.144 0.0005 0.002 2.00 089411-010 SW846 6020 Beryllium ND 0.0001 0.0005 0.004 U 089411-010 SW846 6020 Cadmium ND 0.00011 0.001 0.005 U 089411-010 SW846 6020 Calcium 61.7 0.100 1.00 NE 089411-010 SW846 6020 Chromium ND 0.0025 0.010 0.100 U 089411-010 SW846 6020 Cobalt 0.000251 0.0001 0.001 NE J 089411-010 SW846 6020 Copper 0.00058 0.0003 0.001 NE J 089411-010 SW846 6020 Iron 0.140 0.010 0.100 NE 089411-010 SW846 6020 Lead ND 0.0005 0.002 NE U 089411-010 SW846 6020 Magnesium 21.4 0.005 0.015 NE 089411-010 SW846 6020 Manganese 0.00325 0.001 0.005 NE J 089411-010 SW846 6020 Mercury ND 0.000066 0.0002 0.002 U 089411-010 SW846 7470 Nickel 0.00133 0.0005 0.002 NE J 089411-010 SW846 6020 Potassium 5.06 0.080 0.300 NE 089411-010 SW846 6020 Selenium ND 0.001 0.005 0.050 U 089411-010 SW846 6020 Silver ND 0.0002 0.001 NE U 089411-010 SW846 6020 Sodium 44.4 0.080 0.250 NE 089411-010 SW846 6020 Thallium ND 0.0003 0.001 0.002 U 089411-010 SW846 6020 Uranium 0.00739 0.00005 0.0002 0.030 B 089411-010 SW846 6020 Vanadium ND 0.003 0.010 NE U 089411-010 SW846 6020 Zinc 0.00364 0.0026 0.010 NE J 089411-010 SW846 6020 Refer to footnotes on page 4A-57.

MIX
ED
WA
ST
E L
AN
DF
ILL
4A-49
Table 4A-6 (Concluded) Summary of Total Metal Results (Filtered),
Mixed Waste Landfill Groundwater Monitoring, Sandia National Laboratories/New Mexico
Calendar Year 2010
Well ID Analyte Resulta (mg/L)
MDLb (mg/L)
PQLc (mg/L)
MCLd (mg/L)
Laboratory Qualifierf
Validation Qualifierg Sample No. Analytical
Methodh MWL-MW9 Aluminum ND 0.010 0.030 NE U 089414-010 SW846 6020 13-Jul-10 Antimony ND 0.0005 0.003 0.006 U 089414-010 SW846 6020 Arsenic 0.00316 0.0015 0.005 0.010 J 089414-010 SW846 6020 Barium 0.0971 0.0005 0.002 2.00 089414-010 SW846 6020 Beryllium ND 0.0001 0.0005 0.004 U 089414-010 SW846 6020 Cadmium ND 0.00011 0.001 0.005 U 089414-010 SW846 6020 Calcium 57.3 0.100 1.00 NE 089414-010 SW846 6020 Chromium ND 0.0025 0.010 0.100 U 089414-010 SW846 6020 Cobalt 0.00017 0.0001 0.001 NE J 089414-010 SW846 6020 Copper 0.000471 0.0003 0.001 NE J 089414-010 SW846 6020 Iron 0.138 0.010 0.100 NE 089414-010 SW846 6020 Lead ND 0.0005 0.002 NE U 089414-010 SW846 6020 Magnesium 20.3 0.005 0.015 NE 089414-010 SW846 6020 Manganese 0.00153 0.001 0.005 NE J 089414-010 SW846 6020 Mercury ND 0.000066 0.0002 0.002 U 089414-010 SW846 7470 Nickel 0.0013 0.0005 0.002 NE J 089414-010 SW846 6020 Potassium 5.03 0.080 0.300 NE 089414-010 SW846 6020 Selenium ND 0.001 0.005 0.050 U 089414-010 SW846 6020 Silver ND 0.0002 0.001 NE U 089414-010 SW846 6020 Sodium 46.4 0.080 0.250 NE 089414-010 SW846 6020 Thallium ND 0.0003 0.001 0.002 U 089414-010 SW846 6020 Uranium 0.00883 0.00005 0.0002 0.030 B 089414-010 SW846 6020 Vanadium 0.00767 0.003 0.010 NE J 089414-010 SW846 6020 Zinc ND 0.0026 0.010 NE U 089414-010 SW846 6020 Refer to footnotes on page 4A-57.

4A-50
AN
NU
AL
GR
OU
ND
WA
TE
R M
ON
ITO
RIN
G R
EP
OR
T, CA
LE
ND
AR
YE
AR
2010
Table 4A-7 Summary of Tritium, Gross Alpha, Gross Beta, Gamma Spectroscopy, Isotopic Uranium, and Radon-222 Results,
Mixed Waste Landfill Groundwater Monitoring, Sandia National Laboratories/New Mexico
Calendar Year 2010
Well ID Analyte Activitya (pCi/L)
MDAb (pCi/L)
Critical Levelc(pCi/L)
MCLd (pCi/L)
NMED HWBe
(pCi/L) Laboratory Qualifierf
Validation Qualifierg Sample No. Analytical
Methodh MWL-BW2 Americium-241 -4.38 18.4 21.9 11.0 NE NE U BD 087998-033 EPA 901.1 04-Jan-10 Cesium-137 -3.32 2.28 3.60 1.80 NE 9.3 U BD 087998-033 EPA 901.1 Cobalt-60 0.698 2.22 3.85 1.93 NE NE U BD 087998-033 EPA 901.1 Potassium-40 11.7 50.3 39.1 19.6 NE NE U BD 087998-033 EPA 901.1 Gross Alpha 1.97 NA NA 15 NE NA None 087998-034 EPA 900.0 Gross Beta 4.74 1.23 1.33 0.637 4mrem/yr NE 087998-034 EPA 900.0 Tritium 11.4 87.7 151 73.2 NE NE U BD 087998-036 EPA 906.0 MMWL-MW7 Americium-241 1.95 12.1 21.0 10.5 NE NE U BD 088002-033 EPA 901.1 05-Jan-10 Cesium-137 -3.4 3.87 3.97 1.99 NE 9.3 U BD 088002-033 EPA 901.1 Cobalt-60 -5.06 4.14 3.42 1.71 NE NE U BD 088002-033 EPA 901.1 Potassium-40 73.4 28.7 33.5 16.8 NE NE X R 088002-033 EPA 901.1 Gross Alpha 7.07 NA NA 15 NE NA None 088002-034 EPA 900.0 Gross Beta 3.98 1.04 1.07 0.513 4mrem/yr NE 088002-034 EPA 900.0 Tritium 43.6 90.1 153 74.0 NE NE U BD 088002-036 EPA 906.0 MMWL-MW7 (Duplicate) Americium-241 -18.2 12.6 20.7 10.4 NE NE U BD 088003-033 EPA 901.1 05-Jan-10 Cesium-137 0.400 2.27 3.78 1.89 NE 9.3 U BD 088003-033 EPA 901.1 Cobalt-60 0.487 2.25 3.79 1.90 NE NE U BD 088003-033 EPA 901.1 Potassium-40 -14.6 42.5 46.6 23.3 NE NE U BD 088003-033 EPA 901.1 Gross Alpha 5.02 NA NA 15 NE NA None 088003-034 EPA 900.0 Gross Beta 4.94 1.19 1.17 0.564 4mrem/yr NE 088003-034 EPA 900.0 Tritium -34.2 87.1 153 74.1 NE NE U BD 088003-036 EPA 906.0 MMWL-MW8 Americium-241 -4.21 5.90 9.77 4.89 NE NE U BD 088007-033 EPA 901.1 06-Jan-10 Cesium-137 -2.37 2.65 3.08 1.54 NE 9.3 U BD 088007-033 EPA 901.1 Cobalt-60 2.37 1.95 3.55 1.77 NE NE U BD 088007-033 EPA 901.1 Potassium-40 25.2 46.4 30.7 15.4 NE NE U BD 088007-033 EPA 901.1 Gross Alpha 4.91 NA NA 15 NE NA None 088007-034 EPA 900.0 Gross Beta 6.81 1.53 1.41 0.687 4mrem/yr NE 088007-034 EPA 900.0 Tritium -38 87.2 153 74.3 NE NE U BD 088007-036 EPA 906.0 MMWL-MW9 Americium-241 -1.52 8.81 13.6 6.82 NE NE U BD 088011-033 EPA 901.1 07-Jan-10 Cesium-137 1.92 1.84 3.26 1.63 NE 9.3 U BD 088011-033 EPA 901.1 Cobalt-60 0.306 1.84 3.11 1.56 NE NE U BD 088011-033 EPA 901.1 Potassium-40 16.8 41.2 31.1 15.6 NE NE U BD 088011-033 EPA 901.1 Gross Alpha 9.89 NA NA 15 NE NA None 088011-034 EPA 900.0 Gross Beta 10.4 2.11 1.67 0.813 4mrem/yr NE 088011-034 EPA 900.0 Tritium 27.9 91.3 157 75.6 NE NE U BD 088011-036 EPA 906.0 MRefer to footnotes on page 4A-57.
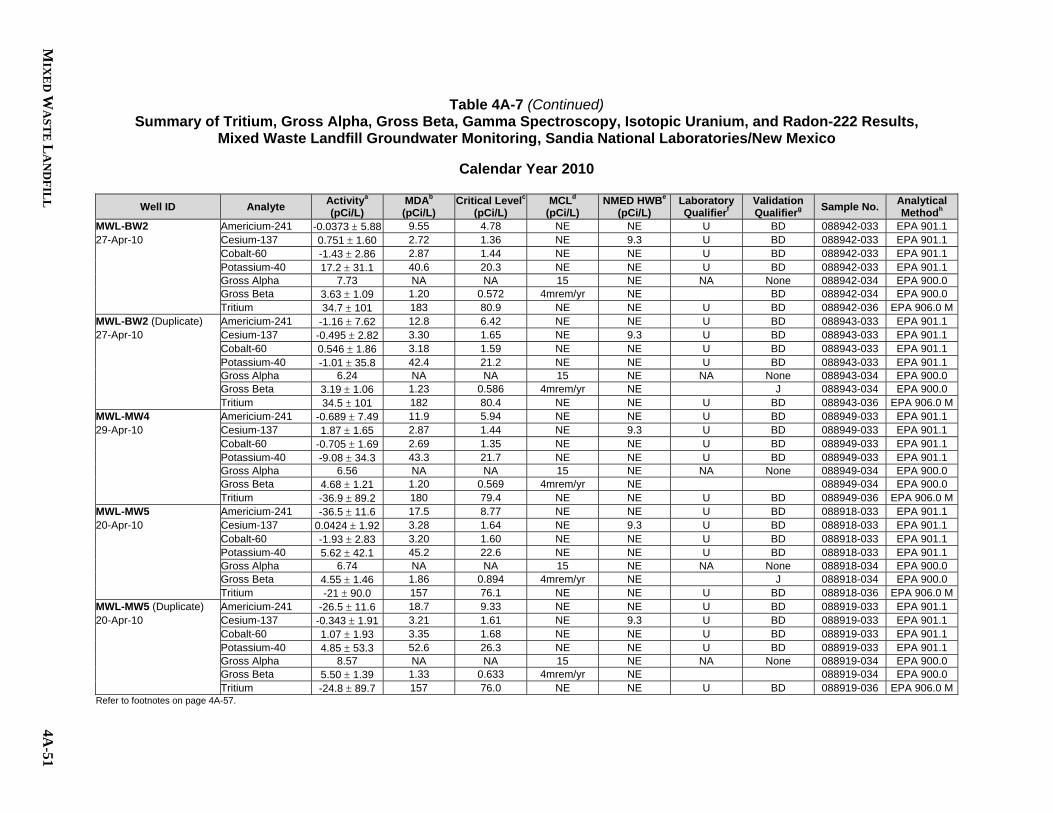
MIX
ED
WA
ST
E L
AN
DF
ILL
4A-51
Table 4A-7 (Continued) Summary of Tritium, Gross Alpha, Gross Beta, Gamma Spectroscopy, Isotopic Uranium, and Radon-222 Results,
Mixed Waste Landfill Groundwater Monitoring, Sandia National Laboratories/New Mexico
Calendar Year 2010
Well ID Analyte Activitya (pCi/L)
MDAb (pCi/L)
Critical Levelc(pCi/L)
MCLd (pCi/L)
NMED HWBe
(pCi/L) Laboratory Qualifierf
Validation Qualifierg Sample No. Analytical
Methodh MWL-BW2 Americium-241 -0.0373 5.88 9.55 4.78 NE NE U BD 088942-033 EPA 901.1 27-Apr-10 Cesium-137 0.751 1.60 2.72 1.36 NE 9.3 U BD 088942-033 EPA 901.1 Cobalt-60 -1.43 2.86 2.87 1.44 NE NE U BD 088942-033 EPA 901.1 Potassium-40 17.2 31.1 40.6 20.3 NE NE U BD 088942-033 EPA 901.1 Gross Alpha 7.73 NA NA 15 NE NA None 088942-034 EPA 900.0 Gross Beta 3.63 1.09 1.20 0.572 4mrem/yr NE BD 088942-034 EPA 900.0 Tritium 34.7 101 183 80.9 NE NE U BD 088942-036 EPA 906.0 MMWL-BW2 (Duplicate) Americium-241 -1.16 7.62 12.8 6.42 NE NE U BD 088943-033 EPA 901.1 27-Apr-10 Cesium-137 -0.495 2.82 3.30 1.65 NE 9.3 U BD 088943-033 EPA 901.1 Cobalt-60 0.546 1.86 3.18 1.59 NE NE U BD 088943-033 EPA 901.1 Potassium-40 -1.01 35.8 42.4 21.2 NE NE U BD 088943-033 EPA 901.1 Gross Alpha 6.24 NA NA 15 NE NA None 088943-034 EPA 900.0 Gross Beta 3.19 1.06 1.23 0.586 4mrem/yr NE J 088943-034 EPA 900.0 Tritium 34.5 101 182 80.4 NE NE U BD 088943-036 EPA 906.0 MMWL-MW4 Americium-241 -0.689 7.49 11.9 5.94 NE NE U BD 088949-033 EPA 901.1 29-Apr-10 Cesium-137 1.87 1.65 2.87 1.44 NE 9.3 U BD 088949-033 EPA 901.1 Cobalt-60 -0.705 1.69 2.69 1.35 NE NE U BD 088949-033 EPA 901.1 Potassium-40 -9.08 34.3 43.3 21.7 NE NE U BD 088949-033 EPA 901.1 Gross Alpha 6.56 NA NA 15 NE NA None 088949-034 EPA 900.0 Gross Beta 4.68 1.21 1.20 0.569 4mrem/yr NE 088949-034 EPA 900.0 Tritium -36.9 89.2 180 79.4 NE NE U BD 088949-036 EPA 906.0 MMWL-MW5 Americium-241 -36.5 11.6 17.5 8.77 NE NE U BD 088918-033 EPA 901.1 20-Apr-10 Cesium-137 0.0424 1.92 3.28 1.64 NE 9.3 U BD 088918-033 EPA 901.1 Cobalt-60 -1.93 2.83 3.20 1.60 NE NE U BD 088918-033 EPA 901.1 Potassium-40 5.62 42.1 45.2 22.6 NE NE U BD 088918-033 EPA 901.1 Gross Alpha 6.74 NA NA 15 NE NA None 088918-034 EPA 900.0 Gross Beta 4.55 1.46 1.86 0.894 4mrem/yr NE J 088918-034 EPA 900.0 Tritium -21 90.0 157 76.1 NE NE U BD 088918-036 EPA 906.0 MMWL-MW5 (Duplicate) Americium-241 -26.5 11.6 18.7 9.33 NE NE U BD 088919-033 EPA 901.1 20-Apr-10 Cesium-137 -0.343 1.91 3.21 1.61 NE 9.3 U BD 088919-033 EPA 901.1 Cobalt-60 1.07 1.93 3.35 1.68 NE NE U BD 088919-033 EPA 901.1 Potassium-40 4.85 53.3 52.6 26.3 NE NE U BD 088919-033 EPA 901.1 Gross Alpha 8.57 NA NA 15 NE NA None 088919-034 EPA 900.0 Gross Beta 5.50 1.39 1.33 0.633 4mrem/yr NE 088919-034 EPA 900.0 Tritium -24.8 89.7 157 76.0 NE NE U BD 088919-036 EPA 906.0 MRefer to footnotes on page 4A-57.

4A-52
AN
NU
AL
GR
OU
ND
WA
TE
R M
ON
ITO
RIN
G R
EP
OR
T, CA
LE
ND
AR
YE
AR
2010
Table 4A-7 (Continued) Summary of Tritium, Gross Alpha, Gross Beta, Gamma Spectroscopy, Isotopic Uranium, and Radon-222 Results,
Mixed Waste Landfill Groundwater Monitoring, Sandia National Laboratories/New Mexico
Calendar Year 2010
Well ID Analyte Activitya (pCi/L)
MDAb (pCi/L)
Critical Levelc(pCi/L)
MCLd (pCi/L)
NMED HWBe
(pCi/L) Laboratory Qualifierf
Validation Qualifierg Sample No. Analytical
Methodh MWL-MW6 Americium-241 -18 12.1 19.1 9.57 NE NE U BD 088909-033 EPA 901.1 19-Apr-10 Cesium-137 -0.304 1.79 2.97 1.49 NE 9.3 U BD 088909-033 EPA 901.1 Cobalt-60 0.169 1.88 3.17 1.58 NE NE U BD 088909-033 EPA 901.1 Potassium-40 -19.9 37.2 45.3 22.6 NE NE U BD 088909-033 EPA 901.1 Gross Alpha 5.26 NA NA 15 NE NA None 088909-034 EPA 900.0 Gross Beta 3.20 1.08 1.32 0.627 4mrem/yr NE J 088909-034 EPA 900.0 Tritium 41.7 91.6 156 75.4 NE NE U BD 088909-036 EPA 906.0 M Low Level Tritium 1.22 0.744 1.18 0.554 NE NE J 088909-037 HASL 300 MWL-MW7 Americium-241 1.28 5.88 9.61 4.81 NE NE U BD 088929-033 EPA 901.1 22-Apr-10 Cesium-137 0.658 1.66 2.81 1.41 NE 9.3 U BD 088929-033 EPA 901.1 Cobalt-60 1.77 1.71 3.04 1.52 NE NE U BD 088929-033 EPA 901.1 Potassium-40 -5.69 36.1 36.5 18.2 NE NE U BD 088929-033 EPA 901.1 Gross Alpha 3.52 NA NA 15 NE NA None 088929-034 EPA 900.0 Gross Beta 5.63 1.24 0.969 0.459 4mrem/yr NE 088929-034 EPA 900.0 Tritium -21 89.8 157 76.0 NE NE U BD 088929-036 EPA 906.0 MMWL-MW8 Americium-241 -8.24 5.47 8.80 4.40 NE NE U BD 088934-033 EPA 901.1 26-Apr-10 Cesium-137 1.65 1.77 3.12 1.56 NE 9.3 U BD 088934-033 EPA 901.1 Cobalt-60 -2.01 2.70 3.21 1.61 NE NE U BD 088934-033 EPA 901.1 Potassium-40 49.5 43.8 29.3 14.7 NE NE X BD 088934-033 EPA 901.1 Gross Alpha 3.52 NA NA 15 NE NA None 088934-034 EPA 900.0 Gross Beta 4.29 1.12 1.12 0.529 4mrem/yr NE 088934-034 EPA 900.0 Tritium 108 112 181 79.8 NE NE U BD 088934-036 EPA 906.0 MMWL-MW9 Americium-241 -2.93 13.3 22.5 11.3 NE NE U BD 088924-033 EPA 901.1 21-Apr-10 Cesium-137 0.313 1.86 3.19 1.60 NE 9.3 U BD 088924-033 EPA 901.1 Cobalt-60 0.497 1.94 3.35 1.67 NE NE U BD 088924-033 EPA 901.1 Potassium-40 -36.3 44.5 49.3 24.7 NE NE U BD 088924-033 EPA 901.1 Gross Alpha 1.63 NA NA 15 NE NA None 088924-034 EPA 900.0 Gross Beta 5.65 1.37 1.31 0.632 4mrem/yr NE 088924-034 EPA 900.0 Tritium -115 86.7 157 76.1 NE NE U BD 088924-036 EPA 906.0 MRefer to footnotes on page 4A-57.
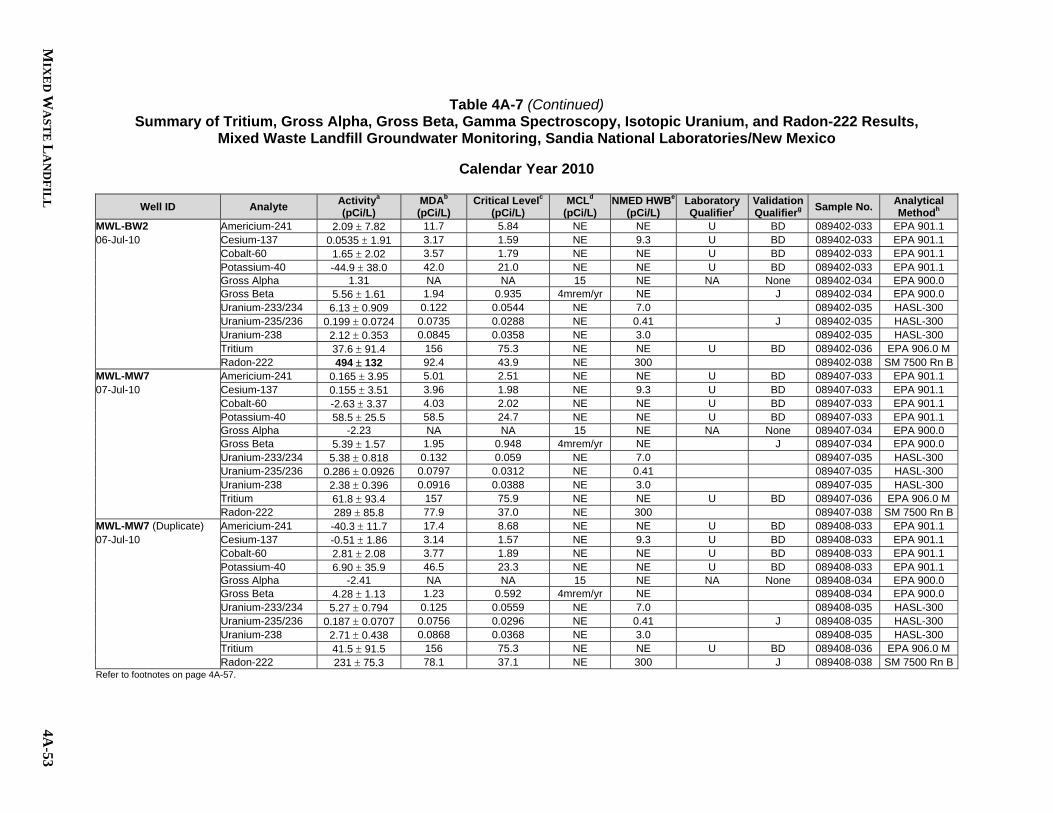
MIX
ED
WA
ST
E L
AN
DF
ILL
4A-53
Table 4A-7 (Continued) Summary of Tritium, Gross Alpha, Gross Beta, Gamma Spectroscopy, Isotopic Uranium, and Radon-222 Results,
Mixed Waste Landfill Groundwater Monitoring, Sandia National Laboratories/New Mexico
Calendar Year 2010
Well ID Analyte Activitya (pCi/L)
MDAb (pCi/L)
Critical Levelc (pCi/L)
MCLd (pCi/L)
NMED HWBe
(pCi/L) Laboratory Qualifierf
Validation Qualifierg Sample No. Analytical
Methodh MWL-BW2 Americium-241 2.09 7.82 11.7 5.84 NE NE U BD 089402-033 EPA 901.1 06-Jul-10 Cesium-137 0.0535 1.91 3.17 1.59 NE 9.3 U BD 089402-033 EPA 901.1 Cobalt-60 1.65 2.02 3.57 1.79 NE NE U BD 089402-033 EPA 901.1 Potassium-40 -44.9 38.0 42.0 21.0 NE NE U BD 089402-033 EPA 901.1 Gross Alpha 1.31 NA NA 15 NE NA None 089402-034 EPA 900.0 Gross Beta 5.56 1.61 1.94 0.935 4mrem/yr NE J 089402-034 EPA 900.0 Uranium-233/234 6.13 0.909 0.122 0.0544 NE 7.0 089402-035 HASL-300 Uranium-235/236 0.199 0.0724 0.0735 0.0288 NE 0.41 J 089402-035 HASL-300 Uranium-238 2.12 0.353 0.0845 0.0358 NE 3.0 089402-035 HASL-300 Tritium 37.6 91.4 156 75.3 NE NE U BD 089402-036 EPA 906.0 M Radon-222 494 132 92.4 43.9 NE 300 089402-038 SM 7500 Rn BMWL-MW7 Americium-241 0.165 3.95 5.01 2.51 NE NE U BD 089407-033 EPA 901.1 07-Jul-10 Cesium-137 0.155 3.51 3.96 1.98 NE 9.3 U BD 089407-033 EPA 901.1 Cobalt-60 -2.63 3.37 4.03 2.02 NE NE U BD 089407-033 EPA 901.1 Potassium-40 58.5 25.5 58.5 24.7 NE NE U BD 089407-033 EPA 901.1 Gross Alpha -2.23 NA NA 15 NE NA None 089407-034 EPA 900.0 Gross Beta 5.39 1.57 1.95 0.948 4mrem/yr NE J 089407-034 EPA 900.0 Uranium-233/234 5.38 0.818 0.132 0.059 NE 7.0 089407-035 HASL-300 Uranium-235/236 0.286 0.0926 0.0797 0.0312 NE 0.41 089407-035 HASL-300 Uranium-238 2.38 0.396 0.0916 0.0388 NE 3.0 089407-035 HASL-300 Tritium 61.8 93.4 157 75.9 NE NE U BD 089407-036 EPA 906.0 M Radon-222 289 85.8 77.9 37.0 NE 300 089407-038 SM 7500 Rn BMWL-MW7 (Duplicate) Americium-241 -40.3 11.7 17.4 8.68 NE NE U BD 089408-033 EPA 901.1 07-Jul-10 Cesium-137 -0.51 1.86 3.14 1.57 NE 9.3 U BD 089408-033 EPA 901.1 Cobalt-60 2.81 2.08 3.77 1.89 NE NE U BD 089408-033 EPA 901.1 Potassium-40 6.90 35.9 46.5 23.3 NE NE U BD 089408-033 EPA 901.1 Gross Alpha -2.41 NA NA 15 NE NA None 089408-034 EPA 900.0 Gross Beta 4.28 1.13 1.23 0.592 4mrem/yr NE 089408-034 EPA 900.0 Uranium-233/234 5.27 0.794 0.125 0.0559 NE 7.0 089408-035 HASL-300 Uranium-235/236 0.187 0.0707 0.0756 0.0296 NE 0.41 J 089408-035 HASL-300 Uranium-238 2.71 0.438 0.0868 0.0368 NE 3.0 089408-035 HASL-300 Tritium 41.5 91.5 156 75.3 NE NE U BD 089408-036 EPA 906.0 M Radon-222 231 75.3 78.1 37.1 NE 300 J 089408-038 SM 7500 Rn BRefer to footnotes on page 4A-57.

4A-54
AN
NU
AL
GR
OU
ND
WA
TE
R M
ON
ITO
RIN
G R
EP
OR
T, CA
LE
ND
AR
YE
AR
2010
Table 4A-7 (Concluded) Summary of Tritium, Gross Alpha, Gross Beta, Gamma Spectroscopy, Isotopic Uranium, and Radon-222 Results,
Mixed Waste Landfill Groundwater Monitoring, Sandia National Laboratories/New Mexico
Calendar Year 2010
Well ID Analyte Activitya (pCi/L)
MDAb (pCi/L)
Critical Levelc (pCi/L)
MCLd (pCi/L)
NMED HWBe
(pCi/L) Laboratory Qualifierf
Validation Qualifierg Sample No. Analytical
Methodh MWL-MW8 Americium-241 1.48 4.05 6.68 3.34 NE NE U BD 089411-033 EPA 901.1 12-Jul-10 Cesium-137 -9.95 5.84 8.40 4.20 NE 9.3 U BD 089411-033 EPA 901.1 Cobalt-60 -0.248 3.33 5.58 2.79 NE NE U BD 089411-033 EPA 901.1 Potassium-40 -0.685 59.6 76.8 38.4 NE NE U BD 089411-033 EPA 901.1 Gross Alpha -4.99 NA NA 15 NE NA None 089411-034 EPA 900.0 Gross Beta 9.90 2.90 3.51 1.69 4mrem/yr NE J 089411-034 EPA 900.0 Uranium-233/234 5.24 0.813 0.149 0.0667 NE 7.0 089411-035 HASL-300 Uranium-235/236 0.223 0.0844 0.0901 0.0353 NE 0.41 J 089411-035 HASL-300 Uranium-238 2.33 0.400 0.103 0.0439 NE 3.0 089411-035 HASL-300 Tritium 59.4 92.5 156 75.3 NE NE U BD 089411-036 EPA 906.0 M Radon-222 183 61.4 67.0 31.9 NE 300 J 089411-038 SM 7500 Rn BMWL-MW9 Americium-241 5.51 8.50 13.2 6.59 NE NE U BD 089414-033 EPA 901.1 13-Jul-10 Cesium-137 2.66 1.79 3.21 1.61 NE 9.3 U BD 089414-033 EPA 901.1 Cobalt-60 0.205 1.83 3.08 1.54 NE NE U BD 089414-033 EPA 901.1 Potassium-40 -10.1 39.7 42.5 21.2 NE NE U BD 089414-033 EPA 901.1 Gross Alpha -0.42 NA NA 15 NE NA None 089414-034 EPA 900.0 Gross Beta 6.44 2.04 2.44 1.16 4mrem/yr NE J 089414-034 EPA 900.0 Uranium-233/234 5.43 0.832 0.140 0.0624 NE 7.0 089414-035 HASL-300 Uranium-235/236 0.148 0.0652 0.0843 0.0331 NE 0.41 J 089414-035 HASL-300 Uranium-238 2.78 0.458 0.0969 0.0411 NE 3.0 089414-035 HASL-300 Tritium -21.9 89.5 157 75.8 NE NE U BD 089414-036 EPA 906.0 M Radon-222 294 83.4 70.5 33.6 NE 300 089414-038 SM 7500 Rn BRefer to footnotes on page 4A-57.

MIX
ED
WA
ST
E L
AN
DF
ILL
4A-55
Table 4A-8 Summary of Field Water Quality Measurementsi,
Mixed Waste Landfill Groundwater Monitoring, Sandia National Laboratories/New Mexico
Calendar Year 2010
Well ID Sample Date Temperature (0C)
Specific Conductivity (mho/cm)
Oxidation Reduction Potential
(mV) pH Turbidity
(NTU) Dissolved Oxygen (% Sat)
Dissolved Oxygen (mg/L)
MWL-BW2 04-Jan-10 18.14 704 100.3 7.07 0.18 6.7 0.63 MWL-MW7 05-Jan-10 16.74 579 196.9 7.24 0.62 41.7 4.04 MWL-MW8 06-Jan-10 17.54 594 194.9 7.23 0.65 22.0 2.08 MWL-MW9 07-Jan-10 12.97 569 219.2 7.29 1.87 59.1 6.12
MWL-BW2 27-Apr-10 20.02 688 152.4 7.12 0.25 8.0 0.72 MWL-MW4 29-Apr-10 19.80 592 257.4 7.33 0.26 27.6 2.51 MWL-MW5 20-Apr-10 21.00 863 166.5 7.03 0.24 28.9 2.56 MWL-MW6 19-Apr-10 20.72 822 175.0 7.16 0.11 33.3 2.98 MWL-MW7 22-Apr-10 16.67 565 242.3 7.30 0.42 44.2 4.29 MWL-MW8 26-Apr-10 22.14 586 153.3 7.21 0.53 30.1 2.62 MWL-MW9 21-Apr-10 21.44 571 134.5 7.20 1.50 30.8 2.71
MWL-BW2 06-Jul-10 21.70 683 143.6 7.32 0.58 12.8 1.11 MWL-MW7 07-Jul-10 23.69 568 243.1 7.55 0.28 52.6 4.44 MWL-MW8 12-Jul-10 25.54 595 167.5 7.45 0.83 27.9 2.28 MWL-MW9 13-Jul-10 25.66 577 223.5 7.47 1.65 47.9 3.90 Refer to footnotes on page 4A-57.

4A-56 ANNUAL GROUNDWATER MONITORING REPORT, CALENDAR YEAR 2010
This page intentionally left blank.

MIXED WASTE LANDFILL 4A-57
Footnotes for Mixed Waste Landfill Groundwater Monitoring Tables
aResult - Values in bold exceed the established MCL and/or NMED HWB-approved background level. - ND = not detected (at method detection limit). - Activities of zero or less are considered to be not detected. - Gross alpha activity measurements were corrected by subtracting out the total uranium activity (40 CFR Parts 9,
141, and 142, Table 1-4) - g/L = micrograms per liter - mg/L = milligrams per liter - pCi/L = picocuries per liter
bMDL or MDA Method detection limit. The minimum concentration or activity that can be measured and reported with 99% confidence that the analyte is greater than zero; analyte is matrix specific. The minimum detectable activity or minimum measured activity in a sample required to ensure a 95% probability that the measured activity is accurately quantified above the critical level. NA = not applicable for gross alpha activities. The MDA could not be calculated as the gross alpha activity was corrected by subtracting out the total uranium activity.
cPQL or Critical Level Practical quantitation limit. The lowest concentration of analytes in a sample that can be reliably determined within specified limits of precision and accuracy by that indicated method under routine laboratory operating conditions. The minimum activity that can be measured and reported with 99% confidence that the analyte is greater than zero; analyte is matrix specific. NA = not applicable for gross alpha activities. The critical level could not be calculated as the gross alpha activity was corrected by subtracting out the total uranium activity.
dMCL - Maximum contaminant level. Established by the U.S. Environmental Protection Agency Primary
Water Regulations (40 CFR 141.11[b]), National Primary Drinking Water Standards, EPA, May 2009.
- NE = not established. - The following are the MCLs for gross alpha particles and beta particles in community water systems:
15 pCi/L = Gross alpha particle activity, excluding total uranium (40 CFR Parts 9, 141, and 142, Table 1-4). 4 mrem/yr = any combination of beta and/or gamma emitting radionuclides (as dose rate).
eNMED HWB
- The New Mexico Environment Department Hazardous Waste Bureau-approved maximum background concentrations, NMED Letter to M. Zamorski and J.B. Woodard, dated November 25, 1998.
- NE = not established.
fLaboratory Qualifier B = Analyte is detected in associated laboratory method blank. J = Estimated value, the analyte concentration is below the practical quantitation limit (PQL). NA = Not applicable for gross alpha activities. U = Analyte is absent or below the method detection limit. X = Data rejected due to peak not meeting identification criteria.

4A-58 ANNUAL GROUNDWATER MONITORING REPORT, CALENDAR YEAR 2010
Footnotes for Mixed Waste Landfill Groundwater Monitoring Tables (Concluded)
gValidation Qualifier (Continued) If cell is blank, then all quality control samples met acceptance criteria with respect to submitted samples. BD = Below detection limit as used in radiochemistry to identify results that are not statistically different from zero. J = The associated value is an estimated quantity. J+ = The associated numerical value is an estimated quantity with a suspected positive bias. NJ- = Presumptive evidence of the presence of the material at an estimated quantity with a suspected negative bias. None = No data validation for corrected gross alpha activity. U = The analyte was analyzed for but was not detected. The associated numerical value is the sample quantitation limit. UJ = The analyte was analyzed for but was not detected. The associated value is an estimate and may be inaccurate or imprecise. R = The data are unusable. Re-sampling and re-analysis are necessary for verification.
hAnalytical Method
- EPA, 1979, “Methods for Chemical Analysis of Water and Wastes,” EPA-600/4-79-020, U.S. Environmental Protection Agency, Cincinnati, Ohio..
- EPA, 1980, “Prescribed Procedures for Measurement of Radioactivity in Drinking Water,” EPA-600/4-80-032, U.S. Environmental Protection Agency, Cincinnati, Ohio
- EPA, 1986, “Test Methods for Evaluating Solid Waste, Physical/Chemical Methods,” SW-846, 3rd ed., Rev. 1, U.S. Environmental Protection Agency, Washington, D.C.
- U.S. Environmental Protection Agency, Washington, D.C.; or Clesceri, Greenburg, and Eaton, 1998, Standard Methods for the Examination of Water and Wastewater, 20th ed., Method 2320B.
- U.S. Department of Energy, Environmental Measurements Laboratory, 1990, EML Procedures Manual, 27th ed., Vol. 1, Rev. 1992, HASL-300.
- Beckman, 1998, Standard Methods for the Examination of Water and Wastewater, 7500-Rn B Method, 20th ed., Beckman LS5000TD Liquid Scintillation System Operation Manual, May 1988.
iField Water Quality Measurements - Field measurements collected prior to sampling. °C = degrees Celsius. % Sat = present saturation. mho/cm = micromhos per centimeter. mg/L = milligrams per liter. mV = millivolts. NTU = nephelometric turbidity units. pH = potential of hydrogen (negative logarithm of the hydrogen ion concentration).

MIXED WASTE LANDFILL 4B-1
Attachment 4B Mixed Waste Landfill
Hydrographs

4B-2 ANNUAL GROUNDWATER MONITORING REPORT, CALENDAR YEAR 2010
This page intentionally left blank.
MIXED WASTE LANDFILL 4B-3
Attachment 4B Hydrographs 4B-1 Mixed Waste Landfill Groundwater Wells ................................................................... 4B-5

4B-4 ANNUAL GROUNDWATER MONITORING REPORT, CALENDAR YEAR 2010
This page intentionally left blank.

MIX
ED
WA
ST
E L
AN
DF
ILL
4B-5
Figure 4B-1. Mixed Waste Landfill Groundwater Wells
4870
4875
4880
4885
4890
4895
4900
4905
4910
4915
Wat
er Le
vel E
leva
tion, f
amsl
MWL‐BW2 MWL‐MW4 MWL‐MW5 MWL‐MW6 MWL‐MW7 MWL‐MW8 MWL‐MW9
MWL‐MW4:No water level measurements collected between May 2009 through March 2010 due to MWL Cover Installation activities.

4B-6 ANNUAL GROUNDWATER MONITORING REPORT, CALENDAR YEAR 2010
This page intentionally left blank.

TECHNICAL AREA V 5-1
5.0 Technical Area V Groundwater
5.1 Introduction
Trichloroethene (TCE) and nitrate have been identified as constituents of concern (COCs) in groundwater at the Technical Area (TA)-V Groundwater Investigation Study Area (TA-V study area) based on detections above the U.S. Environmental Protection Agency (EPA) maximum contaminant levels (MCLs) in samples collected from monitoring wells. Since 1993, the maximum concentrations detected in the study area have been 26 micrograms per liter (g/L) of TCE and 19 milligrams per liter (mg/L) of nitrate. The EPA and State of New Mexico drinking water standards (MCLs) for TCE and nitrate are 5 g/L and 10 mg/L (as nitrogen), respectively. Unique features of the TA-V study area include low concentrations of TCE and nitrate in a deep alluvial aquifer.
5.1.1 Location
TA-V occupies approximately 35 acres in the northeastern corner of TA-III (Figure 5-1) at Sandia National Laboratories, New Mexico (SNL/NM). TA-V is located in the north-central portion of Kirtland Air Force Base (KAFB), south of the City of Albuquerque (COA) (Figure 5-1). The SNL/NM facility is a government-owned, contractor-operated, multi-program laboratory overseen by the U.S. Department of Energy (DOE), National Nuclear Security Administration through the Sandia Site Office in Albuquerque, New Mexico. Sandia Corporation (Sandia), a wholly owned subsidiary of Lockheed Martin Corporation, manages and operates SNL/NM under Contract DE-AC04-94AL85000. TA-V is situated within the Albuquerque Basin, and the vadose zone at TA-V is approximately 500 feet (ft) in thickness and consists of heterogeneous, lenticular, coarse- to fine-grained deposits. The underlying aquifer at TA-V consists of unconsolidated fine-grained, clay-rich, alluvial-fan sediments. Groundwater in the vicinity of TA-V flows generally from east to west. To the west of TA-V, groundwater flow paths turn to the north in response to pumping from municipal well fields located north of KAFB and from water supply wells located in the northern portion of KAFB.
5.1.2 Site History
TA-V facilities are designed to test radiation effects on components and include two research reactors, the Gamma Irradiation Facility and Hot Cell Facility. Historically, wastewater containing contaminants derived from these facilities was disposed of to drain fields, seepage pits, and unlined ponds. SNL/NM Environmental Restoration (ER) Operations (formerly ER Project) personnel have conducted numerous groundwater investigations in the TA-V study area since 1992 (Table 5-1). Many of these investigations were site-specific and conducted in support of various Solid Waste Management Unit (SWMU) assessments. Other investigations in the TA-V study area were more regional studies conducted by the SNL/NM Site-Wide Hydrogeologic Characterization Project (SNL February 1998).
5.1.3 Monitoring History
Investigations of groundwater quality in the TA-V study area have been conducted by Sandia over the past 18 years (Table 5-1). Groundwater monitoring at TA-V began in October 1992. TCE was first detected in monitoring well LWDS-MW1 in October 1993 and was later detected in TAV-MW1 in September 1995. Since then, low concentrations of TCE have been consistently detected during quarterly sampling events. Potential sources for TCE in groundwater include the Liquid Waste Disposal System (LWDS) drain field and surface impoundments and the TA-V seepage pits (Section 5.1.7).
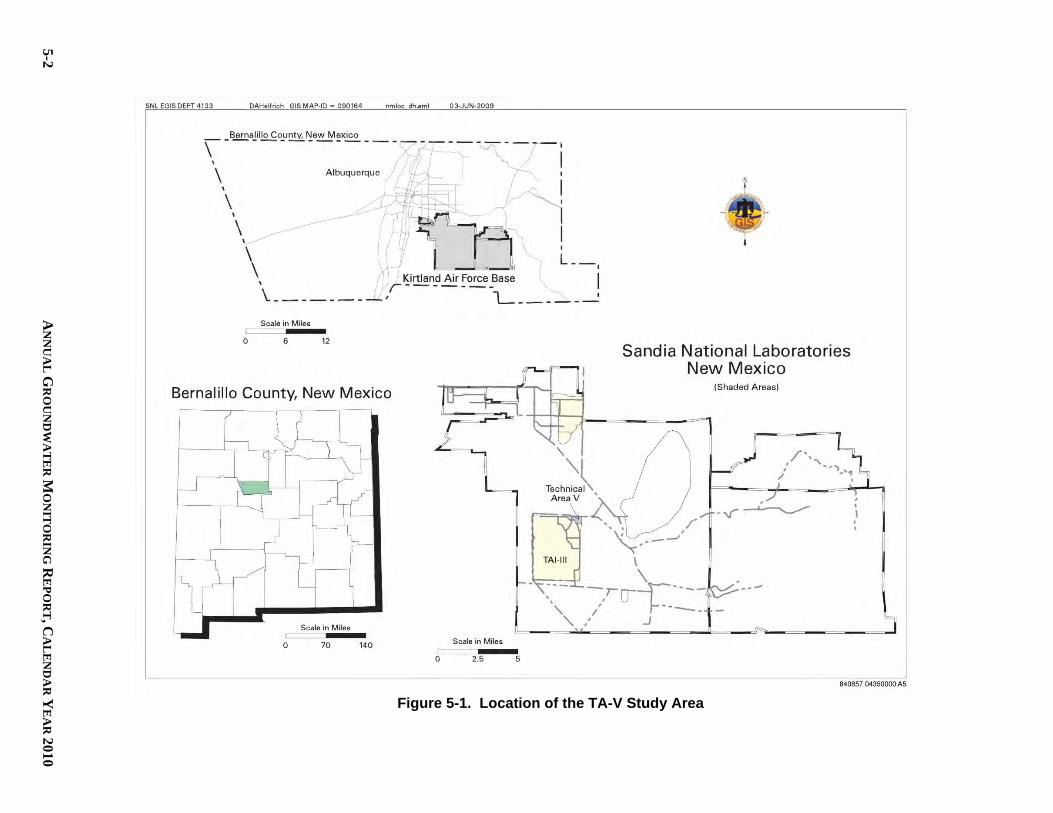
5-2 A
NN
UA
L G
RO
UN
DW
AT
ER
MO
NIT
OR
ING
RE
PO
RT, C
AL
EN
DA
R Y
EA
R 2010
Figure 5-1. Location of the TA-V Study Area
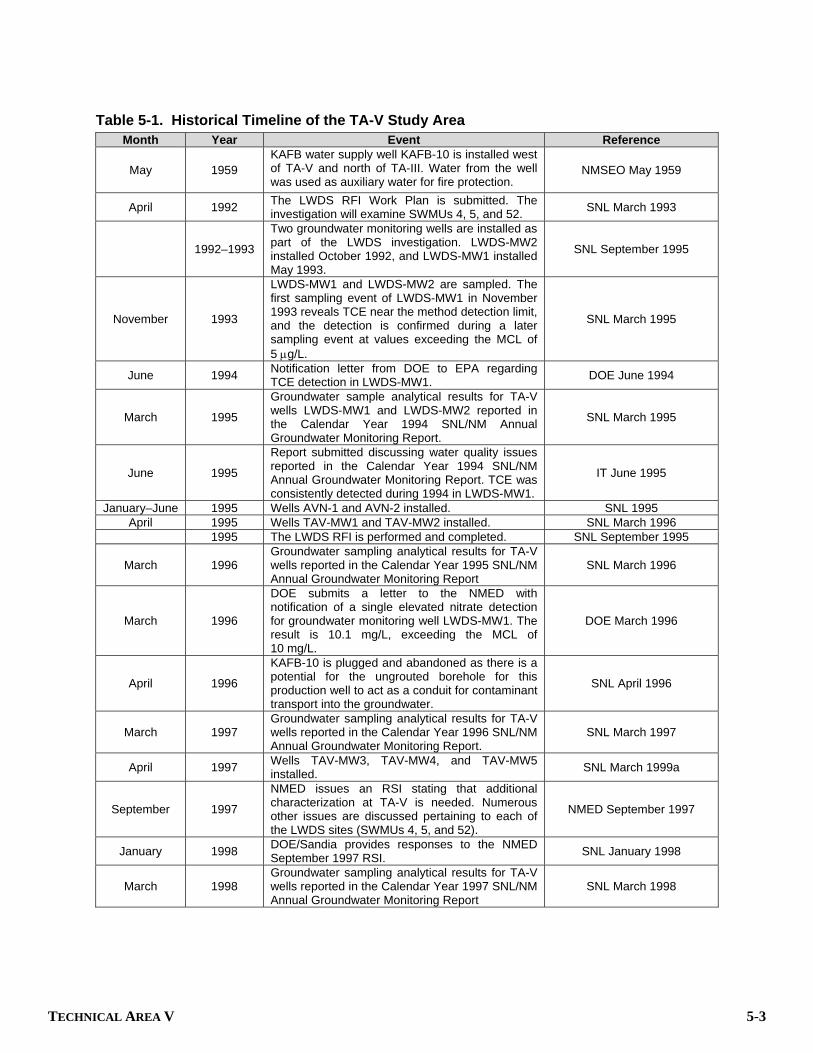
TECHNICAL AREA V 5-3
Table 5-1. Historical Timeline of the TA-V Study Area Month Year Event Reference
May 1959 KAFB water supply well KAFB-10 is installed west of TA-V and north of TA-III. Water from the well was used as auxiliary water for fire protection.
NMSEO May 1959
April 1992 The LWDS RFI Work Plan is submitted. The investigation will examine SWMUs 4, 5, and 52. SNL March 1993
1992–1993
Two groundwater monitoring wells are installed as part of the LWDS investigation. LWDS-MW2 installed October 1992, and LWDS-MW1 installed May 1993.
SNL September 1995
November 1993
LWDS-MW1 and LWDS-MW2 are sampled. The first sampling event of LWDS-MW1 in November 1993 reveals TCE near the method detection limit, and the detection is confirmed during a later sampling event at values exceeding the MCL of 5 g/L.
SNL March 1995
June 1994 Notification letter from DOE to EPA regarding TCE detection in LWDS-MW1. DOE June 1994
March 1995
Groundwater sample analytical results for TA-V wells LWDS-MW1 and LWDS-MW2 reported in the Calendar Year 1994 SNL/NM Annual Groundwater Monitoring Report.
SNL March 1995
June 1995
Report submitted discussing water quality issues reported in the Calendar Year 1994 SNL/NM Annual Groundwater Monitoring Report. TCE was consistently detected during 1994 in LWDS-MW1.
IT June 1995
January–June 1995 Wells AVN-1 and AVN-2 installed. SNL 1995 April 1995 Wells TAV-MW1 and TAV-MW2 installed. SNL March 1996
1995 The LWDS RFI is performed and completed. SNL September 1995
March 1996 Groundwater sampling analytical results for TA-V wells reported in the Calendar Year 1995 SNL/NM Annual Groundwater Monitoring Report
SNL March 1996
March 1996
DOE submits a letter to the NMED with notification of a single elevated nitrate detection for groundwater monitoring well LWDS-MW1. The result is 10.1 mg/L, exceeding the MCL of 10 mg/L.
DOE March 1996
April 1996
KAFB-10 is plugged and abandoned as there is a potential for the ungrouted borehole for this production well to act as a conduit for contaminant transport into the groundwater.
SNL April 1996
March 1997 Groundwater sampling analytical results for TA-V wells reported in the Calendar Year 1996 SNL/NM Annual Groundwater Monitoring Report.
SNL March 1997
April 1997 Wells TAV-MW3, TAV-MW4, and TAV-MW5 installed. SNL March 1999a
September 1997
NMED issues an RSI stating that additional characterization at TA-V is needed. Numerous other issues are discussed pertaining to each of the LWDS sites (SWMUs 4, 5, and 52).
NMED September 1997
January 1998 DOE/Sandia provides responses to the NMED September 1997 RSI. SNL January 1998
March 1998 Groundwater sampling analytical results for TA-V wells reported in the Calendar Year 1997 SNL/NM Annual Groundwater Monitoring Report
SNL March 1998

5-4 ANNUAL GROUNDWATER MONITORING REPORT, CALENDAR YEAR 2010
Table 5-1. Historical Timeline of the TA-V Study Area (Continued) Month Year Event Reference
October 1998 DOE/Sandia provides cross sections to NMED for the LWDS as required in the September 1997 RSI from NMED.
DOE October 1998
March 1999 Groundwater sampling analytical results for TA-V wells reported in the Fiscal Year 1998 SNL/NM Annual Groundwater Monitoring Report.
SNL March 1999b
March 1999
SNL/NM submits a summary report detailing groundwater conditions for the TA-III/V area that includes sites from OU 1306 (TA-III) and OU 1307 (LWDS).
SNL March 1999a
March 2000 Groundwater sampling analytical results for TA-V wells reported in the Fiscal Year 1999 SNL/NM Annual Groundwater Monitoring Report
SNL March 2000
April 2001 Groundwater sampling analytical results for TA-V wells reported in the Fiscal Year 2000 SNL/NM Annual Groundwater Monitoring Report.
SNL April 2001
March - May 2001 Wells TAV-MW6, TAV-MW7, TAV-MW8, and TAV-MW9 installed. SNL October 2001
November 2001
A summary of groundwater sampling results from TA-V wells for Fiscal Years 1999 and 2000 are compiled into a report. This is an update of the March 1999 summary report.
SNL November 2001
March 2002 Groundwater sampling analytical results for TA-V wells reported in the Fiscal Year 2001 SNL/NM Annual Groundwater Monitoring Report.
SNL March 2002
March 2003 Groundwater sampling analytical results for TA-V wells reported in the Fiscal Year 2002 SNL/NM Annual Groundwater Monitoring Report.
SNL March 2003a
June 2003 Subsurface geology at KAFB, including the TA-V area, is updated. Van Hart June 2003
March 2004 Groundwater sampling analytical results for TA-V wells reported in the Fiscal Year 2003 SNL/NM Annual Groundwater Monitoring Report.
SNL March 2004
April 2004
The NMED issues the Compliance Order on Consent (the Consent Order) to the DOE/Sandia, which identified TA-V as an area with groundwater contamination requiring a CME.
NMED April 2004
May 2004
DOE/Sandia submit the Current Conceptual Model of Groundwater Flow and Contaminant Transport at Sandia National Laboratories/New Mexico Technical Area-V. This document was required by the Consent Order.
SNL April 2004a
May 2004
DOE/Sandia submit the Corrective Measures Evaluation Work Plan, Technical Area V Groundwater. This document was required by the Consent Order.
SNL April 2004b
October 2004
The NMED issues an approval with modifications to the TA-V CME Work Plan and the Current Conceptual Model of Groundwater Flow and Contaminant Transport.
NMED October 2004

TECHNICAL AREA V 5-5
Table 5-1. Historical Timeline of the TA-V Study Area (Continued) Month Year Event Reference
December 2004
DOE/Sandia submit responses to the NMED request of October 2004. The responses are included in the revised Corrective Measures Evaluation Work Plan, Technical Area V Groundwater, Revision 0.
SNL December 2004
July 2005
DOE/Sandia submit the Corrective Measures Evaluation Report for Technical Area V Groundwater. The report details the selection of a preferred remedial alternative, cleanup goals, and the corrective measures implementation plan.
SNL July 2005
October 2005 DOE/Sandia submit request to NMED for change in sampling frequency for TA-V wells. DOE October 2005
October 2005 Groundwater sampling analytical results for TA-V wells reported in the Fiscal Year 2004 SNL/NM Annual Groundwater Monitoring Report.
SNL October 2005
March 2006
DOE/Sandia request the removal of well AVN-2 from the TA-V monitoring network due to insufficient water for sampling caused by declining water levels. The well would be returned to service if water levels in the well recover.
DOE March 2006
November 2006 Groundwater sampling analytical results for TA-V wells reported in the Fiscal Year 2005 SNL/NM Annual Groundwater Monitoring Report.
SNL November 2006
March 2007 Groundwater sampling analytical results for TA-V wells reported in the Fiscal Year 2006 SNL/NM Annual Groundwater Monitoring Report.
SNL March 2007
January–March 2008
Well TAV-MW1 plugged and abandoned, and well TAV-MW10 installed as replacement for TAV-MW1.
SNL June 2008
March 2008 Groundwater sampling analytical results for TA-V wells reported in the Fiscal Year 2007 SNL/NM Annual Groundwater Monitoring Report.
SNL March 2008
July 2008 NMED issues an NOD on the July 2005 CME Report for TA-V Groundwater. NMED July 2008
September 2008 The 13 TA-V monitoring wells are resurveyed to establish new northing and easting coordinates and elevations for each well.
SNL October 2008
December 2008
SNL/NM, DOE, and NMED personnel attend an MNA seminar presented by Savannah River National Laboratory personnel and also discuss technical issues and the need for additional characterization work at TA-V.
SRNL December 2008
April 2009 NMED requires characterization of perchlorate in groundwater in one well in the TA-V study area. NMED April 2009
April 2009 DOE/Sandia submit a response to the NOD on the July 2005 CME Report for TA-V Groundwater. SNL April 2009
June 2009 Groundwater sampling analytical results for TA-V wells reported in the Calendar Year 2008 SNL/NM Annual Groundwater Monitoring Report.
SNL June 2009
August 2009 NMED issues a second NOD on the July 2005 CME Report for TA-V Groundwater. NMED August 2009

5-6 ANNUAL GROUNDWATER MONITORING REPORT, CALENDAR YEAR 2010
Table 5-1. Historical Timeline of the TA-V Study Area (Concluded) Month Year Event Reference
November 2009 DOE/Sandia submit a response to the second NOD on the July 2005 CME Report for TA-V Groundwater.
SNL November 2009
December 2009 NMED issues a third NOD on the July 2005 CME Report for TA-V Groundwater. NMED December 2009
February 2010 DOE/Sandia submit a response to the third NOD on the July 2005 CME Report for TA-V Groundwater.
SNL February 2010
May 2010
NMED issues a notice of conditional approval for the TA-V Groundwater Investigation Work Plan associated with July 2005 TA-V Groundwater CME Report.
NMED May 2010
October 2010 DOE/Sandia began installation of groundwater monitoring wells TAV-MW11, TAV-MW12, TAV-MW13, and TAV-MW14.
SNL February 2010
November 2010 DOE/Sandia submit a report on the geophysical log and slug test results for the new TA-V wells. SNL November 2010
December 2010 NMED issues approval for the modification of soil-vapor monitoring well design. NMED December 2010
NOTES: CME = Corrective Measures Evaluation. DOE = U.S. Department of Energy. EPA = U.S. Environmental Protection Agency. KAFB = Kirtland Air Force Base. LWDS = Liquid Waste Disposal System. MCL = Maximum Contaminant Level. µg/L = Microgram(s) per liter. mg/L = Milligram(s) per liter. MNA = Monitored Natural Attenuation. MW = Monitoring well. NMED = New Mexico Environment Department. NMSEO = New Mexico State Engineer Office. NOD = Notice of Disapproval. OU = Operable Unit. RCRA = Resource Conservation and Recovery Act. RFI = RCRA Facility Investigation. RSI = Request for Supplemental Information. Sandia = Sandia Corporation. SNL = Sandia National Laboratories. SNL/NM = Sandia National Laboratories/New Mexico. SRNL = Savannah River National Laboratory. SWMU = Solid Waste Management Unit. TA = Technical Area. TCE = Trichloroethene.

TECHNICAL AREA V 5-7
In April 2004, the Compliance Order on Consent (the Order) between the New Mexico Environment Department (NMED), DOE, and Sandia specified that TA-V was an area of groundwater contamination (NMED April 2004). Since the initial discoveries of TCE and nitrate at the TA-V study area, numerous characterization activities have been conducted (Table 5-1), which are summarized in the Current Conceptual Model of Groundwater Flow and Contaminant Transport at Sandia National Laboratories/New Mexico Technical Area-V (SNL April 2004a). In response to the Order, this document was submitted to the NMED along with the Corrective Measures Evaluation (CME) Work Plan, TA-V Groundwater (SNL April 2004b) by Sandia in April 2004. The Current Conceptual Model provides a comprehensive list of groundwater monitoring data sources used to support the summary of investigations. After fulfilling the requirements of the CME Work Plan, Sandia submitted the CME Report to the NMED in July 2005 (SNL July 2005).
5.1.4 Current Monitoring Network
In Calendar Year (CY) 2010, 12 wells in the TA-V study area were being monitored for water quality and water levels (Figure 5-2; Table 5-2). Table XI-1 of the Order (NMED April 2004) specifies that the sampling frequency for groundwater monitoring at TA-V is quarterly.
5.1.5 Summary of Calendar Year Activities
The following activities took place for the TA-V study area during CY 2010:
Obtained monthly or quarterly water level measurements for all TA-V wells. Conducted quarterly groundwater sampling events at 12 wells (Table 5-2) in February
2010, June 2010, August/September 2010, and October 2010 (SNL January 2010, May 2010, August 2010, and September 2010).
Performed quarterly perchlorate screening groundwater sampling and reporting for LWDS-
MW1 in February 2010 (NMED April 2009). Submitted a response to the NMED’s third Notice of Disapproval (NMED December 2009)
for the CME Report for TA-V Groundwater (SNL February 2010). NMED issued a Notice of Conditional Approval for the TA-V Groundwater Investigation
Work Plan associated with the July 2005 TA-V CME Report (NMED May 2010). Installed groundwater monitoring wells TAV-MW11, TAV-MW12, TAV-MW13, and
TAV-MW14 (SNL February 2010). Submitted a report on the geophysical log and slug test results for the new TA-V wells
(SNL November 2010). Discussed changes in soil-vapor well installation and received approval from the NMED
(NMED December 2010). Prepared tables of analytical results (Attachment 5A), concentration versus time plots
(Attachment 5B), and hydrographs (Attachment 5C) in support of this report.

5-8 A
NN
UA
L G
RO
UN
DW
AT
ER
MO
NIT
OR
ING
RE
PO
RT, C
AL
EN
DA
R Y
EA
R 2010
Figure 5-2. TA-V Monitoring Well Locations (12 Active Wells)

TECHNICAL AREA V 5-9
Table 5-2. Groundwater Monitoring Wells at the TA-V Study Area
Well Installation Year WQ WL Comments
LWDS-MW1 1993 √ √ Regional aquifer LWDS-MW2 1992 √ √ Regional aquifer AVN-1 1995 √ √ Regional aquifer AVN-2 1995 Regional aquifer; currently dry TAV-MW1 1995 Regional aquifer, plugged and abandoned February 2008 TAV-MW2 1995 √ √ Regional aquifer TAV-MW3 1997 √ √ Regional aquifer TAV-MW4 1997 √ √ Regional aquifer TAV-MW5 1997 √ √ Regional aquifer TAV-MW6 2001 √ √ Regional aquifer, water table completion TAV-MW7 2001 √ √ Regional aquifer, deep completion (597–617 feet) TAV-MW8 2001 √ √ Regional aquifer, water table completion TAV-MW9 2001 √ √ Regional aquifer, deep completion (582–602 feet) TAV-MW10 2008 √ √ Regional aquifer, replaced TAV-MW1 TAV-MW11 2010 Regional aquifer, water table completion TAV-MW12 2010 Regional aquifer, water table completion TAV-MW13 2010 Regional aquifer, deep completion (525–545 feet) TAV-MW14 2010 Regional aquifer, water table completion
NOTE: Check marks in the WQ and WL columns indicate WQ sampling and WL measurements were obtained during this reporting period. LWDS = Liquid Waste Disposal System. TA-V = Technical Area V. WL = Water level. WQ = Water quality.
5.1.6 Summary of Future Activities
The following activities are anticipated for the TA-V study area during CY 2011:
Obtain periodic water level measurements for all TA-V wells. Conduct quarterly or semi-annual groundwater sampling at 16 TA-V wells. Install three soil-vapor monitoring wells. Obtain location surveys for the new groundwater and soil-vapor monitoring wells. Conduct quarterly soil-vapor sampling at three TA-V wells. Submit a report on the TA-V field activities.
5.1.7 Current Conceptual Model
The conceptual site model of contaminant transport at TA-V includes release from the source term, migration through the vadose zone, and movement in groundwater.

5-10 ANNUAL GROUNDWATER MONITORING REPORT, CALENDAR YEAR 2010
TCE and other organic chemicals were present in water that was discharged to the LWDS drain field from 1962 to 1967 and to the TA-V seepage pits from the 1960s until the early 1980s when disposal practices were modified to protect the environment. Wastewater discharged to the seepage pits from the early 1980s until 1992 contained no TCE. Water containing dissolved concentrations of TCE and other organic chemicals moved rapidly through the alluvial fan lithofacies into the aquifer. Upon cessation of disposal, vertical pathways to the aquifer drained rapidly. Continued flushing of the vadose zone beneath the seepage pits until 1992 likely removed significant sources of secondary contaminants. Low concentrations of TCE present in the aquifer today are a result of these initial releases. The slow rate of groundwater flow (4 to 20 ft per year [ft/yr]) is responsible for the present distribution of TCE in the aquifer. Nitrate concentrations in groundwater at TA-V are primarily derived from unknown upgradient sources. These concentrations have exceeded MCLs in the two upgradient AVN wells, LWDS-MW1, and TAV-MW10.
5.1.7.1 Regional Hydrogeologic Conditions
SNL/NM TA-V is located within the Albuquerque Basin of the Rio Grande Rift in north-central New Mexico. The Rio Grande Rift is marked by a series of sediment-filled structural basins and adjoining uplifted mountain ranges. One of these basins, the Albuquerque Basin (also known as the Middle Rio Grande Basin), covers about 3,060 square miles in central New Mexico and extends from Cochiti Reservoir on the north to San Acacia, New Mexico, on the south. The Albuquerque Basin includes KAFB and TA-V. The sedimentary deposits of the Santa Fe Group and overlying alluvium that fill the Albuquerque Basin contain the Santa Fe Group aquifer system. This aquifer system provides the primary source of municipal, domestic, and industrial water in the Albuquerque area. The structure of the aquifer system within the Middle Rio Grande Basin today is complex (Bartolino and Cole 2002). The major hydrostratigraphic units in the aquifer are tabular and wedge-shaped bodies that are truncated and displaced by numerous faults. Few of the major units are present continuously throughout all three subbasins, and most “pinch out” against the subsurface basement blocks that separate the subbasins. These major units are hundreds to thousands of feet thick, extend over tens of square miles, and primarily consist of unconsolidated and partially cemented deposits that interfinger in complex arrangements. Prior to development of water resources in the Albuquerque area, groundwater flow direction in the Albuquerque Basin generally was from the north to the south, with a westward component of flow from recharge areas along mountain-front boundaries to the east (Bartolino and Cole 2002). As the Santa Fe Group aquifer has been developed as a source for municipal and industrial water supplies, groundwater flow directions have been altered toward pumping centers to the north of TA-V. Regional discharge occurs as groundwater moves out of the Albuquerque Basin into downgradient basins on the Rio Grande Rift as underflow or through discharge to the Rio Grande. Contaminant transport at TA-V is constrained by geologic features. The stratigraphic units of hydrologic significance consist of the alluvial fan lithofacies and Ancestral Rio Grande (ARG) lithofacies. TA-V is largely underlain by a thick section of alluvial fan deposits. These deposits consist of the alluvial fan lithofacies of the Santa Fe Group overlain by post-Santa Fe Group alluvial fan deposits. The deepest monitoring well in the study area (AVN-1) penetrated 650 ft of these deposits. The total thickness of deposits at TA-V is not known.
TECHNICAL AREA V 5-11
The alluvial fan lithofacies is further subdivided into lower and upper sections. The lower section consists of a fine-grained, clay-rich unit. This unit has been identified as low-energy piedmont deposits derived from upland soil that developed during a preglacial humid climate. The upper section consists of relatively coarse-grained sediments deposited in a higher-energy environment. The water table of the Santa Fe Group aquifer at TA-V is located in the fine-grained lower unit of alluvial fan deposits. The post-Santa Fe Group alluvial fan deposits blanket the area around TA-V and compose the upper few tens of feet of the vadose zone. These deposits were derived primarily from alluvial fans that developed from Coyote Canyon to the east. The ARG deposits interfinger with alluvial fan deposits west of TA-V. These deposits consist predominantly of uniformly coarse sand and gravel that were deposited with the integration of the Rio Grande drainage system.
5.1.7.2 Hydrologic Conditions at the TA-V Study Area
Areal precipitation may provide one possible source of local recharge. The average annual precipitation at TA-V is 8.7 inches (SNL April 2004a). Much of this precipitation is derived from summer thunderstorms that occur between July and October. Because the rate of evapotranspiration in the Albuquerque area greatly exceeds precipitation, this source of recharge is considered to be minimal as a mechanism for transporting contaminants through the thick vadose zone at TA-V. Estimates of evapotranspiration for the KAFB area range from 95 to 99 percent of the annual rainfall (SNL February 1998). The Tijeras and Coyote arroyos to the north and Hells Canyon arroyo to the south of TA-V channel sporadic, short, ephemeral flows from mountainous drainages to the east. Part of the recharge derived from infiltration of these flows is returned to the atmosphere through processes of evapotranspiration. Some water that infiltrates arroyo channels may move past the root zone and provide some local recharge. The distance between these ephemeral stream channels and TA-V precludes a significant effect on local flow and contaminant transport. The vadose zone at TA-V, consisting of approximately 500 ft of unconsolidated to semiconsolidated alluvial sediments, forms the potential pathway for contaminant transport from contaminant sources to the aquifer. Upper sections of the alluvial-fan sediments are relatively coarse-grained, becoming fine-grained and clay-rich with depth. The unsaturated and saturated hydraulic properties of the vadose zone at TA-V have not been fully characterized. However, they are highly variable and anisotropic because of the heterogeneous textures, lenticularity, layering, and changes in cementation. Disposal of wastewater from the LWDS drain field, the LWDS surface impoundments, and the TA-V seepage pits resulted in the development of preferential pathways of saturated or nearly saturated flow through the thick vadose zone to the aquifer. Rapid vertical flow through the discontinuous, layered, lenticular sediments in the vadose zone may have been somewhat attenuated or diverted at horizons of contrasting hydraulic properties. Discharge of wastewater to the drain field was discontinued in 1967. Discharge to the seepage pits was discontinued in the early 1990s. No evidence of perching has been observed at TA-V. Based on moisture content measurements in vadose-zone sediment samples, drainage of residual water from the vadose zone to the aquifer was rapid after discharge ceased; minimal moisture from wastewater discharge at TA-V probably remains in the vadose zone. A wide range of hydraulic conductivity estimates were derived from aquifer tests at TA-V that is attributed to the textural heterogeneities associated with the alluvial fan lithofacies. The average

5-12 ANNUAL GROUNDWATER MONITORING REPORT, CALENDAR YEAR 2010
horizontal hydraulic conductivity for these sediments is estimated to be about 1.24 10–4 ft per minute (SNL March 1999a). Vertical hydraulic conductivity is estimated to be one-tenth to one-hundredth the horizontal hydraulic conductivity.
5.1.7.3 Local Direction of Flow
Water levels measured in nine wells were used to construct a map of the potentiometric surface at TA-V (Figure 5-3). Groundwater elevations presented in this potentiometric surface map reflect new survey coordinates. Until recently, ER Operations survey coordinates were based on the New Mexico State Plane Coordinate System, Central Zone, North American Datum of 1927 and Northern Geographic Vertical Datum of 1929 for elevations. In order to be consistent with current SNL/NM Facilities and KAFB survey practices, ER Operations survey data now are based on New Mexico State Plane Coordinate System, Central Zone, North American Datum of 1983 (NAD83) and North American Vertical Datum of 1988 (NAVD88). Location information for wells surveyed before August 2010 has been mathematically converted to the new NAD83/NAVD88 coordinates using National Geodetic Survey-approved software. The potentiometric surface indicates that the regional groundwater flow beneath TA-V is generally to the northwest. Localized flow paths are to the west and southwest. The October 2010 horizontal gradient ranged from approximately 0.0007 to 0.002 feet per foot. Calculated groundwater flow velocities based on aquifer testing range from 4 to 10 ft/yr (SNL March 1999a). Water-table contours for October 2010 suggest that a subtle groundwater mound is present at TA-V. This apparent groundwater mound is considered to be an artifact of regional water level declines within a heterogeneous aquifer and does not represent residual mounding from wastewater disposal that was discontinued in the early 1990s (SNL March 1999a). Water-level data indicate that groundwater flow to the west of TA-V turns sharply to the north, moving toward COA pumping centers located north of KAFB and KAFB water-supply wells. The sharp change in flow direction coincides with the location of coarse, uniformly sorted ARG sediments. These sediments are much more permeable than the fine-grained sediments of the alluvial fan facies at TA-V and permit more rapid flow. Vertical flow gradients in the regional aquifer within the TA-V study area are strongly downward. Historically, water levels in the regional aquifer have been declining at a rate approaching 1.3 ft/yr (Attachment 5C, Figures 5C-1 and 5C-2).
5.1.7.4 Contaminant Sources
Contaminant migration in the subsurface at TA-V is controlled by local recharge to the Santa Fe Group aquifer and by the permeability of the sedimentary units in the vadose zone and aquifer. Possible sources of recharge include infiltration of wastewater disposed of at TA-V, areal precipitation, and ephemeral flows in nearby arroyos. SWMUs 4, 5, and 275 are responsible for the majority of wastewater discharged at TA-V. Table 5-3 identifies the dates of disposal and estimated disposal volumes. After 1992, wastewater was disposed of to the COA sanitary sewer system. Sampling and analysis have been conducted in the vadose zone in order to characterize the presence of COCs. Locations of investigations are based on possible source terms (Table 5-3). Overall, the presence of COCs in the vadose zone is minimal. Movement of water and contaminant transport through the vadose zone occurred rapidly, and vadose zone drainage occurred soon after cessation of wastewater disposal.
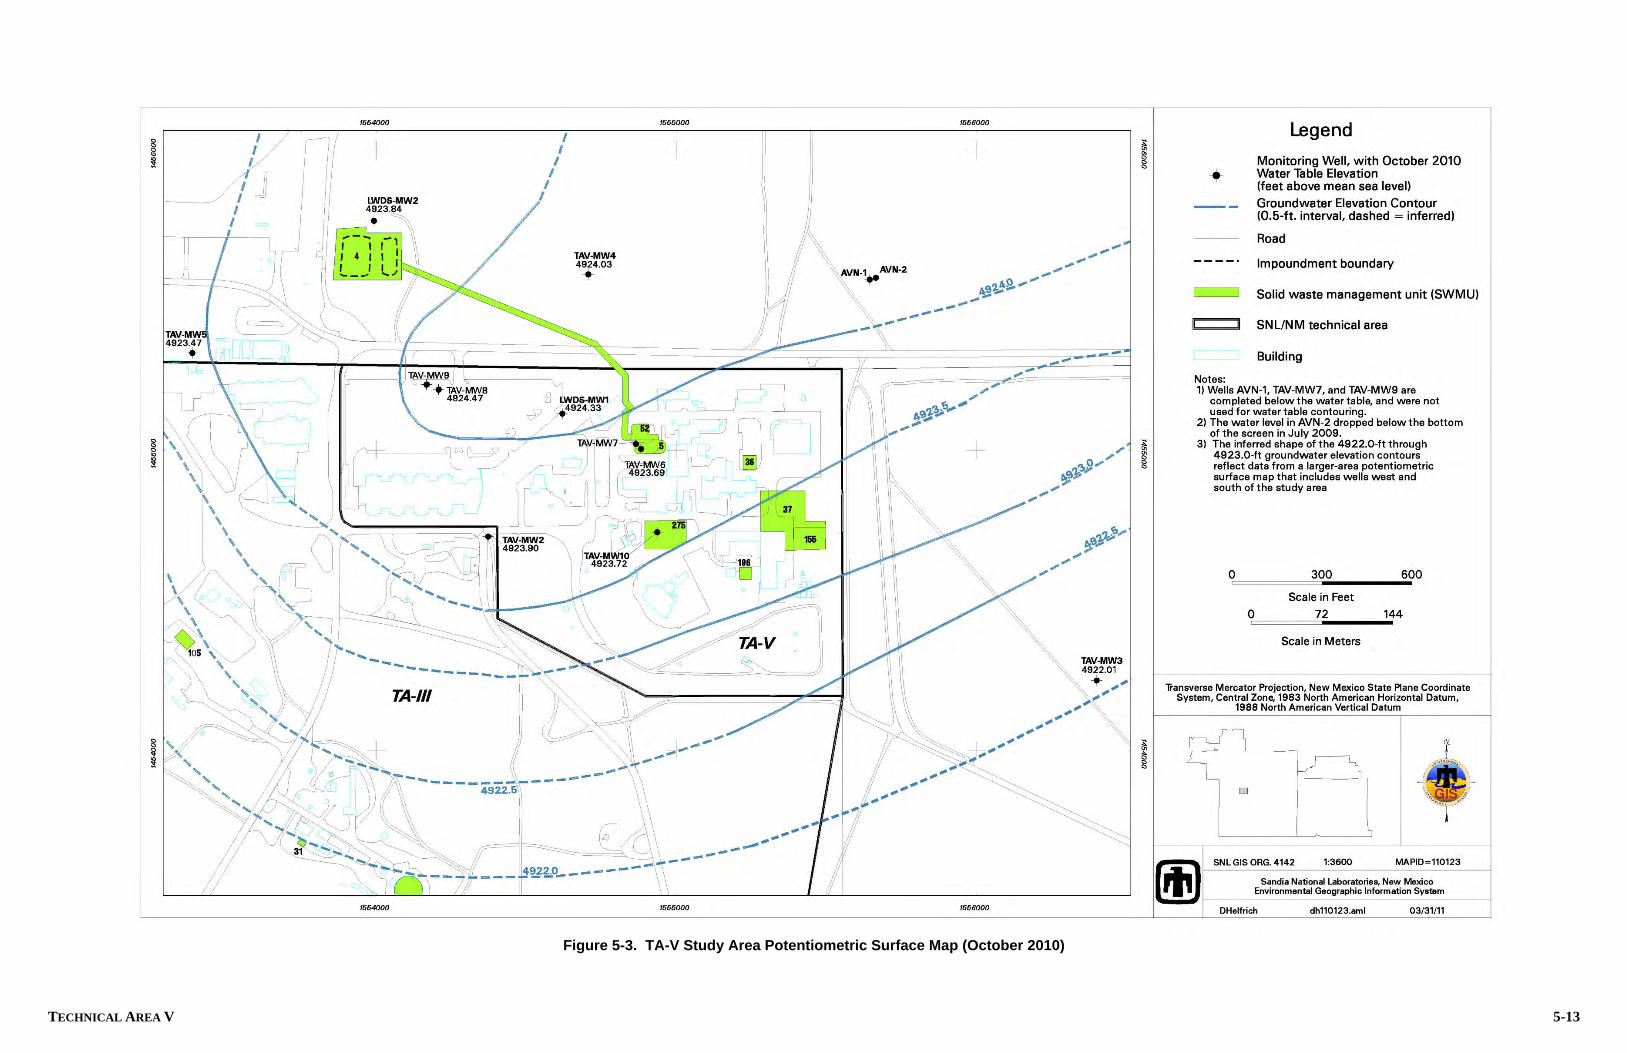
TECHNICAL AREA V 5-13
Figure 5-3. TA-V Study Area Potentiometric Surface Map (October 2010)
5-14 ANNUAL GROUNDWATER MONITORING REPORT, CALENDAR YEAR 2010
THIS PAGE IS BACK OF 11X17 FIGURE

TECHNICAL AREA V 5-15
Table 5-3. Wastewater Disposal History at TA-V
Disposal Site Dates Estimated Volume of Wastewater (gal.)
SWMU 275 – TA-V Seepage Pits 1960s–1992 30 to 50 million SWMU 5 – LWDS Drain Field 1962–1967 6.5 million SWMU 4 – LWDS Surface Impoundments 1967–1972 12 million
NOTES: gal. = Gallon(s). LWDS = Liquid Waste Disposal System. SWMU = Solid Waste Management Unit. TA-V = Technical Area V. Within the LWDS drain field, trace quantities of TCE, tetrachloroethene (PCE), and benzene were detected in shallow borehole soil-vapor samples collected during 1994 (SNL March 1999a). The possibility of vadose zone contamination was further investigated with the installation of wells TAV-MW6, TAV-MW7, TAV-MW8, and TAV-MW9 in March and April 2001. The results for soil and soil-vapor samples show no significant residual soil contamination in the vadose zone. Also, no results have shown evidence of excessive moisture in the vadose zone sediments; therefore, no significant residual contaminated water is present in the vadose zone beneath the LWDS drain field (SNL October 2001). In the vicinity of the TA-V seepage pits, trace quantities of TCE, PCE, benzene, toluene, and total xylene were detected in shallow and deep vadose-zone borehole soil-vapor samples collected during passive, surficial characterization studies conducted during 1994 and 1995. Vapor-phase TCE was detected at 44 parts per billion (by volume) at a depth of 80 ft below ground surface in TAV-BH-01 (SNL March 1999a). Solvent disposals to the seepage pits were most likely reduced in the early 1980s (SNL March 1999a), but wastewater disposal continued. This likely flushed any residual contaminants that may have been present in the vapor and aqueous phase in the vadose zone into the aquifer. Other surface contamination sites have been investigated at TA-V. Investigations have included surficial and subsurficial passive and active vapor-phase sampling for COCs. Sampling results have shown that these other sites probably have not contributed to groundwater contamination. For example, only trace quantities of TCE, methylene chloride, trichloroethane, benzene, and toluene were detected in shallow soil samples collected at SWMU 196 (Building 6597 cistern). Because TCE is volatile and the vapors are denser than ambient air, the physical properties of TCE are conducive to vapor transport; therefore, vapor transport in the vadose zone is a possible mechanism for the presence of TCE in the aquifer. Some TCE will typically be retained in the vadose zone due to absorption onto fine-grained materials and capillary forces. Three physical processes, occurring in the vadose zone, affect the migration of TCE into the aquifer as follows:
Vaporization from the source Transport to the capillary fringe Adsorption into the water table
Nitrate is present primarily in the aqueous phase in both the vadose zone and aquifer. It is nonsorptive and, for the most part, does not exchange on sediment surfaces in the vadose zone or groundwater.

5-16 ANNUAL GROUNDWATER MONITORING REPORT, CALENDAR YEAR 2010
Therefore, any locally derived nitrate most likely was transported through the vadose zone with the initial discharges of wastewater.
5.1.7.5 Contaminant Distribution and Transport in Groundwater
Distribution and transport of COCs and aquifer parameters are discussed in this section. TCE is present in low concentrations in the Santa Fe Group aquifer beneath TA-V. The highest TCE concentrations are not directly under the drain field source; rather, the highest concentrations have migrated in the localized direction of groundwater flow. The TCE distribution depicted in Figure 5-4 shows that the center of the TCE mass is located about 200 ft northwest of the SWMU 5 drain field and about 300 ft northwest of the SWMU 275 seepage pits. Maximum historical TCE concentrations reported at TA-V were 23 to 26 g/L for LWDS-MW1 on November 13, 2000. TCE has consistently exceeded the MCL at LWDS-MW1 since 1993, and concentrations at TAV-MW6 and TAV-MW10 have exceeded the MCL in recent sampling events (Section 5.6). TCE has been found only in water-table completion wells and has not been detected 100 ft below the water table based on data collected from deep wells TAV-MW7 and TAV-MW9. Nitrate is present in groundwater in all wells at TA-V, generally at concentrations ranging from less than 5 to more than 10 mg/L. Nitrate concentrations have exceeded MCLs in samples from AVN-1, AVN-2, LWDS-MW1, TAV-MW5, and TAV-MW10, although concentrations do not appear to be increasing over time. The highest reported concentrations for TA-V wells include the following:
13 mg/L for AVN-1 on May 14, 2001 16 mg/L for AVN-2 on October 27, 1999 13 mg/L for TAV-MW5 on August 18, 1999 14 mg/L for TAV-MW10 on October 20, 2010 19 mg/L for LWDS-MW1 on November 13, 2000, and February 16, 2001
Upgradient wells AVN-1 and AVN-2 were completed at different depths and show relatively consistent nitrate concentrations with depth and over time.
The source of nitrate in water from TA-V wells is unknown. Some nitrate may have been disposed of to the subsurface in TA-V sanitary wastes; however, nitrate concentrations exceeding the MCL in the AVN wells suggests that the source of nitrate is regionally upgradient and to the northeast of TA-V. The background nitrate concentration is 4 mg/L.
5.2 Regulatory Criteria
The NMED Hazardous Waste Bureau provides regulatory oversight of SNL/NM ER Operations as well as implements and enforces federal regulations mandated by the Resource Conservation and Recovery Act (RCRA). All ER SWMUs and Areas of Concern (AOCs) are listed in Module IV of the SNL/NM RCRA Part B Operating Permit, Special Conditions Pursuant to the 1984 Hazardous and Solid Waste Amendments (HSWA) to RCRA for Sandia National Laboratories (NMED 1993). All investigations and corrective action requirements pertaining to SWMUs and AOCs are contained in the Order (NMED April 2004). Groundwater characterization for TA-V was initiated to satisfy the requirements of the SNL/NM HSWA permit for characterization of SWMUs. The groundwater monitoring activities for the TA-V study area are not associated with a single SWMU but are more regional in nature and have historically been voluntarily conducted by SNL/NM ER Operations.

TECHNICAL AREA V 5-17
Figure 5-4. Distribution of TCE in Groundwater at SNL/NM TA-V, October 2010

5-18 ANNUAL GROUNDWATER MONITORING REPORT, CALENDAR YEAR 2010
THIS PAGE IS BACK OF 11X17 FIGURE

TECHNICAL AREA V 5-19
The Order, which became effective in April 2004, transferred regulatory authority for corrective action requirements from the HSWA module to the Order (NMED April 2004). The TA-V investigations must comply with requirements set forth in the Order for site characterization and development of a CME. The Order also contains schedules that define dates for the delivery of plans and reports related to TA-V. Although the Order requires that the DOE and Sandia evaluate the nature and extent of contamination in the TA-V study area, no specific reporting requirements are prescribed in the Order. Sandia continues to present TA-V data with the data from other groundwater sites in the Groundwater Protection Program (GWPP) Annual Groundwater Monitoring Report. The outline of this report is based on the required elements of a “Periodic Monitoring Report” described in Section X.D. of the Order (NMED April 2004). In this report, TA-V groundwater monitoring data are presented for both hazardous and radioactive constituents; however, the monitoring data for radionuclides (gamma spectroscopy, gross alpha/beta activity, and tritium) are provided voluntarily by the DOE/Sandia. The voluntary inclusion of such radionuclide information shall not be enforceable and shall not constitute the basis for any enforcement because such information falls wholly outside the requirements of the Order. Additional information on radionuclides and the scope of the Order is available in Section III.A of the Order (NMED April 2004).
5.3 Scope of Activities
The activities for the TA-V investigation for CY 2010, including plans and reports, are listed in Section 5.1.5. The field activities completed in the study area include monitoring well installation and groundwater monitoring. The CY 2010 sampling events (four quarterly events) are summarized in Table 5-4, and the analytical parameters for each well for each sampling event are listed in Table 5-5.
Table 5-4. Groundwater Monitoring Well Network and Sampling Dates for the TA-V Study Area, Calendar Year 2010
Date of Sampling Event Wells Sampled(1) SAP
February 2010
AVN-1, LWDS-MW1, LWDS-MW2, TAV-MW2, TAV-MW3, TAV-MW4, TAV-MW5, TAV-MW6, TAV-MW7,
TAV-MW8, TAV-MW9, and TAV-MW10
TA-V Groundwater Monitoring Mini-SAP for Second Quarter, Fiscal Year 2010 (SNL January 2010)
June 2010
AVN-1, LWDS-MW1, LWDS-MW2, TAV-MW2, TAV-MW3, TAV-MW4, TAV-MW5, TAV-MW6, TAV-MW7,
TAV-MW8, TAV-MW9, and TAV-MW10
TA-V Groundwater Monitoring Mini-SAP for Third Quarter, Fiscal Year 2010 (SNL May 2010)
August/ September 2010
AVN-1, LWDS-MW1, LWDS-MW2, TAV-MW2, TAV-MW3, TAV-MW4, TAV-MW5, TAV-MW6, TAV-MW7,
TAV-MW8, TAV-MW9, and TAV-MW10
TA-V Groundwater Monitoring Mini-SAP for Fourth Quarter, Fiscal Year 2010 (SNL August 2010)
October 2010
AVN-1, LWDS-MW1, LWDS-MW2, TAV-MW2, TAV-MW3, TAV-MW4, TAV-MW5, TAV-MW6, TAV-MW7,
TAV-MW8, TAV-MW9, and TAV-MW10
TA-V Groundwater Monitoring Mini-SAP for First Quarter, Fiscal Year 2011 (SNL September 2010)
NOTE: (1) Refer to page xviii of this report for well descriptions. SAP = Sampling and Analysis Plan. TA-V = Technical Area V.

5-20 ANNUAL GROUNDWATER MONITORING REPORT, CALENDAR YEAR 2010
Table 5-5. Parameters Sampled at TA-V Wells(1) for Each Sampling Event, Calendar Year 2010
Parameter February 2010 Parameter June 2010
NPN VOCs
AVN-1 LWDS-MW1 LWDS-MW2 TAV-MW2 TAV-MW3 TAV-MW3 (dup) TAV-MW4 TAV-MW5 TAV-MW6 TAV-MW7 TAV-MW8 TAV-MW9 TAV-MW10 TAV-MW10 (dup)
NPN VOCs
AVN-1 LWDS-MW1 LWDS-MW2 TAV-MW2 TAV-MW3 TAV-MW4 TAV-MW5 TAV-MW5 (dup) TAV-MW6 TAV-MW7 TAV-MW8 TAV-MW8 (dup) TAV-MW9 TAV-MW10 TAV-MW10 (dup) Perchlorate LWDS-MW1
Parameter August/September 2010 Parameter October 2010
Anions Gamma Spec* Gross Alpha Gross Beta NPN TAL Metals, plus Total Uranium Tritium VOCs
AVN-1 LWDS-MW1 LWDS-MW2 TAV-MW2 TAV-MW2 (dup) TAV-MW3 TAV-MW4 TAV-MW5 TAV-MW6 TAV-MW7 TAV-MW8 TAV-MW9 TAV-MW9 (dup) TAV-MW10
NPN VOCs
AVN-1 LWDS-MW1 LWDS-MW1 (dup) LWDS-MW2 TAV-MW2 TAV-MW3 TAV-MW4 TAV-MW5 TAV-MW5 (dup) TAV-MW6 TAV-MW7 TAV-MW8 TAV-MW9 TAV-MW10
NOTE: (1) Refer to page xviii of this report for well descriptions. dup = Duplicate sample. Gamma Spec* = Gamma spectroscopy short list (Americium-241, Cesium-137, Cobalt-60, and Potassium-40). NPN = Nitrate plus nitrite (reported as nitrogen). TAL = Target Analyte List. TA-V = Technical Area V. VOC = Volatile organic compound. Quality control (QC) samples are collected in the field at the time of environmental sample collection. Field QC samples include duplicate samples, split samples, equipment blank (EB), and trip blank (TB) samples. Field QC samples are used to monitor the sampling process. Duplicate samples are used to measure the precision of the sampling process. Split samples are used to verify the performance of the analytical laboratory. EB samples are used to verify the effectiveness of sampling equipment decontamination procedures. TB samples are used to determine whether volatile organic compounds (VOCs) contaminated the sample during preparation, transportation, or handling prior to receipt by the analytical laboratory.
TECHNICAL AREA V 5-21
5.4 Field Methods and Measurements
The monitoring procedures, as conducted by ER Operations personnel, are consistent with procedures identified in the EPA technical enforcement guidance document (EPA 1986). The following sections provide an overview of the sampling and data collection procedures.
5.4.1 Groundwater Elevation
Throughout CY 2010, water level measurements were obtained to determine groundwater flow directions, hydraulic gradients, and changes in water table elevations. Water levels are periodically measured in TA-V groundwater monitoring wells according to the instructions and requirements of SNL/NM Field Operating Procedure (FOP) 03-02, Groundwater Level Data Acquisition and Management, Rev. 02 (SNL November 2007). The water level information was used to develop the potentiometric surface map presented in Figure 5-3 and the hydrographs presented in Figures 5C-1 and 5C-2 (Attachment 5C).
5.4.2 Well Purging and Water Quality Measurements
A BennettTM groundwater sampling system (a nitrogen gas-powered portable piston pump) was used to collect the groundwater samples from TA-V wells. The wells are purged a minimum of one saturated screen volume. Field water quality measurements for turbidity, pH, temperature, specific conductance (SC), oxidation-reduction potential (ORP), and dissolved oxygen (DO) were recorded for each well prior to the collection of groundwater samples, according to SNL/NM FOP 05-01 (SNL August 2007a). Groundwater temperature, SC, ORP, DO, and pH were measured using a YSITM Model 620 water quality meter. Turbidity was measured with a HACHTM Model 2100P portable turbidity meter. The amount of water required to achieve stability of field parameters is fairly consistent. However, the ability of the aquifer to produce water varies greatly from well to well. In accordance with the Mini-Sampling and Analysis Plans (SAPs) (Table 5-4), purging continues until four stable measurements for temperature, SC, pH, and turbidity are obtained. Groundwater stability is considered acceptable when measurements are equal to or within 10 percent of 5 nephelometric turbidity units, pH is within 0.1 units, temperature is within 1.0 degree Celsius, and SC is within 5 percent. Associated Field Measurement Logs documenting details of well purging and water quality measurements for each sampling event have been submitted to the SNL/NM Customer Funded Records Center.
5.4.3 Pump Decontamination
The BennettTM sampling pump and tubing bundle were decontaminated prior to installation into monitoring wells according to procedures described in Long-Term Environmental Stewardship (LTES) Groundwater Sampling Equipment Decontamination, SNL/NM FOP 05-03 (SNL August 2007b). An EB or rinsate sample was collected to verify the effectiveness of the equipment decontamination process.
5.4.4 Sample Collection Sampling Procedures
Groundwater samples are collected using the BennettTM pump in accordance with SNL/NM FOP 05-01 (SNL August 2007a). Sample bottles are filled directly from the pump discharge line, with the VOC samples collected at the lowest achievable discharge rate.
5.4.5 Sample Handling and Shipment
The SNL/NM Sample Management Office (SMO) processes environmental samples collected by ER Operations personnel. The SMO reviews the Mini-SAPs, orders sample containers, issues sample control and tracking numbers, tracks the chain-of-custody, and reviews analytical results returned from the laboratories for laboratory contract compliance (SNL March 2003b and April 2007). All groundwater samples are analyzed by off-site laboratories using EPA-specified protocols.

5-22 ANNUAL GROUNDWATER MONITORING REPORT, CALENDAR YEAR 2010
QC samples are also prepared at the laboratory to determine whether contaminant chemicals are introduced into laboratory processes and procedures. These include method blanks, laboratory control samples (LCS), matrix spike, matrix spike duplicate, and surrogate spike samples. Reported laboratory analytical and QC data are reviewed against quality assurance requirements specified in the Procedure for Completing the Contract Verification Review, SMO-05-03, Issue 03, (SNL April 2007) and Administrative Operating Procedure (AOP) 00-03, Data Validation Procedure for Chemical and Radiochemical Data, (SNL July 2007).
5.4.6 Waste Management
Purge and decontamination water generated from sampling activities were placed into 55-gallon containers and stored at the ER Operations Field Office waste accumulation area. All waste was managed in accordance with SNL/NM FOP 05-04 (SNL August 2007c) as nonregulated waste, based on historical sampling results and process knowledge of the monitoring well location. Associated environmental sampling results provide supplemental data for approval to discharge water to the sanitary sewer. All data were compared with COA discharge limits.
5.5 Analytical Methods
All groundwater samples were analyzed by off-site laboratories using EPA-specified protocols. Groundwater samples were submitted to GEL Laboratories, Inc. for analysis. Samples were analyzed in accordance with applicable EPA analytical methods (Tables 5-6 and 5-7), including:
The Determination of Inorganic Anions in Water by Ion Chromatography-Method 300.0 (EPA 1983)
Perchlorate in Drinking Water Using Ion Chromatography (EPA, 1999)
Test Methods for Evaluating Solid Waste, Physical/Chemical Methods, Rev. 1 (EPA 1996)
Prescribed Procedures for Measurement of Radioactivity in Drinking Water (EPA 1980)
Table 5-6. TA-V Study Area Chemical Analytical Methods Analyte Analytical Methoda,b,c
Anions SW846-9056 NPN EPA 353.2 Perchlorate EPA 314.0 TAL Metals, plus Uranium SW846-6020/7470 VOCs SW846-8260
NOTES: aU.S. Environmental Protection Agency, 1996, Test Methods for Evaluating Solid Waste, Physical/Chemical Methods, SW-846, 3rd ed., Rev. 1 (and all updates), U.S. Environmental Protection Agency, Washington, D.C. bU.S. Environmental Protection Agency, 1983, The Determination of Inorganic Anions in Water by Ion Chromatography-Method 300.0, EPA-600/4-84-017. cU.S. Environmental Protection Agency (EPA), 1999, Perchlorate in Drinking Water Using Ion Chromatography, EPA 815/R-00-014. EPA = U.S. Environmental Protection Agency. NPN = Nitrate plus nitrite (reported as nitrogen). SW = Solid Waste. TAL = Target analyte list. TA-V = Technical Area V. VOC = Volatile organic compound.

TECHNICAL AREA V 5-23
Table 5-7. TA-V Study Area Radiochemical Analytical Methods Analyte Analytical Methoda
Gamma Spectroscopy (short list) EPA 901.0 Gross Alpha/Beta Activity EPA 900.0 Tritium EPA 906.0
NOTES: aU.S. Environmental Protection Agency, 1980, Prescribed Procedures for Measurement of Radioactivity in Drinking Water, EPA-600/4-80-032, U.S. Environmental Protection Agency, Cincinnati, Ohio. EPA = U.S. Environmental Protection Agency. TA-V = Technical Area V.
5.6 Summary of Analytical Results
This section discusses monitoring results, exceedances of standards, and pertinent trends in concentrations for COCs in the TA-V study area that exceed standards. The analytical results and field measurements for all TA-V sampling events are presented in Attachment 5A, Tables 5A-1 through 5A-8; concentration trend plots for COCs that exceed the MCLs are presented in Attachment 5B, Figures 5B-1 through 5B-5. A summary of detected VOC results are presented in Table 5A-1. The method detection limits (MDLs) for all analyzed VOCs are listed in Table 5A-2. The VOCs detected at low concentrations in groundwater samples from TA-V study area monitoring wells include the following:
Chloroform cis-1,2-Dichloroethene TCE
Three VOCs were detected during CY 2010. Two of these VOCs have promulgated MCLs. Only TCE exceeds its corresponding MCL, which is 5 g/L (Table 5A-1). TCE was detected in samples from three wells: LWDS-MW1, TAV-MW6, and TAV-MW10. The maximum concentration of TCE detected during this reporting period was 18.6 g/L in the sample from LWDS-MW1 collected in October 2010. Figures 5B-1, 5B-2, and 5B-3 (Attachment 5B) show that the TCE concentrations are decreasing over time in LWDS-MW1 and increasing over time in TAV-MW6 and TAV-MW10. The analytical results for NPN (reported as nitrogen) are presented in Table 5A-3 (Attachment 5A). During this reporting period, NPN results exceed the MCL of 10 mg/L in samples from LWDS-MW1 and TAV-MW10. The maximum concentration of NPN detected during this reporting period is 13.7 mg/L in the sample collected from TAV-MW10 in October 2010. Figure 5B-4 (Attachment 5B) shows that the NPN concentrations in LWDS-MW1 have typically exceeded the MCL, with concentrations being stable to slightly decreasing over time. In contrast, Figure 5B-5 (Attachment 5B) shows that NPN concentrations in TAV-MW10 (and its predecessor, TAV-MW1) only occasionally exceed the MCL with the trend increasing over time. The analytical results for anions (bromide, chloride, fluoride, and sulfate) are presented in Table 5A-4 (Attachment 5A). Secondary MCLs have been promulgated for three of the anions; none of the results exceed the corresponding secondary MCLs. The analytical result for perchlorate are presented in Table 5A-5; perchlorate was not detected in the one groundwater sample analyzed in CY 2010. Total metal results are presented in Table 5A-6; no metal results exceed established primary or secondary MCLs.

5-24 ANNUAL GROUNDWATER MONITORING REPORT, CALENDAR YEAR 2010
Tritium, gross alpha/beta activity, and gamma spectroscopy results are presented in Table 5A-7; all radionuclide results are below established MCLs. Field water quality parameters were measured during purging of each well prior to sampling and included temperature, SC, ORP, pH, turbidity, and DO. The parameter measurements obtained immediately before sample collection are presented in Table 5A-8.
5.7 Quality Control Results
Field and laboratory QC samples were prepared to determine the accuracy of the methods used and to detect inadvertent sample contamination that may have occurred during the sampling and analysis process. All chemical data were reviewed and qualified in accordance with AOP 00-03, Data Validation Procedure for Chemical and Radiochemical Data (SNL July 2007). Although some analytical results were qualified during the data validation process, no significant data quality problems were noted for TA-V COCs during CY 2010 sampling events. Data validation qualifiers are presented with the analytical results in Tables 5A-1 through 5A-7 (Attachment 5A). The data validation report associated with each sampling event has been submitted to the SNL/NM Customer Funded Records Center. The results for each QC sample and the impact on data quality for the TA-V quarterly sampling events are discussed in the following sections.
5.7.1 Field Quality Control Samples
Field QC samples included environmental duplicate, EB, and TB samples. The field QC samples were submitted for analysis along with the groundwater samples in accordance with QC procedures specified in the Mini-SAPs (SNL January 2010, May 2010, August 2010, and September 2010).
5.7.1.1 Duplicate Environmental Samples
Duplicate environmental samples were analyzed in order to estimate the overall reproducibility of the sampling and analytical process. A duplicate sample is collected immediately after the original environmental sample in order to reduce variability caused by time and/or sampling mechanics. The results for duplicate sample analyses (detected parameters only) are used to calculate relative percent difference (RPD) values. Duplicate sampling results for all wells and all sampling periods show good correlation (RPD values of less than 20) for all calculated parameters.
5.7.1.2 Equipment Blank Samples
The BennettTM pump and tubing bundle were decontaminated prior to installation into monitoring wells according to procedures described in SNL/NM FOP 05-03 (SNL August 2007b). An EB or rinsate sample was collected to verify the effectiveness of the equipment decontamination process. The results for the EB analyses are as follows:
February 2010 Sampling Event—EB samples were collected prior to sampling at TAV-MW3 and TAV-MW10 and submitted for all analyses. Bromodichloromethane, bromoform, chloroform, and dibromochloromethane were detected above the laboratory MDLs. No corrective action was necessary as these compounds were not detected in associated environmental samples.
June 2010 Sampling Event—EB samples were collected prior to sampling at TAV-MW5 and TAV-MW8 and submitted for all analyses. Bromodichloromethane, chloroform, and dibromochloromethane were detected above the laboratory MDLs. No corrective action was necessary as these compounds were not detected in associated environmental samples.
August/September 2010 Sampling Event—EB samples were collected prior to sampling at TAV-MW2 and TAV-MW9 and submitted for VOC, total metal, anion, NPN, gamma

TECHNICAL AREA V 5-25
spectroscopy, gross alpha, gross beta, and tritium analyses. The analytical parameters barium, bromodichloromethane, calcium, chloride, chloroform, chromium, copper, dibromochloromethane, iron, manganese, and zinc were detected in the EB samples. Chromium, copper, iron, manganese, and zinc were qualified as not detected during data validation when environmental samples reported these metals at concentrations less than five times the associated EB result. No corrective action was required for barium, bromodichloromethane, calcium, chloride, chloroform, and dibromochloromethane. These parameters either were not detected in environmental samples or were detected at concentrations greater than five times the blank result.
October 2010 2008 Sampling Event—EB samples were collected prior to sampling at LWDS-MW1 and TAV-MW5 and submitted for VOC and NPN analyses. The organic compounds bromodichloromethane, bromoform, chloroform, dibromochloromethane, and TCE were detected in the EB samples. No corrective action was required as these compounds either were not detected in environmental samples or were detected at concentrations greater than five times the blank result.
5.7.1.3 Trip Blank Samples
TB samples are submitted whenever samples are collected for VOC analysis to assess whether contamination of the samples has occurred during shipment and storage. TB samples consist of laboratory reagent grade water with hydrochloric acid preservative contained in 40-milliliter volatile organic analysis vials prepared by the analytical laboratory, which accompany the empty sample containers supplied by the laboratory. TBs were brought to the field and accompanied each sample shipment. TB qualifiers are provided with the analytical results in Table 5A-1 (Attachment 5A).
5.7.2 Laboratory Quality Control Samples
Internal laboratory QC samples, including method blanks and duplicate LCSs were analyzed concurrently with all groundwater samples. All chemical data were reviewed and qualified in accordance with AOP 00-03, Data Validation Procedure for Chemical and Radiochemical Data (SNL July 2007). Laboratory data qualifiers are provided with the analytical results in Tables 5A-1 through 5A-7 (Attachment 5A).
5.8 Variances and Nonconformances
No variances or nonconformances from requirements specified in the TA-V Mini-SAPs were identified during CY 2010 sampling activities. However, a project-specific issue associated with these sampling events was noted during all sampling events. Monitoring well LWDS-MW1 was purged dry prior to minimum volume and stability requirements. This well was allowed to recover and then sampled to collect a representative groundwater sample given the low yield of this well.
5.9 Summary and Conclusions
The conceptual site model of contaminant transport at TA-V includes release from the two primary sources, migration through the vadose zone, and movement into and along with groundwater. TCE and other organic chemicals were present in wastewater that was discharged to the underground LWDS drain field during the period from 1962 to 1967, and to the TA-V seepage pits from the 1960s until the early 1980s when disposal practices were modified to protect the environment. Wastewater discharged to the seepage pits from the early 1980s until 1992 contained no TCE.

5-26 ANNUAL GROUNDWATER MONITORING REPORT, CALENDAR YEAR 2010
Wastewater containing dissolved concentrations of TCE and other organic chemicals moved rapidly through the alluvial fan lithofacies into the aquifer. Upon cessation of disposal, vertical pathways to the aquifer drained rapidly. Continued flushing of the vadose zone beneath the seepage pits that occurred until 1992 removed a significant portion of residual COCs present in the vadose zone. Rapid drainage and continued flushing removed significant secondary contaminant sources. Low concentrations of TCE present in the aquifer today represent these initial wastewater releases. The combined effect of low groundwater velocities, dispersion, and dilution are responsible for the current distribution of TCE in the regional aquifer. Nitrate concentrations in groundwater at TA-V are primarily derived from unknown upgradient sources. These concentrations have exceeded MCLs in samples from the two upgradient AVN wells (AVN-1 and AVN-2), LWDS-MW1, and TAV-MW5. The analytical results for this reporting period are consistent with historical concentrations. The following conclusions are based on a comprehensive review of available information for current groundwater contamination conditions in the TA-V study area:
The primary COCs for the TA-V study area are TCE and nitrate.
Based on the historical use and disposal of chlorinated solvents, the extent of TCE in groundwater is associated with multiple TA-V wastewater releases containing VOCs and the subsequent vapor-phase transport of these VOCs through the vadose zone to the water table.
The distribution of low concentrations of TCE in the regional aquifer is principally attributed to the combined effect of low groundwater velocities, dispersion, and dilution.
The distribution of nitrate above the background level is laterally widespread in the study area, but the lateral extent of nitrate above the MCL is limited.
The primary sources of TCE and possibly nitrate in the TA-V study area consist of two wastewater disposal systems (SWMUs 5 and 275). An upgradient source of nitrate may be present.
The current conceptual site model described in Section 5.1.7 does not require modification based on the analytical results for this reporting period.
DOE/Sandia recommend the following approach as part of the ongoing environmental studies of the TA-V study area:
Continue collecting groundwater samples at the 16 TA-V groundwater and 3 soil-vapor monitoring wells on a quarterly basis. At a minimum, the analytes for groundwater sampling will consist of VOCs and NPN.
Continue obtaining periodic measurements of groundwater elevations in all TA-V monitoring wells.
Continue reporting future TA-V investigation results in the SNL/NM GWPP Annual Groundwater Monitoring Report.

TECHNICAL AREA V 5-27
5.10 References
Bartolino and Cole Bartolino, J.R., and J.C. Cole, 2002. Groundwater Resources of the 2002 Middle Rio Grande Basin, U.S. Geological Survey, Circular 1222,
http://water.usgs.gov/pubs/circ/2002/circ1222/. DOE March 2006 U.S. Department of Energy (DOE), March 2006. Letter to NMED requesting
permission to remove well AVN-2 from the TA-V monitoring well network, U.S. Department of Energy, National Nuclear Security Administration, Sandia Site Office, Albuquerque, New Mexico, March 26, 2005.
DOE October 2005 U.S. Department of Energy (DOE), October 2005. Letter to NMED
requesting change of sampling frequency from TA-V groundwater monitoring wells, U.S. Department of Energy, National Nuclear Security Administration, Sandia Site Office, Albuquerque, New Mexico, October 28, 2005.
DOE October 1998 U.S. Department of Energy (DOE), October 1998. Liquid Waste Disposal
System Cross Sections in Response to the NMED September 1997 LWDS Request for Supplemental Information, U.S. Department of Energy, Albuquerque Operations Office, Kirtland Area Office, Albuquerque, New Mexico.
DOE March 1996 U.S. Department of Energy (DOE), March 1996. Notification letter from
DOE to the New Mexico Environment Department (NMED) regarding detection of nitrate in well LWDS-MW1, U.S. Department of Energy, Albuquerque Operations Office, Kirtland Area Office, Albuquerque, New Mexico.
DOE June 1994 U.S. Department of Energy (DOE), June 1994. Notification letter from DOE
to the U.S. Environmental Protection Agency regarding detection of trichloroethylene in well LWDS-MW1, U.S. Department of Energy, Albuquerque Operations Office, Kirtland Area Office, Albuquerque, New Mexico, June 10, 1994.
EPA 1999 U.S. Environmental Protection Agency (EPA), 1999. Perchlorate in
Drinking Water Using Ion Chromatography, EPA 815/R-00-014, U.S. Environmental Protection Agency, Washington, D.C.
EPA 1996 U.S. Environmental Protection Agency (EPA), 1996. Test Methods for
Evaluating Solid Waste, Physical/Chemical Methods, SW-846, 3rd ed., Rev. 1 (and updates), U.S. Environmental Protection Agency, Washington, D.C., December.
EPA 1986 U.S. Environmental Protection Agency (EPA), 1986. RCRA Ground-Water
Monitoring Technical Enforcement Guidance Document, OSWER-9950.1. U.S. Environmental Protection Agency, Washington, D.C.

5-28 ANNUAL GROUNDWATER MONITORING REPORT, CALENDAR YEAR 2010
EPA 1983 U.S. Environmental Protection Agency (EPA), 1983. The Determination of Inorganic Anions in Water by Ion Chromatography–Method 300.0, EPA-600/4-84-017, U.S. Environmental Protection Agency, Cincinnati, Ohio.
EPA 1980 U.S. Environmental Protection Agency, 1980. Prescribed Procedures for
Measurement of Radioactivity in Drinking Water, EPA-600/4-80-032, U.S. Environmental Protection Agency, Cincinnati, Ohio.
IT June 1995 IT Corporation (IT), June 1995. 1994 Water Quality Study for Technical
Area V, Sandia National Laboratories/New Mexico, prepared by IT Corporation, Albuquerque, New Mexico.
NMED December 2010 New Mexico Environment Department (NMED), December 2010.
Modification of Soil-Vapor Monitoring Well Design, TA-V Groundwater Investigation Work Plan, February 2010, Sandia National Laboratories EPA ID# NM5890110518, HWB-SNL-05-027, New Mexico Environment Department, Santa Fe, New Mexico, December 23, 2010.
NMED May 2010 New Mexico Environment Department (NMED), May 2010. Notice of
Conditional Approval, SNL Responses to NMED December 2009 NOD issued for TA-V Groundwater Investigation Work Plan Associated with TA-V Groundwater CME Report, July 2005, Sandia National Laboratories EPA ID# NM5890110518, HWB-SNL-05-027, New Mexico Environment Department, Santa Fe, New Mexico, December 22, 2009.
NMED December 2009 New Mexico Environment Department (NMED), December 2009. Notice of
Disapproval: Corrective Measures Evaluation Report for Technical Area V Groundwater, July 2005–November 2009 Response to Notice of Deficiency, Sandia National Laboratories EPA ID# NM5890110518, HWB-SNL-05-027, New Mexico Environment Department, Santa Fe, New Mexico, December 22, 2009.
NMED August 2009 New Mexico Environment Department (NMED), August 2009. Notice of
Disapproval: DOE/Sandia Responses to NMED’s Notice of Disapproval for Corrective Measures Evaluation Report for Technical Area V Groundwater, July 2005, Sandia National Laboratories EPA ID# NM5890110518, HWB-SNL-05-027, New Mexico Environment Department, Santa Fe, New Mexico, August 12, 2009.
NMED April 2009 New Mexico Environment Department (NMED), April 2009. RE:
Perchlorate Contamination in Groundwater, Sandia National Laboratories, EPA ID#NM5890110518, New Mexico Environment Department, Santa Fe, New Mexico. April 30, 2009.
NMED July 2008 New Mexico Environment Department (NMED), July 2008. Notice of
Disapproval: Corrective Measures Evaluation Report for Technical Area V Groundwater, July 2005, Sandia National Laboratories NM5890110518, HWB-SNL-05-027, New Mexico Environment Department, Santa Fe, New Mexico, July 28, 2008.

TECHNICAL AREA V 5-29
NMED October 2004 New Mexico Environment Department (NMED), October 2004. Approval With Modifications: Corrective Measures Evaluation Work Plan, Technical Area V Groundwater, April 2004; and Current Conceptual Model of Groundwater Flow and Contaminant Transport at Sandia National Laboratories/New Mexico Technical Area-V, April 2004, Sandia National Laboratories NM5890110518, HWB-SNL-03-009, New Mexico Environment Department, Santa Fe, New Mexico, October 22, 2004.
NMED April 2004 New Mexico Environment Department (NMED), April 2004. Compliance
Order on Consent Pursuant to the New Mexico Hazardous Waste Act 74-4-10: Sandia National Laboratories Consent Order, New Mexico Environment Department, Santa Fe, New Mexico, April 29, 2004.
NMED September 1997 New Mexico Environment Department (NMED), September 1997. Request
For Supplemental Information, Liquid Waste Disposal System RFI Report, Sandia National Laboratories, March 1996, New Mexico Environment Department, Santa Fe, New Mexico.
NMED 1993 New Mexico Environment Department (NMED), 1993. Module IV:
Hazardous and Solid Waste Amendment (HSWA) Portion for Solid Waste Management Units (Module IV to the RCRA Part B Permit, NM5890110518), New Mexico Environment Department, Santa Fe, New Mexico.
NMSEO May 1959 New Mexico State Engineer Office (NMSEO), May 1959. State Engineer
Office Well Record for Well KAFB-10, Drilled for the U.S. Atomic Energy Commission at Sandia National Laboratories/New Mexico, Albuquerque, New Mexico.
SNL November 2010 Sandia National Laboratories/New Mexico (SNL/NM), November 2010.
Slug Test Results and Geophysical Logs for the Four New Technical Area V (TA-V) Ground Water Monitoring Wells, Environmental Restoration Project, Sandia National Laboratories, Albuquerque, New Mexico, November 24, 2010.
SNL September 2010 Sandia National Laboratories/New Mexico (SNL/NM), September 2010.
TA-V Groundwater Monitoring Mini-SAP for First Quarter, Fiscal Year 2011, Environmental Restoration Project, Sandia National Laboratories, Albuquerque, New Mexico, September 14, 2010.
SNL August 2010 Sandia National Laboratories/New Mexico (SNL/NM), August 2010. TA-V
Groundwater Monitoring Mini-SAP for Fourth Quarter, Fiscal Year 2010, Environmental Restoration Project, Sandia National Laboratories, Albuquerque, New Mexico, August 4, 2010.
SNL May 2010 Sandia National Laboratories/New Mexico (SNL/NM), May 2010. TA-V
Groundwater Monitoring Mini-SAP for Third Quarter, Fiscal Year 2010, Environmental Restoration Project, Sandia National Laboratories, Albuquerque, New Mexico, May 19, 2010.
5-30 ANNUAL GROUNDWATER MONITORING REPORT, CALENDAR YEAR 2010
SNL February 2010 Sandia National Laboratories/New Mexico (SNL/NM), February 2010. DOE/Sandia Responses to NMED’s comments in Notice of Disapproval: Corrective Measures Evaluation Report for Technical Area V Groundwater, July 2005—November 2009 Response to Notice of Deficiency, Sandia National Laboratories, EPA ID# NM5890110518 HWB-SNL-05-027, Environmental Restoration Project, Sandia National Laboratories, Albuquerque, New Mexico, February 22, 2009.
SNL January 2010 Sandia National Laboratories/New Mexico (SNL/NM), January 2010. TA-V
Groundwater Monitoring Mini-SAP for Second Quarter, Fiscal Year 2010, Environmental Restoration Project, Sandia National Laboratories, Albuquerque, New Mexico, January 4, 2010.
SNL November 2009 Sandia National Laboratories/New Mexico (SNL/NM), November 2009.
DOE/Sandia Responses to NMED’s Notice of Disapproval: DOE/Sandia Responses to NMED’s Notice of Disapproval for Corrective Measures Evaluation Report for Technical Area V Groundwater, July 2005 Sandia National Laboratories, EPA ID# NM5890110518 HWB-SNL-05-027, Environmental Restoration Project, Sandia National Laboratories, Albuquerque, New Mexico, November 16, 2009.
SNL June 2009 Sandia National Laboratories/New Mexico (SNL/NM), June 2009. Annual
Groundwater Monitoring Report Calendar Year 2008, Groundwater Protection Program, Environmental Management Department and Environmental Programs and Assurance, Sandia National Laboratories, Albuquerque, New Mexico.
SNL April 2009 Sandia National Laboratories/New Mexico (SNL/NM), April 2009.
DOE/Sandia Responses to NMED’s Notice of Disapproval for Corrective Measures Evaluation Report for Technical Area V Groundwater, July 2005 Sandia National Laboratories, EPA ID# NM5890110518 HWB-SNL-05-027, Environmental Restoration Project, Sandia National Laboratories, Albuquerque, New Mexico, April 14, 2009.
SNL October 2008 Sandia National Laboratories/New Mexico (SNL/NM), October 2008. Memo
from M. Sanders (GRAM, Inc.) to T. Jackson and S. Ricketson (GRAM, Inc.), Subject: TA-V Groundwater Monitor Well Re-Survey, Environmental Restoration Project, Sandia National Laboratories, Albuquerque, New Mexico, October 22, 2008.
SNL June 2008 Sandia National Laboratories/New Mexico (SNL/NM), June 2008. Summary
Report for Technical Area V Monitoring Well Plug and Abandonment and Installation, Decommissioning Monitoring Well TAV-MW1, Installation of Groundwater Monitoring Well TAV-MW10, Environmental Restoration Project, Sandia National Laboratories, Albuquerque, New Mexico.
SNL March 2008 Sandia National Laboratories/New Mexico (SNL/NM), March 2008. Annual
Groundwater Monitoring Report, Fiscal Year 2007, Groundwater Protection Program, Sandia National Laboratories, Albuquerque, New Mexico.

TECHNICAL AREA V 5-31
SNL November 2007 Sandia National Laboratories/New Mexico (SNL/NM), November 2007. Groundwater Level Data Acquisition and Management, FOP 03-02, Rev. 02, Sandia National Laboratories, Albuquerque, New Mexico. November 26, 2007.
SNL August 2007a Sandia National Laboratories/New Mexico (SNL/NM), August 2007a. Long-
Term Environmental Stewardship (LTES) Groundwater Monitoring Well Sampling and Field Analytical Measurements, FOP 05-01, Revision 00, Sandia National Laboratories, Albuquerque, New Mexico.
SNL August 2007b Sandia National Laboratories/New Mexico (SNL/NM), August 2007b. Long-
Term Environmental Stewardship (LTES) Groundwater Sampling Equipment Decontamination, FOP 05-03, Revision 02, Sandia National Laboratories, Albuquerque, New Mexico.
SNL August 2007c Sandia National Laboratories/New Mexico (SNL/NM), August 2007c. Long-
Term Environmental Stewardship (LTES) Groundwater Monitoring Waste Management, FOP 05-04, Revision 02, Sandia National Laboratories, Albuquerque, New Mexico.
SNL July 2007 Sandia National Laboratories/New Mexico (SNL/NM), July 2007. Data
Validation Procedure for Chemical and Radiochemical Data, AOP 00-03, Revision 2, Sandia National Laboratories, Albuquerque, New Mexico, July 16, 2007.
SNL April 2007 Sandia National Laboratories/New Mexico (SNL/NM). April 2007.
Procedure for Completing the Contract Verification Review, SMO-05-03, Issue 03, Sandia National Laboratories, Albuquerque, New Mexico, April 30, 2007.
SNL March 2007 Sandia National Laboratories/New Mexico (SNL/NM), March 2007. Annual
Groundwater Monitoring Report, Fiscal Year 2006, Groundwater Protection Program, Sandia National Laboratories, Albuquerque, New Mexico.
SNL November 2006 Sandia National Laboratories/New Mexico (SNL/NM), November 2006.
Annual Groundwater Monitoring Report, Burn Site Groundwater, Tijeras Arroyo Groundwater, and Technical Area V Groundwater Areas of Concern, Fiscal Year 2005, Environmental Restoration Project, Sandia National Laboratories, Albuquerque, New Mexico.
SNL October 2005 Sandia National Laboratories/New Mexico (SNL/NM), October 2005.
Annual Groundwater Monitoring Report, Fiscal Year 2004, Groundwater Protection Program, Sandia National Laboratories, Albuquerque, New Mexico.
SNL July 2005 Sandia National Laboratories/New Mexico (SNL/NM), July 2005. Corrective
Measures Evaluation Report for Technical Area V Groundwater, SAND Report SAND2005-4492, Sandia National Laboratories, Albuquerque, New Mexico.

5-32 ANNUAL GROUNDWATER MONITORING REPORT, CALENDAR YEAR 2010
SNL December 2004 Sandia National Laboratories/New Mexico (SNL/NM), December 2004. Corrective Measures Evaluation Work Plan, Technical Area V Groundwater, Revision 0, SAND Report SAND2004-6113, Sandia National Laboratories, Albuquerque, New Mexico.
SNL April 2004a Sandia National Laboratories/New Mexico (SNL/NM), April 2004. Current
Conceptual Model of Groundwater Flow and Contaminant Transport at Sandia National Laboratories/New Mexico Technical Area-V, SAND Report SAND2004-1470, Sandia National Laboratories, Albuquerque, New Mexico.
SNL April 2004b Sandia National Laboratories/New Mexico (SNL/NM), April 2004.
Corrective Measures Evaluation Work Plan, Technical Area V Groundwater, SAND Report SAND2004-1471, Sandia National Laboratories, Albuquerque, New Mexico.
SNL March 2004 Sandia National Laboratories/New Mexico (SNL/NM), March 2004. Annual
Groundwater Monitoring Report, Fiscal Year 2003, Groundwater Protection Program, Sandia National Laboratories, Albuquerque, New Mexico.
SNL March 2003a Sandia National Laboratories/New Mexico (SNL/NM), March 2003a. Annual
Groundwater Monitoring Report, Fiscal Year 2002, Groundwater Protection Program, Sandia National Laboratories, Albuquerque, New Mexico.
SNL March 2003b Sandia National Laboratories/New Mexico (SNL/NM), March 2003b.
SNL/NM Statement of Work for Analytical Laboratories, Revision 2, Sandia National Laboratories, Albuquerque, New Mexico.
SNL March 2002 Sandia National Laboratories/New Mexico (SNL/NM), March 2002. Annual
Groundwater Monitoring Report, Fiscal Year 2001, Groundwater Protection Program, Sandia National Laboratories, Albuquerque, New Mexico.
SNL November 2001 Sandia National Laboratories/New Mexico (SNL/NM), November 2001.
TA-V Groundwater Investigation, Fiscal Years 1999 and 2000, Environmental Restoration Project, Sandia National Laboratories, Albuquerque, New Mexico.
SNL October 2001 Sandia National Laboratories/New Mexico (SNL/NM), October 2001.
Summary of Monitoring Well Drilling Activities, TA-V Groundwater Investigation, Environmental Restoration Project, Sandia National Laboratories, Albuquerque, New Mexico.
SNL April 2001 Sandia National Laboratories/New Mexico (SNL/NM), April 2001. Annual
Groundwater Monitoring Report, Fiscal Year 2000, Groundwater Protection Program, Sandia National Laboratories, Albuquerque, New Mexico.
SNL March 2000 Sandia National Laboratories/New Mexico (SNL/NM), March 2000, Annual
Groundwater Monitoring Report, Fiscal Year 1999, Groundwater Protection Program, Sandia National Laboratories, Albuquerque, New Mexico.

TECHNICAL AREA V 5-33
SNL March 1999a Sandia National Laboratories/New Mexico (SNL/NM), March 1999a. Summary Report of Groundwater Investigations at Technical Area V Operable Units 1306 and 1307 (2 Volumes), Sandia National Laboratories, Albuquerque, New Mexico.
SNL March 1999b Sandia National Laboratories/New Mexico (SNL/NM), March 1999b.
Groundwater Protection Program, Fiscal Year 1998, Annual Groundwater Monitoring Report, Sandia National Laboratories, Albuquerque, New Mexico.
SNL March 1998 Sandia National Laboratories/New Mexico (SNL/NM), March 1998.
Groundwater Protection Program, Calendar Year 1997 Annual Groundwater Monitoring Report, Sandia National Laboratories, Albuquerque, New Mexico.
SNL February 1998 Sandia National Laboratories/New Mexico (SNL/NM), February 1998.
Revised Site-Wide Hydrogeologic Characterization Project, Calendar Year 1995 Annual Report, Environmental Restoration Project, Sandia National Laboratories, Albuquerque, New Mexico.
SNL January 1998 Sandia National Laboratories/New Mexico (SNL/NM), January 1998.
Response to the NMED “Request For Supplemental Information Liquid Waste Disposal System RFI Report, Sandia National Laboratories March 1996, Sandia National Laboratories, Environmental Restoration Project, Albuquerque, New Mexico, January 15, 1998.
SNL March 1997 Sandia National Laboratories/New Mexico (SNL/NM), March 1997.
Groundwater Protection Program, Calendar Year 1996 Annual Groundwater Monitoring Report, Sandia National Laboratories, Environmental Restoration Project, Albuquerque, New Mexico.
SNL April 1996 Sandia National Laboratories/New Mexico (SNL/NM), April 1996. Site-
Wide Hydrogeologic Characterization Project, KAFB-10 Well Abandonment Plan, Sandia National Laboratories, Albuquerque, New Mexico.
SNL March 1996 Sandia National Laboratories/New Mexico (SNL/NM), March 1996.
Groundwater Protection Program, Calendar Year 1995 Annual Groundwater Monitoring Report, Sandia National Laboratories, Albuquerque, New Mexico.
SNL September 1995 Sandia National Laboratories/New Mexico (SNL/NM), September 1995.
Results of The Liquid Waste Disposal System RCRA Facility Investigation, Sandia National Laboratories Albuquerque New Mexico, Environmental Restoration Project, Sandia National Laboratories, Albuquerque, New Mexico.
SNL March 1995 Sandia National Laboratories/New Mexico (SNL/NM), March 1995.
Groundwater Protection Program, Calendar Year 1994 Annual Groundwater Monitoring Report, Sandia National Laboratories, Albuquerque, New Mexico.
5-34 ANNUAL GROUNDWATER MONITORING REPORT, CALENDAR YEAR 2010
SNL 1995 Sandia National Laboratories/New Mexico (SNL/NM), 1995. Site-Wide
Hydrogeologic Characterization Project, Calendar Year 1995 Annual Report, Environmental Restoration Project, Sandia National Laboratories, Albuquerque, New Mexico.
SNL March 1993 Sandia National Laboratories/New Mexico (SNL/NM), March 1993. RCRA
Facility Investigation Work Plan For The Liquid Waste Disposal System (LWDS), ER Program Sites 4, 5 and 52, Environmental Impact and Restoration Division, Sandia National Laboratories, Albuquerque, New Mexico.
SRNL December 2008 Savannah River National Laboratory (SRNL), December 2008. Course
Agenda for “Natural and Enhanced Attenuation for Chlorinated Solvents: New Developments and Tools,” Agenda and Speakers, Seminar held in Albuquerque, New Mexico, from December 11 to December 12, 2008.
Van Hart June 2003 Van Hart, D., June 2003. Geologic Investigation: An Update of Subsurface
Geology on Kirtland Air Force Base, New Mexico, SAND Report SAND2003-1869, Sandia National Laboratories, Albuquerque, New Mexico.

TECHNICAL AREA V 5A-1
Attachment 5A Technical Area V
Analytical Results Tables

5A-2 ANNUAL GROUNDWATER MONITORING REPORT, CALENDAR YEAR 2010
This page intentionally left blank.

TECHNICAL AREA V 5A-3
Attachment 5A Tables 5A-1 Summary of Detected Volatile Organic Compounds, Technical Area V
Groundwater Monitoring, Sandia National Laboratories/New Mexico, Calendar Year 2010 ...................................................................................................................... 5A-5
5A-2 Method Detection Limits for Volatile Organic Compounds (EPA Methodg 8260),
Technical Area V Groundwater Monitoring, Sandia National Laboratories/New Mexico, Calendar Year 2010 ........................................................................................ 5A-7
5A-3 Summary of Nitrate plus Nitrite Results, Technical Area V Groundwater
Monitoring, Sandia National Laboratories/New Mexico, Calendar Year 2010 ............ 5A-8 5A-4 Summary of Anion Results, Technical Area V Groundwater Monitoring, Sandia
National Laboratories/New Mexico, Calendar Year 2010 .......................................... 5A-12 5A-5 Summary of Perchlorate Results, Technical Area V Groundwater Monitoring,
Sandia National Laboratories/New Mexico, Calendar Year 2010 .............................. 5A-14 5A-6 Summary of Total Metal Results, Technical Area V Groundwater Monitoring,
Sandia National Laboratories/New Mexico, Calendar Year 2010 .............................. 5A-15 5A-7 Summary of Tritium, Gross Alpha, Gross Beta, and Gamma Spectroscopy
Results, Technical Area V Groundwater Monitoring, Sandia National Laboratories/New Mexico, Calendar Year 2010 ........................................................ 5A-29
5A-8 Summary of Field Water Quality Measurementsh, Technical Area V
Groundwater Monitoring, Sandia National Laboratories/New Mexico, Calendar Year 2010 .................................................................................................................... 5A-32
Footnotes for Technical Area V Groundwater Monitoring Tables ....................................................... 5A-35

5A-4 ANNUAL GROUNDWATER MONITORING REPORT, CALENDAR YEAR 2010
This page intentionally left blank.

TE
CH
NIC
AL
AR
EA
V
5A-5
Table 5A-1 Summary of Detected Volatile Organic Compounds,
Technical Area V Groundwater Monitoring, Sandia National Laboratories/New Mexico
Calendar Year 2010
Well ID Analyte Resulta (g/L)
MDLb (g/L)
PQLc (g/L)
MCLd (g/L)
Laboratory Qualifiere
Validation Qualifierf Sample No. Analytical
Methodg LWDS-MW1 Trichloroethene 16.9 0.250 1.00 5.00 088141-001 SW846-8260B17-Feb-10 cis-1,2-Dichloroethene 2.95 0.300 1.00 70.0 088141-001 SW846-8260BTAV-MW2 10-Feb-10 Trichloroethene 1.06 0.250 1.00 5.00 088129-001 SW846-8260B
TAV-MW4 Chloroform 0.490 0.250 1.00 NE J 088131-001 SW846-8260B11-Feb-10 Trichloroethene 1.80 0.250 1.00 5.00 088131-001 SW846-8260BTAV-MW6 Trichloroethene 12.6 0.250 1.00 5.00 088133-001 SW846-8260B12-Feb-10 cis-1,2-Dichloroethene 2.03 0.300 1.00 70.0 088133-001 SW846-8260BTAV-MW8 09-Feb-10 Trichloroethene 1.41 0.250 1.00 5.00 088127-001 SW846-8260B
TAV-MW10 Trichloroethene 14.8 0.250 1.00 5.00 088138-001 SW846-8260B15-Feb-10 cis-1,2-Dichloroethene 2.33 0.300 1.00 70.0 088138-001 SW846-8260BTAV-MW10 (Duplicate) Trichloroethene 14.7 0.250 1.00 5.00 088139-001 SW846-8260B15-Feb-10 cis-1,2-Dichloroethene 2.28 0.300 1.00 70.0 088139-001 SW846-8260B
LWDS-MW1 Trichloroethene 14.4 0.250 1.00 5.00 089212-001 SW846-8260B25-Jun-10 cis-1,2-Dichloroethene 2.55 0.300 1.00 70.0 089212-001 SW846-8260BTAV-MW2 21-Jun-10 Trichloroethene 1.02 0.250 1.00 5.00 1.0U 089205-001 SW846-8260B
TAV-MW4 Chloroform 0.650 0.250 1.00 NE J 089207-001 SW846-8260B22-Jun-10 Trichloroethene 2.15 0.250 1.00 5.00 089207-001 SW846-8260BTAV-MW6 Trichloroethene 11.9 0.250 1.00 5.00 089209-001 SW846-8260B23-Jun-10 cis-1,2-Dichloroethene 2.12 0.300 1.00 70.0 089209-001 SW846-8260BTAV-MW8 16-Jun-10 Trichloroethene 1.27 0.250 1.00 5.00 089202-001 SW846-8260B
TAV-MW8 (Duplicate) 16-Jun-10 Trichloroethene 1.17 0.250 1.00 5.00 089203-001 SW846-8260B
TAV-MW10 Trichloroethene 14.7 0.250 1.00 5.00 089181-001 SW846-8260B07-Jun-10 cis-1,2-Dichloroethene 2.32 0.300 1.00 70.0 089181-001 SW846-8260BTAV-MW10 (Duplicate) Trichloroethene 14.7 0.250 1.00 5.00 089182-001 SW846-8260B07-Jun-10 cis-1,2-Dichloroethene 2.36 0.300 1.00 70.0 089182-001 SW846-8260B
LWDS-MW1 Trichloroethene 12.6 0.250 1.00 5.00 089563-001 SW846-8260B13-Sep-10 cis-1,2-Dichloroethene 2.98 0.300 1.00 70.0 089563-001 SW846-8260BTAV-MW2 31-Aug-10 Trichloroethene 1.04 0.250 1.00 5.00 089551-001 SW846-8260B
Refer to footnotes on page 5A-35.
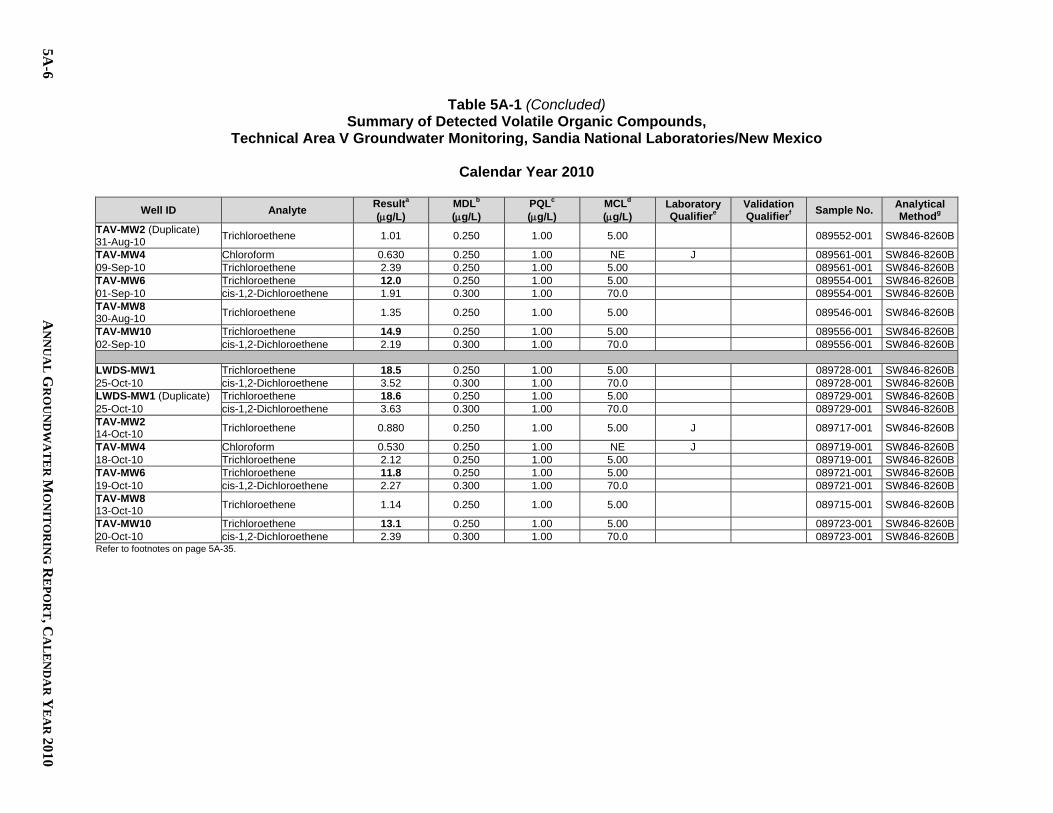
5A-6
AN
NU
AL
GR
OU
ND
WA
TE
R M
ON
ITO
RIN
G R
EP
OR
T, CA
LE
ND
AR
YE
AR
2010
Table 5A-1 (Concluded) Summary of Detected Volatile Organic Compounds,
Technical Area V Groundwater Monitoring, Sandia National Laboratories/New Mexico
Calendar Year 2010
Well ID Analyte Resulta (g/L)
MDLb (g/L)
PQLc (g/L)
MCLd (g/L)
Laboratory Qualifiere
Validation Qualifierf Sample No. Analytical
Methodg TAV-MW2 (Duplicate) 31-Aug-10 Trichloroethene 1.01 0.250 1.00 5.00 089552-001 SW846-8260B
TAV-MW4 Chloroform 0.630 0.250 1.00 NE J 089561-001 SW846-8260B09-Sep-10 Trichloroethene 2.39 0.250 1.00 5.00 089561-001 SW846-8260BTAV-MW6 Trichloroethene 12.0 0.250 1.00 5.00 089554-001 SW846-8260B01-Sep-10 cis-1,2-Dichloroethene 1.91 0.300 1.00 70.0 089554-001 SW846-8260BTAV-MW8 30-Aug-10 Trichloroethene 1.35 0.250 1.00 5.00 089546-001 SW846-8260B
TAV-MW10 Trichloroethene 14.9 0.250 1.00 5.00 089556-001 SW846-8260B02-Sep-10 cis-1,2-Dichloroethene 2.19 0.300 1.00 70.0 089556-001 SW846-8260B
LWDS-MW1 Trichloroethene 18.5 0.250 1.00 5.00 089728-001 SW846-8260B25-Oct-10 cis-1,2-Dichloroethene 3.52 0.300 1.00 70.0 089728-001 SW846-8260BLWDS-MW1 (Duplicate) Trichloroethene 18.6 0.250 1.00 5.00 089729-001 SW846-8260B25-Oct-10 cis-1,2-Dichloroethene 3.63 0.300 1.00 70.0 089729-001 SW846-8260BTAV-MW2 14-Oct-10 Trichloroethene 0.880 0.250 1.00 5.00 J 089717-001 SW846-8260B
TAV-MW4 Chloroform 0.530 0.250 1.00 NE J 089719-001 SW846-8260B18-Oct-10 Trichloroethene 2.12 0.250 1.00 5.00 089719-001 SW846-8260BTAV-MW6 Trichloroethene 11.8 0.250 1.00 5.00 089721-001 SW846-8260B19-Oct-10 cis-1,2-Dichloroethene 2.27 0.300 1.00 70.0 089721-001 SW846-8260BTAV-MW8 13-Oct-10 Trichloroethene 1.14 0.250 1.00 5.00 089715-001 SW846-8260B
TAV-MW10 Trichloroethene 13.1 0.250 1.00 5.00 089723-001 SW846-8260B20-Oct-10 cis-1,2-Dichloroethene 2.39 0.300 1.00 70.0 089723-001 SW846-8260BRefer to footnotes on page 5A-35.

TECHNICAL AREA V 5A-7
Table 5A-2 Method Detection Limits for Volatile Organic Compounds (Methodg SW846-8260),
Technical Area V Groundwater Monitoring, Sandia National Laboratories/New Mexico
Calendar Year 2010
Analyte MDLb (g/L)
1,1,1-Trichloroethane 0.325 1,1,2,2-Tetrachloroethane 0.250 1,1,2-Trichloroethane 0.250 1,1-Dichloroethane 0.300 1,1-Dichloroethene 0.300 1,2-Dichloroethane 0.250 1,2-Dichloropropane 0.250 2-Butanone 1.25 2-Hexanone 1.25 4-methyl-, 2-Pentanone 1.25 Acetone 3.50 Benzene 0.300 Bromodichloromethane 0.250 Bromoform 0.250 Bromomethane 0.300 Carbon disulfide 1.25 Carbon tetrachloride 0.300 Chlorobenzene 0.250 Chloroethane 0.300 Chloroform 0.250 Chloromethane 0.300 Dibromochloromethane 0.300 Ethyl benzene 0.250 Methylene chloride 3.00 Styrene 0.250 Tetrachloroethene 0.300 Toluene 0.250 Trichloroethene 0.250 Vinyl acetate 1.50 Vinyl chloride 0.500 Xylene 0.300 cis-1,2-Dichloroethene 0.300 cis-1,3-Dichloropropene 0.250 trans-1,2-Dichloroethene 0.300 trans-1,3-Dichloropropene 0.250
Refer to footnotes on page 5A-35.
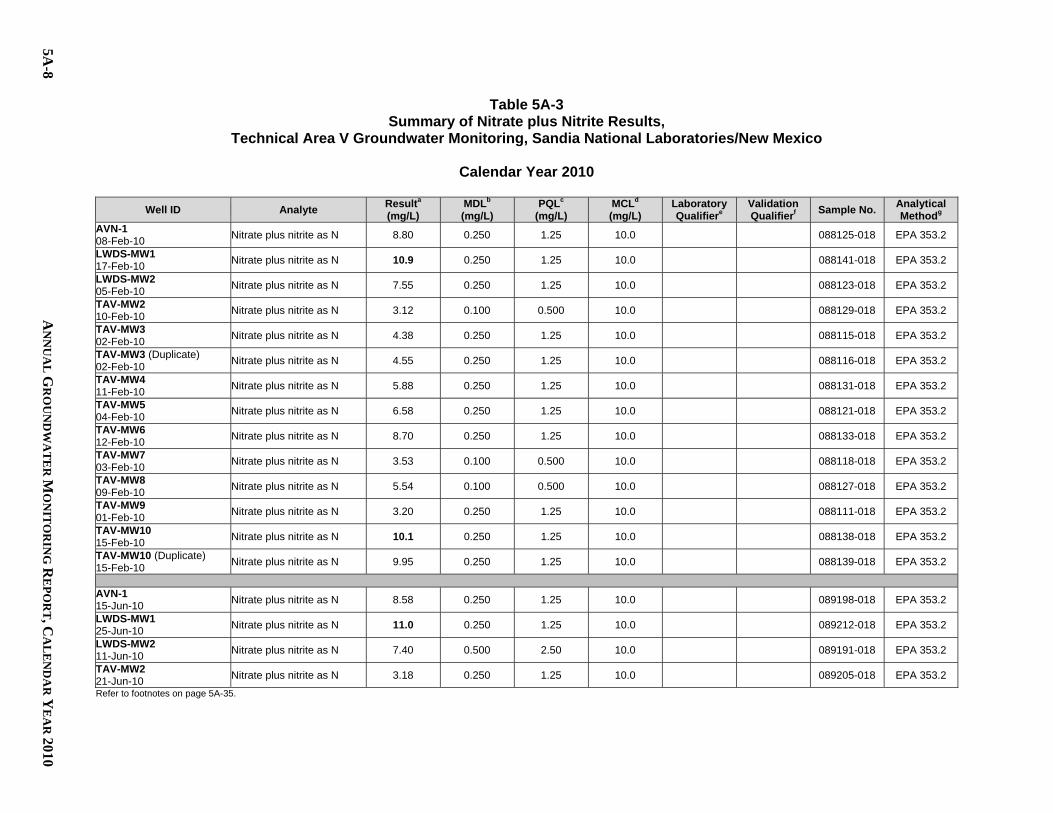
5A-8
AN
NU
AL
GR
OU
ND
WA
TE
R M
ON
ITO
RIN
G R
EP
OR
T, CA
LE
ND
AR
YE
AR
2010
Table 5A-3 Summary of Nitrate plus Nitrite Results,
Technical Area V Groundwater Monitoring, Sandia National Laboratories/New Mexico
Calendar Year 2010
Well ID Analyte Resulta
(mg/L) MDLb (mg/L)
PQLc (mg/L)
MCLd (mg/L)
Laboratory Qualifiere
Validation Qualifierf Sample No. Analytical
Methodg AVN-1 08-Feb-10 Nitrate plus nitrite as N 8.80 0.250 1.25 10.0 088125-018 EPA 353.2
LWDS-MW1 17-Feb-10 Nitrate plus nitrite as N 10.9 0.250 1.25 10.0 088141-018 EPA 353.2
LWDS-MW2 05-Feb-10 Nitrate plus nitrite as N 7.55 0.250 1.25 10.0 088123-018 EPA 353.2
TAV-MW2 10-Feb-10 Nitrate plus nitrite as N 3.12 0.100 0.500 10.0 088129-018 EPA 353.2
TAV-MW3 02-Feb-10 Nitrate plus nitrite as N 4.38 0.250 1.25 10.0 088115-018 EPA 353.2
TAV-MW3 (Duplicate) 02-Feb-10 Nitrate plus nitrite as N 4.55 0.250 1.25 10.0 088116-018 EPA 353.2
TAV-MW4 11-Feb-10 Nitrate plus nitrite as N 5.88 0.250 1.25 10.0 088131-018 EPA 353.2
TAV-MW5 04-Feb-10 Nitrate plus nitrite as N 6.58 0.250 1.25 10.0 088121-018 EPA 353.2
TAV-MW6 12-Feb-10 Nitrate plus nitrite as N 8.70 0.250 1.25 10.0 088133-018 EPA 353.2
TAV-MW7 03-Feb-10 Nitrate plus nitrite as N 3.53 0.100 0.500 10.0 088118-018 EPA 353.2
TAV-MW8 09-Feb-10 Nitrate plus nitrite as N 5.54 0.100 0.500 10.0 088127-018 EPA 353.2
TAV-MW9 01-Feb-10 Nitrate plus nitrite as N 3.20 0.250 1.25 10.0 088111-018 EPA 353.2
TAV-MW10 15-Feb-10 Nitrate plus nitrite as N 10.1 0.250 1.25 10.0 088138-018 EPA 353.2
TAV-MW10 (Duplicate) 15-Feb-10 Nitrate plus nitrite as N 9.95 0.250 1.25 10.0 088139-018 EPA 353.2
AVN-1 15-Jun-10 Nitrate plus nitrite as N 8.58 0.250 1.25 10.0 089198-018 EPA 353.2
LWDS-MW1 25-Jun-10 Nitrate plus nitrite as N 11.0 0.250 1.25 10.0 089212-018 EPA 353.2
LWDS-MW2 11-Jun-10 Nitrate plus nitrite as N 7.40 0.500 2.50 10.0 089191-018 EPA 353.2
TAV-MW2 21-Jun-10 Nitrate plus nitrite as N 3.18 0.250 1.25 10.0 089205-018 EPA 353.2
Refer to footnotes on page 5A-35.

TE
CH
NIC
AL
AR
EA
V
5A-9
Table 5A-3 (Continued) Summary of Nitrate plus Nitrite Results,
Technical Area V Groundwater Monitoring, Sandia National Laboratories/New Mexico
Calendar Year 2010
Well ID Analyte Resulta
(mg/L) MDLb (mg/L)
PQLc (mg/L)
MCLd (mg/L)
Laboratory Qualifiere
Validation Qualifierf Sample No. Analytical
Methodg TAV-MW3 09-Jun-10 Nitrate plus nitrite as N 4.95 0.250 1.25 10.0 089186-018 EPA 353.2
TAV-MW4 22-Jun-10 Nitrate plus nitrite as N 5.83 0.100 0.500 10.0 089207-018 EPA 353.2
TAV-MW5 14-Jun-10 Nitrate plus nitrite as N 7.05 0.500 2.50 10.0 089195-018 EPA 353.2
TAV-MW5 (Duplicate) 14-Jun-10 Nitrate plus nitrite as N 7.05 0.500 2.50 10.0 089196-018 EPA 353.2
TAV-MW6 23-Jun-10 Nitrate plus nitrite as N 8.43 0.250 1.25 10.0 089209-018 EPA 353.2
TAV-MW7 10-Jun-10 Nitrate plus nitrite as N 3.93 0.250 1.25 10.0 089188-018 EPA 353.2
TAV-MW8 16-Jun-10 Nitrate plus nitrite as N 5.55 0.500 2.50 10.0 089202-018 EPA 353.2
TAV-MW8 (Duplicate) 16-Jun-10 Nitrate plus nitrite as N 5.55 0.500 2.50 10.0 089203-018 EPA 353.2
TAV-MW9 08-Jun-10 Nitrate plus nitrite as N 3.55 0.250 1.25 10.0 089184-018 EPA 353.2
TAV-MW10 07-Jun-10 Nitrate plus nitrite as N 10.5 0.500 2.50 10.0 089181-018 EPA 353.2
TAV-MW10 (Duplicate) 07-Jun-10 Nitrate plus nitrite as N 10.8 0.500 2.50 10.0 089182-018 EPA 353.2
AVN-1 26-Aug-10 Nitrate plus nitrite as N 9.05 0.500 2.50 10.0 B 089542-018 EPA 353.2
LWDS-MW1 13-Sep-10 Nitrate plus nitrite as N 11.0 0.250 1.25 10.0 089563-018 EPA 353.2
LWDS-MW2 07-Sep-10 Nitrate plus nitrite as N 7.50 0.250 1.25 10.0 B 089559-018 EPA 353.2
TAV-MW2 31-Aug-10 Nitrate plus nitrite as N 3.00 0.100 0.500 10.0 B 089551-018 EPA 353.2
TAV-MW2 (Duplicate) 31-Aug-10 Nitrate plus nitrite as N 3.00 0.100 0.500 10.0 B 089552-018 EPA 353.2
TAV-MW3 23-Aug-10 Nitrate plus nitrite as N 5.50 0.250 1.25 10.0 B 089533-018 EPA 353.2
TAV-MW4 09-Sep-10 Nitrate plus nitrite as N 5.80 0.250 1.25 10.0 089561-018 EPA 353.2
Refer to footnotes on page 5A-35.

5A-10
AN
NU
AL
GR
OU
ND
WA
TE
R M
ON
ITO
RIN
G R
EP
OR
T, CA
LE
ND
AR
YE
AR
2010
Table 5A-3 (Continued) Summary of Nitrate plus Nitrite Results,
Technical Area V Groundwater Monitoring, Sandia National Laboratories/New Mexico
Calendar Year 2010
Well ID Analyte Resulta
(mg/L) MDLb (mg/L)
PQLc (mg/L)
MCLd (mg/L)
Laboratory Qualifiere
Validation Qualifierf Sample No. Analytical
Methodg TAV-MW5 27-Aug-10 Nitrate plus nitrite as N 6.83 0.250 1.25 10.0 B 089544-018 EPA 353.2
TAV-MW6 01-Sep-10 Nitrate plus nitrite as N 8.63 0.250 1.25 10.0 B 089554-018 EPA 353.2
TAV-MW7 25-Aug-10 Nitrate plus nitrite as N 4.00 0.100 0.500 10.0 B 089540-018 EPA 353.2
TAV-MW8 30-Aug-10 Nitrate plus nitrite as N 5.58 0.250 1.25 10.0 B 089546-018 EPA 353.2
TAV-MW9 24-Aug-10 Nitrate plus nitrite as N 3.80 0.250 1.25 10.0 B 089537-018 EPA 353.2
TAV-MW9 (Duplicate) 24-Aug-10 Nitrate plus nitrite as N 3.85 0.250 1.25 10.0 B 089538-018 EPA 353.2
TAV-MW10 02-Sep-10 Nitrate plus nitrite as N 10.4 0.250 1.25 10.0 B 089556-018 EPA 353.2
AVN-1 12-Oct-10 Nitrate plus nitrite as N 9.18 0.250 1.25 10.0 B 089713-018 EPA 353.2
LWDS-MW1 25-Oct-10 Nitrate plus nitrite as N 12.0 0.250 1.25 10.0 B 089728-018 EPA 353.2
LWDS-MW1 (Duplicate) 25-Oct-10 Nitrate plus nitrite as N 12.1 0.500 2.50 10.0 B 089729-018 EPA 353.2
LWDS-MW2 11-Oct-10 Nitrate plus nitrite as N 7.63 0.250 1.25 10.0 B 089710-018 EPA 353.2
TAV-MW2 14-Oct-10 Nitrate plus nitrite as N 3.18 0.100 0.500 10.0 B 089717-018 EPA 353.2
TAV-MW3 04-Oct-10 Nitrate plus nitrite as N 4.53 0.250 1.25 10.0 089701-018 EPA 353.2
TAV-MW4 18-Oct-10 Nitrate plus nitrite as N 5.95 0.250 1.25 10.0 B 089719-018 EPA 353.2
TAV-MW5 07-Oct-10 Nitrate plus nitrite as N 6.33 0.250 1.25 10.0 089707-018 EPA 353.2
TAV-MW5 (Duplicate) 07-Oct-10 Nitrate plus nitrite as N 6.73 0.250 1.25 10.0 089708-018 EPA 353.2
TAV-MW6 19-Oct-10 Nitrate plus nitrite as N 8.95 0.250 1.25 10.0 B 089721-018 EPA 353.2
Refer to footnotes on page 5A-35.

TE
CH
NIC
AL
AR
EA
V
5A-11
Table 5A-3 (Concluded) Summary of Nitrate plus Nitrite Results,
Technical Area V Groundwater Monitoring, Sandia National Laboratories/New Mexico
Calendar Year 2010
Well ID Analyte Resulta
(mg/L) MDLb (mg/L)
PQLc (mg/L)
MCLd (mg/L)
Laboratory Qualifiere
Validation Qualifierf Sample No. Analytical
Methodg TAV-MW7 06-Oct-10 Nitrate plus nitrite as N 3.40 0.250 1.25 10.0 089703-018 EPA 353.2
TAV-MW8 13-Oct-10 Nitrate plus nitrite as N 5.88 0.250 1.25 10.0 B 089715-018 EPA 353.2
TAV-MW9 05-Oct-10 Nitrate plus nitrite as N 3.15 0.250 1.25 10.0 089699-018 EPA 353.2
TAV-MW10 20-Oct-10 Nitrate plus nitrite as N 13.7 0.250 1.25 10.0 B 089723-018 EPA 353.2
Refer to footnotes on page 5A-35.
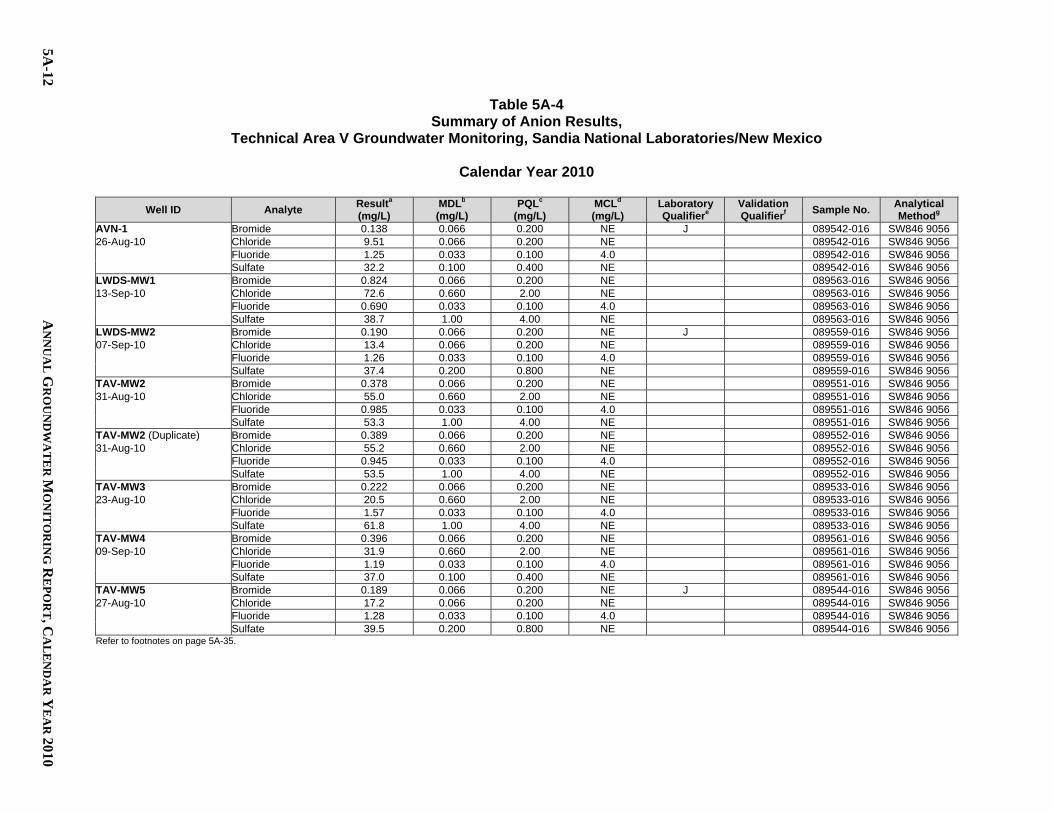
5A-12
AN
NU
AL
GR
OU
ND
WA
TE
R M
ON
ITO
RIN
G R
EP
OR
T, CA
LE
ND
AR
YE
AR
2010
Table 5A-4 Summary of Anion Results,
Technical Area V Groundwater Monitoring, Sandia National Laboratories/New Mexico
Calendar Year 2010
Well ID Analyte Resulta (mg/L)
MDLb (mg/L)
PQLc (mg/L)
MCLd (mg/L)
Laboratory Qualifiere
Validation Qualifierf Sample No. Analytical
Methodg AVN-1 Bromide 0.138 0.066 0.200 NE J 089542-016 SW846 9056 26-Aug-10 Chloride 9.51 0.066 0.200 NE 089542-016 SW846 9056 Fluoride 1.25 0.033 0.100 4.0 089542-016 SW846 9056 Sulfate 32.2 0.100 0.400 NE 089542-016 SW846 9056 LWDS-MW1 Bromide 0.824 0.066 0.200 NE 089563-016 SW846 9056 13-Sep-10 Chloride 72.6 0.660 2.00 NE 089563-016 SW846 9056 Fluoride 0.690 0.033 0.100 4.0 089563-016 SW846 9056 Sulfate 38.7 1.00 4.00 NE 089563-016 SW846 9056 LWDS-MW2 Bromide 0.190 0.066 0.200 NE J 089559-016 SW846 9056 07-Sep-10 Chloride 13.4 0.066 0.200 NE 089559-016 SW846 9056 Fluoride 1.26 0.033 0.100 4.0 089559-016 SW846 9056 Sulfate 37.4 0.200 0.800 NE 089559-016 SW846 9056 TAV-MW2 Bromide 0.378 0.066 0.200 NE 089551-016 SW846 9056 31-Aug-10 Chloride 55.0 0.660 2.00 NE 089551-016 SW846 9056 Fluoride 0.985 0.033 0.100 4.0 089551-016 SW846 9056 Sulfate 53.3 1.00 4.00 NE 089551-016 SW846 9056 TAV-MW2 (Duplicate) Bromide 0.389 0.066 0.200 NE 089552-016 SW846 9056 31-Aug-10 Chloride 55.2 0.660 2.00 NE 089552-016 SW846 9056 Fluoride 0.945 0.033 0.100 4.0 089552-016 SW846 9056 Sulfate 53.5 1.00 4.00 NE 089552-016 SW846 9056 TAV-MW3 Bromide 0.222 0.066 0.200 NE 089533-016 SW846 9056 23-Aug-10 Chloride 20.5 0.660 2.00 NE 089533-016 SW846 9056 Fluoride 1.57 0.033 0.100 4.0 089533-016 SW846 9056 Sulfate 61.8 1.00 4.00 NE 089533-016 SW846 9056 TAV-MW4 Bromide 0.396 0.066 0.200 NE 089561-016 SW846 9056 09-Sep-10 Chloride 31.9 0.660 2.00 NE 089561-016 SW846 9056 Fluoride 1.19 0.033 0.100 4.0 089561-016 SW846 9056 Sulfate 37.0 0.100 0.400 NE 089561-016 SW846 9056 TAV-MW5 Bromide 0.189 0.066 0.200 NE J 089544-016 SW846 9056 27-Aug-10 Chloride 17.2 0.066 0.200 NE 089544-016 SW846 9056 Fluoride 1.28 0.033 0.100 4.0 089544-016 SW846 9056 Sulfate 39.5 0.200 0.800 NE 089544-016 SW846 9056 Refer to footnotes on page 5A-35.

TE
CH
NIC
AL
AR
EA
V
5A-13
Table 5A-4 (Concluded) Summary of Anion Results,
Technical Area V Groundwater Monitoring, Sandia National Laboratories/New Mexico
Calendar Year 2010
Well ID Analyte Resulta (mg/L)
MDLb (mg/L)
PQLc (mg/L)
MCLd (mg/L)
Laboratory Qualifiere
Validation Qualifierf Sample No. Analytical
Methodg TAV-MW6 Bromide 0.778 0.066 0.200 NE 089554-016 SW846 9056 01-Sep-10 Chloride 64.4 0.330 1.00 NE 089554-016 SW846 9056 Fluoride 1.11 0.033 0.100 4.0 089554-016 SW846 9056 Sulfate 42.5 0.500 2.00 NE 089554-016 SW846 9056 TAV-MW7 Bromide 0.249 0.066 0.200 NE 089540-016 SW846 9056 25-Aug-10 Chloride 26.7 0.660 2.00 NE 089540-016 SW846 9056 Fluoride 1.14 0.033 0.100 4.0 089540-016 SW846 9056 Sulfate 64.0 1.00 4.00 NE 089540-016 SW846 9056 TAV-MW8 Bromide 0.325 0.066 0.200 NE 089546-016 SW846 9056 30-Aug-10 Chloride 34.9 0.330 1.00 NE 089546-016 SW846 9056 Fluoride 1.43 0.033 0.100 4.0 089546-016 SW846 9056 Sulfate 51.1 0.500 2.00 NE 089546-016 SW846 9056 TAV-MW9 Bromide 0.265 0.066 0.200 NE 089537-016 SW846 9056 24-Aug-10 Chloride 31.8 0.660 2.00 NE 089537-016 SW846 9056 Fluoride 0.932 0.033 0.100 4.0 089537-016 SW846 9056 Sulfate 57.3 1.00 4.00 NE 089537-016 SW846 9056 TAV-MW9 (Duplicate) Bromide 0.249 0.066 0.200 NE 089538-016 SW846 9056 24-Aug-10 Chloride 31.3 0.660 2.00 NE 089538-016 SW846 9056 Fluoride 0.931 0.033 0.100 4.0 089538-016 SW846 9056 Sulfate 56.9 1.00 4.00 NE 089538-016 SW846 9056 TAV-MW10 Bromide 0.387 0.066 0.200 NE 089556-016 SW846 9056 02-Sep-10 Chloride 47.4 0.330 1.00 NE 089556-016 SW846 9056 Fluoride 1.35 0.033 0.100 4.0 089556-016 SW846 9056 Sulfate 42.9 0.500 2.00 NE 089556-016 SW846 9056 Refer to footnotes on page 5A-35.
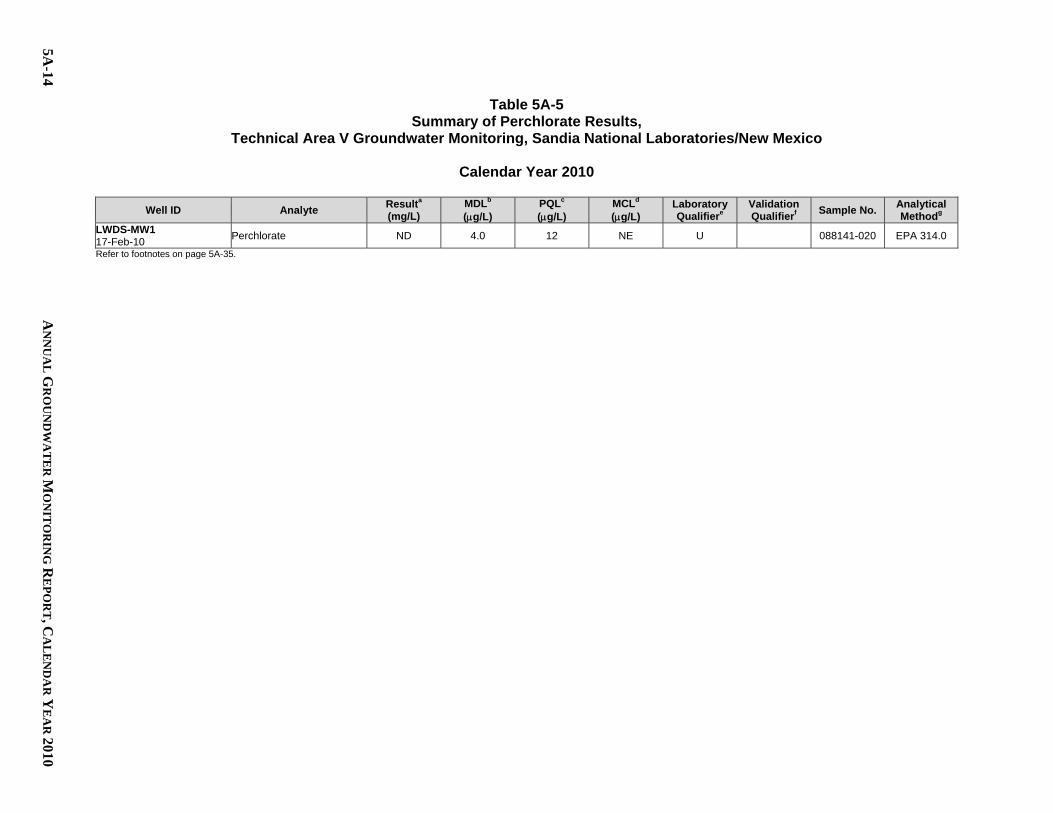
5A-14
AN
NU
AL
GR
OU
ND
WA
TE
R M
ON
ITO
RIN
G R
EP
OR
T, CA
LE
ND
AR
YE
AR
2010
Table 5A-5 Summary of Perchlorate Results,
Technical Area V Groundwater Monitoring, Sandia National Laboratories/New Mexico
Calendar Year 2010
Well ID Analyte Resulta (mg/L)
MDLb (g/L)
PQLc (g/L)
MCLd (g/L)
Laboratory Qualifiere
Validation Qualifierf Sample No. Analytical
Methodg LWDS-MW1 17-Feb-10 Perchlorate ND 4.0 12 NE U 088141-020 EPA 314.0
Refer to footnotes on page 5A-35.

TE
CH
NIC
AL
AR
EA
V
5A-15
Table 5A-6 Summary of Total Metal Results,
Technical Area V Groundwater Monitoring, Sandia National Laboratories/New Mexico
Calendar Year 2010
Well ID Analyte Resulta (mg/L)
MDLb (mg/L)
PQLc (mg/L)
MCLd (mg/L)
Laboratory Qualifiere
Validation Qualifierf Sample No. Analytical
Methodg AVN-1 Aluminum 0.0649 0.010 0.030 NE 089542-010 SW846 6020 26-Aug-10 Antimony ND 0.0005 0.003 0.006 U 089542-010 SW846 6020 Arsenic ND 0.0015 0.005 0.010 U 089542-010 SW846 6020 Barium 0.0729 0.0005 0.002 2.00 089542-010 SW846 6020 Beryllium ND 0.0001 0.0005 0.004 U 089542-010 SW846 6020 Cadmium 0.000319 0.00011 0.001 0.005 J 089542-010 SW846 6020 Calcium 37.3 0.020 0.200 NE B 089542-010 SW846 6020 Chromium 0.00527 0.0025 0.010 0.100 J 089542-010 SW846 6020 Cobalt 0.000135 0.0001 0.001 NE J 089542-010 SW846 6020 Copper 0.00172 0.0003 0.001 NE 089542-010 SW846 6020 Iron 0.195 0.010 0.100 NE B 089542-010 SW846 6020 Lead ND 0.0005 0.002 NE U 089542-010 SW846 6020 Magnesium 8.44 0.005 0.015 NE 089542-010 SW846 6020 Manganese 0.00215 0.001 0.005 NE J 089542-010 SW846 6020 Mercury ND 0.000066 0.0002 0.002 U 089542-010 SW846 7470 Nickel 0.00101 0.0005 0.002 NE J 089542-010 SW846 6020 Potassium 3.19 0.080 0.300 NE 089542-010 SW846 6020 Selenium 0.00145 0.001 0.005 0.050 J 089542-010 SW846 6020 Silver ND 0.0002 0.001 NE U 089542-010 SW846 6020 Sodium 34.3 0.080 0.250 NE 089542-010 SW846 6020 Thallium ND 0.0003 0.001 0.002 U 089542-010 SW846 6020 Uranium 0.00225 0.00005 0.0002 0.030 B 089542-010 SW846 6020 Vanadium ND 0.003 0.010 NE U 089542-010 SW846 6020 Zinc 0.00791 0.0026 0.010 NE J 089542-010 SW846 6020 Refer to footnotes on page 5A-35.

5A-16
AN
NU
AL
GR
OU
ND
WA
TE
R M
ON
ITO
RIN
G R
EP
OR
T, CA
LE
ND
AR
YE
AR
2010
Table 5A-6 (Continued) Summary of Total Metal Results,
Technical Area V Groundwater Monitoring, Sandia National Laboratories/New Mexico
Calendar Year 2010
Well ID Analyte Resulta (mg/L)
MDLb (mg/L)
PQLc (mg/L)
MCLd (mg/L)
Laboratory Qualifiere
Validation Qualifierf Sample No. Analytical
Methodg LWDS-MW1 Aluminum ND 0.010 0.030 NE U 089563-010 SW846 6020 13-Sep-10 Antimony ND 0.0005 0.003 0.006 U 089563-010 SW846 6020 Arsenic ND 0.0015 0.005 0.010 U 089563-010 SW846 6020 Barium 0.0793 0.0005 0.002 2.00 089563-010 SW846 6020 Beryllium ND 0.0001 0.0005 0.004 U 089563-010 SW846 6020 Cadmium ND 0.00011 0.001 0.005 U 089563-010 SW846 6020 Calcium 63.2 0.200 2.00 NE B 089563-010 SW846 6020 Chromium 0.00394 0.0025 0.010 0.100 J 089563-010 SW846 6020 Cobalt 0.000231 0.0001 0.001 NE J 089563-010 SW846 6020 Copper 0.000877 0.0003 0.001 NE J 089563-010 SW846 6020 Iron 0.280 0.010 0.100 NE 089563-010 SW846 6020 Lead ND 0.0005 0.002 NE U 089563-010 SW846 6020 Magnesium 20.2 0.005 0.015 NE 089563-010 SW846 6020 Manganese 0.0012 0.001 0.005 NE J 089563-010 SW846 6020 Mercury ND 0.000066 0.0002 0.002 U 089563-010 SW846 7470 Nickel 0.00173 0.0005 0.002 NE J 089563-010 SW846 6020 Potassium 3.11 0.080 0.300 NE 089563-010 SW846 6020 Selenium 0.00521 0.001 0.005 0.050 089563-010 SW846 6020 Silver ND 0.0002 0.001 NE U 089563-010 SW846 6020 Sodium 58.3 0.800 2.50 NE 089563-010 SW846 6020 Thallium ND 0.0003 0.001 0.002 U 089563-010 SW846 6020 Uranium 0.0043 0.00005 0.0002 0.030 B 089563-010 SW846 6020 Vanadium ND 0.003 0.010 NE U 089563-010 SW846 6020 Zinc 0.00432 0.0026 0.010 NE J 089563-010 SW846 6020 Refer to footnotes on page 5A-35.

TE
CH
NIC
AL
AR
EA
V
5A-17
Table 5A-6 (Continued) Summary of Total Metal Results,
Technical Area V Groundwater Monitoring, Sandia National Laboratories/New Mexico
Calendar Year 2010
Well ID Analyte Resulta (mg/L)
MDLb (mg/L)
PQLc (mg/L)
MCLd (mg/L)
Laboratory Qualifiere
Validation Qualifierf Sample No. Analytical
Methodg LWDS-MW2 Aluminum ND 0.010 0.030 NE U 089559-010 SW846 6020 07-Sep-10 Antimony ND 0.0005 0.003 0.006 U 089559-010 SW846 6020 Arsenic ND 0.0015 0.005 0.010 U 089559-010 SW846 6020 Barium 0.068 0.0005 0.002 2.00 089559-010 SW846 6020 Beryllium ND 0.0001 0.0005 0.004 U 089559-010 SW846 6020 Cadmium 0.000417 0.00011 0.001 0.005 J 089559-010 SW846 6020 Calcium 46.3 0.020 0.200 NE B 089559-010 SW846 6020 Chromium 0.00531 0.0025 0.010 0.100 J 089559-010 SW846 6020 Cobalt 0.00016 0.0001 0.001 NE J 089559-010 SW846 6020 Copper 0.00116 0.0003 0.001 NE 089559-010 SW846 6020 Iron 0.194 0.010 0.100 NE 089559-010 SW846 6020 Lead ND 0.0005 0.002 NE U 089559-010 SW846 6020 Magnesium 13.0 0.005 0.015 NE 089559-010 SW846 6020 Manganese ND 0.001 0.005 NE U 089559-010 SW846 6020 Mercury ND 0.000066 0.0002 0.002 U 089559-010 SW846 7470 Nickel 0.00116 0.0005 0.002 NE J 089559-010 SW846 6020 Potassium 2.79 0.080 0.300 NE 089559-010 SW846 6020 Selenium 0.00248 0.001 0.005 0.050 J 089559-010 SW846 6020 Silver 0.00193 0.0002 0.001 NE 089559-010 SW846 6020 Sodium 45.6 0.080 0.250 NE 089559-010 SW846 6020 Thallium ND 0.0003 0.001 0.002 U 089559-010 SW846 6020 Uranium 0.00345 0.00005 0.0002 0.030 089559-010 SW846 6020 Vanadium 0.00449 0.003 0.010 NE J 089559-010 SW846 6020 Zinc 0.00372 0.0026 0.010 NE J 089559-010 SW846 6020 Refer to footnotes on page 5A-35.

5A-18
AN
NU
AL
GR
OU
ND
WA
TE
R M
ON
ITO
RIN
G R
EP
OR
T, CA
LE
ND
AR
YE
AR
2010
Table 5A-6 (Continued) Summary of Total Metal Results,
Technical Area V Groundwater Monitoring, Sandia National Laboratories/New Mexico
Calendar Year 2010
Well ID Analyte Resulta (mg/L)
MDLb (mg/L)
PQLc (mg/L)
MCLd (mg/L)
Laboratory Qualifiere
Validation Qualifierf Sample No. Analytical
Methodg TAV-MW2 Aluminum 0.0115 0.010 0.030 NE J 089551-010 SW846 6020 31-Aug-10 Antimony ND 0.0005 0.003 0.006 U 089551-010 SW846 6020 Arsenic ND 0.0015 0.005 0.010 U 089551-010 SW846 6020 Barium 0.0591 0.0005 0.002 2.00 089551-010 SW846 6020 Beryllium ND 0.0001 0.0005 0.004 U 089551-010 SW846 6020 Cadmium ND 0.00011 0.001 0.005 U 089551-010 SW846 6020 Calcium 67.1 0.100 1.00 NE 089551-010 SW846 6020 Chromium 0.0042 0.0025 0.010 0.100 J 089551-010 SW846 6020 Cobalt ND 0.0001 0.001 NE U 089551-010 SW846 6020 Copper ND 0.0003 0.001 NE U 0.0052UJ 089551-010 SW846 6020 Iron 0.108 0.010 0.100 NE 089551-010 SW846 6020 Lead ND 0.0005 0.002 NE U 089551-010 SW846 6020 Magnesium 21.9 0.005 0.015 NE 089551-010 SW846 6020 Manganese ND 0.001 0.005 NE U 089551-010 SW846 6020 Mercury ND 0.000066 0.0002 0.002 U 089551-010 SW846 7470 Nickel 0.0014 0.0005 0.002 NE J 089551-010 SW846 6020 Potassium 3.52 0.080 0.300 NE 089551-010 SW846 6020 Selenium 0.00249 0.001 0.005 0.050 J 089551-010 SW846 6020 Silver ND 0.0002 0.001 NE U 089551-010 SW846 6020 Sodium 64.1 0.400 1.25 NE B 089551-010 SW846 6020 Thallium ND 0.0003 0.001 0.002 U 089551-010 SW846 6020 Uranium 0.00695 0.00005 0.0002 0.030 B 089551-010 SW846 6020 Vanadium ND 0.003 0.010 NE U 089551-010 SW846 6020 Zinc 0.0028 0.0026 0.010 NE J 0.014U 089551-010 SW846 6020 Refer to footnotes on page 5A-35.

TE
CH
NIC
AL
AR
EA
V
5A-19
Table 5A-6 (Continued) Summary of Total Metal Results,
Technical Area V Groundwater Monitoring, Sandia National Laboratories/New Mexico
Calendar Year 2010
Well ID Analyte Resulta (mg/L)
MDLb (mg/L)
PQLc (mg/L)
MCLd (mg/L)
Laboratory Qualifiere
Validation Qualifierf Sample No. Analytical
Methodg TAV-MW2 (Duplicate) Aluminum ND 0.010 0.030 NE U 089552-010 SW846 6020 31-Aug-10 Antimony ND 0.0005 0.003 0.006 U 089552-010 SW846 6020 Arsenic ND 0.0015 0.005 0.010 U 089552-010 SW846 6020 Barium 0.0604 0.0005 0.002 2.00 089552-010 SW846 6020 Beryllium ND 0.0001 0.0005 0.004 U 089552-010 SW846 6020 Cadmium ND 0.00011 0.001 0.005 U 089552-010 SW846 6020 Calcium 67.2 0.100 1.00 NE 089552-010 SW846 6020 Chromium 0.00363 0.0025 0.010 0.100 J 089552-010 SW846 6020 Cobalt ND 0.0001 0.001 NE U 089552-010 SW846 6020 Copper ND 0.0003 0.001 NE U 0.0052UJ 089552-010 SW846 6020 Iron 0.123 0.010 0.100 NE 089552-010 SW846 6020 Lead ND 0.0005 0.002 NE U 089552-010 SW846 6020 Magnesium 23.0 0.005 0.015 NE 089552-010 SW846 6020 Manganese ND 0.001 0.005 NE U 089552-010 SW846 6020 Mercury ND 0.000066 0.0002 0.002 U 089552-010 SW846 7470 Nickel 0.00133 0.0005 0.002 NE J 089552-010 SW846 6020 Potassium 3.49 0.080 0.300 NE 089552-010 SW846 6020 Selenium 0.00265 0.001 0.005 0.050 J 089552-010 SW846 6020 Silver ND 0.0002 0.001 NE U 089552-010 SW846 6020 Sodium 69.4 0.400 1.25 NE B 089552-010 SW846 6020 Thallium ND 0.0003 0.001 0.002 U 089552-010 SW846 6020 Uranium 0.0071 0.00005 0.0002 0.030 B 089552-010 SW846 6020 Vanadium ND 0.003 0.010 NE U 089552-010 SW846 6020 Zinc 0.00297 0.0026 0.010 NE J 0.014U 089552-010 SW846 6020 Refer to footnotes on page 5A-35.

5A-20
AN
NU
AL
GR
OU
ND
WA
TE
R M
ON
ITO
RIN
G R
EP
OR
T, CA
LE
ND
AR
YE
AR
2010
Table 5A-6 (Continued) Summary of Total Metal Results,
Technical Area V Groundwater Monitoring, Sandia National Laboratories/New Mexico
Calendar Year 2010
Well ID Analyte Resulta (mg/L)
MDLb (mg/L)
PQLc (mg/L)
MCLd (mg/L)
Laboratory Qualifiere
Validation Qualifierf Sample No. Analytical
Methodg TAV-MW3 Aluminum ND 0.010 0.030 NE U 089533-010 SW846 6020 23-Aug-10 Antimony ND 0.0005 0.003 0.006 U 089533-010 SW846 6020 Arsenic ND 0.0015 0.005 0.010 U 089533-010 SW846 6020 Barium 0.0411 0.0005 0.002 2.00 089533-010 SW846 6020 Beryllium ND 0.0001 0.0005 0.004 U 089533-010 SW846 6020 Cadmium ND 0.00011 0.001 0.005 U 089533-010 SW846 6020 Calcium 46.8 0.020 0.200 NE B 089533-010 SW846 6020 Chromium ND 0.0025 0.010 0.100 U 089533-010 SW846 6020 Cobalt 0.000118 0.0001 0.001 NE J 089533-010 SW846 6020 Copper 0.000516 0.0003 0.001 NE J 089533-010 SW846 6020 Iron 0.163 0.010 0.100 NE B 089533-010 SW846 6020 Lead ND 0.0005 0.002 NE U 089533-010 SW846 6020 Magnesium 12.4 0.005 0.015 NE 089533-010 SW846 6020 Manganese 0.00152 0.001 0.005 NE J 089533-010 SW846 6020 Mercury ND 0.000066 0.0002 0.002 U 089533-010 SW846 7470 Nickel 0.000889 0.0005 0.002 NE J 089533-010 SW846 6020 Potassium 4.28 0.080 0.300 NE 089533-010 SW846 6020 Selenium 0.00177 0.001 0.005 0.050 J 089533-010 SW846 6020 Silver ND 0.0002 0.001 NE U 089533-010 SW846 6020 Sodium 45.9 0.080 0.250 NE 089533-010 SW846 6020 Thallium ND 0.0003 0.001 0.002 U 089533-010 SW846 6020 Uranium 0.00358 0.00005 0.0002 0.030 B 089533-010 SW846 6020 Vanadium ND 0.003 0.010 NE U 089533-010 SW846 6020 Zinc ND 0.0026 0.010 NE U 089533-010 SW846 6020 Refer to footnotes on page 5A-35.

TE
CH
NIC
AL
AR
EA
V
5A-21
Table 5A-6 (Continued) Summary of Total Metal Results,
Technical Area V Groundwater Monitoring, Sandia National Laboratories/New Mexico
Calendar Year 2010
Well ID Analyte Resulta (mg/L)
MDLb (mg/L)
PQLc (mg/L)
MCLd (mg/L)
Laboratory Qualifiere
Validation Qualifierf Sample No. Analytical
Methodg TAV-MW4 Aluminum ND 0.010 0.030 NE U 089561-010 SW846 6020 09-Sep-10 Antimony ND 0.0005 0.003 0.006 U 089561-010 SW846 6020 Arsenic ND 0.0015 0.005 0.010 U 089561-010 SW846 6020 Barium 0.0814 0.0005 0.002 2.00 089561-010 SW846 6020 Beryllium ND 0.0001 0.0005 0.004 U 089561-010 SW846 6020 Cadmium ND 0.00011 0.001 0.005 U 089561-010 SW846 6020 Calcium 46.3 0.020 0.200 NE B 089561-010 SW846 6020 Chromium 0.0234 0.0025 0.010 0.100 089561-010 SW846 6020 Cobalt 0.000152 0.0001 0.001 NE J 089561-010 SW846 6020 Copper 0.00062 0.0003 0.001 NE J 089561-010 SW846 6020 Iron 0.201 0.010 0.100 NE 089561-010 SW846 6020 Lead ND 0.0005 0.002 NE U 089561-010 SW846 6020 Magnesium 14.2 0.005 0.015 NE 089561-010 SW846 6020 Manganese ND 0.001 0.005 NE U 089561-010 SW846 6020 Mercury ND 0.000066 0.0002 0.002 U 089561-010 SW846 7470 Nickel 0.0011 0.0005 0.002 NE J 089561-010 SW846 6020 Potassium 2.92 0.080 0.300 NE 089561-010 SW846 6020 Selenium 0.00364 0.001 0.005 0.050 J 089561-010 SW846 6020 Silver ND 0.0002 0.001 NE U 089561-010 SW846 6020 Sodium 43.3 0.080 0.250 NE 089561-010 SW846 6020 Thallium ND 0.0003 0.001 0.002 U 089561-010 SW846 6020 Uranium 0.0039 0.00005 0.0002 0.030 089561-010 SW846 6020 Vanadium 0.00427 0.003 0.010 NE J 089561-010 SW846 6020 Zinc ND 0.0026 0.010 NE U 089561-010 SW846 6020 Refer to footnotes on page 5A-35.

5A-22
AN
NU
AL
GR
OU
ND
WA
TE
R M
ON
ITO
RIN
G R
EP
OR
T, CA
LE
ND
AR
YE
AR
2010
Table 5A-6 (Continued) Summary of Total Metal Results,
Technical Area V Groundwater Monitoring, Sandia National Laboratories/New Mexico
Calendar Year 2010
Well ID Analyte Resulta (mg/L)
MDLb (mg/L)
PQLc (mg/L)
MCLd (mg/L)
Laboratory Qualifiere
Validation Qualifierf Sample No. Analytical
Methodg TAV-MW5 Aluminum ND 0.010 0.030 NE U 089544-010 SW846 6020 27-Aug-10 Antimony ND 0.0005 0.003 0.006 U 089544-010 SW846 6020 Arsenic ND 0.0015 0.005 0.010 U 089544-010 SW846 6020 Barium 0.0592 0.0005 0.002 2.00 089544-010 SW846 6020 Beryllium ND 0.0001 0.0005 0.004 U 089544-010 SW846 6020 Cadmium ND 0.00011 0.001 0.005 U 089544-010 SW846 6020 Calcium 43.6 0.020 0.200 NE 089544-010 SW846 6020 Chromium 0.00415 0.0025 0.010 0.100 J 089544-010 SW846 6020 Cobalt ND 0.0001 0.001 NE U 089544-010 SW846 6020 Copper ND 0.0003 0.001 NE U 089544-010 SW846 6020 Iron 0.0799 0.010 0.100 NE J 089544-010 SW846 6020 Lead ND 0.0005 0.002 NE U 089544-010 SW846 6020 Magnesium 13.9 0.005 0.015 NE 089544-010 SW846 6020 Manganese ND 0.001 0.005 NE U 089544-010 SW846 6020 Mercury ND 0.000066 0.0002 0.002 U 089544-010 SW846 7470 Nickel 0.000734 0.0005 0.002 NE J 089544-010 SW846 6020 Potassium 2.90 0.080 0.300 NE 089544-010 SW846 6020 Selenium 0.00221 0.001 0.005 0.050 J 089544-010 SW846 6020 Silver ND 0.0002 0.001 NE U 089544-010 SW846 6020 Sodium 46.9 0.080 0.250 NE B 089544-010 SW846 6020 Thallium ND 0.0003 0.001 0.002 U 089544-010 SW846 6020 Uranium 0.00367 0.00005 0.0002 0.030 B 089544-010 SW846 6020 Vanadium 0.00392 0.003 0.010 NE J 089544-010 SW846 6020 Zinc ND 0.0026 0.010 NE U 089544-010 SW846 6020 Refer to footnotes on page 5A-35.
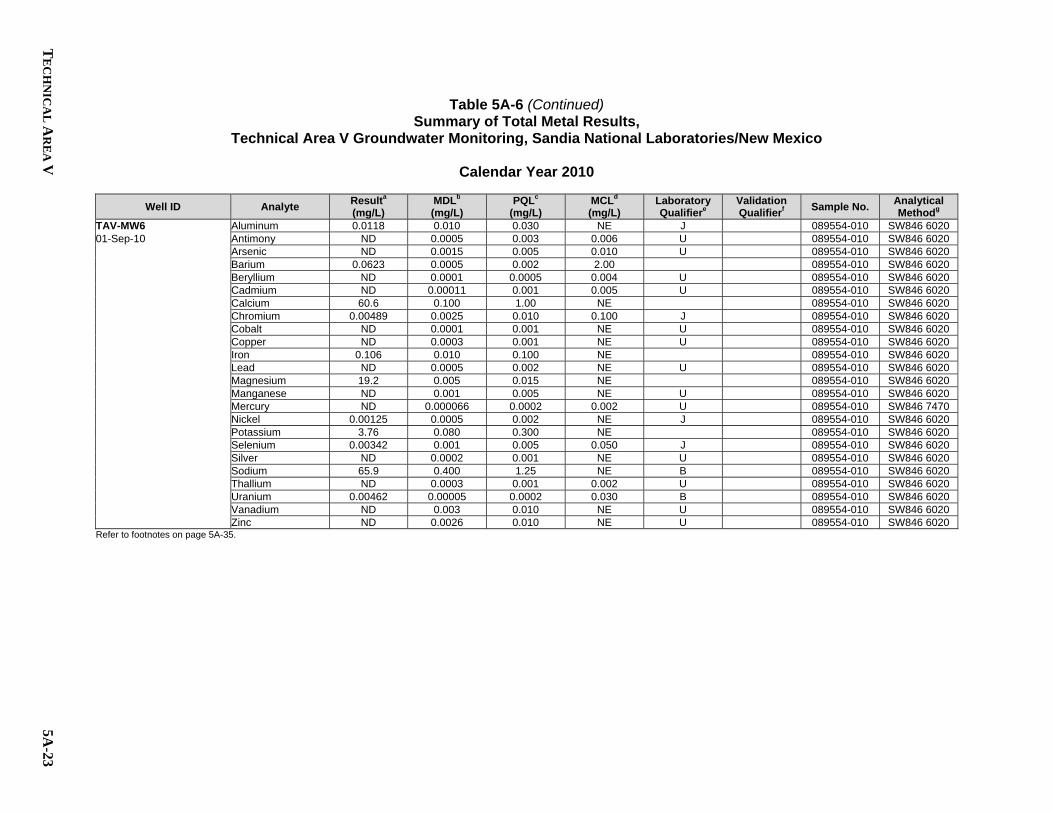
TE
CH
NIC
AL
AR
EA
V
5A-23
Table 5A-6 (Continued) Summary of Total Metal Results,
Technical Area V Groundwater Monitoring, Sandia National Laboratories/New Mexico
Calendar Year 2010
Well ID Analyte Resulta (mg/L)
MDLb (mg/L)
PQLc (mg/L)
MCLd (mg/L)
Laboratory Qualifiere
Validation Qualifierf Sample No. Analytical
Methodg TAV-MW6 Aluminum 0.0118 0.010 0.030 NE J 089554-010 SW846 6020 01-Sep-10 Antimony ND 0.0005 0.003 0.006 U 089554-010 SW846 6020 Arsenic ND 0.0015 0.005 0.010 U 089554-010 SW846 6020 Barium 0.0623 0.0005 0.002 2.00 089554-010 SW846 6020 Beryllium ND 0.0001 0.0005 0.004 U 089554-010 SW846 6020 Cadmium ND 0.00011 0.001 0.005 U 089554-010 SW846 6020 Calcium 60.6 0.100 1.00 NE 089554-010 SW846 6020 Chromium 0.00489 0.0025 0.010 0.100 J 089554-010 SW846 6020 Cobalt ND 0.0001 0.001 NE U 089554-010 SW846 6020 Copper ND 0.0003 0.001 NE U 089554-010 SW846 6020 Iron 0.106 0.010 0.100 NE 089554-010 SW846 6020 Lead ND 0.0005 0.002 NE U 089554-010 SW846 6020 Magnesium 19.2 0.005 0.015 NE 089554-010 SW846 6020 Manganese ND 0.001 0.005 NE U 089554-010 SW846 6020 Mercury ND 0.000066 0.0002 0.002 U 089554-010 SW846 7470 Nickel 0.00125 0.0005 0.002 NE J 089554-010 SW846 6020 Potassium 3.76 0.080 0.300 NE 089554-010 SW846 6020 Selenium 0.00342 0.001 0.005 0.050 J 089554-010 SW846 6020 Silver ND 0.0002 0.001 NE U 089554-010 SW846 6020 Sodium 65.9 0.400 1.25 NE B 089554-010 SW846 6020 Thallium ND 0.0003 0.001 0.002 U 089554-010 SW846 6020 Uranium 0.00462 0.00005 0.0002 0.030 B 089554-010 SW846 6020 Vanadium ND 0.003 0.010 NE U 089554-010 SW846 6020 Zinc ND 0.0026 0.010 NE U 089554-010 SW846 6020 Refer to footnotes on page 5A-35.

5A-24
AN
NU
AL
GR
OU
ND
WA
TE
R M
ON
ITO
RIN
G R
EP
OR
T, CA
LE
ND
AR
YE
AR
2010
Table 5A-6 (Continued) Summary of Total Metal Results,
Technical Area V Groundwater Monitoring, Sandia National Laboratories/New Mexico
Calendar Year 2010
Well ID Analyte Resulta (mg/L)
MDLb (mg/L)
PQLc (mg/L)
MCLd (mg/L)
Laboratory Qualifiere
Validation Qualifierf Sample No. Analytical
Methodg TAV-MW7 Aluminum ND 0.010 0.030 NE U 089540-010 SW846 6020 25-Aug-10 Antimony ND 0.0005 0.003 0.006 U 089540-010 SW846 6020 Arsenic ND 0.0015 0.005 0.010 U 089540-010 SW846 6020 Barium 0.0488 0.0005 0.002 2.00 089540-010 SW846 6020 Beryllium ND 0.0001 0.0005 0.004 U 089540-010 SW846 6020 Cadmium ND 0.00011 0.001 0.005 U 089540-010 SW846 6020 Calcium 58.7 0.200 2.00 NE B 089540-010 SW846 6020 Chromium ND 0.0025 0.010 0.100 U 089540-010 SW846 6020 Cobalt 0.000138 0.0001 0.001 NE J 089540-010 SW846 6020 Copper 0.000653 0.0003 0.001 NE J 089540-010 SW846 6020 Iron 0.171 0.010 0.100 NE B 089540-010 SW846 6020 Lead ND 0.0005 0.002 NE U 089540-010 SW846 6020 Magnesium 16.0 0.005 0.015 NE 089540-010 SW846 6020 Manganese 0.00259 0.001 0.005 NE J 089540-010 SW846 6020 Mercury ND 0.000066 0.0002 0.002 U 089540-010 SW846 7470 Nickel 0.000918 0.0005 0.002 NE J 089540-010 SW846 6020 Potassium 3.85 0.080 0.300 NE 089540-010 SW846 6020 Selenium 0.0016 0.001 0.005 0.050 J 089540-010 SW846 6020 Silver ND 0.0002 0.001 NE U 089540-010 SW846 6020 Sodium 49.0 0.080 0.250 NE 089540-010 SW846 6020 Thallium ND 0.0003 0.001 0.002 U 089540-010 SW846 6020 Uranium 0.00509 0.00005 0.0002 0.030 B 089540-010 SW846 6020 Vanadium ND 0.003 0.010 NE U 089540-010 SW846 6020 Zinc 0.0029 0.0026 0.010 NE J 089540-010 SW846 6020 Refer to footnotes on page 5A-35.

TE
CH
NIC
AL
AR
EA
V
5A-25
Table 5A-6 (Continued) Summary of Total Metal Results,
Technical Area V Groundwater Monitoring, Sandia National Laboratories/New Mexico
Calendar Year 2010
Well ID Analyte Resulta (mg/L)
MDLb (mg/L)
PQLc (mg/L)
MCLd (mg/L)
Laboratory Qualifiere
Validation Qualifierf Sample No. Analytical
Methodg TAV-MW8 Aluminum 0.0243 0.010 0.030 NE J 089546-010 SW846 6020 30-Aug-10 Antimony ND 0.0005 0.003 0.006 U 089546-010 SW846 6020 Arsenic ND 0.0015 0.005 0.010 U 089546-010 SW846 6020 Barium 0.0502 0.0005 0.002 2.00 089546-010 SW846 6020 Beryllium ND 0.0001 0.0005 0.004 U 089546-010 SW846 6020 Cadmium ND 0.00011 0.001 0.005 U 089546-010 SW846 6020 Calcium 53.5 0.100 1.00 NE 089546-010 SW846 6020 Chromium 0.00461 0.0025 0.010 0.100 J 089546-010 SW846 6020 Cobalt ND 0.0001 0.001 NE U 089546-010 SW846 6020 Copper ND 0.0003 0.001 NE U 089546-010 SW846 6020 Iron 0.0985 0.010 0.100 NE J 089546-010 SW846 6020 Lead ND 0.0005 0.002 NE U 089546-010 SW846 6020 Magnesium 16.1 0.005 0.015 NE 089546-010 SW846 6020 Manganese ND 0.001 0.005 NE U 089546-010 SW846 6020 Mercury ND 0.000066 0.0002 0.002 U 089546-010 SW846 7470 Nickel 0.00103 0.0005 0.002 NE J 089546-010 SW846 6020 Potassium 3.81 0.080 0.300 NE 089546-010 SW846 6020 Selenium 0.0026 0.001 0.005 0.050 J 089546-010 SW846 6020 Silver ND 0.0002 0.001 NE U 089546-010 SW846 6020 Sodium 56.7 0.400 1.25 NE B 089546-010 SW846 6020 Thallium ND 0.0003 0.001 0.002 U 089546-010 SW846 6020 Uranium 0.00385 0.00005 0.0002 0.030 B 089546-010 SW846 6020 Vanadium ND 0.003 0.010 NE U 089546-010 SW846 6020 Zinc 0.00283 0.0026 0.010 NE J 089546-010 SW846 6020 Refer to footnotes on page 5A-35.

5A-26
AN
NU
AL
GR
OU
ND
WA
TE
R M
ON
ITO
RIN
G R
EP
OR
T, CA
LE
ND
AR
YE
AR
2010
Table 5A-6 (Continued) Summary of Total Metal Results,
Technical Area V Groundwater Monitoring, Sandia National Laboratories/New Mexico
Calendar Year 2010
Well ID Analyte Resulta (mg/L)
MDLb (mg/L)
PQLc (mg/L)
MCLd (mg/L)
Laboratory Qualifiere
Validation Qualifierf Sample No. Analytical
Methodg TAV-MW9 Aluminum 0.0158 0.010 0.030 NE J 089537-010 SW846 6020 24-Aug-10 Antimony ND 0.0005 0.003 0.006 U 089537-010 SW846 6020 Arsenic ND 0.0015 0.005 0.010 U 089537-010 SW846 6020 Barium 0.0565 0.0005 0.002 2.00 089537-010 SW846 6020 Beryllium ND 0.0001 0.0005 0.004 U 089537-010 SW846 6020 Cadmium ND 0.00011 0.001 0.005 U 089537-010 SW846 6020 Calcium 59.4 0.200 2.00 NE B 089537-010 SW846 6020 Chromium ND 0.0025 0.010 0.100 U 089537-010 SW846 6020 Cobalt 0.000168 0.0001 0.001 NE J 089537-010 SW846 6020 Copper 0.000999 0.0003 0.001 NE J 0.0044U 089537-010 SW846 6020 Iron 0.196 0.010 0.100 NE B 0.67UJ 089537-010 SW846 6020 Lead ND 0.0005 0.002 NE U 089537-010 SW846 6020 Magnesium 17.8 0.005 0.015 NE 089537-010 SW846 6020 Manganese 0.00495 0.001 0.005 NE J 0.0052U 089537-010 SW846 6020 Mercury ND 0.000066 0.0002 0.002 U 089537-010 SW846 7470 Nickel 0.00124 0.0005 0.002 NE J 089537-010 SW846 6020 Potassium 3.83 0.080 0.300 NE 089537-010 SW846 6020 Selenium 0.00145 0.001 0.005 0.050 J 089537-010 SW846 6020 Silver ND 0.0002 0.001 NE U 089537-010 SW846 6020 Sodium 48.6 0.080 0.250 NE 089537-010 SW846 6020 Thallium ND 0.0003 0.001 0.002 U 089537-010 SW846 6020 Uranium 0.00561 0.00005 0.0002 0.030 B 089537-010 SW846 6020 Vanadium ND 0.003 0.010 NE U 089537-010 SW846 6020 Zinc 0.00842 0.0026 0.010 NE J 0.014U 089537-010 SW846 6020 Refer to footnotes on page 5A-35.

TE
CH
NIC
AL
AR
EA
V
5A-27
Table 5A-6 (Continued) Summary of Total Metal Results,
Technical Area V Groundwater Monitoring, Sandia National Laboratories/New Mexico
Calendar Year 2010
Well ID Analyte Resulta (mg/L)
MDLb (mg/L)
PQLc (mg/L)
MCLd (mg/L)
Laboratory Qualifiere
Validation Qualifierf Sample No. Analytical
Methodg TAV-MW9 (Duplicate) Aluminum 0.016 0.010 0.030 NE J 089538-010 SW846 6020 24-Aug-10 Antimony ND 0.0005 0.003 0.006 U 089538-010 SW846 6020 Arsenic ND 0.0015 0.005 0.010 U 089538-010 SW846 6020 Barium 0.0563 0.0005 0.002 2.00 089538-010 SW846 6020 Beryllium ND 0.0001 0.0005 0.004 U 089538-010 SW846 6020 Cadmium ND 0.00011 0.001 0.005 U 089538-010 SW846 6020 Calcium 60.1 0.200 2.00 NE B 089538-010 SW846 6020 Chromium ND 0.0025 0.010 0.100 U 089538-010 SW846 6020 Cobalt 0.000169 0.0001 0.001 NE J 089538-010 SW846 6020 Copper 0.00184 0.0003 0.001 NE 0.0044U 089538-010 SW846 6020 Iron 0.235 0.010 0.100 NE B 0.67UJ 089538-010 SW846 6020 Lead ND 0.0005 0.002 NE U 089538-010 SW846 6020 Magnesium 16.9 0.005 0.015 NE 089538-010 SW846 6020 Manganese 0.00528 0.001 0.005 NE 089538-010 SW846 6020 Mercury ND 0.000066 0.0002 0.002 U 089538-010 SW846 7470 Nickel 0.00125 0.0005 0.002 NE J 089538-010 SW846 6020 Potassium 3.69 0.080 0.300 NE 089538-010 SW846 6020 Selenium 0.00141 0.001 0.005 0.050 J 089538-010 SW846 6020 Silver ND 0.0002 0.001 NE U 089538-010 SW846 6020 Sodium 49.3 0.080 0.250 NE 089538-010 SW846 6020 Thallium ND 0.0003 0.001 0.002 U 089538-010 SW846 6020 Uranium 0.00556 0.00005 0.0002 0.030 B 089538-010 SW846 6020 Vanadium ND 0.003 0.010 NE U 089538-010 SW846 6020 Zinc 0.0122 0.0026 0.010 NE 0.014U 089538-010 SW846 6020 Refer to footnotes on page 5A-35.

5A-28
AN
NU
AL
GR
OU
ND
WA
TE
R M
ON
ITO
RIN
G R
EP
OR
T, CA
LE
ND
AR
YE
AR
2010
Table 5A-6 (Concluded) Summary of Total Metal Results,
Technical Area V Groundwater Monitoring, Sandia National Laboratories/New Mexico
Calendar Year 2010
Well ID Analyte Resulta (mg/L)
MDLb (mg/L)
PQLc (mg/L)
MCLd (mg/L)
Laboratory Qualifiere
Validation Qualifierf Sample No. Analytical
Methodg TAV-MW10 Aluminum ND 0.010 0.030 NE U 089556-010 SW846 6020 02-Sep-10 Antimony ND 0.0005 0.003 0.006 U 089556-010 SW846 6020 Arsenic ND 0.0015 0.005 0.010 U 089556-010 SW846 6020 Barium 0.0612 0.0005 0.002 2.00 089556-010 SW846 6020 Beryllium ND 0.0001 0.0005 0.004 U 089556-010 SW846 6020 Cadmium ND 0.00011 0.001 0.005 U 089556-010 SW846 6020 Calcium 61.9 0.100 1.00 NE 089556-010 SW846 6020 Chromium 0.0052 0.0025 0.010 0.100 J 089556-010 SW846 6020 Cobalt ND 0.0001 0.001 NE U 089556-010 SW846 6020 Copper ND 0.0003 0.001 NE U 089556-010 SW846 6020 Iron 0.106 0.010 0.100 NE 089556-010 SW846 6020 Lead ND 0.0005 0.002 NE U 089556-010 SW846 6020 Magnesium 19.2 0.005 0.015 NE 089556-010 SW846 6020 Manganese ND 0.001 0.005 NE U 089556-010 SW846 6020 Mercury ND 0.000066 0.0002 0.002 U 089556-010 SW846 7470 Nickel 0.00127 0.0005 0.002 NE J 089556-010 SW846 6020 Potassium 4.20 0.080 0.300 NE 089556-010 SW846 6020 Selenium 0.0028 0.001 0.005 0.050 J 089556-010 SW846 6020 Silver ND 0.0002 0.001 NE U 089556-010 SW846 6020 Sodium 63.7 0.400 1.25 NE B 089556-010 SW846 6020 Thallium ND 0.0003 0.001 0.002 U 089556-010 SW846 6020 Uranium 0.0043 0.00005 0.0002 0.030 B 089556-010 SW846 6020 Vanadium ND 0.003 0.010 NE U 089556-010 SW846 6020 Zinc ND 0.0026 0.010 NE U 089556-010 SW846 6020 Refer to footnotes on page 5A-35.

TE
CH
NIC
AL
AR
EA
V
5A-29
Table 5A-7 Summary of Tritium, Gross Alpha, Gross Beta, and Gamma Spectroscopy Results,
Technical Area V Groundwater Monitoring, Sandia National Laboratories/New Mexico
Calendar Year 2010
Well ID Analyte Activitya (pCi/L)
MDAb (pCi/L)
Critical Levelb(pCi/L)
MCLd (pCi/L)
Laboratory Qualifiere
Validation Qualifierf Sample No. Analytical
Methodg AVN-1 Americium-241 2.43 4.63 7.87 3.94 NE U BD 089542-033 EPA 901.1 26-Aug-10 Cesium-137 0.180 1.59 2.73 1.37 NE U BD 089542-033 EPA 901.1 Cobalt-60 -0.566 1.69 2.81 1.41 NE U BD 089542-033 EPA 901.1 Potassium-40 -12.7 30.7 40.6 20.3 NE U BD 089542-033 EPA 901.1 Gross Alpha 1.77 NA NA 15 NA None 089542-034 EPA 900.0 Gross Beta 3.28 1.16 1.57 0.760 4mrem/yr J 089542-034 EPA 900.0 Tritium 60.3 67.2 111 50.6 NE U BD 089542-036 EPA 906.0 M LWDS-MW1 Americium-241 1.97 5.66 9.31 4.66 NE U BD 089563-033 EPA 901.1 13-Sep-10 Cesium-137 0.711 1.51 2.57 1.29 NE U BD 089563-033 EPA 901.1 Cobalt-60 0.970 1.67 2.89 1.45 NE U BD 089563-033 EPA 901.1 Potassium-40 -1.5 38.0 38.7 19.4 NE U BD 089563-033 EPA 901.1 Gross Alpha 1.96 NA NA 15 NA None 089563-034 EPA 900.0 Gross Beta 12.9 2.50 1.55 0.746 4mrem/yr 089563-034 EPA 900.0 Tritium -38.5 60.0 115 53.3 NE U BD 089563-036 EPA 906.0 M LWDS-MW2 Americium-241 -21.3 11.9 18.6 9.30 NE U BD 089559-033 EPA 901.1 07-Sep-10 Cesium-137 -2.15 1.90 3.00 1.50 NE U BD 089559-033 EPA 901.1 Cobalt-60 1.13 1.99 3.46 1.73 NE U BD 089559-033 EPA 901.1 Potassium-40 -35.6 41.0 42.4 21.2 NE U BD 089559-033 EPA 901.1 Gross Alpha 3.13 NA NA 15 NA None 089559-034 EPA 900.0 Gross Beta 4.11 1.40 1.92 0.936 4mrem/yr J 089559-034 EPA 900.0 Tritium 75.2 59.2 91.8 41.5 NE U BD 089559-036 EPA 906.0 M TAV-MW2 Americium-241 7.11 10.3 18.3 9.18 NE U BD 089551-033 EPA 901.1 31-Aug-10 Cesium-137 -0.751 2.01 3.34 1.67 NE U BD 089551-033 EPA 901.1 Cobalt-60 0.376 2.15 3.61 1.81 NE U BD 089551-033 EPA 901.1 Potassium-40 6.97 44.8 52.2 26.1 NE U BD 089551-033 EPA 901.1 Gross Alpha 4.53 NA NA 15 NA None 089551-034 EPA 900.0 Gross Beta 5.47 1.61 1.90 0.917 4mrem/yr J 089551-034 EPA 900.0 Tritium 40.0 62.8 107 49.0 NE U BD 089551-036 EPA 906.0 M TAV-MW2 (Duplicate) Americium-241 -8.44 11.5 19.1 9.57 NE U BD 089552-033 EPA 901.1 31-Aug-10 Cesium-137 0.302 3.66 4.13 2.07 NE U BD 089552-033 EPA 901.1 Cobalt-60 0.370 1.89 3.26 1.63 NE U BD 089552-033 EPA 901.1 Potassium-40 3.25 41.7 44.2 22.1 NE U BD 089552-033 EPA 901.1 Gross Alpha 4.55 NA NA 15 NA None 089552-034 EPA 900.0 Gross Beta 3.03 1.34 1.97 0.955 4mrem/yr J 089552-034 EPA 900.0 Tritium 25.5 63.3 111 50.9 NE U BD 089552-036 EPA 906.0 M Refer to footnotes on page 5A-35.

5A-30
AN
NU
AL
GR
OU
ND
WA
TE
R M
ON
ITO
RIN
G R
EP
OR
T, CA
LE
ND
AR
YE
AR
2010
Table 5A-7 (Continued) Summary of Tritium, Gross Alpha, Gross Beta, and Gamma Spectroscopy Results,
Technical Area V Groundwater Monitoring, Sandia National Laboratories/New Mexico
Calendar Year 2010
Well ID Analyte Activitya (pCi/L)
MDAb (pCi/L)
Critical Levelb(pCi/L)
MCLd (pCi/L)
Laboratory Qualifiere
Validation Qualifierf Sample No. Analytical
Methodg TAV-MW3 Americium-241 -8.71 10.2 17.4 8.72 NE U BD 089533-033 EPA 901.1 23-Aug-10 Cesium-137 1.03 2.09 3.60 1.80 NE U BD 089533-033 EPA 901.1 Cobalt-60 1.29 2.17 3.76 1.88 NE U BD 089533-033 EPA 901.1 Potassium-40 27.1 43.6 56.8 28.4 NE U BD 089533-033 EPA 901.1 Gross Alpha 2.42 NA NA 15 NA None 089533-034 EPA 900.0 Gross Beta 6.31 1.59 1.71 0.828 4mrem/yr 089533-034 EPA 900.0 Tritium 21.5 60.7 107 49.0 NE U BD 089533-036 EPA 906.0 M TAV-MW4 Americium-241 -0.716 5.21 8.82 4.41 NE U BD 089561-033 EPA 901.1 09-Sep-10 Cesium-137 0.363 1.75 2.99 1.50 NE U BD 089561-033 EPA 901.1 Cobalt-60 0.242 1.88 3.18 1.59 NE U BD 089561-033 EPA 901.1 Potassium-40 3.55 43.9 46.7 23.4 NE U BD 089561-033 EPA 901.1 Gross Alpha 1.11 NA NA 15 NA None 089561-034 EPA 900.0 Gross Beta 3.10 0.891 1.01 0.480 4mrem/yr 089561-034 EPA 900.0 Tritium 40.8 55.6 93.9 42.4 NE U BD 089561-036 EPA 906.0 M TAV-MW5 Americium-241 -2.31 5.36 7.92 3.96 NE U BD 089544-033 EPA 901.1 27-Aug-10 Cesium-137 0.444 1.56 2.71 1.35 NE U BD 089544-033 EPA 901.1 Cobalt-60 1.20 1.63 2.91 1.46 NE U BD 089544-033 EPA 901.1 Potassium-40 -17.6 34.5 39.6 19.8 NE U BD 089544-033 EPA 901.1 Gross Alpha 1.44 NA NA 15 NA None 089544-034 EPA 900.0 Gross Beta 2.16 0.840 1.15 0.548 4mrem/yr J 089544-034 EPA 900.0 Tritium 12.4 60.4 108 49.6 NE U BD 089544-036 EPA 906.0 M TAV-MW6 Americium-241 -7.94 10.7 17.6 8.83 NE U BD 089554-033 EPA 901.1 01-Sep-10 Cesium-137 0.456 1.87 3.19 1.60 NE U BD 089554-033 EPA 901.1 Cobalt-60 0.549 2.16 3.68 1.84 NE U BD 089554-033 EPA 901.1 Potassium-40 40.2 24.8 45.1 22.6 NE U BD 089554-033 EPA 901.1 Gross Alpha 1.09 NA NA 15 NA None 089554-034 EPA 900.0 Gross Beta 4.60 1.23 1.42 0.685 4mrem/yr 089554-034 EPA 900.0 Tritium 6.33 60.7 110 50.4 NE U BD 089554-036 EPA 906.0 M TAV-MW7 Americium-241 -16.2 7.80 12.6 6.29 NE U BD 089540-033 EPA 901.1 25-Aug-10 Cesium-137 0.341 1.77 3.00 1.50 NE U BD 089540-033 EPA 901.1 Cobalt-60 2.18 1.91 3.46 1.73 NE U BD 089540-033 EPA 901.1 Potassium-40 13.7 35.1 43.6 21.8 NE U BD 089540-033 EPA 901.1 Gross Alpha 3.35 NA NA 15 NA None 089540-034 EPA 900.0 Gross Beta 5.62 1.46 1.63 0.788 4mrem/yr 089540-034 EPA 900.0 Tritium 6.12 58.7 107 48.8 NE U BD 089540-036 EPA 906.0 M Refer to footnotes on page 5A-35.
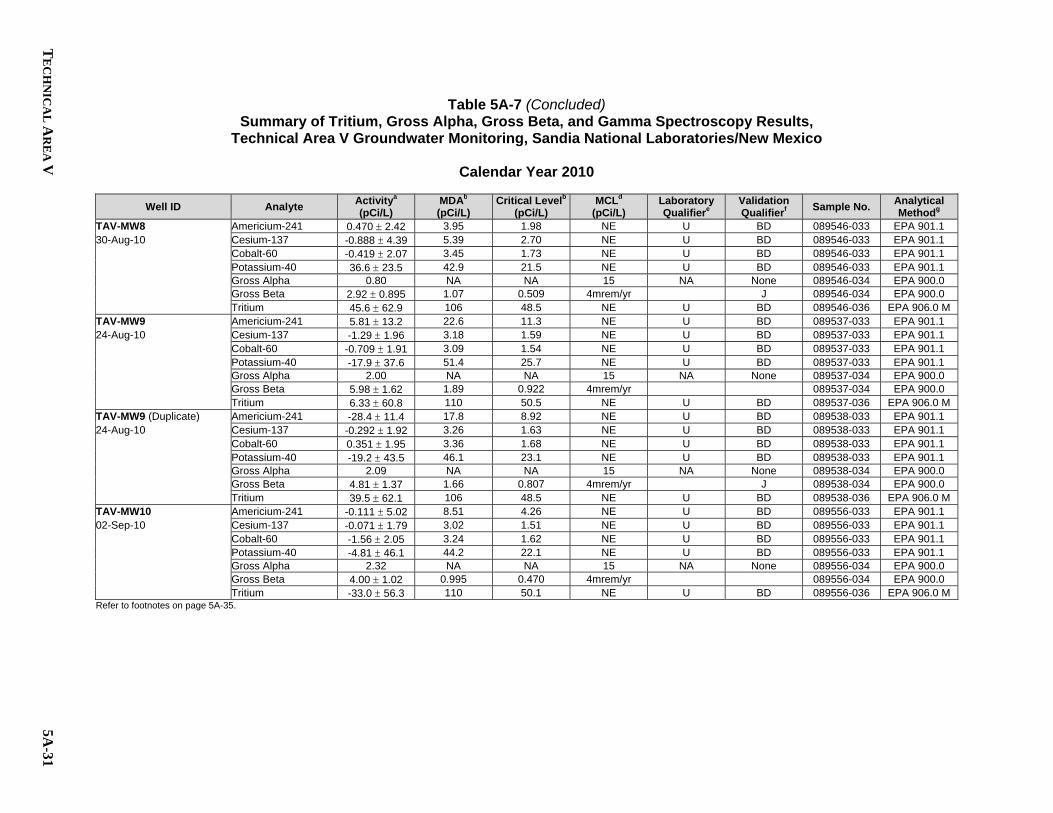
TE
CH
NIC
AL
AR
EA
V
5A-31
Table 5A-7 (Concluded) Summary of Tritium, Gross Alpha, Gross Beta, and Gamma Spectroscopy Results,
Technical Area V Groundwater Monitoring, Sandia National Laboratories/New Mexico
Calendar Year 2010
Well ID Analyte Activitya (pCi/L)
MDAb (pCi/L)
Critical Levelb(pCi/L)
MCLd (pCi/L)
Laboratory Qualifiere
Validation Qualifierf Sample No. Analytical
Methodg TAV-MW8 Americium-241 0.470 2.42 3.95 1.98 NE U BD 089546-033 EPA 901.1 30-Aug-10 Cesium-137 -0.888 4.39 5.39 2.70 NE U BD 089546-033 EPA 901.1 Cobalt-60 -0.419 2.07 3.45 1.73 NE U BD 089546-033 EPA 901.1 Potassium-40 36.6 23.5 42.9 21.5 NE U BD 089546-033 EPA 901.1 Gross Alpha 0.80 NA NA 15 NA None 089546-034 EPA 900.0 Gross Beta 2.92 0.895 1.07 0.509 4mrem/yr J 089546-034 EPA 900.0 Tritium 45.6 62.9 106 48.5 NE U BD 089546-036 EPA 906.0 M TAV-MW9 Americium-241 5.81 13.2 22.6 11.3 NE U BD 089537-033 EPA 901.1 24-Aug-10 Cesium-137 -1.29 1.96 3.18 1.59 NE U BD 089537-033 EPA 901.1 Cobalt-60 -0.709 1.91 3.09 1.54 NE U BD 089537-033 EPA 901.1 Potassium-40 -17.9 37.6 51.4 25.7 NE U BD 089537-033 EPA 901.1 Gross Alpha 2.00 NA NA 15 NA None 089537-034 EPA 900.0 Gross Beta 5.98 1.62 1.89 0.922 4mrem/yr 089537-034 EPA 900.0 Tritium 6.33 60.8 110 50.5 NE U BD 089537-036 EPA 906.0 M TAV-MW9 (Duplicate) Americium-241 -28.4 11.4 17.8 8.92 NE U BD 089538-033 EPA 901.1 24-Aug-10 Cesium-137 -0.292 1.92 3.26 1.63 NE U BD 089538-033 EPA 901.1 Cobalt-60 0.351 1.95 3.36 1.68 NE U BD 089538-033 EPA 901.1 Potassium-40 -19.2 43.5 46.1 23.1 NE U BD 089538-033 EPA 901.1 Gross Alpha 2.09 NA NA 15 NA None 089538-034 EPA 900.0 Gross Beta 4.81 1.37 1.66 0.807 4mrem/yr J 089538-034 EPA 900.0 Tritium 39.5 62.1 106 48.5 NE U BD 089538-036 EPA 906.0 M TAV-MW10 Americium-241 -0.111 5.02 8.51 4.26 NE U BD 089556-033 EPA 901.1 02-Sep-10 Cesium-137 -0.071 1.79 3.02 1.51 NE U BD 089556-033 EPA 901.1 Cobalt-60 -1.56 2.05 3.24 1.62 NE U BD 089556-033 EPA 901.1 Potassium-40 -4.81 46.1 44.2 22.1 NE U BD 089556-033 EPA 901.1 Gross Alpha 2.32 NA NA 15 NA None 089556-034 EPA 900.0 Gross Beta 4.00 1.02 0.995 0.470 4mrem/yr 089556-034 EPA 900.0 Tritium -33.0 56.3 110 50.1 NE U BD 089556-036 EPA 906.0 M Refer to footnotes on page 5A-35.

5A-32
AN
NU
AL
GR
OU
ND
WA
TE
R M
ON
ITO
RIN
G R
EP
OR
T, CA
LE
ND
AR
YE
AR
2010
Table 5A-8 Summary of Field Water Quality Measurementsh,
Technical Area V Groundwater Monitoring, Sandia National Laboratories/New Mexico
Calendar Year 2010
Well ID Sample Date Temperature (0C)
Specific Conductivity (mho/cm)
Oxidation Reduction Potential
(mV) pH Turbidity
(NTU) Dissolved Oxygen (% Sat)
Dissolved Oxygen (mg/L)
AVN-1 08-Feb-10 17.12 411 154.1 7.53 1.20 40.8 3.93 LWDS-MW1 17-Feb-10 17.59 729 234.7 7.19 0.69 75.6 7.31 LWDS-MW2 05-Feb-10 18.05 468 203.3 7.41 0.42 49.4 4.66 TAV-MW2 10-Feb-10 17.00 715 183.1 7.18 0.45 58.2 5.61 TAV-MW3 02-Feb-10 17.97 541 220.4 7.32 0.61 70.4 6.66 TAV-MW4 11-Feb-10 16.02 514 236.4 7.39 0.64 70.1 6.99 TAV-MW5 04-Feb-10 17.23 485 206.1 7.38 0.16 47.7 4.58 TAV-MW6 12-Feb-10 16.41 679 211.2 7.25 0.63 74.5 7.31 TAV-MW7 03-Feb-10 17.47 600 136.1 7.25 1.39 2.7 0.26 TAV-MW8 09-Feb-10 18.12 575 200.5 7.34 0.68 66.0 6.22 TAV-MW9 01-Feb-10 18.61 591 170.1 7.11 1.65 16.1 1.50 TAV-MW10 15-Feb-10 16.31 655 235.1 7.22 0.21 85.3 8.34
AVN-1 15-Jun-10 21.42 405 66.3 7.83 2.47 43.2 3.81 LWDS-MW1 25-Jun-10 23.06 700 183.9 7.41 0.24 84.5 7.22 LWDS-MW2 11-Jun-10 21.82 459 72.3 7.69 0.53 50.0 4.34 TAV-MW2 21-Jun-10 22.53 687 52.8 7.53 2.17 60.3 5.18 TAV-MW3 09-Jun-10 23.78 525 116.0 7.50 0.54 74.8 6.20 TAV-MW4 22-Jun-10 21.68 500 288.6 7.51 0.89 71.6 6.28 TAV-MW5 14-Jun-10 22.34 476 67.0 7.71 0.14 52.6 4.56 TAV-MW6 23-Jun-10 21.34 663 213.9 7.40 1.59 78.7 6.98 TAV-MW7 10-Jun-10 22.23 591 2.7 7.52 0.64 3.7 0.32 TAV-MW8 16-Jun-10 22.91 565 63.8 7.68 0.46 70.9 6.04 TAV-MW9 08-Jun-10 21.67 628 92.5 8.46 1.08 16.4 1.44 TAV-MW10 07-Jun-10 21.99 644 159.6 8.47 0.25 83.1 7.26
AVN-1 26-Aug-10 22.74 393 154.1 7.56 1.67 36.6 3.28 LWDS-MW1 13-Sep-10 20.12 691 112.3 7.34 0.22 81.8 7.40 LWDS-MW2 07-Sep-10 22.54 454 173.3 7.45 0.09 50.9 4.41 TAV-MW2 31-Aug-10 22.47 679 186.8 7.19 0.42 66.5 5.76 TAV-MW3 23-Aug-10 22.61 516 144.6 7.39 0.73 74.8 6.45 TAV-MW4 09-Sep-10 21.78 495 177.9 7.47 0.45 75.4 6.63 TAV-MW5 27-Aug-10 22.92 464 163.8 7.42 0.16 54.1 4.65 TAV-MW6 01-Sep-10 21.87 645 193.5 7.29 0.39 80.5 7.11 Refer to footnotes on page 5A-35.

TE
CH
NIC
AL
AR
EA
V
5A-33
Table 5A-8 (Concluded) Summary of Field Water Quality Measurementsh,
Technical Area V Groundwater Monitoring, Sandia National Laboratories/New Mexico
Calendar Year 2010
Well ID Sample Date Temperature (0C)
Specific Conductivity (mho/cm)
Oxidation Reduction Potential
(mV) pH Turbidity
(NTU) Dissolved Oxygen (% Sat)
Dissolved Oxygen (mg/L)
TAV-MW7 25-Aug-10 21.00 572 107.9 7.26 0.30 3.5 0.31 TAV-MW8 30-Aug-10 21.27 547 190.9 7.37 0.98 79.1 7.10 TAV-MW9 24-Aug-10 21.84 568 125.6 7.17 1.73 18.4 1.61 TAV-MW10 02-Sep-10 23.11 631 171.5 7.27 0.12 84.4 7.20
AVN-1 12-Oct-10 21.00 400 195.7 7.68 0.95 43.2 3.84 LWDS-MW1 25-Oct-10 16.38 690 249.9 7.47 0.22 76.3 7.46 LWDS-MW2 11-Oct-10 20.80 452 232.2 7.59 0.21 49.7 4.43 TAV-MW2 14-Oct-10 20.37 688 277.6 7.31 0.58 58.4 5.26 TAV-MW3 04-Oct-10 21.45 528 154.5 7.46 0.20 75.0 6.64 TAV-MW4 18-Oct-10 20.43 497 215.4 7.56 0.41 71.8 6.48 TAV-MW5 07-Oct-10 21.27 471 228.3 7.53 0.11 50.9 4.49 TAV-MW6 19-Oct-10 19.17 652 214.7 7.40 0.61 74.3 6.85 TAV-MW7 06-Oct-10 20.79 582 214.9 7.37 0.27 3.4 0.30 TAV-MW8 13-Oct-10 19.99 555 225.1 7.50 0.90 69.1 6.26 TAV-MW9 05-Oct-10 22.46 605 144.9 7.27 1.47 17.3 1.50 TAV-MW10 20-Oct-10 20.58 629 206.8 7.42 0.08 76.9 7.00 Refer to footnotes on page 5A-35.
5A-34 ANNUAL GROUNDWATER MONITORING REPORT, CALENDAR YEAR 2010
This page left intentionally blank.

TECHNICAL AREA V 5A-35
Footnotes for Technical Area V Groundwater Monitoring Tables
aResult - Values in bold exceed the established MCL. - ND = not detected (at method detection limit). - Activities of zero or less are considered to be not detected. - Gross alpha activity measurements were corrected by subtracting out the total uranium activity (40 CFR Parts 9, 141, and 142, Table 1-4) - g/L = micrograms per liter - mg/L = milligrams per liter - pCi/L = picocuries per liter
bMDL or MDA Method detection limit. The minimum concentration or activity that can be measured and reported with 99% confidence that the analyte is greater than zero; analyte is matrix specific. The minimal detectable activity or minimum measured activity in a sample required to ensure a 95% probability that the measured activity is accurately quantified above the critical level. NA = not applicable for gross alpha activities. The MDA could not be calculated as the gross alpha activity was corrected by subtracting out the total uranium activity.
cPQL or Critical Level Practical quantitation limit. The lowest concentration of analytes in a sample that can be reliably determined within specified limits of precision and accuracy by that indicated method under routine laboratory operating conditions. The minimum activity that can be measured and reported with 99% confidence that the analyte is greater than zero; analyte is matrix specific. NA = not applicable for gross alpha activities. The critical level could not be calculated as the gross alpha activity was corrected by subtracting out the total uranium activity.
dMCL - Maximum contaminant level. Established by the U.S. Environmental Protection Agency Primary Water Regulations (40 CFR 141.11[b]), National Primary Drinking Water Standards, EPA, July 2002. - NE = not established. - The following are the MCLs for gross alpha particles and beta particles in community water systems: 15 pCi/L = Gross alpha particle activity, excluding total uranium (40 CFR Parts 9, 141, and 142, Table 1-4). 4 mrem/yr = any combination of beta and/or gamma emitting radionuclides (as dose rate).
eLaboratory Qualifier B = Analyte is detected in associated laboratory method blank. J = Amount detected is below the practical quantitation limit (PQL). NA = Not applicable for gross alpha activities. U = Analyte is absent or below the method detection limit.
fValidation Qualifier If cell is blank, then all quality control samples met acceptance criteria with respect to submitted samples. BD = Below detection limit as used in radiochemistry to identify results that are not statistically different from zero. J = The associate value is an estimated quantity. None = No data validation for corrected gross alpha activity. U = The analyte was analyzed for but was not detected. The associated numerical value is the sample quantitation limit. UJ = The analyte was analyzed for but was not detected. The associated value is an estimate and may be inaccurate or imprecise.
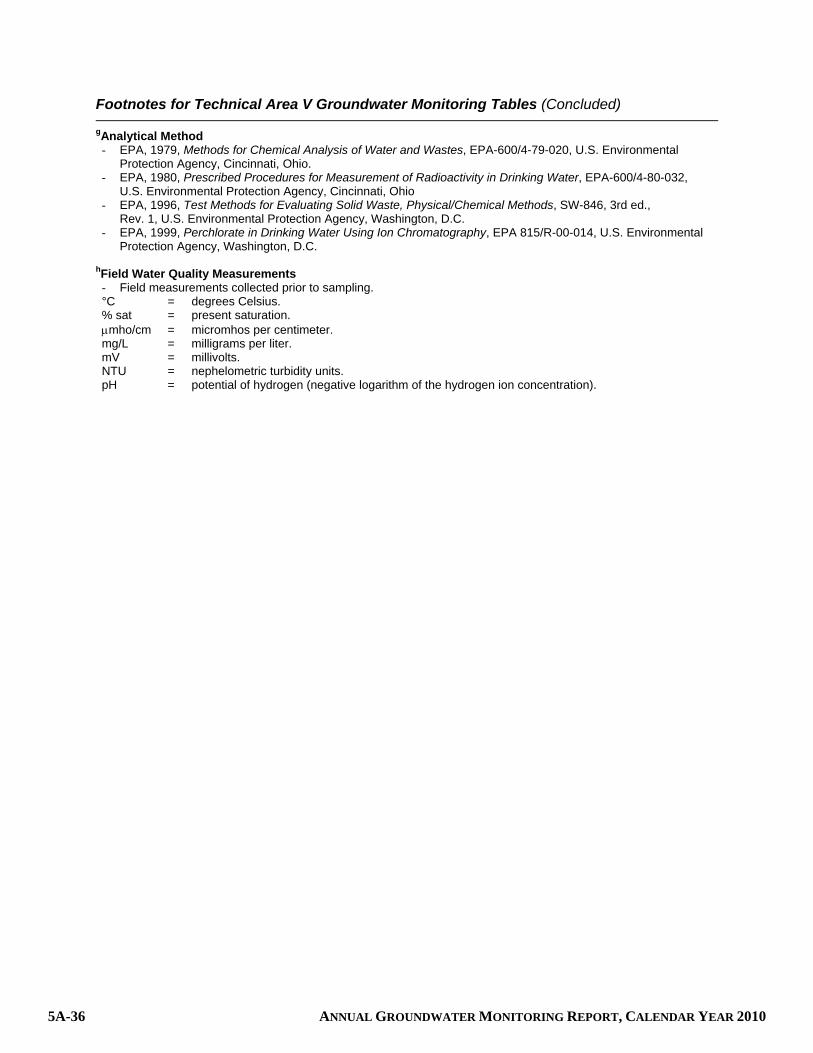
5A-36 ANNUAL GROUNDWATER MONITORING REPORT, CALENDAR YEAR 2010
Footnotes for Technical Area V Groundwater Monitoring Tables (Concluded)
gAnalytical Method
- EPA, 1979, Methods for Chemical Analysis of Water and Wastes, EPA-600/4-79-020, U.S. Environmental Protection Agency, Cincinnati, Ohio. - EPA, 1980, Prescribed Procedures for Measurement of Radioactivity in Drinking Water, EPA-600/4-80-032, U.S. Environmental Protection Agency, Cincinnati, Ohio - EPA, 1996, Test Methods for Evaluating Solid Waste, Physical/Chemical Methods, SW-846, 3rd ed.,
Rev. 1, U.S. Environmental Protection Agency, Washington, D.C. - EPA, 1999, Perchlorate in Drinking Water Using Ion Chromatography, EPA 815/R-00-014, U.S. Environmental
Protection Agency, Washington, D.C. hField Water Quality Measurements - Field measurements collected prior to sampling. °C = degrees Celsius. % sat = present saturation. mho/cm = micromhos per centimeter. mg/L = milligrams per liter. mV = millivolts. NTU = nephelometric turbidity units. pH = potential of hydrogen (negative logarithm of the hydrogen ion concentration).

TECHNICAL AREA V 5B-1
Attachment 5B Technical Area V
Plots

5B-2 ANNUAL GROUNDWATER MONITORING REPORT, CALENDAR YEAR 2010
This page intentionally left blank.
TECHNICAL AREA V 5B-3
Attachment 5B Plots 5B-1 Trichloroethene Concentrations, LWDS-MW1 ............................................................ 5B-5 5B-2 Trichloroethene Concentrations, TAV-MW6 ............................................................... 5B-6 5B-3 Trichloroethene Concentrations, TAV-MW10 ............................................................. 5B-7 5B-4 Nitrate plus Nitrite Concentrations, LWDS-MW1 ....................................................... 5B-8 5B-5 Nitrate plus Nitrite Concentrations, TAV-MW10 ........................................................ 5B-9

5B-4 ANNUAL GROUNDWATER MONITORING REPORT, CALENDAR YEAR 2010
This page intentionally left blank.
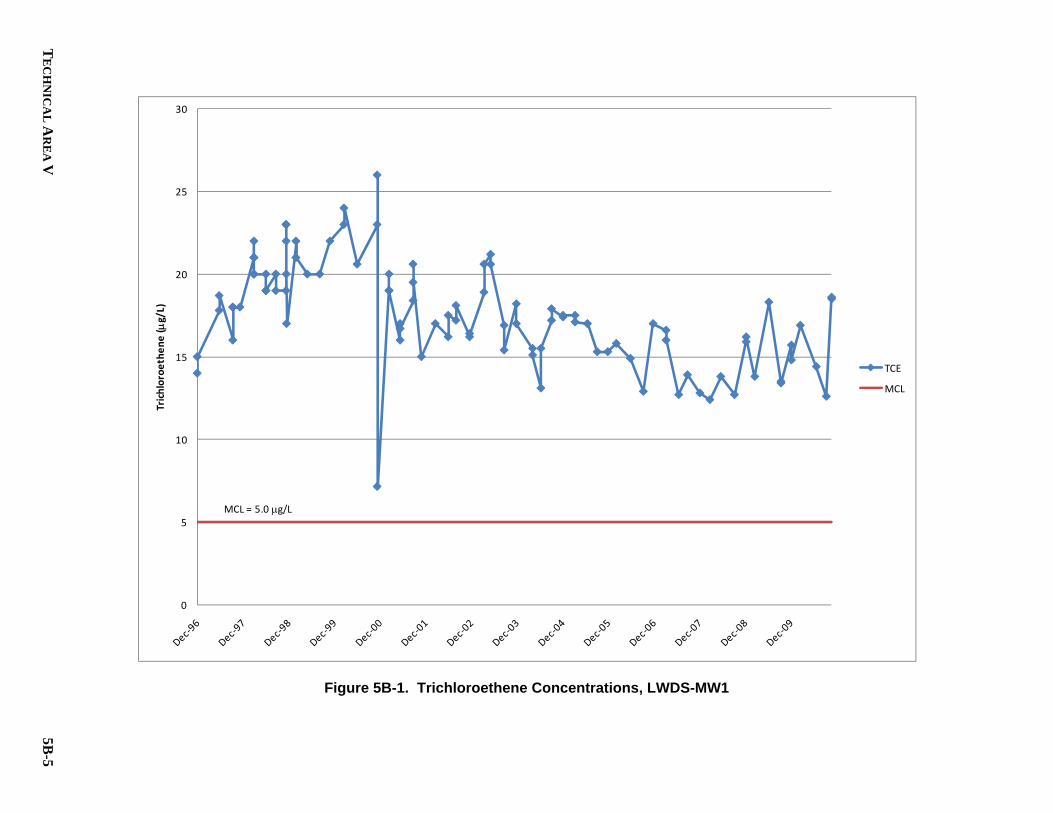
TE
CH
NIC
AL
AR
EA
V
5B-5
Figure 5B-1. Trichloroethene Concentrations, LWDS-MW1
0
5
10
15
20
25
30
Trich
loro
ethe
ne (
g/L)
TCE
MCL
MCL = 5.0 g/L

5B-6
AN
NU
AL
GR
OU
ND
WA
TE
R M
ON
ITO
RIN
G R
EP
OR
T, CA
LE
ND
AR
YE
AR
2010
Figure 5B-2. Trichloroethene Concentrations, TAV-MW6
0
2
4
6
8
10
12
14
Trich
loro
ethe
ne (
g/L)
TCE
MCL
MCL = 5.0 mg/L

TE
CH
NIC
AL
AR
EA
V
5B-7
Figure 5B-3. Trichloroethene Concentrations, TAV-MW10
0
2
4
6
8
10
12
14
16
Trich
loro
ethe
ne (
g/L)
TCE
MCL
MCL = 5.0 g/L
April 2008, monitoring well TAV‐MW10 replaces TAV‐MW1

5B-8
AN
NU
AL
GR
OU
ND
WA
TE
R M
ON
ITO
RIN
G R
EP
OR
T, CA
LE
ND
AR
YE
AR
2010
Figure 5B-4. Nitrate plus Nitrite Concentrations, LWDS-MW1
0
2
4
6
8
10
12
14
16
Nitr
ate
plus N
itrite
(mg/
L)
NPN
MCL
MCL = 10 mg/L
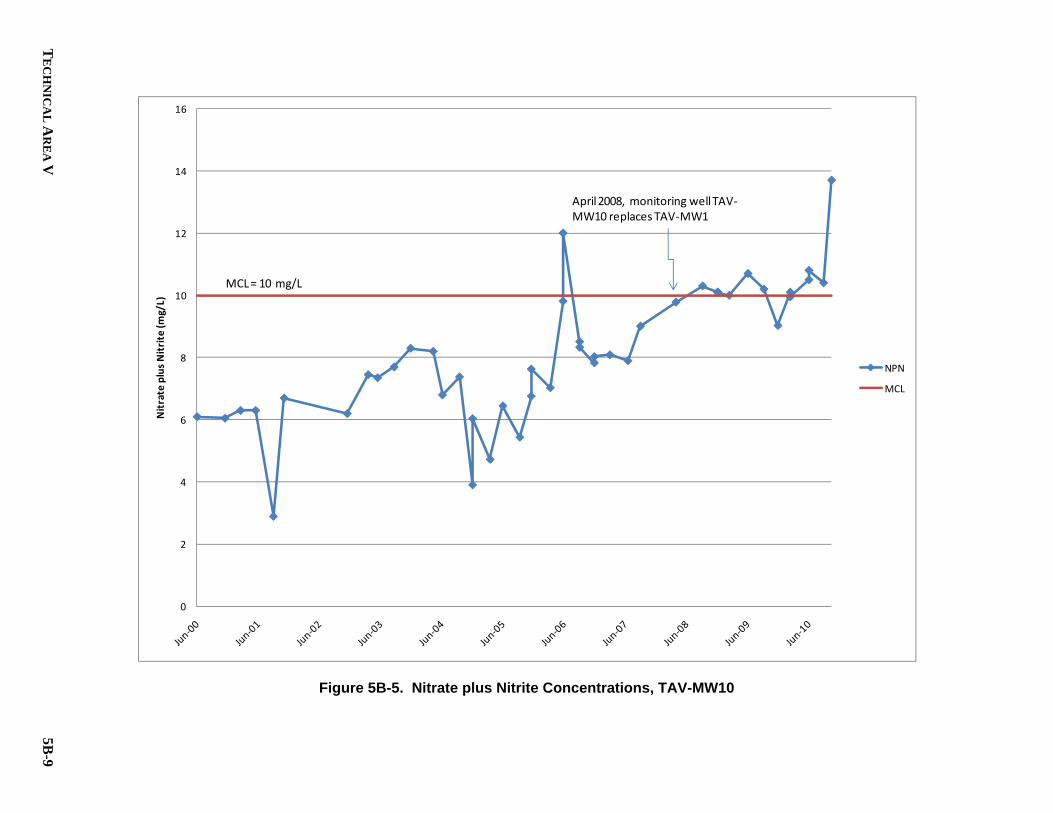
TE
CH
NIC
AL
AR
EA
V
5B-9
Figure 5B-5. Nitrate plus Nitrite Concentrations, TAV-MW10
0
2
4
6
8
10
12
14
16
Nitr
ate
plus N
itrite
(mg/
L)
NPN
MCL
MCL = 10 mg/L
April 2008, monitoring well TAV‐MW10 replaces TAV‐MW1

5B-10 ANNUAL GROUNDWATER MONITORING REPORT, CALENDAR YEAR 2010
This page intentionally left blank.

TECHNICAL AREA V 5C-1
Attachment 5C Technical Area V
Hydrographs

5C-2 ANNUAL GROUNDWATER MONITORING REPORT, CALENDAR YEAR 2010
This page intentionally left blank.

TECHNICAL AREA V 5C-3
Attachment 5C Hydrographs 5C-1 TA-V Study Area Water Table Completion Wells ....................................................... 5C-5 5C-2 TA-V Study Area Deep Completion Wells .................................................................. 5C-6

5C-4 ANNUAL GROUNDWATER MONITORING REPORT, CALENDAR YEAR 2010
This page intentionally left blank.

TE
CH
NIC
AL
AR
EA
V
5C-5
Figure 5C-1. TA-V Study Area Water Table Completion Wells
4919
4920
4921
4922
4923
4924
4925
4926
Jan-
07
Mar
-07
May
-07
Jul-0
7
Sep
-07
Nov
-07
Jan-
08
Mar
-08
May
-08
Jul-0
8
Aug
-08
Oct
-08
Dec
-08
Feb-
09
Apr
-09
Jun-
09
Aug
-09
Oct
-09
Dec
-09
Feb-
10
Apr
-10
Jun-
10
Aug
-10
Oct
-10
Dec
-10
Wat
er L
evel
Ele
vatio
n, f
amsl
LWDS-MW1 LWDS-MW2 TAV-MW1 TAV-MW10TAV-MW2 TAV-MW3 TAV-MW4 TAV-MW5TAV-MW6 TAV-MW8
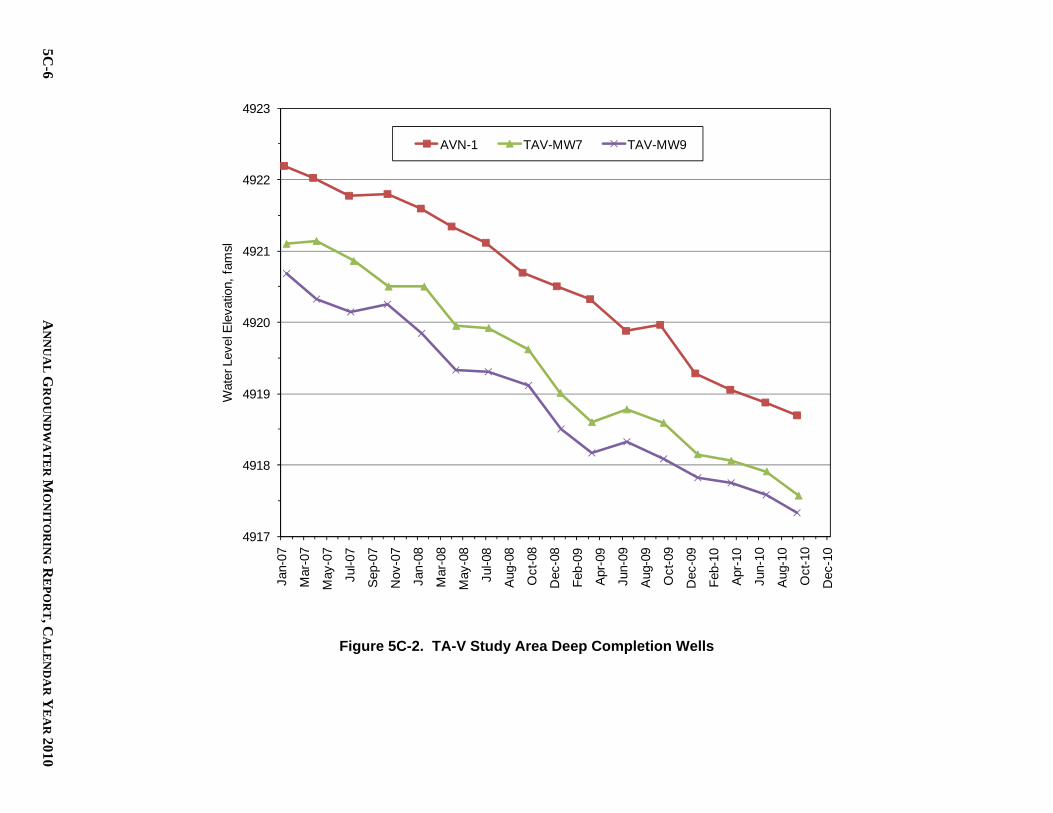
5C-6
AN
NU
AL
GR
OU
ND
WA
TE
R M
ON
ITO
RIN
G R
EP
OR
T, CA
LE
ND
AR
YE
AR
2010
Figure 5C-2. TA-V Study Area Deep Completion Wells
4917
4918
4919
4920
4921
4922
4923
Jan-
07
Mar
-07
May
-07
Jul-0
7
Sep
-07
Nov
-07
Jan-
08
Mar
-08
May
-08
Jul-0
8
Aug
-08
Oct
-08
Dec
-08
Feb-
09
Apr
-09
Jun-
09
Aug
-09
Oct
-09
Dec
-09
Feb-
10
Apr
-10
Jun-
10
Aug
-10
Oct
-10
Dec
-10
Wat
er L
evel
Ele
vatio
n, f
amsl
AVN-1 TAV-MW7 TAV-MW9
TIJERAS ARROYO GROUNDWATER 6-1
6.0 Tijeras Arroyo Groundwater Study Area
6.1 Introduction
Trichloroethene (TCE) and nitrate have been identified as constituents of concern (COCs) in groundwater at the Tijeras Arroyo Groundwater (TAG) study area based on historical groundwater monitoring results. Detections of these COCs exceed the U.S. Environmental Protection Agency (EPA) maximum contaminant levels (MCLs) in samples collected from the TAG study area monitoring wells. Since August 1996, the historical maximum TCE concentration detected at the site has been 9.6 micrograms per liter (g/L), and the maximum nitrate detection has been 49 milligrams per liter (mg/L). The EPA and State of New Mexico drinking water standards (MCLs) for TCE and nitrate are 5 g/L and 10 mg/L (as nitrogen), respectively. Unique features of the TAG study area include low concentrations of TCE at scattered locations in the perched groundwater system (PGWS), and low concentrations of nitrate at scattered locations in the PGWS and regional aquifer.
6.1.1 Location
The TAG study area encompasses approximately 40 square miles (sq mi) in the north-central portion of Kirtland Air Force Base (KAFB) (Figure 6-1). Three of the five Technical Areas (TAs) managed by Sandia National Laboratories, New Mexico (SNL/NM) are located in the TAG study area. Together, the three TAs (TA-I, TA-II, and TA-IV) encompass approximately 641 acres. The SNL/NM facility is a government-owned, contractor-operated, multi-program laboratory overseen by the U.S. Department of Energy (DOE), National Nuclear Security Administration through the Sandia Site Office in Albuquerque, New Mexico. Sandia Corporation (Sandia), a wholly owned subsidiary of Lockheed Martin Corporation, manages and operates SNL/NM under Contract DE-AC04-94AL85000. The three parties identified as potentially responsible for groundwater contamination within the TAG area include Sandia, KAFB, and the City of Albuquerque (COA). KAFB controls facilities and properties with a variety of land uses along the north, west, south, and southeast boundaries of TA-I, TA-II, and TA-IV. The area located along the northern and western boundaries of the three TAs contains KAFB housing, office buildings, a fire station, training schools, machine workshops, storage yards, a brig, a diesel-fuel tank farm, an electromagnetic research facility, and inactive sewage lagoons. Bordering the southern and southeastern edges of the three TAs are undeveloped open spaces, active landfills, closed landfills, emergency-response training areas, and the Tijeras Arroyo Golf Course. The COA residential areas are located along most of the northern boundary of KAFB.
6.1.2 Site History
In early 1928, the first airport in Albuquerque was constructed where TA-I and TA-II are currently located. In the spring of 1946, during a dismantling operation, 2,250 military aircraft were dismantled adjacent to the taxiways. In July 1945, the “Z Division” of the Manhattan Engineers District, an extension of the original Los Alamos Laboratory, was established as the forerunner of SNL/NM. At that time, the primary mission of the Z Division was to provide engineering, production, stockpiling, and testing support for nuclear weapon components and systems. In the summer of 1949, the major weapons production was transferred to other manufacturing facilities and the early work of SNL/NM concentrated on prototype research and manufacturing of experimental devices. Since 1949, SNL/NM has grown from a factory-style ordnance facility to a national laboratory dedicated to research, development, and testing of both defense and nondefense components. The current work performed in TA-I and TA-II can be
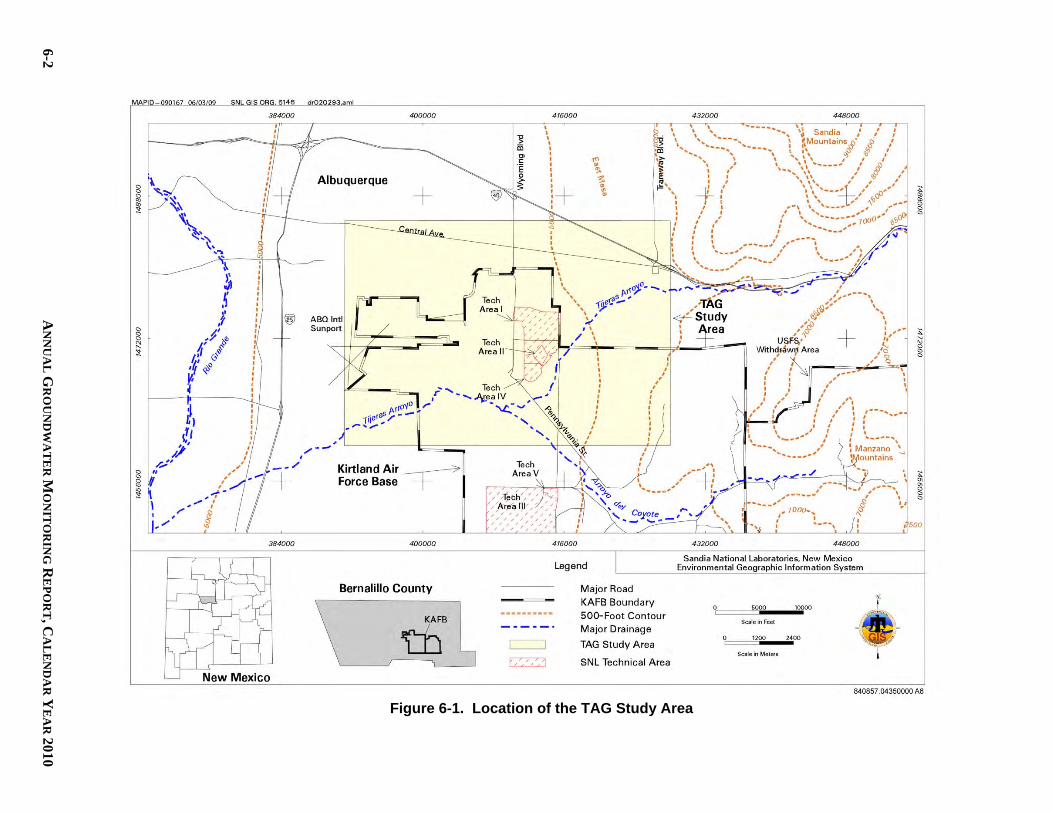
6-2 A
NN
UA
L G
RO
UN
DW
AT
ER
MO
NIT
OR
ING
RE
PO
RT, C
AL
EN
DA
R Y
EA
R 2010
Figure 6-1. Location of the TAG Study Area
TIJERAS ARROYO GROUNDWATER 6-3
divided into four main types: nuclear weapon, nonnuclear weapon, technical support, and special research and development. Numerous SNL/NM facilities may have potentially released hazardous materials to the soil and groundwater; however, the current research-oriented mission of most SNL/NM operations has resulted in an inventory of numerous chemicals, which are generally stored and used indoors in small quantities. SNL/NM Environmental Restoration (ER) Operations (formerly ER Project) has conducted numerous groundwater investigations in the TAG study area since 1992 (SNL November 2005) (Table 6-1). Many of these investigations were site-specific and conducted in support of various Solid Waste Management Unit (SWMU) assessments. Other investigations in the TAG study area were more regional studies conducted by the SNL/NM Site-Wide Hydrogeologic Characterization Project (SNL February 1998). Both KAFB and COA have also completed numerous groundwater investigations in the TAG study area, the results of which are presented in the TAG Investigation Report (SNL November 2005).
6.1.3 Monitoring History
Investigations of groundwater quality in the TAG study area have been conducted by Sandia over the past 18 years (Table 6-1). In 1992, Sandia began to investigate groundwater quality as part of the overall TA-II investigation with the installation of three groundwater monitoring wells. During this initial investigation, the PGWS was discovered at a depth of approximately 320 feet (ft) below ground surface (bgs). In October 1994, the analytical results for a groundwater sample from the PGWS showed TCE at a concentration of 1 g/L, which caused Sandia to further investigate groundwater contamination in the study area. Beginning in October 2000, meetings of the TAG High Performing Team (HPT) served as a forum for discussing TAG issues. During these meetings, members of the HPT debated the validity of using groundwater analytical results previously collected using low-flow sampling devices. Based on the perceived inadequacy of the sampling method, TAG quarterly groundwater sampling was temporarily suspended by Sandia until an alternative sampling method could be implemented. In June 2003, SNL/NM submitted the TAG Investigation Work Plan (SNL June 2003) to the New Mexico Environment Department (NMED). This work plan presented a comprehensive scope of work for groundwater investigations that are being jointly conducted by SNL/NM, KAFB, and COA. Based on the requirements of the work plan, Sandia resumed quarterly groundwater sampling in July 2003 using conventional groundwater purging/sampling techniques. The NMED approved the TAG Investigation Work Plan in September 2003 (NMED September 2003). Since the initial discoveries of TCE and nitrate at the TAG study area, numerous characterization activities have been conducted (Table 6-1). The results of these characterization activities are summarized in the TAG Investigation Report (SNL November 2005). The November 2005 report presents a conceptual model that provides a comprehensive list of groundwater monitoring data sources used to support the investigations. In April 2004, a Compliance Order on Consent (the Order) became effective between the DOE, Sandia and the NMED, specified that TAG was an area of groundwater contamination (NMED April 2004). In response to the Order, Sandia submitted the TAG Corrective Measures Evaluation (CME) Work Plan to the NMED in July 2004 (SNL July 2004). After fulfilling the requirements of the CME Work Plan, Sandia submitted the CME Report to the NMED (SNL/NM August 2005).
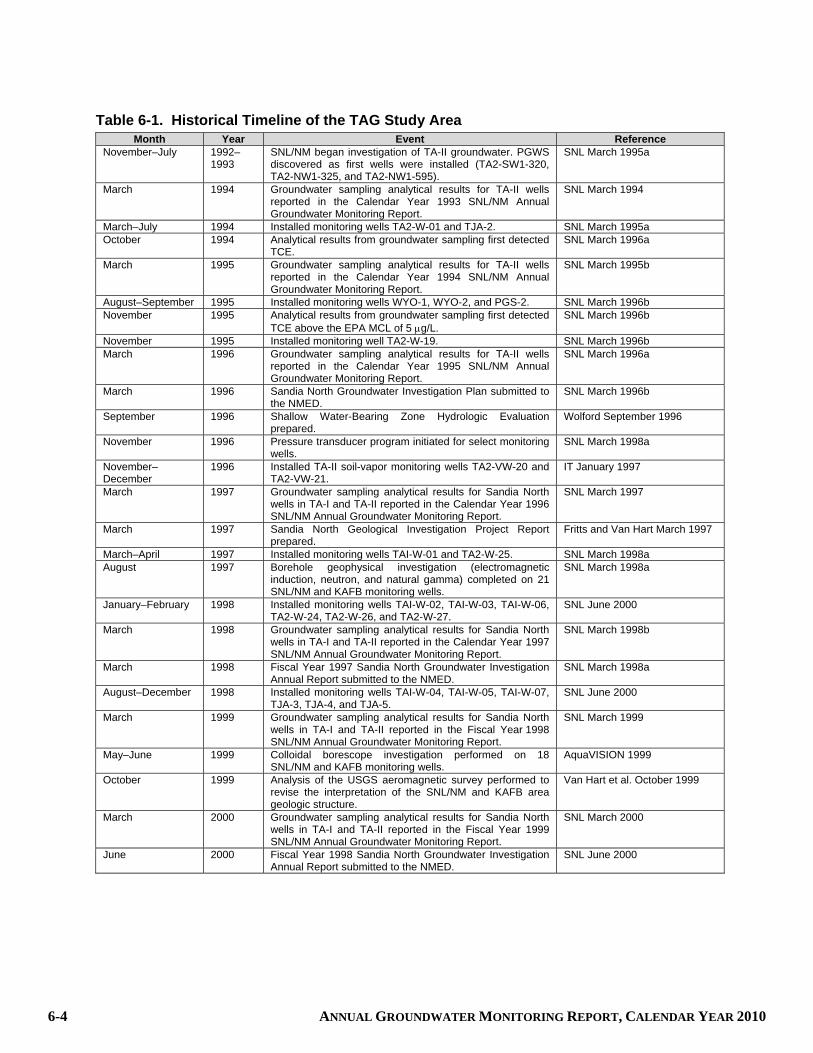
6-4 ANNUAL GROUNDWATER MONITORING REPORT, CALENDAR YEAR 2010
Table 6-1. Historical Timeline of the TAG Study Area Month Year Event Reference
November–July 1992–1993
SNL/NM began investigation of TA-II groundwater. PGWS discovered as first wells were installed (TA2-SW1-320, TA2-NW1-325, and TA2-NW1-595).
SNL March 1995a
March 1994 Groundwater sampling analytical results for TA-II wells reported in the Calendar Year 1993 SNL/NM Annual Groundwater Monitoring Report.
SNL March 1994
March–July 1994 Installed monitoring wells TA2-W-01 and TJA-2. SNL March 1995a October 1994 Analytical results from groundwater sampling first detected
TCE. SNL March 1996a
March 1995 Groundwater sampling analytical results for TA-II wells reported in the Calendar Year 1994 SNL/NM Annual Groundwater Monitoring Report.
SNL March 1995b
August–September 1995 Installed monitoring wells WYO-1, WYO-2, and PGS-2. SNL March 1996b November 1995 Analytical results from groundwater sampling first detected
TCE above the EPA MCL of 5 g/L. SNL March 1996b
November 1995 Installed monitoring well TA2-W-19. SNL March 1996b March 1996 Groundwater sampling analytical results for TA-II wells
reported in the Calendar Year 1995 SNL/NM Annual Groundwater Monitoring Report.
SNL March 1996a
March 1996 Sandia North Groundwater Investigation Plan submitted to the NMED.
SNL March 1996b
September 1996 Shallow Water-Bearing Zone Hydrologic Evaluation prepared.
Wolford September 1996
November 1996 Pressure transducer program initiated for select monitoring wells.
SNL March 1998a
November–December
1996 Installed TA-II soil-vapor monitoring wells TA2-VW-20 and TA2-VW-21.
IT January 1997
March 1997 Groundwater sampling analytical results for Sandia North wells in TA-I and TA-II reported in the Calendar Year 1996 SNL/NM Annual Groundwater Monitoring Report.
SNL March 1997
March 1997 Sandia North Geological Investigation Project Report prepared.
Fritts and Van Hart March 1997
March–April 1997 Installed monitoring wells TAI-W-01 and TA2-W-25. SNL March 1998a August 1997 Borehole geophysical investigation (electromagnetic
induction, neutron, and natural gamma) completed on 21 SNL/NM and KAFB monitoring wells.
SNL March 1998a
January–February 1998 Installed monitoring wells TAI-W-02, TAI-W-03, TAI-W-06, TA2-W-24, TA2-W-26, and TA2-W-27.
SNL June 2000
March 1998 Groundwater sampling analytical results for Sandia North wells in TA-I and TA-II reported in the Calendar Year 1997 SNL/NM Annual Groundwater Monitoring Report.
SNL March 1998b
March 1998 Fiscal Year 1997 Sandia North Groundwater Investigation Annual Report submitted to the NMED.
SNL March 1998a
August–December 1998 Installed monitoring wells TAI-W-04, TAI-W-05, TAI-W-07, TJA-3, TJA-4, and TJA-5.
SNL June 2000
March 1999 Groundwater sampling analytical results for Sandia North wells in TA-I and TA-II reported in the Fiscal Year 1998 SNL/NM Annual Groundwater Monitoring Report.
SNL March 1999
May–June 1999 Colloidal borescope investigation performed on 18 SNL/NM and KAFB monitoring wells.
AquaVISION 1999
October 1999 Analysis of the USGS aeromagnetic survey performed to revise the interpretation of the SNL/NM and KAFB area geologic structure.
Van Hart et al. October 1999
March 2000 Groundwater sampling analytical results for Sandia North wells in TA-I and TA-II reported in the Fiscal Year 1999 SNL/NM Annual Groundwater Monitoring Report.
SNL March 2000
June 2000 Fiscal Year 1998 Sandia North Groundwater Investigation Annual Report submitted to the NMED.
SNL June 2000

TIJERAS ARROYO GROUNDWATER 6-5
Table 6-1. Historical Timeline of the TAG Study Area (Continued) Month Year Event Reference
October 2000 TAG High Performing Team convened for the first time. SNL June 2003 December 2000 Project name changed from the Sandia North to the Tijeras
Arroyo Groundwater Investigation. Collins 2000
January–March 2001 Installed groundwater monitoring wells TJA-6 and TJA-7, and soil-vapor monitoring wells 46-VW-01, 46-VW-02, and 227-VW-01.
SNL November 2002
February 2001 Preliminary model of the PGWS updated. BGW February 2001 April 2001 Groundwater sampling analytical results for TAG wells
reported in the Fiscal Year 2000 SNL/NM Annual Groundwater Monitoring Report.
SNL April 2001
June 2001 Geologic model of the PGWS updated. Van Hart June 2001 July 2001 Monitoring wells WYO-1 and WYO-2 plugged and
abandoned, replaced by WYO-3 and WYO-4. SNL June 2003
October 2001 Monitoring well TA1-W-08 installed. SNL November 2002 March 2002 Groundwater sampling analytical results for TAG wells
reported in the Fiscal Year 2001 SNL/NM Annual Groundwater Monitoring Report.
SNL March 2002
November 2002 TAG Continuing Investigation Report submitted to the NMED.
SNL November 2002
March 2003 Groundwater sampling analytical results for TAG wells reported in the Fiscal Year 2002 SNL/NM Annual Groundwater Monitoring Report.
SNL March 2003a
June 2003 Subsurface geology at KAFB, including the TAG area, updated.
Van Hart June 2003
June 2003 TAG Investigation Work Plan submitted to the NMED. SNL June 2003 September 2003 TAG Investigation Work Plan approved by the NMED. NMED September 2003 December–January
2003– 2004
ER Project conducts slug (hydraulic conductivity) tests at groundwater monitoring wells.
Collins 2004
March 2004 Groundwater sampling analytical results for TAG wells reported in the Fiscal Year 2003 SNL/NM Annual Groundwater Monitoring Report.
SNL March 2004
April 2004 NMED issues the Compliance Order on Consent (the Consent Order), which identified TAG as an area with groundwater contamination requiring a CME.
NMED April 2004
July 2004 TAG CME Work Plan submitted to the NMED. SNL July 2004 July-August 2004 Monitoring wells TAG-SV-01 through TAG-SV-05 were
installed. SNL November 2005
October 2004 TAG CME Work Plan for the SNL/NM Area of Responsibility approved by the NMED.
NMED October 2004
September 2005 CME Report for TAG submitted to NMED. SNL August 2005 October 2005 Groundwater sampling analytical results for TAG wells
reported in the Fiscal Year 2004 SNL/NM Annual Groundwater Monitoring Report.
SNL October 2005
November 2005 SNL/NM submits TAG Investigation Report to the NMED. SNL November 2005 November 2006 Groundwater sampling analytical results for TAG wells
reported in the Fiscal Year 2005 SNL/NM Annual Groundwater Monitoring Report.
SNL November 2006
March 2007 Groundwater sampling analytical results for TAG wells reported in the Fiscal Year 2006 SNL/NM Annual Groundwater Monitoring Report.
SNL March 2007
March 2008 Groundwater sampling analytical results for TAG wells reported in the Fiscal Year 2007 SNL/NM Annual Groundwater Monitoring Report.
SNL March 2008
August 2008 NMED issues Notice of Disapproval on November 2005 TAG Investigation Report.
NMED August 2008
February 2009 SNL/NM submits Response to NMED’s August 2008 Notice of Disapproval on November 2005 TAG Investigation Report.
SNL February 2009
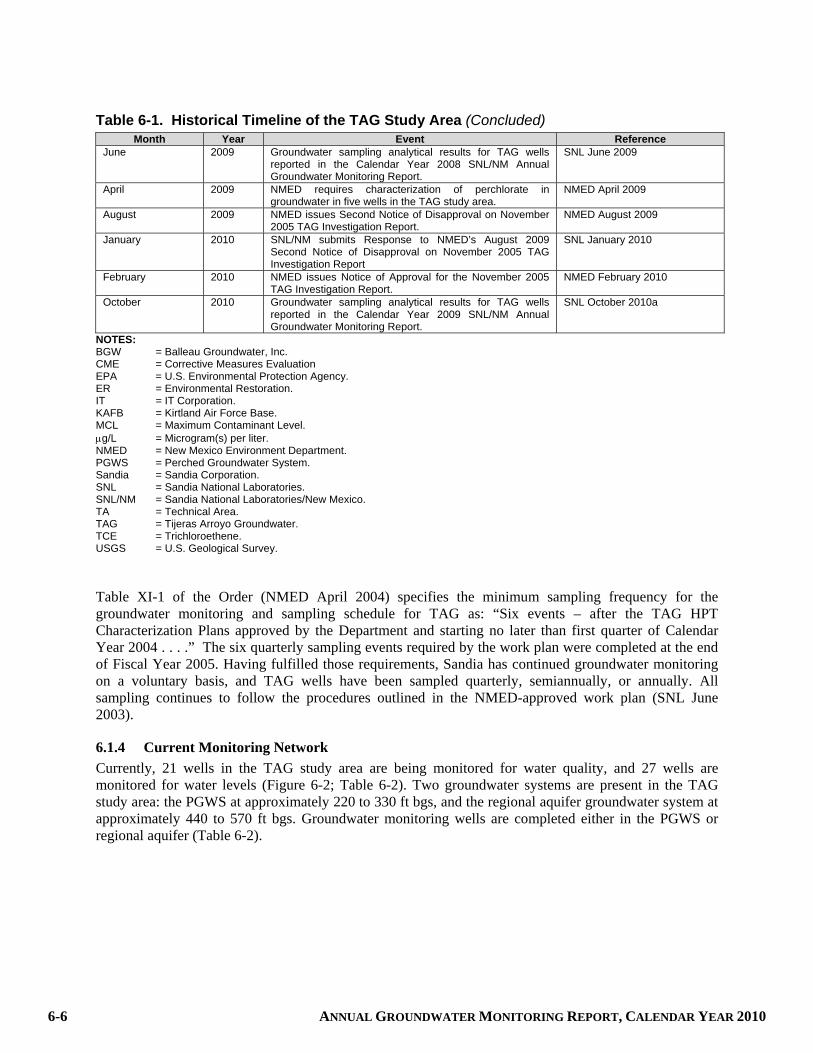
6-6 ANNUAL GROUNDWATER MONITORING REPORT, CALENDAR YEAR 2010
Table 6-1. Historical Timeline of the TAG Study Area (Concluded) Month Year Event Reference
June 2009 Groundwater sampling analytical results for TAG wells reported in the Calendar Year 2008 SNL/NM Annual Groundwater Monitoring Report.
SNL June 2009
April 2009 NMED requires characterization of perchlorate in groundwater in five wells in the TAG study area.
NMED April 2009
August 2009 NMED issues Second Notice of Disapproval on November 2005 TAG Investigation Report.
NMED August 2009
January 2010 SNL/NM submits Response to NMED’s August 2009 Second Notice of Disapproval on November 2005 TAG Investigation Report
SNL January 2010
February 2010 NMED issues Notice of Approval for the November 2005 TAG Investigation Report.
NMED February 2010
October 2010 Groundwater sampling analytical results for TAG wells reported in the Calendar Year 2009 SNL/NM Annual Groundwater Monitoring Report.
SNL October 2010a
NOTES: BGW = Balleau Groundwater, Inc. CME = Corrective Measures Evaluation EPA = U.S. Environmental Protection Agency. ER = Environmental Restoration. IT = IT Corporation. KAFB = Kirtland Air Force Base. MCL = Maximum Contaminant Level. g/L = Microgram(s) per liter. NMED = New Mexico Environment Department. PGWS = Perched Groundwater System. Sandia = Sandia Corporation. SNL = Sandia National Laboratories. SNL/NM = Sandia National Laboratories/New Mexico. TA = Technical Area. TAG = Tijeras Arroyo Groundwater. TCE = Trichloroethene. USGS = U.S. Geological Survey. Table XI-1 of the Order (NMED April 2004) specifies the minimum sampling frequency for the groundwater monitoring and sampling schedule for TAG as: “Six events – after the TAG HPT Characterization Plans approved by the Department and starting no later than first quarter of Calendar Year 2004 . . . .” The six quarterly sampling events required by the work plan were completed at the end of Fiscal Year 2005. Having fulfilled those requirements, Sandia has continued groundwater monitoring on a voluntary basis, and TAG wells have been sampled quarterly, semiannually, or annually. All sampling continues to follow the procedures outlined in the NMED-approved work plan (SNL June 2003).
6.1.4 Current Monitoring Network
Currently, 21 wells in the TAG study area are being monitored for water quality, and 27 wells are monitored for water levels (Figure 6-2; Table 6-2). Two groundwater systems are present in the TAG study area: the PGWS at approximately 220 to 330 ft bgs, and the regional aquifer groundwater system at approximately 440 to 570 ft bgs. Groundwater monitoring wells are completed either in the PGWS or regional aquifer (Table 6-2).

TIJERAS ARROYO GROUNDWATER 6-7
Figure 6-2. Tijeras Arroyo Groundwater (TAG) Investigation Monitoring Well Locations

6-8 ANNUAL GROUNDWATER MONITORING REPORT, CALENDAR YEAR 2010
Table 6-2. Groundwater Monitoring Wells in the TAG Study Area Well Installation Year WQ WL Comments
Eubank-1 1988 Regional aquifer (COA well) Eubank-2 1997 Regional aquifer (COA well)a Eubank-3 1997 Regional aquifer (COA well)a Eubank-5 1997 Regional aquifer (COA well)a PGS-2 1995 Regional aquifer TA1-W-01 1997 Regional aquifer TA1-W-02 1998 Regional aquifer TA1-W-03 1998 PGWS TA1-W-04 1998 Regional aquifer TA1-W-05 1998 Regional aquifer TA1-W-06 1998 PGWS TA1-W-08 2001 PGWS TA2-NW1-595 1993 Regional aquifer TA2-SW1-320 1992 PGWS TA2-W-01 1994 PGWS TA2-W-19 1995 PGWS TA2-W-25 1997 Regional aquifer TA2-W-26 1998 PGWS TA2-W-27 1998 PGWS TJA-2 1994 PGWS TJA-3 1998 Regional aquifer TJA-4 1998 Regional aquifer TJA-5 1998 PGWS TJA-6 2001 Regional aquifer TJA-7 2001 PGWS WYO-3 2001 Regional aquifer WYO-4 2001 PGWS
NOTE: Check marks in the WQ and WL columns indicate WQ sampling and WL measurements were obtained during this reporting period.
aWL data for Eubank-2, Eubank-3, and Eubank- 5 provided by Jake Daugherty, Environmental Service Division of the City of Albuquerque Environmental Health Department.
COA = City of Albuquerque. PGWS = Perched Groundwater System. TAG = Tijeras Arroyo Groundwater. WL = Water level. WQ = Water quality.
6.1.5 Summary of Calendar Year 2010 Activities
The following activities took place for the TAG investigation during Calendar Year (CY) 2010:
Monthly or quarterly water level measurements were obtained from TAG wells.
Quarterly groundwater sampling events were conducted at seven wells (TA2-SW1-320, TA2-W-19, TA2-W-26, TJA-2, TJA-4, TJA-7, and WYO-4) in January/February 2010, May 2010, July/August 2010, and October/November 2010 (SNL December 2009, April 2010, June 2010, and October 2010b).

TIJERAS ARROYO GROUNDWATER 6-9
Semiannual groundwater sampling was conducted at four wells (TA2-W-01, TA2-W-27, TJA-3, and TJA-6) in January/February 2010 and July/August 2010 (SNL December 2009 and June 2010).
Annual groundwater sampling was conducted at nine wells (PGS-2, TA1-W-01, TA1-W-02, TA1-W-04, TA1-W-05, TA1-W-06, TA1-W-08, TA2-NW1-595, and WYO-3) in July/August 2010 (SNL June 2010).
Quarterly perchlorate screening groundwater sampling was conducted at up to five wells (TA1-W-03, TA1-W-06, TA1-W-08, TA2-W-01, and TA2-W-27) in January/February 2010, May 2010, July/August 2010, and October/November 2010 (SNL December 2009, April 2010, June 2010, and October 2010b).
Responses to the NMED’s second Notice of Disapproval of November 2005 TAG Investigation Report were submitted to the NMED (SNL January 2010).
The Approval of the November 2005 TAG Investigation Report (NMED February 2010) was received from the NMED.
Quarterly reporting of perchlorate analyses for TA1-W-03, TA1-W-06, TA1-W-08, TA2-W-01, and TA2-W-27 was conducted.
Tables of analytical results (Attachment 6A), concentration versus time graphs (Attachment 6B), and hydrographs (Attachment 6C) were prepared in support of this report.
6.1.6 Summary of Future Activities.
The following activities are anticipated for the TAG Investigation during the next reporting period (CY 2011):
Monthly or quarterly water level measurements from TAG wells.
Quarterly groundwater sampling at seven wells: TA2-SW1-320, TA2-W-19, TA2-W-26, TJA-2, TJA-4, TJA-7, and WYO-4.
Semiannual groundwater sampling at four wells: TA2-W-01, TA2-W-27, TJA-3, and TJA-6.
Annual groundwater sampling at 10 wells: PGS-2, TA1-W-01, TA1-W-02, TA1-W-03, TA1-W-04, TA1-W-05, TA1-W-06, TA1-W-08, TA2-NW1-595, and WYO-3.
6.1.7 Current Conceptual Model
Two groundwater systems are present in the TAG study area: the PGWS at approximately 220 to 330 ft bgs, and the regional aquifer groundwater system at approximately 440 to 570 ft bgs. The uppermost saturated interval of the PGWS is between 10 and 30 ft in thickness. Water in the PGWS moves to the southeast and is assumed to merge with the underlying regional aquifer southeast of Tijeras Arroyo. Figure 6-3 presents a diagram of the TAG conceptual model.

6-10 ANNUAL GROUNDWATER MONITORING REPORT, CALENDAR YEAR 2010
Figure 6-3. TAG Conceptual Model Illustration

TIJERAS ARROYO GROUNDWATER 6-11
Data pertaining to the hydrogeologic setting have been synthesized into the TAG conceptual model. The hydrogeologic setting for the TAG study area is well understood based on a significant number of monitoring wells. Groundwater occurs in both the PGWS and regional aquifer. However, the PGWS has a limited lateral extent that encompasses approximately 3.8 sq mi of north-central KAFB. The PGWS may extend northward across the KAFB boundary. In the TAG study area, the depth to groundwater for the PGWS ranges from 220 to 330 ft bgs. The uppermost saturated zone in the PGWS varies from approximately 10 to 30 ft in thickness, depending on the well location. Borehole geophysical surveys indicate that a few relatively damp intervals are present below the uppermost saturated zone, but borehole-yield testing has revealed that most of these deeper intervals are too thin to yield volumes of water sufficient for the construction of monitoring wells. The PGWS is not used as a water supply source. The direction of groundwater flow in the PGWS is to the southeast. Groundwater flows through low-yield, alluvial fan sediments with an average hydraulic gradient of approximately 0.008 feet per foot (ft/ft). Groundwater elevations in the PGWS are decreasing in the northwestern portion of the study area but are increasing in the southeastern area. The PGWS is recharged by both artificial (leaking water supply/sewer lines and the former sewage lagoons) and natural sources (Tijeras Arroyo and possibly ancestral Tijeras Creek). Principal hydrogeologic controls on the PGWS include: (1) eastward bedding-plane dip attributed to the western limb of an inferred syncline; (2) stratigraphic variations (such as braided paleochannels); and (3) multiple recharge locations in the northwestern portion of the TAG study area. Multiple overlapping lenses of low conductivity, mostly unsaturated sediments, serve as a perching horizon beneath the PGWS. Beneath the central TAG study area, a layer of approximately 180 to 280 ft of these unsaturated sediments separates the PGWS from the regional aquifer. Groundwater in the PGWS merges with the regional aquifer southeast of Tijeras Arroyo where the alluvial fan sediments are slightly more permeable. The regional aquifer is more laterally extensive than the PGWS, underlying the entire TAG study area as well as the Albuquerque Basin. Across the TAG study area, the depth to the regional aquifer ranges from approximately 440 to 570 ft bgs. The regional aquifer is composed of both the Ancestral Rio Grande (ARG) fluvial facies and alluvial fan facies. Locally, groundwater in the regional aquifer flows to the northwest, in a nearly opposite direction to that of the PGWS. The gradient in the regional aquifer averages approximately 0.009 ft/ft across the TAG study area, but is steeper near the KAFB, COA, and Veterans Administration (VA) water supply wells. The regional aquifer is recharged on the eastern side of the study area by natural sources including mountain-front flow, Tijeras Arroyo, and the PGWS. Groundwater elevations are generally decreasing in the northwestern portion of the study area but are increasing in the southeastern area. Seasonal pumping variations cause sporadic water-level fluctuations near the water supply wells. The principal hydrogeologic control upon groundwater flow direction in the regional aquifer is the combined drawdown effect of the KAFB, COA, and VA water supply wells. The aqueous geochemical signatures of the PGWS and the regional aquifer are distinctive. The geochemical signatures of the PGWS vary between well locations but tend to exhibit higher concentrations of calcium, sulfate, and chloride than those for the regional aquifer. Groundwater in the regional aquifer exhibits higher bicarbonate/alkalinity concentrations.
6.1.7.1 Regional Hydrogeologic Conditions
Tijeras Arroyo is the most significant surface-water drainage feature on KAFB and trends southwest across KAFB to eventually drain into the Rio Grande, approximately 6 miles west of KAFB. Surface water flows in the arroyo several times per year as a result of storm events. The average annual precipitation for the area, as measured at the Albuquerque International Sunport, is 8.2 inches (SNL February 2001). During most rainfall events, rainfall quickly infiltrates into the soil in the study

6-12 ANNUAL GROUNDWATER MONITORING REPORT, CALENDAR YEAR 2010
area. However, virtually all of the moisture subsequently undergoes evapotranspiration. Estimates of evapotranspiration for the KAFB area range from 95 to 99 percent of the annual rainfall (SNL February 1998). The TAG study area overlies the eastern margin of the Albuquerque Basin where the basin-bounding faults mostly trend parallel to the Sandia-Manzanita-Manzano mountain front. The stratigraphic unit of greatest interest is the Upper Santa Fe Group, which is primarily composed of two interfingering lithofacies: an alluvial-fan lithofacies and a fluvial lithofacies. Both lithofacies are less than 5 million years old and are composed of unconsolidated to poorly cemented gravel, sand, silt, and clay (Stone et al. February 2000). The alluvial-fan lithofacies consists of poorly sorted piedmont-slope deposits derived from the Sandia, Manzanita, and Manzano Mountains east of the study area. Fine-grained units within the alluvial-fan lithofacies produce low-permeability zones that are capable of perching groundwater. The fluvial lithofacies is derived from the ARG to the north and is typically well sorted and medium- to coarse-grained.
6.1.7.2 Hydrologic Conditions at the TAG Study Area
The thickness of the vadose zone is reduced in the central portion of the TAG study area where the PGWS is present. Discontinuous, yet overlapping multiple lenses of unsaturated alluvial-fan sediments serve as a perching horizon beneath the PGWS in that area. The PGWS is present at approximately 220 to 330 ft bgs, and the regional aquifer system is present at approximately 440 to 570 ft bgs. Groundwater in the PGWS most likely merges with the regional aquifer southeast of Tijeras Arroyo where the alluvial-fan sediments are slightly more permeable. A comparison of aquifer characteristics for the PGWS and the regional aquifer in the TAG study area is provided in Table 6-3. The PGWS is presently understood to cover approximately 3.8 sq mi. Monitoring wells bound the PGWS on the western and southern margins. The northern margin of the PGWS has not been fully defined and may extend across the northern KAFB boundary (Figure 6-1). A southeastern margin is not discernible because the PGWS merges with the regional aquifer. The direction of groundwater flow in the PGWS is inferred to be principally to the southeast, with a horizontal gradient that varies from approximately 0.02 to 0.004 ft/ft. The vertical gradient is approximately 0.95 ft/ft over most of the PGWS, and continuous vertical flow is suggested by the merging of the two groundwater systems to the southeast.
6.1.7.3 Local Direction of Flow
Figure 6-4 presents the current potentiometric surface for the PGWS (October 2010). Groundwater elevations presented in this potentiometric surface map reflect new survey coordinates. Until recently, ER Operations provided survey coordinates that were based on the New Mexico State Plane Coordinate System, Central Zone, North American Datum of 1927 and Northern Geographic Vertical Datum of 1929 for elevations. In order to be consistent with current SNL/NM Facilities and KAFB survey practices, ER Operations survey data now are based on New Mexico State Plane Coordinate System, Central Zone, North American Datum of 1983 (NAD83) and North American Vertical Datum of 1988 (NAVD88). Location information for wells surveyed before August 2010 has been mathematically converted to the new NAD83/NAVD88 coordinates using National Geodetic Survey-approved software. The direction of groundwater flow in the PGWS is towards the southeast. The horizontal gradient of the PGWS varies from approximately 0.02 to 0.004 ft/ft. Historically, water levels in the PGWS have fluctuated across the study area (SNL November 2005). In the vicinity of the former sewage lagoons, water levels have been declining since 1987, apparently in response to the lagoons being removed from service. Conversely, water levels have increased southeast of Tijeras Arroyo (Attachment 6C, Figures 6C-1 through 6C-11).

TIJERAS ARROYO GROUNDWATER 6-13
Table 6-3. Comparison of the Perched Groundwater System and the Regional Aquifer in the Tijeras Arroyo Groundwater Study Area (SNL November 2005)
Characteristic PGWS Regional Aquifer Pressure Head Unconfined (water table) conditions Unconfined to semiconfined conditions
Lithofacies Distribution
Restricted to the alluvial-fan lithofacies Contained within both the alluvial-fan lithofacies and the ARG fluvial lithofacies
Flow Direction Primarily to the southeast Primarily to the northwest
Horizontal Gradient
Approximate average of 0.007 ft/ft Approximate average of 0.009 ft/ft, but steeper near water supply wells
Flow velocities 4 to 10 ft/yr 4 to 10 ft/yr
Usage Not used for water supply purposes Utilized for water supply by KAFB, COA, and VA
Lateral extent Limited lateral extent across north-central KAFB
Laterally extensive across the Albuquerque Basin
Saturated Thickness
Uppermost saturated interval only about 10 to 30 ft in thickness
In excess of 1,000 ft thick across much of the study area
Geochemical Variability
Geochemical signatures variable between monitoring wells
Geochemical signatures consistent between monitoring wells
Geochemical High chloride, nitrate, and sulfate concentrations
Low calcium concentrations but high bicarbonate/alkalinity concentrations
Water levels Steadily declining water levels in the northwest, but increasing in the southeast part of the TAG study area
Steadily declining water levels in the northwest, but increasing in the southeast part of the TAG study area
Recharge Recharged by both anthropogenic (leaking water supply/sewer lines, irrigated lawns, Tijeras Arroyo Golf Course), and natural sources such as Tijeras Arroyo
Recharged by natural sources including mountain front flow, the perched system, and Tijeras Arroyo
Principal Hydrologic Controls
Stratigraphic variations such as multiple overlapping lenses; several recharge locations; stratigraphic dip of the alluvial-fan sediments
Combined drawdown of KAFB, COA, and VA water supply wells
NOTES: ARG = Ancestral Rio Grande (facies). COA = City of Albuquerque. ft = Foot (feet). ft/ft = Feet/foot. ft/yr = Feet per year. KAFB = Kirtland Air Force Base. PGWS = Perched Groundwater System. SNL = Sandia National Laboratories. TAG = Tijeras Arroyo Groundwater. VA = Veterans Administration.

6-14 ANNUAL GROUNDWATER MONITORING REPORT, CALENDAR YEAR 2010
This page intentionally left blank.

TIJERAS ARROYO GROUNDWATER 6-15
Figure 6-4. Tijeras Arroyo Groundwater Investigation Potentiometric Surface Map for the Perched Groundwater System (October 2010)

6-16 ANNUAL GROUNDWATER MONITORING REPORT, CALENDAR YEAR 2010
THIS PAGE IS BACK OF 11X17 FIGURE

TIJERAS ARROYO GROUNDWATER 6-17
Figure 6-5 presents the current potentiometric surface for the regional aquifer (October 2010). The direction of groundwater flow in the regional aquifer is to the northwest towards the KAFB, COA, and VA water supply wells. The horizontal gradient of the regional aquifer across the central portion of the study area is approximately 0.01 ft/ft. Vertical flow gradients within the TAG study area have not been measured but are inferred to be downward, consistent with TA-V groundwater studies. Historically, water levels in the regional aquifer have fluctuated across the study area (SNL November 2005). A line of demarcation between increasing and declining water levels is evident along the eastern extent of the ARG-fluvial lithofacies. Declining water levels approaching 1.5 feet/year (ft/yr) are apparently associated with the KAFB, COA, and VA water supply wells. Increases in groundwater elevations of up to 1.8 ft/yr in the southeast portion of the study area reflect recharge of the regional aquifer from the PGWS, Tijeras Arroyo, the golf course, and the mountain front (Attachment 6C, Figures 6C-1 through 6C-11).
6.1.7.4 Contaminant Sources
Sandia, the KAFB Installation Restoration Program (IRP), and the COA have evaluated a variety of potentially contaminated sites. The TAG Investigation Report (SNL November 2005) presents a comprehensive summary of the environmental investigations that have been conducted by these three parties. As described in the report, two potential TCE and three potential nitrate sources are believed to be the responsibility of Sandia. A brief description of each potential release site is provided as follows. SWMU 46 (Old Acid Waste Line Outfall)—TCE and Nitrate: An estimated 1.3 billion gallons of wastewater from six TA-I research/office buildings (839, 840, 841, 860, 863, and 892) discharged into the three outfall ditches at the south end of SWMU 226. Possible TCE and nitrate were present in the wastewater. Septic water from possible cross-connects between the SWMU 226 waste line and sewer lines may have discharged at SWMU 46. In 2000, two soil-vapor monitoring wells were installed at SWMU 46, and soil-vapor sampling was conducted quarterly. Well 46-VW-01 is located near the waste-line outfall, and sampling ports are set at 50-ft intervals from 15 to 265 ft bgs. The maximum TCE concentration to date is 46,000 parts per billion by volume (ppbv) from 115 ft bgs. Well 46-VW-02, located 900 ft farther southeast, has sampling ports set at 50-ft intervals from 46 to 296 ft bgs. The maximum TCE concentration to date at this well is 650 ppbv from 96 ft bgs. SWMU 165 (Building 901 Septic System)—TCE and Nitrate: The septic system leach field is connected to a personnel shower/laundry facility (Building 901) and small research/machine shop (Building 902). Possible TCE and high explosives were present in the wastewater. No significant contamination has been detected in soil samples. Groundwater samples from PGWS monitoring well TA2-SW1-320 have contained a maximum nitrate concentration of 44 mg/L. SWMU 187 (TA-I Sanitary Sewer System)—Nitrate: The sanitary sewer system has sewer lines that are possibly leaking and several cross-connects with wastewater lines. The system is connected to numerous research/office buildings in TA-I. No significant contamination has been detected in soil samples. Soil-vapor and soil samples collected from the vadose zone (land surface to the water table) during drilling operations and from the vapor monitoring network have indicated evidence of vapor-phase contaminants. However, no free-phase TCE and no water-saturated core samples have been encountered in any of the soil samples collected from the boreholes. The original source of the TCE was the aqueous phase (i.e., wastewater), and the current vapor phase contaminants partitioned from the aqueous phase. All anthropogenic sources of recharge (i.e., wastewater) have been removed from service and no longer contribute water to the vadose zone.

6-18 ANNUAL GROUNDWATER MONITORING REPORT, CALENDAR YEAR 2010
This page intentionally left blank.

TIJERAS ARROYO GROUNDWATER 6-19
Figure 6-5. Tijeras Arroyo Groundwater Investigation Potentiometric Surface Map for the Regional Aquifer (October 2010)

6-20 ANNUAL GROUNDWATER MONITORING REPORT, CALENDAR YEAR 2010
THIS PAGE IS BACK OF 11X17 FIGURE

TIJERAS ARROYO GROUNDWATER 6-21
Based on soil-vapor data (SNL November 2005), the mass of TCE that the vapor phase is contributing to the aquifer is minimal. In addition, the consistency of soil-vapor concentration measurements over time indicates that this TCE vapor plume is immobile. Therefore, the only potential mechanism for transporting these contaminants to the aquifer would be through partitioning back into the aqueous phase of additional recharge that might move through the system. Given that both current anthropogenic and natural recharge to the PGWS is minimal, it is extremely unlikely that significant transport of the vadose zone TCE into the aquifer will ever occur. Therefore, the vapor phase TCE in the vadose zone is not considered to be a continuing source of contamination to the groundwater that needs to be addressed under the source control criteria defined in the Resource Conservation and Recovery Act (RCRA) Corrective Action Plan (EPA May 1994). Nitrate was present in sewage wastewater discharged to septic systems and sanitary sewer lines in the area. The nitrate was transported to the PGWS water table by high volumes of wastewater disposed of at the sites. Because nitrate is extremely soluble and cannot exist as a separate phase (i.e., vapor or nonaqueous phase liquid), and because no water-saturated core samples have been encountered in any of the soil samples collected from boreholes, a secondary source of anthropogenic nitrate contamination in the vadose zone does not exist.
6.1.7.5 Contaminant Distribution and Transport in Groundwater
Perched Groundwater System The distribution of TCE is discontinuous across the PGWS and does not indicate a single release site. Based on the historic use of chlorinated solvents across SNL/NM and KAFB, the known extent of TCE in the PGWS is associated with multiple releases of aqueous-phase solvents and subsequent transport through the vadose zone. The maximum historical concentration of TCE in the PGWS is 9.6 g/L for well TA2-W-26; samples from only three TAG study area wells have exceeded the MCL for TCE (5 g/L) (TA2-W-19, TA2-W-26, and WYO-4). The maximum historical concentration of nitrate in the PGWS within the TAG study area is 44 mg/L for well TA2-SW1-320. Concentrations of nitrate in the PGWS exceeding the MCL for nitrate (10 mg/L) are scattered across the TAG study area. Historically, two plumes have been identified in the PGWS, consisting of Plume 3 beneath SNL/NM TA-II and Plume 4 beneath the Tijeras Arroyo Golf Course (MWH Americas, Inc. July 2003). However, the subsequent installation and sampling of several monitoring wells failed to identify a boundary between Plumes 3 and 4. Therefore, the perched aquifer nitrate plume is now shown as one contiguous plume and is referred to as Plume 4 (CH2M HILL, Inc. June 2009). Plume 4, which originates near monitoring well TA2-SW1-320, is located underneath the southwest portion of TA-II and extends southward to the Tijeras Arroyo Golf Course. The plume is 2 miles long and 0.8 miles wide (CH2M HILL, Inc. June 2009), and the upgradient portion is considered to emanate from SWMU 165, the Building 901 Septic System. Regional Aquifer The regional aquifer monitoring wells have generally yielded no samples with detectable TCE concentrations except for low-level detections in samples from TJA-3. No samples from the SNL/NM TAG study area regional aquifer wells exceed the MCL of 5 g/L for TCE. In the regional aquifer, samples from nine SNL/NM TAG study area wells have exceeded the MCL for nitrate during at least one sampling event. The maximum historical concentration of nitrate for wells
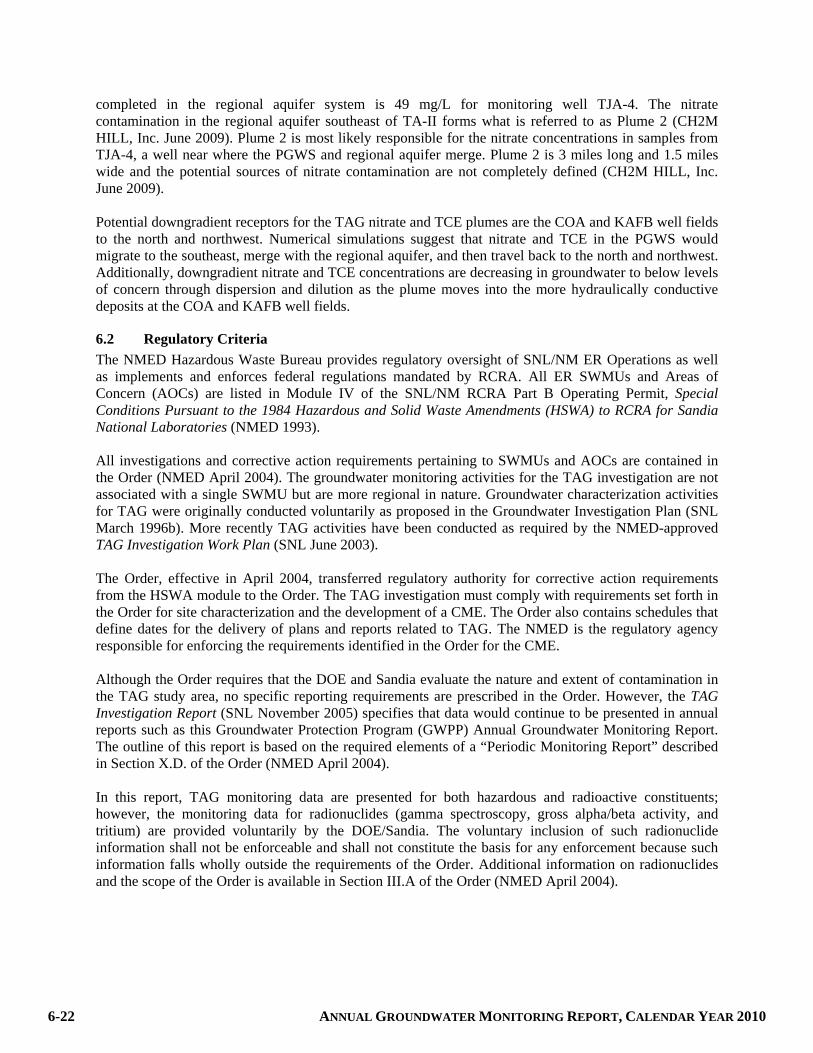
6-22 ANNUAL GROUNDWATER MONITORING REPORT, CALENDAR YEAR 2010
completed in the regional aquifer system is 49 mg/L for monitoring well TJA-4. The nitrate contamination in the regional aquifer southeast of TA-II forms what is referred to as Plume 2 (CH2M HILL, Inc. June 2009). Plume 2 is most likely responsible for the nitrate concentrations in samples from TJA-4, a well near where the PGWS and regional aquifer merge. Plume 2 is 3 miles long and 1.5 miles wide and the potential sources of nitrate contamination are not completely defined (CH2M HILL, Inc. June 2009). Potential downgradient receptors for the TAG nitrate and TCE plumes are the COA and KAFB well fields to the north and northwest. Numerical simulations suggest that nitrate and TCE in the PGWS would migrate to the southeast, merge with the regional aquifer, and then travel back to the north and northwest. Additionally, downgradient nitrate and TCE concentrations are decreasing in groundwater to below levels of concern through dispersion and dilution as the plume moves into the more hydraulically conductive deposits at the COA and KAFB well fields.
6.2 Regulatory Criteria
The NMED Hazardous Waste Bureau provides regulatory oversight of SNL/NM ER Operations as well as implements and enforces federal regulations mandated by RCRA. All ER SWMUs and Areas of Concern (AOCs) are listed in Module IV of the SNL/NM RCRA Part B Operating Permit, Special Conditions Pursuant to the 1984 Hazardous and Solid Waste Amendments (HSWA) to RCRA for Sandia National Laboratories (NMED 1993). All investigations and corrective action requirements pertaining to SWMUs and AOCs are contained in the Order (NMED April 2004). The groundwater monitoring activities for the TAG investigation are not associated with a single SWMU but are more regional in nature. Groundwater characterization activities for TAG were originally conducted voluntarily as proposed in the Groundwater Investigation Plan (SNL March 1996b). More recently TAG activities have been conducted as required by the NMED-approved TAG Investigation Work Plan (SNL June 2003). The Order, effective in April 2004, transferred regulatory authority for corrective action requirements from the HSWA module to the Order. The TAG investigation must comply with requirements set forth in the Order for site characterization and the development of a CME. The Order also contains schedules that define dates for the delivery of plans and reports related to TAG. The NMED is the regulatory agency responsible for enforcing the requirements identified in the Order for the CME. Although the Order requires that the DOE and Sandia evaluate the nature and extent of contamination in the TAG study area, no specific reporting requirements are prescribed in the Order. However, the TAG Investigation Report (SNL November 2005) specifies that data would continue to be presented in annual reports such as this Groundwater Protection Program (GWPP) Annual Groundwater Monitoring Report. The outline of this report is based on the required elements of a “Periodic Monitoring Report” described in Section X.D. of the Order (NMED April 2004). In this report, TAG monitoring data are presented for both hazardous and radioactive constituents; however, the monitoring data for radionuclides (gamma spectroscopy, gross alpha/beta activity, and tritium) are provided voluntarily by the DOE/Sandia. The voluntary inclusion of such radionuclide information shall not be enforceable and shall not constitute the basis for any enforcement because such information falls wholly outside the requirements of the Order. Additional information on radionuclides and the scope of the Order is available in Section III.A of the Order (NMED April 2004).

TIJERAS ARROYO GROUNDWATER 6-23
6.3 Scope of Activities
The CY 2010 activities for the TAG investigation, including plans and reports, are listed in Section 6.1.5. However, the only field activity completed in the study area was groundwater monitoring. The four groundwater sampling events are summarized in Table 6-4, and the analytical parameters for each well and each sampling event are listed in Table 6-5. Quality control (QC) samples are collected in the field at the time of environmental sample collection. Field QC samples include equipment blank (EB) samples, duplicate samples, split samples, and trip blank (TB) samples. Field QC samples are used to monitor the sampling process. EB samples are used to verify the effectiveness of sampling equipment decontamination procedures. Duplicate samples are used to measure the precision of the sampling process. Split samples are used to verify the performance of the analytical laboratory. TB samples are used to determine whether volatile organic compounds (VOCs) contaminated the sample during preparation, transportation, and handling prior to receipt by the analytical laboratory.
6.4 Field Methods and Measurements
The monitoring procedures, as conducted by ER Operations personnel, are consistent with procedures identified in the EPA technical enforcement guidance document (EPA 1986). The following sections provide an overview of the sampling and data collection procedures.
6.4.1 Groundwater Elevation
Throughout CY 2010, water level measurements were obtained to determine groundwater flow directions, hydraulic gradients, and changes in water table elevations. Water levels are periodically measured in TAG monitoring wells according to the instructions and requirements specified in SNL/NM Field Operating Procedure (FOP) 03-02, Groundwater Level Data Acquisition and Management, Rev. 02 (SNL November 2007). The water level information was used to create the potentiometric surface maps presented in Figures 6-4 and 6-5 and the hydrographs presented in Attachment 6C.
6.4.2 Well Purging and Water Quality Measurements
A portable Bennett™ groundwater sampling system was used to collect the groundwater samples from TAG wells. The wells are purged a minimum of one saturated screen volume. Field water quality measurements for turbidity, pH, temperature, specific conductance (SC), oxidation-reduction potential (ORP), and dissolved oxygen (DO) were recorded from the well prior to collecting groundwater samples, according to SNL/NM FOP 05-01 (SNL August 2007a). Groundwater temperature, SC, ORP, DO, and pH were measured using a YSITM Model 620 water quality meter. Turbidity was measured with a HACHTM Model 2100P portable turbidity meter. The amount of water required to achieve stability of field parameters is fairly consistent. However, the ability of the aquifer to produce water varies greatly from well to well. In accordance with the Mini-Sampling and Analysis Plans (SAPs) (Table 6-4), purging continued until four stable measurements for temperature, SC, pH, and turbidity were obtained. Groundwater stability is considered acceptable when measurements range within 10 percent or 5 nephelometric turbidity units, 0.1 pH units, 1.0 degree Celsius, and SC is within 5 percent. Associated Field Measurement Logs documenting details of well purging and water quality measurements for each sampling event have been submitted to the SNL/NM Customer Funded Records Center.

6-24 ANNUAL GROUNDWATER MONITORING REPORT, CALENDAR YEAR 2010
Table 6-4. Groundwater Monitoring Well Network and Sampling Dates for the TAG Study Area, Calendar Year 2010
Date of Sampling Event Wells Sampled(1) SAP
January/February 2010
TA1-W-03 TA1-W-06 TA1-W-08 TA2-SW1-320 TA2-W-01 TA2-W-19 TA2-W-26
TA2-W-27 TJA-2 TJA-3 TJA-4 TJA-6 TJA-7 WYO-4
Tijeras Arroyo Groundwater Investigation, Mini-SAP for FY10, 2nd Quarter Sampling, January 2010 (SNL December 2009)
May 2010
TA1-W-03 TA1-W-06 TA1-W-08 TA2-W-01 TA2-SW1-320 TA2-W-19
TA2-W-26 TJA-2 TJA-4 TJA-7 WYO-4
Tijeras Arroyo Groundwater Investigation, Mini-SAP for FY10, 3rd Quarter Sampling, May 2010 (SNL April 2010)
July/August 2010
PGS-2 TA1-W-01 TA1-W-02 TA1-W-03 TA1-W-04 TA1-W-05 TA1-W-06 TA1-W-08 TA2-NW1-595 TA2-SW1-320 TA2-W-01
TA2-W-19 TA2-W-26 TA2-W-27 TJA-2 TJA-3 TJA-4 TJA-6 TJA-7 WYO-3 WYO-4
Tijeras Arroyo Groundwater Investigation, Mini-SAP for FY10, 4th Quarter Sampling, July/August 2010 (SNL June 2010)
October/ November 2010
TA1-W-03 TA2-SW1-320 TA2-W-19 TA2-W-26 TJA-2
TJA-4 TJA-7 WYO-4
Tijeras Arroyo Groundwater Investigation, Mini-SAP for FY11, 1st Quarter Sampling, November 2010 (SNL October 2010b)
NOTE: (1) Refer to page xviii of this report for well descriptions. FY = Fiscal Year. SAP = Sampling and Analysis Plan. SNL = Sandia National Laboratories. TAG = Tijeras Arroyo Groundwater.
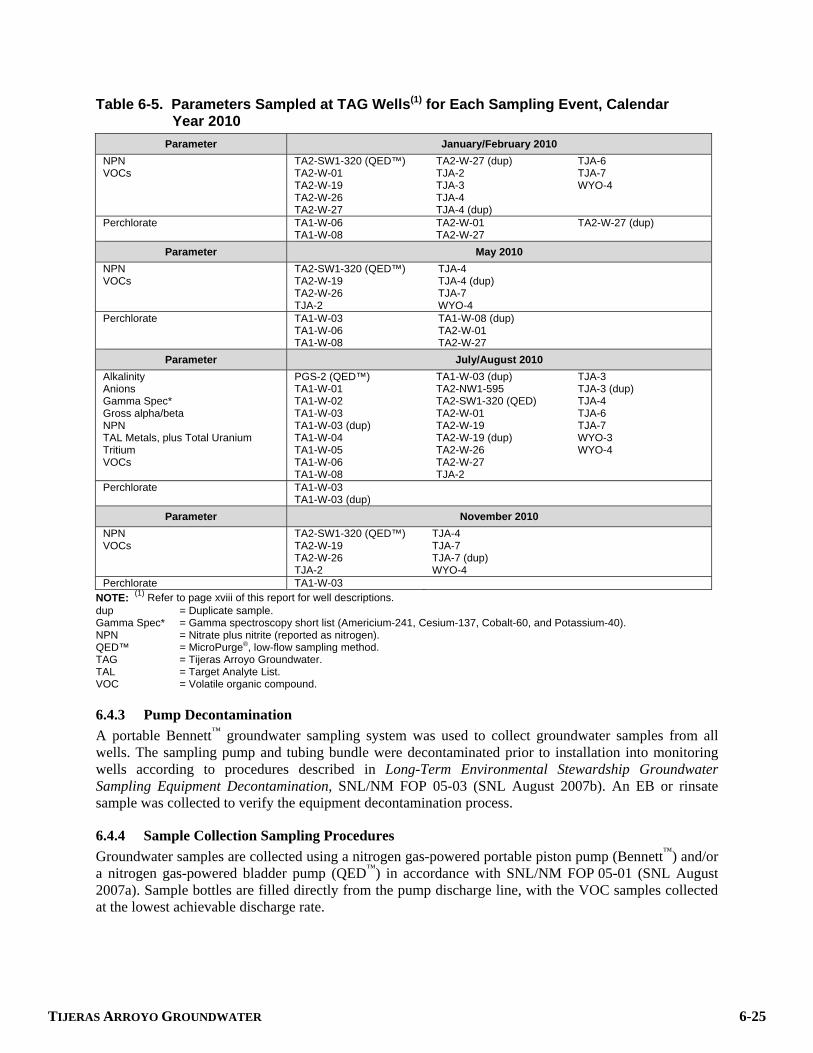
TIJERAS ARROYO GROUNDWATER 6-25
Table 6-5. Parameters Sampled at TAG Wells(1) for Each Sampling Event, Calendar Year 2010
Parameter January/February 2010 NPN VOCs
TA2-SW1-320 (QED™) TA2-W-01 TA2-W-19 TA2-W-26 TA2-W-27
TA2-W-27 (dup) TJA-2 TJA-3 TJA-4 TJA-4 (dup)
TJA-6 TJA-7 WYO-4
Perchlorate TA1-W-06 TA1-W-08
TA2-W-01 TA2-W-27
TA2-W-27 (dup)
Parameter May 2010 NPN VOCs
TA2-SW1-320 (QED™) TA2-W-19 TA2-W-26 TJA-2
TJA-4 TJA-4 (dup) TJA-7 WYO-4
Perchlorate TA1-W-03 TA1-W-06 TA1-W-08
TA1-W-08 (dup) TA2-W-01 TA2-W-27
Parameter July/August 2010 Alkalinity Anions Gamma Spec* Gross alpha/beta NPN TAL Metals, plus Total Uranium Tritium VOCs
PGS-2 (QED™) TA1-W-01 TA1-W-02 TA1-W-03 TA1-W-03 (dup) TA1-W-04 TA1-W-05 TA1-W-06 TA1-W-08
TA1-W-03 (dup) TA2-NW1-595 TA2-SW1-320 (QED) TA2-W-01 TA2-W-19 TA2-W-19 (dup) TA2-W-26 TA2-W-27 TJA-2
TJA-3 TJA-3 (dup) TJA-4 TJA-6 TJA-7 WYO-3 WYO-4
Perchlorate TA1-W-03 TA1-W-03 (dup)
Parameter November 2010 NPN VOCs
TA2-SW1-320 (QED™) TA2-W-19 TA2-W-26 TJA-2
TJA-4 TJA-7 TJA-7 (dup) WYO-4
Perchlorate TA1-W-03 NOTE: (1) Refer to page xviii of this report for well descriptions. dup = Duplicate sample. Gamma Spec* = Gamma spectroscopy short list (Americium-241, Cesium-137, Cobalt-60, and Potassium-40). NPN = Nitrate plus nitrite (reported as nitrogen). QED™ = MicroPurge®, low-flow sampling method. TAG = Tijeras Arroyo Groundwater. TAL = Target Analyte List. VOC = Volatile organic compound.
6.4.3 Pump Decontamination
A portable Bennett™ groundwater sampling system was used to collect groundwater samples from all wells. The sampling pump and tubing bundle were decontaminated prior to installation into monitoring wells according to procedures described in Long-Term Environmental Stewardship Groundwater Sampling Equipment Decontamination, SNL/NM FOP 05-03 (SNL August 2007b). An EB or rinsate sample was collected to verify the equipment decontamination process.
6.4.4 Sample Collection Sampling Procedures
Groundwater samples are collected using a nitrogen gas-powered portable piston pump (Bennett™) and/or a nitrogen gas-powered bladder pump (QED™) in accordance with SNL/NM FOP 05-01 (SNL August 2007a). Sample bottles are filled directly from the pump discharge line, with the VOC samples collected at the lowest achievable discharge rate.
6-26 ANNUAL GROUNDWATER MONITORING REPORT, CALENDAR YEAR 2010
6.4.5 Sample Handling and Shipment
The SNL/NM Sample Management Office (SMO) processes environmental samples collected by ER Operations personnel. The SMO reviews the Mini-SAPs, orders sample containers, issues sample control and tracking numbers, tracks the chain-of-custody, and reviews analytical results returned from the laboratories for laboratory contract compliance (SNL March 2003b and April 2007). All groundwater samples are analyzed by off-site laboratories using EPA-specified protocols. QC samples are also prepared at the laboratory to determine whether contaminant chemicals are introduced into laboratory processes and procedures. These include method blanks, laboratory control samples, matrix spike duplicates, and surrogate spike samples. Reported laboratory analytical and QC data are reviewed against quality assurance requirements specified in the Procedure for Completing the Contract Verification Review, SMO-05-03, Issue 03 (SNL April 2007) and Administrative Operating Procedure (AOP) 00-03, Data Validation Procedure for Chemical and Radiochemical Data, (SNL July 2007).
6.4.6 Waste Management
Purge and decontamination water generated from sampling activities were placed into 55-gallon containers and stored at the ER Operations Field Office waste accumulation area. All waste was managed in accordance with SNL/NM FOP 05-04 (SNL August 2007c) as nonregulated waste, based on historical sampling results and process knowledge of the monitoring well location. Results for associated environmental samples provide supplemental data for approval to discharge water to the sanitary sewer. All data were compared with COA discharge limits.
6.5 Analytical Methods
All groundwater samples are analyzed by off-site laboratories using EPA-specified protocols. Groundwater samples were submitted to GEL Laboratories, Inc. for analysis. Samples were analyzed in accordance with applicable EPA methods (Tables-6-6 and 6-7), including the following:
The Determination of Inorganic Anions in Water by Ion Chromatography-Method 300.0 (EPA 1983)
Perchlorate in Drinking Water Using Ion Chromatography (EPA, 1999)
Test Methods for Evaluating Solid Waste, Physical/Chemical Methods (EPA 1996).
Prescribed Procedures for Measurement of Radioactivity in Drinking Water (EPA 1980).
6.6 Summary of Analytical Results
This section discusses monitoring results, exceedances of standards, and pertinent trends in concentrations for COCs in the TAG study area that exceed standards. The analytical results and field measurements for all TAG sampling events are presented in Attachment 6A, Tables 6A-1 through 6A-8; concentration trend plots for COCs that exceed the MCLs are presented in Attachment 6B, Figures 6B-1 through 6B-6. A summary of detected VOC results are presented in Table 6A-1. The method detection limits (MDLs) for all analyzed VOCs are listed in Table 6A-2.

TIJERAS ARROYO GROUNDWATER 6-27
Table 6-6. TAG Study Area Chemical Analytical Methods Analyte Analytical Methoda,b,c
Anions SW846-9056 NPN EPA 353.2 Perchlorate EPA 314.0 TAL Metals, plus Total Uranium SW846-6020/7470 VOCs SW846-8260
NOTES: aU.S. Environmental Protection Agency, 1996, Test Methods for Evaluating Solid Waste, Physical/Chemical Methods, SW-846, 3rd ed., Rev. 1 (and all updates), U.S. Environmental Protection Agency, Washington, D.C. bU.S. Environmental Protection Agency, 1983, The Determination of Inorganic Anions in Water by Ion Chromatography-Method 300.0, EPA-600/4-84-017. cU.S. Environmental Protection Agency, 1999, Perchlorate in Drinking Water Using Ion Chromatography, EPA 815/R-00-014. EPA = U.S. Environmental Protection Agency. NPN = Nitrate plus nitrite (reported as nitrogen). SW = Solid waste. TAG = Tijeras Arroyo Groundwater. TAL = Target Analyte List. VOC = Volatile organic compound. Table 6-7. TAG Study Area Radiochemical Analytical Methods
Analyte Analytical Methoda Gamma Spectroscopy (short list) EPA 901.0 Gross Alpha/Beta Activity EPA 900.0 Tritium EPA 906.0
NOTES: aU.S. Environmental Protection Agency, 1980. Prescribed Procedures for Measurement of Radioactivity in Drinking Water, EPA-600/4-80-032, U.S. Environmental Protection Agency, Cincinnati, Ohio. EPA = U.S. Environmental Protection Agency. TAG = Tijeras Arroyo Groundwater. The VOCs detected at low concentrations in groundwater samples from TAG study area monitoring wells include the following:
1,1-Dichloroethane Carbon Disulfide Chloroform Chloromethane cis-1,2-Dichloroethene Tetrachloroethene (PCE) Toluene TCE
Nine VOCs were detected during CY 2010. Four of these VOCs have promulgated MCLs. Only TCE exceeded its MCL of 5 g/L (Table 6A-1). TCE was detected in the sample from one PGWS well, WYO-4. The maximum concentration of TCE reported for WYO-4 during this reporting period is 8.94 µg/L in the sample collected during the October/November 2010 sampling event. Figure 6B-1 (Attachment 6B) shows that the TCE concentrations in samples from WYO-4 have slightly exceeded the MCL, and the trend is level to slightly increasing over time. The analytical results for nitrate plus nitrite (NPN) (reported as nitrogen) are presented in Table 6A-3 (Attachment 6A). The NPN results exceed the MCL of 10 mg/L in samples from TA2-SW1-320, TA2-W-19, TJA-2, TJA-4, and TJA-7. The maximum concentration of NPN detected during this reporting period is 33.3 mg/L in the sample from TJA-7 collected during the October/November 2010

6-28 ANNUAL GROUNDWATER MONITORING REPORT, CALENDAR YEAR 2010
sampling event. Figures 6B-2 through 6B-6 (Attachment 6B) show that the NPN concentrations in wells TA2-SW1-320, TJA-4, and TJA-7 have generally exceeded the MCL for the life of the wells, and trends are slightly increasing to slightly decreasing over time. In contrast, NPN concentrations in TA2-W-19 and TJA-2 only occasionally exceed the MCL, and trends are slightly increasing over time. Analytical results for anions and alkalinity are presented in Table 6A-4; no anion concentrations exceed established MCLs. Analytical results for perchlorate are presented in Table 6A-5; no perchlorate was detected above the MDL. Total metal analytical results are presented in Table 6A-6; no metal results exceed established MCLs. Groundwater samples were analyzed for tritium, gross alpha/beta activity, and gamma spectroscopy. The results are presented in Table 6A-7. All radionuclide activities are below MCLs, where established. Field water quality parameters are measured during purging of each well prior to sampling and include temperature, SC, ORP, pH, turbidity, and DO. The parameter measurements obtained immediately before collecting the samples are presented in Table 6A-8.
6.7 Quality Control Results
Field and laboratory QC samples were prepared to determine the accuracy of the methods used and to detect inadvertent sample contamination that may have occurred during the sampling and analysis process. All chemical data were reviewed and qualified in accordance with AOP 00-03, Data Validation Procedure for Chemical and Radiochemical Data (SNL July 2007). Although some analytical results were qualified during the data validation process, no significant data quality problems were noted for TAG study area COCs. Data validation qualifiers are provided with the analytical results in Tables 6A-1 through 6A-7 (Attachment 6A). The data validation report associated with each sampling event has been submitted to the SNL/NM Customer Funded Records Center. The following sections discuss the results for each QC sample and the impact on data quality for the TAG quarterly sampling events.
6.7.1 Field Quality Control Samples
Field QC samples included environmental duplicate, EB, and TB samples. The field QC samples were submitted for analysis along with the groundwater samples in accordance with QC procedures specified in the Mini-SAPs (SNL December 2009, April 2010, June 2010, and October 2010b).
6.7.1.1 Duplicate Environmental Samples
Duplicate environmental samples were analyzed in order to estimate the overall reproducibility of the sampling and analytical process. A duplicate sample is collected immediately after the original environmental sample, in order to reduce variability caused by time and/or sampling mechanics. The results for duplicate sample analyses (detected parameters only) are used to calculate relative percent difference (RPD) values. Duplicate sample results for all wells and all sampling periods show good correlation (RPD values less than 20) for all calculated parameters, with the following exceptions:
January/February 2010 Sampling Event—The RPD for PCE in the TA2-W-27 sample was calculated at 21. Although analytical results were not duplicated, the reported concentrations for PCE are comparable to historical values.
July/August 2010 Sampling Event—The RPD for cis-1, 2-dichloroethene in the sample from TA2-W-19 was calculated at 27. This RPD value is considered estimated, as reported concentrations were below associated practical quantitation limits (PQLs).

TIJERAS ARROYO GROUNDWATER 6-29
November 2010 Sampling Event—The RPD for TCE in the TJA-7 sample was calculated at 27. This RPD value is considered estimated, as reported concentrations were below associated PQLs.
6.7.1.2 Equipment Blank Samples
A portable Bennett™ groundwater sampling system was used to collect groundwater samples from all wells except TA2-SW1-320, which is fitted with a dedicated pumping system. The portable Bennett™ sampling pump and tubing bundle were decontaminated prior to installation into monitoring wells according to procedures described in SNL/NM FOP 05-03 (SNL August 2007b). An EB or rinsate sample was collected to verify the effectiveness of the equipment decontamination process. The results for the EB analyses are as follows:
January/February 2010 Sampling Event—The EB sample was collected prior to sampling wells TA2-W-27 and TJA-4. Bromodichloromethane, chloroform, chloromethane, and dibromochloromethane were detected in the EB samples. No corrective action was required for bromodichloromethane, chloromethane, or dibromochloromethane as these compounds were not detected in the associated environmental samples. The result for chloroform was qualified as not detected in the TA2-W-27 EB sample during data validation because the result for the environmental sample was reported at a concentration less than the EB result.
May 2010 Sampling Event—An EB sample was collected prior to sampling wells TA1-W-08 and TJA-4. Bromodichloromethane, bromoform, chloroform, dibromochloromethane, and NPN were detected in the EB sample associated with TJA-4. No corrective action was required for bromodichloromethane, bromoform, chloroform, or dibromochloromethane as these compounds were not detected in the associated environmental samples. No corrective action was required for NPN because NPN was reported in the associated environmental samples at concentrations greater than 10 times the EB result.
July/August 2010 Sampling Event—EB samples were collected prior to sampling wells TA1-W-03, TA2-W-19, and TJA-3 and submitted for analysis of VOCs, total metals, anions, NPN, gamma spectroscopy, gross alpha, gross beta, and tritium. The analytical parameters bromodichloromethane, chloroform, dibromochloromethane, alkalinity, calcium, copper, iron, magnesium, nickel, NPN, sodium, and zinc were detected in EB samples. The result for chloroform was qualified as not detected during data validation in the TA1-W-03 environmental and duplicate samples, as the blank contamination was within five times the environmental sample concentration. The results for copper, nickel, and zinc were qualified as not detected during data validation because the results for these metals in the environmental samples were at concentrations less than five times the associated EB result. No corrective action was required for bromodichloromethane, dibromochloromethane, alkalinity, calcium, iron, magnesium, NPN, or sodium. These parameters either were not detected in environmental samples or detected at concentrations greater than five times the EB result.
November 2010 Sampling Event—One EB sample was collected prior to sampling monitoring well TJA-7 and submitted for analysis of VOCs and NPN. The organic compounds bromodichloromethane, bromoform, chloroform, and dibromochloromethane were detected in the EB sample. No corrective action was required as these compounds were not detected in the associated environmental sample. The result for NPN was
6-30 ANNUAL GROUNDWATER MONITORING REPORT, CALENDAR YEAR 2010
qualified as not detected during data validation due to associated laboratory method blank and calibration blank contamination.
6.7.1.3 Trip Blank Samples
TB samples are submitted whenever samples are collected for VOC analysis to assess whether contamination of the samples has occurred during shipment and storage. The TB samples consist of laboratory reagent grade water with hydrochloric acid preservative contained in 40-milliliter volatile organic analysis vials prepared by the analytical laboratory, which accompany the empty sample containers supplied by the laboratory. TBs were brought to the field and accompanied each sample shipment. TB qualifiers are provided with the analytical results in Table 6A-1 (Attachment 6A).
6.7.2 Laboratory Quality Control Samples
Internal laboratory QC samples, including method blanks and duplicate laboratory control samples were analyzed concurrently with all groundwater samples. All chemical data were reviewed and qualified in accordance with AOP 00-03, Data Validation Procedure for Chemical and Radiochemical Data (SNL July 2007). Laboratory data qualifiers are provided with the analytical results in Tables 6A-1 through 6A-7 (Attachment 6A).
6.8 Variances and Nonconformances
No variances or nonconformances from field or sampling requirements specified in the TAG Investigation Mini-SAPs (SNL December 2009, April 2010, June 2010, and October 2010b) were noted during sampling activities. However, project-specific issues associated with these sampling events are noted as follows:
All sampling events—(1) WYO-4 was purged dry prior to sampling. This well was allowed to recover to a minimum of 80 percent of the original water level and then samples were collected. (2) A MicroPurge®, low-flow (QED™) sampling system was used to collect a groundwater sample from TA2-SW1-320. Conventional sampling equipment cannot be lowered to the proper sampling depth due to well construction issues. The pump intake was set at 279 ft bgs in TA2-W-19 due to sediment at the bottom of the well. (3) The field team was unable to set the pump in monitoring well TA2-W-01 at the selected depth of 334 ft below the top of the well casing due to sediment within the well screen interval. The portable system was removed from the well, the pump was cleaned of fine-grained sand and silt, and the pump was then lowered back into the well to a depth of 332.5 to 333 ft below the top of the well casing.
January/February 2010 Sampling Event—On February 26, 2010, a perchlorate sample was collected from monitoring well TA1-W-03, as required by the letter from the NMED Hazardous Waste Bureau, dated April 30, 2009 (NMED April 2009). Prior sampling has been unsuccessful due to unstable turbidity readings, and in early February 2010, monitoring well TA1-W-03 was redeveloped to remove sediment from the well.
6.9 Summary and Conclusions
This section provides a brief summary of activities, discussion of COCs that exceed standards, trends of concentrations versus time, the current conceptual model, and plans for studies to be completed during CY 2011 at the TAG study area. The TAG study area encompasses an area of approximately 40 sq mi in the north-central portion of KAFB. Groundwater investigations were initiated in 1992, and the current monitoring network consists of 21 monitoring wells for water quality analysis and 27 wells for water level measurements. For this

TIJERAS ARROYO GROUNDWATER 6-31
reporting period, wells were sampled in January/February 2010, May 2010, July/August 2010, and October/November 2010. The samples were analyzed for VOCs, NPN, anions, alkalinity, perchlorate, Target Analyte List metals (plus uranium), gross alpha/beta activity, tritium, and radionuclides by gamma spectroscopy. Depending on their locations and historical concentrations of COCs, wells were sampled quarterly, semiannually, or annually during this reporting period. Only NPN and TCE were detected above MCLs in samples from TAG study area wells. NPN concentrations exceeded the MCL of 10 mg/L in samples from TA2-SW1-320, TJA-2, TJA-4, and TJA-7 during all sampling events, with a maximum concentration of 33.3 mg/L in the sample from TJA-7 collected during the November 2010 sampling event. NPN concentrations occasionally exceeded the MCL in samples from TA2-W-19. TCE exceeded the MCL of 5 g/L in samples from well WYO-4, completed in the PGWS. The maximum concentration of TCE detected during this reporting period was 8.94 µg/L detected in the sample from WYO-4 collected during the November 2010 sampling event. TCE concentrations in WYO-4 have barely exceeded the MCL for the life of the well, and the trend is level to slightly increasing over time. The analytical results for this reporting period are consistent with historical concentrations. The following conclusions are based on a comprehensive review of available information for current groundwater contamination conditions in the TAG study area:
The distribution of TCE in the PGWS is sporadic across the study area and reflects multiple release sites and the effect of subsurface heterogeneity.
Based on the historical use and disposal of chlorinated solvents, the extent of TCE in groundwater is probably associated with multiple aqueous releases of solvents and subsequent vapor-phase transport through the vadose zone.
The distribution of nitrate above the background level is laterally widespread in the PGWS.
In the regional aquifer, concentrations of nitrate above the MCL occur in the western and southeastern portions of the TAG study area.
The potential sources of TCE and/or nitrate in the TAG study area include sewage lagoons, wastewater outfalls, septic systems, landfills, sewer lines, and the golf course.
The current conceptual model described in Section 6.1.7 does not require modification based on the analytical results for this reporting period.
DOE/Sandia recommend the following approach as part of the ongoing environmental studies of the TAG study area:
Continue collection of groundwater samples at the 21 TAG groundwater monitoring wells on a quarterly, semiannual, and annual basis. At a minimum, the analytes for groundwater sampling will consist of VOCs and nitrate.
Continue periodic measurements of groundwater elevations in all TAG monitoring wells.
Maintain contact with the KAFB IRP personnel with respect to the results of TCE and nitrate abatement studies.

6-32 ANNUAL GROUNDWATER MONITORING REPORT, CALENDAR YEAR 2010
As available, obtain groundwater results from both KAFB and the COA.
Continue to integrate SNL/NM, KAFB, and COA data into the CME process currently underway for the SNL/NM Area of Responsibility.
Continue to report future TAG investigation results in the SNL/NM GWPP Annual Groundwater Monitoring Report.
Upon NMED approval of the TAG CME Report (SNL August 2005), prepare a Corrective Measures Implementation Plan.
6.10 References
AquaVISION 1999 AquaVISION, July 1999. Colloidal Borescope Investigation of the Sandia North Site, Albuquerque, New Mexico, July 21, 1999.
BGW February 2001 Balleau Groundwater, Inc. (BGW), February 2001. A Preliminary Three-
Dimensional Variably Saturated Model of a Perched Aquifer at Sandia National Laboratories, New Mexico, Balleau Groundwater, Inc., Albuquerque, New Mexico.
CH2M HILL, Inc. CH2M HILL, Inc., June 2009. Stage 2 Abatement Program for Nitrate- June 2009 Contaminated Groundwater (Site ST-105), Second Annual Groundwater
Monitoring Report, Kirtland Air Force Base, New Mexico, prepared for HQ AFCEE/ Environmental Restoration Division, Brooks City-Base, Texas.
Collins 2004 Collins, S., May 2004. Technical Memorandum: Field Report on the Slug
Tests at Tijeras Arroyo Groundwater Investigation Wells, Sandia National Laboratories, Albuquerque, New Mexico, May 18, 2004.
Collins 2000 Collins, S., December 2000. Memo to: All ER Personnel Re: Project Name
Change from the “Sandia North Groundwater Investigation” to the “Tijeras Arroyo Groundwater Investigation,” Sandia National Laboratories, Albuquerque, New Mexico.
EPA 1999 U.S. Environmental Protection Agency (EPA), 1999. Perchlorate in
Drinking Water Using Ion Chromatography, EPA 815/R-00-014, U.S. Environmental Protection Agency, Washington, D.C.
EPA 1996 U.S. Environmental Protection Agency (EPA), 1996. Test Methods for
Evaluating Solid Waste, Physical/Chemical Methods, SW-846, 3rd ed., Rev. 1 (and all updates), U.S. Environmental Protection Agency, Washington, D.C.
EPA May 1994 U.S. Environmental Protection Agency (EPA), May 1994. RCRA Corrective
Action Plan (Final), OSWER 9902.3-2A, U.S. Environmental Protection Agency, Office of Solid Waste and Emergency Response, May 1994.
EPA 1986 U.S. Environmental Protection Agency (EPA), 1986. RCRA Ground-Water
Monitoring Technical Enforcement Guidance Document, OSWER-9950.1. U.S. Environmental Protection Agency, Washington, D.C.

TIJERAS ARROYO GROUNDWATER 6-33
EPA 1983 U.S. Environmental Protection Agency (EPA), 1983. The Determination of Inorganic Anions in Water by Ion Chromatography-Method 300.0, EPA-600/4-84-017, U.S. Environmental Protection Agency, Cincinnati, Ohio.
EPA 1980 U.S. Environmental Protection Agency, 1980. Prescribed Procedures for
Measurement of Radioactivity in Drinking Water, EPA-600/4-80-032, U.S. Environmental Protection Agency, Cincinnati, Ohio.
Fritts and Van Hart Fritts, J.E., and D. Van Hart, March 1997. Sandia North Geologic 1997 Investigation Project Report, Prepared for Sandia National Laboratories
Environmental Restoration Project by GRAM, Inc. under Contract AS-4959. GRAM, Inc., Albuquerque, New Mexico.
IT January 1997 IT Corporation (IT), January 1997. Letter Report to R. Arnold,
AFCEE/ERDM. Soil Vapor Sampling in Technical Area 2, Boreholes 21, 23, and 20, November – December 1996, IT Corporation, Albuquerque, New Mexico.
MWH Americas, Inc. MWH Americas, Inc., July 2003. Stage 1 Abatement Report for July 2003 Nitrate-Impacted Groundwater at Kirtland Air Force Base, New Mexico,
prepared for Environmental Compliance Program, Kirtland Air Force Base, Albuquerque, New Mexico.
NMED February 2010 New Mexico Environment Department (NMED), February 2010. Notice of
Approval: Tijeras Arroyo Groundwater Investigation Report, November 2005, Sandia National Laboratories EPA ID# NM5890110518, SNL-05-028, New Mexico Environment Department, Santa Fe, New Mexico, February 22, 2010.
NMED August 2009 New Mexico Environment Department (NMED), August 2009. Notice of
Disapproval: Response to the Notice of Disapproval for the Tijeras Arroyo Groundwater Investigation Report, February 2009, Sandia National Laboratories EPA ID# NM5890110518, SNL-05-028, New Mexico Environment Department, Santa Fe, New Mexico, August 12, 2009.
NMED April 2009 New Mexico Environment Department (NMED), April 2009. RE:
Perchlorate Contamination in Groundwater, Sandia National Laboratories, EPA ID#NM5890110518, New Mexico Environment Department, Santa Fe, New Mexico, April 30, 2009.
NMED August 2008 New Mexico Environment Department (NMED), August 2008. Notice of
Disapproval: Tijeras Arroyo Groundwater Investigation Report, November 2005, Sandia National Laboratories EPA ID# NM5890110518, SNL-05-028, New Mexico Environment Department, Santa Fe, New Mexico.
NMED October 2004 New Mexico Environment Department (NMED), October 2004. Approval
with Modifications: Corrective Measures Evaluation Work Plan for Tijeras Arroyo Groundwater, July 2004, Sandia National Laboratories NM5890110518, HWB-SNL-04-036, New Mexico Environment Department, Santa Fe, New Mexico.
6-34 ANNUAL GROUNDWATER MONITORING REPORT, CALENDAR YEAR 2010
NMED April 2004 New Mexico Environment Department (NMED), 2004. Compliance Order on Consent Pursuant to the New Mexico Hazardous Waste Act 74-4-10: Sandia National Laboratories Consent Order, New Mexico Environment Department, Santa Fe, New Mexico, April 29, 2004.
NMED September 2003 New Mexico Environment Department (NMED), 2003. J.E. Kieling,
Manager – Management Program, correspondence: Tijeras Arroyo Groundwater Investigation Work Plan, June 2003, Sandia National Laboratories, NM5890110518-1, HWB-SNL-03-006, to K. Boardman, Manager, Sandia Site Office NNSA, U.S. Department of Energy, New Mexico Environment Department, Santa Fe, New Mexico, September 3, 2003.
NMED 1993 New Mexico Environment Department (NMED), 1993. Module IV:
Hazardous and Solid Waste Amendment (HSWA) Portion for Solid Waste Management Units (Module IV to the RCRA Part B Permit, NM5890110518), New Mexico Environment Department, Santa Fe, New Mexico.
SNL October 2010a Sandia National Laboratories/New Mexico (SNL/NM), October 2010.
Annual Groundwater Monitoring Report Calendar Year 2009, Groundwater Protection Program, Environmental Management Department and Environmental Programs and Assurance, Sandia National Laboratories, Albuquerque, New Mexico.
SNL October 2010b Sandia National Laboratories/New Mexico (SNL/NM), October 2010.
Tijeras Arroyo Groundwater Investigation, Mini-SAP for FY11, 1st Quarter Sampling, November 2010, Environmental Restoration Program, Sandia National Laboratories, Albuquerque, New Mexico, October 12, 2010.
SNL June 2010 Sandia National Laboratories/New Mexico (SNL/NM), June 2010. Tijeras
Arroyo Groundwater Investigation, Mini-SAP for FY10, 4th Quarter Sampling, July/August 2010, Environmental Restoration Program, Sandia National Laboratories, Albuquerque, New Mexico, June 14, 2010.
SNL April 2010 Sandia National Laboratories/New Mexico (SNL/NM), April 2010. Tijeras
Arroyo Groundwater Investigation, Mini-SAP for FY10, 3rd Quarter Sampling, May 2010, Environmental Restoration Program, Sandia National Laboratories, Albuquerque, New Mexico, April 19, 2010.
SNL January 2010 Sandia National Laboratories/New Mexico (SNL/NM), January 2010.
Response to NMED’s “Notice of Disapproval: Tijeras Arroyo Groundwater Investigation Report, November 2005” Dated February 2009, Environmental Restoration Program, Sandia National Laboratories, Albuquerque, New Mexico, January 19, 2010.
SNL December 2009 Sandia National Laboratories/New Mexico (SNL/NM), December 2009.
Tijeras Arroyo Groundwater Investigation, Mini-SAP for FY10, 2nd Quarter Sampling, January 2010, Environmental Restoration Program, Sandia National Laboratories, Albuquerque, New Mexico, December 14, 2009.
TIJERAS ARROYO GROUNDWATER 6-35
SNL June 2009 Sandia National Laboratories/New Mexico (SNL/NM), June 2009. Annual Groundwater Monitoring Report Calendar Year 2008, Groundwater Protection Program, Environmental Management Department and Environmental Programs and Assurance, Sandia National Laboratories, Albuquerque, New Mexico.
SNL February 2009 Sandia National Laboratories/New Mexico (SNL/NM), February 2009.
Response to NMED’s “Notice of Disapproval: Tijeras Arroyo Groundwater Investigation Report, November 2005” Dated August 2008, Environmental Restoration Program, Sandia National Laboratories, Albuquerque, New Mexico, February 26, 2009.
SNL March 2008 Sandia National Laboratories/New Mexico (SNL/NM), March 2008, Annual
Groundwater Monitoring Report, Fiscal Year 2007, Groundwater Protection Program, Sandia National Laboratories, Albuquerque, New Mexico.
SNL November 2007 Sandia National Laboratories/New Mexico (SNL/NM), November 2007.
Groundwater Level Data Acquisition and Management, FOP 03-02, Rev. 02, Sandia National Laboratories, Albuquerque, New Mexico.
SNL August 2007a Sandia National Laboratories/New Mexico (SNL/NM), August 2007a. Long-
Term Environmental Stewardship (LTES) Groundwater Monitoring Well Sampling and Field Analytical Measurements, FOP 05-01, Revision 00, Sandia National Laboratories, Albuquerque, New Mexico.
SNL August 2007b Sandia National Laboratories/New Mexico (SNL/NM), August 2007b. LTES
Groundwater Sampling Equipment Decontamination, FOP 05-03, Revision 02, Sandia National Laboratories, Albuquerque, New Mexico.
SNL August 2007c Sandia National Laboratories/New Mexico (SNL/NM), August 2007c. LTES
Groundwater Monitoring Waste Management, FOP 05-04, Revision 02, Sandia National Laboratories, Albuquerque, New Mexico.
SNL July 2007 Sandia National Laboratories, New Mexico (SNL/NM) July 2007. Data
Validation Procedure for Chemical and Radiochemical Data, AOP 00-03, Revision 2, Sample Management Office, Sandia National Laboratories, New Mexico, July 16, 2007.
SNL April 2007 Sandia National Laboratories/New Mexico (SNL/NM), April 2007.
Procedure for Completing the Contract Verification Review, SMO-05-03, Issue 03, Sandia National Laboratories, Albuquerque, New Mexico, April 30, 2007.
SNL March 2007 Sandia National Laboratories/New Mexico (SNL/NM), March 2007. Annual
Groundwater Monitoring Report, Fiscal Year 2006, Groundwater Protection Program Sandia National Laboratories, Albuquerque, New Mexico.

6-36 ANNUAL GROUNDWATER MONITORING REPORT, CALENDAR YEAR 2010
SNL November 2006 Sandia National Laboratories/New Mexico (SNL/NM), November 2006. Annual Groundwater Monitoring Report, Burn Site Groundwater, Tijeras Arroyo Groundwater, and Technical Area V Groundwater Areas of Concern, Fiscal Year 2005, Environmental Restoration Project, Sandia National Laboratories, Albuquerque, New Mexico.
SNL November 2005 Sandia National Laboratories/New Mexico (SNL/NM), November 2005.
Tijeras Arroyo Groundwater Investigation Report, Environmental Restoration Project, Sandia National Laboratories, for U.S. Department of Energy, Albuquerque Operations Office, Albuquerque, New Mexico.
SNL October 2005 Sandia National Laboratories/New Mexico (SNL/NM), October 2005.
Annual Groundwater Monitoring Report, Fiscal Year 2004, Groundwater Protection Program, Sandia National Laboratories, Albuquerque, New Mexico.
SNL August 2005 Sandia National Laboratories/New Mexico (SNL/NM), August 2005.
Corrective Measures Evaluation Report for Tijeras Arroyo Groundwater, Sandia Report SAND2005-5297, Environmental Restoration Project, Sandia National Laboratories, Albuquerque, New Mexico.
SNL July 2004 Sandia National Laboratories/New Mexico (SNL/NM), July 2004. Corrective
Measures Evaluation Work Plan, Tijeras Arroyo Groundwater, Environmental Restoration Project, Sandia National Laboratories, Albuquerque, New Mexico.
SNL March 2004 Sandia National Laboratories/New Mexico (SNL/NM), March 2004. Annual
Groundwater Monitoring Report, Fiscal Year 2003, Groundwater Protection Program Sandia National Laboratories, Albuquerque, New Mexico.
SNL June 2003 Sandia National Laboratories/New Mexico (SNL/NM), June 2003. Tijeras
Arroyo Groundwater Investigation Work Plan (Final Version), Sandia National Laboratories Environmental Restoration Project for U.S. Department of Energy, Albuquerque Operations Office, Albuquerque, New Mexico.
SNL March 2003a Sandia National Laboratories/New Mexico (SNL/NM), March 2003. Annual
Groundwater Monitoring Report, Fiscal Year 2002, Groundwater Protection Program Sandia National Laboratories, Albuquerque, New Mexico.
SNL March 2003b Sandia National Laboratories/New Mexico (SNL/NM), March 2003.
SNL/NM Statement of Work for Analytical Laboratories, Revision 2, Sandia National Laboratories, Albuquerque, New Mexico.
SNL November 2002 Sandia National Laboratories/New Mexico (SNL/NM), November 2002.
Tijeras Arroyo Groundwater Continuing Investigation Report, Environmental Restoration Project, Sandia National Laboratories, for U.S. Department of Energy, Albuquerque Operations Office, Albuquerque, New Mexico.
TIJERAS ARROYO GROUNDWATER 6-37
SNL March 2002 Sandia National Laboratories/New Mexico (SNL/NM), March 2002. Annual Groundwater Monitoring Report, Fiscal Year 2001, Groundwater Protection Program Sandia National Laboratories, Albuquerque, New Mexico.
SNL April 2001 Sandia National Laboratories/New Mexico (SNL/NM), April 2001. Annual
Groundwater Monitoring Report, Fiscal Year 2000, Groundwater Protection Program, Sandia National Laboratories, Albuquerque, New Mexico.
SNL February 2001 Sandia National Laboratories/New Mexico (SNL/NM), February 2001.
Environmental Restoration Project Long-Term Monitoring Strategy for Groundwater, Sandia National Laboratories, Albuquerque, New Mexico.
SNL June 2000 Sandia National Laboratories/New Mexico (SNL/NM), June 2000. Sandia
North Groundwater Investigation, Annual Report, Fiscal Year 1998, Environmental Restoration Project, Sandia National Laboratories, Albuquerque, New Mexico.
SNL March 2000 Sandia National Laboratories/New Mexico (SNL/NM), March 2000. Annual
Groundwater Monitoring Report, Fiscal Year 1999, Groundwater Protection Program Sandia National Laboratories, Albuquerque, New Mexico.
SNL March 1999 Sandia National Laboratories/New Mexico (SNL/NM), March 1999.
Groundwater Protection Program, Fiscal Year 1998, Annual Groundwater Monitoring Report, Sandia National Laboratories, Albuquerque, New Mexico.
SNL March 1998a Sandia National Laboratories/New Mexico (SNL/NM), March 1998. Sandia
North Groundwater Investigation, Annual Report, Fiscal Year 1997, Environmental Restoration Project, Sandia National Laboratories, Albuquerque, New Mexico.
SNL March 1998b Sandia National Laboratories/New Mexico (SNL/NM), March 1998.
Groundwater Protection Program, Calendar Year 1997 Annual Groundwater Monitoring Report, Sandia National Laboratories, Albuquerque, New Mexico.
SNL February 1998 Sandia National Laboratories/New Mexico (SNL/NM), February 1998.
Revised Site-Wide Hydrogeologic Characterization Project, Calendar Year 1995 Annual Report, Environmental Restoration Project, Sandia National Laboratories, Albuquerque, New Mexico.
SNL March 1997 Sandia National Laboratories/New Mexico (SNL/NM), March 1997.
Groundwater Protection Program, Calendar Year 1996 Annual Groundwater Monitoring Report, Sandia National Laboratories, Environmental Restoration Project, Albuquerque, New Mexico.
SNL March 1996a Sandia National Laboratories/New Mexico (SNL/NM), March 1996.
Groundwater Protection Program, Calendar Year 1995 Annual Groundwater Monitoring Report, Sandia National Laboratories, Albuquerque, New Mexico.

6-38 ANNUAL GROUNDWATER MONITORING REPORT, CALENDAR YEAR 2010
SNL March 1996b Sandia National Laboratories/New Mexico (SNL/NM), March 1996. Sandia
North Groundwater Investigation Plan, Sandia National Laboratories, Environmental Restoration Project, for U.S. Department of Energy, Albuquerque Operations Office, Albuquerque, New Mexico.
SNL March 1995a Sandia National Laboratories/New Mexico (SNL/NM), March 1995. Site-
Wide Hydrogeologic Characterization Project, Calendar Year 1994 Annual Report, Environmental Restoration Project, Sandia National Laboratories, Albuquerque, New Mexico.
SNL March 1995b Sandia National Laboratories/New Mexico (SNL/NM), March 1995.
Groundwater Protection Program, Calendar Year 1994 Annual Groundwater Monitoring Report, Sandia National Laboratories, Albuquerque, New Mexico.
SNL March 1994 Sandia National Laboratories/New Mexico (SNL/NM), March 1994.
Groundwater Protection Program, Calendar Year 1993 Annual Groundwater Monitoring Report, Sandia National Laboratories, Albuquerque, New Mexico.
Stone et al. Stone, B.D., J.C. Cole, and D.A. Sawyer, February 2000. “Regional February 2000 Stratigraphic Framework for an Integrated Three-Dimensional Geologic
Model of the Rio Grande Rift,” in U.S. Geological Survey, Middle Rio Grande Basin Study—Proceedings of the Fourth Annual Workshop, Albuquerque, New Mexico, February 15-16, 2000, Open File Report 00-488. U.S. Geological Survey, Albuquerque, New Mexico.
Van Hart et al. Van Hart, D., D.A. Hyndman, and S.S. Brandwein, October 1999. Analysis October 1999 of the USGS Isleta/Kirtland Air Force Base Aeromagnetic Survey for
Application to SNL/KAFB Area Geologic Structure, prepared for the Groundwater Protection Program/Environmental Restoration Project, Sandia National Laboratories, Albuquerque, New Mexico, October 15, 1999.
Van Hart June 2003 Van Hart, D., June 2003. Geologic Investigation: An Update of Subsurface
Geology on Kirtland Air Force Base, New Mexico, SAND Report SAND2003-1869, Sandia National Laboratories, Albuquerque, New Mexico.
Van Hart June 2001 Van Hart, D., June 2001. Shallow Groundwater System Investigation:
Tijeras Arroyo and Vicinity, prepared for the Environmental Restoration Project, Sandia National Laboratories, Albuquerque, New Mexico.
Wolford Wolford R., September 1996. Hydrologic Evaluation of a Perched Aquifer September 1996 near TA-II Tijeras Arroyo: Estimating Aquifer Parameters, Water Travel
Times, and Possible Sources of Recharge in the Perched Zone. Site-Wide Hydrogeologic Characterization Project, Environmental Restoration Program, SNL/NM, Consultants Report—GRAM, Inc., prepared for Sandia National Laboratories, Albuquerque, New Mexico.

TIJERAS ARROYO GROUNDWATER 6A-1
Attachment 6A Tijeras Arroyo Groundwater
Analytical Results Tables

6A-2 ANNUAL GROUNDWATER MONITORING REPORT, CALENDAR YEAR 2010
This page intentionally left blank.

TIJERAS ARROYO GROUNDWATER 6A-3
Attachment 6A Tables 6A-1 Summary of Detected Volatile Organic Compounds, Tijeras Arroyo
Groundwater Investigation, Sandia National Laboratories/New Mexico, Calendar Year 2010 ...................................................................................................................... 6A-5
6A-2 Method Detection Limits for Volatile Organic Compounds (EPA Methodg 8260),
Tijeras Arroyo Groundwater Investigation, Sandia National Laboratories/New Mexico, Calendar Year 2010 ........................................................................................ 6A-8
6A-3 Summary of Nitrate plus Nitrite Results, Tijeras Arroyo Groundwater
Investigation, Sandia National Laboratories/New Mexico, Calendar Year 2010 ......... 6A-9 6A-4 Summary of Anion and Alkalinity Results, Tijeras Arroyo Groundwater
Investigation, Sandia National Laboratories/New Mexico, Calendar Year 2010 ....... 6A-13 6A-5 Summary of Perchlorate Results, Tijeras Arroyo Groundwater Investigation,
Sandia National Laboratories/New Mexico, Calendar Year 2010 .............................. 6A-17 6A-6 Summary of Total Metal Results, Tijeras Arroyo Groundwater Investigation,
Sandia National Laboratories/New Mexico, Calendar Year 2010 .............................. 6A-18 6A-7 Summary of Gamma Spectroscopy, Gross Alpha, Gross Beta, and Tritium
Results, Tijeras Arroyo Groundwater Investigation, Sandia National Laboratories/New Mexico, Calendar Year 2010 ........................................................ 6A-42
6A-8 Summary of Field Water Quality Measurementsh, Tijeras Arroyo Groundwater
Investigation, Sandia National Laboratories/New Mexico, Calendar Year 2010 ....... 6A-47 Footnotes for Tijeras Arroyo Groundwater Investigation Tables ......................................................... 6A-49

6A-4 ANNUAL GROUNDWATER MONITORING REPORT, CALENDAR YEAR 2010
This page intentionally left blank.

TIJE
RA
S AR
RO
YO
GR
OU
ND
WA
TE
R
6A-5
Table 6A-1 Summary of Detected Volatile Organic Compounds,
Tijeras Arroyo Groundwater Investigation, Sandia National Laboratories/New Mexico
Calendar Year 2010
Well ID Analyte Resulta (g/L)
MDLb (g/L)
PQLc (g/L)
MCLd (g/L)
Laboratory Qualifiere
Validation Qualifierf Sample No. Analytical
Methodg TA2-W-01 Tetrachloroethene 0.392 0.300 1.00 5.00 J 088016-001 SW846-8260B13-Jan-10 Trichloroethene 1.41 0.250 1.00 5.00 088016-001 SW846-8260BTA2-W-19 1,1-Dichloroethane 0.510 0.300 1.00 NE J 088032-001 SW846-8260B21-Jan-10 Trichloroethene 4.49 0.250 1.00 5.00 088032-001 SW846-8260B cis-1,2-Dichloroethene 0.590 0.300 1.00 70.0 J 088032-001 SW846-8260BTA2-W-26 Chloroform 0.250 0.250 1.00 NE J 088030-001 SW846-8260B20-Jan-10 Tetrachloroethene 0.790 0.300 1.00 5.00 J 088030-001 SW846-8260B Trichloroethene 0.940 0.250 1.00 5.00 J 088030-001 SW846-8260BTA2-W-27 Tetrachloroethene 1.23 0.300 1.00 5.00 088020-001 SW846-8260B14-Jan-10 Trichloroethene 0.733 0.250 1.00 5.00 J 088020-001 SW846-8260BTA2-W-27 (Duplicate) Chloroform 0.266 0.250 1.00 NE J 1.0U 088021-001 SW846-8260B14-Jan-10 Tetrachloroethene 0.992 0.300 1.00 5.00 J 088021-001 SW846-8260B Trichloroethene 0.783 0.250 1.00 5.00 J 088021-001 SW846-8260BTJA-2 Carbon Disulfide 2.00 1.25 5.00 NE J 088041-001 SW846-8260B28-Jan-10 Trichloroethene 3.58 0.250 1.00 5.00 088041-001 SW846-8260B cis-1,2-Dichloroethene 0.490 0.300 1.00 70.0 J 088041-001 SW846-8260BTJA-4 (Duplicate) 27-Jan-10 Chloromethane 0.300 0.300 1.00 NE J 1.0UJ 088039-001 SW846-8260B
TJA-7 29-Jan-10 Trichloroethene 0.353 0.250 1.00 5.00 J 088043-001 SW846-8260B
WYO-4 1,1-Dichloroethane 0.980 0.300 1.00 NE J 088034-001 SW846-8260B26-Jan-10 Trichloroethene 8.34 0.250 1.00 5.00 088034-001 SW846-8260B cis-1,2-Dichloroethene 1.77 0.300 1.00 70.0 088034-001 SW846-8260B
TA2-W-19 1,1-Dichloroethane 0.520 0.300 1.00 NE J 088987-001 SW846-8260B14-May-10 Toluene 0.250 0.250 1.00 1000 J 088987-001 SW846-8260B Trichloroethene 4.09 0.250 1.00 5.00 088987-001 SW846-8260B cis-1,2-Dichloroethene 0.540 0.300 1.00 70.0 J 088987-001 SW846-8260BTA2-W-26 Chloroform 0.280 0.250 1.00 NE J 088985-001 SW846-8260B13-May-10 Tetrachloroethene 0.760 0.300 1.00 5.00 J 088985-001 SW846-8260B Trichloroethene 0.920 0.250 1.00 5.00 J 088985-001 SW846-8260BTJA-2 1,1-Dichloroethane 0.420 0.300 1.00 NE J 088996-001 SW846-8260B20-May-10 Trichloroethene 3.17 0.250 1.00 5.00 088996-001 SW846-8260B cis-1,2-Dichloroethene 0.500 0.300 1.00 70.0 J 088996-001 SW846-8260BTJA-4 (Duplicate) 19-May-10 Chloromethane 31.8 0.300 1.00 NE 088994-001 SW846-8260B
Refer to footnotes on page 6A-49.

6A-6
AN
NU
AL
GR
OU
ND
WA
TE
R M
ON
ITO
RIN
G R
EP
OR
T, CA
LE
ND
AR
YE
AR
2010
Table 6A-1 (Continued) Summary of Detected Volatile Organic Compounds,
Tijeras Arroyo Groundwater Investigation, Sandia National Laboratories/New Mexico
Calendar Year 2010
Well ID Analyte Resulta (g/L)
MDLb (g/L)
PQLc (g/L)
MCLd (g/L)
Laboratory Qualifiere
Validation Qualifierf Sample No. Analytical
Methodg TJA-7 24-May-10 Trichloroethene 0.440 0.250 1.00 5.00 J 088998-001 SW846-8260B
WYO-4 1,1-Dichloroethane 0.740 0.300 1.00 NE J 088989-001 SW846-8260B18-May-10 Chloromethane 0.400 0.300 1.00 NE J 088989-001 SW846-8260B Trichloroethene 6.47 0.250 1.00 5.00 088989-001 SW846-8260B cis-1,2-Dichloroethene 1.51 0.300 1.00 70.0 088989-001 SW846-8260B
TA1-W-03 22-Jul-10 Chloroform 0.360 0.250 1.00 NE J 1.0U 089435-001 SW846-8260B
TA1-W-03 (Duplicate) 22-Jul-10 Chloroform 0.430 0.250 1.00 NE J 1.0U 089436-001 SW846-8260B
TA1-W-06 27-Jul-10 1,1-Dichloroethene 0.640 0.300 1.00 7.00 J 089442-001 SW846-8260B
TA2-W-01 Tetrachloroethene 0.320 0.300 1.00 5.00 J 089460-001 SW846-8260B09-Aug-10 Trichloroethene 1.47 0.250 1.00 5.00 089460-001 SW846-8260BTA2-W-19 1,1-Dichloroethane 0.550 0.300 1.00 NE J 089466-001 SW846-8260B11-Aug-10 Trichloroethene 3.53 0.250 1.00 5.00 089466-001 SW846-8260B cis-1,2-Dichloroethene 0.420 0.300 1.00 70.0 J 089466-001 SW846-8260BTA2-W-19 (Duplicate) Trichloroethene 3.93 0.250 1.00 5.00 089467-001 SW846-8260B11-Aug-10 cis-1,2-Dichloroethene 0.550 0.300 1.00 70.0 J 089467-001 SW846-8260BTA2-W-26 Chloroform 0.260 0.250 1.00 5.00 J 089462-001 SW846-8260B10-Aug-10 Tetrachloroethene 0.850 0.300 1.00 5.00 J 089462-001 SW846-8260B Trichloroethene 0.830 0.250 1.00 5.00 J 089462-001 SW846-8260B cis-1,2-Dichloroethene 0.310 0.300 1.00 70.0 J 089462-001 SW846-8260BTA2-W-27 Tetrachloroethene 0.990 0.300 1.00 5.00 J 089456-001 SW846-8260B04-Aug-10 Trichloroethene 0.750 0.250 1.00 5.00 J 089456-001 SW846-8260BTJA-2 1,1-Dichloroethane 0.400 0.300 1.00 NE J 089469-001 SW846-8260B12-Aug-10 Trichloroethene 2.97 0.250 1.00 5.00 089469-001 SW846-8260B cis-1,2-Dichloroethene 0.490 0.300 1.00 70.0 J 089469-001 SW846-8260BTJA-3 29-Jul-10 Trichloroethene 0.870 0.250 1.00 5.00 J 089448-001 SW846-8260B
TJA-3 (Duplicate) 29-Jul-10 Trichloroethene 0.980 0.250 1.00 5.00 J 089449-001 SW846-8260B
TJA-7 18-Aug-10 Trichloroethene 0.400 0.250 1.00 5.00 J 089475-001 SW846-8260B
Refer to footnotes on page 6A-49.

TIJE
RA
S AR
RO
YO
GR
OU
ND
WA
TE
R
6A-7
Table 6A-1 (Concluded) Summary of Detected Volatile Organic Compounds,
Tijeras Arroyo Groundwater Investigation, Sandia National Laboratories/New Mexico
Calendar Year 2010
Well ID Analyte Resulta (g/L)
MDLb (g/L)
PQLc (g/L)
MCLd (g/L)
Laboratory Qualifiere
Validation Qualifierf Sample No. Analytical
Methodg WYO-3 02-Aug-10 Toluene 0.290 0.250 1.00 1000 J 1.0U 089451-001 SW846-8260B
WYO-4 1,1-Dichloroethane 1.04 0.300 1.00 NE 089471-001 SW846-8260B16-Aug-10 Trichloroethene 8.80 0.250 1.00 5.00 089471-001 SW846-8260B cis-1,2-Dichloroethene 1.90 0.300 1.00 70.0 089471-001 SW846-8260B
TA2-W-19 1,1-Dichloroethane 0.390 0.300 1.00 NE J 089842-001 SW846-8260B11-Nov-10 Trichloroethene 3.09 0.250 1.00 5.00 089842-001 SW846-8260B cis-1,2-Dichloroethene 0.410 0.300 1.00 70.0 J 089842-001 SW846-8260BTA2-W-26 Chloroform 0.370 0.250 1.00 NE J 089840-001 SW846-8260B10-Nov-10 Tetrachloroethene 0.910 0.300 1.00 5.00 J 089840-001 SW846-8260B Trichloroethene 1.07 0.250 1.00 5.00 089840-001 SW846-8260BTJA-2 1,1-Dichloroethane 0.620 0.300 1.00 NE J J 089847-001 SW846-8260B15-Nov-10 Trichloroethene 3.97 0.250 1.00 5.00 J 089847-001 SW846-8260B cis-1,2-Dichloroethene 0.630 0.300 1.00 70.0 J J 089847-001 SW846-8260BTJA-7 16-Nov-10 Trichloroethene 0.590 0.250 1.00 5.00 J J 089851-001 SW846-8260B
TJA-7 (Duplicate) 16-Nov-10 Trichloroethene 0.450 0.250 1.00 5.00 J J 089852-001 SW846-8260B
WYO-4 1,1-Dichloroethane 1.17 0.300 1.00 NE J 089854-001 SW846-8260B18-Nov-10 Chloromethane 0.350 0.300 1.00 NE J J 089854-001 SW846-8260B Toluene 0.250 0.250 1.00 1000 J 1.0U 089854-001 SW846-8260B Trichloroethene 8.94 0.250 1.00 5.00 J 089854-001 SW846-8260B cis-1,2-Dichloroethene 2.09 0.300 1.00 70.0 J 089854-001 SW846-8260BRefer to footnotes on page 6A-49.

6A-8 ANNUAL GROUNDWATER MONITORING REPORT, CALENDAR YEAR 2010
Table 6A-2 Method Detection Limits for Volatile Organic Compounds (EPA Methodg 8260),
Tijeras Arroyo Groundwater Investigation, Sandia National Laboratories/New Mexico
Calendar Year 2010
Analyte MDLb (g/L)
1,1,1-Trichloroethane 0.325 1,1,2,2-Tetrachloroethane 0.250 1,1,2-Trichloroethane 0.250 1,1-Dichloroethane 0.300 1,1-Dichloroethene 0.300 1,2-Dichloroethane 0.250 1,2-Dichloropropane 0.250 2-Butanone 1.25 2-Hexanone 1.25 4-methyl-, 2-Pentanone 1.25 Acetone 3.50 Benzene 0.300 Bromodichloromethane 0.250 Bromoform 0.250 Bromomethane 0.300 Carbon disulfide 1.25 Carbon tetrachloride 0.300 Chlorobenzene 0.250 Chloroethane 0.300 Chloroform 0.250 Chloromethane 0.300 Dibromochloromethane 0.300 Ethyl benzene 0.250 Methylene chloride 3.00 Styrene 0.250 Tetrachloroethene 0.300 Toluene 0.250 Trichloroethene 0.250 Vinyl acetate 1.50 Vinyl chloride 0.500 Xylene 0.300 cis-1,2-Dichloroethene 0.300 cis-1,3-Dichloropropene 0.250 trans-1,2-Dichloroethene 0.300 trans-1,3-Dichloropropene 0.250
Refer to footnotes on page 6A-49.
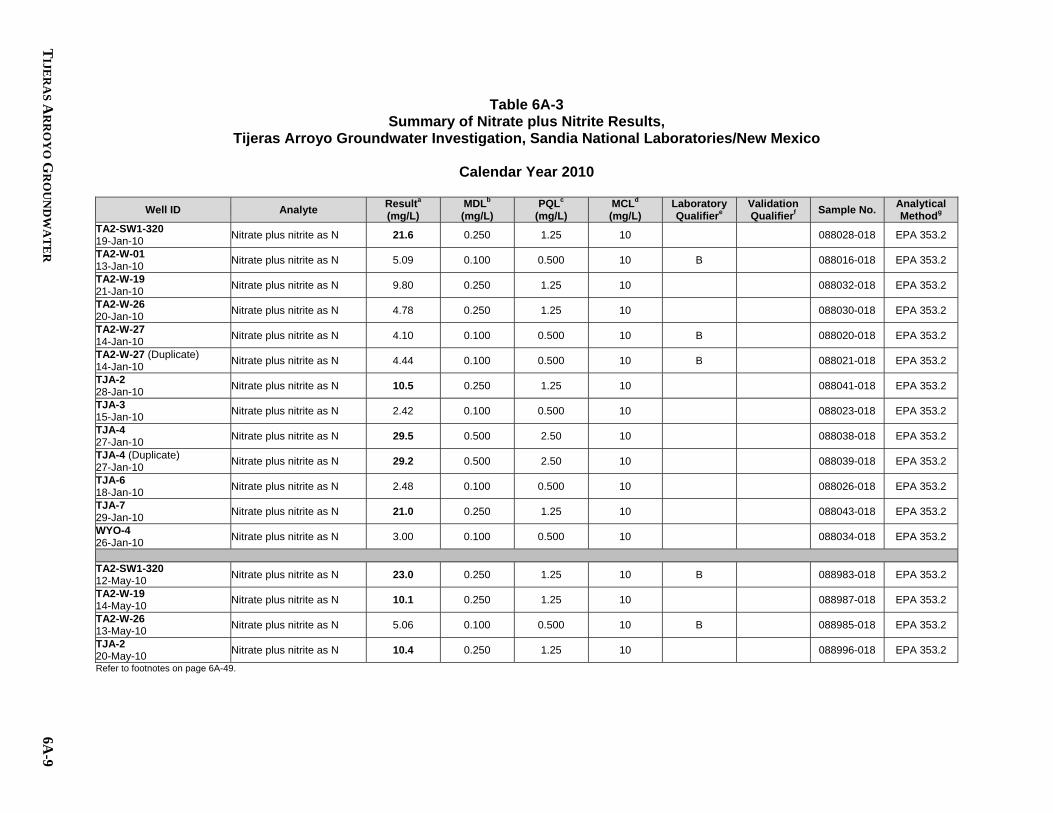
TIJE
RA
S AR
RO
YO
GR
OU
ND
WA
TE
R
6A-9
Table 6A-3 Summary of Nitrate plus Nitrite Results,
Tijeras Arroyo Groundwater Investigation, Sandia National Laboratories/New Mexico
Calendar Year 2010
Well ID Analyte Resulta
(mg/L) MDLb (mg/L)
PQLc (mg/L)
MCLd (mg/L)
Laboratory Qualifiere
Validation Qualifierf Sample No. Analytical
Methodg TA2-SW1-320 19-Jan-10 Nitrate plus nitrite as N 21.6 0.250 1.25 10 088028-018 EPA 353.2
TA2-W-01 13-Jan-10 Nitrate plus nitrite as N 5.09 0.100 0.500 10 B 088016-018 EPA 353.2
TA2-W-19 21-Jan-10 Nitrate plus nitrite as N 9.80 0.250 1.25 10 088032-018 EPA 353.2
TA2-W-26 20-Jan-10 Nitrate plus nitrite as N 4.78 0.250 1.25 10 088030-018 EPA 353.2
TA2-W-27 14-Jan-10 Nitrate plus nitrite as N 4.10 0.100 0.500 10 B 088020-018 EPA 353.2
TA2-W-27 (Duplicate) 14-Jan-10 Nitrate plus nitrite as N 4.44 0.100 0.500 10 B 088021-018 EPA 353.2
TJA-2 28-Jan-10 Nitrate plus nitrite as N 10.5 0.250 1.25 10 088041-018 EPA 353.2
TJA-3 15-Jan-10 Nitrate plus nitrite as N 2.42 0.100 0.500 10 088023-018 EPA 353.2
TJA-4 27-Jan-10 Nitrate plus nitrite as N 29.5 0.500 2.50 10 088038-018 EPA 353.2
TJA-4 (Duplicate) 27-Jan-10 Nitrate plus nitrite as N 29.2 0.500 2.50 10 088039-018 EPA 353.2
TJA-6 18-Jan-10 Nitrate plus nitrite as N 2.48 0.100 0.500 10 088026-018 EPA 353.2
TJA-7 29-Jan-10 Nitrate plus nitrite as N 21.0 0.250 1.25 10 088043-018 EPA 353.2
WYO-4 26-Jan-10 Nitrate plus nitrite as N 3.00 0.100 0.500 10 088034-018 EPA 353.2
TA2-SW1-320 12-May-10 Nitrate plus nitrite as N 23.0 0.250 1.25 10 B 088983-018 EPA 353.2
TA2-W-19 14-May-10 Nitrate plus nitrite as N 10.1 0.250 1.25 10 088987-018 EPA 353.2
TA2-W-26 13-May-10 Nitrate plus nitrite as N 5.06 0.100 0.500 10 B 088985-018 EPA 353.2
TJA-2 20-May-10 Nitrate plus nitrite as N 10.4 0.250 1.25 10 088996-018 EPA 353.2
Refer to footnotes on page 6A-49.

6A-10
AN
NU
AL
GR
OU
ND
WA
TE
R M
ON
ITO
RIN
G R
EP
OR
T, CA
LE
ND
AR
YE
AR
2010
Table 6A-3 (Continued) Summary of Nitrate plus Nitrite Results,
Tijeras Arroyo Groundwater Investigation, Sandia National Laboratories/New Mexico
Calendar Year 2010
Well ID Analyte Resulta
(mg/L) MDLb (mg/L)
PQLc (mg/L)
MCLd (mg/L)
Laboratory Qualifiere
Validation Qualifierf Sample No. Analytical
Methodg TJA-4 19-May-10 Nitrate plus nitrite as N 28.0 1.00 5.00 10 088993-018 EPA 353.2
TJA-4 (Duplicate) 19-May-10 Nitrate plus nitrite as N 28.4 0.500 2.50 10 088994-018 EPA 353.2
TJA-7 24-May-10 Nitrate plus nitrite as N 23.7 0.500 2.50 10 088998-018 EPA 353.2
WYO-4 18-May-10 Nitrate plus nitrite as N 2.96 0.100 0.500 10 088989-018 EPA 353.2
PGS-2 16-Jul-10 Nitrate plus nitrite as N 0.900 0.050 0.250 10 089426-018 EPA 353.2
TA1-W-01 06-Aug-10 Nitrate plus nitrite as N 2.73 0.100 0.500 10 089429-018 EPA 353.2
TA1-W-02 21-Jul-10 Nitrate plus nitrite as N 1.02 0.050 0.250 10 089431-018 EPA 353.2
TA1-W-03 22-Jul-10 Nitrate plus nitrite as N 6.40 0.250 1.25 10 089435-018 EPA 353.2
TA1-W-03 (Duplicate) 22-Jul-10 Nitrate plus nitrite as N 6.40 0.250 1.25 10 089436-018 EPA 353.2
TA1-W-04 23-Jul-10 Nitrate plus nitrite as N 1.68 0.100 0.500 10 089438-018 EPA 353.2
TA1-W-05 26-Jul-10 Nitrate plus nitrite as N 1.31 0.050 0.250 10 089440-018 EPA 353.2
TA1-W-06 27-Jul-10 Nitrate plus nitrite as N 3.42 0.100 0.500 10 089442-018 EPA 353.2
TA1-W-08 28-Jul-10 Nitrate plus nitrite as N 7.00 0.250 1.25 10 089444-018 EPA 353.2
TA2-NW1-595 03-Aug-10 Nitrate plus nitrite as N 4.05 0.250 1.25 10 089453-018 EPA 353.2
TA2-SW1-320 15-Jul-10 Nitrate plus nitrite as N 21.4 0.500 2.50 10 B J 089424-018 EPA 353.2
TA2-W-01 09-Aug-10 Nitrate plus nitrite as N 4.65 0.100 0.500 10 089460-018 EPA 353.2
Refer to footnotes on page 6A-49.
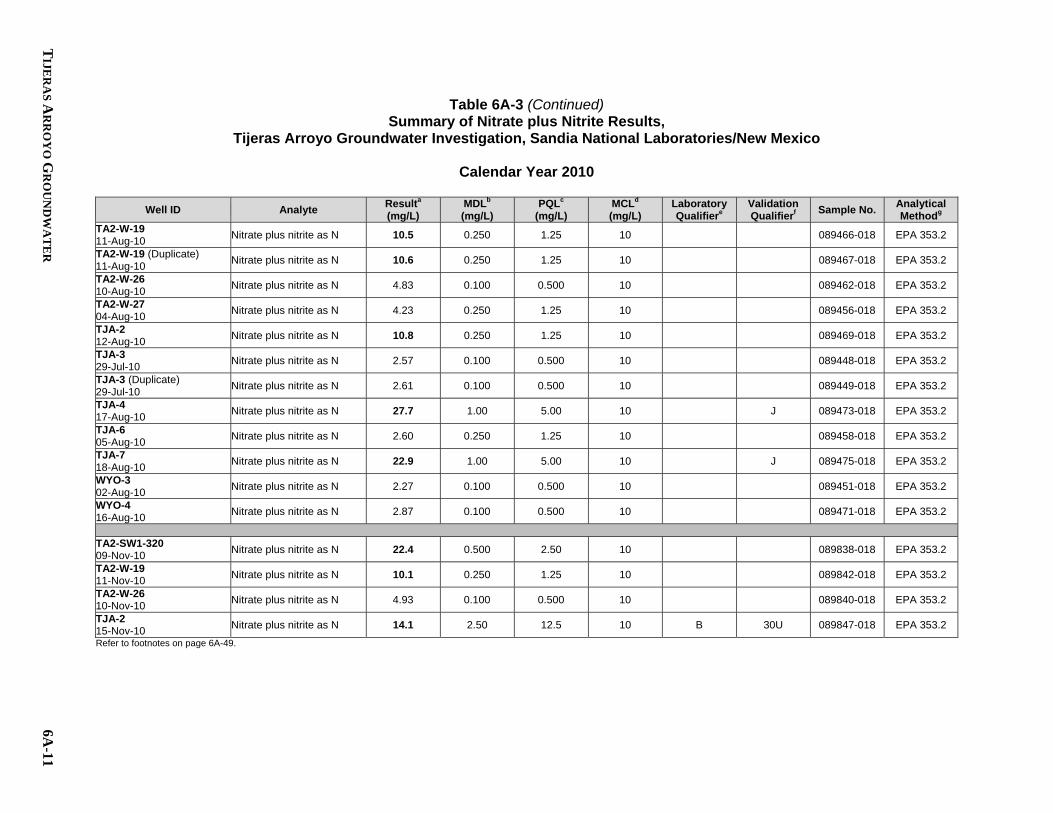
TIJE
RA
S AR
RO
YO
GR
OU
ND
WA
TE
R
6A-11
Table 6A-3 (Continued) Summary of Nitrate plus Nitrite Results,
Tijeras Arroyo Groundwater Investigation, Sandia National Laboratories/New Mexico
Calendar Year 2010
Well ID Analyte Resulta
(mg/L) MDLb (mg/L)
PQLc (mg/L)
MCLd (mg/L)
Laboratory Qualifiere
Validation Qualifierf Sample No. Analytical
Methodg TA2-W-19 11-Aug-10 Nitrate plus nitrite as N 10.5 0.250 1.25 10 089466-018 EPA 353.2
TA2-W-19 (Duplicate) 11-Aug-10 Nitrate plus nitrite as N 10.6 0.250 1.25 10 089467-018 EPA 353.2
TA2-W-26 10-Aug-10 Nitrate plus nitrite as N 4.83 0.100 0.500 10 089462-018 EPA 353.2
TA2-W-27 04-Aug-10 Nitrate plus nitrite as N 4.23 0.250 1.25 10 089456-018 EPA 353.2
TJA-2 12-Aug-10 Nitrate plus nitrite as N 10.8 0.250 1.25 10 089469-018 EPA 353.2
TJA-3 29-Jul-10 Nitrate plus nitrite as N 2.57 0.100 0.500 10 089448-018 EPA 353.2
TJA-3 (Duplicate) 29-Jul-10 Nitrate plus nitrite as N 2.61 0.100 0.500 10 089449-018 EPA 353.2
TJA-4 17-Aug-10 Nitrate plus nitrite as N 27.7 1.00 5.00 10 J 089473-018 EPA 353.2
TJA-6 05-Aug-10 Nitrate plus nitrite as N 2.60 0.250 1.25 10 089458-018 EPA 353.2
TJA-7 18-Aug-10 Nitrate plus nitrite as N 22.9 1.00 5.00 10 J 089475-018 EPA 353.2
WYO-3 02-Aug-10 Nitrate plus nitrite as N 2.27 0.100 0.500 10 089451-018 EPA 353.2
WYO-4 16-Aug-10 Nitrate plus nitrite as N 2.87 0.100 0.500 10 089471-018 EPA 353.2
TA2-SW1-320 09-Nov-10 Nitrate plus nitrite as N 22.4 0.500 2.50 10 089838-018 EPA 353.2
TA2-W-19 11-Nov-10 Nitrate plus nitrite as N 10.1 0.250 1.25 10 089842-018 EPA 353.2
TA2-W-26 10-Nov-10 Nitrate plus nitrite as N 4.93 0.100 0.500 10 089840-018 EPA 353.2
TJA-2 15-Nov-10 Nitrate plus nitrite as N 14.1 2.50 12.5 10 B 30U 089847-018 EPA 353.2
Refer to footnotes on page 6A-49.

6A-12
AN
NU
AL
GR
OU
ND
WA
TE
R M
ON
ITO
RIN
G R
EP
OR
T, CA
LE
ND
AR
YE
AR
2010
Table 6A-3 (Concluded) Summary of Nitrate plus Nitrite Results,
Tijeras Arroyo Groundwater Investigation, Sandia National Laboratories/New Mexico
Calendar Year 2010
Well ID Analyte Resulta
(mg/L) MDLb (mg/L)
PQLc (mg/L)
MCLd (mg/L)
Laboratory Qualifiere
Validation Qualifierf Sample No. Analytical
Methodg TJA-4 12-Nov-10 Nitrate plus nitrite as N 30.0 2.50 12.5 10 B 30U 089845-018 EPA 353.2
TJA-7 16-Nov-10 Nitrate plus nitrite as N 27.3 2.50 12.5 10 B 30U 089851-018 EPA 353.2
TJA-7 (Duplicate) 16-Nov-10 Nitrate plus nitrite as N 33.3 2.50 12.5 10 B 089852-018 EPA 353.2
WYO-4 18-Nov-10 Nitrate plus nitrite as N 0.730 0.050 0.250 10 B J 089854-018 EPA 353.2
Refer to footnotes on page 6A-49.

TIJE
RA
S AR
RO
YO
GR
OU
ND
WA
TE
R
6A-13
Table 6A-4 Summary of Anion and Alkalinity Results,
Tijeras Arroyo Groundwater Investigation, Sandia National Laboratories/New Mexico
Calendar Year 2010
Well ID Analyte Resulta (mg/L)
MDLb (mg/L)
PQLc (mg/L)
MCLd (mg/L)
Laboratory Qualifiere
Validation Qualifierf Sample No. Analytical
Methodg PGS-2 Bromide 0.170 0.066 0.200 NE J 089426-016 SW846 9056 16-Jul-10 Chloride 14.6 0.066 0.200 NE 089426-016 SW846 9056 Fluoride 0.227 0.033 0.100 4.0 089426-016 SW846 9056 Sulfate 63.6 0.500 2.00 NE 089426-016 SW846 9056 Alkalinity, Total 161 0.725 1.00 NE B 089426-016 SM 2320B TA1-W-01 Bromide 0.206 0.066 0.200 NE 089429-016 SW846 9056 06-Aug-10 Chloride 16.3 0.066 0.200 NE 089429-016 SW846 9056 Fluoride 0.498 0.033 0.100 4.0 089429-016 SW846 9056 Sulfate 76.8 1.00 4.00 NE 089429-016 SW846 9056 Alkalinity, Total 168 0.725 1.00 NE B 089429-016 SM 2320B TA1-W-02 Bromide 0.180 0.066 0.200 NE J 089431-016 SW846 9056 21-Jul-10 Chloride 15.1 0.066 0.200 NE 089431-016 SW846 9056 Fluoride 0.478 0.033 0.100 4.0 089431-016 SW846 9056 Sulfate 76.7 0.500 2.00 NE 089431-016 SW846 9056 Alkalinity, Total 176 0.725 1.00 NE B 089431-016 SM 2320B TA1-W-03 Bromide 3.29 0.066 0.200 NE 089435-016 SW846 9056 22-Jul-10 Chloride 264 1.65 5.00 NE 089435-016 SW846 9056 Fluoride 0.263 0.033 0.100 4.0 089435-016 SW846 9056 Sulfate 503 2.50 10.0 NE 089435-016 SW846 9056 Alkalinity, Total 71.1 0.725 1.00 NE B 089435-016 SM 2320B TA1-W-03 (Duplicate) Bromide 3.32 0.066 0.200 NE 089436-016 SW846 9056 22-Jul-10 Chloride 260 1.65 5.00 NE 089436-016 SW846 9056 Fluoride 0.262 0.033 0.100 4.0 089436-016 SW846 9056 Sulfate 497 2.50 10.0 NE 089436-016 SW846 9056 Alkalinity, Total 72.1 0.725 1.00 NE B 089436-016 SM 2320B TA1-W-04 Bromide 0.191 0.066 0.200 NE J 089438-016 SW846 9056 23-Jul-10 Chloride 15.3 0.066 0.200 NE 089438-016 SW846 9056 Fluoride 0.476 0.033 0.100 4.0 089438-016 SW846 9056 Sulfate 65.4 0.200 0.800 NE 089438-016 SW846 9056 Alkalinity, Total 174 0.725 1.00 NE B 089438-016 SM 2320B TA1-W-05 Bromide 0.167 0.066 0.200 NE J 089440-016 SW846 9056 26-Jul-10 Chloride 11.2 0.066 0.200 NE 089440-016 SW846 9056 Fluoride 0.359 0.033 0.100 4.0 089440-016 SW846 9056 Sulfate 98.1 0.500 2.00 NE 089440-016 SW846 9056 Alkalinity, Total 212 0.725 1.00 NE B 089440-016 SM 2320B Refer to footnotes on page 6A-49.

6A-14
AN
NU
AL
GR
OU
ND
WA
TE
R M
ON
ITO
RIN
G R
EP
OR
T, CA
LE
ND
AR
YE
AR
2010
Table 6A-4 (Continued) Summary of Anion and Alkalinity Results,
Tijeras Arroyo Groundwater Investigation, Sandia National Laboratories/New Mexico
Calendar Year 2010
Well ID Analyte Resulta (mg/L)
MDLb (mg/L)
PQLc (mg/L)
MCLd (mg/L)
Laboratory Qualifiere
Validation Qualifierf Sample No. Analytical
Methodg TA1-W-06 Bromide 1.27 0.066 0.200 NE 089442-016 SW846 9056 27-Jul-10 Chloride 102 0.660 2.00 NE 089442-016 SW846 9056 Fluoride 0.350 0.033 0.100 4.0 089442-016 SW846 9056 Sulfate 206 1.00 4.00 NE 089442-016 SW846 9056 Alkalinity, Total 87.8 0.725 1.00 NE B 089442-016 SM 2320B TA1-W-08 Bromide 2.53 0.066 0.200 NE 089444-016 SW846 9056 28-Jul-10 Chloride 199 3.30 10.0 NE J 089444-016 SW846 9056 Fluoride 0.269 0.033 0.100 4.0 089444-016 SW846 9056 Sulfate 731 5.00 20.0 NE J 089444-016 SW846 9056 Alkalinity, Total 85.7 0.725 1.00 NE B 089444-016 SM 2320B TA2-NW1-595 Bromide 1.33 0.066 0.200 NE 089453-016 SW846 9056 03-Aug-10 Chloride 97.2 0.660 2.00 NE 089453-016 SW846 9056 Fluoride 0.378 0.033 0.100 4.0 089453-016 SW846 9056 Sulfate 107 1.00 4.00 NE 089453-016 SW846 9056 Alkalinity, Total 133 0.725 1.00 NE B 089453-016 SM 2320B TA2-SW1-320 Bromide 0.547 0.066 0.200 NE 089424-016 SW846 9056 15-Jul-10 Chloride 30.0 0.660 2.00 NE 089424-016 SW846 9056 Fluoride 0.471 0.033 0.100 4.0 089424-016 SW846 9056 Sulfate 13.8 0.100 0.400 NE 089424-016 SW846 9056 Alkalinity, Total 124 0.725 1.00 NE B 089424-016 SM 2320B TA2-W-01 Bromide 1.48 0.066 0.200 NE 089460-016 SW846 9056 09-Aug-10 Chloride 99.7 0.660 2.00 NE 089460-016 SW846 9056 Fluoride 0.414 0.033 0.100 4.0 089460-016 SW846 9056 Sulfate 51.5 1.00 4.00 NE 089460-016 SW846 9056 Alkalinity, Total 96.0 0.725 1.00 NE B 089460-016 SM 2320B TA2-W-19 Bromide 0.927 0.066 0.200 NE 089466-016 SW846 9056 11-Aug-10 Chloride 64.7 0.660 2.00 NE 089466-016 SW846 9056 Fluoride 0.409 0.033 0.100 4.0 089466-016 SW846 9056 Sulfate 54.0 1.00 4.00 NE 089466-016 SW846 9056 Alkalinity, Total 105 0.725 1.00 NE B 089466-016 SM 2320B TA2-W-19 (Duplicate) Bromide 0.913 0.066 0.200 NE 089467-016 SW846 9056 11-Aug-10 Chloride 65.2 0.660 2.00 NE 089467-016 SW846 9056 Fluoride 0.409 0.033 0.100 4.0 089467-016 SW846 9056 Sulfate 54.2 1.00 4.00 NE 089467-016 SW846 9056 Alkalinity, Total 104 0.725 1.00 NE B 089467-016 SM 2320B Refer to footnotes on page 6A-49.
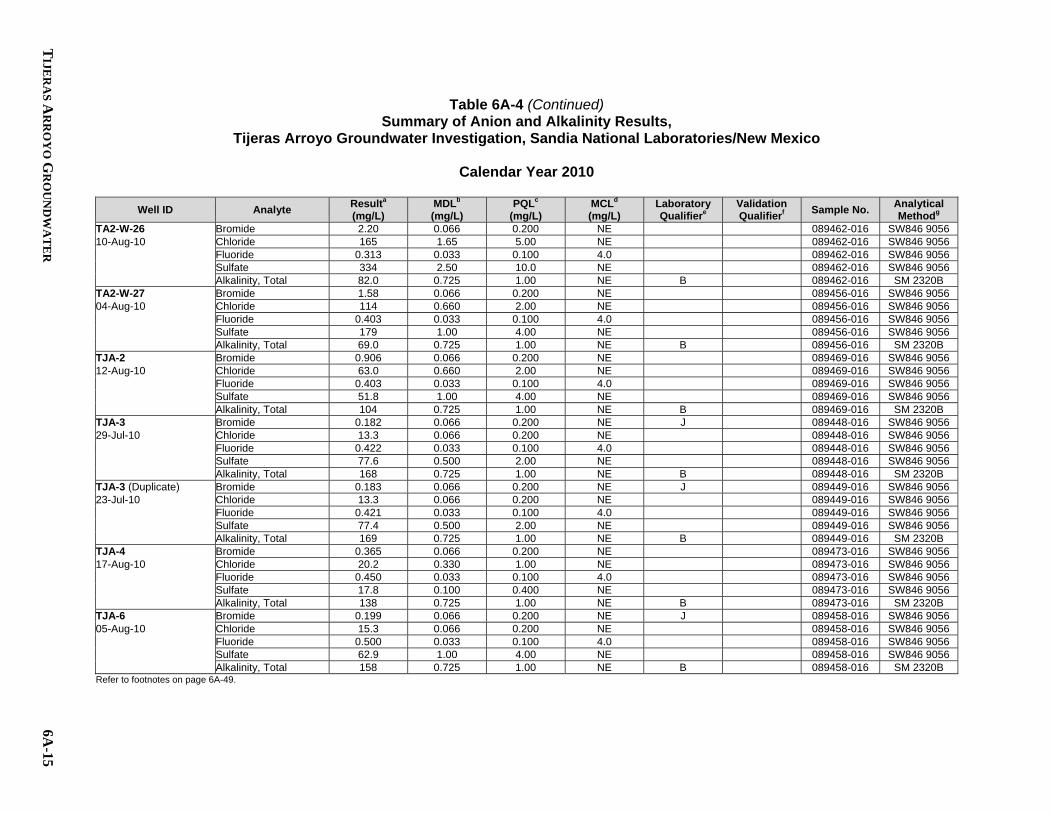
TIJE
RA
S AR
RO
YO
GR
OU
ND
WA
TE
R
6A-15
Table 6A-4 (Continued) Summary of Anion and Alkalinity Results,
Tijeras Arroyo Groundwater Investigation, Sandia National Laboratories/New Mexico
Calendar Year 2010
Well ID Analyte Resulta (mg/L)
MDLb (mg/L)
PQLc (mg/L)
MCLd (mg/L)
Laboratory Qualifiere
Validation Qualifierf Sample No. Analytical
Methodg TA2-W-26 Bromide 2.20 0.066 0.200 NE 089462-016 SW846 9056 10-Aug-10 Chloride 165 1.65 5.00 NE 089462-016 SW846 9056 Fluoride 0.313 0.033 0.100 4.0 089462-016 SW846 9056 Sulfate 334 2.50 10.0 NE 089462-016 SW846 9056 Alkalinity, Total 82.0 0.725 1.00 NE B 089462-016 SM 2320B TA2-W-27 Bromide 1.58 0.066 0.200 NE 089456-016 SW846 9056 04-Aug-10 Chloride 114 0.660 2.00 NE 089456-016 SW846 9056 Fluoride 0.403 0.033 0.100 4.0 089456-016 SW846 9056 Sulfate 179 1.00 4.00 NE 089456-016 SW846 9056 Alkalinity, Total 69.0 0.725 1.00 NE B 089456-016 SM 2320B TJA-2 Bromide 0.906 0.066 0.200 NE 089469-016 SW846 9056 12-Aug-10 Chloride 63.0 0.660 2.00 NE 089469-016 SW846 9056 Fluoride 0.403 0.033 0.100 4.0 089469-016 SW846 9056 Sulfate 51.8 1.00 4.00 NE 089469-016 SW846 9056 Alkalinity, Total 104 0.725 1.00 NE B 089469-016 SM 2320B TJA-3 Bromide 0.182 0.066 0.200 NE J 089448-016 SW846 9056 29-Jul-10 Chloride 13.3 0.066 0.200 NE 089448-016 SW846 9056 Fluoride 0.422 0.033 0.100 4.0 089448-016 SW846 9056 Sulfate 77.6 0.500 2.00 NE 089448-016 SW846 9056 Alkalinity, Total 168 0.725 1.00 NE B 089448-016 SM 2320B TJA-3 (Duplicate) Bromide 0.183 0.066 0.200 NE J 089449-016 SW846 9056 23-Jul-10 Chloride 13.3 0.066 0.200 NE 089449-016 SW846 9056 Fluoride 0.421 0.033 0.100 4.0 089449-016 SW846 9056 Sulfate 77.4 0.500 2.00 NE 089449-016 SW846 9056 Alkalinity, Total 169 0.725 1.00 NE B 089449-016 SM 2320B TJA-4 Bromide 0.365 0.066 0.200 NE 089473-016 SW846 9056 17-Aug-10 Chloride 20.2 0.330 1.00 NE 089473-016 SW846 9056 Fluoride 0.450 0.033 0.100 4.0 089473-016 SW846 9056 Sulfate 17.8 0.100 0.400 NE 089473-016 SW846 9056 Alkalinity, Total 138 0.725 1.00 NE B 089473-016 SM 2320B TJA-6 Bromide 0.199 0.066 0.200 NE J 089458-016 SW846 9056 05-Aug-10 Chloride 15.3 0.066 0.200 NE 089458-016 SW846 9056 Fluoride 0.500 0.033 0.100 4.0 089458-016 SW846 9056 Sulfate 62.9 1.00 4.00 NE 089458-016 SW846 9056 Alkalinity, Total 158 0.725 1.00 NE B 089458-016 SM 2320B Refer to footnotes on page 6A-49.

6A-16
AN
NU
AL
GR
OU
ND
WA
TE
R M
ON
ITO
RIN
G R
EP
OR
T, CA
LE
ND
AR
YE
AR
2010
Table 6A-4 (Concluded) Summary of Anion and Alkalinity Results,
Tijeras Arroyo Groundwater Investigation, Sandia National Laboratories/New Mexico
Calendar Year 2010
Well ID Analyte Resulta (mg/L)
MDLb (mg/L)
PQLc (mg/L)
MCLd (mg/L)
Laboratory Qualifiere
Validation Qualifierf Sample No. Analytical
Methodg TJA-7 Bromide 0.434 0.066 0.200 NE 089475-016 SW846 9056 18-Aug-10 Chloride 23.2 0.330 1.00 NE 089475-016 SW846 9056 Fluoride 0.447 0.033 0.100 4.0 089475-016 SW846 9056 Sulfate 20.8 0.100 0.400 NE 089475-016 SW846 9056 Alkalinity, Total 128 0.725 1.00 NE B 089475-016 SM 2320B WYO-3 Bromide 0.214 0.066 0.200 NE 089451-016 SW846 9056 02-Aug-10 Chloride 17.2 0.066 0.200 NE 089451-016 SW846 9056 Fluoride 0.521 0.033 0.100 4.0 089451-016 SW846 9056 Sulfate 79.0 1.00 4.00 NE 089451-016 SW846 9056 Alkalinity, Total 161 0.725 1.00 NE B 089451-016 SM 2320B WYO-4 Bromide 1.31 0.066 0.200 NE 089471-016 SW846 9056 16-Aug-10 Chloride 107 0.660 2.00 NE 089471-016 SW846 9056 Fluoride 0.412 0.033 0.100 4.0 089471-016 SW846 9056 Sulfate 49.5 1.00 4.00 NE 089471-016 SW846 9056 Alkalinity, Total 99.5 0.725 1.00 NE B 089471-016 SM 2320B Refer to footnotes on page 6A-49.

TIJE
RA
S AR
RO
YO
GR
OU
ND
WA
TE
R
6A-17
Table 6A-5 Summary of Perchlorate Results,
Tijeras Arroyo Groundwater Investigation, Sandia National Laboratories/New Mexico
Calendar Year 2010
Well ID Analyte Resulta (g/L)
MDLb (g/L)
PQLc (g/L)
MCLd (g/L)
Laboratory Qualifiere
Validation Qualifierf Sample No. Analytical
Methodg TA1-W-03 26-Feb-10 Perchlorate ND 4.0 12 NE U 088220-020 EPA 314.0
TA1-W-06 11-Jan-10 Perchlorate ND 4.0 12 NE U 088014-020 EPA 314.0
TA1-W-08 12-Jan-10 Perchlorate ND 4.0 12 NE U 088015-020 EPA 314.0
TA2-W-01 13-Jan-10 Perchlorate ND 4.0 12 NE U 088016-020 EPA 314.0
TA2-W-27 14-Jan-10 Perchlorate ND 4.0 12 NE U 088020-020 EPA 314.0
TA2-W-27 (Duplicate) 14-Jan-10 Perchlorate ND 4.0 12 NE U 088021-020 EPA 314.0
TA1-W-03 03-May-10 Perchlorate ND 4.0 12 NE U 088976-020 EPA 314.0
TA1-W-06 04-May-10 Perchlorate ND 4.0 12 NE U 088977-020 EPA 314.0
TA1-W-08 05-May-10 Perchlorate ND 4.0 12 NE U 088979-020 EPA 314.0
TA1-W-08 (Duplicate) 05-May-10 Perchlorate ND 4.0 12 NE U 088980-020 EPA 314.0
TA2-W-01 06-May-10 Perchlorate ND 4.0 12 NE U 088981-020 EPA 314.0
TA2-W-27 11-May-10 Perchlorate ND 4.0 12 NE U 088982-020 EPA 314.0
TA1-W-03 22-Jul-10 Perchlorate ND 4.0 12 NE U 089435-020 EPA 314.0
TA1-W-03 (Duplicate) 22-Jul-10 Perchlorate ND 4.0 12 NE U 089436-020 EPA 314.0
TA1-W-03 08-Nov-10 Perchlorate ND 4.0 12 NE U 089837-020 EPA 314.0
Refer to footnotes on page 6A-49.
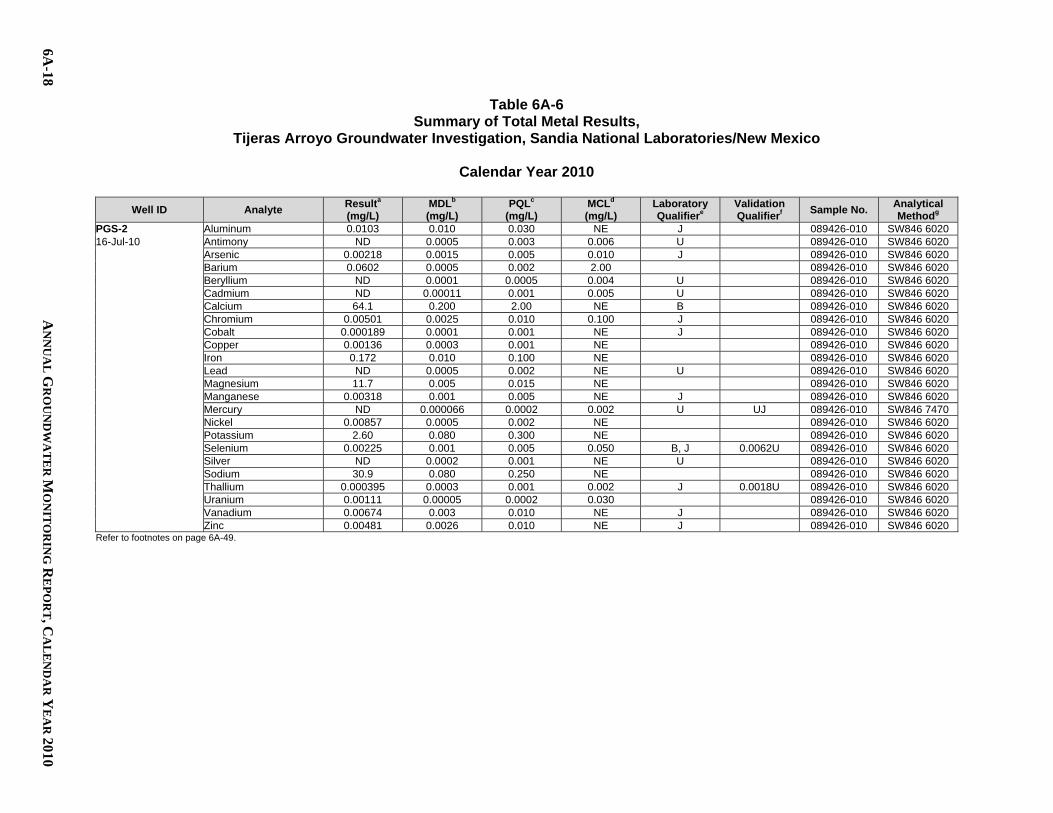
6A-18
AN
NU
AL
GR
OU
ND
WA
TE
R M
ON
ITO
RIN
G R
EP
OR
T, CA
LE
ND
AR
YE
AR
2010
Table 6A-6 Summary of Total Metal Results,
Tijeras Arroyo Groundwater Investigation, Sandia National Laboratories/New Mexico
Calendar Year 2010
Well ID Analyte Resulta
(mg/L) MDLb (mg/L)
PQLc (mg/L)
MCLd (mg/L)
Laboratory Qualifiere
Validation Qualifierf Sample No. Analytical
Methodg PGS-2 Aluminum 0.0103 0.010 0.030 NE J 089426-010 SW846 6020 16-Jul-10 Antimony ND 0.0005 0.003 0.006 U 089426-010 SW846 6020 Arsenic 0.00218 0.0015 0.005 0.010 J 089426-010 SW846 6020 Barium 0.0602 0.0005 0.002 2.00 089426-010 SW846 6020 Beryllium ND 0.0001 0.0005 0.004 U 089426-010 SW846 6020 Cadmium ND 0.00011 0.001 0.005 U 089426-010 SW846 6020 Calcium 64.1 0.200 2.00 NE B 089426-010 SW846 6020 Chromium 0.00501 0.0025 0.010 0.100 J 089426-010 SW846 6020 Cobalt 0.000189 0.0001 0.001 NE J 089426-010 SW846 6020 Copper 0.00136 0.0003 0.001 NE 089426-010 SW846 6020 Iron 0.172 0.010 0.100 NE 089426-010 SW846 6020 Lead ND 0.0005 0.002 NE U 089426-010 SW846 6020 Magnesium 11.7 0.005 0.015 NE 089426-010 SW846 6020 Manganese 0.00318 0.001 0.005 NE J 089426-010 SW846 6020 Mercury ND 0.000066 0.0002 0.002 U UJ 089426-010 SW846 7470 Nickel 0.00857 0.0005 0.002 NE 089426-010 SW846 6020 Potassium 2.60 0.080 0.300 NE 089426-010 SW846 6020 Selenium 0.00225 0.001 0.005 0.050 B, J 0.0062U 089426-010 SW846 6020 Silver ND 0.0002 0.001 NE U 089426-010 SW846 6020 Sodium 30.9 0.080 0.250 NE 089426-010 SW846 6020 Thallium 0.000395 0.0003 0.001 0.002 J 0.0018U 089426-010 SW846 6020 Uranium 0.00111 0.00005 0.0002 0.030 089426-010 SW846 6020 Vanadium 0.00674 0.003 0.010 NE J 089426-010 SW846 6020 Zinc 0.00481 0.0026 0.010 NE J 089426-010 SW846 6020 Refer to footnotes on page 6A-49.

TIJE
RA
S AR
RO
YO
GR
OU
ND
WA
TE
R
6A-19
Table 6A-6 (Continued) Summary of Total Metal Results,
Tijeras Arroyo Groundwater Investigation, Sandia National Laboratories/New Mexico
Calendar Year 2010
Well ID Analyte Resulta
(mg/L) MDLb (mg/L)
PQLc (mg/L)
MCLd (mg/L)
Laboratory Qualifiere
Validation Qualifierf Sample No. Analytical
Methodg TA1-W-01 Aluminum ND 0.010 0.030 NE U 089429-010 SW846 6020 06-Aug-10 Antimony ND 0.0005 0.003 0.006 U 089429-010 SW846 6020 Arsenic 0.00241 0.0015 0.005 0.010 B, J 0.012U 089429-010 SW846 6020 Barium 0.0488 0.0005 0.002 2.00 089429-010 SW846 6020 Beryllium 0.000104 0.0001 0.0005 0.004 B, J 0.00093U 089429-010 SW846 6020 Cadmium ND 0.00011 0.001 0.005 U 089429-010 SW846 6020 Calcium 69.9 0.100 1.00 NE B 089429-010 SW846 6020 Chromium ND 0.0025 0.010 0.100 U 089429-010 SW846 6020 Cobalt 0.000146 0.0001 0.001 NE B, J 0.00072U 089429-010 SW846 6020 Copper 0.000636 0.0003 0.001 NE J 089429-010 SW846 6020 Iron 0.149 0.010 0.100 NE B J 089429-010 SW846 6020 Lead ND 0.0005 0.002 NE U 089429-010 SW846 6020 Magnesium 14.2 0.005 0.015 NE 089429-010 SW846 6020 Manganese ND 0.001 0.005 NE U 089429-010 SW846 6020 Mercury ND 0.000066 0.0002 0.002 U 089429-010 SW846 7470 Nickel 0.0013 0.0005 0.002 NE J 089429-010 SW846 6020 Potassium 2.08 0.080 0.300 NE 089429-010 SW846 6020 Selenium 0.00134 0.001 0.005 0.050 J 089429-010 SW846 6020 Silver ND 0.0002 0.001 NE U 089429-010 SW846 6020 Sodium 26.9 0.080 0.250 NE 089429-010 SW846 6020 Thallium ND 0.0003 0.001 0.002 U 089429-010 SW846 6020 Uranium 0.0034 0.00005 0.0002 0.030 089429-010 SW846 6020 Vanadium ND 0.003 0.010 NE U 089429-010 SW846 6020 Zinc 0.00317 0.0026 0.010 NE J 089429-010 SW846 6020 Refer to footnotes on page 6A-49.

6A-20
AN
NU
AL
GR
OU
ND
WA
TE
R M
ON
ITO
RIN
G R
EP
OR
T, CA
LE
ND
AR
YE
AR
2010
Table 6A-6 (Continued) Summary of Total Metal Results,
Tijeras Arroyo Groundwater Investigation, Sandia National Laboratories/New Mexico
Calendar Year 2010
Well ID Analyte Resulta
(mg/L) MDLb (mg/L)
PQLc (mg/L)
MCLd (mg/L)
Laboratory Qualifiere
Validation Qualifierf Sample No. Analytical
Methodg TA1-W-02 Aluminum ND 0.010 0.030 NE U 089431-010 SW846 6020 21-Jul-10 Antimony ND 0.0005 0.003 0.006 U 089431-010 SW846 6020 Arsenic ND 0.0015 0.005 0.010 U 089431-010 SW846 6020 Barium 0.0478 0.0005 0.002 2.00 089431-010 SW846 6020 Beryllium ND 0.0001 0.0005 0.004 U 089431-010 SW846 6020 Cadmium ND 0.00011 0.001 0.005 U 089431-010 SW846 6020 Calcium 77.3 0.200 2.00 NE B 089431-010 SW846 6020 Chromium ND 0.0025 0.010 0.100 U 089431-010 SW846 6020 Cobalt ND 0.0001 0.001 NE U 089431-010 SW846 6020 Copper 0.000576 0.0003 0.001 NE J 089431-010 SW846 6020 Iron 0.119 0.010 0.100 NE 089431-010 SW846 6020 Lead ND 0.0005 0.002 NE U 089431-010 SW846 6020 Magnesium 13.6 0.005 0.015 NE 089431-010 SW846 6020 Manganese 0.00116 0.001 0.005 NE J 089431-010 SW846 6020 Mercury ND 0.000066 0.0002 0.002 U UJ 089431-010 SW846 7470 Nickel 0.00105 0.0005 0.002 NE J 089431-010 SW846 6020 Potassium 2.28 0.080 0.300 NE 089431-010 SW846 6020 Selenium 0.00136 0.001 0.005 0.050 B, J 0.0062U 089431-010 SW846 6020 Silver ND 0.0002 0.001 NE U 089431-010 SW846 6020 Sodium 24.4 0.080 0.250 NE 089431-010 SW846 6020 Thallium ND 0.0003 0.001 0.002 U 089431-010 SW846 6020 Uranium 0.00337 0.00005 0.0002 0.030 089431-010 SW846 6020 Vanadium 0.00336 0.003 0.010 NE J 089431-010 SW846 6020 Zinc 0.00377 0.0026 0.010 NE J 089431-010 SW846 6020 Refer to footnotes on page 6A-49.

TIJE
RA
S AR
RO
YO
GR
OU
ND
WA
TE
R
6A-21
Table 6A-6 (Continued) Summary of Total Metal Results,
Tijeras Arroyo Groundwater Investigation, Sandia National Laboratories/New Mexico
Calendar Year 2010
Well ID Analyte Resulta
(mg/L) MDLb (mg/L)
PQLc (mg/L)
MCLd (mg/L)
Laboratory Qualifiere
Validation Qualifierf Sample No. Analytical
Methodg TA1-W-03 Aluminum 0.0175 0.010 0.030 NE J 089435-010 SW846 6020 22-Jul-10 Antimony ND 0.0005 0.003 0.006 U 089435-010 SW846 6020 Arsenic ND 0.0015 0.005 0.010 U 089435-010 SW846 6020 Barium 0.027 0.0005 0.002 2.00 089435-010 SW846 6020 Beryllium ND 0.0001 0.0005 0.004 U 089435-010 SW846 6020 Cadmium ND 0.00011 0.001 0.005 U 089435-010 SW846 6020 Calcium 306 0.200 2.00 NE B 089435-010 SW846 6020 Chromium ND 0.0025 0.010 0.100 U 089435-010 SW846 6020 Cobalt 0.000175 0.0001 0.001 NE J 089435-010 SW846 6020 Copper 0.00164 0.0003 0.001 NE 0.011U 089435-010 SW846 6020 Iron 0.458 0.010 0.100 NE 089435-010 SW846 6020 Lead ND 0.0005 0.002 NE U 089435-010 SW846 6020 Magnesium 33.4 0.005 0.015 NE 089435-010 SW846 6020 Manganese ND 0.001 0.005 NE U 089435-010 SW846 6020 Mercury ND 0.000066 0.0002 0.002 U UJ 089435-010 SW846 7470 Nickel 0.00298 0.0005 0.002 NE 0.0069U 089435-010 SW846 6020 Potassium 2.74 0.080 0.300 NE 089435-010 SW846 6020 Selenium 0.0304 0.001 0.005 0.050 B 089435-010 SW846 6020 Silver ND 0.0002 0.001 NE U 089435-010 SW846 6020 Sodium 50.0 0.080 0.250 NE 089435-010 SW846 6020 Thallium ND 0.0003 0.001 0.002 U 089435-010 SW846 6020 Uranium 0.00122 0.00005 0.0002 0.030 089435-010 SW846 6020 Vanadium ND 0.003 0.010 NE U 089435-010 SW846 6020 Zinc 0.00372 0.0026 0.010 NE J 0.016U 089435-010 SW846 6020 Refer to footnotes on page 6A-49.

6A-22
AN
NU
AL
GR
OU
ND
WA
TE
R M
ON
ITO
RIN
G R
EP
OR
T, CA
LE
ND
AR
YE
AR
2010
Table 6A-6 (Continued) Summary of Total Metal Results,
Tijeras Arroyo Groundwater Investigation, Sandia National Laboratories/New Mexico
Calendar Year 2010
Well ID Analyte Resulta
(mg/L) MDLb (mg/L)
PQLc (mg/L)
MCLd (mg/L)
Laboratory Qualifiere
Validation Qualifierf Sample No. Analytical
Methodg TA1-W-03 (Duplicate) Aluminum ND 0.010 0.030 NE U 089436-010 SW846 6020 22-Jul-10 Antimony ND 0.0005 0.003 0.006 U 089436-010 SW846 6020 Arsenic ND 0.0015 0.005 0.010 U 089436-010 SW846 6020 Barium 0.0267 0.0005 0.002 2.00 089436-010 SW846 6020 Beryllium ND 0.0001 0.0005 0.004 U 089436-010 SW846 6020 Cadmium ND 0.00011 0.001 0.005 U 089436-010 SW846 6020 Calcium 281 0.200 2.00 NE B 089436-010 SW846 6020 Chromium ND 0.0025 0.010 0.100 U 089436-010 SW846 6020 Cobalt 0.000154 0.0001 0.001 NE J 089436-010 SW846 6020 Copper 0.00148 0.0003 0.001 NE 0.011U 089436-010 SW846 6020 Iron 0.455 0.010 0.100 NE 089436-010 SW846 6020 Lead ND 0.0005 0.002 NE U 089436-010 SW846 6020 Magnesium 34.4 0.005 0.015 NE 089436-010 SW846 6020 Manganese ND 0.001 0.005 NE U 089436-010 SW846 6020 Mercury ND 0.000066 0.0002 0.002 U UJ 089436-010 SW846 7470 Nickel 0.00293 0.0005 0.002 NE 0.0069U 089436-010 SW846 6020 Potassium 2.82 0.080 0.300 NE 089436-010 SW846 6020 Selenium 0.0302 0.001 0.005 0.050 B 089436-010 SW846 6020 Silver ND 0.0002 0.001 NE U 089436-010 SW846 6020 Sodium 49.0 0.080 0.250 NE 089436-010 SW846 6020 Thallium ND 0.0003 0.001 0.002 U 089436-010 SW846 6020 Uranium 0.00123 0.00005 0.0002 0.030 089436-010 SW846 6020 Vanadium ND 0.003 0.010 NE U 089436-010 SW846 6020 Zinc 0.00312 0.0026 0.010 NE J 0.016U 089436-010 SW846 6020 Refer to footnotes on page 6A-49.

TIJE
RA
S AR
RO
YO
GR
OU
ND
WA
TE
R
6A-23
Table 6A-6 (Continued) Summary of Total Metal Results,
Tijeras Arroyo Groundwater Investigation, Sandia National Laboratories/New Mexico
Calendar Year 2010
Well ID Analyte Resulta
(mg/L) MDLb (mg/L)
PQLc (mg/L)
MCLd (mg/L)
Laboratory Qualifiere
Validation Qualifierf Sample No. Analytical
Methodg TA1-W-04 Aluminum ND 0.010 0.030 NE U 089438-010 SW846 6020 23-Jul-10 Antimony ND 0.0005 0.003 0.006 U 089438-010 SW846 6020 Arsenic ND 0.0015 0.005 0.010 U 089438-010 SW846 6020 Barium 0.0505 0.0005 0.002 2.00 089438-010 SW846 6020 Beryllium ND 0.0001 0.0005 0.004 U 089438-010 SW846 6020 Cadmium ND 0.00011 0.001 0.005 U 089438-010 SW846 6020 Calcium 65.2 0.100 1.00 NE B 089438-010 SW846 6020 Chromium ND 0.0025 0.010 0.100 U 089438-010 SW846 6020 Cobalt ND 0.0001 0.001 NE U 089438-010 SW846 6020 Copper 0.000737 0.0003 0.001 NE J 089438-010 SW846 6020 Iron 0.243 0.010 0.100 NE 089438-010 SW846 6020 Lead ND 0.0005 0.002 NE U 089438-010 SW846 6020 Magnesium 10.6 0.005 0.015 NE 089438-010 SW846 6020 Manganese 0.00104 0.001 0.005 NE J 089438-010 SW846 6020 Mercury ND 0.000066 0.0002 0.002 U 089438-010 SW846 7470 Nickel 0.00116 0.0005 0.002 NE J 089438-010 SW846 6020 Potassium 2.01 0.080 0.300 NE 089438-010 SW846 6020 Selenium ND 0.001 0.005 0.050 U UJ 089438-010 SW846 6020 Silver ND 0.0002 0.001 NE U 089438-010 SW846 6020 Sodium 22.2 0.080 0.250 NE 089438-010 SW846 6020 Thallium 0.000512 0.0003 0.001 0.002 J 0.0034U 089438-010 SW846 6020 Uranium 0.00322 0.00005 0.0002 0.030 089438-010 SW846 6020 Vanadium ND 0.003 0.010 NE U 089438-010 SW846 6020 Zinc 0.00323 0.0026 0.010 NE J 089438-010 SW846 6020 Refer to footnotes on page 6A-49.

6A-24
AN
NU
AL
GR
OU
ND
WA
TE
R M
ON
ITO
RIN
G R
EP
OR
T, CA
LE
ND
AR
YE
AR
2010
Table 6A-6 (Continued) Summary of Total Metal Results,
Tijeras Arroyo Groundwater Investigation, Sandia National Laboratories/New Mexico
Calendar Year 2010
Well ID Analyte Resulta
(mg/L) MDLb (mg/L)
PQLc (mg/L)
MCLd (mg/L)
Laboratory Qualifiere
Validation Qualifierf Sample No. Analytical
Methodg TA1-W-05 Aluminum ND 0.010 0.030 NE U 089440-010 SW846 6020 26-Jul-10 Antimony ND 0.0005 0.003 0.006 U 089440-010 SW846 6020 Arsenic ND 0.0015 0.005 0.010 U 089440-010 SW846 6020 Barium 0.0371 0.0005 0.002 2.00 089440-010 SW846 6020 Beryllium ND 0.0001 0.0005 0.004 U 089440-010 SW846 6020 Cadmium ND 0.00011 0.001 0.005 U 089440-010 SW846 6020 Calcium 83.9 0.100 1.00 NE B 089440-010 SW846 6020 Chromium ND 0.0025 0.010 0.100 U 089440-010 SW846 6020 Cobalt 0.000116 0.0001 0.001 NE J 089440-010 SW846 6020 Copper 0.00091 0.0003 0.001 NE J 089440-010 SW846 6020 Iron 0.310 0.010 0.100 NE 089440-010 SW846 6020 Lead ND 0.0005 0.002 NE U 089440-010 SW846 6020 Magnesium 12.1 0.005 0.015 NE 089440-010 SW846 6020 Manganese ND 0.001 0.005 NE U 089440-010 SW846 6020 Mercury ND 0.000066 0.0002 0.002 U 089440-010 SW846 7470 Nickel 0.00142 0.0005 0.002 NE J 089440-010 SW846 6020 Potassium 2.25 0.080 0.300 NE 089440-010 SW846 6020 Selenium ND 0.001 0.005 0.050 U UJ 089440-010 SW846 6020 Silver ND 0.0002 0.001 NE U 089440-010 SW846 6020 Sodium 29.4 0.080 0.250 NE 089440-010 SW846 6020 Thallium ND 0.0003 0.001 0.002 U 089440-010 SW846 6020 Uranium 0.00401 0.00005 0.0002 0.030 089440-010 SW846 6020 Vanadium ND 0.003 0.010 NE U 089440-010 SW846 6020 Zinc 0.0057 0.0026 0.010 NE J 089440-010 SW846 6020 Refer to footnotes on page 6A-49.

TIJE
RA
S AR
RO
YO
GR
OU
ND
WA
TE
R
6A-25
Table 6A-6 (Continued) Summary of Total Metal Results,
Tijeras Arroyo Groundwater Investigation, Sandia National Laboratories/New Mexico
Calendar Year 2010
Well ID Analyte Resulta
(mg/L) MDLb (mg/L)
PQLc (mg/L)
MCLd (mg/L)
Laboratory Qualifiere
Validation Qualifierf Sample No. Analytical
Methodg TA1-W-06 Aluminum ND 0.010 0.030 NE U 089442-010 SW846 6020 27-Jul-10 Antimony ND 0.0005 0.003 0.006 U 089442-010 SW846 6020 Arsenic ND 0.0015 0.005 0.010 U 089442-010 SW846 6020 Barium 0.0266 0.0005 0.002 2.00 089442-010 SW846 6020 Beryllium ND 0.0001 0.0005 0.004 U 089442-010 SW846 6020 Cadmium ND 0.00011 0.001 0.005 U 089442-010 SW846 6020 Calcium 128 0.100 1.00 NE B 089442-010 SW846 6020 Chromium ND 0.0025 0.010 0.100 U 089442-010 SW846 6020 Cobalt 0.00019 0.0001 0.001 NE J J+ 089442-010 SW846 6020 Copper 0.00133 0.0003 0.001 NE 089442-010 SW846 6020 Iron 0.470 0.010 0.100 NE 089442-010 SW846 6020 Lead ND 0.0005 0.002 NE U 089442-010 SW846 6020 Magnesium 16.8 0.005 0.015 NE 089442-010 SW846 6020 Manganese ND 0.001 0.005 NE U 089442-010 SW846 6020 Mercury ND 0.000066 0.0002 0.002 U 089442-010 SW846 7470 Nickel 0.00216 0.0005 0.002 NE J+ 089442-010 SW846 6020 Potassium 2.24 0.080 0.300 NE 089442-010 SW846 6020 Selenium 0.00777 0.001 0.005 0.050 J- 089442-010 SW846 6020 Silver ND 0.0002 0.001 NE U 089442-010 SW846 6020 Sodium 32.3 0.080 0.250 NE 089442-010 SW846 6020 Thallium ND 0.0003 0.001 0.002 U 089442-010 SW846 6020 Uranium 0.00137 0.00005 0.0002 0.030 089442-010 SW846 6020 Vanadium ND 0.003 0.010 NE U 089442-010 SW846 6020 Zinc 0.00292 0.0026 0.010 NE J J+ 089442-010 SW846 6020 Refer to footnotes on page 6A-49.

6A-26
AN
NU
AL
GR
OU
ND
WA
TE
R M
ON
ITO
RIN
G R
EP
OR
T, CA
LE
ND
AR
YE
AR
2010
Table 6A-6 (Continued) Summary of Total Metal Results,
Tijeras Arroyo Groundwater Investigation, Sandia National Laboratories/New Mexico
Calendar Year 2010
Well ID Analyte Resulta
(mg/L) MDLb (mg/L)
PQLc (mg/L)
MCLd (mg/L)
Laboratory Qualifiere
Validation Qualifierf Sample No. Analytical
Methodg TA1-W-08 Aluminum ND 0.010 0.030 NE U 089444-010 SW846 6020 28-Jul-10 Antimony ND 0.0005 0.003 0.006 U 089444-010 SW846 6020 Arsenic ND 0.0015 0.005 0.010 U 089444-010 SW846 6020 Barium 0.0196 0.0005 0.002 2.00 089444-010 SW846 6020 Beryllium ND 0.0001 0.0005 0.004 U 089444-010 SW846 6020 Cadmium ND 0.00011 0.001 0.005 U 089444-010 SW846 6020 Calcium 334 0.200 2.00 NE B 089444-010 SW846 6020 Chromium 0.00346 0.0025 0.010 0.100 J 089444-010 SW846 6020 Cobalt 0.000588 0.0001 0.001 NE J J+ 089444-010 SW846 6020 Copper 0.00405 0.0003 0.001 NE 089444-010 SW846 6020 Iron 1.41 0.010 0.100 NE 089444-010 SW846 6020 Lead ND 0.0005 0.002 NE U 089444-010 SW846 6020 Magnesium 40.1 0.005 0.015 NE 089444-010 SW846 6020 Manganese ND 0.001 0.005 NE U 089444-010 SW846 6020 Mercury ND 0.000066 0.0002 0.002 U 089444-010 SW846 7470 Nickel 0.00717 0.0005 0.002 NE J+ 089444-010 SW846 6020 Potassium 2.97 0.080 0.300 NE 089444-010 SW846 6020 Selenium 0.0275 0.001 0.005 0.050 J- 089444-010 SW846 6020 Silver ND 0.0002 0.001 NE U 089444-010 SW846 6020 Sodium 83.1 0.800 2.50 NE 089444-010 SW846 6020 Thallium ND 0.0003 0.001 0.002 U 089444-010 SW846 6020 Uranium 0.00215 0.00005 0.0002 0.030 089444-010 SW846 6020 Vanadium ND 0.003 0.010 NE U 089444-010 SW846 6020 Zinc 0.00533 0.0026 0.010 NE J J+ 089444-010 SW846 6020 Refer to footnotes on page 6A-49.

TIJE
RA
S AR
RO
YO
GR
OU
ND
WA
TE
R
6A-27
Table 6A-6 (Continued) Summary of Total Metal Results,
Tijeras Arroyo Groundwater Investigation, Sandia National Laboratories/New Mexico
Calendar Year 2010
Well ID Analyte Resulta
(mg/L) MDLb (mg/L)
PQLc (mg/L)
MCLd (mg/L)
Laboratory Qualifiere
Validation Qualifierf Sample No. Analytical
Methodg TA2-NW1-595 Aluminum ND 0.010 0.030 NE U 089453-010 SW846 6020 03-Aug-10 Antimony 0.000638 0.0005 0.003 0.006 J 089453-010 SW846 6020 Arsenic ND 0.0015 0.005 0.010 U 089453-010 SW846 6020 Barium 0.0424 0.0005 0.002 2.00 089453-010 SW846 6020 Beryllium ND 0.0001 0.0005 0.004 U 089453-010 SW846 6020 Cadmium ND 0.00011 0.001 0.005 U 089453-010 SW846 6020 Calcium 104 0.200 2.00 NE 089453-010 SW846 6020 Chromium ND 0.0025 0.010 0.100 U 089453-010 SW846 6020 Cobalt 0.000116 0.0001 0.001 NE J J+ 089453-010 SW846 6020 Copper 0.000636 0.0003 0.001 NE J J+ 089453-010 SW846 6020 Iron 0.215 0.010 0.100 NE 089453-010 SW846 6020 Lead ND 0.0005 0.002 NE U 089453-010 SW846 6020 Magnesium 18.9 0.005 0.015 NE 089453-010 SW846 6020 Manganese ND 0.001 0.005 NE U 089453-010 SW846 6020 Mercury ND 0.000066 0.0002 0.002 U 089453-010 SW846 7470 Nickel 0.00296 0.0005 0.002 NE J+ 089453-010 SW846 6020 Potassium 2.37 0.080 0.300 NE 089453-010 SW846 6020 Selenium 0.00863 0.001 0.005 0.050 089453-010 SW846 6020 Silver ND 0.0002 0.001 NE U 089453-010 SW846 6020 Sodium 28.8 0.080 0.250 NE 089453-010 SW846 6020 Thallium ND 0.0003 0.001 0.002 U 089453-010 SW846 6020 Uranium 0.0022 0.00005 0.0002 0.030 089453-010 SW846 6020 Vanadium ND 0.003 0.010 NE U 089453-010 SW846 6020 Zinc ND 0.0026 0.010 NE U 089453-010 SW846 6020 Refer to footnotes on page 6A-49.
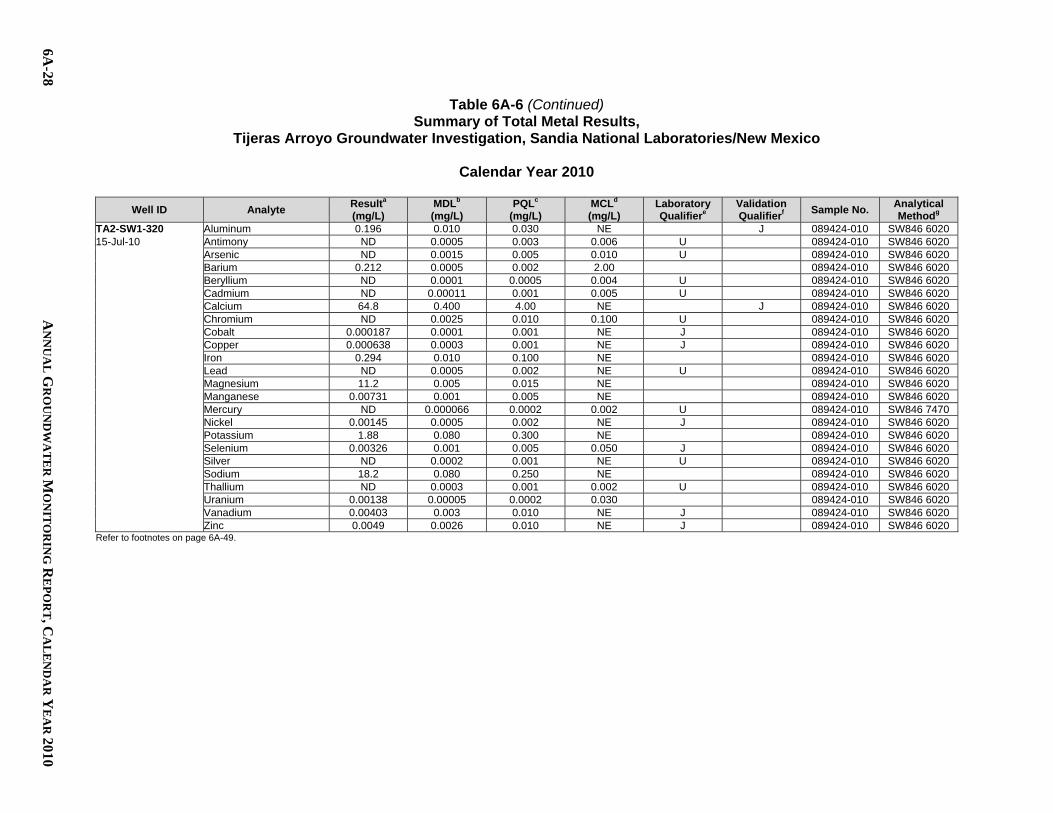
6A-28
AN
NU
AL
GR
OU
ND
WA
TE
R M
ON
ITO
RIN
G R
EP
OR
T, CA
LE
ND
AR
YE
AR
2010
Table 6A-6 (Continued) Summary of Total Metal Results,
Tijeras Arroyo Groundwater Investigation, Sandia National Laboratories/New Mexico
Calendar Year 2010
Well ID Analyte Resulta
(mg/L) MDLb (mg/L)
PQLc (mg/L)
MCLd (mg/L)
Laboratory Qualifiere
Validation Qualifierf Sample No. Analytical
Methodg TA2-SW1-320 Aluminum 0.196 0.010 0.030 NE J 089424-010 SW846 6020 15-Jul-10 Antimony ND 0.0005 0.003 0.006 U 089424-010 SW846 6020 Arsenic ND 0.0015 0.005 0.010 U 089424-010 SW846 6020 Barium 0.212 0.0005 0.002 2.00 089424-010 SW846 6020 Beryllium ND 0.0001 0.0005 0.004 U 089424-010 SW846 6020 Cadmium ND 0.00011 0.001 0.005 U 089424-010 SW846 6020 Calcium 64.8 0.400 4.00 NE J 089424-010 SW846 6020 Chromium ND 0.0025 0.010 0.100 U 089424-010 SW846 6020 Cobalt 0.000187 0.0001 0.001 NE J 089424-010 SW846 6020 Copper 0.000638 0.0003 0.001 NE J 089424-010 SW846 6020 Iron 0.294 0.010 0.100 NE 089424-010 SW846 6020 Lead ND 0.0005 0.002 NE U 089424-010 SW846 6020 Magnesium 11.2 0.005 0.015 NE 089424-010 SW846 6020 Manganese 0.00731 0.001 0.005 NE 089424-010 SW846 6020 Mercury ND 0.000066 0.0002 0.002 U 089424-010 SW846 7470 Nickel 0.00145 0.0005 0.002 NE J 089424-010 SW846 6020 Potassium 1.88 0.080 0.300 NE 089424-010 SW846 6020 Selenium 0.00326 0.001 0.005 0.050 J 089424-010 SW846 6020 Silver ND 0.0002 0.001 NE U 089424-010 SW846 6020 Sodium 18.2 0.080 0.250 NE 089424-010 SW846 6020 Thallium ND 0.0003 0.001 0.002 U 089424-010 SW846 6020 Uranium 0.00138 0.00005 0.0002 0.030 089424-010 SW846 6020 Vanadium 0.00403 0.003 0.010 NE J 089424-010 SW846 6020 Zinc 0.0049 0.0026 0.010 NE J 089424-010 SW846 6020 Refer to footnotes on page 6A-49.

TIJE
RA
S AR
RO
YO
GR
OU
ND
WA
TE
R
6A-29
Table 6A-6 (Continued) Summary of Total Metal Results,
Tijeras Arroyo Groundwater Investigation, Sandia National Laboratories/New Mexico
Calendar Year 2010
Well ID Analyte Resulta
(mg/L) MDLb (mg/L)
PQLc (mg/L)
MCLd (mg/L)
Laboratory Qualifiere
Validation Qualifierf Sample No. Analytical
Methodg TA2-W-01 Aluminum 0.505 0.010 0.030 NE 089460-010 SW846 6020 09-Aug-10 Antimony ND 0.0005 0.003 0.006 U 089460-010 SW846 6020 Arsenic 0.0041 0.0015 0.005 0.010 B, J 0.012U 089460-010 SW846 6020 Barium 0.123 0.0005 0.002 2.00 089460-010 SW846 6020 Beryllium ND 0.0001 0.0005 0.004 U 089460-010 SW846 6020 Cadmium ND 0.00011 0.001 0.005 U 089460-010 SW846 6020 Calcium 86.0 0.100 1.00 NE B 089460-010 SW846 6020 Chromium ND 0.0025 0.010 0.100 U 089460-010 SW846 6020 Cobalt 0.00025 0.0001 0.001 NE B, J 0.00072U 089460-010 SW846 6020 Copper 0.00115 0.0003 0.001 NE 089460-010 SW846 6020 Iron 0.819 0.010 0.100 NE B J 089460-010 SW846 6020 Lead ND 0.0005 0.002 NE U 089460-010 SW846 6020 Magnesium 12.8 0.005 0.015 NE 089460-010 SW846 6020 Manganese 0.0127 0.001 0.005 NE 089460-010 SW846 6020 Mercury ND 0.000066 0.0002 0.002 U 089460-010 SW846 7470 Nickel 0.00206 0.0005 0.002 NE 089460-010 SW846 6020 Potassium 1.89 0.080 0.300 NE 089460-010 SW846 6020 Selenium 0.00653 0.001 0.005 0.050 089460-010 SW846 6020 Silver ND 0.0002 0.001 NE U 089460-010 SW846 6020 Sodium 20.3 0.080 0.250 NE 089460-010 SW846 6020 Thallium ND 0.0003 0.001 0.002 U 089460-010 SW846 6020 Uranium 0.000942 0.00005 0.0002 0.030 089460-010 SW846 6020 Vanadium ND 0.003 0.010 NE U 089460-010 SW846 6020 Zinc 0.00389 0.0026 0.010 NE J 089460-010 SW846 6020 Refer to footnotes on page 6A-49.
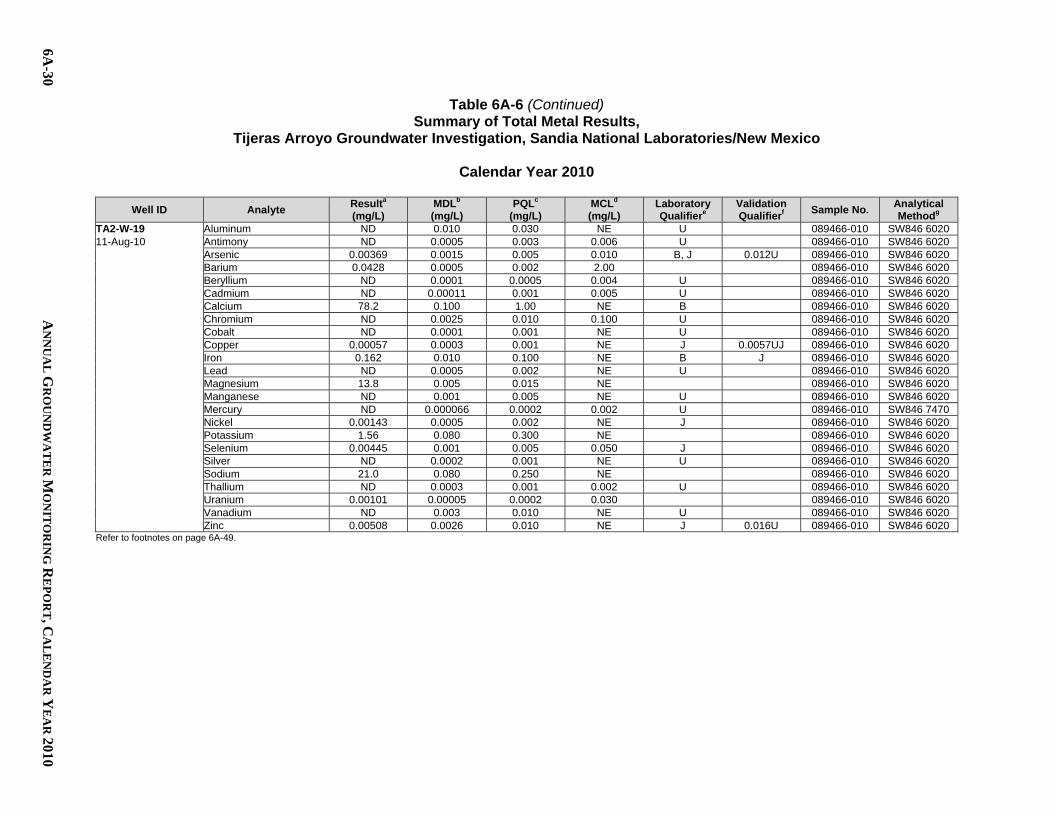
6A-30
AN
NU
AL
GR
OU
ND
WA
TE
R M
ON
ITO
RIN
G R
EP
OR
T, CA
LE
ND
AR
YE
AR
2010
Table 6A-6 (Continued) Summary of Total Metal Results,
Tijeras Arroyo Groundwater Investigation, Sandia National Laboratories/New Mexico
Calendar Year 2010
Well ID Analyte Resulta
(mg/L) MDLb (mg/L)
PQLc (mg/L)
MCLd (mg/L)
Laboratory Qualifiere
Validation Qualifierf Sample No. Analytical
Methodg TA2-W-19 Aluminum ND 0.010 0.030 NE U 089466-010 SW846 6020 11-Aug-10 Antimony ND 0.0005 0.003 0.006 U 089466-010 SW846 6020 Arsenic 0.00369 0.0015 0.005 0.010 B, J 0.012U 089466-010 SW846 6020 Barium 0.0428 0.0005 0.002 2.00 089466-010 SW846 6020 Beryllium ND 0.0001 0.0005 0.004 U 089466-010 SW846 6020 Cadmium ND 0.00011 0.001 0.005 U 089466-010 SW846 6020 Calcium 78.2 0.100 1.00 NE B 089466-010 SW846 6020 Chromium ND 0.0025 0.010 0.100 U 089466-010 SW846 6020 Cobalt ND 0.0001 0.001 NE U 089466-010 SW846 6020 Copper 0.00057 0.0003 0.001 NE J 0.0057UJ 089466-010 SW846 6020 Iron 0.162 0.010 0.100 NE B J 089466-010 SW846 6020 Lead ND 0.0005 0.002 NE U 089466-010 SW846 6020 Magnesium 13.8 0.005 0.015 NE 089466-010 SW846 6020 Manganese ND 0.001 0.005 NE U 089466-010 SW846 6020 Mercury ND 0.000066 0.0002 0.002 U 089466-010 SW846 7470 Nickel 0.00143 0.0005 0.002 NE J 089466-010 SW846 6020 Potassium 1.56 0.080 0.300 NE 089466-010 SW846 6020 Selenium 0.00445 0.001 0.005 0.050 J 089466-010 SW846 6020 Silver ND 0.0002 0.001 NE U 089466-010 SW846 6020 Sodium 21.0 0.080 0.250 NE 089466-010 SW846 6020 Thallium ND 0.0003 0.001 0.002 U 089466-010 SW846 6020 Uranium 0.00101 0.00005 0.0002 0.030 089466-010 SW846 6020 Vanadium ND 0.003 0.010 NE U 089466-010 SW846 6020 Zinc 0.00508 0.0026 0.010 NE J 0.016U 089466-010 SW846 6020 Refer to footnotes on page 6A-49.

TIJE
RA
S AR
RO
YO
GR
OU
ND
WA
TE
R
6A-31
Table 6A-6 (Continued) Summary of Total Metal Results,
Tijeras Arroyo Groundwater Investigation, Sandia National Laboratories/New Mexico
Calendar Year 2010
Well ID Analyte Resulta
(mg/L) MDLb (mg/L)
PQLc (mg/L)
MCLd (mg/L)
Laboratory Qualifiere
Validation Qualifierf Sample No. Analytical
Methodg TA2-W-19 (Duplicate) Aluminum ND 0.010 0.030 NE U 089467-010 SW846 6020 11-Aug-10 Antimony ND 0.0005 0.003 0.006 U 089467-010 SW846 6020 Arsenic 0.0042 0.0015 0.005 0.010 B, J 0.012U 089467-010 SW846 6020 Barium 0.0438 0.0005 0.002 2.00 089467-010 SW846 6020 Beryllium ND 0.0001 0.0005 0.004 U 089467-010 SW846 6020 Cadmium ND 0.00011 0.001 0.005 U 089467-010 SW846 6020 Calcium 78.5 0.100 1.00 NE B 089467-010 SW846 6020 Chromium ND 0.0025 0.010 0.100 U 089467-010 SW846 6020 Cobalt ND 0.0001 0.001 NE U 089467-010 SW846 6020 Copper 0.000528 0.0003 0.001 NE J 0.0057UJ 089467-010 SW846 6020 Iron 0.152 0.010 0.100 NE B J 089467-010 SW846 6020 Lead ND 0.0005 0.002 NE U 089467-010 SW846 6020 Magnesium 13.0 0.005 0.015 NE 089467-010 SW846 6020 Manganese ND 0.001 0.005 NE U 089467-010 SW846 6020 Mercury ND 0.000066 0.0002 0.002 U 089467-010 SW846 7470 Nickel 0.00139 0.0005 0.002 NE J 089467-010 SW846 6020 Potassium 1.62 0.080 0.300 NE 089467-010 SW846 6020 Selenium 0.00413 0.001 0.005 0.050 J 089467-010 SW846 6020 Silver ND 0.0002 0.001 NE U 089467-010 SW846 6020 Sodium 20.5 0.080 0.250 NE 089467-010 SW846 6020 Thallium ND 0.0003 0.001 0.002 U 089467-010 SW846 6020 Uranium 0.00105 0.00005 0.0002 0.030 089467-010 SW846 6020 Vanadium ND 0.003 0.010 NE U 089467-010 SW846 6020 Zinc 0.00372 0.0026 0.010 NE J 0.016U 089467-010 SW846 6020 Refer to footnotes on page 6A-49.

6A-32
AN
NU
AL
GR
OU
ND
WA
TE
R M
ON
ITO
RIN
G R
EP
OR
T, CA
LE
ND
AR
YE
AR
2010
Table 6A-6 (Continued) Summary of Total Metal Results,
Tijeras Arroyo Groundwater Investigation, Sandia National Laboratories/New Mexico
Calendar Year 2010
Well ID Analyte Resulta
(mg/L) MDLb (mg/L)
PQLc (mg/L)
MCLd (mg/L)
Laboratory Qualifiere
Validation Qualifierf Sample No. Analytical
Methodg TA2-W-26 Aluminum 0.0109 0.010 0.030 NE J 089462-010 SW846 6020 10-Aug-10 Antimony ND 0.0005 0.003 0.006 U 089462-010 SW846 6020 Arsenic 0.00345 0.0015 0.005 0.010 B, J 0.012U 089462-010 SW846 6020 Barium 0.0653 0.0005 0.002 2.00 089462-010 SW846 6020 Beryllium ND 0.0001 0.0005 0.004 U 089462-010 SW846 6020 Cadmium ND 0.00011 0.001 0.005 U UJ 089462-010 SW846 6020 Calcium 198 0.100 1.00 NE B 089462-010 SW846 6020 Chromium ND 0.0025 0.010 0.100 U 089462-010 SW846 6020 Cobalt 0.00021 0.0001 0.001 NE B, J 0.00072U 089462-010 SW846 6020 Copper 0.00241 0.0003 0.001 NE J+ 089462-010 SW846 6020 Iron 0.394 0.010 0.100 NE B J 089462-010 SW846 6020 Lead ND 0.0005 0.002 NE U 089462-010 SW846 6020 Magnesium 28.2 0.005 0.015 NE 089462-010 SW846 6020 Manganese ND 0.001 0.005 NE U 089462-010 SW846 6020 Mercury ND 0.000066 0.0002 0.002 U 089462-010 SW846 7470 Nickel 0.00299 0.0005 0.002 NE J+ 089462-010 SW846 6020 Potassium 2.30 0.080 0.300 NE 089462-010 SW846 6020 Selenium 0.0156 0.001 0.005 0.050 089462-010 SW846 6020 Silver ND 0.0002 0.001 NE U 089462-010 SW846 6020 Sodium 34.1 0.080 0.250 NE 089462-010 SW846 6020 Thallium ND 0.0003 0.001 0.002 U 089462-010 SW846 6020 Uranium 0.0011 0.00005 0.0002 0.030 089462-010 SW846 6020 Vanadium ND 0.003 0.010 NE U 089462-010 SW846 6020 Zinc 0.00301 0.0026 0.010 NE J J+ 089462-010 SW846 6020 Refer to footnotes on page 6A-49.

TIJE
RA
S AR
RO
YO
GR
OU
ND
WA
TE
R
6A-33
Table 6A-6 (Continued) Summary of Total Metal Results,
Tijeras Arroyo Groundwater Investigation, Sandia National Laboratories/New Mexico
Calendar Year 2010
Well ID Analyte Resulta
(mg/L) MDLb (mg/L)
PQLc (mg/L)
MCLd (mg/L)
Laboratory Qualifiere
Validation Qualifierf Sample No. Analytical
Methodg TA2-W-27 Aluminum ND 0.010 0.030 NE U 089456-010 SW846 6020 04-Aug-10 Antimony ND 0.0005 0.003 0.006 U 089456-010 SW846 6020 Arsenic 0.00151 0.0015 0.005 0.010 J 089456-010 SW846 6020 Barium 0.0579 0.0005 0.002 2.00 089456-010 SW846 6020 Beryllium ND 0.0001 0.0005 0.004 U 089456-010 SW846 6020 Cadmium ND 0.00011 0.001 0.005 U 089456-010 SW846 6020 Calcium 119 0.200 2.00 NE 089456-010 SW846 6020 Chromium ND 0.0025 0.010 0.100 U 089456-010 SW846 6020 Cobalt 0.00013 0.0001 0.001 NE J J+ 089456-010 SW846 6020 Copper 0.000847 0.0003 0.001 NE J J+ 089456-010 SW846 6020 Iron 0.256 0.010 0.100 NE 089456-010 SW846 6020 Lead ND 0.0005 0.002 NE U 089456-010 SW846 6020 Magnesium 19.4 0.005 0.015 NE 089456-010 SW846 6020 Manganese ND 0.001 0.005 NE U 089456-010 SW846 6020 Mercury ND 0.000066 0.0002 0.002 U 089456-010 SW846 7470 Nickel 0.00349 0.0005 0.002 NE J+ 089456-010 SW846 6020 Potassium 2.07 0.080 0.300 NE 089456-010 SW846 6020 Selenium 0.010 0.001 0.005 0.050 089456-010 SW846 6020 Silver ND 0.0002 0.001 NE U 089456-010 SW846 6020 Sodium 29.2 0.080 0.250 NE 089456-010 SW846 6020 Thallium ND 0.0003 0.001 0.002 U 089456-010 SW846 6020 Uranium 0.00113 0.00005 0.0002 0.030 089456-010 SW846 6020 Vanadium 0.00306 0.003 0.010 NE J 089456-010 SW846 6020 Zinc 0.00292 0.0026 0.010 NE J J+ 089456-010 SW846 6020 Refer to footnotes on page 6A-49.

6A-34
AN
NU
AL
GR
OU
ND
WA
TE
R M
ON
ITO
RIN
G R
EP
OR
T, CA
LE
ND
AR
YE
AR
2010
Table 6A-6 (Continued) Summary of Total Metal Results,
Tijeras Arroyo Groundwater Investigation, Sandia National Laboratories/New Mexico
Calendar Year 2010
Well ID Analyte Resulta
(mg/L) MDLb (mg/L)
PQLc (mg/L)
MCLd (mg/L)
Laboratory Qualifiere
Validation Qualifierf Sample No. Analytical
Methodg TJA-2 Aluminum ND 0.010 0.030 NE U 089469-010 SW846 6020 12-Aug-10 Antimony ND 0.0005 0.003 0.006 U 089469-010 SW846 6020 Arsenic 0.00375 0.0015 0.005 0.010 B, J 0.012U 089469-010 SW846 6020 Barium 0.0415 0.0005 0.002 2.00 089469-010 SW846 6020 Beryllium ND 0.0001 0.0005 0.004 U 089469-010 SW846 6020 Cadmium ND 0.00011 0.001 0.005 U 089469-010 SW846 6020 Calcium 145 0.100 1.00 NE B 089469-010 SW846 6020 Chromium ND 0.0025 0.010 0.100 U 089469-010 SW846 6020 Cobalt ND 0.0001 0.001 NE U 089469-010 SW846 6020 Copper 0.000524 0.0003 0.001 NE J 089469-010 SW846 6020 Iron 0.153 0.010 0.100 NE B J 089469-010 SW846 6020 Lead ND 0.0005 0.002 NE U 089469-010 SW846 6020 Magnesium 13.3 0.005 0.015 NE 089469-010 SW846 6020 Manganese ND 0.001 0.005 NE U 089469-010 SW846 6020 Mercury ND 0.000066 0.0002 0.002 U 089469-010 SW846 7470 Nickel 0.00133 0.0005 0.002 NE J 089469-010 SW846 6020 Potassium 1.70 0.080 0.300 NE 089469-010 SW846 6020 Selenium 0.00383 0.001 0.005 0.050 J 089469-010 SW846 6020 Silver ND 0.0002 0.001 NE U 089469-010 SW846 6020 Sodium 21.0 0.080 0.250 NE 089469-010 SW846 6020 Thallium ND 0.0003 0.001 0.002 U 089469-010 SW846 6020 Uranium 0.00125 0.00005 0.0002 0.030 089469-010 SW846 6020 Vanadium ND 0.003 0.010 NE U 089469-010 SW846 6020 Zinc ND 0.0026 0.010 NE U 089469-010 SW846 6020 Refer to footnotes on page 6A-49.

TIJE
RA
S AR
RO
YO
GR
OU
ND
WA
TE
R
6A-35
Table 6A-6 (Continued) Summary of Total Metal Results,
Tijeras Arroyo Groundwater Investigation, Sandia National Laboratories/New Mexico
Calendar Year 2010
Well ID Analyte Resulta
(mg/L) MDLb (mg/L)
PQLc (mg/L)
MCLd (mg/L)
Laboratory Qualifiere
Validation Qualifierf Sample No. Analytical
Methodg TJA-3 Aluminum ND 0.010 0.030 NE U 089448-010 SW846 6020 29-Jul-10 Antimony ND 0.0005 0.003 0.006 U 089448-010 SW846 6020 Arsenic ND 0.0015 0.005 0.010 U 089448-010 SW846 6020 Barium 0.0441 0.0005 0.002 2.00 089448-010 SW846 6020 Beryllium ND 0.0001 0.0005 0.004 U 089448-010 SW846 6020 Cadmium ND 0.00011 0.001 0.005 U 089448-010 SW846 6020 Calcium 73.3 0.100 1.00 NE B 089448-010 SW846 6020 Chromium ND 0.0025 0.010 0.100 U 089448-010 SW846 6020 Cobalt ND 0.0001 0.001 NE U 089448-010 SW846 6020 Copper 0.00152 0.0003 0.001 NE 0.0067UJ 089448-010 SW846 6020 Iron 0.248 0.010 0.100 NE 089448-010 SW846 6020 Lead ND 0.0005 0.002 NE U 089448-010 SW846 6020 Magnesium 12.4 0.025 0.075 NE 089448-010 SW846 6020 Manganese ND 0.001 0.005 NE U 089448-010 SW846 6020 Mercury ND 0.000066 0.0002 0.002 U 089448-010 SW846 7470 Nickel 0.00133 0.0005 0.002 NE J 089448-010 SW846 6020 Potassium 1.84 0.080 0.300 NE 089448-010 SW846 6020 Selenium ND 0.001 0.005 0.050 U UJ 089448-010 SW846 6020 Silver ND 0.0002 0.001 NE U 089448-010 SW846 6020 Sodium 24.6 0.400 1.25 NE 089448-010 SW846 6020 Thallium ND 0.0003 0.001 0.002 U 089448-010 SW846 6020 Uranium 0.00288 0.00005 0.0002 0.030 089448-010 SW846 6020 Vanadium 0.00304 0.003 0.010 NE J 089448-010 SW846 6020 Zinc ND 0.0026 0.010 NE U 089448-010 SW846 6020 Refer to footnotes on page 6A-49.

6A-36
AN
NU
AL
GR
OU
ND
WA
TE
R M
ON
ITO
RIN
G R
EP
OR
T, CA
LE
ND
AR
YE
AR
2010
Table 6A-6 (Continued) Summary of Total Metal Results,
Tijeras Arroyo Groundwater Investigation, Sandia National Laboratories/New Mexico
Calendar Year 2010
Well ID Analyte Resulta
(mg/L) MDLb (mg/L)
PQLc (mg/L)
MCLd (mg/L)
Laboratory Qualifiere
Validation Qualifierf Sample No. Analytical
Methodg TJA-3 (Duplicate) Aluminum ND 0.010 0.030 NE U 089449-010 SW846 6020 23-Jul-10 Antimony ND 0.0005 0.003 0.006 U 089449-010 SW846 6020 Arsenic ND 0.0015 0.005 0.010 U 089449-010 SW846 6020 Barium 0.0387 0.0005 0.002 2.00 089449-010 SW846 6020 Beryllium ND 0.0001 0.0005 0.004 U 089449-010 SW846 6020 Cadmium ND 0.00011 0.001 0.005 U 089449-010 SW846 6020 Calcium 68.5 0.100 1.00 NE B 089449-010 SW846 6020 Chromium ND 0.0025 0.010 0.100 U 089449-010 SW846 6020 Cobalt ND 0.0001 0.001 NE U 089449-010 SW846 6020 Copper 0.000861 0.0003 0.001 NE J 0.0067UJ 089449-010 SW846 6020 Iron 0.241 0.010 0.100 NE 089449-010 SW846 6020 Lead ND 0.0005 0.002 NE U 089449-010 SW846 6020 Magnesium 11.3 0.025 0.075 NE 089449-010 SW846 6020 Manganese ND 0.001 0.005 NE U 089449-010 SW846 6020 Mercury ND 0.000066 0.0002 0.002 U 089449-010 SW846 7470 Nickel 0.00129 0.0005 0.002 NE J 089449-010 SW846 6020 Potassium 1.72 0.080 0.300 NE 089449-010 SW846 6020 Selenium ND 0.001 0.005 0.050 U UJ 089449-010 SW846 6020 Silver ND 0.0002 0.001 NE U 089449-010 SW846 6020 Sodium 23.8 0.400 1.25 NE 089449-010 SW846 6020 Thallium ND 0.0003 0.001 0.002 U 089449-010 SW846 6020 Uranium 0.0028 0.00005 0.0002 0.030 089449-010 SW846 6020 Vanadium 0.00328 0.003 0.010 NE J 089449-010 SW846 6020 Zinc 0.00295 0.0026 0.010 NE J 089449-010 SW846 6020 Refer to footnotes on page 6A-49.

TIJE
RA
S AR
RO
YO
GR
OU
ND
WA
TE
R
6A-37
Table 6A-6 (Continued) Summary of Total Metal Results,
Tijeras Arroyo Groundwater Investigation, Sandia National Laboratories/New Mexico
Calendar Year 2010
Well ID Analyte Resulta
(mg/L) MDLb (mg/L)
PQLc (mg/L)
MCLd (mg/L)
Laboratory Qualifiere
Validation Qualifierf Sample No. Analytical
Methodg TJA-4 Aluminum ND 0.010 0.030 NE U 089473-010 SW846 6020 17-Aug-10 Antimony ND 0.0005 0.003 0.006 U 089473-010 SW846 6020 Arsenic ND 0.0015 0.005 0.010 U 089473-010 SW846 6020 Barium 0.187 0.0025 0.010 2.00 089473-010 SW846 6020 Beryllium ND 0.0001 0.0005 0.004 U 089473-010 SW846 6020 Cadmium ND 0.00011 0.001 0.005 U 089473-010 SW846 6020 Calcium 70.1 0.200 2.00 NE B 089473-010 SW846 6020 Chromium 0.00302 0.0025 0.010 0.100 J 089473-010 SW846 6020 Cobalt 0.000149 0.0001 0.001 NE J 0.00062U 089473-010 SW846 6020 Copper 0.000874 0.0003 0.001 NE J 089473-010 SW846 6020 Iron 0.200 0.010 0.100 NE 089473-010 SW846 6020 Lead ND 0.0005 0.002 NE U 089473-010 SW846 6020 Magnesium 14.2 0.005 0.015 NE 089473-010 SW846 6020 Manganese ND 0.001 0.005 NE U 089473-010 SW846 6020 Mercury ND 0.000066 0.0002 0.002 U 089473-010 SW846 7470 Nickel 0.00216 0.0005 0.002 NE 089473-010 SW846 6020 Potassium 3.34 0.080 0.300 NE 089473-010 SW846 6020 Selenium 0.00342 0.001 0.005 0.050 J 089473-010 SW846 6020 Silver ND 0.0002 0.001 NE U 089473-010 SW846 6020 Sodium 25.9 0.080 0.250 NE 089473-010 SW846 6020 Thallium 0.00055 0.0003 0.001 0.002 J 0.0039U 089473-010 SW846 6020 Uranium 0.00298 0.00005 0.0002 0.030 089473-010 SW846 6020 Vanadium ND 0.003 0.010 NE U 089473-010 SW846 6020 Zinc ND 0.0026 0.010 NE U 089473-010 SW846 6020 Refer to footnotes on page 6A-49.

6A-38
AN
NU
AL
GR
OU
ND
WA
TE
R M
ON
ITO
RIN
G R
EP
OR
T, CA
LE
ND
AR
YE
AR
2010
Table 6A-6 (Continued) Summary of Total Metal Results,
Tijeras Arroyo Groundwater Investigation, Sandia National Laboratories/New Mexico
Calendar Year 2010
Well ID Analyte Resulta
(mg/L) MDLb (mg/L)
PQLc (mg/L)
MCLd (mg/L)
Laboratory Qualifiere
Validation Qualifierf Sample No. Analytical
Methodg TJA-6 Aluminum 0.0284 0.010 0.030 NE J 089458-010 SW846 6020 05-Aug-10 Antimony ND 0.0005 0.003 0.006 U 089458-010 SW846 6020 Arsenic ND 0.0015 0.005 0.010 U 089458-010 SW846 6020 Barium 0.0634 0.0005 0.002 2.00 089458-010 SW846 6020 Beryllium ND 0.0001 0.0005 0.004 U 089458-010 SW846 6020 Cadmium ND 0.00011 0.001 0.005 U 089458-010 SW846 6020 Calcium 64.8 0.100 1.00 NE 089458-010 SW846 6020 Chromium ND 0.0025 0.010 0.100 U 089458-010 SW846 6020 Cobalt ND 0.0001 0.001 NE U 089458-010 SW846 6020 Copper 0.000555 0.0003 0.001 NE J 089458-010 SW846 6020 Iron 0.165 0.010 0.100 NE 089458-010 SW846 6020 Lead ND 0.0005 0.002 NE U 089458-010 SW846 6020 Magnesium 13.6 0.005 0.015 NE 089458-010 SW846 6020 Manganese 0.00108 0.001 0.005 NE J 089458-010 SW846 6020 Mercury ND 0.000066 0.0002 0.002 U 089458-010 SW846 7470 Nickel 0.00191 0.0005 0.002 NE J 089458-010 SW846 6020 Potassium 2.33 0.080 0.300 NE 089458-010 SW846 6020 Selenium 0.00106 0.001 0.005 0.050 J 089458-010 SW846 6020 Silver ND 0.0002 0.001 NE U 089458-010 SW846 6020 Sodium 23.0 0.080 0.250 NE 089458-010 SW846 6020 Thallium ND 0.0003 0.001 0.002 U 089458-010 SW846 6020 Uranium 0.00305 0.00005 0.0002 0.030 089458-010 SW846 6020 Vanadium ND 0.003 0.010 NE U 089458-010 SW846 6020 Zinc ND 0.0026 0.010 NE U 089458-010 SW846 6020 Refer to footnotes on page 6A-49.

TIJE
RA
S AR
RO
YO
GR
OU
ND
WA
TE
R
6A-39
Table 6A-6 (Continued) Summary of Total Metal Results,
Tijeras Arroyo Groundwater Investigation, Sandia National Laboratories/New Mexico
Calendar Year 2010
Well ID Analyte Resulta
(mg/L) MDLb (mg/L)
PQLc (mg/L)
MCLd (mg/L)
Laboratory Qualifiere
Validation Qualifierf Sample No. Analytical
Methodg TJA-7 Aluminum 0.115 0.010 0.030 NE 089475-010 SW846 6020 18-Aug-10 Antimony ND 0.0005 0.003 0.006 U 089475-010 SW846 6020 Arsenic ND 0.0015 0.005 0.010 U 089475-010 SW846 6020 Barium 0.232 0.0025 0.010 2.00 089475-010 SW846 6020 Beryllium ND 0.0001 0.0005 0.004 U 089475-010 SW846 6020 Cadmium ND 0.00011 0.001 0.005 U 089475-010 SW846 6020 Calcium 73.4 0.200 2.00 NE B 089475-010 SW846 6020 Chromium 0.00306 0.0025 0.010 0.100 J 089475-010 SW846 6020 Cobalt 0.000686 0.0001 0.001 NE J 089475-010 SW846 6020 Copper 0.000593 0.0003 0.001 NE J 089475-010 SW846 6020 Iron 0.267 0.010 0.100 NE 089475-010 SW846 6020 Lead ND 0.0005 0.002 NE U 089475-010 SW846 6020 Magnesium 13.1 0.005 0.015 NE 089475-010 SW846 6020 Manganese 0.00198 0.001 0.005 NE J 089475-010 SW846 6020 Mercury ND 0.000066 0.0002 0.002 U 089475-010 SW846 7470 Nickel 0.00217 0.0005 0.002 NE 089475-010 SW846 6020 Potassium 2.16 0.080 0.300 NE 089475-010 SW846 6020 Selenium 0.00555 0.001 0.005 0.050 089475-010 SW846 6020 Silver ND 0.0002 0.001 NE U 089475-010 SW846 6020 Sodium 19.5 0.080 0.250 NE 089475-010 SW846 6020 Thallium ND 0.0003 0.001 0.002 U 089475-010 SW846 6020 Uranium 0.00176 0.00005 0.0002 0.030 089475-010 SW846 6020 Vanadium ND 0.003 0.010 NE U 089475-010 SW846 6020 Zinc ND 0.0026 0.010 NE U 089475-010 SW846 6020 Refer to footnotes on page 6A-49.

6A-40
AN
NU
AL
GR
OU
ND
WA
TE
R M
ON
ITO
RIN
G R
EP
OR
T, CA
LE
ND
AR
YE
AR
2010
Table 6A-6 (Continued) Summary of Total Metal Results,
Tijeras Arroyo Groundwater Investigation, Sandia National Laboratories/New Mexico
Calendar Year 2010
Well ID Analyte Resulta
(mg/L) MDLb (mg/L)
PQLc (mg/L)
MCLd (mg/L)
Laboratory Qualifiere
Validation Qualifierf Sample No. Analytical
Methodg WYO-3 Aluminum 0.0232 0.010 0.030 NE J 089451-010 SW846 6020 02-Aug-10 Antimony ND 0.0005 0.003 0.006 U 089451-010 SW846 6020 Arsenic ND 0.0015 0.005 0.010 U 089451-010 SW846 6020 Barium 0.0476 0.0005 0.002 2.00 089451-010 SW846 6020 Beryllium ND 0.0001 0.0005 0.004 U 089451-010 SW846 6020 Cadmium ND 0.00011 0.001 0.005 U 089451-010 SW846 6020 Calcium 64.9 0.100 1.00 NE 089451-010 SW846 6020 Chromium ND 0.0025 0.010 0.100 U 089451-010 SW846 6020 Cobalt ND 0.0001 0.001 NE U 089451-010 SW846 6020 Copper 0.000766 0.0003 0.001 NE J 089451-010 SW846 6020 Iron 0.160 0.010 0.100 NE 089451-010 SW846 6020 Lead ND 0.0005 0.002 NE U 089451-010 SW846 6020 Magnesium 14.5 0.005 0.015 NE 089451-010 SW846 6020 Manganese 0.00147 0.001 0.005 NE J 089451-010 SW846 6020 Mercury ND 0.000066 0.0002 0.002 U 089451-010 SW846 7470 Nickel 0.00203 0.0005 0.002 NE 089451-010 SW846 6020 Potassium 2.46 0.080 0.300 NE 089451-010 SW846 6020 Selenium ND 0.001 0.005 0.050 U 089451-010 SW846 6020 Silver ND 0.0002 0.001 NE U 089451-010 SW846 6020 Sodium 24.2 0.080 0.250 NE 089451-010 SW846 6020 Thallium 0.000316 0.0003 0.001 0.002 J 0.002U 089451-010 SW846 6020 Uranium 0.00361 0.00005 0.0002 0.030 089451-010 SW846 6020 Vanadium 0.00401 0.003 0.010 NE J 089451-010 SW846 6020 Zinc 0.00437 0.0026 0.010 NE J 089451-010 SW846 6020 Refer to footnotes on page 6A-49.

TIJE
RA
S AR
RO
YO
GR
OU
ND
WA
TE
R
6A-41
Table 6A-6 (Concluded) Summary of Total Metal Results,
Tijeras Arroyo Groundwater Investigation, Sandia National Laboratories/New Mexico
Calendar Year 2010
Well ID Analyte Resulta
(mg/L) MDLb (mg/L)
PQLc (mg/L)
MCLd (mg/L)
Laboratory Qualifiere
Validation Qualifierf Sample No. Analytical
Methodg WYO-4 Aluminum 0.0129 0.010 0.030 NE J 089471-010 SW846 6020 16-Aug-10 Antimony ND 0.0005 0.003 0.006 U 089471-010 SW846 6020 Arsenic ND 0.0015 0.005 0.010 U 089471-010 SW846 6020 Barium 0.182 0.0025 0.010 2.00 089471-010 SW846 6020 Beryllium ND 0.0001 0.0005 0.004 U 089471-010 SW846 6020 Cadmium ND 0.00011 0.001 0.005 U 089471-010 SW846 6020 Calcium 90.2 0.200 2.00 NE B 089471-010 SW846 6020 Chromium ND 0.0025 0.010 0.100 U 089471-010 SW846 6020 Cobalt 0.00019 0.0001 0.001 NE J 0.00062U 089471-010 SW846 6020 Copper 0.00195 0.0003 0.001 NE 089471-010 SW846 6020 Iron 0.251 0.010 0.100 NE 089471-010 SW846 6020 Lead ND 0.0005 0.002 NE U 089471-010 SW846 6020 Magnesium 15.7 0.005 0.015 NE 089471-010 SW846 6020 Manganese ND 0.001 0.005 NE U 089471-010 SW846 6020 Mercury ND 0.000066 0.0002 0.002 U 089471-010 SW846 7470 Nickel 0.00291 0.0005 0.002 NE 089471-010 SW846 6020 Potassium 2.19 0.080 0.300 NE 089471-010 SW846 6020 Selenium 0.00637 0.001 0.005 0.050 089471-010 SW846 6020 Silver ND 0.0002 0.001 NE U 089471-010 SW846 6020 Sodium 22.2 0.080 0.250 NE 089471-010 SW846 6020 Thallium 0.000669 0.0003 0.001 0.002 J 0.0039U 089471-010 SW846 6020 Uranium 0.0013 0.00005 0.0002 0.030 089471-010 SW846 6020 Vanadium ND 0.003 0.010 NE U 089471-010 SW846 6020 Zinc ND 0.0026 0.010 NE U 089471-010 SW846 6020 Refer to footnotes on page 6A-49.

6A-42
AN
NU
AL
GR
OU
ND
WA
TE
R M
ON
ITO
RIN
G R
EP
OR
T, CA
LE
ND
AR
YE
AR
2010
Table 6A-7 Summary of Gamma Spectroscopy, Gross Alpha, Gross Beta, and Tritium Results,
Tijeras Arroyo Groundwater Investigation, Sandia National Laboratories/New Mexico
Calendar Year 2010
Well ID Analyte Activitya (pCi/L)
MDAb (pCi/L)
Critical Levelc(pCi/L)
MCLd (pCi/L)
Laboratory Qualifiere
Validation Qualifierf Sample No. Analytical
Methodg PGS-2 Americium-241 -0.283 ± 12.2 20.2 10.1 NE U BD 089426-033 EPA 901.1 16-Jul-10 Cesium-137 1.86 ± 2.31 4.07 2.04 NE U BD 089426-033 EPA 901.1 Cobalt-60 -0.854 ± 2.25 3.70 1.85 NE U BD 089426-033 EPA 901.1 Potassium-40 28.8 ± 41.4 59.0 29.5 NE U BD 089426-033 EPA 901.1 Gross Alpha 1.33 NA NA 15 NA None 089426-034 EPA 900.0 Gross Beta 2.91 ± 0.885 1.10 0.530 4mrem/yr J 089426-034 EPA 900.0 Tritium 61.4 ± 92.6 156 75.3 NE U BD 089426-036 EPA 906.0 M TA1-W-01 Americium-241 -2.35 ± 5.00 8.30 4.15 NE U BD 089429-033 EPA 901.1 06-Aug-10 Cesium-137 0.892 ± 1.57 2.76 1.38 NE U BD 089429-033 EPA 901.1 Cobalt-60 -0.262 ± 1.61 2.71 1.36 NE U BD 089429-033 EPA 901.1 Potassium-40 -28.2 ± 36.1 40.9 20.5 NE U BD 089429-033 EPA 901.1 Gross Alpha 1.90 NA NA 15 NA None 089429-034 EPA 900.0 Gross Beta 1.99 ± 1.07 1.61 0.775 4mrem/yr J 089429-034 EPA 900.0 Tritium -18.6 ± 63.7 119 54.9 NE U BD 089429-036 EPA 906.0 M TA1-W-02 Americium-241 -0.735 ± 12.2 20.9 10.4 NE U BD 089431-033 EPA 901.1 21-Jul-10 Cesium-137 0.221 ± 3.66 4.48 2.24 NE U BD 089431-033 EPA 901.1 Cobalt-60 -1.75 ± 2.07 3.23 1.61 NE U BD 089431-033 EPA 901.1 Potassium-40 -34.4 ± 46.9 46.6 23.3 NE U BD 089431-033 EPA 901.1 Gross Alpha 2.06 NA NA 15 NA None 089431-034 EPA 900.0 Gross Beta 4.09 ± 1.03 1.06 0.508 4mrem/yr 089431-034 EPA 900.0 Tritium 81.4 ± 94.2 156 75.6 NE U BD 089431-036 EPA 906.0 M TA1-W-03 Americium-241 -0.797 ± 5.08 8.59 4.30 NE U BD 089435-033 EPA 901.1 22-Jul-10 Cesium-137 0.530 ± 1.72 2.95 1.48 NE U BD 089435-033 EPA 901.1 Cobalt-60 -1.23 ± 1.98 3.16 1.58 NE U BD 089435-033 EPA 901.1 Potassium-40 6.21 ± 41.3 45.0 22.5 NE U BD 089435-033 EPA 901.1 Gross Alpha 0.27 NA NA 15 NA None 089435-034 EPA 900.0 Gross Beta 0.824 ± 2.26 3.85 1.87 4mrem/yr U BD 089435-034 EPA 900.0 Tritium 53.2 ± 91.8 155 75.0 NE U BD 089435-036 EPA 906.0 M TA1-W-03 (Duplicate) Americium-241 -1.89 ± 12.6 18.6 9.31 NE U BD 089436-033 EPA 901.1 22-Jul-10 Cesium-137 -0.0267 ± 1.88 3.16 1.58 NE U BD 089436-033 EPA 901.1 Cobalt-60 -0.396 ± 2.10 3.46 1.73 NE U BD 089436-033 EPA 901.1 Potassium-40 -0.752 ± 40.2 45.6 22.8 NE U BD 089436-033 EPA 901.1 Gross Alpha -1.01 NA NA 15 NA None 089436-034 EPA 900.0 Gross Beta 7.35 ± 2.47 3.25 1.56 4mrem/yr J 089436-034 EPA 900.0 Tritium 27.7 ± 90.9 156 75.3 NE U BD 089436-036 EPA 906.0 M Refer to footnotes on page 6A-49.

TIJE
RA
S AR
RO
YO
GR
OU
ND
WA
TE
R
6A-43
Table 6A-7 (Continued) Summary of Gamma Spectroscopy, Gross Alpha, Gross Beta, and Tritium Results,
Tijeras Arroyo Groundwater Investigation, Sandia National Laboratories/New Mexico
Calendar Year 2010
Well ID Analyte Activitya (pCi/L)
MDAb (pCi/L)
Critical Levelc(pCi/L)
MCLd (pCi/L)
Laboratory Qualifiere
Validation Qualifierf Sample No. Analytical
Methodg TA1-W-04 Americium-241 -0.726 ± 13.1 22.9 11.5 NE U BD 089438-033 EPA 901.1 23-Jul-10 Cesium-137 -0.392 ± 2.80 4.70 2.35 NE U BD 089438-033 EPA 901.1 Cobalt-60 -0.379 ± 2.81 4.61 2.31 NE U BD 089438-033 EPA 901.1 Potassium-40 31.7 ± 52.0 71.7 35.9 NE U BD 089438-033 EPA 901.1 Gross Alpha 0.86 NA NA 15 NA None 089438-034 EPA 900.0 Gross Beta 2.11 ± 0.957 1.40 0.672 4mrem/yr J 089438-034 EPA 900.0 Tritium 20.4 ± 111 191 92.3 NE U BD 089438-036 EPA 906.0 M TA1-W-05 Americium-241 3.74 ± 14.3 22.0 11.0 NE U BD 089440-033 EPA 901.1 26-Jul-10 Cesium-137 -1.82 ± 1.84 2.96 1.48 NE U BD 089440-033 EPA 901.1 Cobalt-60 0.365 ± 2.09 3.58 1.79 NE U BD 089440-033 EPA 901.1 Potassium-40 -2.90 ± 40.4 49.2 24.6 NE U BD 089440-033 EPA 901.1 Gross Alpha 4.27 NA NA 15 NA None 089440-034 EPA 900.0 Gross Beta 11.5 ± 2.38 1.94 0.940 4mrem/yr 089440-034 EPA 900.0 Tritium 5.16 ± 111 193 93.3 NE U BD 089440-036 EPA 906.0 M TA1-W-06 Americium-241 -2.80 ± 6.51 9.56 4.78 NE U BD 089442-033 EPA 901.1 27-Jul-10 Cesium-137 -2.61 ± 2.77 2.75 1.38 NE U BD 089442-033 EPA 901.1 Cobalt-60 0.431 ± 1.69 2.84 1.42 NE U BD 089442-033 EPA 901.1 Potassium-40 6.57 ± 31.4 40.1 20.1 NE U BD 089442-033 EPA 901.1 Gross Alpha -0.56 NA NA 15 NA None 089442-034 EPA 900.0 Gross Beta 0.0388 ± 1.44 2.48 1.20 4mrem/yr U BD 089442-034 EPA 900.0 Tritium 63.2 ± 112 189 91.5 NE U BD 089442-036 EPA 906.0 M TA1-W-08 Americium-241 -2.04 ± 8.57 12.9 6.44 NE U BD 089444-033 EPA 901.1 28-Jul-10 Cesium-137 0.659 ± 1.86 3.19 1.60 NE U BD 089444-033 EPA 901.1 Cobalt-60 0.940 ± 1.82 3.16 1.58 NE U BD 089444-033 EPA 901.1 Potassium-40 -12.4 ± 41.9 44.2 22.1 NE U BD 089444-033 EPA 901.1 Gross Alpha -5.82 NA NA 15 NA None 089444-034 EPA 900.0 Gross Beta 1.16 ± 3.06 5.20 2.52 4mrem/yr U BD 089444-034 EPA 900.0 Tritium 2.55 ± 110 191 92.2 NE U BD 089444-036 EPA 906.0 M TA2-NW1-595 Americium-241 -3.06 ± 5.19 8.58 4.29 NE U BD 089453-033 EPA 901.1 03-Aug-10 Cesium-137 -0.152 ± 1.50 2.55 1.28 NE U BD 089453-033 EPA 901.1 Cobalt-60 -0.686 ± 1.61 2.66 1.33 NE U BD 089453-033 EPA 901.1 Potassium-40 -8.24 ± 30.5 38.5 19.3 NE U BD 089453-033 EPA 901.1 Gross Alpha 0.62 NA NA 15 NA None 089453-034 EPA 900.0 Gross Beta 4.26 ± 1.68 2.41 1.17 4mrem/yr J 089453-034 EPA 900.0 Tritium -19.3 ± 66.0 123 56.8 NE U BD 089453-036 EPA 906.0 M Refer to footnotes on page 6A-49.

6A-44
AN
NU
AL
GR
OU
ND
WA
TE
R M
ON
ITO
RIN
G R
EP
OR
T, CA
LE
ND
AR
YE
AR
2010
Table 6A-7 (Continued) Summary of Gamma Spectroscopy, Gross Alpha, Gross Beta, and Tritium Results,
Tijeras Arroyo Groundwater Investigation, Sandia National Laboratories/New Mexico
Calendar Year 2010
Well ID Analyte Activitya (pCi/L)
MDAb (pCi/L)
Critical Levelc(pCi/L)
MCLd (pCi/L)
Laboratory Qualifiere
Validation Qualifierf Sample No. Analytical
Methodg TA2-SW1-320 Americium-241 -0.797 ± 7.28 11.6 5.78 NE U BD 089424-033 EPA 901.1 15-Jul-10 Cesium-137 1.95 ± 1.67 2.91 1.46 NE U BD 089424-033 EPA 901.1 Cobalt-60 0.0393 ± 1.65 2.73 1.36 NE U BD 089424-033 EPA 901.1 Potassium-40 -32.5 ± 37.8 39.4 19.7 NE U BD 089424-033 EPA 901.1 Gross Alpha 1.64 NA NA 15 NA None 089424-034 EPA 900.0 Gross Beta 4.21 ± 1.03 0.982 0.466 4mrem/yr 089424-034 EPA 900.0 Tritium 37.5 ± 91.1 155 75.1 NE U BD 089424-036 EPA 906.0 M TA2-W-01 Americium-241 -20.7 ± 7.95 12.5 6.28 NE U BD 089460-033 EPA 901.1 09-Aug-10 Cesium-137 -0.578 ± 1.80 2.97 1.48 NE U BD 089460-033 EPA 901.1 Cobalt-60 1.09 ± 1.95 3.40 1.70 NE U BD 089460-033 EPA 901.1 Potassium-40 -9.92 ± 32.7 41.7 20.9 NE U BD 089460-033 EPA 901.1 Gross Alpha 1.29 NA NA 15 NA None 089460-034 EPA 900.0 Gross Beta 0.779 ± 0.839 1.38 0.658 4mrem/yr U BD 089460-034 EPA 900.0 Tritium 6.29 ± 67.0 121 55.7 NE U BD 089460-036 EPA 906.0 M TA2-W-19 Americium-241 -16.5 ± 11.9 18.9 9.46 NE U BD 089466-033 EPA 901.1 11-Aug-10 Cesium-137 1.19 ± 2.00 3.50 1.75 NE U BD 089466-033 EPA 901.1 Cobalt-60 -0.80 ± 2.26 3.73 1.87 NE U BD 089466-033 EPA 901.1 Potassium-40 14.6 ± 51.6 51.1 25.6 NE U BD 089466-033 EPA 901.1 Gross Alpha 0.91 NA NA 15 NA None 089466-034 EPA 900.0 Gross Beta 1.38 ± 0.901 1.41 0.672 4mrem/yr U BD 089466-034 EPA 900.0 Tritium 21.6 ± 67.3 119 54.8 NE U BD 089466-036 EPA 906.0 M TA2-W-19 (Duplicate) Americium-241 2.85 ± 10.1 17.7 8.86 NE U BD 089467-033 EPA 901.1 11-Aug-10 Cesium-137 0.410 ± 2.04 3.48 1.74 NE U BD 089467-033 EPA 901.1 Cobalt-60 0.608 ± 2.21 3.74 1.87 NE U BD 089467-033 EPA 901.1 Potassium-40 7.17 ± 46.1 54.2 27.1 NE U BD 089467-033 EPA 901.1 Gross Alpha 1.52 NA NA 15 NA None 089467-034 EPA 900.0 Gross Beta 1.32 ± 0.924 1.46 0.699 4mrem/yr U BD 089467-034 EPA 900.0 Tritium 21.6 ± 67.3 119 54.7 NE U BD 089467-036 EPA 906.0 M TA2-W-26 Americium-241 6.22 ± 11.9 17.8 8.93 NE U BD 089462-033 EPA 901.1 10-Aug-10 Cesium-137 -0.55 ± 1.94 3.27 1.64 NE U BD 089462-033 EPA 901.1 Cobalt-60 1.80 ± 1.99 3.54 1.77 NE U BD 089462-033 EPA 901.1 Potassium-40 12.4 ± 33.7 46.7 23.3 NE U BD 089462-033 EPA 901.1 Gross Alpha 1.45 NA NA 15 NA None 089462-034 EPA 900.0 Gross Beta 2.32 ± 1.60 2.53 1.21 4mrem/yr U BD 089462-034 EPA 900.0 Tritium 15.8 ± 68.2 121 56.0 NE U BD 089462-036 EPA 906.0 M Refer to footnotes on page 6A-49.

TIJE
RA
S AR
RO
YO
GR
OU
ND
WA
TE
R
6A-45
Table 6A-7 (Continued) Summary of Gamma Spectroscopy, Gross Alpha, Gross Beta, and Tritium Results,
Tijeras Arroyo Groundwater Investigation, Sandia National Laboratories/New Mexico
Calendar Year 2010
Well ID Analyte Activitya (pCi/L)
MDAb (pCi/L)
Critical Levelc(pCi/L)
MCLd (pCi/L)
Laboratory Qualifiere
Validation Qualifierf Sample No. Analytical
Methodg TA2-W-27 Americium-241 1.18 ± 5.33 9.00 4.50 NE U BD 089456-033 EPA 901.1 04-Aug-10 Cesium-137 -0.525 ± 1.60 2.70 1.35 NE U BD 089456-033 EPA 901.1 Cobalt-60 -0.0257 ± 1.54 2.62 1.31 NE U BD 089456-033 EPA 901.1 Potassium-40 3.33 ± 31.3 38.6 19.3 NE U BD 089456-033 EPA 901.1 Gross Alpha -0.68 NA NA 15 NA None 089456-034 EPA 900.0 Gross Beta 2.71 ± 1.51 2.35 1.14 4mrem/yr J 089456-034 EPA 900.0 Tritium 6.37 ± 67.8 122 56.4 NE U ND 089456-036 EPA 906.0 M TJA-2 Americium-241 1.05 ± 5.19 8.86 4.43 NE U BD 089469-033 EPA 901.1 12-Aug-10 Cesium-137 1.33 ± 1.65 2.90 1.45 NE U BD 089469-033 EPA 901.1 Cobalt-60 0.169 ± 2.03 3.41 1.71 NE U BD 089469-033 EPA 901.1 Potassium-40 -2.27 ± 35.7 46.0 23.0 NE U BD 089469-033 EPA 901.1 Gross Alpha 1.32 NA NA 15 NA None 089469-034 EPA 900.0 Gross Beta 0.650 ± 0.920 1.54 0.739 4mrem/yr U BD 089469-034 EPA 900.0 Tritium -28.2 ± 63.5 120 55.5 NE U BD 089469-036 EPA 906.0 M TJA-3 Americium-241 0.583 ± 2.61 4.26 2.13 NE U BD 089448-033 EPA 901.1 29-Jul-10 Cesium-137 -5.30 ± 4.86 5.75 2.88 NE U BD 089448-033 EPA 901.1 Cobalt-60 0.244 ± 2.14 3.65 1.83 NE U BD 089448-033 EPA 901.1 Potassium-40 3.06 ± 46.6 49.6 24.8 NE U BD 089448-033 EPA 901.1 Gross Alpha 1.19 NA NA 15 NA None 089448-034 EPA 900.0 Gross Beta 1.47 ± 0.776 1.15 0.550 4mrem/yr J 089448-034 EPA 900.0 Tritium 69.4 ± 114 192 93.0 NE U BD 089448-036 EPA 906.0 M TJA-3 (Duplicate) Americium-241 -31.7 ± 11.5 17.7 8.86 NE U BD 089449-033 EPA 901.1 23-Jul-10 Cesium-137 -0.625 ± 1.85 3.12 1.56 NE U BD 089449-033 EPA 901.1 Cobalt-60 0.602 ± 1.88 3.27 1.63 NE U BD 089449-033 EPA 901.1 Potassium-40 -1.34 ± 35.7 46.2 23.1 NE U BD 089449-033 EPA 901.1 Gross Alpha 0.74 NA NA 15 NA None 089449-034 EPA 900.0 Gross Beta 3.11 ± 1.01 1.30 0.626 4mrem/yr J 089449-034 EPA 900.0 Tritium -51.2 ± 108 191 92.5 NE U BD 089449-036 EPA 906.0 M TJA-4 Americium-241 -2.61 ± 13.5 22.8 11.4 NE U BD 089473-033 EPA 901.1 17-Aug-10 Cesium-137 0.374 ± 1.82 3.14 1.57 NE U BD 089473-033 EPA 901.1 Cobalt-60 0.442 ± 1.96 3.36 1.68 NE U BD 089473-033 EPA 901.1 Potassium-40 -6.72 ± 40.0 52.4 26.2 NE U BD 089473-033 EPA 901.1 Gross Alpha 0.53 NA NA 15 NA None 089473-034 EPA 900.0 Gross Beta 1.76 ± 0.746 1.05 0.499 4mrem/yr J 089473-034 EPA 900.0 Tritium -29.9 ± 56.7 110 50.2 NE U BD 089473-036 EPA 906.0 M Refer to footnotes on page 6A-49.

6A-46
AN
NU
AL
GR
OU
ND
WA
TE
R M
ON
ITO
RIN
G R
EP
OR
T, CA
LE
ND
AR
YE
AR
2010
Table 6A-7 (Concluded) Summary of Gamma Spectroscopy, Gross Alpha, Gross Beta, and Tritium Results,
Tijeras Arroyo Groundwater Investigation, Sandia National Laboratories/New Mexico
Calendar Year 2010
Well ID Analyte Activitya (pCi/L)
MDAb (pCi/L)
Critical Levelc(pCi/L)
MCLd (pCi/L)
Laboratory Qualifiere
Validation Qualifierf Sample No. Analytical
Methodg TJA-6 Americium-241 -18.6 ± 7.70 12.0 6.01 NE U BD 089458-033 EPA 901.1 05-Aug-10 Cesium-137 0.798 ± 1.90 3.22 1.61 NE U BD 089458-033 EPA 901.1 Cobalt-60 0.969 ± 2.12 3.67 1.84 NE U BD 089458-033 EPA 901.1 Potassium-40 3.87 ± 33.6 42.6 21.3 NE U BD 089458-033 EPA 901.1 Gross Alpha 1.12 NA NA 15 NA None 089458-034 EPA 900.0 Gross Beta 3.52 ± 1.15 1.52 0.738 4mrem/yr J 089458-034 EPA 900.0 Tritium 16.0 ± 69.0 123 56.6 NE U BD 089458-036 EPA 906.0 M TJA-7 Americium-241 1.10 ± 5.95 9.72 4.86 NE U BD 089475-033 EPA 901.1 18-Aug-10 Cesium-137 1.36 ± 1.57 2.72 1.36 NE U BD 089475-033 EPA 901.1 Cobalt-60 -1.65 ± 1.72 2.59 1.30 NE U BD 089475-033 EPA 901.1 Potassium-40 55.9 ± 20.3 55.9 19.3 NE U BD 089475-033 EPA 901.1 Gross Alpha 3.05 NA NA 15 NA None 089475-034 EPA 900.0 Gross Beta 1.08 ± 0.711 1.11 0.530 4mrem/yr U BD 089475-034 EPA 900.0 Tritium -3.1 ± 58.6 108 49.4 NE U BD 089475-036 EPA 906.0 M WYO-3 Americium-241 -19.4 ± 7.72 12.0 5.99 NE U BD 089451-033 EPA 901.1 02-Aug-10 Cesium-137 0.172 ± 1.89 3.15 1.58 NE U BD 089451-033 EPA 901.1 Cobalt-60 -0.219 ± 2.04 3.40 1.70 NE U BD 089451-033 EPA 901.1 Potassium-40 14.3 ± 34.3 45.1 22.6 NE U BD 089451-033 EPA 901.1 Gross Alpha 3.15 NA NA 15 NA None 089451-034 EPA 900.0 Gross Beta 4.11± 1.47 2.06 1.00 4mrem/yr J 089451-034 EPA 900.0 Tritium 18.5 ± 67.0 119 54.7 NE U BD 089451-036 EPA 906.0 M WYO-4 Americium-241 -3.97 ± 11.8 19.6 9.79 NE U BD 089471-033 EPA 901.1 16-Aug-10 Cesium-137 1.86 ± 1.97 3.44 1.72 NE U BD 089471-033 EPA 901.1 Cobalt-60 1.81 ± 2.01 3.56 1.78 NE U BD 089471-033 EPA 901.1 Potassium-40 -41.0 ± 49.4 44.4 22.2 NE U BD 089471-033 EPA 901.1 Gross Alpha -0.08 NA NA 15 NA None 089471-034 EPA 900.0 Gross Beta 0.143 ± 0.579 1.00 0.475 4mrem/yr U BD 089471-034 EPA 900.0 Tritium 41.8 ± 65.7 112 51.3 NE U BD 089471-036 EPA 906.0 M Refer to footnotes on page 6A-49.

TIJE
RA
S AR
RO
YO
GR
OU
ND
WA
TE
R
6A-47
Table 6A-8 Summary of Field Water Quality Measurementsh,
Tijeras Arroyo Groundwater Investigation, Sandia National Laboratories/New Mexico
Calendar Year 2010
Well ID Sample Date Temperature (0C)
Specific Conductivity (mho/cm)
Oxidation Reduction Potential
(mV) pH Turbidity
(NTU) Dissolved Oxygen (% Sat)
Dissolved Oxygen (mg/L)
TA1-W-03 26-Feb-10 14.20 1626 209.6 7.50 0.74 77.3 7.89 TA1-W-06 11-Jan-10 17.39 826 215.1 7.36 0.52 86.1 8.20 TA1-W-08 12-Jan-10 17.33 1841 218.9 7.21 0.46 78.6 7.49 TA2-SW1-320 19-Jan-10 13.90 472 274.9 7.52 19.0 83.9 8.65 TA2-W-01 13-Jan-10 16.95 603 244.8 7.40 1.88 83.5 8.07 TA2-W-19 21-Jan-10 15.63 563 239.8 7.47 0.16 83.8 8.32 TA2-W-26 20-Jan-10 14.11 1148 237.6 7.35 0.29 78.7 8.09 TA2-W-27 14-Jan-10 16.00 799 226.5 7.36 0.40 72.6 7.00 TJA-2 28-Jan-10 12.32 562 239.7 7.45 0.26 82.1 8.79 TJA-3 15-Jan-10 18.52 475 210.0 7.25 0.27 76.1 7.12 TJA-4 27-Jan-10 16.79 524 229.8 7.39 0.32 56.0 5.47 TJA-6 18-Jan-10 17.64 446 240.8 7.28 0.64 64.2 6.11 TJA-7 29-Jan-10 13.93 498 252.2 7.44 1.19 79.9 8.23 WYO-4 26-Jan-10 12.78 610 261.4 7.49 0.37 77.3 8.18
TA1-W-03 03-May-10 15.83 1585 300.2 7.35 0.36 82.0 8.08 TA1-W-06 04-May-10 19.79 812 276.3 7.37 1.81 85.7 7.81 TA1-W-08 05-May-10 19.87 1813 264.4 7.26 0.23 81.0 7.34 TA2-SW1-320 12-May-10 16.64 467 258.6 7.50 6.63 80.9 7.88 TA2-W-01 06-May-10 19.71 597 244.9 7.40 2.30 85.8 7.83 TA2-W-19 14-May-10 19.25 556 205.6 7.40 0.17 89.1 8.19 TA2-W-26 13-May-10 18.69 1142 218.4 7.33 0.21 81.7 7.61 TA2-W-27 11-May-10 19.67 784 289.8 7.34 0.22 90.0 8.26 TJA-2 20-May-10 19.31 553 219.9 7.36 0.29 88.1 8.11 TJA-4 19-May-10 19.85 521 170.0 7.31 0.15 56.9 5.20 TJA-7 24-May-10 18.69 491 193.9 7.41 5.19 85.0 7.92 WYO-4 18-May-10 18.30 597 157.3 7.57 0.31 81.9 7.69 Refer to footnotes on page 6A-49.

6A-48
AN
NU
AL
GR
OU
ND
WA
TE
R M
ON
ITO
RIN
G R
EP
OR
T, CA
LE
ND
AR
YE
AR
2010
Table 6A-8 (Concluded) Summary of Field Water Quality Measurementsh,
Tijeras Arroyo Groundwater Investigation, Sandia National Laboratories/New Mexico
Calendar Year 2010
Well ID Sample Date Temperature (0C)
Specific Conductivity (mho/cm)
Oxidation Reduction Potential
(mV) pH Turbidity
(NTU) Dissolved Oxygen (% Sat)
Dissolved Oxygen (mg/L)
PGS-2 16-Jul-10 23.10 429 162.7 8.16 1.18 14.4 1.24 TA1-W-01 06-Aug-10 21.12 487 159.1 7.56 0.27 70.9 6.32 TA1-W-02 21-Jul-10 21.91 472 144.1 7.53 0.89 62.2 5.44 TA1-W-03 22-Jul-10 19.53 1588 180.6 7.58 0.21 88.1 8.04 TA1-W-04 23-Jul-10 20.69 447 157.9 7.55 0.35 64.6 6.18 TA1-W-05 26-Jul-10 19.71 547 226.9 7.40 0.17 79.8 7.38 TA1-W-06 27-Jul-10 19.61 803 158.9 7.66 0.84 81.6 7.50 TA1-W-08 28-Jul-10 20.83 1823 158.9 7.48 0.30 84.2 7.48 TA2-NW1-595 03-Aug-10 20.79 730 143.7 7.49 0.30 87.6 7.82 TA2-SW1-320 15-Jul-10 20.94 472 191.3 7.76 2.67 89.5 8.00 TA2-W-01 09-Aug-10 21.60 595 160.9 7.73 6.23 88.4 7.80 TA2-W-19 11-Aug-10 22.49 557 155.4 7.73 0.14 94.1 8.14 TA2-W-26 10-Aug-10 20.82 1154 144.8 7.59 0.36 81.3 7.25 TA2-W-27 04-Aug-10 22.85 790 149.5 7.64 0.19 94.9 8.14 TJA-2 12-Aug-10 21.42 554 157.7 7.72 0.22 92.4 8.24 TJA-3 29-Jul-10 20.86 470 159.7 7.58 0.07 78.2 6.99 TJA-4 17-Aug-10 20.42 522 135.9 7.67 0.20 62.0 5.58 TJA-6 05-Aug-10 22.04 441 158.3 7.62 1.92 63.8 5.56 TJA-7 18-Aug-10 20.75 489 162.9 7.72 2.20 90.1 8.06 WYO-3 02-Aug-10 21.49 476 134.4 7.70 0.66 76.1 6.71 WYO-4 16-Aug-10 20.07 601 127.4 7.76 0.11 86.4 7.83
TA1-W-03 08-Nov-10 16.72 1569 299.9 7.51 0.19 80.7 7.81 TA2-SW1-320 09-Nov-10 13.84 463 323.1 7.77 14.2 76.9 7.93 TA2-W-19 11-Nov-10 18.00 535 257.4 7.65 0.22 89.8 8.49 TA2-W-26 10-Nov-10 17.67 1149 296.6 7.52 0.25 77.1 7.32 TJA-2 15-Nov-10 15.34 540 236.7 7.67 0.20 84.1 8.41 TJA-4 12-Nov-10 17.33 512 237.6 7.60 0.18 55.0 5.27 TJA-7 16-Nov-10 17.61 478 226.5 7.66 1.86 82.6 7.87 WYO-4 18-Nov-10 15.36 588 245.0 7.74 0.68 78.9 7.89 Refer to footnotes on page 6A-49.
TIJERAS ARROYO GROUNDWATER 6A-49
Footnotes for Tijeras Arroyo Groundwater Investigation Tables
aResult - Values in bold exceed the established MCL. - ND = not detected (at method detection limit). - Activities of zero or less are considered to be not detected. - Gross alpha activity measurements were corrected by subtracting out the total uranium activity (40 CFR Parts 9, 141, and 142, Table 1-4) - g/L = micrograms per liter. - mg/L = milligrams per liter. - pCi/L = picocuries per liter.
bMDL or MDA Method detection limit. The minimum concentration or activity that can be measured and reported with 99% confidence that the analyte is greater than zero; analyte is matrix specific. The minimum detectable activity or minimum measured activity in a sample required to ensure a 95% probability that the measured activity is accurately quantified above the critical level. NA = not applicable for gross alpha activities. The MDA could not be calculated as the gross alpha activity was corrected by subtracting out the total uranium activity.
cPQL or Critical Level Practical quantitation limit. The lowest concentration of analytes in a sample that can be reliably determined within specified limits of precision and accuracy by that indicated method under routine laboratory operating conditions. The minimum activity that can be measured and reported with 99% confidence that the analyte is greater than zero; analyte is matrix specific. NA = not applicable for gross alpha activities. The critical level could not be calculated as the gross alpha activity was corrected by subtracting out the total uranium activity.
dMCL - Maximum contaminant level. Established by the U.S. Environmental Protection Agency Primary
Water Regulations (40 CFR 141.11, Subpart B), National Primary Drinking Water Standards, EPA, July 2002.
- NE = not established. - The following are the MCLs for gross alpha particles and beta particles in community water systems:
15 pCi/L = Gross alpha particle activity, excluding total uranium (40 CFR Parts 9, 141, and 142, Table 1-4). 4 mrem/yr = any combination of beta and/or gamma emitting radionuclides (as dose rate).
eLaboratory Qualifier B = Analyte is detected in associated laboratory method blank. J = Amount detected is below the practical quantitation limit (PQL). NA = Not applicable. U = Analyte is absent or below the method detection limit.
fValidation Qualifier If cell is blank, then all quality control samples met acceptance criteria with respect to submitted samples. BD = Below detection limit as used in radiochemistry to identify results that are not statistically different from zero. J = The associate value is an estimated quantity. J+ = The associated numerical value is an estimated quantity with suspected positive bias. J- = The associated numerical value is an estimated quantity with a suspected negative bias. None = No data validation for corrected gross alpha activity.

6A-50 ANNUAL GROUNDWATER MONITORING REPORT, CALENDAR YEAR 2010
Footnotes for Tijeras Arroyo Groundwater Investigation Tables (Concluded)
fValidation Qualifier (continued) U = The analyte was analyzed for but was not detected. The associated numerical value is the sample quantitation limit. UJ = The analyte was analyzed for but was not detected. The associated value is an estimate and may be inaccurate or imprecise.
gAnalytical Method
- EPA, 1980, Prescribed Procedures for Measurement of Radioactivity in Drinking Water EPA-600/4-80-032, U.S. Environmental Protection Agency, Cincinnati, Ohio.
- EPA, 1983, The Determination of Inorganic Anions in Water by Ion Chromatography- Method 300.00, EPA-600/4-80-032, U.S. Environmental Protection Agency, Cincinnati, Ohio.
- EPA, 1996, Test Methods for Evaluating Solid Waste, Physical/Chemical Methods, SW-846, 3rd ed., Rev. 1, U.S. Environmental Protection Agency, Washington, D.C.
- U.S. Environmental Protection Agency, Washington, D.C.; or Clesceri, Greenburg, and Eaton, 1998, Standard Methods for the Examination of Water and Wastewater, 20th ed., Method 2320B.
- EPA, 1999, Perchlorate in Drinking Water Using Ion Chromatography, EPA 815/R-00-014, U.S. Environmental Protection Agency, Washington, D.C.
hField Water Quality Measurements - Field measurements collected prior to sampling. °C = degrees Celsius. % sat = present saturation. mho/cm = micromhos per centimeter. mg/L = milligrams per liter. mV = millivolts. NTU = nephelometric turbidity units. pH = potential of hydrogen (negative logarithm of the hydrogen ion concentration).

TIJERAS ARROYO GROUNDWATER 6B-1
Attachment 6B Tijeras Arroyo Groundwater
Plots

6B-2 ANNUAL GROUNDWATER MONITORING REPORT, CALENDAR YEAR 2010
This page intentionally left blank.

TIJERAS ARROYO GROUNDWATER 6B-3
Attachment 6B Plots 6B-1 Trichloroethene Concentrations, WYO-4 ..................................................................... 6B-5 6B-2 Nitrate plus Nitrite Concentrations, TA2-SW1-320 ..................................................... 6B-6 6B-3 Nitrate plus Nitrite Concentrations, TJA-4 ................................................................... 6B-7 6B-4 Nitrate plus Nitrite Concentrations, TJA-7 ................................................................... 6B-8 6B-5 Nitrate plus Nitrite Concentrations, TA2-W-19 ........................................................... 6B-9 6B-6 Nitrate plus Nitrite Concentrations, TJA-2 ................................................................. 6B-10

6B-4 ANNUAL GROUNDWATER MONITORING REPORT, CALENDAR YEAR 2010
This page intentionally left blank.

TIJE
RA
S AR
RO
YO
GR
OU
ND
WA
TE
R
6B-5
Figure 6B-1. Trichloroethene Concentrations, WYO-4
0
1
2
3
4
5
6
7
8
9
10
Trich
loro
ethe
ne (
g/L)
TCE
MCLMCL = 5.0 g/L

6B-6
AN
NU
AL
GR
OU
ND
WA
TE
R M
ON
ITO
RIN
G R
EP
OR
T, CA
LE
ND
AR
YE
AR
2010
Figure 6B-2. Nitrate plus Nitrite Concentrations, TA2-SW1-320
0
5
10
15
20
25
30
35
Nitr
ate
plus N
itrite
(mg/
L)
NPN
MCL
MCL = 10 mg/L

TIJE
RA
S AR
RO
YO
GR
OU
ND
WA
TE
R
6B-7
Figure 6B-3. Nitrate plus Nitrite Concentrations, TJA-4
0
5
10
15
20
25
30
35
40
45
Nitr
ate
plus N
itrite
(mg/
L)
NPN
MCL
MCL = 10 mg/L

6B-8
AN
NU
AL
GR
OU
ND
WA
TE
R M
ON
ITO
RIN
G R
EP
OR
T, CA
LE
ND
AR
YE
AR
2010
Figure 6B-4. Nitrate plus Nitrite Concentrations, TJA-7
0
5
10
15
20
25
30
35
Nitr
ate
plus N
itrite
(mg/
L)
NPN
MCL
MCL = 10 mg/L

TIJE
RA
S AR
RO
YO
GR
OU
ND
WA
TE
R
6B-9
Figure 6B-5. Nitrate plus Nitrite Concentrations, TA2-W-19
0
2
4
6
8
10
12
14
Nitr
ate
plus N
itrite
(mg/
L)
NPN
MCL
MCL = 10 mg/L
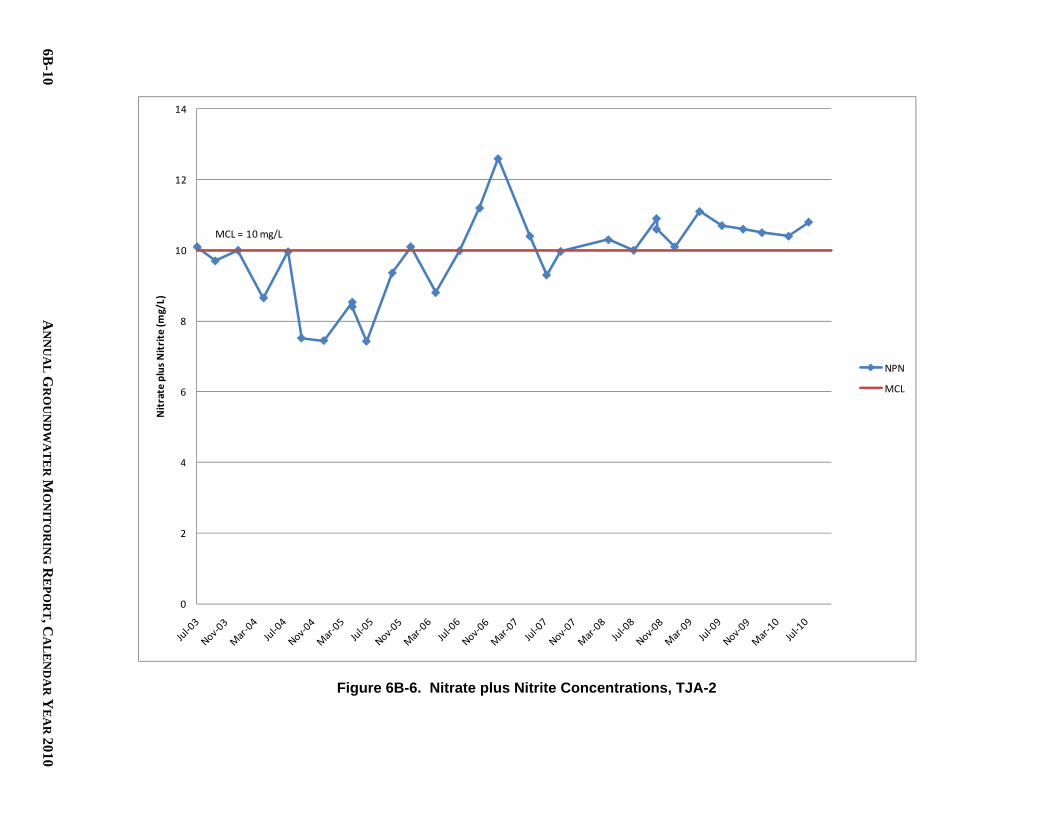
6B-10
AN
NU
AL
GR
OU
ND
WA
TE
R M
ON
ITO
RIN
G R
EP
OR
T, CA
LE
ND
AR
YE
AR
2010
Figure 6B-6. Nitrate plus Nitrite Concentrations, TJA-2
0
2
4
6
8
10
12
14
Nitr
ate
plus N
itrite
(mg/
L)
NPN
MCL
MCL = 10 mg/L
TIJERAS ARROYO GROUNDWATER 6C-1
Attachment 6C Tijeras Arroyo Groundwater
Hydrographs
6C-2 ANNUAL GROUNDWATER MONITORING REPORT, CALENDAR YEAR 2010
This page intentionally left blank.

TIJERAS ARROYO GROUNDWATER 6C-3
Attachment 6C Hydrographs 6C-1 TAG Study Area PGWS Wells (1 of 6) ........................................................................ 6C-5 6C-2 TAG Study Area PGWS Wells (2 of 6) ........................................................................ 6C-6 6C-3 TAG Study Area PGWS Wells (3 of 6) ........................................................................ 6C-7 6C-4 TAG Study Area PGWS Wells (4 of 6) ........................................................................ 6C-8 6C-5 TAG Study Area PGWS Wells (5 of 6) ........................................................................ 6C-9 6C-6 TAG Study Area PGWS Wells (6 of 6) ...................................................................... 6C-10 6C-7 TAG Study Area Regional Aquifer Wells (1 of 5) ..................................................... 6C-11 6C-8 TAG Study Area Regional Aquifer Wells (2 of 5) ..................................................... 6C-12 6C-9 TAG Study Area Regional Aquifer Wells (3 of 5) ..................................................... 6C-13 6C-10 TAG Study Area Regional Aquifer Wells (4 of 5) ..................................................... 6C-14 6C-11 TAG Study Area Regional Aquifer Wells (5 of 5) ..................................................... 6C-15

6C-4 ANNUAL GROUNDWATER MONITORING REPORT, CALENDAR YEAR 2010
This page intentionally left blank.
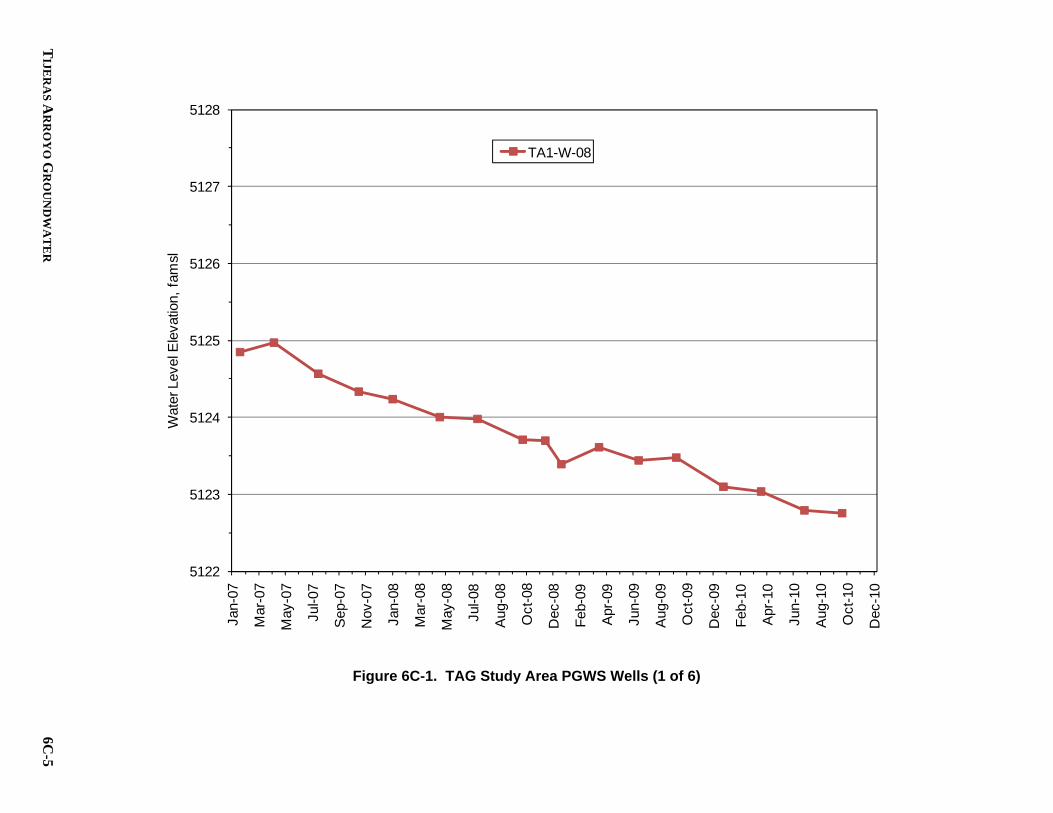
TIJE
RA
S AR
RO
YO
GR
OU
ND
WA
TE
R
6C-5
Figure 6C-1. TAG Study Area PGWS Wells (1 of 6)
5122
5123
5124
5125
5126
5127
5128
Jan-
07
Mar
-07
May
-07
Jul-0
7
Sep
-07
Nov
-07
Jan-
08
Mar
-08
May
-08
Jul-0
8
Aug
-08
Oct
-08
Dec
-08
Feb-
09
Apr
-09
Jun-
09
Aug
-09
Oct
-09
Dec
-09
Feb-
10
Apr
-10
Jun-
10
Aug
-10
Oct
-10
Dec
-10
Wat
er L
evel
Ele
vatio
n, f
amsl
TA1-W-08

6C-6
AN
NU
AL
GR
OU
ND
WA
TE
R M
ON
ITO
RIN
G R
EP
OR
T, CA
LE
ND
AR
YE
AR
2010
Figure 6C-2. TAG Study Area PGWS Wells (2 of 6)
5107
5108
5109
5110
5111
5112
5113
Jan-
07
Mar
-07
May
-07
Jul-0
7
Sep
-07
Nov
-07
Jan-
08
Mar
-08
May
-08
Jul-0
8
Aug
-08
Oct
-08
Dec
-08
Feb-
09
Apr
-09
Jun-
09
Aug
-09
Oct
-09
Dec
-09
Feb-
10
Apr
-10
Jun-
10
Aug
-10
Oct
-10
Dec
-10
Wat
er L
evel
Ele
vatio
n, f
amsl
TA1-W-03 TA1-W-06

TIJE
RA
S AR
RO
YO
GR
OU
ND
WA
TE
R
6C-7
Figure 6C-3. TAG Study Area PGWS Wells (3 of 6)
5099
5100
5101
5102
5103
5104
5105
Jan-
07
Mar
-07
May
-07
Jul-0
7
Sep
-07
Nov
-07
Jan-
08
Mar
-08
May
-08
Jul-0
8
Aug
-08
Oct
-08
Dec
-08
Feb-
09
Apr
-09
Jun-
09
Aug
-09
Oct
-09
Dec
-09
Feb-
10
Apr
-10
Jun-
10
Aug
-10
Oct
-10
Dec
-10
Wat
er L
evel
Ele
vatio
n, f
amsl
WYO-4

6C-8
AN
NU
AL
GR
OU
ND
WA
TE
R M
ON
ITO
RIN
G R
EP
OR
T, CA
LE
ND
AR
YE
AR
2010
Figure 6C-4. TAG Study Area PGWS Wells (4 of 6)
5087
5088
5089
5090
5091
5092
5093
Jan-
07
Mar
-07
May
-07
Jul-0
7
Sep
-07
Nov
-07
Jan-
08
Mar
-08
May
-08
Jul-0
8
Aug
-08
Oct
-08
Dec
-08
Feb-
09
Apr
-09
Jun-
09
Aug
-09
Oct
-09
Dec
-09
Feb-
10
Apr
-10
Jun-
10
Aug
-10
Oct
-10
Dec
-10
Wat
er L
evel
Ele
vatio
n, f
amsl
TA2-W-26

TIJE
RA
S AR
RO
YO
GR
OU
ND
WA
TE
R
6C-9
Figure 6C-5. TAG Study Area PGWS Wells (5 of 6)
5069
5070
5071
5072
5073
5074
5075
5076
5077
Jan-
07
Mar
-07
May
-07
Jul-0
7
Sep
-07
Nov
-07
Jan-
08
Mar
-08
May
-08
Jul-0
8
Aug
-08
Oct
-08
Dec
-08
Feb-
09
Apr
-09
Jun-
09
Aug
-09
Oct
-09
Dec
-09
Feb-
10
Apr
-10
Jun-
10
Aug
-10
Oct
-10
Dec
-10
Wat
er L
evel
Ele
vatio
n, f
amsl
TJA-2 TJA-5
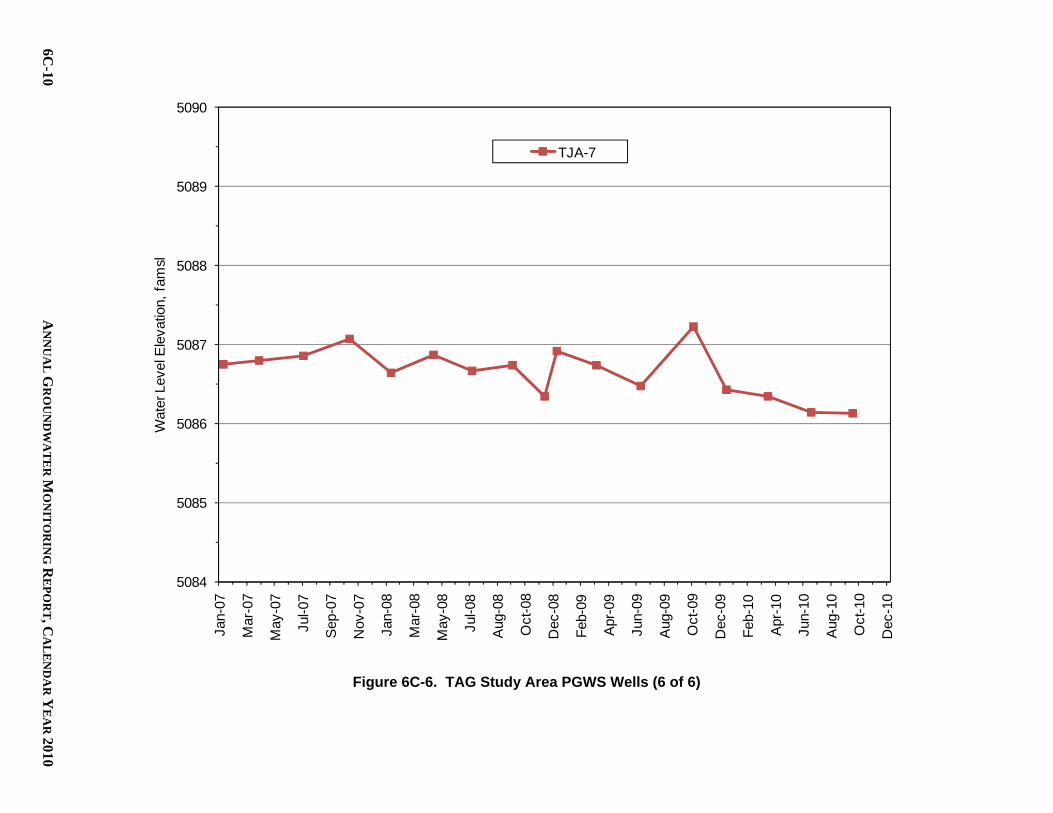
6C-10
AN
NU
AL
GR
OU
ND
WA
TE
R M
ON
ITO
RIN
G R
EP
OR
T, CA
LE
ND
AR
YE
AR
2010
Figure 6C-6. TAG Study Area PGWS Wells (6 of 6)
5084
5085
5086
5087
5088
5089
5090
Jan-
07
Mar
-07
May
-07
Jul-0
7
Sep
-07
Nov
-07
Jan-
08
Mar
-08
May
-08
Jul-0
8
Aug
-08
Oct
-08
Dec
-08
Feb-
09
Apr
-09
Jun-
09
Aug
-09
Oct
-09
Dec
-09
Feb-
10
Apr
-10
Jun-
10
Aug
-10
Oct
-10
Dec
-10
Wat
er L
evel
Ele
vatio
n, f
amsl
TJA-7

TIJE
RA
S AR
RO
YO
GR
OU
ND
WA
TE
R
6C-11
Figure 6C-7. TAG Study Area Regional Aquifer Wells (1 of 5)
5031
5032
5033
5034
5035
5036
5037
Jan-
07
Mar
-07
May
-07
Jul-0
7
Sep
-07
Nov
-07
Jan-
08
Mar
-08
May
-08
Jul-0
8
Aug
-08
Oct
-08
Dec
-08
Feb-
09
Apr
-09
Jun-
09
Aug
-09
Oct
-09
Dec
-09
Feb-
10
Apr
-10
Jun-
10
Aug
-10
Oct
-10
Dec
-10
Wat
er L
evel
Ele
vatio
n, f
amslTJA-4

6C-12
AN
NU
AL
GR
OU
ND
WA
TE
R M
ON
ITO
RIN
G R
EP
OR
T, CA
LE
ND
AR
YE
AR
2010
Figure 6C-8. TAG Study Area Regional Aquifer Wells (2 of 5)
4898
4899
4900
4901
4902
4903
4904
4905
4906
Jan-
07
Mar
-07
May
-07
Jul-0
7
Sep
-07
Nov
-07
Jan-
08
Mar
-08
May
-08
Jul-0
8
Aug
-08
Oct
-08
Dec
-08
Feb-
09
Apr
-09
Jun-
09
Aug
-09
Oct
-09
Dec
-09
Feb-
10
Apr
-10
Jun-
10
Aug
-10
Oct
-10
Dec
-10
Wat
er L
evel
Ele
vatio
n, f
amsl
EUBANK-1 TA2-W-25

TIJE
RA
S AR
RO
YO
GR
OU
ND
WA
TE
R
6C-13
Figure 6C-9. TAG Study Area Regional Aquifer Wells (3 of 5)
4883
4884
4885
4886
4887
4888
4889
4890
4891
4892
Jan-
07
Mar
-07
May
-07
Jul-0
7
Sep
-07
Nov
-07
Jan-
08
Mar
-08
May
-08
Jul-0
8
Aug
-08
Oct
-08
Dec
-08
Feb-
09
Apr
-09
Jun-
09
Aug
-09
Oct
-09
Dec
-09
Feb-
10
Apr
-10
Jun-
10
Aug
-10
Oct
-10
Dec
-10
Wat
er L
evel
Ele
vatio
n, f
amsl
EUBANK-2 EUBANK-3 EUBANK-5TA1-W-02 TA1-W-04 TJA-6

6C-14
AN
NU
AL
GR
OU
ND
WA
TE
R M
ON
ITO
RIN
G R
EP
OR
T, CA
LE
ND
AR
YE
AR
2010
Figure 6C-10. TAG Study Area Regional Aquifer Wells (4 of 5)
4855
4856
4857
4858
4859
4860
4861
Jan-
07
Mar
-07
May
-07
Jul-0
7
Sep
-07
Nov
-07
Jan-
08
Mar
-08
May
-08
Jul-0
8
Aug
-08
Oct
-08
Dec
-08
Feb-
09
Apr
-09
Jun-
09
Aug
-09
Oct
-09
Dec
-09
Feb-
10
Apr
-10
Jun-
10
Aug
-10
Oct
-10
Dec
-10
Wat
er L
evel
Ele
vatio
n, f
amsl
TA1-W-01 WYO-3

TIJE
RA
S AR
RO
YO
GR
OU
ND
WA
TE
R
6C-15
Figure 6C-11. TAG Study Area Regional Aquifer Wells (5 of 5)
4847
4849
4851
4853
4855
4857
4859
4861
Jan-
07
Mar
-07
May
-07
Jul-0
7
Sep
-07
Nov
-07
Jan-
08
Mar
-08
May
-08
Jul-0
8
Aug
-08
Oct
-08
Dec
-08
Feb-
09
Apr
-09
Jun-
09
Aug
-09
Oct
-09
Dec
-09
Feb-
10
Apr
-10
Jun-
10
Aug
-10
Oct
-10
Dec
-10
Wat
er L
evel
Ele
vatio
n, f
amsl
PGS-2 TA1-W-05

6C-16 ANNUAL GROUNDWATER MONITORING REPORT, CALENDAR YEAR 2010
This page intentionally left blank.
BURN SITE GROUNDWATER 7-1
7.0 Burn Site Groundwater Study Area
7.1 Introduction
Unique features of the Burn Site Groundwater (BSG) study area, located in the Manzanita Mountains (Figure 7-1), include low concentrations of nitrate and perchlorate in a fractured bedrock aquifer. Nitrate has been identified as a constituent of concern (COC) in groundwater at the study area based on detections above the U.S. Environmental Protection Agency (EPA) maximum contaminant level (MCL) in samples collected from monitoring wells. Since August 1998, the maximum concentration of nitrate detected in the study area has been 29.3 milligrams per liter (mg/L). The EPA and State of New Mexico drinking water standard (MCL) for nitrate is 10 mg/L (as nitrogen). Perchlorate has also been identified as a COC in groundwater at the BSG study area. Currently there is no EPA MCL or State of New Mexico drinking water standard for perchlorate. However, Section IV.B of the Compliance Order on Consent (the Order), between the New Mexico Environment Department (NMED), the U.S. Department of Energy (DOE), and Sandia Corporation (Sandia) stipulates that a select group of groundwater monitoring wells be sampled for perchlorate using a screening level/method detection limit (MDL) of 4 micrograms per liter (g/L) (NMED April 2004). Furthermore, the Order requires that for detections equal to or greater than 4 g/L, the DOE/Sandia will evaluate the nature and extent of perchlorate contamination. Perchlorate has been detected in samples from one well and, since March 2006, the maximum concentration of perchlorate in the study area has been 8.93 g/L.
7.1.1 Location
Sandia National Laboratories, New Mexico (SNL/NM) manages the Coyote Canyon Test Area in the eastern portion of Kirtland Air Force Base (KAFB). The SNL/NM facility is a government-owned, contractor-operated, multi-program laboratory overseen by the DOE, National Nuclear Security Administration through the Sandia Site Office in Albuquerque, New Mexico. Sandia, a wholly owned subsidiary of Lockheed Martin Corporation, manages and operates SNL/NM under Contract DE-AC04-94AL85000. The Burn Site is located in Lurance Canyon, one of three canyons that are located on the eastern edge of the Coyote Canyon Test Area and within the Manzanita Mountains. Two other canyons, Madera Canyon and Sol se Mete Canyon, intersect Lurance Canyon to the west of the Burn Site. These three canyons are the headwaters of Arroyo del Coyote. Testing activities at the Lurance Canyon Burn Facility, which includes the Burn Site, began in 1967. The BSG study area is located along the eastern margin of the Albuquerque Basin, and the terrain is characterized by large topographic relief, exceeding 500 feet (ft). Lurance Canyon, deeply incised into Paleozoic and Precambrian rocks, provides local westward drainage of ephemeral surface-water flows to Arroyo del Coyote.
7.1.2 Site History
The Lurance Canyon Burn Site (Solid Waste Management Unit [SWMU] 94) and the nearby Lurance Canyon Explosive Test Site (SWMU 65) have been used since 1967. Most research has involved testing the fire survivability of transportation containers, weapon components, simulated weapons, and satellite components. Historical operations also include open detonation of high explosives (HE) (Table 7-1) and the open burning of HE materials, liquid propellants, and solid propellants. Most HE testing occurred
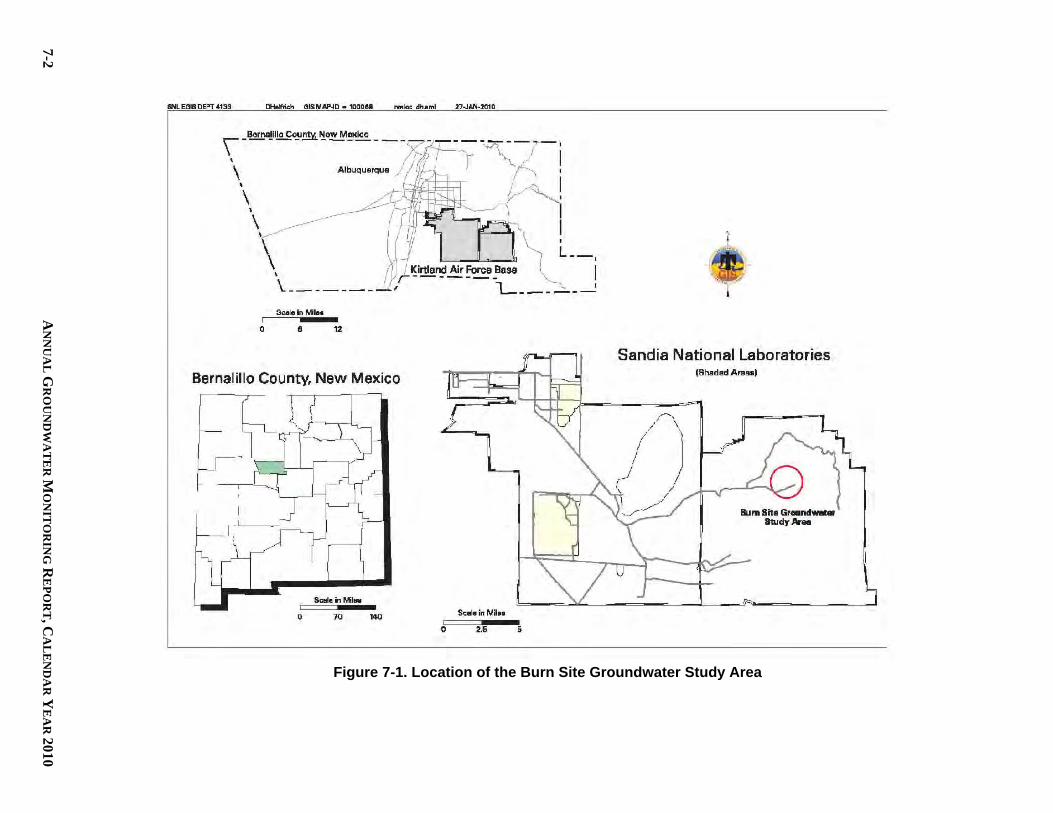
7-2 A
NN
UA
L G
RO
UN
DW
AT
ER
MO
NIT
OR
ING
RE
PO
RT, C
AL
EN
DA
R Y
EA
R 2010
Figure 7-1. Location of the Burn Site Groundwater Study Area
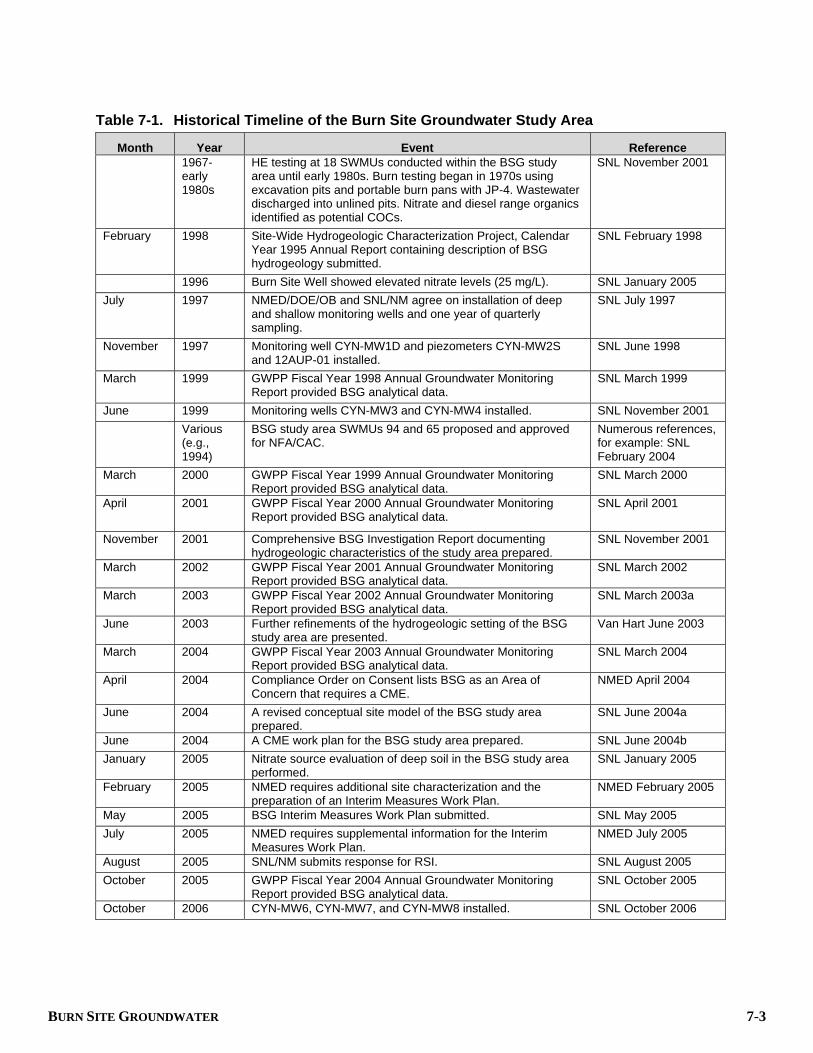
BURN SITE GROUNDWATER 7-3
Table 7-1. Historical Timeline of the Burn Site Groundwater Study Area
Month Year Event Reference 1967-
early 1980s
HE testing at 18 SWMUs conducted within the BSG study area until early 1980s. Burn testing began in 1970s using excavation pits and portable burn pans with JP-4. Wastewater discharged into unlined pits. Nitrate and diesel range organics identified as potential COCs.
SNL November 2001
February 1998 Site-Wide Hydrogeologic Characterization Project, Calendar Year 1995 Annual Report containing description of BSG hydrogeology submitted.
SNL February 1998
1996 Burn Site Well showed elevated nitrate levels (25 mg/L). SNL January 2005 July 1997 NMED/DOE/OB and SNL/NM agree on installation of deep
and shallow monitoring wells and one year of quarterly sampling.
SNL July 1997
November 1997 Monitoring well CYN-MW1D and piezometers CYN-MW2S and 12AUP-01 installed.
SNL June 1998
March 1999 GWPP Fiscal Year 1998 Annual Groundwater Monitoring Report provided BSG analytical data.
SNL March 1999
June 1999 Monitoring wells CYN-MW3 and CYN-MW4 installed. SNL November 2001 Various
(e.g., 1994)
BSG study area SWMUs 94 and 65 proposed and approved for NFA/CAC.
Numerous references, for example: SNL February 2004
March 2000 GWPP Fiscal Year 1999 Annual Groundwater Monitoring Report provided BSG analytical data.
SNL March 2000
April 2001 GWPP Fiscal Year 2000 Annual Groundwater Monitoring Report provided BSG analytical data.
SNL April 2001
November 2001 Comprehensive BSG Investigation Report documenting hydrogeologic characteristics of the study area prepared.
SNL November 2001
March 2002 GWPP Fiscal Year 2001 Annual Groundwater Monitoring Report provided BSG analytical data.
SNL March 2002
March 2003 GWPP Fiscal Year 2002 Annual Groundwater Monitoring Report provided BSG analytical data.
SNL March 2003a
June 2003 Further refinements of the hydrogeologic setting of the BSG study area are presented.
Van Hart June 2003
March 2004 GWPP Fiscal Year 2003 Annual Groundwater Monitoring Report provided BSG analytical data.
SNL March 2004
April 2004 Compliance Order on Consent lists BSG as an Area of Concern that requires a CME.
NMED April 2004
June 2004 A revised conceptual site model of the BSG study area prepared.
SNL June 2004a
June 2004 A CME work plan for the BSG study area prepared. SNL June 2004b January 2005 Nitrate source evaluation of deep soil in the BSG study area
performed. SNL January 2005
February 2005 NMED requires additional site characterization and the preparation of an Interim Measures Work Plan.
NMED February 2005
May 2005 BSG Interim Measures Work Plan submitted. SNL May 2005 July 2005 NMED requires supplemental information for the Interim
Measures Work Plan. NMED July 2005
August 2005 SNL/NM submits response for RSI. SNL August 2005 October 2005 GWPP Fiscal Year 2004 Annual Groundwater Monitoring
Report provided BSG analytical data. SNL October 2005
October 2006 CYN-MW6, CYN-MW7, and CYN-MW8 installed. SNL October 2006

7-4 ANNUAL GROUNDWATER MONITORING REPORT, CALENDAR YEAR 2010
Table 7-1. Historical Timeline of the Burn Site Groundwater Study Area (Concluded)
Month Year Event Reference March 2007 GWPP Fiscal Year 2006 Annual Groundwater Monitoring
Report provided BSG analytical data. SNL March 2007
April 2008 BSG Current Conceptual Site Model resubmitted. SNL April 2008a April 2008 BSG CME Work Plan resubmitted. SNL April 2008b March 2008 GWPP Fiscal Year 2007 Annual Groundwater Monitoring
Report provided BSG analytical data. SNL March 2008
April 2009 NMED requires supplemental characterization of soil and groundwater in the BSG study area.
NMED April 2009
November 2009 BSG Characterization Work Plan submitted. SNL November 2009 June 2009 GWPP Calendar Year 2008 Annual Groundwater Monitoring
Report provided BSG analytical data. SNL June 2009a
February 2010 Received notice of conditional approval for the November 2009 BSG Characterization Work Plan.
NMED February 2010
July 2010 Completed subsurface soil sampling at 10 deep soil boring locations to determine contaminant sources.
SNL November 2009
July 2010 Installed four groundwater monitoring wells to determine extent of groundwater contamination.
SNL November 2009
September 2010 Submitted an extension request for the BSG CME Report. SNL September 2010 September 2010 Initial sampling at groundwater monitoring wells CYN-MW9,
CYN-MW10, CYN-MW11, and CYN-MW12. SNL August 2010
October 2010 Received approval of a time extension for submittal of the BSG CME Report.
NMED October 2010
October 2010 GWPP Calendar Year 2009 Annual Groundwater Monitoring Report provided BSG analytical data.
SNL October 2010a
NOTES: BSG = Burn Site Groundwater. CAC = Corrective Action Complete. CME = Corrective Measures Evaluation. COC = Constituent of concern. DOE = U.S. Department of Energy. GWPP = Groundwater Protection Program. HE = High explosive(s). JP-4 = Jet propellant fuel composition 4 mg/L = Milligram(s) per liter. NFA = No Further Action. NMED = New Mexico Environment Department. OB = Oversight Bureau. RSI = Request for Supplemental Information. SNL/NM = Sandia National Laboratories/New Mexico. SWMU = Solid Waste Management Unit. between 1967 and 1975 and was completely phased out by the 1980s. Burn testing began in the early 1970s and has continued to the present. Early burn testing was conducted in unlined pits excavated in native soil. By 1975, portable, steel, burn pans were used for open burning mostly using JP-4 (jet propellant fuel composition 4). The Light Air Transport Accident Resistant Container Unit was constructed in 1980, and other engineered burn units were constructed by 1983. These burn units used jet fuel, gasoline, and diesel for the burn tests.
7.1.3 Monitoring History
Groundwater samples collected during 1996 from the Burn Site Well (a nonpotable production well used for fire suppression) contained elevated concentrations of nitrate (24.3 mg/L in November 1996). In 1997, the NMED, DOE, and Sandia agreed to investigate the source of this contamination. Later in 1997,
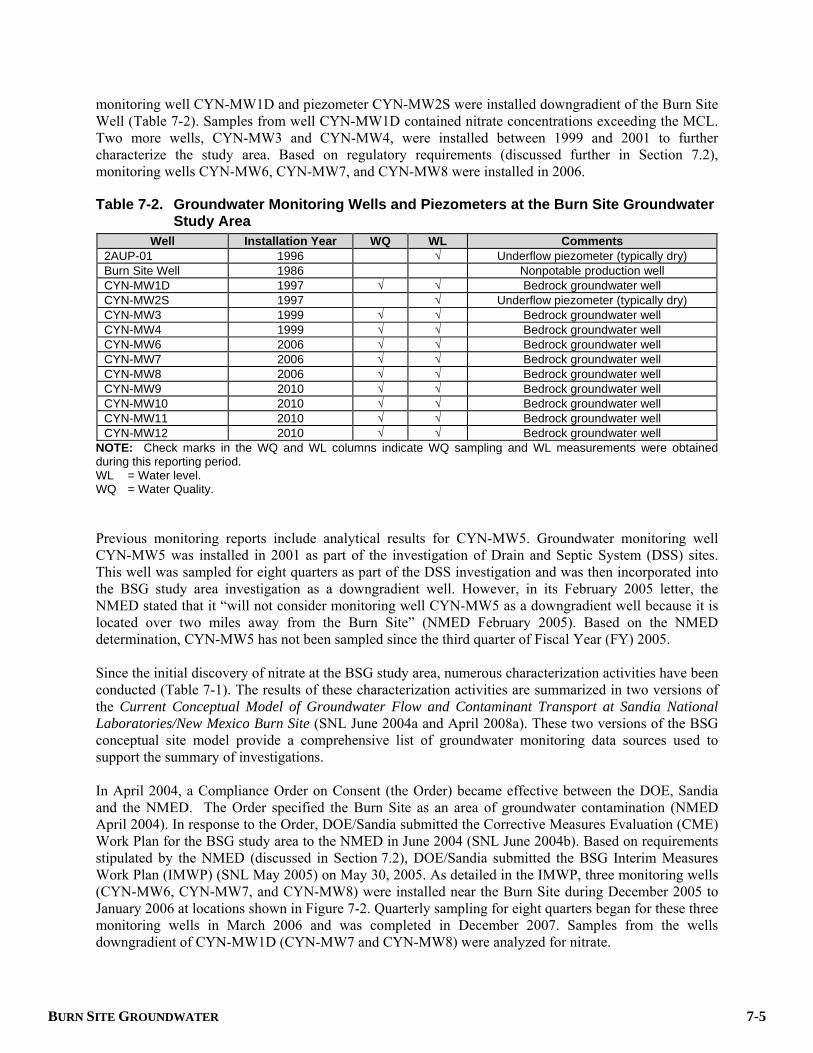
BURN SITE GROUNDWATER 7-5
monitoring well CYN-MW1D and piezometer CYN-MW2S were installed downgradient of the Burn Site Well (Table 7-2). Samples from well CYN-MW1D contained nitrate concentrations exceeding the MCL. Two more wells, CYN-MW3 and CYN-MW4, were installed between 1999 and 2001 to further characterize the study area. Based on regulatory requirements (discussed further in Section 7.2), monitoring wells CYN-MW6, CYN-MW7, and CYN-MW8 were installed in 2006.
Table 7-2. Groundwater Monitoring Wells and Piezometers at the Burn Site Groundwater Study Area
Well Installation Year WQ WL Comments 2AUP-01 1996 √ Underflow piezometer (typically dry) Burn Site Well 1986 Nonpotable production well CYN-MW1D 1997 √ √ Bedrock groundwater well CYN-MW2S 1997 √ Underflow piezometer (typically dry) CYN-MW3 1999 √ √ Bedrock groundwater well CYN-MW4 1999 √ √ Bedrock groundwater well CYN-MW6 2006 √ √ Bedrock groundwater well CYN-MW7 2006 √ √ Bedrock groundwater well CYN-MW8 2006 √ √ Bedrock groundwater well CYN-MW9 2010 √ √ Bedrock groundwater well CYN-MW10 2010 √ √ Bedrock groundwater well CYN-MW11 2010 √ √ Bedrock groundwater well CYN-MW12 2010 √ √ Bedrock groundwater well
NOTE: Check marks in the WQ and WL columns indicate WQ sampling and WL measurements were obtained during this reporting period. WL = Water level. WQ = Water Quality. Previous monitoring reports include analytical results for CYN-MW5. Groundwater monitoring well CYN-MW5 was installed in 2001 as part of the investigation of Drain and Septic System (DSS) sites. This well was sampled for eight quarters as part of the DSS investigation and was then incorporated into the BSG study area investigation as a downgradient well. However, in its February 2005 letter, the NMED stated that it “will not consider monitoring well CYN-MW5 as a downgradient well because it is located over two miles away from the Burn Site” (NMED February 2005). Based on the NMED determination, CYN-MW5 has not been sampled since the third quarter of Fiscal Year (FY) 2005. Since the initial discovery of nitrate at the BSG study area, numerous characterization activities have been conducted (Table 7-1). The results of these characterization activities are summarized in two versions of the Current Conceptual Model of Groundwater Flow and Contaminant Transport at Sandia National Laboratories/New Mexico Burn Site (SNL June 2004a and April 2008a). These two versions of the BSG conceptual site model provide a comprehensive list of groundwater monitoring data sources used to support the summary of investigations. In April 2004, a Compliance Order on Consent (the Order) became effective between the DOE, Sandia and the NMED. The Order specified the Burn Site as an area of groundwater contamination (NMED April 2004). In response to the Order, DOE/Sandia submitted the Corrective Measures Evaluation (CME) Work Plan for the BSG study area to the NMED in June 2004 (SNL June 2004b). Based on requirements stipulated by the NMED (discussed in Section 7.2), DOE/Sandia submitted the BSG Interim Measures Work Plan (IMWP) (SNL May 2005) on May 30, 2005. As detailed in the IMWP, three monitoring wells (CYN-MW6, CYN-MW7, and CYN-MW8) were installed near the Burn Site during December 2005 to January 2006 at locations shown in Figure 7-2. Quarterly sampling for eight quarters began for these three monitoring wells in March 2006 and was completed in December 2007. Samples from the wells downgradient of CYN-MW1D (CYN-MW7 and CYN-MW8) were analyzed for nitrate.
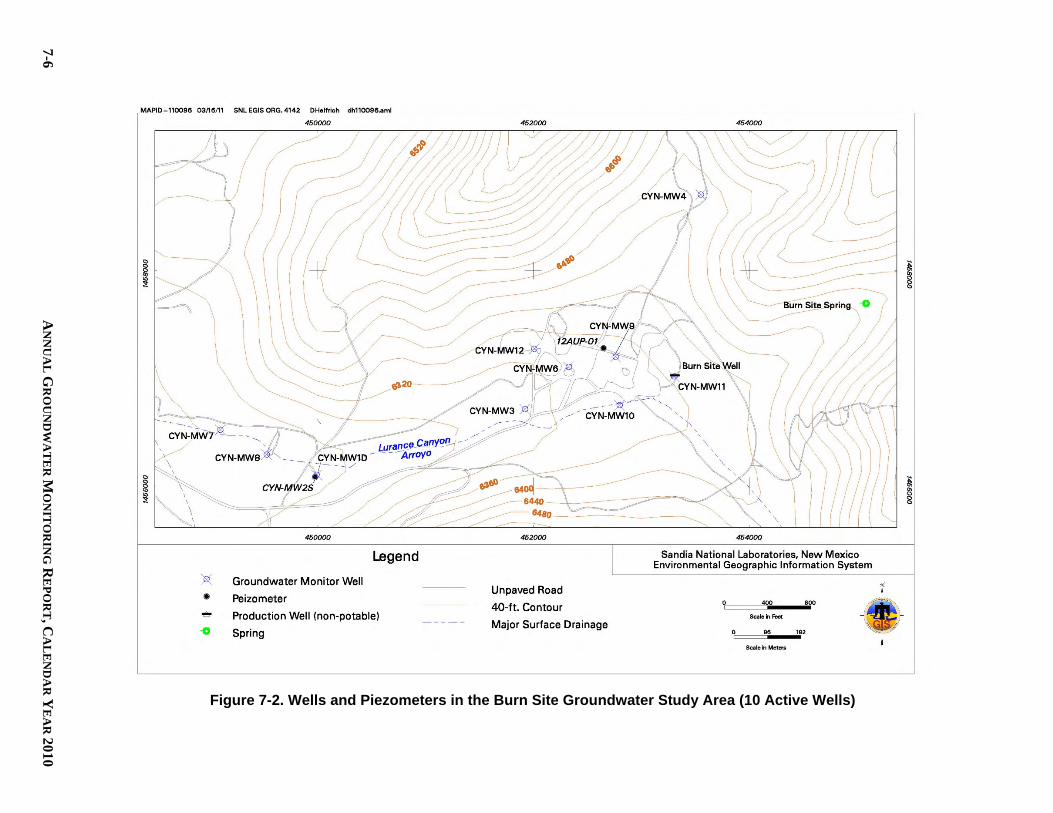
7-6 A
NN
UA
L G
RO
UN
DW
AT
ER
MO
NIT
OR
ING
RE
PO
RT, C
AL
EN
DA
R Y
EA
R 2010
Figure 7-2. Wells and Piezometers in the Burn Site Groundwater Study Area (10 Active Wells)
BURN SITE GROUNDWATER 7-7
Samples from the newly installed well adjacent to SWMU 94F (CYN-MW6) were analyzed for nitrate, total petroleum hydrocarbons (TPH) as gasoline range organics (GRO) and diesel range organics (DRO), and other parameters. Groundwater monitoring programs have continued as outlined in the IMWP (SNL May 2005). Based on a letter received from the NMED (NMED April 2009), DOE/Sandia were required to further characterize the nature and extent of the perchlorate contamination at the BSG study area. DOE/Sandia prepared the BSG Characterization Work Plan (SNL/NM November 2009) that was approved by NMED (NMED February 2010). In July 2010, DOE/Sandia implemented the requirements of the work plan and installed four new groundwater monitoring wells (CYN-MW9, CYN-MW10, CYN-MW11, and CYN-MW12) to determine the extent of groundwater contamination (Section 7.1.5). These four new wells were sampled for the first time in September 2010.
7.1.4 Current Monitoring Network
Currently 10 wells in the BSG study area are monitored for water quality, including CYN-MW1D, CYN-MW3, CYN-MW4, CYN-MW6, CYN-MW7, CYN-MW8, CYN-MW9, CYN-MW10, CYN-MW11, and CYN-MW12 (Figure 7-2). Two shallow piezometers (12AUP-01 and CYN-MW2S) were installed in 1997 to determine whether any ephemeral flow was occurring at the alluvium-bedrock interface. Both piezometers have been predominately dry since installation.
7.1.5 Summary of Calendar Year Activities
The following activities took place for the BSG study area investigation during Calendar Year (CY) 2010 (January through December 2010):
Semiannual groundwater sampling was conducted at six wells (CYN-MW1D, CYN-MW3, CYN-MW4, CYN-MW6, CYN-MW7, and CYN-MW8) in February/March 2010, May/June 2010, and September 2010.
Quarterly groundwater sampling was conducted at four wells (CYN-MW9, CYN-MW10, CYN-MW11, and CYN-MW12) in September 2010 and October/November 2010.
The Burn Site Groundwater Characterization Work Plan, Installation of Groundwater Monitoring Wells CYN-MW9, CYN-MW10, and CYN-MW11, Collection of Subsurface Soil Samples (SNL November 2009) was conditionally approved by the NMED (February 2010).
Subsurface soil sampling was completed in July 2010 at 10 deep soil boring locations to determine contaminant sources.
Four groundwater monitoring wells (CYN-MW9, CYN-MW10, CYN-MW11, and CYN-MW12) were installed in July 2010 to determine the extent of groundwater contamination.
Semiannual reporting of perchlorate analyses for CYN-MW6 was conducted.
Tables of analytical results (Attachment 7A), concentration versus time graphs (Attachment 7B), and hydrographs (Attachment 7C) were prepared in support of this report.

7-8 ANNUAL GROUNDWATER MONITORING REPORT, CALENDAR YEAR 2010
7.1.6 Summary of Future Activities
The following activities are anticipated for the BSG study area investigation during CY 2011:
Quarterly groundwater sampling will be conducted at four wells (CYN-MW9, CYN-MW10, CYN-MW11, and CYN-MW12) during CY 2011.
Semiannual groundwater sampling will be conducted at six wells (CYN-MW1D, CYN-MW3, CYN-MW4, CYN-MW6, CYN-MW7, and CYN-MW8) during the second and fourth quarters of CY 2011.
A report describing the subsurface soil sampling and well installation field activities will be prepared and submitted to the NMED.
Semiannual reporting of perchlorate analyses for CYN-MW6 will be performed.
7.1.7 Current Conceptual Model
Groundwater flow in the BSG study area is controlled by the local geologic framework and structural features described in the following sections.
7.1.7.1 Regional Hydrogeologic Conditions
The Manzanita Mountains are composed of a complex sequence of uplifted Precambrian metamorphic and granitic units that were subjected to significant deformation. These units are capped by Paleozoic sandstones, shales, and limestones of the Sandia Formation and Madera Group. The geologic history of the Manzanita Mountains is thoroughly described in the Groundwater Investigation, Canyons Test Area, Operable Unit 1333, Burn Site, Lurance Canyon (SNL November 2001) and utilizes the model presented by Brown et al. (1999). The local geology is also summarized in the Current Conceptual Model of Groundwater Flow and Contaminant Transport at Sandia National Laboratories/New Mexico Burn Site (SNL June 2004a and April 2008a). Groundwater in the Manzanita Mountains predominantly occurs in fractured metamorphic and intrusive units that consist of metavolcanics, quartzite, metasediments (schists and phyllites), and the Manzanita Granite. Groundwater migrates through bedrock fractures in a generally westward direction. The only perennial spring in the area, the Burn Site Spring, is located upgradient of the testing facilities at a limestone outcrop. The permeability of the fractured bedrock units is low and well yields are minimal. Groundwater discharges to small ephemeral springs located at the base of the Manzanita Mountains approximately 3 miles west of the Burn Site. Additionally, some groundwater may discharge as underflow to unconsolidated sedimentary deposits of the Albuquerque Basin. The Precambrian metamorphic rocks typically are fractured as a result of the long and complex history of regional deformation. Drill core data and exposures indicate that the fractures in shallow bedrock are filled with chemical precipitates such as calcium carbonate. The carbonate precipitation likely occurred when the water table was elevated prior to the development of the Rio Grande. As chemical precipitates filled the fractures, permeability was effectively reduced, creating a semiconfined unit above underlying bedrock with open fractures. The Burn Site is bisected by a north-south–trending system of faults, consisting locally of several high-angle normal faults that are downfaulted to the east. Faults (where exposed) are characterized by zones of crushing and brecciation. The Burn Site fault trends north to south in the vicinity of the Burn Site Well and well CYN-MW4. Nearby outcrops indicate that the fault displacement is approximately 160 ft.

BURN SITE GROUNDWATER 7-9
The canyon floor at the BSG study area consists of unconsolidated alluvial fill deposits over bedrock. These deposits typically are sand and gravel derived from erosion of upslope colluvium and bedrock. These alluvial deposits range in thickness from 21 to 55 ft as evidenced in borings drilled at the BSG study area.
7.1.7.2 Hydrogeologic Conditions at the BSG Study Area
When the Burn Site Well was drilled in 1986, the depth to groundwater-bearing strata was approximately 222 ft below ground surface. Following completion of the well in fractured bedrock, the water level rose approximately 150 ft due to positive head. The fractured rocks of the Manzanita Mountains are recharged by infiltration of precipitation, largely occurring from summer thundershowers and, to a lesser degree, winter snowfall on the higher elevations. Groundwater recharge is restricted by high evapotranspiration rates (losses to the atmosphere by evaporation and plant transpiration) and low permeability of the fractured bedrock. Regionally, groundwater in the western Manzanita Mountains flows generally toward the west from a groundwater flow divide located east of the BSG study area (SNL November 2001). Westward groundwater flow across Lurance Canyon discharges primarily as direct underflow to the unconsolidated basin-fill deposits of the Albuquerque Basin. Based on field observations, some discharge also occurs at springs along the mountain front. Much of the flow that discharges from these springs undergoes evapotranspiration. Some flow from the springs infiltrates nearby alluvial deposits. Annual precipitation in the Manzanita Mountains is in the form of rainfall and minor snowfall. July and August are typically the wettest months; 45 to 62 percent of annual precipitation falls during summer thunderstorms from July to October (National Weather Service, 2002). The average annual precipitation in this drainage basin is estimated to range between 12 and 16 inches (SNL April 2008a). Annual potential evapotranspiration in the Albuquerque area greatly exceeds annual precipitation. Because much of the rainfall in the Lurance Canyon drainage occurs during the summer, losses to evapotranspiration are high. A small percentage may infiltrate into the exposed bedrock or into alluvial deposits along the canyon floor. Ephemeral surface-water flows occur in response to precipitation in the drainage basin. Two piezometers (Figure 7-2) were constructed in Lurance Canyon to monitor moisture within the channel deposits at the contact with underlying Precambrian bedrock. No water was detected in either piezometer until September 2, 2004. After a series of rain events, between 1 and 2 inches of water was measured in 12AUP-01. The water level remained fairly constant through September 2004. However, more recent water level measurements show no measurable water in 12AUP-01. It is likely that significant saturation in the vadose zone occurs only after a series of significant rain events. Episodic accumulation of precipitation, as evidenced by the occurrence of water in the piezometer, may provide a mechanism for recharging the brecciated fault zones and uncemented fractures in the underlying bedrock.
7.1.7.3 Local Direction of Flow
Figure 7-3 presents the current potentiometric surface for the BSG monitoring well network (October 2010). Groundwater elevations presented in this potentiometric surface map reflect new survey coordinates. Until recently, Environmental Restoration (ER) Operations (formerly ER Project) survey coordinates were based on the New Mexico State Plane Coordinate System, Central Zone, North American Datum of 1927 and Northern Geographic Vertical Datum of 1929 for elevations. In order to be consistent with current SNL/NM Facilities and KAFB survey practices, ER Operations survey data now

7-10 A
NN
UA
L G
RO
UN
DW
AT
ER
MO
NIT
OR
ING
RE
PO
RT, C
AL
EN
DA
R Y
EA
R 2010
Figure 7-3. Burn Site Groundwater Potentiometric Surface Map (October 2010)

BURN SITE GROUNDWATER 7-11
are based on New Mexico State Plane Coordinate System, Central Zone, North American Datum of 1983 (NAD83) and North American Vertical Datum of 1988 (NAVD88) coordinates. Location information for wells surveyed before August 2010 has been mathematically converted to the new NAD83/NAVD88 coordinates using National Geodetic Survey-approved software. The general direction of groundwater flow beneath the BSG study area is to the west-southwest as indicated by the potentiometric surface. No water supply wells are located near the BSG study area, except for the Burn Site Well that is used only rarely (last pumped in 2003) for nonpotable applications such as fire suppression. Groundwater levels in the Paleozoic rocks near the BSG study area are not influenced by regional water supply well pumping from the basin-fill deposits of the Albuquerque Basin. The apparent horizontal groundwater gradient based on BSG monitoring wells, piezometers, and springs varies from approximately 0.004 to 0.14 feet per foot (SNL April 2008a). The hydraulic gradient west of the BSG study area flattens substantially. The wide range of hydraulic gradients in Lurance Canyon indicate that localized groundwater systems associated with brecciated fault zones in the low-permeability fractured bedrock at the BSG study area are poorly connected and are effectively compartmentalized. Limited groundwater flow velocity information is based on COC first-arrival estimates. Based on contaminant releases from SWMU 94F arriving at well CYN-MW1D, the minimum apparent velocity of the COCs is estimated to be approximately 160 ft/year (ft/yr) (SNL April 2008a). No information is available about vertical flow velocity within the fractured rocks at the BSG study area. However, vertical movement of water to the water table within the brecciated fault zones probably occurs as rapid, partially saturated to saturated flow. Filled fractures within the upper portion of metamorphic rock act as a semiconfined unit restricting vertical flow. Water levels have been routinely monitored in BSG wells since 1999. Figures 7C-1 through 7C-4 (Attachment 7C) show groundwater levels in BSG wells that are completed in bedrock. No substantial seasonal variation in water levels is evident in these wells. The wide range of hydraulic gradients in Lurance Canyon and the lack of correlation between water level fluctuations in these wells support the assessment that the low-permeability fractured groundwater system at the BSG study area is poorly connected. Water level fluctuations may be a result of local heterogeneities in hydraulic properties related to the fractured system. The BSG monitoring wells have shown significant groundwater declines over the past three to four years, with decreases in water levels ranging from 0.7 to 2.8 ft/yr. Declining water levels may be due to reduced amounts of precipitation.
7.1.7.4 Contaminant Sources
Nitrate in the BSG study area may be derived from both natural and anthropogenic sources. The NMED-specified background concentration for nitrate in groundwater is 4 mg/L. Potential natural sources include the weathering of sedimentary rocks and atmospheric deposition. Evaporation and transpiration of rainwater that has infiltrated canyon alluvial sediments can increase nitrate concentrations. Potential anthropogenic nitrate sources include septic systems and the degradation of HE materials. Some evidence indicates that evaporation and transpiration may concentrate nitrate in sediments beneath ephemeral drainages in the vicinity of the Manzanita Mountains. This evidence includes nitrate concentrations that exceed the MCL in groundwater beneath these drainages and a chloride to nitrate ratio in groundwater that is similar to the chloride to nitrate ratio in rainfall. SWMU 65 is located in the center of the BSG study area and contains open-air detonation areas where nitrate-based explosives were used. The detonations may have dispersed HE materials across the ground surface, and subsequent degradation (weathering) of these HE materials most likely released nitrate. SWMU 94 testing also involved burning HE material and propellants. Nitrate is highly soluble in water,

7-12 ANNUAL GROUNDWATER MONITORING REPORT, CALENDAR YEAR 2010
and precipitation can enhance the migration of nitrate to groundwater. In addition to nitrate, petroleum products were detected in soil samples; therefore, the potential for petroleum products in groundwater required further evaluation.
7.1.7.5 Contaminant Distribution and Transport in Groundwater
Nitrate was first detected above the MCL of 10 mg/L in groundwater samples from the Burn Site Well. Since the completion of wells CYN-MW1D (December 1997), CYN-MW3 (June 1999), CYN-MW6 (February 2006), CYN-MW9, CYN-MW10, and CYN-MW12 (July 2010), nitrate concentrations that exceed the MCL have been consistently detected in samples from these six wells. Nitrate concentrations in samples from CYN-MW11 are near or just above the MCL. Nitrate concentrations in groundwater samples from wells CYN-MW4, CYN-MW7, and CYN-MW8 have not exceeded the MCL. Nitrate concentrations in groundwater samples from the Burn Site Well decreased from 24.3 mg/L in 1996 to 5.5 mg/L in 2001. Concentrations in groundwater samples from well CYN-MW6, approximately 1,000 ft downgradient of the Burn Site Well, have ranged from 22.9 to 39.9 mg/L since 2006. Concentrations in groundwater samples from well CYN-MW3, located approximately 1,400 ft downgradient of the Burn Site Well, have ranged from less than 5 to 15 mg/L since 1999. Nitrate concentrations have increased from approximately 10 to more than 25 mg/L from 1998 to 2008 in groundwater samples from well CYN-MW1D, located approximately 3,400 ft downgradient of the Burn Site Well. Potential downgradient receptors for the nitrate plume are Coyote Springs, approximately 3 miles west of the study area, and the City of Albuquerque (COA) and KAFB well fields, approximately 12 miles to the west-northwest of the study area. Numerical simulations suggest nitrate concentrations will be decreasing in groundwater to below the MCL at Coyote Springs and to below MDLs through dispersion and dilution as the plume moves into the more hydraulically conductive Ancestral Rio Grande deposits west of Coyote Springs. Numerical simulations also show that contaminant travel times exceed 600 years from the study area to the COA and KAFB well fields (SNL May 2005).
7.2 Regulatory Criteria
The NMED Hazardous Waste Bureau provides regulatory oversight of SNL/NM ER Operations as well as implements and enforces federal regulations mandated by the Resource Conservation and Recovery Act (RCRA). All ER SWMUs and Areas of Concern (AOCs) are listed in Module IV of the SNL/NM RCRA Part B Operating Permit, Special Conditions Pursuant to the 1984 Hazardous and Solid Waste Amendments (HSWA) to RCRA for Sandia National Laboratories (NMED 1993). All investigations and corrective action requirements pertaining to SWMUs and AOCs are contained in the Order (NMED April 2004). The groundwater monitoring activities for BSG are not associated with a single SWMU but are more regional in nature. Before the effectiveness of the Order in April 2004, groundwater investigations at the BSG study area had been conducted voluntarily by ER Operations. Initially, groundwater monitoring for the BSG was initiated to satisfy the requirements of the SNL/NM HSWA permit for characterization of SWMUs. The Order transferred regulatory authority for corrective action requirements from the HSWA module to the Order. The BSG investigation must comply with requirements set forth in the Order for site characterization and the development of a CME. In response to the Order, DOE/Sandia submitted the following two documents to the NMED: (1) Current Conceptual Model of Groundwater Flow and Contaminant Transport at Sandia National Laboratories/New Mexico Burn Site (SNL June 2004a), and (2) Corrective Measures Evaluation Work Plan for Sandia National Laboratories/New Mexico Burn Site (SNL June 2004b). The current conceptual

BURN SITE GROUNDWATER 7-13
site model provides site-specific characteristics by which remedial alternatives were evaluated. The CME Work Plan provides a description and justification of which remedial alternatives were considered and the methods and criteria to be used in the evaluation. The CME Work Plan was completed to comply with requirements set forth in the Order and with the guidance of the RCRA Corrective Action Plan (EPA 1994). On March 1, 2005, the DOE and Sandia received a letter from the NMED (February 2005) that rejected the CME Work Plan and stipulated the following requirements:
DOE/Sandia must prepare and submit an IMWP within 90 days from the receipt of the letter (by May 30, 2005).
The NMED requires additional characterization of the nitrate-contaminated groundwater near the BSG study area. Specifically, the downgradient extent of groundwater with nitrate concentrations greater than 10 mg/L shall be determined.
The NMED does not accept the Corrective Measures Evaluation Work Plan for Sandia National Laboratories/New Mexico Burn Site (SNL June 2004b) because it is not satisfied with the existing characterization of nitrate-contaminated groundwater near the BSG study area.
The NMED also requires the installation of one additional monitoring well “adjacent to SWMU-94F in order to establish groundwater conditions in this petroleum-contamination source area.”
The DOE and Sandia submitted an IMWP to the NMED in May 2005 that proposed the installation of additional groundwater monitoring wells to characterize the extent of nitrate contamination in the bedrock aquifer downgradient of CYN-MW1D and fuel-related compounds downgradient of SWMU 94F (SNL May 2005). The selected interim measures described in the IMWP included additional well installation, groundwater monitoring, and institutional controls. These interim measures were proposed to serve three purposes: (1) provide data to support the CME; (2) monitor the migration of the nitrate plume in order to provide an early warning system to trigger an action if a danger to downgradient ecological receptors (Coyote Springs) becomes apparent; and (3) protect human health and the environment by limiting exposure to contaminated groundwater by restricting access to the monitoring wells. In support of the selected interim measures, the IMWP included the following reports as attachments: (1) Remedial Alternatives Data Gaps Review, (2) Nitrate Source Evaluation, and (3) Evaluation of Contaminant Transport. The Data Gaps Review document included detailed definitions of remedial alternatives and a preliminary evaluation of remedial alternatives with the purpose of identifying data gaps. One of the data gaps identified included determining background nitrate concentrations and evaluating the potential for a residual source of nitrate in the vadose zone. The investigation initiated to fill this data gap and the analytical results were presented in the Nitrate Source Evaluation. The Evaluation of Contaminant Transport consisted of a simplified cross-sectional modeling approach to simulate transport and dilution of nitrate between the current location of nitrate in BSG and potential human and ecological receptors (SNL May 2005). Data collected as part of additional characterization required by the IMWP were incorporated into an updated version of the conceptual site model (SNL April 2008a). The updated conceptual site model provides the basis for a technically defensible remediation program that was developed and documented in the CME Work Plan (SNL April 2008b), the results of which will eventually be documented in the CME Report. The April 2008 CME Work Plan was developed to address the concerns outlined in the

7-14 ANNUAL GROUNDWATER MONITORING REPORT, CALENDAR YEAR 2010
letter from the NMED (February 2005) and to comply with requirements of the Order. The work plan provides information and data gathered during interim measures and performance and compliance goals and objectives for the remediation of the BSG. A letter was received from the NMED by DOE/Sandia on April 30, 2009, entitled, Perchlorate Contamination in Groundwater, Sandia National Laboratories, EPA ID #NM5890110518 (NMED April 2009). The NMED’s letter discussed the occurrence of perchlorate in groundwater at concentrations at or greater than 1 µg/L at various locations at SNL/NM. The letter also states that DOE/Sandia must characterize the nature and extent of the perchlorate contamination at the BSG study area and submit to the NMED a plan for such characterization. DOE/Sandia met with the NMED in June and July 2009 (SNL June 2009b and July 2009) and submitted a letter requesting an extension to November 30, 2009 (DOE July 2009). The results of the discussions at the June and July meetings (SNL June 2009b and July 2009) have been incorporated into the BSG Characterization Work Plan (SNL/NM November 2009). In February 2010, DOE/Sandia received notice of conditional approval for the November 2009 BSG Characterization Work Plan (NMED February 2010). In July 2010, DOE/Sandia implemented the requirements of the work plan and completed subsurface soil sampling at 10 deep soil boring locations to determine contaminant sources and installed four groundwater monitoring wells to determine the extent of groundwater contamination. Based on an outstanding schedule commitment, DOE/Sandia submitted an extension request for the BSG CME Report in September 2010 (SNL September 2010), which was approved by the NMED (October 2010). In this report, BSG monitoring data are being presented for both hazardous and radioactive constituents; however, the monitoring data for radionuclides (gamma spectroscopy, gross/beta activity, and tritium) are provided voluntarily by the DOE/Sandia. The voluntary inclusion of such radionuclide information shall not be enforceable and shall not constitute the basis for any enforcement because such information falls wholly outside the requirements of the Order. Additional information on radionuclides and the scope of the Order is available in Section III.A of the Order (NMED April 2004).
7.3 Scope of Activities
The activities for the BSG investigation conducted during this reporting period, including plans and reports, are listed in Section 7.1.5. The field activity discussed in this section is groundwater monitoring sampling and analysis, including the February/March through October/November 2010 sampling events (Table 7-3). The analytical parameters for each well and each sampling event are listed in Table 7-4. Quality control (QC) samples are collected in the field at the time of environmental sample collection. Field QC samples include duplicate samples, split samples, equipment blank (EB), field blank (FB), and trip blank (TB) samples. Duplicate samples are used to measure the precision of the sampling process. Split samples are used to verify the performance of the analytical laboratory. EB samples are used to verify the effectiveness of sampling equipment decontamination procedures. FB samples provide a check for potential ambient sources of sample contamination during the sampling process and/or sampling error. TB samples are used to determine whether volatile organic compounds (VOCs) contaminated the sample during preparation, transportation, and handling prior to receipt by the analytical laboratory.

BURN SITE GROUNDWATER 7-15
Table 7-3. Groundwater Monitoring Well Network and Sampling Dates for the Burn Site Groundwater Study Area, Calendar Year 2010
Date of Sampling Event Wells Sampled(1) SAP February and March 2010 CYN-MW1D
CYN-MW3 CYN-MW4 CYN-MW6 CYN-MW7 CYN-MW8
Burn Site Groundwater Monitoring, Mini-SAP for Second Quarter Fiscal Year 2010 (SNL February 2010)
May and June 2010 CYN-MW1D CYN-MW3 CYN-MW4 CYN-MW6 CYN-MW7 CYN-MW8
Burn Site Groundwater Monitoring, Mini-SAP for Third Quarter Fiscal Year 2010 (SNL May 2010)
September 2010 CYN-MW1D CYN-MW3 CYN-MW4 CYN-MW6 CYN-MW7
CYN-MW8 CYN-MW9 CYN-MW10 CYN-MW11 CYN-MW12
Burn Site Groundwater Monitoring, Mini-SAP for Fourth Quarter Fiscal Year 2010 (SNL August 2010)
October and November 2010 CYN-MW9 CYN-MW10 CYN-MW11 CYN-MW12
Burn Site Groundwater Monitoring, Mini-SAP for First Quarter Fiscal Year 2011 (SNL October 2010b)
NOTE: (1) Refer to page xviii of this report for well descriptions. SAP = Sampling and analysis Plan. SNL = Sandia National Laboratories.

7-16 ANNUAL GROUNDWATER MONITORING REPORT, CALENDAR YEAR 2010
Table 7-4. Parameters Sampled at Burn Site Groundwater Study Area Wells(1) for Each Sampling Event, Calendar Year 2010
Parameter February/March 2010 NPN TPH-DRO TPH-GRO
CYN-MW1D CYN-MW3 CYN-MW4 CYN-MW6 CYN-MW7 CYN-MW7 (dup) CYN-MW8
Perchlorate CYN-MW6 Parameter May/June 2010
TPH-GRO CYN-MW1D CYN-MW3 CYN-MW4 CYN-MW6 CYN-MW7 CYN-MW7 (dup) CYN-MW8
Parameter September 2010 Anions Bicarbonate/carbonates Cations Gamma Spec* Gross Alpha Gross Beta Isotopic Uranium NPN TAL Metals, plus Total Uranium TPH-DRO TPH-GRO Tritium VOCs
CYN-MW1D CYN-MW3 CYN-MW4 CYN-MW4 (dup) CYN-MW6 CYN-MW7 CYN-MW8 CYN-MW9 CYN-MW9 (dup) CYN-MW10 CYN-MW11 CYN-MW12
SVOCs HE
CYN-MW9 CYN-MW9 (dup) CYN-MW10 CYN-MW11 CYN-MW12
Perchlorate CYN-MW6 CYN-MW9 CYN-MW9 (dup) CYN-MW10 CYN-MW11 CYN-MW12
Parameter October/November 2010 HE NPN Perchlorate SVOCs TPH-DRO TPH-GRO VOCs
CYN-MW9 CYN-MW10 CYN-MW10 (dup) CYN-MW11 CYN-MW12
NOTE: (1) Refer to page xviii of this report for well descriptions. DRO = Diesel range organics. dup = duplicate sample. Gamma Spec* = Gamma spectroscopy short list (Americium-241, Cesium-137, Cobalt-60, and Potassium-40). GRO = Gasoline range organics. HE = High explosives. NPN = Nitrate plus nitrate (reported as nitrogen). SVOC = Semivolatile organic compound.
TAL = Target Analyte List. TPH = Total petroleum hydrocarbons. VOC = Volatile organic compound.
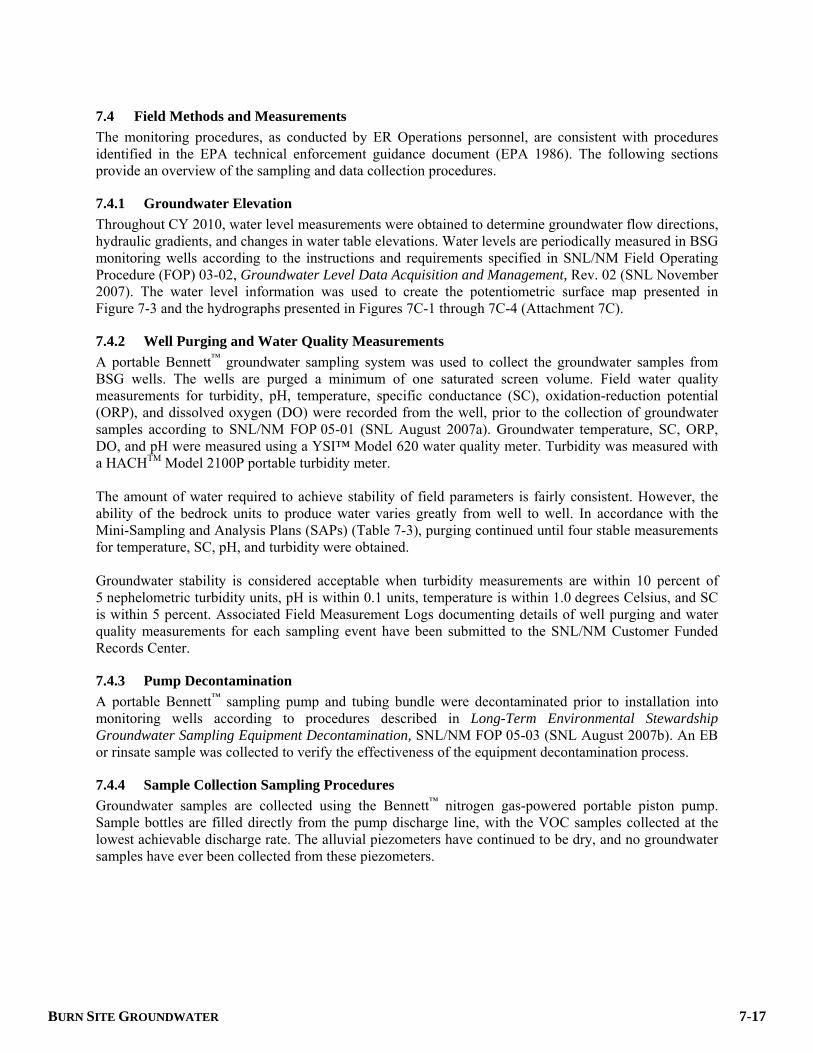
BURN SITE GROUNDWATER 7-17
7.4 Field Methods and Measurements
The monitoring procedures, as conducted by ER Operations personnel, are consistent with procedures identified in the EPA technical enforcement guidance document (EPA 1986). The following sections provide an overview of the sampling and data collection procedures.
7.4.1 Groundwater Elevation
Throughout CY 2010, water level measurements were obtained to determine groundwater flow directions, hydraulic gradients, and changes in water table elevations. Water levels are periodically measured in BSG monitoring wells according to the instructions and requirements specified in SNL/NM Field Operating Procedure (FOP) 03-02, Groundwater Level Data Acquisition and Management, Rev. 02 (SNL November 2007). The water level information was used to create the potentiometric surface map presented in Figure 7-3 and the hydrographs presented in Figures 7C-1 through 7C-4 (Attachment 7C).
7.4.2 Well Purging and Water Quality Measurements
A portable Bennett™ groundwater sampling system was used to collect the groundwater samples from BSG wells. The wells are purged a minimum of one saturated screen volume. Field water quality measurements for turbidity, pH, temperature, specific conductance (SC), oxidation-reduction potential (ORP), and dissolved oxygen (DO) were recorded from the well, prior to the collection of groundwater samples according to SNL/NM FOP 05-01 (SNL August 2007a). Groundwater temperature, SC, ORP, DO, and pH were measured using a YSI™ Model 620 water quality meter. Turbidity was measured with a HACHTM Model 2100P portable turbidity meter. The amount of water required to achieve stability of field parameters is fairly consistent. However, the ability of the bedrock units to produce water varies greatly from well to well. In accordance with the Mini-Sampling and Analysis Plans (SAPs) (Table 7-3), purging continued until four stable measurements for temperature, SC, pH, and turbidity were obtained. Groundwater stability is considered acceptable when turbidity measurements are within 10 percent of 5 nephelometric turbidity units, pH is within 0.1 units, temperature is within 1.0 degrees Celsius, and SC is within 5 percent. Associated Field Measurement Logs documenting details of well purging and water quality measurements for each sampling event have been submitted to the SNL/NM Customer Funded Records Center.
7.4.3 Pump Decontamination
A portable Bennett™ sampling pump and tubing bundle were decontaminated prior to installation into monitoring wells according to procedures described in Long-Term Environmental Stewardship Groundwater Sampling Equipment Decontamination, SNL/NM FOP 05-03 (SNL August 2007b). An EB or rinsate sample was collected to verify the effectiveness of the equipment decontamination process.
7.4.4 Sample Collection Sampling Procedures
Groundwater samples are collected using the Bennett™ nitrogen gas-powered portable piston pump. Sample bottles are filled directly from the pump discharge line, with the VOC samples collected at the lowest achievable discharge rate. The alluvial piezometers have continued to be dry, and no groundwater samples have ever been collected from these piezometers.

7-18 ANNUAL GROUNDWATER MONITORING REPORT, CALENDAR YEAR 2010
7.4.5 Sample Handling and Shipment
The SNL/NM Sample Management Office (SMO) processes environmental samples collected by ER Operations personnel. The SMO reviews the Mini-SAPs, orders sample containers, issues sample control and tracking numbers, tracks the chain-of-custody, and reviews analytical results returned from the laboratories for laboratory contract compliance (SNL March 2003b and April 2007). All groundwater samples are analyzed by off-site laboratories using EPA-specified protocols. QC samples are also prepared at the laboratory to determine whether contaminant chemicals are introduced in laboratory processes and procedures. These include method blanks, laboratory control samples, matrix spike, matrix spike duplicate, and surrogate spike samples. Reported laboratory analytical and QC data are reviewed against quality assurance requirements specified in the Procedure for Completing the Contract Verification Review, SMO-05-03, Issue 03 (SNL April 2007) and Administrative Operating Procedure (AOP) 00-03, Data Validation Procedure for Chemical and Radiochemical Data (SNL July 2007).
7.4.6 Waste Management
Purge and decontamination water generated from sampling activities were placed into 55-gallon containers and stored at the ER Operations Field Office waste accumulation area. All waste was managed in accordance with FOP 05-04 (SNL August 2007c) as nonregulated waste, based on historical sampling results and process knowledge of the monitoring well location. Results for associated environmental samples provide supplemental data for approval to discharge water to the sanitary sewer. All data were compared with COA discharge limits.
7.5 Analytical Methods
Groundwater samples were submitted to GEL Laboratories, Inc. (GEL) for analysis. Samples were analyzed in accordance with applicable EPA analytical methods (Tables 7-5 and 7-6), including the following:
The Determination of Inorganic Anions in Water by Ion Chromatography-Method 300.0 (EPA 1983).
Test Methods for Evaluating Solid Waste, Physical/Chemical Methods, SW-846, 3rd ed., Rev. 1 (and updates) (EPA 1996).
Perchlorate in Drinking Water Using Ion Chromatography (EPA 1999).
Prescribed Procedures for Measurement of Radioactivity in Drinking Water, EPA-600/4-80-032 (EPA 1980).

BURN SITE GROUNDWATER 7-19
Table 7-5. Burn Site Groundwater Study Area Chemical Analytical Methods Analyte Analytical Methoda,b,c
Anions SW846-9056 Bicarbonate/carbonates SM 2320B Cations SW846-6020 HE SW846-8321A Mod NPN EPA 353.2 Perchlorate EPA 314.0 SVOCs SW846-8270 TAL Metals, plus Total Uranium SW846-6020/7470 TPH Diesel Range Organics SW846-8015 TPH Gasoline Range Organics SW846-8015 VOCs SW846-8260
NOTES: aU.S. Environmental Protection Agency, 1996, Test Methods for Evaluating Solid Waste, Physical/Chemical Methods, SW-846, 3rd ed., Rev. 1, U.S. Environmental Protection Agency, Washington, D.C. bU.S. Environmental Protection Agency, 1983, The Determination of Inorganic Anions in Water by Ion Chromatography-Method 300.0, EPA-600/4-84-017. cU.S. Environmental Protection Agency, 1999, Perchlorate in Drinking Water Using Ion Chromatography, EPA 815/R-00-014. EPA = U.S. Environmental Protection Agency. HE = High explosives. NPN = Nitrate plus nitrite (reported as nitrogen). SW = Solid waste. SVOC = Semi volatile organic compound. TAL = Target Analyte List. TPH = Total petroleum hydrocarbons. VOC = Volatile organic compound.
Table 7-6. Burn Site Groundwater Study Area Radiochemical Analytical Methods Analyte Analytical Methoda
Gamma Spectroscopy (short list) EPA 901.0 Gross Alpha/Beta EPA 900.0 Isotopic Uranium ASTM D3972-09M Tritium EPA 906.0
NOTES: aU.S. Environmental Protection Agency, 1980. Prescribed Procedures for Measurement of Radioactivity in Drinking Water, EPA-600/4-80-032, U.S. Environmental Protection Agency, Cincinnati, Ohio. EPA = U.S. Environmental Protection Agency.
7.6 Summary of Analytical Results
This section discusses analytical results, exceedances of regulatory standards, and pertinent trends in COC concentrations. The analytical results and field measurements for the CY 2010 BSG sampling events are presented in Tables 7A-1 through 7A-10 (Attachment 7A). Data qualifiers are explained in the footnotes following Table 7A-10. A summary of detected VOC and semivolatile organic compound (SVOC) results is presented in Table 7A-1. The MDLs for all analyzed VOCs and SVOCs are listed in Table 7A-2. The only VOC detected was carbon disulfide (Table 7A-1). Carbon disulfide was reported at concentrations of 1.58 J (where “J” is an estimated value below the laboratory practical quantitation limit) for samples from monitoring well CYN-MW1D. No HE compounds were detected. The MDLs for all analyzed HE compounds are listed in Table 7A-3.

7-20 ANNUAL GROUNDWATER MONITORING REPORT, CALENDAR YEAR 2010
The analytical results for nitrate plus nitrite (NPN) (reported as nitrogen) are presented in Table 7A-4. NPN results exceed the MCL of 10 mg/L in samples from CYN-MW1D, CYN-MW3, CYN-MW6, CYN-MW9, CYN-MW10, CYN-MW11, and CYN-MW12. NPN concentrations in samples from the other BSG wells are less than the MCL (Table 7A-4). For CY 2010, the NPN concentrations for wells exceeding the MCL are summarized as follows:
CYN-MW1D had reported concentrations of 13.4 mg/L (February 2010), 12.4 mg/L (February 2010, reanalysis), and 12.2 mg/L (September 2010). The historical range of NPN concentrations for CYN-MW1 is less than 1 to 28 mg/L with highly variable fluctuations in concentrations and a slightly decreasing trend (Figure 7B-1).
CYN-MW3 had reported concentrations of 10.4 mg/L (March 2010) and 12.0 mg/L (September 2010). The historical range of NPN concentrations for CYN-MW3 is approximately 4 to 15 mg/L with a slightly decreasing trend (Figure 7B-2).
CYN-MW6 had reported concentrations of 35.8 mg/L (March 2010) and 29.9 mg/L (September 2010). The historical range of NPN concentrations for CYN-MW6 is approximately 23 to 40 mg/L with an overall increasing trend (Figure 7B-3).
CYN-MW9 had reported concentrations of 30.1 mg/L (September 2010), 30.1 mg/L (September 2010, duplicate), and 36.6 mg/L (October 2010). Two sampling events are insufficient to determine a trend (Figure 7B-4).
CYN-MW10 had reported concentrations of 11.0 mg/L (September 2010), 11.4 mg/L (November 2010), and 11.4 mg/L (November 2010, duplicate). Two sampling events are insufficient to determine a trend (Figure 7B-5).
CYN-MW11 had reported concentrations of 10.0 mg/L (September 2010) and 10.6 mg/L (November 2010). Two sampling events are insufficient to determine a trend (Figure 7B-6).
CYN-MW12 had reported concentrations of 12.2 mg/L (September 2010) and 14.4 mg/L (November 2010). Two sampling events are insufficient to determine a trend (Figure 7B-7).
The results for TPH are listed for TPH-DRO and TPH-GRO in Table 7A-5. No MCLs have been established for TPH-DRO or TPH-GRO. No detections of TPH-DRO were reported for any of the samples collected during the CY 2010 sampling events. Detections of TPH-GRO were reported for the February sampling event, with values ranging from 17.8 to 30.5 g/L. However, all TPH–GRO results were rejected during data validation, which initiated an additional round of sampling for TPH–GRO in June 2010. All TPH–GRO results for the June and September 2010 sampling events were qualified as not detected during data validation. All TPH-GRO results for the October/November 2010 samples were not detected (Table 7A-5). The analytical results for anions, cations, and alkalinity are presented in Table 7A-6. None of the analytes exceed MCLs, where established. Perchlorate was not detected above the MDL of 4 g/L in any of the samples collected from the new wells CYN-MW9, CYN-MW10, CYN-MW11, or CYN-MW12. Perchlorate was detected above the MDL of 4 g/L in samples collected from CYN-MW6 (Table 7A-7). Perchlorate concentrations for the

BURN SITE GROUNDWATER 7-21
samples from CYN-MW6 are estimated values and range from 4.59 J to 6.14 J g/L. Currently, no MCL is established for perchlorate. However, perchlorate is a COC for the BSG study area because it exceeds the NMED-specified screening level/MDL of 4 g/L (NMED April 2004). Figure 7B-8 (Attachment 7B) shows that the perchlorate concentration in this well has historically exceeded the screening level/MDL of 4 g/L, but exhibits a slightly decreasing trend. Total metal results are presented in Table 7A-8. No metals exceed established MCLs. Groundwater samples were analyzed for tritium, gross alpha/beta activity, and gamma spectroscopy. The results are presented in Table 7A-9. All radionuclide activities are below MCLs, where established. Gamma spectroscopy analysis detected no isotopes above the associated minimum detectable activity. Field water quality parameters are measured during sample purging of each well prior to sampling and include temperature, SC, ORP, pH, turbidity, and DO. The parameter measurements obtained immediately prior to sample collection are presented in Table 7A-10.
7.7 Quality Control Results
Field and laboratory QC samples were prepared to determine the accuracy of the methods used and to detect inadvertent sample contamination that may have occurred during the sampling and analysis process. All chemical data were reviewed and qualified in accordance with AOP 00-03, Data Validation Procedure for Chemical and Radiochemical Data (SNL July 2007). Although some analytical results were qualified during the data validation process, no significant data quality problems were noted for BSG COCs. Data validation qualifiers are provided with the analytical results in Tables 7A-1 through 7A-9 (Attachment 7A). The data validation report associated with each sampling event has been submitted to the SNL/NM Customer Funded Records Center. The following sections discuss site-specific QC results for the BSG quarterly sampling events.
7.7.1 Field Quality Control Samples
Field QC samples included environmental duplicate, EB, and TB, and FB samples. The field QC samples were submitted for analysis along with the groundwater samples in accordance with QC procedures specified in the Mini-SAPs (SNL February 2010, May 2010, August 2010, and October 2010b).
7.7.1.1 Duplicate Environmental Samples
Duplicate environmental samples were analyzed in order to estimate the overall reproducibility of the sampling and analytical process. A duplicate sample is collected immediately after the original environmental sample in order to reduce variability caused by time and/or sampling mechanics. The results of duplicate sample analyses (detected parameters only) are used to calculate relative percent difference (RPD) values. Duplicate sample results show good correlation (RPD values less than 20) for all calculated parameters.
7.7.1.2 Equipment Blank Samples
A portable Bennett™ groundwater sampling system was used to collect groundwater samples in all wells. The sampling pump and tubing bundle were decontaminated prior to installation into monitoring wells according to procedures described in SNL/NM FOP 05-03 (SNL August 2007b). An EB or rinsate sample was collected to verify the effectiveness of the equipment decontamination process. The results of the EB sample analyses are as follows:
February/March 2010 Sampling Event at CYN-MW7—An EB sample was collected prior to sampling and analyzed for NPN, TPH-DRO, and TPH-GRO. The results for the February 2010 sample showed detections of NPN and TPH-GRO. NPN was reported at a

7-22 ANNUAL GROUNDWATER MONITORING REPORT, CALENDAR YEAR 2010
concentration of 0.0885 mg/L, but this result was qualified as not detected during data validation due to associated laboratory method blank contamination. The result for TPH-GRO was qualified as unusable during data validation.
May/June 2010 Sampling Event at CYN-MW7—The EB sample was collected prior to sampling CYN-MW7 and analyzed for NPN, TPH-DRO, and TPH-GRO. No parameters were detected above the associated laboratory MDLs.
September 2010 Sampling Events at CYN-MW4 and CYN-MW9—The EB samples were collected prior to sampling CYN-MW4 and CYN-MW9 and analyzed for all parameters. Bromodichloromethane, bromoform, carbon disulfide, chloroform, chloromethane, dibromochloromethane, and toluene were detected above the laboratory MDLs. No corrective action was necessary as these compounds were not detected in the associated environmental samples. Inorganic analytes detected in the EB samples included antimony, calcium, copper, chloride, sodium, and zinc. No corrective action was required for antimony, calcium, chloride, and sodium as the associated sampling results were greater than five times the EB result. The results for copper in CYN-MW9 samples and zinc in CYN-MW4 samples were qualified as not detected during data validation as these parameters were detected in the EB samples at concentrations less than five times the environmental sampling results.
October/November 2010 Sampling Events at CYN-MW10—The EB sample was collected prior to sampling CYN-MW10 and analyzed for all parameters. Bromodichloromethane, chloroform, and dibromochloromethane were detected above the laboratory MDLs. No corrective action was necessary as these compounds were not detected in the associated environmental sample.
7.7.1.3 Trip Blank Samples
TB samples are submitted whenever samples are collected for VOC analysis to assess whether contamination of the samples has occurred during shipment and storage. The TB samples consist of laboratory reagent grade water with hydrochloric acid preservative contained in 40-milliliter volatile organic analysis vials prepared by the analytical laboratory, which accompany the empty sample containers supplied by the laboratory. The TBs were brought to the field and accompanied each sample shipment.
May/June 2010 Sampling Event—Due to detections of TPH-GRO in environmental samples, seven TB samples were submitted for TPH-GRO analysis during the May/June 2010 resampling event. TPH-GRO was detected above the MDL in the TB samples associated with CYN-MW4, CYN-MW6, and CYN-MW7. No corrective action was required for the CYN-MW6 TB sample result as TPH-GRO was not detected in the environmental sample. The result for the TB sample associated with CYN-MW4 was qualified as not detected during data validation due to associated laboratory method blank contamination. TPH-GRO was detected in the TB sample associat4ed with CYN-MW7 at a concentration of 30.6 g/L; however, as this result is greater than the results for the environmental and duplicate samples, the results for both the CYN-MW7 environmental and duplicate samples were qualified as not detected during data validation.
BURN SITE GROUNDWATER 7-23
September 2010 Sampling Event—A total of 12 TB samples were submitted with the September 2010 samples. Chloromethane was detected above the MDL in the TB samples associated with CYN-MW4, CYN-MW7, and CYN-MW10. No corrective action was necessary as the compound was not detected in associated environmental samples. TPH-GRO was detected in all TB samples at concentrations ranging from 11.0 to 31.3 g/L. Therefore, the results for environmental samples with detected TPH-GRO at concentrations less than five times the TB concentration were qualified as not detected during data validation.
October/November 2010 Sampling Event—A total of five VOC and TPH-GRO TB
samples were submitted with the October/November 2010 samples. Chloromethane and toluene were detected above the MDL in various TB samples. TPH-GRO was detected in the TB sample associated with CYN-MW12 at a concentration 11.0 g/L. No corrective action was necessary as these compounds were not detected in associated environmental samples.
7.7.1.4 Field Blank Samples
FB samples were collected to assess whether contamination of the samples resulted from ambient field conditions. The FB samples were prepared by pouring deionized water into sample containers at a sampling point to simulate the transfer of environmental samples from the sampling system to the sample container.
May/June 2010 Sampling Event—An FB sample was collected at the CYN-MW6 sampling point. TPH-DRO was detected above the laboratory MDL, but no corrective action was necessary as TPH-DRO was not detected in the associated CYN-MW6 environmental sample.
September 2010 Sampling Event—An FB sample was collected at the CYN-MW12 sampling point. The VOC compounds bromodichloromethane, chloroform, and dibromochloromethane were detected above laboratory MDLs. No corrective action was necessary as these compounds were not detected in the associated CYN-MW12 environmental sample.
October/November 2010 Sampling Event—An FB sample was collected at the CYN-MW10 sampling point. The VOC compounds bromodichloromethane, chloroform, and dibromochloromethane were detected above laboratory MDLs. No corrective action was necessary as these compounds were not detected in the associated environmental sample.
7.7.2 Laboratory Quality Control Samples
Internal laboratory QC samples, including method blanks and duplicate laboratory control samples were analyzed concurrently with all groundwater samples. All chemical data were reviewed and qualified in accordance with AOP 00-03, Data Validation Procedure for Chemical and Radiochemical Data (SNL July 2007). Laboratory data qualifiers are provided with the analytical results in Tables 7A-1 through 7A-9 (Attachment 7A).

7-24 ANNUAL GROUNDWATER MONITORING REPORT, CALENDAR YEAR 2010
7.8 Variances and Nonconformances
No variances or nonconformances from field or sampling requirements specified in the BSG monitoring Mini-SAPs (SNL February 2010, May 2010, August 2010, and October 2010b) occurred during sampling activities. The following project-specific issues associated with the CY 2010 sampling events for BSG occurred:
February/March 2010 Sampling Event—Monitoring well CYN-MW6 was purged dry, allowed to recover, and then sampled to collect the most representative groundwater sample possible. TPH-GRO results were qualified as unusable and the following additional tests were performed. SNL/NM personnel collected several field QC samples including FB, TB, and EB samples in May 2010. SNL/NM submitted the samples to GEL with several empty 40-milliliter vials and various laboratory-prepared TB samples for analysis. Siloxane compounds detected in various samples have been attributed to the sample containers and acid preservative.
September 2010 Sampling Event—SNL/NM field team members did not include TB samples specific for TPH-GRO analysis. SNL/NM contacted GEL and requested that TPH-GRO TB analysis be performed using extra volume from the VOC TB samples. The error was not discovered until completion of several analyses, and GEL reanalyzed the samples from CYN-MW4, CYN-MW7, and CYN-MW8 outside holding time requirements. Request for data validation of the CYN-MW3 anion reanalysis was not initially performed by SNL/NM SMO personnel. Data validation for the reanalysis was completed in December 2010.
7.9 Summary and Conclusions
This section provides a brief summary of activities, discussion of COCs that exceed standards, trends of concentrations versus time, the current conceptual site model, and plans for studies to be completed during CY 2011 at the BSG study area. The BSG study area is located in the vicinity of the active Lurance Canyon Burn Site facility. Groundwater investigations were initiated in 1997 at the request of the NMED after elevated nitrate levels were discovered in the nonpotable Burn Site Well. The study area currently consists of 10 monitoring wells. Wells were sampled during February/March 2010, May/June 2010, September 2010, and October/November 2010. The samples were analyzed for VOCs, SVOCs, HE, TPH-DRO, TPH-GRO, anions, NPN, Target Analyte List metals (plus uranium), anions, bicarbonate/carbonates, cations, gross alpha/beta activity, tritium, and radionuclides by gamma spectroscopy. As required by the NMED, semiannual sampling for perchlorate was conducted at CYN-MW6, and quarterly sampling for perchlorate was conducted at the four new monitoring wells CYN-MW9, CYN-MW10, CYN-MW11, and CYN-MW12. Only NPN was detected at concentrations exceeding the MCL of 10 mg/L in samples from the following BSG study area wells: CYN-MW1D, CYN-MW3, CYN-MW6, CYN-MW9, CYN-MW10, CYN-MW11, and CYN-MW12. The maximum concentration reported was 36.6 mg/L in the sample collected from CYN-MW9 during the October 2010 sampling event. For CY 2010, the NPN concentrations for samples from wells exceeding the MCL are summarized as follows:
CYN-MW1D had reported concentrations of NPN at 13.4, 12.4, and 12.2 mg/L. The historical range of NPN concentrations for CYN-MW1 is less than 1 to 28 mg/L with highly variable fluctuations in concentrations and a slightly decreasing trend.

BURN SITE GROUNDWATER 7-25
CYN-MW3 had reported concentrations of NPN at 10.4 and 12.0 mg/L. The historical range of NPN concentrations for CYN-MW3 is approximately 4 to 15 mg/L with a slightly decreasing trend.
CYN-MW6 had reported concentrations of NPN at 35.8 and 29.9 mg/L. The historical
range of NPN concentrations for CYN-MW6 is approximately 23 to 40 mg/L with an overall increasing trend.
CYN-MW9 had reported concentrations of NPN at 30.1, 30.1, and 36.6 mg/L.
CYN-MW10 had reported concentrations of NPN at 11.0, 11.4, and 11.4 mg/L.
CYN-MW11 had reported concentrations of NPN at 10.0 and 10.6 mg/L.
CYN-MW12 had reported concentrations of NPN at 12.2 and 14.4 mg/L.
The analytical results for this reporting period are consistent with historical concentrations. The current conceptual model described in Section 7.1.7 does not require modification based on the analytical results for this reporting period. During CY 2011, semiannual groundwater sampling will continue at six of the BSG study area wells (CYN-MW1D, CYN-MW3, CYN-MW4, CYN-MW6, CYN-MW7, and CYN-MW8) during the second and fourth quarters of FY 2011. Quarterly groundwater sampling will continue at the four new BSG study area wells (CYN-MW9, CYN-MW10, CYN-MW11, and CYN-MW12) during CY 2011. In addition, the subsurface soil sampling and well installation field report will be submitted to the NMED.
7.10 References
Brown et al. 1999 Brown, C.L., K.E. Karlstrom, M. Heizler, and D. Unruh, 1999. Paleoproterozoic deformation, metamorphism, and 40Ar/39Ar thermal history of the 1.65-Ga Manzanita Pluton, Manzanita Mountains, New Mexico, in New Mexico Geological Society 50th Annual Fall Field Conference, Albuquerque Geology, pp. 255–68.
DOE July 2009 U.S. Department of Energy, July 2009. Extension Request for Submission of
Characterization Work Plan for the Burn Site Groundwater Study Area, U.S. Department of Energy, National Nuclear Security Administration, Sandia Site Office, Albuquerque, New Mexico, July 23, 2009.
EPA 1999 U.S. Environmental Protection Agency (EPA), 1999. Perchlorate in
Drinking Water Using Ion Chromatography, EPA 815/R-00-014, U.S. Environmental Protection Agency, Washington, D.C.
EPA 1996 U.S. Environmental Protection Agency (EPA), 1996. Test Methods for Evaluating Solid Waste, Physical/Chemical Methods, SW-846, 3rd ed., Rev. 1 (and updates), U.S. Environmental Protection Agency, Washington, D.C.
EPA 1994 U.S. Environmental Protection Agency (EPA), 1994. RCRA Corrective
Action Plan, U.S. Environmental Protection Agency, Washington, D.C.

7-26 ANNUAL GROUNDWATER MONITORING REPORT, CALENDAR YEAR 2010
EPA 1986 U.S. Environmental Protection Agency (EPA), 1986. RCRA Ground-Water Monitoring Technical Enforcement Guidance Document OSWER-9950.1, U.S. Environmental Protection Agency, Washington, D.C.
EPA 1983 U.S. Environmental Protection Agency (EPA), 1983. The Determination of
Inorganic Anions in Water by Ion Chromatography-Method 300.0, EPA-600/4-84-017, U.S. Environmental Protection Agency, Washington, D.C.
EPA 1980 U.S. Environmental Protection Agency, 1980. Prescribed Procedures for
Measurement of Radioactivity in Drinking Water, EPA-600/4-80-032, U.S. Environmental Protection Agency, Cincinnati, Ohio.
National Weather National Weather Service, 2002. New Mexico Climate Summaries. Service 2002 http://www.wrcc.dri.edu/summary/climsmnm.html. NMED October 2010 New Mexico Environment Department (NMED), October 2010. RE: Time
Extension Request for Submittal of the Burn Site Groundwater Corrective Measures Evaluation Report, Sandia National Laboratories, EPA ID#NM5890110518, New Mexico Environment Department, Santa Fe, New Mexico, October 4, 2010.
NMED February 2010 New Mexico Environment Department (NMED), February 2010. RE: Notice
of Conditional Approval, Burn Site Groundwater Characterization Work Plan, November 2009, Sandia National Laboratories, EPA ID #NM5890110518, SNL-09-017, New Mexico Environment Department, Santa Fe, New Mexico, February 12, 2010.
NMED April 2009 New Mexico Environment Department (NMED), April 2009. RE:
Perchlorate Contamination in Groundwater, Sandia National Laboratories, EPA ID #NM5890110518, New Mexico Environment Department, Santa Fe, New Mexico, April 30, 2009.
NMED July 2005 New Mexico Environment Department (NMED), July 2005. Request for
Supplemental Information: Burn Site Groundwater Interim Measures Work Plan, Dated May 2005, Sandia National Laboratories, EPA ID #NM5890110518, HWB-SNL-04-039,” July 18, 2005.
NMED February 2005 New Mexico Environment Department (NMED), February 2005. RE:
Current Conceptual Model for the Sandia National Laboratories Canyons Area (Burn Site), June 2004: Requirement to Conduct Additional Site Characterization and Interim Measures, Sandia National Laboratories NM5890110518, HWB-SNL-04-039, New Mexico Environment Department, Santa Fe, New Mexico.
NMED April 2004 New Mexico Environment Department (NMED), April 2004. Compliance
Order on Consent Pursuant to the New Mexico Hazardous Waste Act 74-4-10: Sandia National Laboratories Consent Order, New Mexico Environment Department, Santa Fe, New Mexico, April 29, 2004.

BURN SITE GROUNDWATER 7-27
NMED 1993 New Mexico Environment Department (NMED), 1993. Module IV: Hazardous and Solid Waste Amendment (HSWA) Portion for Solid Waste Management Units (Module IV to the RCRA Part B Permit, NM5890110518), New Mexico Environment Department, Santa Fe, New Mexico.
SNL October 2010a Sandia National Laboratories/New Mexico (SNL/NM), October 2010.
Annual Groundwater Monitoring Report, Calendar Year 2009, Groundwater Protection Program, Environmental Management Department and Environmental Programs and Assurance, Sandia National Laboratories, Albuquerque, New Mexico.
SNL October 2010b Sandia National Laboratories, New Mexico (SNL/NM), October 2010. Burn
Site Groundwater Monitoring, Mini-Sampling and Analysis Plan (SAP) for First Quarter, Fiscal Year 2011, Environmental Restoration Project, Sandia National Laboratories, Albuquerque, New Mexico, October 1, 2010.
SNL September 2010 Sandia National Laboratories, New Mexico (SNL/NM), September 2010.
Extension Request for the Burn Site Corrective Measures Evaluation (CME) Report, Environmental Restoration Project, Sandia National Laboratories, Albuquerque, New Mexico, September 20, 2010.
SNL August 2010 Sandia National Laboratories, New Mexico (SNL/NM), August 2010. Burn
Site Groundwater Monitoring, Mini-Sampling and Analysis Plan (SAP) for Fourth Quarter, Fiscal Year 2010, Environmental Restoration Project, Sandia National Laboratories, Albuquerque, New Mexico, August 23, 2010.
SNL May 2010 Sandia National Laboratories, New Mexico (SNL/NM), May 2010. Burn Site
Groundwater Monitoring, Mini-Sampling and Analysis Plan (SAP) for Third Quarter, Fiscal Year 2010, Environmental Restoration Project, Sandia National Laboratories, Albuquerque, New Mexico, May 12, 2010.
SNL February 2010 Sandia National Laboratories, New Mexico (SNL/NM), February 2010. Burn
Site Groundwater Monitoring, Mini-Sampling and Analysis Plan (SAP) for Second Quarter, Fiscal Year 2010, Environmental Restoration Project, Sandia National Laboratories, Albuquerque, New Mexico, February 8, 2010.
SNL November 2009 Sandia National Laboratories, New Mexico (SNL/NM), November, 2009.
Burn Site Groundwater Characterization Work Plan, Installation of Groundwater Monitoring Wells CYN-MW9, CYN-MW10, and CYN-MW11, Collection of Subsurface Soil Samples, Environmental Restoration Project, Sandia National Laboratories, Albuquerque, New Mexico, November 23, 2009.
SNL July 2009 Sandia National Laboratories/New Mexico (SNL/NM), July 2009. Notes of
Meeting—July 14, 2009 Meeting Between NMED, DOE, and SNL/NM to discuss the April 2009 NMED Letter entitled: Perchlorate Contamination in Groundwater, Sandia National Laboratories, Sandia National Laboratories, Albuquerque, New Mexico, July 23, 2009.
7-28 ANNUAL GROUNDWATER MONITORING REPORT, CALENDAR YEAR 2010
SNL June 2009a Sandia National Laboratories/New Mexico (SNL/NM), June 2009. Annual Groundwater Monitoring Report, Calendar Year 2008, Groundwater Protection Program, Environmental Management Department and Environmental Programs and Assurance, Sandia National Laboratories, Albuquerque, New Mexico.
SNL June 2009b Sandia National Laboratories/New Mexico (SNL/NM), June 2009. Notes of
Meeting—June 15, 2009 Meeting Between NMED, DOE, and SNL/NM to discuss the April 2009 NMED Letter entitled: Perchlorate Contamination in Groundwater, Sandia National Laboratories, Sandia National Laboratories, Albuquerque, New Mexico, June 23, 2009.
SNL April 2008a Sandia National Laboratories/New Mexico (SNL/NM), April 2008. Current
Conceptual Model of Groundwater Flow and Contaminant Transport at Sandia National Laboratories/New Mexico Burn Site, Environmental Restoration Project, Sandia National Laboratories, Albuquerque, New Mexico.
SNL April 2008b Sandia National Laboratories/New Mexico (SNL/NM), April 2008.
Corrective Measures Evaluation Work Plan, Burn Site Groundwater, Environmental Management Department, Sandia National Laboratories, Albuquerque, New Mexico.
SNL March 2008 Sandia National Laboratories/New Mexico (SNL/NM), March 2008. Annual
Groundwater Monitoring Report, Fiscal Year 2007, Groundwater Protection Program, Environmental Management Department and Environmental Programs and Assurance, Sandia National Laboratories, Albuquerque, New Mexico.
SNL November 2007 Sandia National Laboratories/New Mexico (SNL/NM), November 2007.
Groundwater Level Data Acquisition and Management, FOP 03-02, Rev. 02, Sandia National Laboratories, Albuquerque, New Mexico.
SNL August 2007a Sandia National Laboratories/New Mexico (SNL/NM), August 2007. Long-
Term Environmental Stewardship (LTES) Groundwater Monitoring Well Sampling and Field Analytical Measurements, FOP 05-01, Revision 00, Sandia National Laboratories, Albuquerque, New Mexico.
SNL August 2007b Sandia National Laboratories/New Mexico (SNL/NM), August 2007. LTES
Groundwater Sampling Equipment Decontamination, FOP 05 03, Revision 02, Sandia National Laboratories, Albuquerque, New Mexico.
SNL August 2007c Sandia National Laboratories/New Mexico (SNL/NM), August 2007. LTES
Groundwater Monitoring Waste Management, FOP 05-04, Revision 02, Sandia National Laboratories, Albuquerque, New Mexico.
SNL July 2007 Sandia National Laboratories, New Mexico (SNL/NM) July 2007. Data
Validation Procedure for Chemical and Radiochemical Data, AOP 00-03, Revision 2, Sample Management Office, Sandia National Laboratories, Albuquerque, New Mexico, July 16, 2007.

BURN SITE GROUNDWATER 7-29
SNL April 2007 Sandia National Laboratories/New Mexico (SNL/NM), April 2007. Procedure for Completing the Contract Verification Review, SMO-05-03, Issue 03, Sandia National Laboratories, Albuquerque, New Mexico, April 30, 2007.
SNL March 2007 Sandia National Laboratories/New Mexico (SNL/NM), March 2007. Annual
Groundwater Monitoring Report, Fiscal Year 2006, Groundwater Protection Program, Environmental Management Department and Environmental Programs and Assurance, Sandia National Laboratories, Albuquerque, New Mexico.
SNL October 2006 Sandia National Laboratories/New Mexico (SNL/NM), October 2006. Field
Report: Installation of Burn Site Groundwater Monitoring Wells CYN-MW6, CYN-MW7, and CYN-MW8, Environmental Restoration Project, Sandia National Laboratories, Albuquerque, New Mexico.
SNL October 2005 Sandia National Laboratories/New Mexico (SNL/NM), October 2005.
Annual Groundwater Monitoring Report, Fiscal Year 2004, Groundwater Protection Program, Environmental Management Department, Sandia National Laboratories, Albuquerque, New Mexico.
SNL August 2005 Sandia National Laboratories/New Mexico (SNL/NM), August 2005.
Responses to NMED Request for Supplemental Information: Burn Site Groundwater Interim Measures Work Plan, Environmental Restoration Project, Sandia National Laboratories, Albuquerque, New Mexico.
SNL May 2005 Sandia National Laboratories/New Mexico (SNL/NM), May 2005. Interim
Measures Work Plan, Burn Site Groundwater, SAND Report SAND2005-2952, Environmental Restoration Project, Sandia National Laboratories, Albuquerque, New Mexico.
SNL January 2005 Sandia National Laboratories/New Mexico (SNL/NM), January 2005. Field
Report, Burn Site Groundwater Nitrate Source Evaluation, January 2005, Environmental Restoration Project, Sandia National Laboratories, Albuquerque, New Mexico.
SNL June 2004a Sandia National Laboratories/New Mexico (SNL/NM), June 2004. Current
Conceptual Model of Groundwater Flow and Contaminant Transport at Sandia National Laboratories/New Mexico Burn Site, Environmental Restoration Project, Sandia National Laboratories, Albuquerque, New Mexico.
SNL June 2004b Sandia National Laboratories/New Mexico (SNL/NM), June 2004.
Corrective Measures Evaluation Work Plan for Sandia National Laboratories/New Mexico Burn Site, Environmental Restoration Project, Sandia National Laboratories, Albuquerque, New Mexico.
SNL March 2004 Sandia National Laboratories/New Mexico (SNL/NM), March 2004. Annual
Groundwater Monitoring Report, Fiscal Year 2003, Groundwater Protection Program, Environmental Management Department, Sandia National Laboratories, Albuquerque, New Mexico.

7-30 ANNUAL GROUNDWATER MONITORING REPORT, CALENDAR YEAR 2010
SNL February 2004 Sandia National Laboratories/New Mexico (SNL/NM), February 2004. Justification for Class III Permit Modification, ER Site 94H Operable Unit 1333, JP-8 Fuel Site, Environmental Restoration Project, Sandia National Laboratories, Albuquerque, New Mexico.
SNL March 2003a Sandia National Laboratories/New Mexico (SNL/NM), March 2003. Annual
Groundwater Monitoring Report, Fiscal Year 2002, Groundwater Protection Program, Environmental Management Department, Sandia National Laboratories, Albuquerque, New Mexico.
SNL March 2003b Sandia National Laboratories/New Mexico (SNL/NM), March 2003.
SNL/NM Statement of Work for Analytical Laboratories, Revision 2, Sandia National Laboratories, Albuquerque, New Mexico.
SNL March 2002 Sandia National Laboratories/New Mexico (SNL/NM), March 2002. Annual
Groundwater Monitoring Report, Fiscal Year 2001, Groundwater Protection Program, Environmental Management Department, Sandia National Laboratories, Albuquerque, New Mexico.
SNL November 2001 Sandia National Laboratories/New Mexico (SNL/NM), November 2001.
Groundwater Investigation, Canyons Test Area, Operable Unit 1333, Burn Site, Lurance Canyon, Environmental Restoration Project, Sandia National Laboratories, Albuquerque, New Mexico.
SNL April 2001 Sandia National Laboratories/New Mexico (SNL/NM), April 2001. Annual
Groundwater Monitoring Report, Fiscal Year 2000, Groundwater Protection Program, Environmental Management Department, Sandia National Laboratories, Albuquerque, New Mexico.
SNL March 2000 Sandia National Laboratories/New Mexico (SNL/NM), March 2000. Annual
Groundwater Monitoring Report, Fiscal Year 1999, Groundwater Protection Program, Environmental Management and Integrated Training Department, Sandia National Laboratories, Albuquerque, New Mexico.
SNL March 1999 Sandia National Laboratories/New Mexico (SNL/NM), March 1999.
Groundwater Protection Program, Fiscal Year 1998, Annual Groundwater Monitoring Report, Sandia National Laboratories, Albuquerque, New Mexico.
SNL June 1998 Sandia National Laboratories/New Mexico (SNL/NM), June 1998. Letter
Report–Information Summarizing Recent Well Installation and Sampling Activities Near the Burn Site, Environmental Restoration Project, Sandia National Laboratories, Albuquerque, New Mexico.
SNL February 1998 Sandia National Laboratories/New Mexico (SNL/NM), February 1998.
Revised Site-Wide Hydrogeologic Characterization Project, Calendar Year 1995 Annual Report, Environmental Restoration Project, Sandia National Laboratories, Albuquerque, New Mexico.

BURN SITE GROUNDWATER 7-31
SNL July 1997 Sandia National Laboratories/New Mexico (SNL/NM), July 1997. Bullets of Understanding Between NMED DOE OB and the SNL/NM ER Project for the Nitrate Assessment at the Lurance Canyon Explosive Test Site, ER Site 65, OU 1333, Canyons Test Area, Environmental Restoration Project, Sandia National Laboratories, Albuquerque, New Mexico.
Van Hart June 2003 Van Hart, D. June 2003. Geologic Investigation: An Update of Subsurface
Geology on Kirtland Air Force Base, New Mexico, SAND2003-1869, Sandia National Laboratories, Albuquerque, New Mexico.

7-32 ANNUAL GROUNDWATER MONITORING REPORT, CALENDAR YEAR 2010
This page intentionally left blank.

BURN SITE GROUNDWATER 7A-1
Attachment 7A Burn Site Groundwater
Analytical Results Tables

7A-2 ANNUAL GROUNDWATER MONITORING REPORT, CALENDAR YEAR 2010
This page intentionally left blank.

BURN SITE GROUNDWATER 7A-3
Attachment 7A Tables 7A-1 Summary of Detected Volatile Organic, Semivolatile Organic, and High
Explosive Compounds, Burn Site Groundwater Monitoring, Sandia National Laboratories/New Mexico, Calendar Year 2010 .......................................................... 7A-5
7A-2 Method Detection Limits for Volatile and Semivolatile Organic Compounds,
Burn Site Groundwater Monitoring, Sandia National Laboratories/New Mexico, Calendar Year 2010 ...................................................................................................... 7A-6
7A-3 Method Detection Limits for High Explosives Compounds (EPA Methodg
SW846-8321A), Burn Site Groundwater Monitoring, Sandia National Laboratories/New Mexico, Calendar Year 2010 .......................................................... 7A-7
7A-4 Summary of Nitrate plus Nitrite Results, Burn Site Groundwater Monitoring,
Sandia National Laboratories/New Mexico, Calendar Year 2010 ................................ 7A-8 7A-5 Summary of TPH-Diesel Range Organics and TPH-Gasoline Range Organics
Results, Burn Site Groundwater Monitoring, Sandia National Laboratories/New Mexico, Calendar Year 2010 ...................................................................................... 7A-10
7A-6 Summary of Anion, Cation, and Alkalinity Results, Burn Site Groundwater
Monitoring, Sandia National Laboratories/New Mexico, Calendar Year 2010 .......... 7A-13 7A-7 Summary of Perchlorate Results, Burn Site Groundwater Monitoring, Sandia
National Laboratories/New Mexico, Calendar Year 2010 .......................................... 7A-17 7A-8 Summary of Total Metal Results, Burn Site Groundwater Monitoring, Sandia
National Laboratories/New Mexico, Calendar Year 2010 .......................................... 7A-18 7A-9 Summary of Tritium, Gross Alpha, Gross Beta, Gamma Spectroscopy, and
Isotopic Uranium Results, Burn Site Groundwater Monitoring, Sandia National Laboratories/New Mexico, Calendar Year 2010 ........................................................ 7A-30
7A-10 Summary of Field Water Quality Measurementsh, Burn Site Groundwater
Monitoring, Sandia National Laboratories/New Mexico, Calendar Year 2010 .......... 7A-34 Footnotes for Burn Site Groundwater Monitoring Tables .................................................................... 7A-35
7A-4 ANNUAL GROUNDWATER MONITORING REPORT, CALENDAR YEAR 2010
This page intentionally left blank.
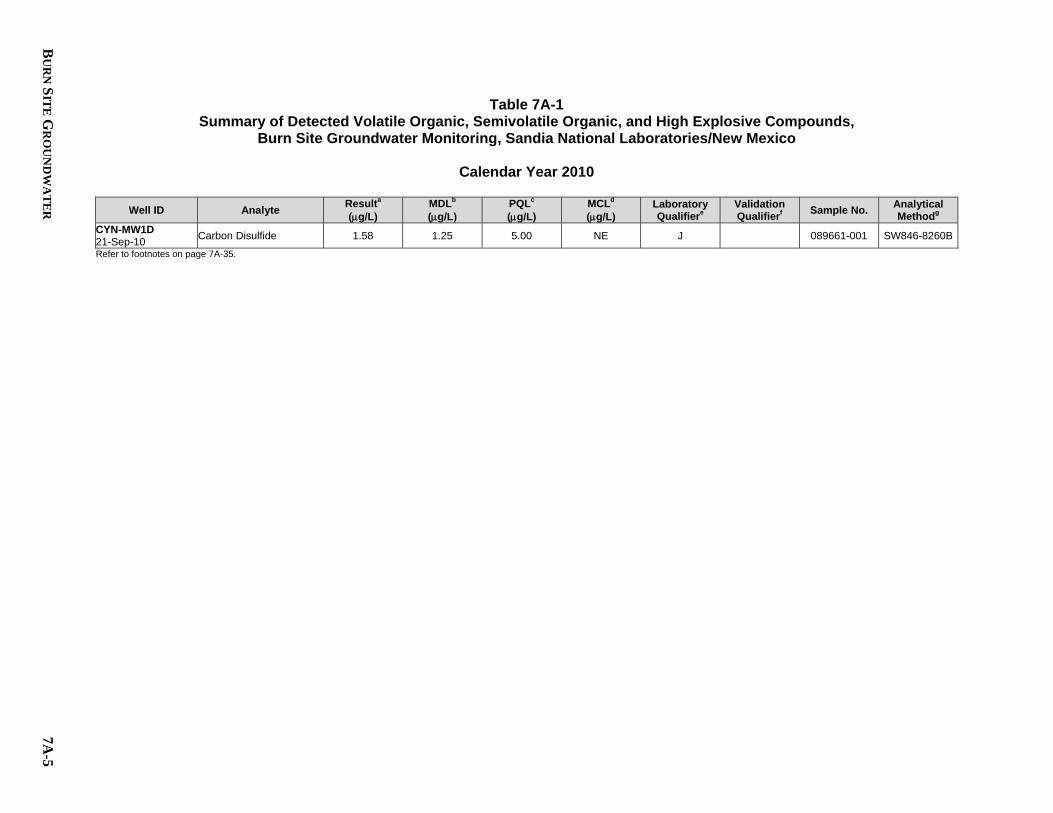
BU
RN
SIT
E G
RO
UN
DW
AT
ER
7A
-5
Table 7A-1 Summary of Detected Volatile Organic, Semivolatile Organic, and High Explosive Compounds,
Burn Site Groundwater Monitoring, Sandia National Laboratories/New Mexico
Calendar Year 2010
Well ID Analyte Resulta (g/L)
MDLb (g/L)
PQLc (g/L)
MCLd (g/L)
Laboratory Qualifiere
Validation Qualifierf Sample No. Analytical
Methodg CYN-MW1D 21-Sep-10 Carbon Disulfide 1.58 1.25 5.00 NE J 089661-001 SW846-8260B
Refer to footnotes on page 7A-35.
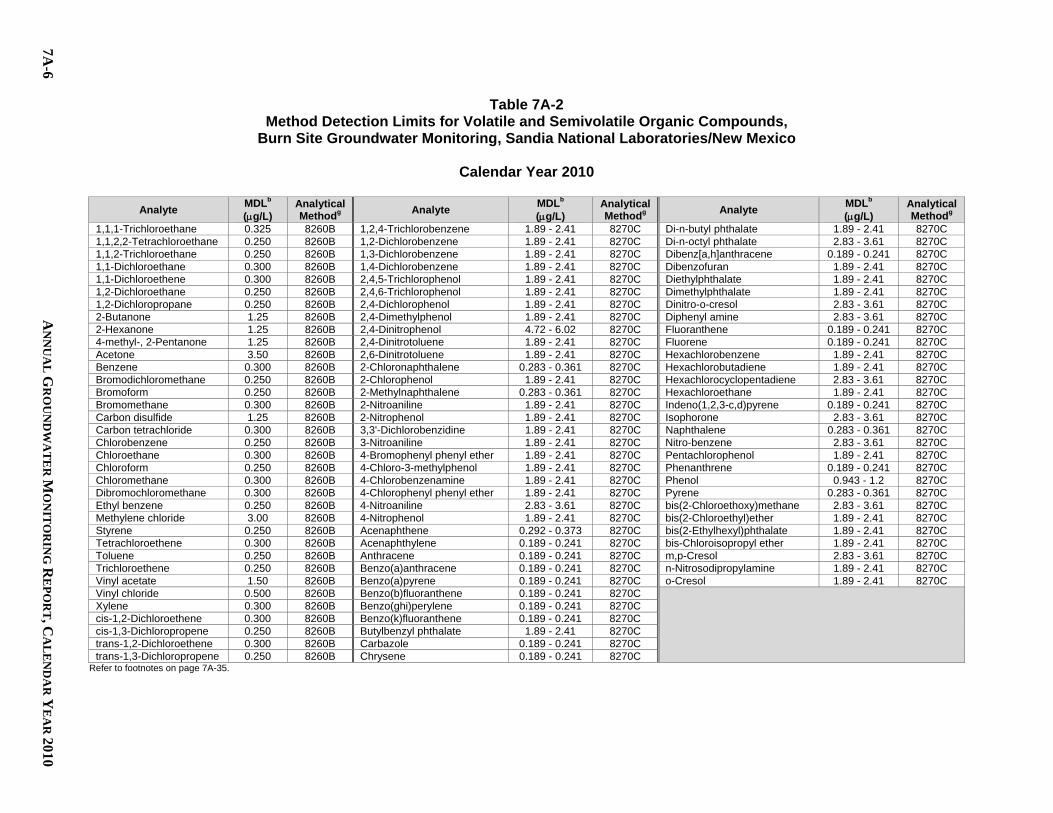
7A-6
AN
NU
AL
GR
OU
ND
WA
TE
R M
ON
ITO
RIN
G R
EP
OR
T, CA
LE
ND
AR
YE
AR
2010
Table 7A-2 Method Detection Limits for Volatile and Semivolatile Organic Compounds,
Burn Site Groundwater Monitoring, Sandia National Laboratories/New Mexico
Calendar Year 2010
Analyte MDLb
(g/L) Analytical Methodg Analyte MDLb
(g/L) Analytical Methodg Analyte MDLb
(g/L) Analytical Methodg
1,1,1-Trichloroethane 0.325 8260B 1,2,4-Trichlorobenzene 1.89 - 2.41 8270C Di-n-butyl phthalate 1.89 - 2.41 8270C 1,1,2,2-Tetrachloroethane 0.250 8260B 1,2-Dichlorobenzene 1.89 - 2.41 8270C Di-n-octyl phthalate 2.83 - 3.61 8270C 1,1,2-Trichloroethane 0.250 8260B 1,3-Dichlorobenzene 1.89 - 2.41 8270C Dibenz[a,h]anthracene 0.189 - 0.241 8270C 1,1-Dichloroethane 0.300 8260B 1,4-Dichlorobenzene 1.89 - 2.41 8270C Dibenzofuran 1.89 - 2.41 8270C 1,1-Dichloroethene 0.300 8260B 2,4,5-Trichlorophenol 1.89 - 2.41 8270C Diethylphthalate 1.89 - 2.41 8270C 1,2-Dichloroethane 0.250 8260B 2,4,6-Trichlorophenol 1.89 - 2.41 8270C Dimethylphthalate 1.89 - 2.41 8270C 1,2-Dichloropropane 0.250 8260B 2,4-Dichlorophenol 1.89 - 2.41 8270C Dinitro-o-cresol 2.83 - 3.61 8270C 2-Butanone 1.25 8260B 2,4-Dimethylphenol 1.89 - 2.41 8270C Diphenyl amine 2.83 - 3.61 8270C 2-Hexanone 1.25 8260B 2,4-Dinitrophenol 4.72 - 6.02 8270C Fluoranthene 0.189 - 0.241 8270C 4-methyl-, 2-Pentanone 1.25 8260B 2,4-Dinitrotoluene 1.89 - 2.41 8270C Fluorene 0.189 - 0.241 8270C Acetone 3.50 8260B 2,6-Dinitrotoluene 1.89 - 2.41 8270C Hexachlorobenzene 1.89 - 2.41 8270C Benzene 0.300 8260B 2-Chloronaphthalene 0.283 - 0.361 8270C Hexachlorobutadiene 1.89 - 2.41 8270C Bromodichloromethane 0.250 8260B 2-Chlorophenol 1.89 - 2.41 8270C Hexachlorocyclopentadiene 2.83 - 3.61 8270C Bromoform 0.250 8260B 2-Methylnaphthalene 0.283 - 0.361 8270C Hexachloroethane 1.89 - 2.41 8270C Bromomethane 0.300 8260B 2-Nitroaniline 1.89 - 2.41 8270C Indeno(1,2,3-c,d)pyrene 0.189 - 0.241 8270C Carbon disulfide 1.25 8260B 2-Nitrophenol 1.89 - 2.41 8270C Isophorone 2.83 - 3.61 8270C Carbon tetrachloride 0.300 8260B 3,3'-Dichlorobenzidine 1.89 - 2.41 8270C Naphthalene 0.283 - 0.361 8270C Chlorobenzene 0.250 8260B 3-Nitroaniline 1.89 - 2.41 8270C Nitro-benzene 2.83 - 3.61 8270C Chloroethane 0.300 8260B 4-Bromophenyl phenyl ether 1.89 - 2.41 8270C Pentachlorophenol 1.89 - 2.41 8270C Chloroform 0.250 8260B 4-Chloro-3-methylphenol 1.89 - 2.41 8270C Phenanthrene 0.189 - 0.241 8270C Chloromethane 0.300 8260B 4-Chlorobenzenamine 1.89 - 2.41 8270C Phenol 0.943 - 1.2 8270C Dibromochloromethane 0.300 8260B 4-Chlorophenyl phenyl ether 1.89 - 2.41 8270C Pyrene 0.283 - 0.361 8270C Ethyl benzene 0.250 8260B 4-Nitroaniline 2.83 - 3.61 8270C bis(2-Chloroethoxy)methane 2.83 - 3.61 8270C Methylene chloride 3.00 8260B 4-Nitrophenol 1.89 - 2.41 8270C bis(2-Chloroethyl)ether 1.89 - 2.41 8270C Styrene 0.250 8260B Acenaphthene 0.292 - 0.373 8270C bis(2-Ethylhexyl)phthalate 1.89 - 2.41 8270C Tetrachloroethene 0.300 8260B Acenaphthylene 0.189 - 0.241 8270C bis-Chloroisopropyl ether 1.89 - 2.41 8270C Toluene 0.250 8260B Anthracene 0.189 - 0.241 8270C m,p-Cresol 2.83 - 3.61 8270C Trichloroethene 0.250 8260B Benzo(a)anthracene 0.189 - 0.241 8270C n-Nitrosodipropylamine 1.89 - 2.41 8270C Vinyl acetate 1.50 8260B Benzo(a)pyrene 0.189 - 0.241 8270C o-Cresol 1.89 - 2.41 8270C Vinyl chloride 0.500 8260B Benzo(b)fluoranthene 0.189 - 0.241 8270C
Xylene 0.300 8260B Benzo(ghi)perylene 0.189 - 0.241 8270C cis-1,2-Dichloroethene 0.300 8260B Benzo(k)fluoranthene 0.189 - 0.241 8270C cis-1,3-Dichloropropene 0.250 8260B Butylbenzyl phthalate 1.89 - 2.41 8270C trans-1,2-Dichloroethene 0.300 8260B Carbazole 0.189 - 0.241 8270C trans-1,3-Dichloropropene 0.250 8260B Chrysene 0.189 - 0.241 8270C
Refer to footnotes on page 7A-35.

BURN SITE GROUNDWATER 7A-7
Table 7A-3 Method Detection Limits for High Explosives Compounds (EPA Methodg SW846-8321A),
Burn Site Groundwater Monitoring, Sandia National Laboratories/New Mexico
Calendar Year 2010
Analyte MDLb (g/L)
1,3,5-Trinitrobenzene 0.104 1,3-Dinitrobenzene 0.104 2,4,6-Trinitrotoluene 0.104 2,4-Dinitrotoluene 0.104 2,6-Dinitrotoluene 0.0779 2-Amino-4,6-dinitrotoluene 0.104 2-Nitrotoluene 0.104 3-Nitrotoluene 0.104 4-Amino-2,6-dinitrotoluene 0.104 4-Nitrotoluene 0.104 HMX 0.104 Nitro-benzene 0.104 Pentaerythritol tetranitrate 0.130 RDX 0.104 Tetryl 0.130
Refer to footnotes on page 7A-35.
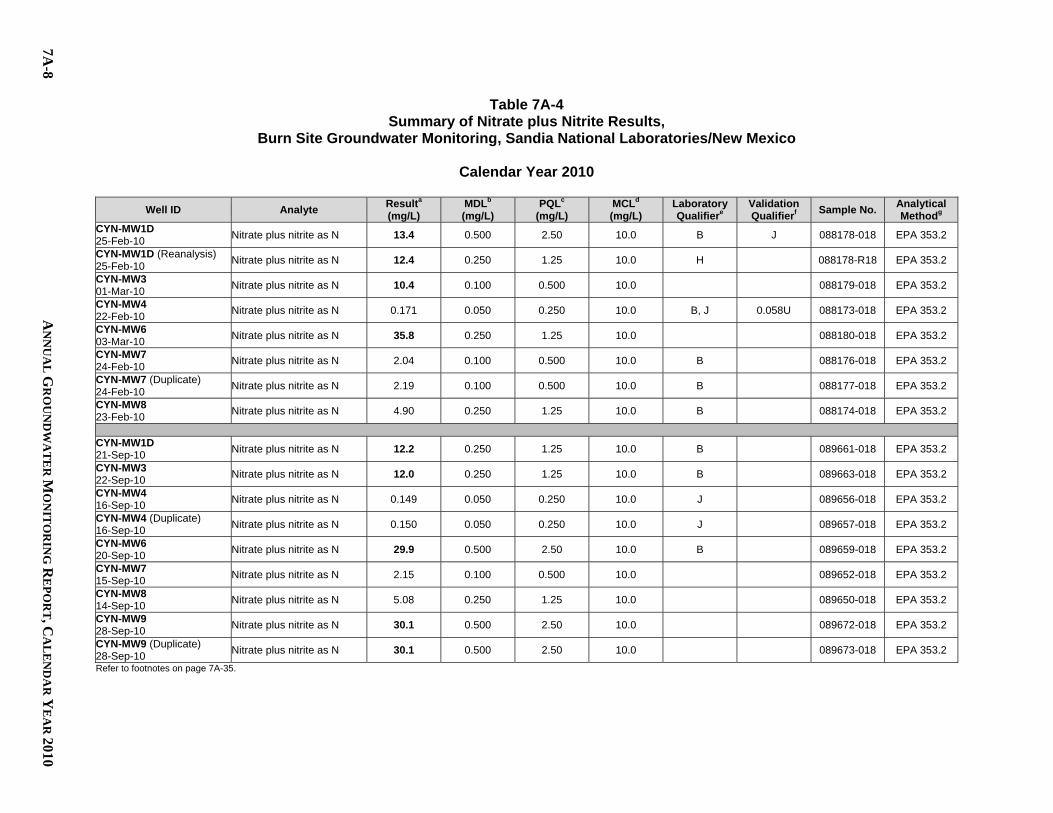
7A-8
AN
NU
AL
GR
OU
ND
WA
TE
R M
ON
ITO
RIN
G R
EP
OR
T, CA
LE
ND
AR
YE
AR
2010
Table 7A-4 Summary of Nitrate plus Nitrite Results,
Burn Site Groundwater Monitoring, Sandia National Laboratories/New Mexico
Calendar Year 2010
Well ID Analyte Resulta (mg/L)
MDLb (mg/L)
PQLc (mg/L)
MCLd (mg/L)
Laboratory Qualifiere
Validation Qualifierf Sample No. Analytical
Methodg CYN-MW1D 25-Feb-10 Nitrate plus nitrite as N 13.4 0.500 2.50 10.0 B J 088178-018 EPA 353.2
CYN-MW1D (Reanalysis) 25-Feb-10 Nitrate plus nitrite as N 12.4 0.250 1.25 10.0 H 088178-R18 EPA 353.2
CYN-MW3 01-Mar-10 Nitrate plus nitrite as N 10.4 0.100 0.500 10.0 088179-018 EPA 353.2
CYN-MW4 22-Feb-10 Nitrate plus nitrite as N 0.171 0.050 0.250 10.0 B, J 0.058U 088173-018 EPA 353.2
CYN-MW6 03-Mar-10 Nitrate plus nitrite as N 35.8 0.250 1.25 10.0 088180-018 EPA 353.2
CYN-MW7 24-Feb-10 Nitrate plus nitrite as N 2.04 0.100 0.500 10.0 B 088176-018 EPA 353.2
CYN-MW7 (Duplicate) 24-Feb-10 Nitrate plus nitrite as N 2.19 0.100 0.500 10.0 B 088177-018 EPA 353.2
CYN-MW8 23-Feb-10 Nitrate plus nitrite as N 4.90 0.250 1.25 10.0 B 088174-018 EPA 353.2
CYN-MW1D 21-Sep-10 Nitrate plus nitrite as N 12.2 0.250 1.25 10.0 B 089661-018 EPA 353.2
CYN-MW3 22-Sep-10 Nitrate plus nitrite as N 12.0 0.250 1.25 10.0 B 089663-018 EPA 353.2
CYN-MW4 16-Sep-10 Nitrate plus nitrite as N 0.149 0.050 0.250 10.0 J 089656-018 EPA 353.2
CYN-MW4 (Duplicate) 16-Sep-10 Nitrate plus nitrite as N 0.150 0.050 0.250 10.0 J 089657-018 EPA 353.2
CYN-MW6 20-Sep-10 Nitrate plus nitrite as N 29.9 0.500 2.50 10.0 B 089659-018 EPA 353.2
CYN-MW7 15-Sep-10 Nitrate plus nitrite as N 2.15 0.100 0.500 10.0 089652-018 EPA 353.2
CYN-MW8 14-Sep-10 Nitrate plus nitrite as N 5.08 0.250 1.25 10.0 089650-018 EPA 353.2
CYN-MW9 28-Sep-10 Nitrate plus nitrite as N 30.1 0.500 2.50 10.0 089672-018 EPA 353.2
CYN-MW9 (Duplicate) 28-Sep-10 Nitrate plus nitrite as N 30.1 0.500 2.50 10.0 089673-018 EPA 353.2
Refer to footnotes on page 7A-35.

BU
RN
SIT
E G
RO
UN
DW
AT
ER
7A
-9
Table 7A-4 (Concluded) Summary of Nitrate plus Nitrite Results,
Burn Site Groundwater Monitoring, Sandia National Laboratories/New Mexico
Calendar Year 2010
Well ID Analyte Resulta (mg/L)
MDLb (mg/L)
PQLc (mg/L)
MCLd (mg/L)
Laboratory Qualifiere
Validation Qualifierf Sample No. Analytical
Methodg CYN-MW10 27-Sep-10 Nitrate plus nitrite as N 11.0 0.250 1.25 10.0 089668-018 EPA 353.2
CYN-MW11 29-Sep-10 Nitrate plus nitrite as N 10.0 0.250 1.25 10.0 089675-018 EPA 353.2
CYN-MW12 23-Sep-10 Nitrate plus nitrite as N 12.2 0.250 1.25 10.0 B 089665-018 EPA 353.2
CYN-MW9 27-Oct-10 Nitrate plus nitrite as N 36.6 5.00 25.0 10.0 089759-018 EPA 353.2
CYN-MW10 02-Nov-10 Nitrate plus nitrite as N 11.4 0.250 1.25 10.0 089773-018 EPA 353.2
CYN-MW10 (Duplicate) 02-Nov-10 Nitrate plus nitrite as N 11.4 0.250 1.25 10.0 089774-018 EPA 353.2
CYN-MW11 01-Nov-10 Nitrate plus nitrite as N 10.6 0.250 1.25 10.0 089765-018 EPA 353.2
CYN-MW12 28-Oct-10 Nitrate plus nitrite as N 14.4 0.500 2.50 10.0 089762-018 EPA 353.2
Refer to footnotes on page 7A-35.

7A-10
AN
NU
AL
GR
OU
ND
WA
TE
R M
ON
ITO
RIN
G R
EP
OR
T, CA
LE
ND
AR
YE
AR
2010
Table 7A-5 Summary of TPH-Diesel Range Organics and TPH-Gasoline Range Organics Results,
Burn Site Groundwater Monitoring, Sandia National Laboratories/New Mexico
Calendar Year 2010
Well ID Analyte Resulta (g/L)
MDLb (g/L)
PQLc (g/L)
MCLd (g/L)
Laboratory Qualifiere
Validation Qualifierf Sample No. Analytical
Methodg CYN-MW1D Diesel Range Organics ND 69.1 213 NE U 088178-005 SW846 8015A/B 25-Feb-10 Gasoline Range Organics 30.5 10.5 50.0 NE J R 088178-006 SW846 8015B CYN-MW3 Diesel Range Organics ND 73.9 227 NE U 088179-005 SW846 8015A/B 01-Mar-10 Gasoline Range Organics 23.0 10.5 50.0 NE J R 088179-006 SW846 8015B CYN-MW4 Diesel Range Organics ND 67.7 208 NE U 088173-005 SW846 8015A/B 22-Feb-10 Gasoline Range Organics 17.8 10.5 50.0 NE J R 088173-006 SW846 8015B CYN-MW6 Diesel Range Organics ND 70.7 217 NE U 088180-005 SW846 8015A/B 03-Mar-10 Gasoline Range Organics 27.2 10.5 50.0 NE J R 088180-006 SW846 8015B CYN-MW7 Diesel Range Organics ND 69.1 213 NE U 088176-005 SW846 8015A/B 24-Feb-10 Gasoline Range Organics 30.1 10.5 50.0 NE J R 088176-006 SW846 8015B CYN-MW7 (Duplicate) Diesel Range Organics ND 69.1 213 NE U 088177-005 SW846 8015A/B 24-Feb-10 Gasoline Range Organics 25.6 10.5 50.0 NE J R 088177-006 SW846 8015B CYN-MW8 Diesel Range Organics ND 69.1 213 NE U 088174-005 SW846 8015A/B 23-Feb-10 Gasoline Range Organics 26.3 10.5 50.0 NE J R 088174-006 SW846 8015B
CYN-MW1D 01-Jun-10 Gasoline Range Organics ND 10.5 50.0 NE U 089140-006 SW846 8015B
CYN-MW3 02-Jun-10 Gasoline Range Organics ND 10.5 50.0 NE U 089142-006 SW846 8015B
CYN-MW4 27-May-10 Gasoline Range Organics 14.1 10.5 50.0 NE B, J 50U 089138-006 SW846 8015B
CYN-MW6 04-Jun-10 Gasoline Range Organics ND 10.5 50.0 NE U 089144-006 SW846 8015B
CYN-MW7 26-May-10 Gasoline Range Organics 29.6 10.5 50.0 NE J 50U 089135-006 SW846 8015B
CYN-MW7 (Duplicate) 26-May-10 Gasoline Range Organics 24.9 10.5 50.0 NE J 50U 089136-006 SW846 8015B
CYN-MW8 25-May-10 Gasoline Range Organics ND 10.5 50.0 NE U 089131-006 SW846 8015B
CYN-MW1D Diesel Range Organics ND 69.9 215 NE U 089661-005 SW846 8015A/B 21-Sep-10 Gasoline Range Organics 19.1 10.5 50.0 NE J 50U 089661-006 SW846 8015B CYN-MW3 Diesel Range Organics ND 67.7 208 NE U 089663-005 SW846 8015A/B 22-Sep-10 Gasoline Range Organics ND 10.5 50.0 NE U 089663-006 SW846 8015B Refer to footnotes on page 7A-35.

BU
RN
SIT
E G
RO
UN
DW
AT
ER
7A
-11
Table 7A-5 (Continued) Summary of TPH-Diesel Range Organics and TPH-Gasoline Range Organics Results,
Burn Site Groundwater Monitoring, Sandia National Laboratories/New Mexico
Calendar Year 2010
Well ID Analyte Resulta (g/L)
MDLb (g/L)
PQLc (g/L)
MCLd (g/L)
Laboratory Qualifiere
Validation Qualifierf Sample No. Analytical
Methodg CYN-MW4 Diesel Range Organics ND 70.7 217 NE U 089656-005 SW846 8015A/B 16-Sep-10 Gasoline Range Organics 10.8 10.5 50.0 NE J 50U 089656-006 SW846 8015B CYN-MW4 (Re-analysis) 16-Sep-10 Gasoline Range Organics 14.8 10.5 50.0 NE H, J 50UJ 089656-R06 SW846 8015B
CYN-MW4 (Duplicate) Diesel Range Organics ND 70.7 217 NE U 089657-005 SW846 8015A/B 16-Sep-10 Gasoline Range Organics 11.4 10.5 50.0 NE J 50U 089657-006 SW846 8015B CYN-MW4 (Duplicate re-analysis) 16-Sep-10
Gasoline Range Organics ND 10.5 50.0 NE H, U UJ 089657-R06 SW846 8015B
CYN-MW6 Diesel Range Organics ND 65.0 200 NE U 089659-005 SW846 8015A/B 20-Sep-10 Gasoline Range Organics ND 10.5 50.0 NE U 089659-006 SW846 8015B CYN-MW7 Diesel Range Organics ND 69.1 213 NE U 089652-005 SW846 8015A/B 15-Sep-10 Gasoline Range Organics ND 10.5 50.0 NE U 089652-006 SW846 8015B CYN-MW7 (Re-analysis) 15-Sep-10 Gasoline Range Organics ND 10.5 50.0 NE H, U UJ 089652-R06 SW846 8015B
CYN-MW8 Diesel Range Organics ND 74.7 230 NE U 089650-005 SW846 8015A/B 14-Sep-10 Gasoline Range Organics ND 10.5 50.0 NE U 089650-006 SW846 8015B CYN-MW8 (Re-analysis) 14-Sep-10 Gasoline Range Organics 13.5 10.5 50.0 NE H, J 50UJ 089650-R06 SW846 8015B
CYN-MW9 Diesel Range Organics ND 73.0 225 NE U 089672-005 SW846 8015A/B 28-Sep-10 Gasoline Range Organics 14.8 10.5 50.0 NE J 50U 089672-006 SW846 8015B CYN-MW9 (Duplicate) Diesel Range Organics ND 71.4 220 NE U 089673-005 SW846 8015A/B 28-Sep-10 Gasoline Range Organics 13.1 10.5 50.0 NE J 50U 089673-006 SW846 8015B CYN-MW10 Diesel Range Organics ND 72.2 222 NE U 089668-005 SW846 8015A/B 27-Sep-10 Gasoline Range Organics 13.5 10.5 50.0 NE J 50U 089668-006 SW846 8015B CYN-MW11 Diesel Range Organics ND 68.4 211 NE U 089675-005 SW846 8015A/B 29-Sep-10 Gasoline Range Organics 12.1 10.5 50.0 NE J 50U 089675-006 SW846 8015B CYN-MW12 Diesel Range Organics ND 71.4 220 NE U 089665-005 SW846 8015A/B 23-Sep-10 Gasoline Range Organics 14.4 10.5 50.0 NE J 50U 089665-006 SW846 8015B CYN-MW9 Diesel Range Organics ND 65.0 200 NE U 089759-005 SW846 8015A/B 27-Oct-10 Gasoline Range Organics ND 10.5 50.0 NE U 089759-006 SW846 8015B CYN-MW10 Diesel Range Organics ND 65.7 202 NE U 089773-005 SW846 8015A/B 02-Nov-10 Gasoline Range Organics ND 10.5 50.0 NE U 089773-006 SW846 8015B CYN-MW10 (Duplicate) Diesel Range Organics ND 66.3 204 NE U 089774-005 SW846 8015A/B 02-Nov-10 Gasoline Range Organics ND 10.5 50.0 NE U 089774-006 SW846 8015B Refer to footnotes on page 7A-35.

7A-12
AN
NU
AL
GR
OU
ND
WA
TE
R M
ON
ITO
RIN
G R
EP
OR
T, CA
LE
ND
AR
YE
AR
2010
Table 7A-5 (Concluded) Summary of TPH-Diesel Range Organics and TPH-Gasoline Range Organics Results,
Burn Site Groundwater Monitoring, Sandia National Laboratories/New Mexico
Calendar Year 2010
Well ID Analyte Resulta (g/L)
MDLb (g/L)
PQLc (g/L)
MCLd (g/L)
Laboratory Qualifiere
Validation Qualifierf Sample No. Analytical
Methodg CYN-MW11 Diesel Range Organics ND 64.4 198 NE U 089765-005 SW846 8015A/B 01-Nov-10 Gasoline Range Organics ND 10.5 50.0 NE U 089765-006 SW846 8015B CYN-MW12 Diesel Range Organics ND 71.4 220 NE U 089762-005 SW846 8015A/B 28-Oct-10 Gasoline Range Organics ND 10.5 50.0 NE U 089762-006 SW846 8015B Refer to footnotes on page 7A-35.

BU
RN
SIT
E G
RO
UN
DW
AT
ER
7A
-13
Table 7A-6 Summary of Anion, Cation, and Alkalinity Results,
Burn Site Groundwater Monitoring, Sandia National Laboratories/New Mexico
Calendar Year 2010
Well ID Analyte Resulta (mg/L)
MDLb (mg/L)
PQLc (mg/L)
MCLd (mg/L)
Laboratory Qualifiere
Validation Qualifierf Sample No. Analytical
Methodg CYN-MW1D Bicarbonate Alkalinity 72.9 0.725 1.00 NE B 089661-016 SM2320B 21-Sep-10 Carbonate Alkalinity ND 0.725 1.00 NE U 089661-016 SM2320B Bromide 0.429 0.066 0.200 NE 089661-016 SW846 9056 Chloride 27.2 0.660 2.00 NE 089661-016 SW846 9056 Fluoride 1.81 0.033 0.100 4.0 089661-016 SW846 9056 Sulfate 114 1.00 4.00 NE 089661-016 SW846 9056 Calcium 70.0 0.200 2.00 NE B 089661-017 SW846-6020 Magnesium 14.6 0.005 0.015 NE 089661-017 SW846-6020 Potassium 2.62 0.080 0.300 NE 089661-017 SW846-6020 Sodium 34.8 0.080 0.250 NE 089661-017 SW846-6020 CYN-MW3 Bicarbonate Alkalinity 239 0.725 1.00 NE B 089663-016 SM2320B 22-Sep-10 Carbonate Alkalinity ND 0.725 1.00 NE U 089663-016 SM2320B Bromide 0.748 0.066 0.200 NE 089663-016 SW846 9056 Chloride 120 0.660 2.00 NE 089663-016 SW846 9056 Fluoride 0.639 0.033 0.100 4.0 089663-016 SW846 9056 Sulfate 365 1.00 4.00 NE 089663-016 SW846 9056 Calcium 129 0.200 2.00 NE B 089663-017 SW846-6020 Magnesium 35.4 0.005 0.015 NE 089663-017 SW846-6020 Potassium 2.03 0.080 0.300 NE 089663-017 SW846-6020 Sodium 40.7 0.080 0.250 NE 089663-017 SW846-6020 CYN-MW3 (Re-analysis) Bromide 0.750 0.066 0.200 NE H J 089663-R16 SW846 9056 22-Sep-10 Chloride 55.3 0.660 2.00 NE H J 089663-R16 SW846 9056 Fluoride 0.675 0.033 0.100 4.0 H J 089663-R16 SW846 9056 Sulfate 167 1.00 4.00 NE H J 089663-R16 SW846 9056 CYN-MW4 Bicarbonate Alkalinity 223 0.725 1.00 NE B 089656-016 SM2320B 16-Sep-10 Carbonate Alkalinity ND 0.725 1.00 NE U 089656-016 SM2320B Bromide 0.378 0.066 0.200 NE 089656-016 SW846 9056 Chloride 24.2 0.660 2.00 NE 089656-016 SW846 9056 Fluoride 0.780 0.033 0.100 4.0 089656-016 SW846 9056 Sulfate 130 1.00 4.00 NE 089656-016 SW846 9056 Calcium 69.7 0.200 2.00 NE 089656-017 SW846-6020 Magnesium 33.9 0.025 0.075 NE 089656-017 SW846-6020 Potassium 6.27 0.400 1.50 NE 089656-017 SW846-6020 Sodium 46.6 0.400 1.50 NE 089656-017 SW846-6020 Refer to footnotes on page 7A-35.
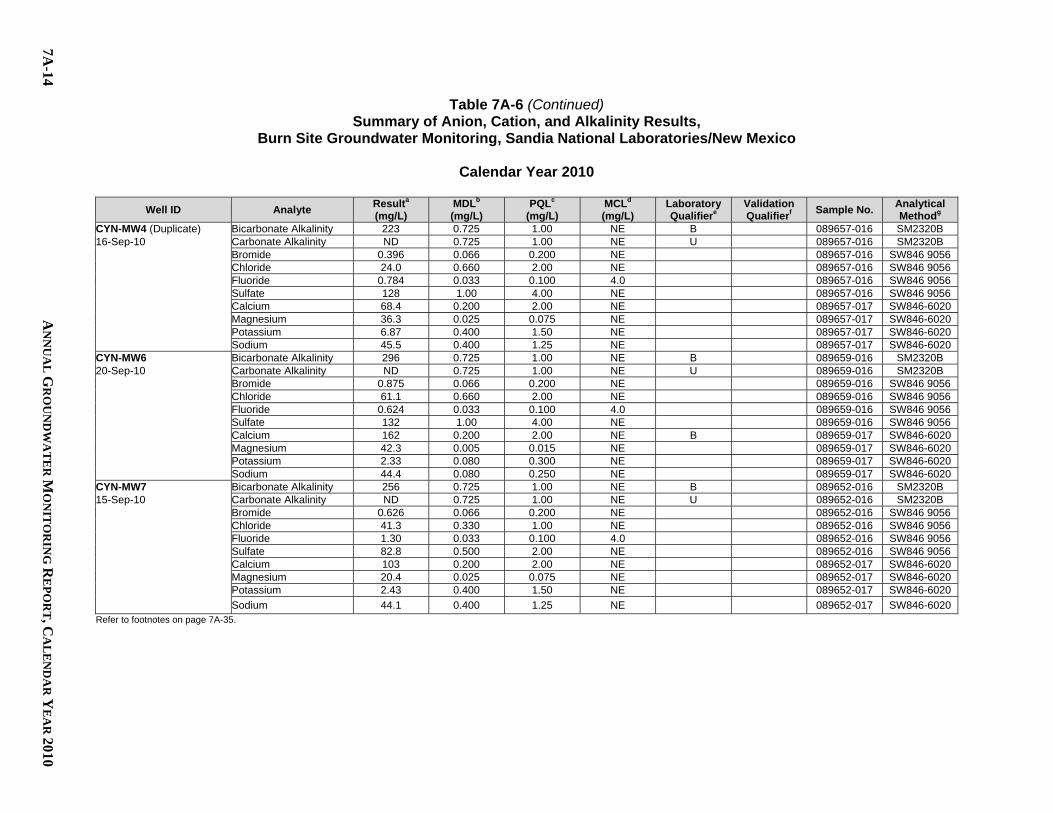
7A-14
AN
NU
AL
GR
OU
ND
WA
TE
R M
ON
ITO
RIN
G R
EP
OR
T, CA
LE
ND
AR
YE
AR
2010
Table 7A-6 (Continued) Summary of Anion, Cation, and Alkalinity Results,
Burn Site Groundwater Monitoring, Sandia National Laboratories/New Mexico
Calendar Year 2010
Well ID Analyte Resulta (mg/L)
MDLb (mg/L)
PQLc (mg/L)
MCLd (mg/L)
Laboratory Qualifiere
Validation Qualifierf Sample No. Analytical
Methodg CYN-MW4 (Duplicate) Bicarbonate Alkalinity 223 0.725 1.00 NE B 089657-016 SM2320B 16-Sep-10 Carbonate Alkalinity ND 0.725 1.00 NE U 089657-016 SM2320B Bromide 0.396 0.066 0.200 NE 089657-016 SW846 9056 Chloride 24.0 0.660 2.00 NE 089657-016 SW846 9056 Fluoride 0.784 0.033 0.100 4.0 089657-016 SW846 9056 Sulfate 128 1.00 4.00 NE 089657-016 SW846 9056 Calcium 68.4 0.200 2.00 NE 089657-017 SW846-6020 Magnesium 36.3 0.025 0.075 NE 089657-017 SW846-6020 Potassium 6.87 0.400 1.50 NE 089657-017 SW846-6020 Sodium 45.5 0.400 1.25 NE 089657-017 SW846-6020 CYN-MW6 Bicarbonate Alkalinity 296 0.725 1.00 NE B 089659-016 SM2320B 20-Sep-10 Carbonate Alkalinity ND 0.725 1.00 NE U 089659-016 SM2320B Bromide 0.875 0.066 0.200 NE 089659-016 SW846 9056 Chloride 61.1 0.660 2.00 NE 089659-016 SW846 9056 Fluoride 0.624 0.033 0.100 4.0 089659-016 SW846 9056 Sulfate 132 1.00 4.00 NE 089659-016 SW846 9056 Calcium 162 0.200 2.00 NE B 089659-017 SW846-6020 Magnesium 42.3 0.005 0.015 NE 089659-017 SW846-6020 Potassium 2.33 0.080 0.300 NE 089659-017 SW846-6020 Sodium 44.4 0.080 0.250 NE 089659-017 SW846-6020 CYN-MW7 Bicarbonate Alkalinity 256 0.725 1.00 NE B 089652-016 SM2320B 15-Sep-10 Carbonate Alkalinity ND 0.725 1.00 NE U 089652-016 SM2320B Bromide 0.626 0.066 0.200 NE 089652-016 SW846 9056 Chloride 41.3 0.330 1.00 NE 089652-016 SW846 9056 Fluoride 1.30 0.033 0.100 4.0 089652-016 SW846 9056 Sulfate 82.8 0.500 2.00 NE 089652-016 SW846 9056 Calcium 103 0.200 2.00 NE 089652-017 SW846-6020 Magnesium 20.4 0.025 0.075 NE 089652-017 SW846-6020 Potassium 2.43 0.400 1.50 NE 089652-017 SW846-6020 Sodium 44.1 0.400 1.25 NE 089652-017 SW846-6020 Refer to footnotes on page 7A-35.
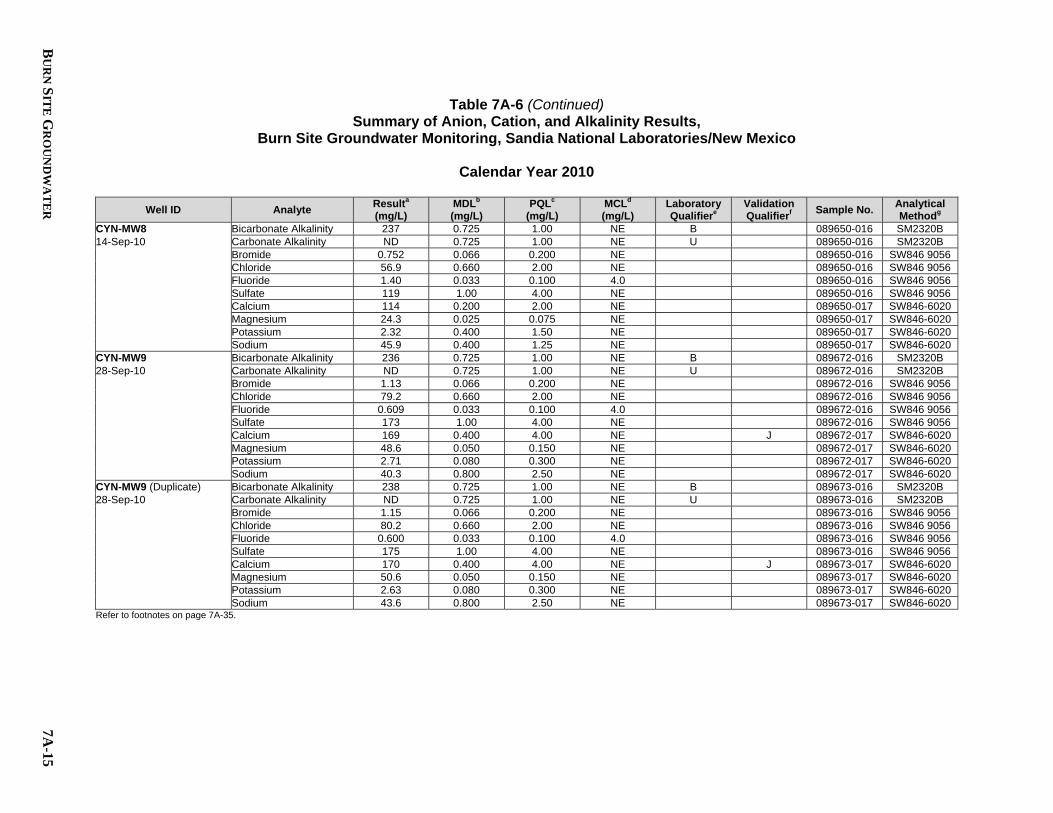
BU
RN
SIT
E G
RO
UN
DW
AT
ER
7A
-15
Table 7A-6 (Continued) Summary of Anion, Cation, and Alkalinity Results,
Burn Site Groundwater Monitoring, Sandia National Laboratories/New Mexico
Calendar Year 2010
Well ID Analyte Resulta (mg/L)
MDLb (mg/L)
PQLc (mg/L)
MCLd (mg/L)
Laboratory Qualifiere
Validation Qualifierf Sample No. Analytical
Methodg CYN-MW8 Bicarbonate Alkalinity 237 0.725 1.00 NE B 089650-016 SM2320B 14-Sep-10 Carbonate Alkalinity ND 0.725 1.00 NE U 089650-016 SM2320B Bromide 0.752 0.066 0.200 NE 089650-016 SW846 9056 Chloride 56.9 0.660 2.00 NE 089650-016 SW846 9056 Fluoride 1.40 0.033 0.100 4.0 089650-016 SW846 9056 Sulfate 119 1.00 4.00 NE 089650-016 SW846 9056 Calcium 114 0.200 2.00 NE 089650-017 SW846-6020 Magnesium 24.3 0.025 0.075 NE 089650-017 SW846-6020 Potassium 2.32 0.400 1.50 NE 089650-017 SW846-6020 Sodium 45.9 0.400 1.25 NE 089650-017 SW846-6020 CYN-MW9 Bicarbonate Alkalinity 236 0.725 1.00 NE B 089672-016 SM2320B 28-Sep-10 Carbonate Alkalinity ND 0.725 1.00 NE U 089672-016 SM2320B Bromide 1.13 0.066 0.200 NE 089672-016 SW846 9056 Chloride 79.2 0.660 2.00 NE 089672-016 SW846 9056 Fluoride 0.609 0.033 0.100 4.0 089672-016 SW846 9056 Sulfate 173 1.00 4.00 NE 089672-016 SW846 9056 Calcium 169 0.400 4.00 NE J 089672-017 SW846-6020 Magnesium 48.6 0.050 0.150 NE 089672-017 SW846-6020 Potassium 2.71 0.080 0.300 NE 089672-017 SW846-6020 Sodium 40.3 0.800 2.50 NE 089672-017 SW846-6020 CYN-MW9 (Duplicate) Bicarbonate Alkalinity 238 0.725 1.00 NE B 089673-016 SM2320B 28-Sep-10 Carbonate Alkalinity ND 0.725 1.00 NE U 089673-016 SM2320B Bromide 1.15 0.066 0.200 NE 089673-016 SW846 9056 Chloride 80.2 0.660 2.00 NE 089673-016 SW846 9056 Fluoride 0.600 0.033 0.100 4.0 089673-016 SW846 9056 Sulfate 175 1.00 4.00 NE 089673-016 SW846 9056 Calcium 170 0.400 4.00 NE J 089673-017 SW846-6020 Magnesium 50.6 0.050 0.150 NE 089673-017 SW846-6020 Potassium 2.63 0.080 0.300 NE 089673-017 SW846-6020 Sodium 43.6 0.800 2.50 NE 089673-017 SW846-6020 Refer to footnotes on page 7A-35.

7A-16
AN
NU
AL
GR
OU
ND
WA
TE
R M
ON
ITO
RIN
G R
EP
OR
T, CA
LE
ND
AR
YE
AR
2010
Table 7A-6 (Concluded) Summary of Anion, Cation, and Alkalinity Results,
Burn Site Groundwater Monitoring, Sandia National Laboratories/New Mexico
Calendar Year 2010
Well ID Analyte Resulta (mg/L)
MDLb (mg/L)
PQLc (mg/L)
MCLd (mg/L)
Laboratory Qualifiere
Validation Qualifierf Sample No. Analytical
Methodg CYN-MW10 Bicarbonate Alkalinity 236 0.725 1.00 NE B 089668-016 SM2320B 27-Sep-10 Carbonate Alkalinity ND 0.725 1.00 NE U 089668-016 SM2320B Bromide 0.789 0.066 0.200 NE 089668-016 SW846 9056 Chloride 53.2 0.660 2.00 NE 089668-016 SW846 9056 Fluoride 0.626 0.033 0.100 4.0 089668-016 SW846 9056 Sulfate 172 1.00 4.00 NE 089668-016 SW846 9056 Calcium 128 0.500 5.00 NE J 089668-017 SW846-6020 Magnesium 36.4 0.025 0.075 NE 089668-017 SW846-6020 Potassium 1.96 0.080 0.300 NE 089668-017 SW846-6020 Sodium 37.6 0.400 1.25 NE 089668-017 SW846-6020 CYN-MW11 Bicarbonate Alkalinity 257 0.725 1.00 NE B 089675-016 SM2320B 29-Sep-10 Carbonate Alkalinity ND 0.725 1.00 NE U 089675-016 SM2320B Bromide 1.00 0.066 0.200 NE 089675-016 SW846 9056 Chloride 73.6 0.660 2.00 NE 089675-016 SW846 9056 Fluoride 0.660 0.033 0.100 4.0 089675-016 SW846 9056 Sulfate 178 1.00 4.00 NE 089675-016 SW846 9056 Calcium 142 0.400 4.00 NE J 089675-017 SW846-6020 Magnesium 44.0 0.050 0.150 NE 089675-017 SW846-6020 Potassium 3.33 0.080 0.300 NE 089675-017 SW846-6020 Sodium 45.5 0.800 2.50 NE 089675-017 SW846-6020 CYN-MW12 Bicarbonate Alkalinity 250 0.725 1.00 NE B 089665-016 SM2320B 23-Sep-10 Carbonate Alkalinity ND 0.725 1.00 NE U 089665-016 SM2320B Bromide 0.928 0.066 0.200 NE 089665-016 SW846 9056 Chloride 88.8 0.330 1.00 NE 089665-016 SW846 9056 Fluoride 1.04 0.033 0.100 4.0 089665-016 SW846 9056 Sulfate 208 1.00 4.00 NE 089665-016 SW846 9056 Calcium 164 0.200 2.00 NE B 089665-017 SW846-6020 Magnesium 44.2 0.005 0.015 NE 089665-017 SW846-6020 Potassium 5.86 0.080 0.300 NE 089665-017 SW846-6020 Sodium 51.4 0.800 2.50 NE 089665-017 SW846-6020 Refer to footnotes on page 7A-35.

BU
RN
SIT
E G
RO
UN
DW
AT
ER
7A
-17
Table 7A-7 Summary of Perchlorate Results,
Burn Site Groundwater Monitoring, Sandia National Laboratories/New Mexico
Calendar Year 2010
Well ID Perchlorate
Resulta (g/L)
MDLb (g/L)
PQLc (g/L)
MCLd (g/L)
Laboratory Qualifiere
Validation Qualifierf Sample No. Analytical
Methodg
CYN-MW6 03-Mar-10 4.59 4.0 12 NE J 088180-020 EPA 314.0
CYN-MW6 20-Sep-10 6.14 4.0 12 NE J 089659-020 EPA 314.0
CYN-MW9 28-Sep-10 ND 4.0 12 NE U 089672-020 EPA 314.0
CYN-MW9 (Duplicate) 28-Sep-10 ND 4.0 12 NE U 089673-020 EPA 314.0
CYN-MW10 27-Sep-10 ND 4.0 12 NE U 089668-020 EPA 314.0
CYN-MW11 29-Sep-10 ND 4.0 12 NE U 089675-020 EPA 314.0
CYN-MW12 23-Sep-10 ND 4.0 12 NE U 089665-020 EPA 314.0
CYN-MW9 27-Oct-10 ND 4.0 12 NE U 089759-020 EPA 314.0
CYN-MW10 02-Nov-10 ND 4.0 12 NE U 089773-020 EPA 314.0
CYN-MW10 (Duplicate) 02-Nov-10 ND 4.0 12 NE U 089774-020 EPA 314.0
CYN-MW11 01-Nov-10 ND 4.0 12 NE U 089765-020 EPA 314.0
CYN-MW12 28-Oct-10 ND 4.0 12 NE U 089762-020 EPA 314.0
Refer to footnotes on page 7A-35.

7A-18
AN
NU
AL
GR
OU
ND
WA
TE
R M
ON
ITO
RIN
G R
EP
OR
T, CA
LE
ND
AR
YE
AR
2010
Table 7A-8 Summary of Total Metal Results,
Burn Site Groundwater Monitoring, Sandia National Laboratories/New Mexico
Calendar Year 2010
Well ID Analyte Resulta (mg/L)
MDLb (mg/L)
PQLc (mg/L)
MCLd (mg/L)
Laboratory Qualifiere
Validation Qualifierf Sample No. Analytical
Methodg CYN-MW1D Aluminum 0.0245 0.010 0.030 NE J 089661-010 SW846 6020 21-Sep-10 Antimony ND 0.0005 0.003 0.006 U 089661-010 SW846 6020 Arsenic ND 0.0015 0.005 0.010 U 089661-010 SW846 6020 Barium 0.0467 0.0005 0.002 2.00 089661-010 SW846 6020 Beryllium ND 0.0001 0.0005 0.004 U 089661-010 SW846 6020 Cadmium ND 0.00011 0.001 0.005 U 089661-010 SW846 6020 Calcium 67.3 0.200 2.00 NE B 089661-010 SW846 6020 Chromium ND 0.0025 0.010 0.100 U 089661-010 SW846 6020 Cobalt 0.000325 0.0001 0.001 NE J 089661-010 SW846 6020 Copper 0.00245 0.0003 0.001 NE 089661-010 SW846 6020 Iron 8.36 0.010 0.100 NE 089661-010 SW846 6020 Lead ND 0.0005 0.002 NE U 089661-010 SW846 6020 Magnesium 14.4 0.005 0.015 NE 089661-010 SW846 6020 Manganese 0.0675 0.001 0.005 NE 089661-010 SW846 6020 Mercury ND 0.000066 0.0002 0.002 U 089661-010 SW846 7470 Nickel 0.00168 0.0005 0.002 NE J 089661-010 SW846 6020 Potassium 2.52 0.080 0.300 NE 089661-010 SW846 6020 Selenium 0.002 0.001 0.005 0.050 J 089661-010 SW846 6020 Silver ND 0.0002 0.001 NE U 089661-010 SW846 6020 Sodium 33.4 0.080 0.250 NE 089661-010 SW846 6020 Thallium ND 0.0003 0.001 0.002 U 089661-010 SW846 6020 Uranium 0.00111 0.00005 0.0002 0.030 089661-010 SW846 6020 Vanadium ND 0.003 0.010 NE U 089661-010 SW846 6020 Zinc ND 0.0026 0.010 NE U 089661-010 SW846 6020 Refer to footnotes on page 7A-35.

BU
RN
SIT
E G
RO
UN
DW
AT
ER
7A
-19
Table 7A-8 (Continued) Summary of Total Metal Results,
Burn Site Groundwater Monitoring, Sandia National Laboratories/New Mexico
Calendar Year 2010
Well ID Analyte Resulta (mg/L)
MDLb (mg/L)
PQLc (mg/L)
MCLd (mg/L)
Laboratory Qualifiere
Validation Qualifierf Sample No. Analytical
Methodg CYN-MW3 Aluminum 0.0158 0.010 0.030 NE J 089663-010 SW846 6020 22-Sep-10 Antimony ND 0.0005 0.003 0.006 U 089663-010 SW846 6020 Arsenic ND 0.0015 0.005 0.010 U 089663-010 SW846 6020 Barium 0.0502 0.0005 0.002 2.00 089663-010 SW846 6020 Beryllium ND 0.0001 0.0005 0.004 U 089663-010 SW846 6020 Cadmium ND 0.00011 0.001 0.005 U 089663-010 SW846 6020 Calcium 140 0.200 2.00 NE B 089663-010 SW846 6020 Chromium ND 0.0025 0.010 0.100 U 089663-010 SW846 6020 Cobalt 0.000179 0.0001 0.001 NE J J+ 089663-010 SW846 6020 Copper 0.00348 0.0003 0.001 NE 089663-010 SW846 6020 Iron 0.233 0.010 0.100 NE 089663-010 SW846 6020 Lead ND 0.0005 0.002 NE U 089663-010 SW846 6020 Magnesium 37.0 0.005 0.015 NE 089663-010 SW846 6020 Manganese ND 0.001 0.005 NE U 089663-010 SW846 6020 Mercury ND 0.000066 0.0002 0.002 U 089663-010 SW846 7470 Nickel 0.00274 0.0005 0.002 NE 089663-010 SW846 6020 Potassium 2.13 0.080 0.300 NE 089663-010 SW846 6020 Selenium 0.00811 0.001 0.005 0.050 089663-010 SW846 6020 Silver ND 0.0002 0.001 NE U 089663-010 SW846 6020 Sodium 41.2 0.080 0.250 NE 089663-010 SW846 6020 Thallium ND 0.0003 0.001 0.002 U 089663-010 SW846 6020 Uranium 0.00624 0.00005 0.0002 0.030 089663-010 SW846 6020 Vanadium ND 0.003 0.010 NE U 089663-010 SW846 6020 Zinc 0.00283 0.0026 0.010 NE J 089663-010 SW846 6020 Refer to footnotes on page 7A-35.

7A-20
AN
NU
AL
GR
OU
ND
WA
TE
R M
ON
ITO
RIN
G R
EP
OR
T, CA
LE
ND
AR
YE
AR
2010
Table 7A-8 (Continued) Summary of Total Metal Results,
Burn Site Groundwater Monitoring, Sandia National Laboratories/New Mexico
Calendar Year 2010
Well ID Analyte Resulta (mg/L)
MDLb (mg/L)
PQLc (mg/L)
MCLd (mg/L)
Laboratory Qualifiere
Validation Qualifierf Sample No. Analytical
Methodg CYN-MW4 Aluminum ND 0.050 0.150 NE U 089656-010 SW846 6020 16-Sep-10 Antimony ND 0.0005 0.003 0.006 U 089656-010 SW846 6020 Arsenic 0.00185 0.0015 0.005 0.010 J 089656-010 SW846 6020 Barium 0.0471 0.0005 0.002 2.00 089656-010 SW846 6020 Beryllium ND 0.0001 0.0005 0.004 U 089656-010 SW846 6020 Cadmium ND 0.00011 0.001 0.005 U 089656-010 SW846 6020 Calcium 69.7 0.200 2.00 NE 089656-010 SW846 6020 Chromium ND 0.0125 0.050 0.100 U 089656-010 SW846 6020 Cobalt ND 0.0005 0.005 NE U 089656-010 SW846 6020 Copper ND 0.0015 0.005 NE U 089656-010 SW846 6020 Iron 0.128 0.050 0.500 NE J 089656-010 SW846 6020 Lead ND 0.0005 0.002 NE U 089656-010 SW846 6020 Magnesium 34.6 0.025 0.075 NE 089656-010 SW846 6020 Manganese ND 0.005 0.025 NE U 089656-010 SW846 6020 Mercury ND 0.000066 0.0002 0.002 U 089656-010 SW846 7470 Nickel ND 0.0025 0.010 NE U 089656-010 SW846 6020 Potassium 6.34 0.400 1.50 NE 089656-010 SW846 6020 Selenium 0.0148 0.001 0.005 0.050 089656-010 SW846 6020 Silver ND 0.0002 0.001 NE U 089656-010 SW846 6020 Sodium 45.7 0.400 1.25 NE 089656-010 SW846 6020 Thallium ND 0.0003 0.001 0.002 U 089656-010 SW846 6020 Uranium 0.0126 0.00005 0.0002 0.030 B 089656-010 SW846 6020 Vanadium ND 0.003 0.010 NE U 089656-010 SW846 6020 Zinc 0.00672 0.0026 0.010 NE J 0.041U 089656-010 SW846 6020 Refer to footnotes on page 7A-35.

BU
RN
SIT
E G
RO
UN
DW
AT
ER
7A
-21
Table 7A-8 (Continued) Summary of Total Metal Results,
Burn Site Groundwater Monitoring, Sandia National Laboratories/New Mexico
Calendar Year 2010
Well ID Analyte Resulta (mg/L)
MDLb (mg/L)
PQLc (mg/L)
MCLd (mg/L)
Laboratory Qualifiere
Validation Qualifierf Sample No. Analytical
Methodg CYN-MW4 (Duplicate) Aluminum ND 0.050 0.150 NE U 089657-010 SW846 6020 16-Sep-10 Antimony ND 0.0005 0.003 0.006 U 089657-010 SW846 6020 Arsenic ND 0.0015 0.005 0.010 U 089657-010 SW846 6020 Barium 0.0464 0.0005 0.002 2.00 089657-010 SW846 6020 Beryllium ND 0.0001 0.0005 0.004 U 089657-010 SW846 6020 Cadmium ND 0.00011 0.001 0.005 U 089657-010 SW846 6020 Calcium 69.1 0.200 2.00 NE 089657-010 SW846 6020 Chromium ND 0.0125 0.050 0.100 U 089657-010 SW846 6020 Cobalt ND 0.0005 0.005 NE U 089657-010 SW846 6020 Copper ND 0.0015 0.005 NE U 089657-010 SW846 6020 Iron 0.127 0.050 0.500 NE J 089657-010 SW846 6020 Lead ND 0.0005 0.002 NE U 089657-010 SW846 6020 Magnesium 35.4 0.025 0.075 NE 089657-010 SW846 6020 Manganese ND 0.005 0.025 NE U 089657-010 SW846 6020 Mercury ND 0.000066 0.0002 0.002 U 089657-010 SW846 7470 Nickel ND 0.0025 0.010 NE U 089657-010 SW846 6020 Potassium 6.41 0.400 1.50 NE 089657-010 SW846 6020 Selenium 0.0146 0.001 0.005 0.050 089657-010 SW846 6020 Silver ND 0.0002 0.001 NE U 089657-010 SW846 6020 Sodium 46.3 0.400 1.25 NE 089657-010 SW846 6020 Thallium ND 0.0003 0.001 0.002 U 089657-010 SW846 6020 Uranium 0.0126 0.00005 0.0002 0.030 B 089657-010 SW846 6020 Vanadium ND 0.003 0.010 NE U 089657-010 SW846 6020 Zinc 0.00651 0.0026 0.010 NE J 0.041U 089657-010 SW846 6020 Refer to footnotes on page 7A-35.

7A-22
AN
NU
AL
GR
OU
ND
WA
TE
R M
ON
ITO
RIN
G R
EP
OR
T, CA
LE
ND
AR
YE
AR
2010
Table 7A-8 (Continued) Summary of Total Metal Results,
Burn Site Groundwater Monitoring, Sandia National Laboratories/New Mexico
Calendar Year 2010
Well ID Analyte Resulta (mg/L)
MDLb (mg/L)
PQLc (mg/L)
MCLd (mg/L)
Laboratory Qualifiere
Validation Qualifierf Sample No. Analytical
Methodg CYN-MW6 Aluminum 0.0138 0.010 0.030 NE J 089659-010 SW846 6020 20-Sep-10 Antimony ND 0.0005 0.003 0.006 U 089659-010 SW846 6020 Arsenic ND 0.0015 0.005 0.010 U 089659-010 SW846 6020 Barium 0.0664 0.0005 0.002 2.00 089659-010 SW846 6020 Beryllium ND 0.0001 0.0005 0.004 U 089659-010 SW846 6020 Cadmium 0.000124 0.00011 0.001 0.005 J J+ 089659-010 SW846 6020 Calcium 160 0.200 2.00 NE B 089659-010 SW846 6020 Chromium ND 0.0025 0.010 0.100 U 089659-010 SW846 6020 Cobalt 0.000299 0.0001 0.001 NE J J+ 089659-010 SW846 6020 Copper 0.00628 0.0003 0.001 NE 089659-010 SW846 6020 Iron 0.253 0.010 0.100 NE 089659-010 SW846 6020 Lead ND 0.0005 0.002 NE U 089659-010 SW846 6020 Magnesium 46.4 0.005 0.015 NE 089659-010 SW846 6020 Manganese 0.00148 0.001 0.005 NE J J+ 089659-010 SW846 6020 Mercury ND 0.000066 0.0002 0.002 U 089659-010 SW846 7470 Nickel 0.00361 0.0005 0.002 NE 089659-010 SW846 6020 Potassium 2.37 0.080 0.300 NE 089659-010 SW846 6020 Selenium 0.0101 0.001 0.005 0.050 089659-010 SW846 6020 Silver ND 0.0002 0.001 NE U 089659-010 SW846 6020 Sodium 45.2 0.080 0.250 NE 089659-010 SW846 6020 Thallium ND 0.0003 0.001 0.002 U 089659-010 SW846 6020 Uranium 0.0087 0.00005 0.0002 0.030 089659-010 SW846 6020 Vanadium ND 0.003 0.010 NE U 089659-010 SW846 6020 Zinc 0.0197 0.0026 0.010 NE 089659-010 SW846 6020 Refer to footnotes on page 7A-35.

BU
RN
SIT
E G
RO
UN
DW
AT
ER
7A
-23
Table 7A-8 (Continued) Summary of Total Metal Results,
Burn Site Groundwater Monitoring, Sandia National Laboratories/New Mexico
Calendar Year 2010
Well ID Analyte Resulta (mg/L)
MDLb (mg/L)
PQLc (mg/L)
MCLd (mg/L)
Laboratory Qualifiere
Validation Qualifierf Sample No. Analytical
Methodg CYN-MW7 Aluminum 0.0562 0.050 0.150 NE J J+ 089652-010 SW846 6020 15-Sep-10 Antimony ND 0.0005 0.003 0.006 U 089652-010 SW846 6020 Arsenic ND 0.0015 0.005 0.010 U 089652-010 SW846 6020 Barium 0.106 0.0005 0.002 2.00 089652-010 SW846 6020 Beryllium ND 0.0001 0.0005 0.004 U 089652-010 SW846 6020 Cadmium ND 0.00011 0.001 0.005 U 089652-010 SW846 6020 Calcium 107 0.200 2.00 NE 089652-010 SW846 6020 Chromium ND 0.0125 0.050 0.100 U 089652-010 SW846 6020 Cobalt ND 0.0005 0.005 NE U 089652-010 SW846 6020 Copper ND 0.0015 0.005 NE U 089652-010 SW846 6020 Iron 0.203 0.050 0.500 NE J 089652-010 SW846 6020 Lead ND 0.0005 0.002 NE U 089652-010 SW846 6020 Magnesium 21.2 0.025 0.075 NE 089652-010 SW846 6020 Manganese ND 0.005 0.025 NE U 089652-010 SW846 6020 Mercury ND 0.000066 0.0002 0.002 U 089652-010 SW846 7470 Nickel 0.00322 0.0025 0.010 NE J 089652-010 SW846 6020 Potassium 2.52 0.400 1.50 NE 089652-010 SW846 6020 Selenium 0.00449 0.001 0.005 0.050 J 089652-010 SW846 6020 Silver ND 0.0002 0.001 NE U 089652-010 SW846 6020 Sodium 39.9 0.400 1.25 NE 089652-010 SW846 6020 Thallium ND 0.0003 0.001 0.002 U 089652-010 SW846 6020 Uranium 0.00682 0.00005 0.0002 0.030 B 089652-010 SW846 6020 Vanadium ND 0.003 0.010 NE U 089652-010 SW846 6020 Zinc 0.004 0.0026 0.010 NE J 089652-010 SW846 6020 Refer to footnotes on page 7A-35.

7A-24
AN
NU
AL
GR
OU
ND
WA
TE
R M
ON
ITO
RIN
G R
EP
OR
T, CA
LE
ND
AR
YE
AR
2010
Table 7A-8 (Continued) Summary of Total Metal Results,
Burn Site Groundwater Monitoring, Sandia National Laboratories/New Mexico
Calendar Year 2010
Well ID Analyte Resulta (mg/L)
MDLb (mg/L)
PQLc (mg/L)
MCLd (mg/L)
Laboratory Qualifiere
Validation Qualifierf Sample No. Analytical
Methodg CYN-MW8 Aluminum ND 0.010 0.030 NE U 089650-010 SW846 6020 14-Sep-10 Antimony ND 0.0005 0.003 0.006 U 089650-010 SW846 6020 Arsenic ND 0.0015 0.005 0.010 U 089650-010 SW846 6020 Barium 0.0598 0.0005 0.002 2.00 089650-010 SW846 6020 Beryllium ND 0.0001 0.0005 0.004 U 089650-010 SW846 6020 Cadmium 0.000171 0.00011 0.001 0.005 J J+ 089650-010 SW846 6020 Calcium 116 0.200 2.00 NE 089650-010 SW846 6020 Chromium ND 0.0025 0.010 0.100 U 089650-010 SW846 6020 Cobalt 0.000309 0.0001 0.001 NE J J+ 089650-010 SW846 6020 Copper 0.000956 0.0003 0.001 NE B, J 0.0019U 089650-010 SW846 6020 Iron 0.188 0.010 0.100 NE 089650-010 SW846 6020 Lead ND 0.0005 0.002 NE U 089650-010 SW846 6020 Magnesium 24.4 0.025 0.075 NE 089650-010 SW846 6020 Manganese 0.00305 0.001 0.005 NE J J+ 089650-010 SW846 6020 Mercury ND 0.000066 0.0002 0.002 U 089650-010 SW846 7470 Nickel 0.00324 0.0005 0.002 NE J+ 089650-010 SW846 6020 Potassium 2.62 0.400 1.50 NE 089650-010 SW846 6020 Selenium 0.00708 0.001 0.005 0.050 089650-010 SW846 6020 Silver ND 0.0002 0.001 NE U 089650-010 SW846 6020 Sodium 49.2 0.400 1.25 NE 089650-010 SW846 6020 Thallium 0.000434 0.0003 0.001 0.002 J 0.0023U 089650-010 SW846 6020 Uranium 0.00797 0.00005 0.0002 0.030 B 089650-010 SW846 6020 Vanadium ND 0.003 0.010 NE U 089650-010 SW846 6020 Zinc 0.00609 0.0026 0.010 NE J 089650-010 SW846 6020 Refer to footnotes on page 7A-35.

BU
RN
SIT
E G
RO
UN
DW
AT
ER
7A
-25
Table 7A-8 (Continued) Summary of Total Metal Results,
Burn Site Groundwater Monitoring, Sandia National Laboratories/New Mexico
Calendar Year 2010
Well ID Analyte Resulta (mg/L)
MDLb (mg/L)
PQLc (mg/L)
MCLd (mg/L)
Laboratory Qualifiere
Validation Qualifierf Sample No. Analytical
Methodg CYN-MW9 Aluminum ND 0.010 0.030 NE U 089672-010 SW846 6020 28-Sep-10 Antimony ND 0.0005 0.003 0.006 U 089672-010 SW846 6020 Arsenic ND 0.0015 0.005 0.010 U 089672-010 SW846 6020 Barium 0.0738 0.0005 0.002 2.00 089672-010 SW846 6020 Beryllium ND 0.0001 0.0005 0.004 U 089672-010 SW846 6020 Cadmium ND 0.00011 0.001 0.005 U 089672-010 SW846 6020 Calcium 166 0.400 4.00 NE J 089672-010 SW846 6020 Chromium ND 0.0025 0.010 0.100 U 089672-010 SW846 6020 Cobalt 0.000365 0.0001 0.001 NE J J+ 089672-010 SW846 6020 Copper 0.0015 0.0003 0.001 NE 0.0098UJ 089672-010 SW846 6020 Iron 0.368 0.010 0.100 NE 089672-010 SW846 6020 Lead ND 0.0005 0.002 NE U 089672-010 SW846 6020 Magnesium 48.1 0.050 0.150 NE 089672-010 SW846 6020 Manganese 0.0658 0.001 0.005 NE J+ 089672-010 SW846 6020 Mercury ND 0.000066 0.0002 0.002 U 089672-010 SW846 7470 Nickel 0.00524 0.0005 0.002 NE J+ 089672-010 SW846 6020 Potassium 2.68 0.080 0.300 NE 089672-010 SW846 6020 Selenium 0.00822 0.001 0.005 0.050 089672-010 SW846 6020 Silver ND 0.0002 0.001 NE U 089672-010 SW846 6020 Sodium 42.0 0.800 2.50 NE 089672-010 SW846 6020 Thallium ND 0.0003 0.001 0.002 U 089672-010 SW846 6020 Uranium 0.00821 0.00005 0.0002 0.030 B 089672-010 SW846 6020 Vanadium ND 0.003 0.010 NE U 089672-010 SW846 6020 Zinc 0.0359 0.0026 0.010 NE J+ 089672-010 SW846 6020 Refer to footnotes on page 7A-35.

7A-26
AN
NU
AL
GR
OU
ND
WA
TE
R M
ON
ITO
RIN
G R
EP
OR
T, CA
LE
ND
AR
YE
AR
2010
Table 7A-8 (Continued) Summary of Total Metal Results,
Burn Site Groundwater Monitoring, Sandia National Laboratories/New Mexico
Calendar Year 2010
Well ID Analyte Resulta (mg/L)
MDLb (mg/L)
PQLc (mg/L)
MCLd (mg/L)
Laboratory Qualifiere
Validation Qualifierf Sample No. Analytical
Methodg CYN-MW9 (Duplicate) Aluminum 0.012 0.010 0.030 NE J 089673-010 SW846 6020 28-Sep-10 Antimony ND 0.0005 0.003 0.006 U 089673-010 SW846 6020 Arsenic ND 0.0015 0.005 0.010 U 089673-010 SW846 6020 Barium 0.074 0.0005 0.002 2.00 089673-010 SW846 6020 Beryllium ND 0.0001 0.0005 0.004 U 089673-010 SW846 6020 Cadmium ND 0.00011 0.001 0.005 U 089673-010 SW846 6020 Calcium 174 0.400 4.00 NE J 089673-010 SW846 6020 Chromium ND 0.0025 0.010 0.100 U 089673-010 SW846 6020 Cobalt 0.000378 0.0001 0.001 NE J J+ 089673-010 SW846 6020 Copper 0.00152 0.0003 0.001 NE 0.0098UJ 089673-010 SW846 6020 Iron 0.388 0.010 0.100 NE 089673-010 SW846 6020 Lead ND 0.0005 0.002 NE U 089673-010 SW846 6020 Magnesium 49.8 0.050 0.150 NE 089673-010 SW846 6020 Manganese 0.068 0.001 0.005 NE J+ 089673-010 SW846 6020 Mercury ND 0.000066 0.0002 0.002 U 089673-010 SW846 7470 Nickel 0.00547 0.0005 0.002 NE J+ 089673-010 SW846 6020 Potassium 2.75 0.080 0.300 NE 089673-010 SW846 6020 Selenium 0.00831 0.001 0.005 0.050 089673-010 SW846 6020 Silver ND 0.0002 0.001 NE U 089673-010 SW846 6020 Sodium 40.2 0.800 2.50 NE 089673-010 SW846 6020 Thallium ND 0.0003 0.001 0.002 U 089673-010 SW846 6020 Uranium 0.00827 0.00005 0.0002 0.030 B 089673-010 SW846 6020 Vanadium ND 0.003 0.010 NE U 089673-010 SW846 6020 Zinc 0.0368 0.0026 0.010 NE J+ 089673-010 SW846 6020 Refer to footnotes on page 7A-35.

BU
RN
SIT
E G
RO
UN
DW
AT
ER
7A
-27
Table 7A-8 (Continued) Summary of Total Metal Results,
Burn Site Groundwater Monitoring, Sandia National Laboratories/New Mexico
Calendar Year 2010
Well ID Analyte Resulta (mg/L)
MDLb (mg/L)
PQLc (mg/L)
MCLd (mg/L)
Laboratory Qualifiere
Validation Qualifierf Sample No. Analytical
Methodg CYN-MW10 Aluminum ND 0.010 0.030 NE U 089668-010 SW846 6020 27-Sep-10 Antimony ND 0.0005 0.003 0.006 U 089668-010 SW846 6020 Arsenic ND 0.0015 0.005 0.010 U 089668-010 SW846 6020 Barium 0.0644 0.0005 0.002 2.00 089668-010 SW846 6020 Beryllium ND 0.0001 0.0005 0.004 U 089668-010 SW846 6020 Cadmium ND 0.00011 0.001 0.005 U 089668-010 SW846 6020 Calcium 133 0.100 1.00 NE 089668-010 SW846 6020 Chromium ND 0.0025 0.010 0.100 U 089668-010 SW846 6020 Cobalt 0.000197 0.0001 0.001 NE J J+ 089668-010 SW846 6020 Copper 0.000989 0.0003 0.001 NE J 089668-010 SW846 6020 Iron 0.282 0.010 0.100 NE 089668-010 SW846 6020 Lead ND 0.0005 0.002 NE U 089668-010 SW846 6020 Magnesium 35.2 0.025 0.075 NE 089668-010 SW846 6020 Manganese 0.00296 0.001 0.005 NE J J+ 089668-010 SW846 6020 Mercury ND 0.000066 0.0002 0.002 U 089668-010 SW846 7470 Nickel 0.00399 0.0005 0.002 NE J+ 089668-010 SW846 6020 Potassium 1.99 0.080 0.300 NE 089668-010 SW846 6020 Selenium 0.00771 0.001 0.005 0.050 089668-010 SW846 6020 Silver ND 0.0002 0.001 NE U 089668-010 SW846 6020 Sodium 37.2 0.400 1.25 NE 089668-010 SW846 6020 Thallium 0.000588 0.0003 0.001 0.002 B, J 0.0031U 089668-010 SW846 6020 Uranium 0.0068 0.00005 0.0002 0.030 B 089668-010 SW846 6020 Vanadium ND 0.003 0.010 NE U 089668-010 SW846 6020 Zinc 0.00305 0.0026 0.010 NE J J+ 089668-010 SW846 6020 Refer to footnotes on page 7A-35.

7A-28
AN
NU
AL
GR
OU
ND
WA
TE
R M
ON
ITO
RIN
G R
EP
OR
T, CA
LE
ND
AR
YE
AR
2010
Table 7A-8 (Continued) Summary of Total Metal Results,
Burn Site Groundwater Monitoring, Sandia National Laboratories/New Mexico
Calendar Year 2010
Well ID Analyte Resulta (mg/L)
MDLb (mg/L)
PQLc (mg/L)
MCLd (mg/L)
Laboratory Qualifiere
Validation Qualifierf Sample No. Analytical
Methodg CYN-MW11 Aluminum 0.0478 0.010 0.030 NE 089675-010 SW846 6020 29-Sep-10 Antimony 0.000617 0.0005 0.003 0.006 J 089675-010 SW846 6020 Arsenic ND 0.0015 0.005 0.010 U 089675-010 SW846 6020 Barium 0.0868 0.0005 0.002 2.00 089675-010 SW846 6020 Beryllium ND 0.0001 0.0005 0.004 U 089675-010 SW846 6020 Cadmium ND 0.00011 0.001 0.005 U 089675-010 SW846 6020 Calcium 128 0.400 4.00 NE J 089675-010 SW846 6020 Chromium ND 0.0025 0.010 0.100 U 089675-010 SW846 6020 Cobalt 0.00127 0.0001 0.001 NE J+ 089675-010 SW846 6020 Copper 0.00153 0.0003 0.001 NE 089675-010 SW846 6020 Iron 0.394 0.010 0.100 NE 089675-010 SW846 6020 Lead ND 0.0005 0.002 NE U 089675-010 SW846 6020 Magnesium 44.2 0.050 0.150 NE 089675-010 SW846 6020 Manganese 0.771 0.001 0.005 NE 089675-010 SW846 6020 Mercury ND 0.000066 0.0002 0.002 U 089675-010 SW846 7470 Nickel 0.00593 0.0005 0.002 NE J+ 089675-010 SW846 6020 Potassium 3.62 0.080 0.300 NE 089675-010 SW846 6020 Selenium 0.00548 0.001 0.005 0.050 089675-010 SW846 6020 Silver ND 0.0002 0.001 NE U 089675-010 SW846 6020 Sodium 51.8 0.800 2.50 NE 089675-010 SW846 6020 Thallium ND 0.0003 0.001 0.002 U 089675-010 SW846 6020 Uranium 0.00771 0.00005 0.0002 0.030 B 089675-010 SW846 6020 Vanadium ND 0.003 0.010 NE U 089675-010 SW846 6020 Zinc 0.735 0.0026 0.010 NE 089675-010 SW846 6020 Refer to footnotes on page 7A-35.
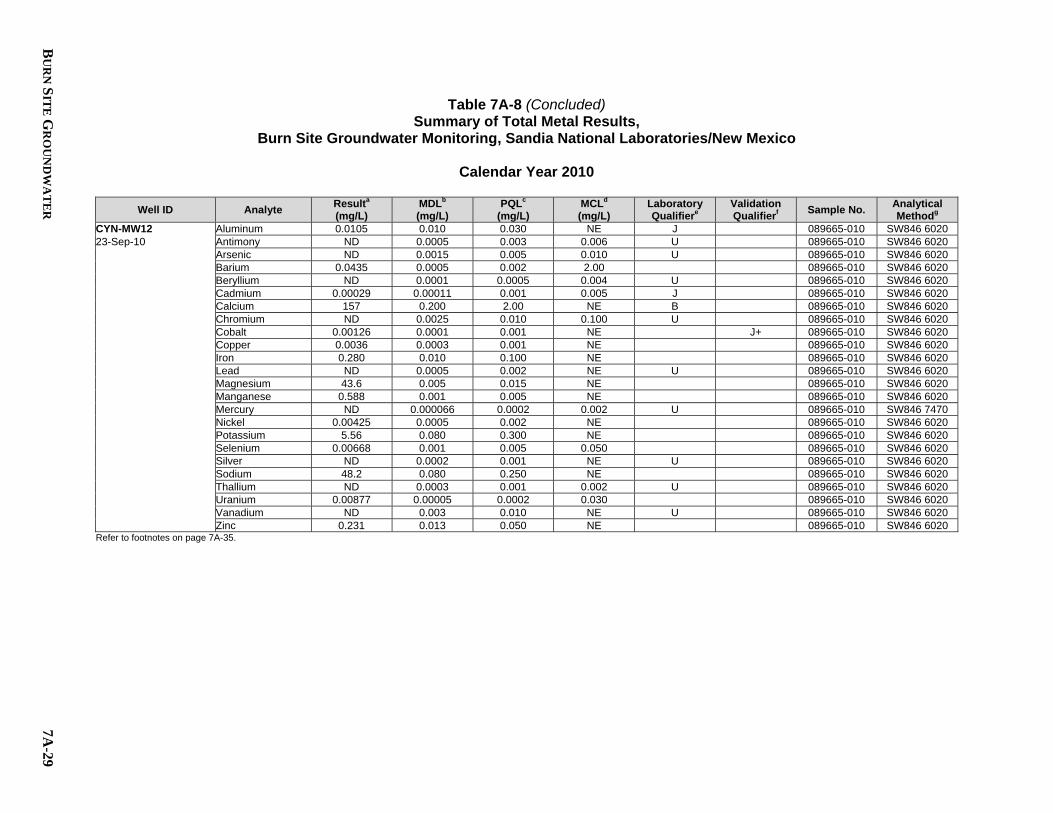
BU
RN
SIT
E G
RO
UN
DW
AT
ER
7A
-29
Table 7A-8 (Concluded) Summary of Total Metal Results,
Burn Site Groundwater Monitoring, Sandia National Laboratories/New Mexico
Calendar Year 2010
Well ID Analyte Resulta (mg/L)
MDLb (mg/L)
PQLc (mg/L)
MCLd (mg/L)
Laboratory Qualifiere
Validation Qualifierf Sample No. Analytical
Methodg CYN-MW12 Aluminum 0.0105 0.010 0.030 NE J 089665-010 SW846 6020 23-Sep-10 Antimony ND 0.0005 0.003 0.006 U 089665-010 SW846 6020 Arsenic ND 0.0015 0.005 0.010 U 089665-010 SW846 6020 Barium 0.0435 0.0005 0.002 2.00 089665-010 SW846 6020 Beryllium ND 0.0001 0.0005 0.004 U 089665-010 SW846 6020 Cadmium 0.00029 0.00011 0.001 0.005 J 089665-010 SW846 6020 Calcium 157 0.200 2.00 NE B 089665-010 SW846 6020 Chromium ND 0.0025 0.010 0.100 U 089665-010 SW846 6020 Cobalt 0.00126 0.0001 0.001 NE J+ 089665-010 SW846 6020 Copper 0.0036 0.0003 0.001 NE 089665-010 SW846 6020 Iron 0.280 0.010 0.100 NE 089665-010 SW846 6020 Lead ND 0.0005 0.002 NE U 089665-010 SW846 6020 Magnesium 43.6 0.005 0.015 NE 089665-010 SW846 6020 Manganese 0.588 0.001 0.005 NE 089665-010 SW846 6020 Mercury ND 0.000066 0.0002 0.002 U 089665-010 SW846 7470 Nickel 0.00425 0.0005 0.002 NE 089665-010 SW846 6020 Potassium 5.56 0.080 0.300 NE 089665-010 SW846 6020 Selenium 0.00668 0.001 0.005 0.050 089665-010 SW846 6020 Silver ND 0.0002 0.001 NE U 089665-010 SW846 6020 Sodium 48.2 0.080 0.250 NE 089665-010 SW846 6020 Thallium ND 0.0003 0.001 0.002 U 089665-010 SW846 6020 Uranium 0.00877 0.00005 0.0002 0.030 089665-010 SW846 6020 Vanadium ND 0.003 0.010 NE U 089665-010 SW846 6020 Zinc 0.231 0.013 0.050 NE 089665-010 SW846 6020 Refer to footnotes on page 7A-35.

7A-30
AN
NU
AL
GR
OU
ND
WA
TE
R M
ON
ITO
RIN
G R
EP
OR
T, CA
LE
ND
AR
YE
AR
2010
Table 7A-9 Summary of Tritium, Gross Alpha, Gross Beta, Gamma Spectroscopy, and Isotopic Uranium Results,
Burn Site Groundwater Monitoring, Sandia National Laboratories/New Mexico
Calendar Year 2010
Well ID Analyte Activitya (pCi/L)
MDAb (pCi/L)
Critical Levelc(pCi/L)
MCLd (pCi/L)
Laboratory Qualifiere
Validation Qualifierf Sample No. Analytical
Methodg CYN-MW1D Americium-241 -7.19 13.0 21.5 10.7 NE U BD 089661-033 EPA 901.1 21-Sep-10 Cesium-137 0.949 2.02 3.45 1.73 NE U BD 089661-033 EPA 901.1 Cobalt-60 0.0907 2.20 3.66 1.83 NE U BD 089661-033 EPA 901.1 Potassium-40 12.2 46.9 33.1 16.5 NE U BD 089661-033 EPA 901.1 Gross Alpha 0.50 NA NA 15 NA None 089661-034 EPA 900.0 Gross Beta 2.53 1.07 1.56 0.756 4mrem/yr J 089661-034 EPA 900.0 Uranium-233/234 2.04 0.320 0.0513 0.0216 NE 089661-035 HASL-300 Uranium-235/236 0.0413 0.0271 0.0396 0.0147 NE J 089661-035 HASL-300 Uranium-238 0.331 0.0771 0.031 0.0114 NE 089661-035 HASL-300 Tritium 32.4 86.6 147 71.6 NE U BD 089661-036 EPA 906.0 M CYN-MW3 Americium-241 4.37 12.4 18.7 9.36 NE U BD 089663-033 EPA 901.1 22-Sep-10 Cesium-137 0.398 1.92 3.26 1.63 NE U BD 089663-033 EPA 901.1 Cobalt-60 0.879 1.94 3.34 1.67 NE U BD 089663-033 EPA 901.1 Potassium-40 21.1 50.1 28.4 14.2 NE U BD 089663-033 EPA 901.1 Gross Alpha 2.00 NA NA 15 NA None 089663-034 EPA 900.0 Gross Beta 5.63 1.86 2.43 1.17 4mrem/yr J 089663-034 EPA 900.0 Uranium-233/234 6.16 0.899 0.0559 0.0235 NE 089663-035 HASL-300 Uranium-235/236 0.213 0.0659 0.0431 0.016 NE J 089663-035 HASL-300 Uranium-238 1.93 0.310 0.0338 0.0124 NE 089663-035 HASL-300 Tritium 56.6 92.7 156 75.8 NE U BD 089663-036 EPA 906.0 M CYN-MW4 Americium-241 7.34 7.95 12.5 6.25 NE U BD 089656-033 EPA 901.1 16-Sep-10 Cesium-137 0.416 1.86 3.15 1.57 NE U BD 089656-033 EPA 901.1 Cobalt-60 -1.53 1.89 2.98 1.49 NE U BD 089656-033 EPA 901.1 Potassium-40 -15.4 38.4 41.6 20.8 NE U BD 089656-033 EPA 901.1 Gross Alpha 3.74 NA NA 15 NA None 089656-034 EPA 900.0 Gross Beta 13.3 2.71 1.45 0.691 4mrem/yr 089656-034 EPA 900.0 Uranium-233/234 32.5 4.76 0.123 0.0548 NE 089656-035 HASL-300 Uranium-235/236 0.721 0.166 0.0628 0.0232 NE 089656-035 HASL-300 Uranium-238 4.34 0.690 0.0546 0.0207 NE 089656-035 HASL-300 Tritium 8.74 63.4 114 52.5 NE U BD 089656-036 EPA 906.0 M Refer to footnotes on page 7A-35.

BU
RN
SIT
E G
RO
UN
DW
AT
ER
7A
-31
Table 7A-9 (Continued) Summary of Tritium, Gross Alpha, Gross Beta, Gamma Spectroscopy, and Isotopic Uranium Results,
Burn Site Groundwater Monitoring, Sandia National Laboratories/New Mexico
Calendar Year 2010
Well ID Analyte Activitya (pCi/L)
MDAb (pCi/L)
Critical Levelc(pCi/L)
MCLd (pCi/L)
Laboratory Qualifiere
Validation Qualifierf Sample No. Analytical
Methodg CYN-MW4 (Duplicate) Americium-241 0.182 4.58 7.70 3.85 NE U BD 089657-033 EPA 901.1 16-Sep-10 Cesium-137 -0.564 1.55 2.60 1.30 NE U BD 089657-033 EPA 901.1 Cobalt-60 1.65 1.59 2.90 1.45 NE U BD 089657-033 EPA 901.1 Potassium-40 -22.2 34.1 39.2 19.6 NE U BD 089657-033 EPA 901.1 Gross Alpha -5.15 NA NA 15 NA None 089657-034 EPA 900.0 Gross Beta 4.08 2.00 2.79 1.36 4mrem/yr J 089657-034 EPA 900.0 Uranium-233/234 33.9 4.93 0.116 0.0515 NE 089657-035 HASL-300 Uranium-235/236 0.355 0.103 0.059 0.0218 NE 089657-035 HASL-300 Uranium-238 4.39 0.689 0.0514 0.0195 NE 089657-035 HASL-300 Tritium -5.95 63.3 116 53.6 NE U BD 089657-036 EPA 906.0 M CYN-MW6 Americium-241 -8.49 12.8 21.1 10.6 NE U BD 089659-033 EPA 901.1 20-Sep-10 Cesium-137 -0.25 2.03 3.38 1.69 NE U BD 089659-033 EPA 901.1 Cobalt-60 -0.781 2.21 3.55 1.78 NE U BD 089659-033 EPA 901.1 Potassium-40 -46.4 36.7 42.3 21.2 NE U BD 089659-033 EPA 901.1 Gross Alpha -1.69 NA NA 15 NA None 089659-034 EPA 900.0 Gross Beta 4.25 2.00 2.95 1.43 4mrem/yr J 089659-034 EPA 900.0 Uranium-233/234 10.6 1.55 0.0889 0.0373 NE 089659-035 HASL-300 Uranium-235/236 0.247 0.0895 0.0685 0.0255 NE J 089659-035 HASL-300 Uranium-238 2.84 0.463 0.0537 0.0197 NE 089659-035 HASL-300 Tritium 83.3 93.5 155 75.2 NE U BD 089659-036 EPA 906.0 M CYN-MW7 Americium-241 -2.87 10.6 17.8 8.90 NE U BD 089652-033 EPA 901.1 15-Sep-10 Cesium-137 0.889 1.96 3.37 1.68 NE U BD 089652-033 EPA 901.1 Cobalt-60 -0.333 2.09 3.43 1.71 NE U BD 089652-033 EPA 901.1 Potassium-40 40.8 24.8 45.2 22.6 NE U BD 089652-033 EPA 901.1 Gross Alpha -1.94 NA NA 15 NA None 089652-034 EPA 900.0 Gross Beta 4.99 1.48 1.60 0.761 4mrem/yr 089652-034 EPA 900.0 Uranium-233/234 19.3 2.80 0.107 0.0479 NE 089652-035 HASL-300 Uranium-235/236 0.127 0.054 0.0549 0.0203 NE J 089652-035 HASL-300 Uranium-238 2.41 0.397 0.0478 0.0181 NE 089652-035 HASL-300 Tritium 0.00 63.0 115 52.9 NE U BD 089652-036 EPA 906.0 M Refer to footnotes on page 7A-35.
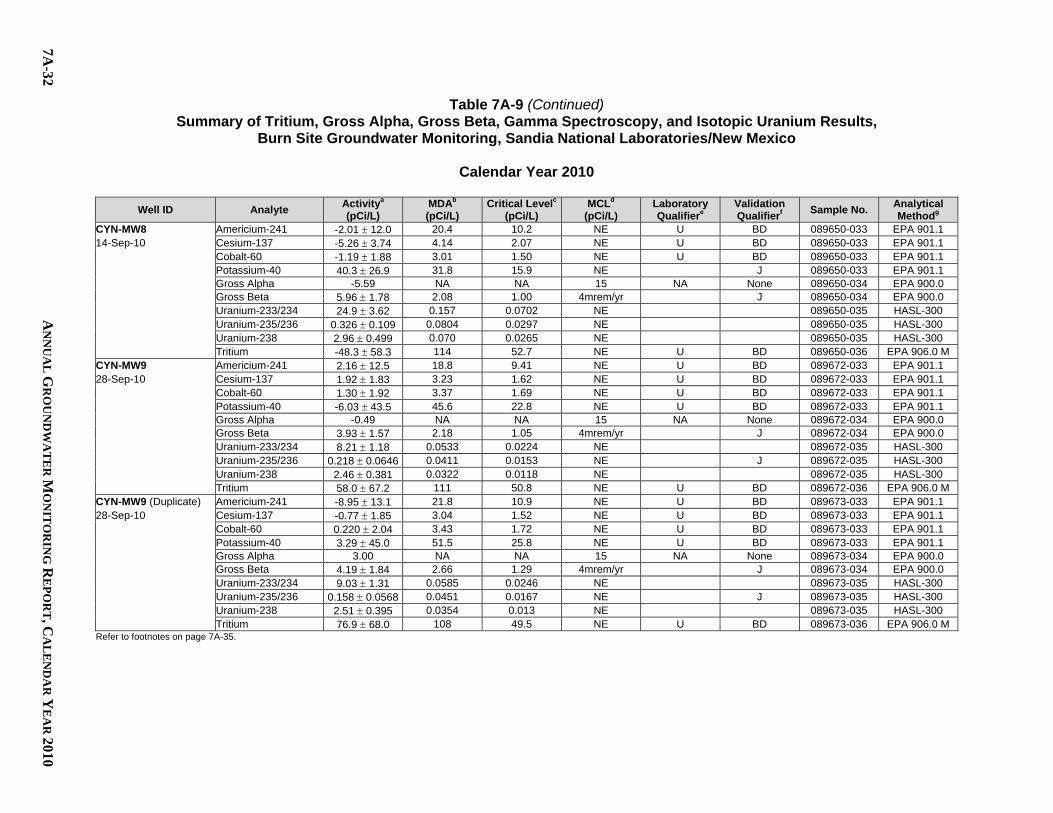
7A-32
AN
NU
AL
GR
OU
ND
WA
TE
R M
ON
ITO
RIN
G R
EP
OR
T, CA
LE
ND
AR
YE
AR
2010
Table 7A-9 (Continued) Summary of Tritium, Gross Alpha, Gross Beta, Gamma Spectroscopy, and Isotopic Uranium Results,
Burn Site Groundwater Monitoring, Sandia National Laboratories/New Mexico
Calendar Year 2010
Well ID Analyte Activitya (pCi/L)
MDAb (pCi/L)
Critical Levelc(pCi/L)
MCLd (pCi/L)
Laboratory Qualifiere
Validation Qualifierf Sample No. Analytical
Methodg CYN-MW8 Americium-241 -2.01 12.0 20.4 10.2 NE U BD 089650-033 EPA 901.1 14-Sep-10 Cesium-137 -5.26 3.74 4.14 2.07 NE U BD 089650-033 EPA 901.1 Cobalt-60 -1.19 1.88 3.01 1.50 NE U BD 089650-033 EPA 901.1 Potassium-40 40.3 26.9 31.8 15.9 NE J 089650-033 EPA 901.1 Gross Alpha -5.59 NA NA 15 NA None 089650-034 EPA 900.0 Gross Beta 5.96 1.78 2.08 1.00 4mrem/yr J 089650-034 EPA 900.0 Uranium-233/234 24.9 3.62 0.157 0.0702 NE 089650-035 HASL-300 Uranium-235/236 0.326 0.109 0.0804 0.0297 NE 089650-035 HASL-300 Uranium-238 2.96 0.499 0.070 0.0265 NE 089650-035 HASL-300 Tritium -48.3 58.3 114 52.7 NE U BD 089650-036 EPA 906.0 M CYN-MW9 Americium-241 2.16 12.5 18.8 9.41 NE U BD 089672-033 EPA 901.1 28-Sep-10 Cesium-137 1.92 1.83 3.23 1.62 NE U BD 089672-033 EPA 901.1 Cobalt-60 1.30 1.92 3.37 1.69 NE U BD 089672-033 EPA 901.1 Potassium-40 -6.03 43.5 45.6 22.8 NE U BD 089672-033 EPA 901.1 Gross Alpha -0.49 NA NA 15 NA None 089672-034 EPA 900.0 Gross Beta 3.93 1.57 2.18 1.05 4mrem/yr J 089672-034 EPA 900.0 Uranium-233/234 8.21 1.18 0.0533 0.0224 NE 089672-035 HASL-300 Uranium-235/236 0.218 0.0646 0.0411 0.0153 NE J 089672-035 HASL-300 Uranium-238 2.46 0.381 0.0322 0.0118 NE 089672-035 HASL-300 Tritium 58.0 67.2 111 50.8 NE U BD 089672-036 EPA 906.0 M CYN-MW9 (Duplicate) Americium-241 -8.95 13.1 21.8 10.9 NE U BD 089673-033 EPA 901.1 28-Sep-10 Cesium-137 -0.77 1.85 3.04 1.52 NE U BD 089673-033 EPA 901.1 Cobalt-60 0.220 2.04 3.43 1.72 NE U BD 089673-033 EPA 901.1 Potassium-40 3.29 45.0 51.5 25.8 NE U BD 089673-033 EPA 901.1 Gross Alpha 3.00 NA NA 15 NA None 089673-034 EPA 900.0 Gross Beta 4.19 1.84 2.66 1.29 4mrem/yr J 089673-034 EPA 900.0 Uranium-233/234 9.03 1.31 0.0585 0.0246 NE 089673-035 HASL-300 Uranium-235/236 0.158 0.0568 0.0451 0.0167 NE J 089673-035 HASL-300 Uranium-238 2.51 0.395 0.0354 0.013 NE 089673-035 HASL-300 Tritium 76.9 68.0 108 49.5 NE U BD 089673-036 EPA 906.0 M Refer to footnotes on page 7A-35.
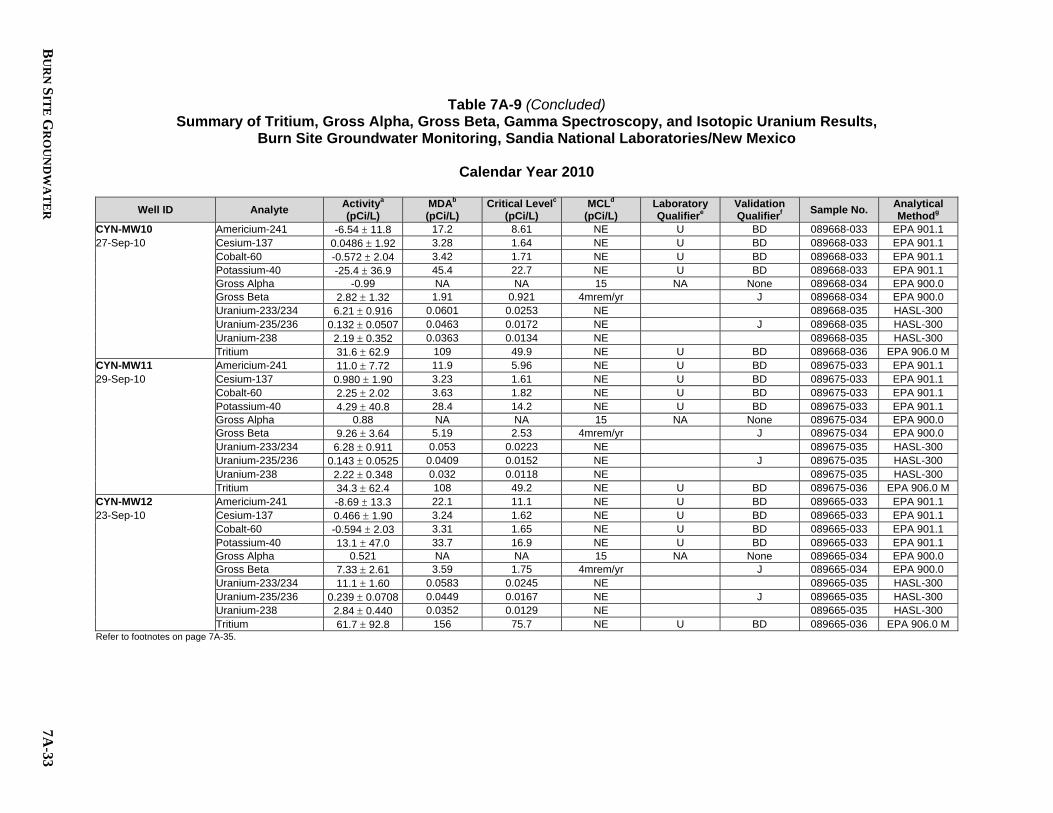
BU
RN
SIT
E G
RO
UN
DW
AT
ER
7A
-33
Table 7A-9 (Concluded) Summary of Tritium, Gross Alpha, Gross Beta, Gamma Spectroscopy, and Isotopic Uranium Results,
Burn Site Groundwater Monitoring, Sandia National Laboratories/New Mexico
Calendar Year 2010
Well ID Analyte Activitya (pCi/L)
MDAb (pCi/L)
Critical Levelc(pCi/L)
MCLd (pCi/L)
Laboratory Qualifiere
Validation Qualifierf Sample No. Analytical
Methodg CYN-MW10 Americium-241 -6.54 11.8 17.2 8.61 NE U BD 089668-033 EPA 901.1 27-Sep-10 Cesium-137 0.0486 1.92 3.28 1.64 NE U BD 089668-033 EPA 901.1 Cobalt-60 -0.572 2.04 3.42 1.71 NE U BD 089668-033 EPA 901.1 Potassium-40 -25.4 36.9 45.4 22.7 NE U BD 089668-033 EPA 901.1 Gross Alpha -0.99 NA NA 15 NA None 089668-034 EPA 900.0 Gross Beta 2.82 1.32 1.91 0.921 4mrem/yr J 089668-034 EPA 900.0 Uranium-233/234 6.21 0.916 0.0601 0.0253 NE 089668-035 HASL-300 Uranium-235/236 0.132 0.0507 0.0463 0.0172 NE J 089668-035 HASL-300 Uranium-238 2.19 0.352 0.0363 0.0134 NE 089668-035 HASL-300 Tritium 31.6 62.9 109 49.9 NE U BD 089668-036 EPA 906.0 M CYN-MW11 Americium-241 11.0 7.72 11.9 5.96 NE U BD 089675-033 EPA 901.1 29-Sep-10 Cesium-137 0.980 1.90 3.23 1.61 NE U BD 089675-033 EPA 901.1 Cobalt-60 2.25 2.02 3.63 1.82 NE U BD 089675-033 EPA 901.1 Potassium-40 4.29 40.8 28.4 14.2 NE U BD 089675-033 EPA 901.1 Gross Alpha 0.88 NA NA 15 NA None 089675-034 EPA 900.0 Gross Beta 9.26 3.64 5.19 2.53 4mrem/yr J 089675-034 EPA 900.0 Uranium-233/234 6.28 0.911 0.053 0.0223 NE 089675-035 HASL-300 Uranium-235/236 0.143 0.0525 0.0409 0.0152 NE J 089675-035 HASL-300 Uranium-238 2.22 0.348 0.032 0.0118 NE 089675-035 HASL-300 Tritium 34.3 62.4 108 49.2 NE U BD 089675-036 EPA 906.0 M CYN-MW12 Americium-241 -8.69 13.3 22.1 11.1 NE U BD 089665-033 EPA 901.1 23-Sep-10 Cesium-137 0.466 1.90 3.24 1.62 NE U BD 089665-033 EPA 901.1 Cobalt-60 -0.594 2.03 3.31 1.65 NE U BD 089665-033 EPA 901.1 Potassium-40 13.1 47.0 33.7 16.9 NE U BD 089665-033 EPA 901.1 Gross Alpha 0.521 NA NA 15 NA None 089665-034 EPA 900.0 Gross Beta 7.33 2.61 3.59 1.75 4mrem/yr J 089665-034 EPA 900.0 Uranium-233/234 11.1 1.60 0.0583 0.0245 NE 089665-035 HASL-300 Uranium-235/236 0.239 0.0708 0.0449 0.0167 NE J 089665-035 HASL-300 Uranium-238 2.84 0.440 0.0352 0.0129 NE 089665-035 HASL-300 Tritium 61.7 92.8 156 75.7 NE U BD 089665-036 EPA 906.0 M Refer to footnotes on page 7A-35.

7A-34
AN
NU
AL
GR
OU
ND
WA
TE
R M
ON
ITO
RIN
G R
EP
OR
T, CA
LE
ND
AR
YE
AR
2010
Table 7A-10 Summary of Field Water Quality Measurementsh,
Burn Site Groundwater Monitoring, Sandia National Laboratories/New Mexico
Calendar Year 2010
Well ID Sample Date Temperature (0C)
Specific Conductivity (mho/cm)
Oxidation Reduction Potential
(mV) pH Turbidity
(NTU) Dissolved Oxygen (% Sat)
Dissolved Oxygen (mg/L)
CYN-MW1D 25-Feb-10 13.89 517 27.5 7.74 132 11.7 1.20 CYN-MW3 01-Mar-10 13.10 927 266.3 7.19 0.33 62.1 6.56 CYN-MW4 22-Feb-10 12.98 702 224.8 7.17 0.26 44.3 4.66 CYN-MW6 03-Mar-10 16.27 1302 231.2 6.92 1.74 18.0 1.76 CYN-MW7 24-Feb-10 15.73 736 229.9 7.03 15.6 33.0 3.24 CYN-MW8 23-Feb-10 14.97 849 223.5 7.06 0.36 29.9 3.08
CYN-MW1D 01-Jun-10 19.71 445 -109.8 8.98 92.0 6.3 0.59 CYN-MW3 02-Jun-10 16.70 912 260.5 8.31 1.39 64.5 6.26 CYN-MW4 27-May-10 19.74 685 96.0 7.84 0.18 37.4 3.42 CYN-MW6 04-Jun-10 18.28 1090 284.4 8.18 0.34 20.4 1.91 CYN-MW7 26-May-10 19.17 719 140.0 7.35 4.90 34.7 3.20 CYN-MW8 25-May-10 18.53 824 149.9 7.14 0.61 40.8 3.81
CYN-MW1D 21-Sep-10 20.31 495 -20.6 7.75 105.0 9.6 0.88 CYN-MW3 22-Sep-10 18.35 900 142.5 7.29 0.33 66.5 6.19 CYN-MW4 16-Sep-10 20.50 672 180.5 7.29 0.12 34.8 3.12 CYN-MW6 20-Sep-10 18.53 1059 103.8 7.04 0.37 20.6 1.92 CYN-MW7 15-Sep-10 21.62 707 166.1 7.09 1.11 39.1 3.44 CYN-MW8 14-Sep-10 21.46 811 158.1 7.13 0.19 48.1 4.24 CYN-MW9 28-Sep-10 18.93 1089 197.3 7.03 0.45 48.6 4.50 CYN-MW10 27-Sep-10 19.86 905 145.5 7.33 0.40 71.3 6.49 CYN-MW11 29-Sep-10 21.51 992 58.9 7.27 3.73 5.5 0.51 CYN-MW12 23-Sep-10 18.47 1045 50.8 7.10 0.90 5.4 0.51
CYN-MW9 27-Oct-10 16.07 1081 210.7 7.08 0.28 48.5 475 CYN-MW10 02-Nov-10 16.40 899 259.3 7.37 0.39 66.8 6.52 CYN-MW11 01-Nov-10 16.98 975 81.3 7.34 0.57 5.4 0.55 CYN-MW12 28-Oct-10 17.59 1035 173.4 7.16 0.26 6.6 0.63 Refer to footnotes on page 7A-35.

BURN SITE GROUNDWATER 7A-35
Footnotes for Burn Site Groundwater Monitoring Tables
aResult - Values in bold exceed the established MCL. - ND = not detected (at method detection limit). - Activities of zero or less are considered to be not detected. - Gross alpha activity measurements were corrected by subtracting out the total uranium activity (40 CFR Parts 9,
141, and 142, Table 1-4) - g/L = micrograms per liter. - mg/L = milligrams per liter. - pCi/L = picocuries per liter.
bMDL or MDA Method detection limit. The minimum concentration or activity that can be measured and reported with 99% confidence that the analyte is greater than zero; analyte is matrix specific. The minimal detectable activity or minimum measured activity in a sample required to ensure a 95% probability that the measured activity is accurately quantified above the critical level. NA = not applicable for gross alpha activities. The MDA could not be calculated as the gross alpha activity was corrected by subtracting out the total uranium activity.
cPQL or Critical Level Practical quantitation limit. The lowest concentration of analytes in a sample that can be reliably determined within specified limits of precision and accuracy by that indicated method under routine laboratory operating conditions. The minimum activity that can be measured and reported with 99% confidence that the analyte is greater than zero; analyte is matrix specific. NA = not applicable for gross alpha activities. The critical level could not be calculated as the gross alpha activity was corrected by subtracting out the total uranium activity.
dMCL - Maximum contaminant level. Established by the U.S. Environmental Protection Agency Primary
Water Regulations (40 CFR 141.11(b)), National Primary Drinking Water Standards, EPA, July 2002.
- NE = not established. - The following are the MCLs for gross alpha particles and beta particles in community water systems:
15 pCi/L = Gross alpha particle activity, excluding total uranium (40 CFR Parts 9, 141, and 142, Table 1-4). 4 mrem/yr = any combination of beta and/or gamma emitting radionuclides (as dose rate).
eLaboratory Qualifier B = Analyte is detected in associated laboratory method blank. H = Analytical holding time was exceeded. J = Amount detected is below the practical quantitation limit (PQL). NA = Not applicable for gross alpha activities. U = Analyte is absent or below the method detection limit.
fValidation Qualifier If cell is blank, then all quality control samples met acceptance criteria with respect to submitted samples. BD = Below detection limit as used in radiochemistry to identify results that are not statistically different from zero. J = The associated value is an estimated quantity. J+ = The associated numerical value is an estimated quantity with suspected positive bias.

7A-36 ANNUAL GROUNDWATER MONITORING REPORT, CALENDAR YEAR 2009
Footnotes for Burn Site Groundwater Monitoring Tables (Concluded)
fValidation Qualifier (continued) None = No data validation for corrected gross alpha activity. U = The analyte was analyzed for but was not detected. The associated numerical value is the sample quantitation limit. UJ = The analyte was analyzed for but was not detected. The associated value is an estimate and may be inaccurate or imprecise. R = The data are unusable. Resampling and reanalysis are necessary for verification.
gAnalytical Method
- U.S. Environmental Protection Agency, 1996, Test Methods for Evaluating Solid Waste, Physical/Chemical Methods, SW-846, 3rd ed., Rev. 1
- U.S. Environmental Protection Agency, Washington, D.C.; or Clesceri, Greenburg, and Eaton, 1998, Standard Methods for the Examination of Water and Wastewater, 20th ed., Method 2320B.
- U.S. Environmental Protection Agency, 1983, The Determination of Inorganic Anions in Water by Ion Chromatography-Method 300.0, EPA-600/4-84-017.
- U.S. Environmental Protection Agency, 1980, Prescribed Procedures for Measurement of Radioactivity in Drinking Water, EPA-600/4-80-032.
- U.S. Environmental Protection Agency, 1999, Perchlorate in Drinking Water Using Ion Chromatography, EPA 815/R-00-014.
- U.S. Department of Energy, Environmental Measurements Laboratory, 1990, EML Procedures Manual, 27th ed., Vol. 1, Rev. 1992, HASL-300.
hField Water Quality Measurements - Field measurements collected prior to sampling. °C = degrees Celsius. % Sat = present saturation. mho/cm = micromhos per centimeter. mg/L = milligrams per liter. mV = millivolts. NTU = nephelometric turbidity units. pH = potential of hydrogen (negative logarithm of the hydrogen ion concentration).

BURN SITE GROUNDWATER 7B-1
Attachment 7B Burn Site Groundwater
Plots

7B-2 ANNUAL GROUNDWATER MONITORING REPORT, CALENDAR YEAR 2010
This page intentionally left blank.

BURN SITE GROUNDWATER 7B-3
Attachment 7B Plots 7B-1 Nitrate plus Nitrite Concentrations, CYN-MW1D ....................................................... 7B-5 7B-2 Nitrate plus Nitrite Concentrations, CYN-MW3 .......................................................... 7B-6 7B-3 Nitrate plus Nitrite Concentrations, CYN-MW6 .......................................................... 7B-7 7B-4 Nitrate plus Nitrite Concentrations, CYN-MW9 .......................................................... 7B-8 7B-5 Nitrate plus Nitrite Concentrations, CYN-MW10 ........................................................ 7B-9 7B-6 Nitrate plus Nitrite Concentrations, CYN-MW11 ...................................................... 7B-10 7B-7 Nitrate plus Nitrite Concentrations, CYN-MW12 ...................................................... 7B-11 7B-8 Perchlorate Concentrations, CYN-MW6 .................................................................... 7B-12
7B-4 ANNUAL GROUNDWATER MONITORING REPORT, CALENDAR YEAR 2010
This page intentionally left blank.

BU
RN
SIT
E G
RO
UN
DW
AT
ER
7B
-5
Figure 7B-1. Nitrate plus Nitrite Concentrations, CYN-MW1D
0
5
10
15
20
25
30
35
40
45
Nitr
ate
plus N
itrite
(mg/
L)
NPN
MCL
MCL = 10 mg/L

7B-6
AN
NU
AL
GR
OU
ND
WA
TE
R M
ON
ITO
RIN
G R
EP
OR
T, CA
LE
ND
AR
YE
AR
2010
Figure 7B-2. Nitrate plus Nitrite Concentrations, CYN-MW3
0
5
10
15
20
25
30
35
40
45
Nitr
ate
plus N
itrite
(mg/
L)
NPN
MCL
MCL = 10 mg/L

BU
RN
SIT
E G
RO
UN
DW
AT
ER
7B
-7
Figure 7B-3. Nitrate plus Nitrite Concentrations, CYN-MW6
0
5
10
15
20
25
30
35
40
45
Nitr
ate
plus N
itrite
(mg/
L)
NPN
MCL
MCL = 10 mg/L

7B-8
AN
NU
AL
GR
OU
ND
WA
TE
R M
ON
ITO
RIN
G R
EP
OR
T, CA
LE
ND
AR
YE
AR
2010
Figure 7B-4. Nitrate plus Nitrite Concentrations, CYN-MW9
0
5
10
15
20
25
30
35
40
45
Nitr
ate
plus N
itrite
(mg/
L)
NPN
MCL
MCL = 10 mg/L

BU
RN
SIT
E G
RO
UN
DW
AT
ER
7B
-9
Figure 7B-5. Nitrate plus Nitrite Concentrations, CYN-MW10
0
5
10
15
20
25
30
35
40
45
Nitr
ate
plus N
itrite
(mg/
L)NPN
MCL
MCL = 10 mg/L

7B-10
AN
NU
AL
GR
OU
ND
WA
TE
R M
ON
ITO
RIN
G R
EP
OR
T, CA
LE
ND
AR
YE
AR
2010
Figure 7B-6. Nitrate plus Nitrite Concentrations, CYN-MW11
0
5
10
15
20
25
30
35
40
45
Nitr
ate
plus N
itrite
(mg/
L)
NPN
MCL
MCL = 10 mg/L

BU
RN
SIT
E G
RO
UN
DW
AT
ER
7B
-11
Figure 7B-7. Nitrate plus Nitrite Concentrations, CYN-MW12
0
5
10
15
20
25
30
35
40
45
Nitr
ate
plus N
itrite
(mg/
L)
NPN
MCL
MCL = 10 mg/L

7B-12
AN
NU
AL
GR
OU
ND
WA
TE
R M
ON
ITO
RIN
G R
EP
OR
T, CA
LE
ND
AR
YE
AR
2010
Figure 7B-8. Perchlorate Concentrations, CYN-MW6
6.92
7.44
6.636.45
7.52
8.46
8.93
8.12
6.57
7.74
6.20
6.56
7.25
6.676.85
7.24
4.12
4.714.59
6.146.396.48
6.996.92 6.96
5.94
6.46
0
1
2
3
4
5
6
7
8
9
10
Mar-06 Jun-06 Sep-06 Dec-06 Mar-07 Jun-07 Sep-07 Dec-07 Mar-08 Jun-08 Sep-08 Dec-08 Mar-09 Jun-09 Sep-09 Dec-09 Mar-10 Jun-10 Sep-10
Perc
hlor
ate
Conc
entr
atio
n (
g/L)
Sample Event (month/year)
The screening level/MDL for perchlorate required by the Order (NMED April 2004) is 4.0 g/L.
EPA Method 314.0
EPA Method 6850 ModifiedTransition from quarterly monitoring
to semiannual monitoring

BURN SITE GROUNDWATER 7C-1
Attachment 7C Burn Site Groundwater
Hydrographs

7C-2 ANNUAL GROUNDWATER MONITORING REPORT, CALENDAR YEAR 2010
This page intentionally left blank.

BURN SITE GROUNDWATER 7C-3
Attachment 7C Hydrographs 7C-1 Burn Site Groundwater Wells (1 of 4) .......................................................................... 7C-5 7C-2 Burn Site Groundwater Wells (2 of 4) .......................................................................... 7C-6 7C-3 Burn Site Groundwater Wells (3 of 4) .......................................................................... 7C-7 7C-4 Burn Site Groundwater Wells (4 of 4) .......................................................................... 7C-8

7C-4 ANNUAL GROUNDWATER MONITORING REPORT, CALENDAR YEAR 2010
This page intentionally left blank.
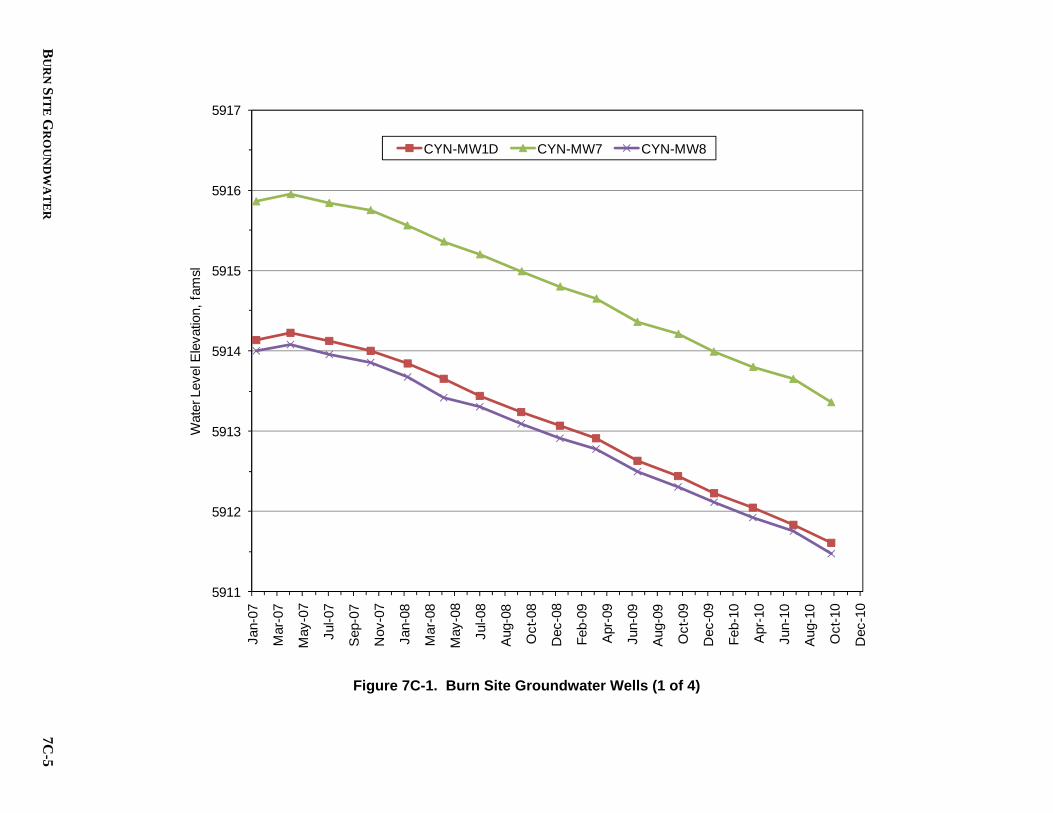
BU
RN
SIT
E G
RO
UN
DW
AT
ER
7C
-5
Figure 7C-1. Burn Site Groundwater Wells (1 of 4)
5911
5912
5913
5914
5915
5916
5917
Jan-
07
Mar
-07
May
-07
Jul-0
7
Sep
-07
Nov
-07
Jan-
08
Mar
-08
May
-08
Jul-0
8
Aug
-08
Oct
-08
Dec
-08
Feb-
09
Apr
-09
Jun-
09
Aug
-09
Oct
-09
Dec
-09
Feb-
10
Apr
-10
Jun-
10
Aug
-10
Oct
-10
Dec
-10
Wat
er L
evel
Ele
vatio
n, f
amsl
CYN-MW1D CYN-MW7 CYN-MW8

7C-6
AN
NU
AL
GR
OU
ND
WA
TE
R M
ON
ITO
RIN
G R
EP
OR
T, CA
LE
ND
AR
YE
AR
2010
Figure 7C-2. Burn Site Groundwater Wells (2 of 4)
6183
6185
6187
6189
6191
6193
6195
Jan-
07
Mar
-07
May
-07
Jul-0
7
Sep
-07
Nov
-07
Jan-
08
Mar
-08
May
-08
Jul-0
8
Aug
-08
Oct
-08
Dec
-08
Feb-
09
Apr
-09
Jun-
09
Aug
-09
Oct
-09
Dec
-09
Feb-
10
Apr
-10
Jun-
10
Aug
-10
Oct
-10
Dec
-10
Wat
er L
evel
Ele
vatio
n, f
amslCYN-MW3

BU
RN
SIT
E G
RO
UN
DW
AT
ER
7C
-7
Figure 7C-3. Burn Site Groundwater Wells (3 of 4)
6232
6233
6234
6235
6236
6237
6238
Jan-
07
Mar
-07
May
-07
Jul-0
7
Sep-
07
Nov
-07
Jan-
08
Mar
-08
May
-08
Jul-0
8
Aug-
08
Oct
-08
Dec
-08
Feb-
09
Apr
-09
Jun-
09
Aug-
09
Oct
-09
Dec
-09
Feb-
10
Apr
-10
Jun-
10
Aug-
10
Oct
-10
Dec
-10
Wat
er L
evel
Ele
vatio
n, fa
msl
CYN-MW4

7C-8
AN
NU
AL
GR
OU
ND
WA
TE
R M
ON
ITO
RIN
G R
EP
OR
T, CA
LE
ND
AR
YE
AR
2010
Figure 7C-4. Burn Site Groundwater Wells (4 of 4)
6190
6192
6194
6196
6198
6200
6202
6204
Jan-
07
Mar
-07
May
-07
Jul-0
7
Sep-
07
Nov
-07
Jan-
08
Mar
-08
May
-08
Jul-0
8
Aug-
08
Oct
-08
Dec
-08
Feb-
09
Apr
-09
Jun-
09
Aug-
09
Oct
-09
Dec
-09
Feb-
10
Apr
-10
Jun-
10
Aug-
10
Oct
-10
Dec
-10
Wat
er L
evel
Ele
vatio
n, f
amsl
CYN-MW6

APPENDIX C2010 TERRESTRIAL
SURVEILLANCE RESULTS

Location Type Analyte Location UnitsActivity and/or Concentration Two Sigma Error
Lab Data Qualifiers Decision Level MDA
Community Americium-241 9 pCi/g 0.0332 0.0176 U 0.0151 0.0332Community Americium-241 10 pCi/g -0.00954 0.0466 U 0.0381 0.0762Community Americium-241 25 pCi/g 0.0339 0.0618 U 0.0509 0.102Community Americium-241 62 pCi/g 0.0974 0.059 U 0.0475 0.0974Community Cesium-137 9 pCi/g 0.303 0.0389 0.0113 0.0226Community Cesium-137 10 pCi/g 0.215 0.0305 0.0116 0.0231Community Cesium-137 25 pCi/g 0.00527 0.0157 U 0.0133 0.0265Community Cesium-137 62 pCi/g 0.379 0.0432 0.0135 0.027Community Tritium 9 pCi/L 192 111 86.3 177Community Tritium 10 pCi/L 141 106 U 84.5 173Community Tritium 25 pCi/L 106 127 U 103 212Community Tritium 62 pCi/L 54.1 106 U 86.7 180Community Uranium 9 mg/kg 0.539 0.0129 0.039Community Uranium 10 mg/kg 0.481 0.013 0.0394Community Uranium 25 mg/kg 0.573 0.0122 0.037Community Uranium 62 mg/kg 0.526 0.0128 0.0389On-Site Americium-241 1 pCi/g -0.059 0.0602 U 0.0545 0.109On-Site Americium-241 02NE pCi/g -0.117 0.0782 U 0.0646 0.129On-Site Americium-241 02NW pCi/g 0.00972 0.0434 U 0.0405 0.0809On-Site Americium-241 02SE pCi/g 0.028 0.0655 U 0.0557 0.111On-Site Americium-241 02SW pCi/g 0.0362 0.0558 U 0.045 0.0899On-Site Americium-241 3 pCi/g 0.0526 0.0321 U 0.0272 0.0544On-Site Americium-241 6 pCi/g 0.0749 0.0327 U 0.0281 0.075On-Site Americium-241 7 pCi/g 0.013 0.0148 U 0.013 0.026On-Site Americium-241 33 pCi/g 0.0193 0.0682 U 0.0633 0.127On-Site Americium-241 34 pCi/g 0.00506 0.0466 U 0.0371 0.0742On-Site Americium-241 35 pCi/g 0.0589 0.0398 U 0.031 0.062On-Site Americium-241 41 pCi/g 0.0329 0.0878 U 0.0732 0.146On-Site Americium-241 42 pCi/g -0.127 0.0538 U 0.0381 0.0762On-Site Americium-241 43 pCi/g -0.092 0.0695 U 0.0627 0.125On-Site Americium-241 45 pCi/g -0.0407 0.104 U 0.0937 0.187On-Site Americium-241 46 pCi/g 0.0105 0.0388 U 0.0329 0.0658
TABLE C-1. Radiological Results Sorted by Location for Calendar Year 2010, Soil

Location Type Analyte Location UnitsActivity and/or Concentration Two Sigma Error
Lab Data Qualifiers Decision Level MDA
TABLE C-1. Radiological Results Sorted by Location for Calendar Year 2010, Soil
On-Site Americium-241 49 pCi/g 0.0151 0.0525 U 0.0487 0.0974On-Site Americium-241 51 pCi/g 0.0448 0.0386 U 0.0328 0.0655On-Site Americium-241 52 pCi/g -0.0113 0.0238 U 0.0212 0.0424On-Site Americium-241 53 pCi/g -0.0486 0.0459 U 0.0428 0.0855On-Site Americium-241 54 pCi/g 0.0317 0.0517 U 0.0458 0.0915On-Site Americium-241 55 pCi/g -0.0543 0.0647 U 0.0582 0.116On-Site Americium-241 56 pCi/g -0.0127 0.0528 U 0.0496 0.0991On-Site Americium-241 57 pCi/g -0.00116 0.0344 U 0.0281 0.0561On-Site Americium-241 66 pCi/g 0.00456 0.0325 U 0.0304 0.0609On-Site Americium-241 76 pCi/g -0.0272 0.0696 U 0.055 0.11On-Site Americium-241 77 pCi/g 0.0144 0.0243 U 0.0197 0.0393On-Site Americium-241 78 pCi/g -0.103 0.0565 U 0.0421 0.0842On-Site Americium-241 86 pCi/g -0.0152 0.0548 U 0.0506 0.101On-Site Americium-241 92 pCi/g 0.0349 0.0727 U 0.0703 0.14On-Site Cesium-137 1 pCi/g 0.207 0.0263 0.0105 0.0211On-Site Cesium-137 02NE pCi/g 0.149 0.0304 0.0144 0.0287On-Site Cesium-137 02NW pCi/g 0.0785 0.0263 0.0158 0.0316On-Site Cesium-137 02SE pCi/g 0.171 0.0332 0.0151 0.0302On-Site Cesium-137 02SW pCi/g 0.0826 0.0316 0.0134 0.0268On-Site Cesium-137 3 pCi/g 0.0777 0.0148 0.00713 0.0143On-Site Cesium-137 6 pCi/g 0.16 0.0218 0.00727 0.0145On-Site Cesium-137 7 pCi/g 0.0959 0.0203 0.00991 0.0198On-Site Cesium-137 33 pCi/g 0.0991 0.0209 0.00961 0.0192On-Site Cesium-137 34 pCi/g 0.149 0.0228 0.00906 0.0181On-Site Cesium-137 35 pCi/g 0.139 0.0248 0.00905 0.0181On-Site Cesium-137 41 pCi/g 0.123 0.0211 0.0107 0.0215On-Site Cesium-137 42 pCi/g 0.097 0.0168 0.00841 0.0168On-Site Cesium-137 43 pCi/g 0.0519 0.0167 0.00931 0.0186On-Site Cesium-137 45 pCi/g 0.0365 0.0237 0.0165 0.0331On-Site Cesium-137 46 pCi/g 0.199 0.0241 0.00855 0.0171On-Site Cesium-137 49 pCi/g 0.498 0.0474 0.00898 0.018On-Site Cesium-137 51 pCi/g 0.0697 0.0152 0.00853 0.0171

Location Type Analyte Location UnitsActivity and/or Concentration Two Sigma Error
Lab Data Qualifiers Decision Level MDA
TABLE C-1. Radiological Results Sorted by Location for Calendar Year 2010, Soil
On-Site Cesium-137 52 pCi/g 0.0188 0.0117 0.00681 0.0136On-Site Cesium-137 53 pCi/g 0.04 0.0126 0.00719 0.0144On-Site Cesium-137 54 pCi/g 0.17 0.0255 0.0104 0.0207On-Site Cesium-137 55 pCi/g 0.491 0.0489 0.0107 0.0213On-Site Cesium-137 56 pCi/g 0.0203 0.0126 0.0081 0.0162On-Site Cesium-137 57 pCi/g 0.0408 0.0107 0.00695 0.0139On-Site Cesium-137 66 pCi/g 0.0569 0.0143 0.00781 0.0156On-Site Cesium-137 76 pCi/g 0.146 0.0329 0.0138 0.0275On-Site Cesium-137 77 pCi/g 0.408 0.0612 0.0183 0.0365On-Site Cesium-137 78 pCi/g 0.475 0.0435 0.0092 0.0184On-Site Cesium-137 86 pCi/g 0.0125 0.0131 U 0.00894 0.0179On-Site Cesium-137 92 pCi/g 0.489 0.0671 0.0177 0.0354On-Site Tritium 1 pCi/L -12.2 166 U 139 289On-Site Tritium 02NE pCi/L 617 153 90.3 187On-Site Tritium 02NW pCi/L 430 149 104 215On-Site Tritium 02SE pCi/L 437 149 105 215On-Site Tritium 02SW pCi/L 224 134 104 214On-Site Tritium 3 pCi/L 160 89.3 61.3 133On-Site Tritium 6 pCi/L 158 89.8 61.8 134On-Site Tritium 7 pCi/L 246 105 75.9 157On-Site Tritium 33 pCi/L 152 111 U 86.5 179On-Site Tritium 34 pCi/L 59.1 112 U 92.3 191On-Site Tritium 35 pCi/L 268 107 76.6 158On-Site Tritium 41 pCi/L 113 60.3 41.8 89.9On-Site Tritium 42 pCi/L 85.4 93.7 U 75.6 156On-Site Tritium 43 pCi/L 202 101 76 157On-Site Tritium 45 pCi/L 142 96.9 U 75 156On-Site Tritium 46 pCi/L 148 58.5 39.1 82.7On-Site Tritium 49 pCi/L 202 93.4 60.7 132On-Site Tritium 51 pCi/L 134 80.7 56.3 122On-Site Tritium 52 pCi/L 148 84.2 58 126On-Site Tritium 53 pCi/L 134 84 59.1 129

Location Type Analyte Location UnitsActivity and/or Concentration Two Sigma Error
Lab Data Qualifiers Decision Level MDA
TABLE C-1. Radiological Results Sorted by Location for Calendar Year 2010, Soil
On-Site Tritium 54 pCi/L 127 57.3 39.8 84On-Site Tritium 55 pCi/L 46.4 107 U 88.3 183On-Site Tritium 56 pCi/L 121 62 42.6 91.7On-Site Tritium 57 pCi/L 200 94.3 61.7 134On-Site Tritium 66 pCi/L 23.2 125 U 104 214On-Site Tritium 76 pCi/L 191 100 75 156On-Site Tritium 77 pCi/L 38 90.4 U 74.5 155On-Site Tritium 78 pCi/L 130 81.6 57.4 125On-Site Tritium 86 pCi/L 33 136 U 113 233On-Site Tritium 92 pCi/g -0.125 0.714 U 0.605 1.27On-Site Uranium 1 mg/kg 0.645 0.0124 0.0377On-Site Uranium 02NE mg/kg 0.264 0.0129 0.039On-Site Uranium 02NW mg/kg 0.607 0.0129 0.0391On-Site Uranium 02SE mg/kg 0.415 0.0114 0.0346On-Site Uranium 02SW mg/kg 0.321 0.0131 0.0398On-Site Uranium 3 mg/kg 0.485 0.0129 0.0392On-Site Uranium 6 mg/kg 0.404 0.0129 0.0392On-Site Uranium 7 mg/kg 0.347 0.0125 0.038On-Site Uranium 33 mg/kg 0.702 0.0118 0.0359On-Site Uranium 34 mg/kg 0.507 0.0131 0.0398On-Site Uranium 41 mg/kg 0.34 0.0122 0.037On-Site Uranium 42 mg/kg 0.383 0.013 0.0393On-Site Uranium 43 mg/kg 0.313 0.0122 0.0368On-Site Uranium 45 mg/kg 0.322 0.0128 0.0387On-Site Uranium 46 mg/kg 0.665 0.0123 0.0373On-Site Uranium 49 mg/kg 0.52 0.0128 0.0389On-Site Uranium 51 mg/kg 0.616 0.0124 0.0377On-Site Uranium 52 mg/kg 0.397 0.0125 0.0379On-Site Uranium 53 mg/kg 0.314 0.0117 0.0355On-Site Uranium 54 mg/kg 0.357 0.013 0.0394On-Site Uranium 55 mg/kg 0.557 0.0127 0.0385On-Site Uranium 56 mg/kg 0.401 0.0125 0.0378
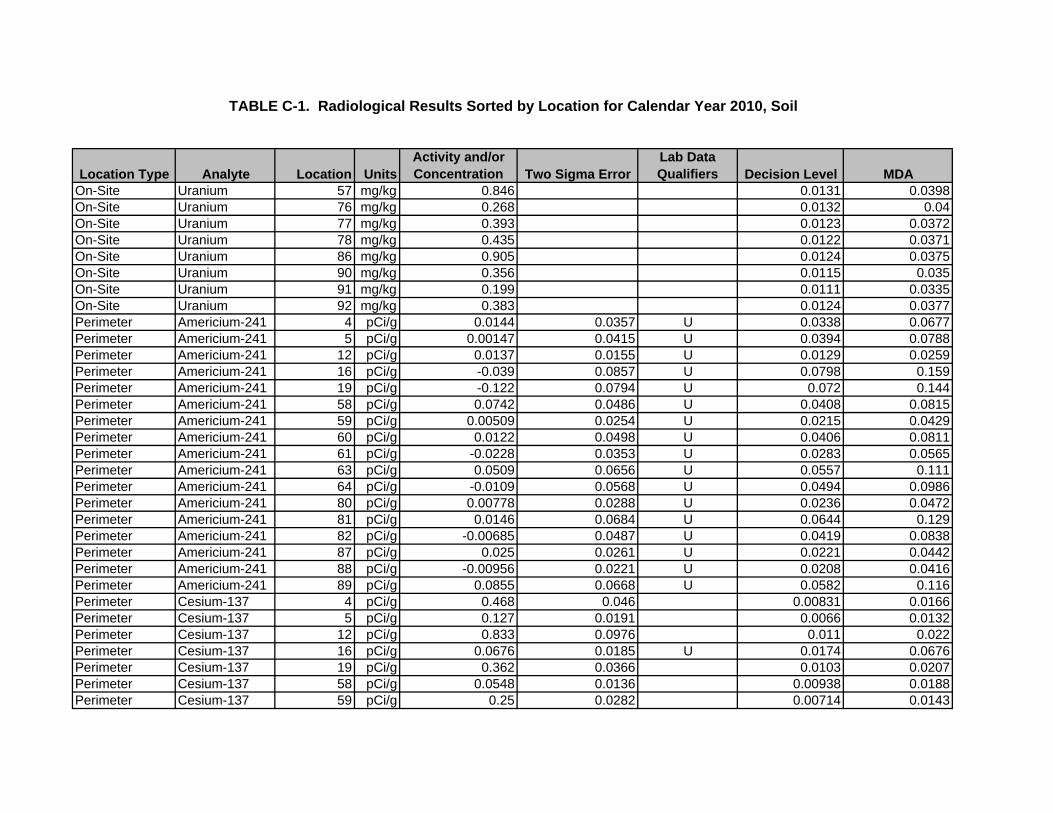
Location Type Analyte Location UnitsActivity and/or Concentration Two Sigma Error
Lab Data Qualifiers Decision Level MDA
TABLE C-1. Radiological Results Sorted by Location for Calendar Year 2010, Soil
On-Site Uranium 57 mg/kg 0.846 0.0131 0.0398On-Site Uranium 76 mg/kg 0.268 0.0132 0.04On-Site Uranium 77 mg/kg 0.393 0.0123 0.0372On-Site Uranium 78 mg/kg 0.435 0.0122 0.0371On-Site Uranium 86 mg/kg 0.905 0.0124 0.0375On-Site Uranium 90 mg/kg 0.356 0.0115 0.035On-Site Uranium 91 mg/kg 0.199 0.0111 0.0335On-Site Uranium 92 mg/kg 0.383 0.0124 0.0377Perimeter Americium-241 4 pCi/g 0.0144 0.0357 U 0.0338 0.0677Perimeter Americium-241 5 pCi/g 0.00147 0.0415 U 0.0394 0.0788Perimeter Americium-241 12 pCi/g 0.0137 0.0155 U 0.0129 0.0259Perimeter Americium-241 16 pCi/g -0.039 0.0857 U 0.0798 0.159Perimeter Americium-241 19 pCi/g -0.122 0.0794 U 0.072 0.144Perimeter Americium-241 58 pCi/g 0.0742 0.0486 U 0.0408 0.0815Perimeter Americium-241 59 pCi/g 0.00509 0.0254 U 0.0215 0.0429Perimeter Americium-241 60 pCi/g 0.0122 0.0498 U 0.0406 0.0811Perimeter Americium-241 61 pCi/g -0.0228 0.0353 U 0.0283 0.0565Perimeter Americium-241 63 pCi/g 0.0509 0.0656 U 0.0557 0.111Perimeter Americium-241 64 pCi/g -0.0109 0.0568 U 0.0494 0.0986Perimeter Americium-241 80 pCi/g 0.00778 0.0288 U 0.0236 0.0472Perimeter Americium-241 81 pCi/g 0.0146 0.0684 U 0.0644 0.129Perimeter Americium-241 82 pCi/g -0.00685 0.0487 U 0.0419 0.0838Perimeter Americium-241 87 pCi/g 0.025 0.0261 U 0.0221 0.0442Perimeter Americium-241 88 pCi/g -0.00956 0.0221 U 0.0208 0.0416Perimeter Americium-241 89 pCi/g 0.0855 0.0668 U 0.0582 0.116Perimeter Cesium-137 4 pCi/g 0.468 0.046 0.00831 0.0166Perimeter Cesium-137 5 pCi/g 0.127 0.0191 0.0066 0.0132Perimeter Cesium-137 12 pCi/g 0.833 0.0976 0.011 0.022Perimeter Cesium-137 16 pCi/g 0.0676 0.0185 U 0.0174 0.0676Perimeter Cesium-137 19 pCi/g 0.362 0.0366 0.0103 0.0207Perimeter Cesium-137 58 pCi/g 0.0548 0.0136 0.00938 0.0188Perimeter Cesium-137 59 pCi/g 0.25 0.0282 0.00714 0.0143

Location Type Analyte Location UnitsActivity and/or Concentration Two Sigma Error
Lab Data Qualifiers Decision Level MDA
TABLE C-1. Radiological Results Sorted by Location for Calendar Year 2010, Soil
Perimeter Cesium-137 60 pCi/g 0.0176 0.0177 U 0.00966 0.0193Perimeter Cesium-137 61 pCi/g -0.00741 0.013 U 0.00965 0.0193Perimeter Cesium-137 63 pCi/g 0.403 0.0416 0.00887 0.0177Perimeter Cesium-137 64 pCi/g 0.176 0.0363 0.0165 0.033Perimeter Cesium-137 80 pCi/g 0.0947 0.0185 0.00845 0.0169Perimeter Cesium-137 81 pCi/g 0.334 0.0418 0.00992 0.0198Perimeter Cesium-137 82 pCi/g 0.0196 0.0142 0.0094 0.0188Perimeter Cesium-137 87 pCi/g 0.264 0.0323 0.00706 0.0141Perimeter Cesium-137 88 pCi/g 0.141 0.0223 0.00768 0.0154Perimeter Cesium-137 89 pCi/g 0.0635 0.0184 0.0106 0.0211Perimeter Tritium 4 pCi/L 243 103 74.3 154Perimeter Tritium 5 pCi/L 201 151 U 120 246Perimeter Tritium 12 pCi/g 0.0249 0.721 U 0.604 1.27Perimeter Tritium 16 pCi/L 141 104 U 81.9 169Perimeter Tritium 16 pCi/g 0.5 0.759 U 0.607 1.28Perimeter Tritium 19 pCi/L 140 84.2 58.7 128Perimeter Tritium 58 pCi/L 212 94.2 60.4 131Perimeter Tritium 59 pCi/L 240 102 64.2 140Perimeter Tritium 60 pCi/L 109 132 U 107 221Perimeter Tritium 61 pCi/L 117 90.3 U 71.1 147Perimeter Tritium 63 pCi/L 134 57.5 39.5 83.4Perimeter Tritium 64 pCi/g 0.228 0.748 U 0.615 1.29Perimeter Tritium 64 pCi/g 0.545 0.71 U 0.562 1.18Perimeter Tritium 64 pCi/g 0.672 0.799 U 0.627 1.32Perimeter Tritium 80 pCi/L 94.1 58.8 42.2 90.7Perimeter Tritium 81 pCi/L 122 132 U 107 220Perimeter Tritium 82 pCi/L 115 56.1 39.7 84Perimeter Tritium 87 pCi/L 190 101 75.6 157Perimeter Tritium 88 pCi/L 186 112 86.5 179Perimeter Tritium 89 pCi/L 230 130 98.9 205Perimeter Uranium 4 mg/kg 0.48 0.013 0.0395Perimeter Uranium 5 mg/kg 0.339 0.0124 0.0376

Location Type Analyte Location UnitsActivity and/or Concentration Two Sigma Error
Lab Data Qualifiers Decision Level MDA
TABLE C-1. Radiological Results Sorted by Location for Calendar Year 2010, Soil
Perimeter Uranium 12 mg/kg 0.364 0.013 0.0394Perimeter Uranium 16 mg/kg 0.764 0.0115 0.0348Perimeter Uranium 19 mg/kg 0.46 0.0126 0.0381Perimeter Uranium 58 mg/kg 0.617 0.013 0.0393Perimeter Uranium 59 mg/kg 0.487 0.0126 0.0383Perimeter Uranium 60 mg/kg 0.556 0.013 0.0394Perimeter Uranium 61 mg/kg 0.458 0.0125 0.038Perimeter Uranium 63 mg/kg 0.516 0.0131 0.0398Perimeter Uranium 64 mg/kg 0.832 0.0126 0.0383Perimeter Uranium 80 mg/kg 0.673 0.0127 0.0385Perimeter Uranium 81 mg/kg 0.463 0.0131 0.0398Perimeter Uranium 82 mg/kg 0.727 0.0125 0.038Perimeter Uranium 87 mg/kg 0.232 0.0124 0.0375Perimeter Uranium 88 mg/kg 0.178 0.0129 0.0391Perimeter Uranium 89 mg/kg 0.367 0.0126 0.0383
NOTES: MDA = minimum detectable amount mg/kg = milligram per kilogram n/a = not applicable pCi/g = picocurie per gram pCi/L = picocurie per liter U = The analyte was analyzed for, but not detected above the MDA.
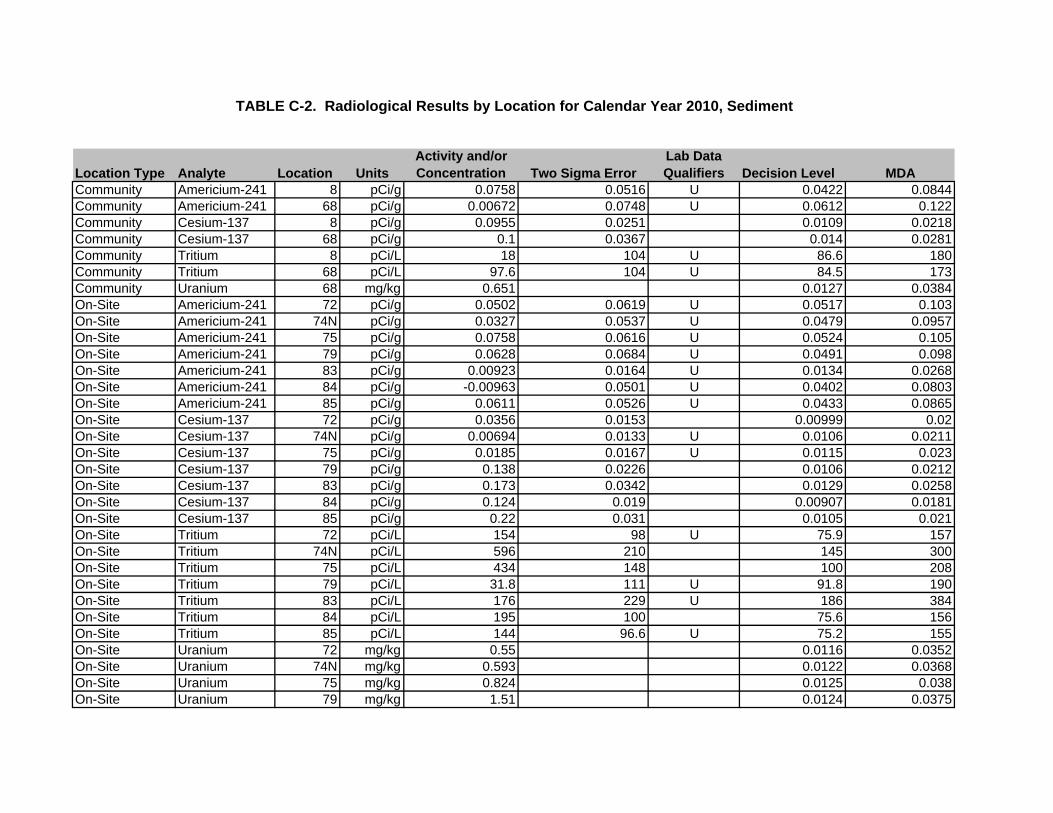
Location Type Analyte Location UnitsActivity and/or Concentration Two Sigma Error
Lab Data Qualifiers Decision Level MDA
Community Americium-241 8 pCi/g 0.0758 0.0516 U 0.0422 0.0844Community Americium-241 68 pCi/g 0.00672 0.0748 U 0.0612 0.122Community Cesium-137 8 pCi/g 0.0955 0.0251 0.0109 0.0218Community Cesium-137 68 pCi/g 0.1 0.0367 0.014 0.0281Community Tritium 8 pCi/L 18 104 U 86.6 180Community Tritium 68 pCi/L 97.6 104 U 84.5 173Community Uranium 68 mg/kg 0.651 0.0127 0.0384On-Site Americium-241 72 pCi/g 0.0502 0.0619 U 0.0517 0.103On-Site Americium-241 74N pCi/g 0.0327 0.0537 U 0.0479 0.0957On-Site Americium-241 75 pCi/g 0.0758 0.0616 U 0.0524 0.105On-Site Americium-241 79 pCi/g 0.0628 0.0684 U 0.0491 0.098On-Site Americium-241 83 pCi/g 0.00923 0.0164 U 0.0134 0.0268On-Site Americium-241 84 pCi/g -0.00963 0.0501 U 0.0402 0.0803On-Site Americium-241 85 pCi/g 0.0611 0.0526 U 0.0433 0.0865On-Site Cesium-137 72 pCi/g 0.0356 0.0153 0.00999 0.02On-Site Cesium-137 74N pCi/g 0.00694 0.0133 U 0.0106 0.0211On-Site Cesium-137 75 pCi/g 0.0185 0.0167 U 0.0115 0.023On-Site Cesium-137 79 pCi/g 0.138 0.0226 0.0106 0.0212On-Site Cesium-137 83 pCi/g 0.173 0.0342 0.0129 0.0258On-Site Cesium-137 84 pCi/g 0.124 0.019 0.00907 0.0181On-Site Cesium-137 85 pCi/g 0.22 0.031 0.0105 0.021On-Site Tritium 72 pCi/L 154 98 U 75.9 157On-Site Tritium 74N pCi/L 596 210 145 300On-Site Tritium 75 pCi/L 434 148 100 208On-Site Tritium 79 pCi/L 31.8 111 U 91.8 190On-Site Tritium 83 pCi/L 176 229 U 186 384On-Site Tritium 84 pCi/L 195 100 75.6 156On-Site Tritium 85 pCi/L 144 96.6 U 75.2 155On-Site Uranium 72 mg/kg 0.55 0.0116 0.0352On-Site Uranium 74N mg/kg 0.593 0.0122 0.0368On-Site Uranium 75 mg/kg 0.824 0.0125 0.038On-Site Uranium 79 mg/kg 1.51 0.0124 0.0375
TABLE C-2. Radiological Results by Location for Calendar Year 2010, Sediment

Location Type Analyte Location UnitsActivity and/or Concentration Two Sigma Error
Lab Data Qualifiers Decision Level MDA
TABLE C-2. Radiological Results by Location for Calendar Year 2010, Sediment
On-Site Uranium 83 mg/kg 0.706 0.012 0.0363On-Site Uranium 84 mg/kg 0.644 0.012 0.0364On-Site Uranium 85 mg/kg 0.774 0.0131 0.0398Perimeter Americium-241 60 pCi/g -0.000239 0.0363 U 0.0307 0.0615Perimeter Americium-241 73 pCi/g -0.0000844 0.0205 U 0.0165 0.033Perimeter Cesium-137 60 pCi/g 0.00219 0.0122 U 0.0108 0.0217Perimeter Cesium-137 73 pCi/g 0.0239 0.015 U 0.0134 0.0268Perimeter Tritium 60 pCi/L 69.3 180 U 149 309Perimeter Tritium 73 pCi/L 378 138 96.3 199Perimeter Uranium 60 mg/kg 0.653 0.0118 0.0357Perimeter Uranium 65 mg/kg 1.44 0.0122 0.0368Perimeter Uranium 73 mg/kg 0.39 0.0122 0.037
NOTES: MDA = minimum detectable amount mg/kg = milligram per kilogram n/a = not applicable pCi/g = picocurie per gram pCi/L = picocurie per liter U = The analyte was analyzed for, but not detected above the MDA.

Location Type Analyte Location Sample ID UnitsActivity and/or Concentration Two Sigma Error Qualifier Decision Level MDA
On-Site Americium-241 02NE 088761-001 pCi/g -0.12 0.08 U 0.06 0.13On-Site Americium-241 02NE 088761-002 pCi/g -0.06 0.08 U 0.07 0.14On-Site Americium-241 02NE 088761-003 pCi/g 0.00 0.08 U 0.08 0.16
Average -0.06Std Dev 0.06CV (%) -98.15
On-Site Americium-241 33 088796-001 pCi/g 0.02 0.07 U 0.06 0.13On-Site Americium-241 33 088796-002 pCi/g 0.00 0.11 U 0.09 0.18On-Site Americium-241 33 088796-003 pCi/g 0.02 0.02 U 0.02 0.03
Average 0.01Std Dev 0.01CV (%) 109.54
On-Site Americium-241 53 088756-001 pCi/g -0.05 0.05 U 0.04 0.09On-Site Americium-241 53 088756-002 pCi/g 0.02 0.03 U 0.03 0.07On-Site Americium-241 53 088756-003 pCi/g 0.02 0.04 U 0.03 0.07
Average 0.00Std Dev 0.04CV (%) -2548.74
On-Site Cesium-137 02NE 088761-001 pCi/g 0.15 0.03 0.01 0.03On-Site Cesium-137 02NE 088761-002 pCi/g 0.14 0.03 0.02 0.03On-Site Cesium-137 02NE 088761-003 pCi/g 0.17 0.03 0.01 0.03
Average 0.15Std Dev 0.01CV (%) 7.19
On-Site Cesium-137 33 088796-001 pCi/g 0.10 0.02 0.01 0.02On-Site Cesium-137 33 088796-002 pCi/g 0.12 0.03 0.01 0.02On-Site Cesium-137 33 088796-003 pCi/g 0.10 0.02 0.01 0.02
Average 0.11Std Dev 0.01CV (%) 11.85
On-Site Cesium-137 53 088756-001 pCi/g 0.04 0.01 0.01 0.01On-Site Cesium-137 53 088756-002 pCi/g 0.05 0.01 0.01 0.01On-Site Cesium-137 53 088756-003 pCi/g 0.05 0.01 0.01 0.02
Average 0.04Std Dev 0.00CV (%) 9.70
TABLE C-3. Radiological Replicate Results Sorted by Location for Calendar Year 2010, Soil

Location Type Analyte Location Sample ID UnitsActivity and/or Concentration Two Sigma Error Qualifier Decision Level MDA
TABLE C-3. Radiological Replicate Results Sorted by Location for Calendar Year 2010, Soil
On-Site Tritium 02NE 088761-001 pCi/L 617.00 153.00 90.30 187.00On-Site Tritium 02NE 088761-002 pCi/L 615.00 158.00 94.60 196.00On-Site Tritium 02NE 088761-003 pCi/L 777.00 174.00 94.50 195.00
Average 669.67Std Dev 92.96CV (%) 13.88
On-Site Tritium 33 088796-001 pCi/L 152.00 111.00 U 86.50 179.00On-Site Tritium 33 088796-002 pCi/L 198.00 121.00 92.70 192.00On-Site Tritium 33 088796-003 pCi/L 137.00 94.20 U 73.40 152.00
Average 162.33Std Dev 31.79CV (%) 19.58
On-Site Tritium 53 088756-001 pCi/L 134.00 84.00 59.10 129.00On-Site Tritium 53 088756-002 pCi/L 239.00 92.20 56.10 122.00On-Site Tritium 53 088756-003 pCi/L 269.00 104.00 63.20 137.00
Average 214.00Std Dev 70.89CV (%) 33.12
On-Site Uranium 02NE 088761-001 mg/kg 0.26 0.01 0.04On-Site Uranium 02NE 088761-002 mg/kg 0.46 0.01 0.04On-Site Uranium 02NE 088761-003 mg/kg 0.27 0.01 0.04
Average 0.33Std Dev 0.11CV (%) 33.10
On-Site Uranium 33 088796-001 mg/kg 0.70 0.01 0.04On-Site Uranium 33 088796-002 mg/kg 0.99 0.01 0.04On-Site Uranium 33 088796-003 mg/kg 0.92 0.01 0.04
Average 0.87Std Dev 0.15CV (%) 17.40
On-Site Uranium 53 088756-001 mg/kg 0.31 0.01 0.04On-Site Uranium 53 088756-002 mg/kg 0.27 0.01 0.04On-Site Uranium 53 088756-003 mg/kg 0.25 0.01 0.04
Average 0.28Std Dev 0.03CV (%) 10.88

Location Type Analyte Location Sample ID UnitsActivity and/or Concentration Two Sigma Error Qualifier Decision Level MDA
TABLE C-3. Radiological Replicate Results Sorted by Location for Calendar Year 2010, Soil
Perimeter Americium-241 64 088807-001 pCi/g -0.01 0.06 U 0.05 0.10Perimeter Americium-241 64 088807-002 pCi/g 0.05 0.07 U 0.06 0.12Perimeter Americium-241 64 088807-003 pCi/g 0.11 0.07 U 0.06 0.11
Average 0.05Std Dev 0.06CV (%) 124.21
Perimeter Cesium-137 64 088807-001 pCi/g 0.18 0.04 0.02 0.03Perimeter Cesium-137 64 088807-002 pCi/g 0.60 0.07 0.02 0.04Perimeter Cesium-137 64 088807-003 pCi/g 0.00 0.01 U 0.01 0.02
Average 0.26Std Dev 0.31CV (%) 119.24
Perimeter Tritium 64 088807-R01 pCi/g 0.55 0.71 U 0.56 1.18Perimeter Tritium 64 088807-R02 pCi/g 0.23 0.75 U 0.62 1.29Perimeter Tritium 64 088807-R03 pCi/g 0.67 0.80 U 0.63 1.32
Average 0.48Std Dev 0.23CV (%) 47.48
Perimeter Uranium 64 088807-001 mg/kg 0.83 0.01 0.04Perimeter Uranium 64 088807-002 mg/kg 0.94 0.01 0.04Perimeter Uranium 64 088807-003 mg/kg 1.28 0.01 0.04
Average 1.02Std Dev 0.23CV (%) 23.08
NOTES: CV = coefficient of variation. Only meaningful if data contains non-zero values. mg/kg = milligram per kilogram n/a = not applicable MDA = minimum detectable amount. pCi/g = picocurie per gram pCi/L = picocurie per liter Std Dev = standard deviation U = The analyte was analyzed for, but not detected. For organic and inorganic analytes the result is less than the method detection limit.

Location Type Analyte Location Sample ID UnitsActivity and/or Concentration Two Sigma Error Qualifier Decision Level MDA
TABLE C-3. Radiological Replicate Results Sorted by Location for Calendar Year 2010, Soil
For radiochemical analytes the result is less than the MDA.

Location Type Analyte Location Sample ID UnitsActivity and/or Concentration Two Sigma Error Qualifier Decision Level Detection Limit
On-Site Americium-241 74N 088811-001 pCi/g 0.03 0.05 U 0.05 0.10On-Site Americium-241 74N 088811-002 pCi/g -0.02 0.04 U 0.03 0.07On-Site Americium-241 74N 088811-003 pCi/g 0.03 0.02 U 0.02 0.03
Average 0.02Std Dev 0.03CV (%) 180.42
On-Site Cesium-137 74N 088811-001 pCi/g 0.01 0.01 U 0.01 0.02On-Site Cesium-137 74N 088811-002 pCi/g 0.00 0.01 U 0.01 0.02On-Site Cesium-137 74N 088811-003 pCi/g 0.02 0.01 U 0.01 0.02
Average 0.01Std Dev 0.01CV (%) 149.83
On-Site Tritium 74N 088811-001 pCi/L 596.00 210.00 145.00 300.00On-Site Tritium 74N 088811-002 pCi/L 1110.00 214.00 97.30 201.00On-Site Tritium 74N 088811-003 pCi/L 564.00 163.00 104.00 216.00
Average 756.67Std Dev 306.41CV (%) 40.50
On-Site Uranium 74N 088811-001 mg/kg 0.59 0.01 0.04On-Site Uranium 74N 088811-002 mg/kg 0.46 0.01 0.04On-Site Uranium 74N 088811-003 mg/kg 0.85 0.01 0.04
Average 0.63Std Dev 0.20CV (%) 31.17
NOTES: CV = coefficient of variation. Only meaningful if data contains non-zero values. mg/kg = milligram per kilogram n/a = not applicable MDA = minimum detectable amount. pCi/g = picocurie per gram pCi/L = picocurie per liter Std Dev = standard deviation U = The analyte was analyzed for, but not detected. For organic and inorganic analytes the result is less than the method detection limit.
TABLE C-4. Radiological Replicate Results Sorted by Location for Calendar Year 2010, Sediment

Location Type Analyte Location Sample ID UnitsActivity and/or Concentration Two Sigma Error Qualifier Decision Level Detection Limit
TABLE C-4. Radiological Replicate Results Sorted by Location for Calendar Year 2010, Sediment
For radiochemical analytes the result is less than the MDA.

Exposure (mR) Error Exposure (mR) Error Exposure (mR) Error Exposure (mR) ErrorCommunity 10 25.3 1.7 32.4 1.5 32.4 3.2 32.2 0.4Community 11 25.3 2.1 25.4 1.4 23.7 2.3 25.9 1.1Community 21 25.2 1.5 28.2 1.8 26.3 2.3 28.1 0.5Community 22 n/a n/a 27.2 1.4 27.8 2.9 27.1 0.5Community 23 26 1.9 26.4 1.2 25.4 2.6 30.9 5.6Community 24 22.9 1.5 24.6 0.9 21.5 2.5 24.2 0.6Community 25 24 1.5 26.3 0.9 25.4 2.3 25.5 0.5Community 26 29.3 1.5 29.6 0.8 32.7 2.6 32.3 2.4Community 27 26.9 2 26.6 1 28 2.4 26.3 0.4Community 28 25.5 1.5 24.7 1 25.5 2.1 28.8 0.4Community 29 22.6 1.6 23.7 0.9 23.9 4.6 22.8 0.5Community 30 27.1 1.7 28.9 1.1 29.2 2.6 25.2 1.3On-Site 1 27.5 0.9 27 1.1 26 1.5 27.9 0.6On-Site 2NW 25.9 0.8 25.3 1.7 25.9 2.7 25.6 1.4On-Site 3 27.5 0.7 26.5 1.3 30.1 1.2 27.3 0.6On-Site 6 25.8 0.7 26.4 2.5 23.9 1.3 26.5 0.8On-Site 7 26.7 0.7 25.7 1.3 27.7 4.3 26.9 0.7On-Site 20 28.4 0.8 27.6 1.8 25.7 1.6 27.2 0.7On-Site 31 27.9 0.7 28.2 1.4 26 1.4 29.8 2.8On-Site 41 29.6 3.1 26.7 2 26.8 1.5 25.8 0.6On-Site 42 26.6 0.8 24.3 1.3 25.8 3.1 26.4 1On-Site 43 26.4 1.3 25.2 1.9 25.3 1.3 26 0.6On-Site 45 26.4 0.7 27.1 1.2 26.3 2.7 27.3 1.1On-Site 45E 29.1 2 26.9 1.2 26.1 1.3 28.1 0.7On-Site 46 27.5 1.6 28.4 2.1 26.9 1.5 27 0.8On-Site 47 25.8 0.7 24.7 1.3 28.5 1.8 29.6 2.7On-Site 48 28.5 1.1 33.2 5.8 28.3 5.4 27 0.6On-Site 66 30.2 5.5 25.4 1.1 26.2 2.3 26.1 0.8On-Site E1003 24.6 1.6 24.7 1.5 26.7 1.2 24.2 0.7On-Site E1004 24.6 1.5 26.3 1.9 28.5 1.9 23 0.7
TABLE C-5. TLD Measurements by Quarter and Location Class for Calendar Year 2010
Location ClassLocation Number
1st Quarter (90 Days) 2nd Quarter (93 Days) 3rd Quarter (98 Days) 4th Quarter (90 Days)
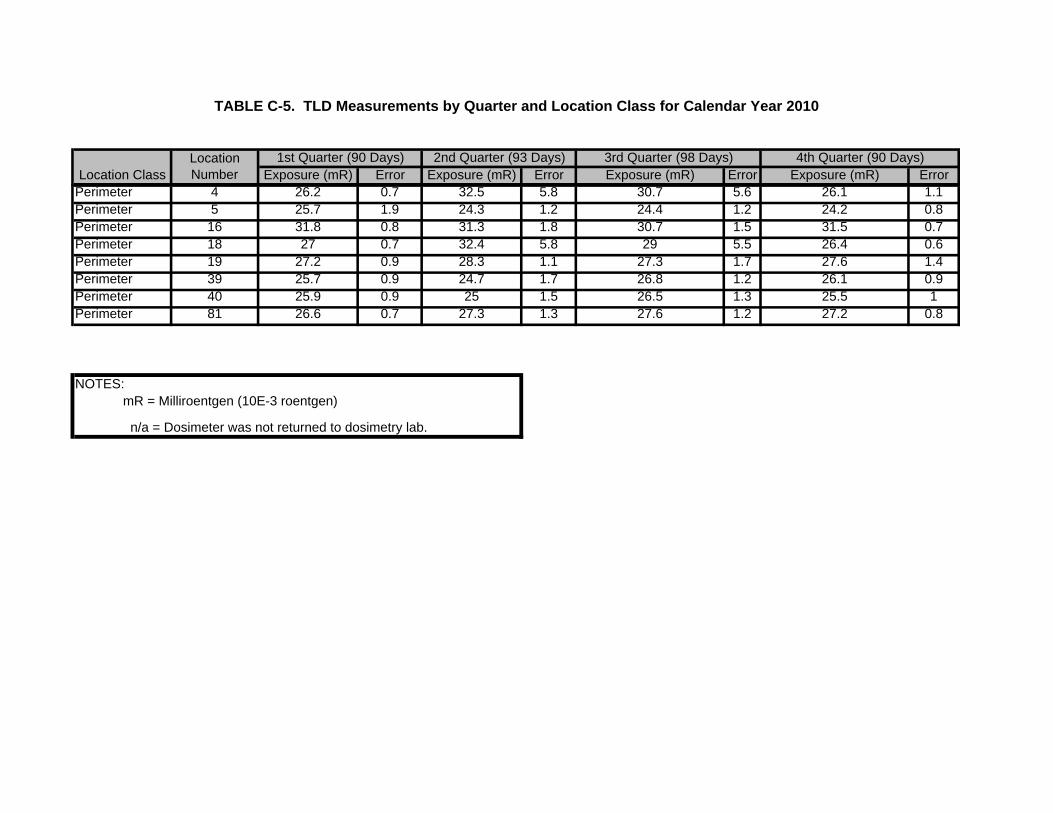
Exposure (mR) Error Exposure (mR) Error Exposure (mR) Error Exposure (mR) Error
TABLE C-5. TLD Measurements by Quarter and Location Class for Calendar Year 2010
Location ClassLocation Number
1st Quarter (90 Days) 2nd Quarter (93 Days) 3rd Quarter (98 Days) 4th Quarter (90 Days)
Perimeter 4 26.2 0.7 32.5 5.8 30.7 5.6 26.1 1.1Perimeter 5 25.7 1.9 24.3 1.2 24.4 1.2 24.2 0.8Perimeter 16 31.8 0.8 31.3 1.8 30.7 1.5 31.5 0.7Perimeter 18 27 0.7 32.4 5.8 29 5.5 26.4 0.6Perimeter 19 27.2 0.9 28.3 1.1 27.3 1.7 27.6 1.4Perimeter 39 25.7 0.9 24.7 1.7 26.8 1.2 26.1 0.9Perimeter 40 25.9 0.9 25 1.5 26.5 1.3 25.5 1Perimeter 81 26.6 0.7 27.3 1.3 27.6 1.2 27.2 0.8
NOTES: mR = Milliroentgen (10E-3 roentgen)
n/a = Dosimeter was not returned to dosimetry lab.

Location Type Location Analyte Units Result Lab Data Qualifiers Decision Level (MDL) Detection Limit (PQL)Community 09 Aluminum mg/kg 15800 14.6 48.7Community 09 Antimony mg/kg 0.314 U 0.314 0.952Community 09 Arsenic mg/kg 4.91 0.195 0.975Community 09 Barium mg/kg 192 0.487 1.95Community 09 Beryllium mg/kg 0.747 0.0195 0.0975Community 09 Cadmium mg/kg 0.352 0.0195 0.195Community 09 Calcium mg/kg 42900 32.2 97.5Community 09 Chromium mg/kg 16.7 0.195 0.585Community 09 Cobalt mg/kg 6.15 0.0585 0.195Community 09 Copper mg/kg 11.6 0.0643 0.195Community 09 Iron mg/kg 16300 24.4 97.5Community 09 Lead mg/kg 17.9 0.0975 0.39Community 09 Magnesium mg/kg 5140 1.46 4.87Community 09 Manganese mg/kg 327 0.975 4.87Community 09 Nickel mg/kg 13 0.0975 0.39Community 09 Potassium mg/kg 2370 78 292Community 09 Selenium mg/kg 0.487 U 0.487 0.975Community 09 Silver mg/kg 0.0952 U 0.0952 0.476Community 09 Sodium mg/kg 60 15.6 48.7Community 09 Thallium mg/kg 0.132 J 0.0585 0.195Community 09 Vanadium mg/kg 32.6 1.95 9.75Community 09 Zinc mg/kg 47.6 0.39 1.95Community 10 Aluminum mg/kg 16400 14.8 49.2Community 10 Antimony mg/kg 0.311 U 0.311 0.943Community 10 Arsenic mg/kg 2.49 0.197 0.984Community 10 Barium mg/kg 115 0.0984 0.394Community 10 Beryllium mg/kg 0.67 0.0197 0.0984Community 10 Cadmium mg/kg 0.289 0.0197 0.197Community 10 Calcium mg/kg 7750 6.5 19.7Community 10 Chromium mg/kg 15 0.197 0.591Community 10 Cobalt mg/kg 5.4 0.0591 0.197Community 10 Copper mg/kg 8.26 0.065 0.197Community 10 Iron mg/kg 13900 24.6 98.4
TABLE C-6. Non-radiological Results by Location for Calendar Year 2010, Soil

Location Type Location Analyte Units Result Lab Data Qualifiers Decision Level (MDL) Detection Limit (PQL)
TABLE C-6. Non-radiological Results by Location for Calendar Year 2010, Soil
Community 10 Lead mg/kg 11 0.0984 0.394Community 10 Magnesium mg/kg 3520 1.48 4.92Community 10 Manganese mg/kg 438 0.984 4.92Community 10 Nickel mg/kg 11.2 0.0984 0.394Community 10 Potassium mg/kg 2640 78.7 295Community 10 Selenium mg/kg 0.492 U 0.492 0.984Community 10 Silver mg/kg 0.101 J 0.0943 0.472Community 10 Sodium mg/kg 47.2 J 15.7 49.2Community 10 Thallium mg/kg 0.133 J 0.0591 0.197Community 10 Vanadium mg/kg 24.1 1.97 9.84Community 10 Zinc mg/kg 36.3 0.394 1.97Community 25 Aluminum mg/kg 6690 13.9 46.3Community 25 Antimony mg/kg 1.63 U 1.63 4.95Community 25 Arsenic mg/kg 2.18 0.185 0.926Community 25 Barium mg/kg 101 0.0926 0.37Community 25 Beryllium mg/kg 0.259 0.0185 0.0926Community 25 Cadmium mg/kg 0.291 0.0185 0.185Community 25 Calcium mg/kg 87000 61.1 185Community 25 Chromium mg/kg 7.2 0.185 0.556Community 25 Cobalt mg/kg 2.21 0.0556 0.185Community 25 Copper mg/kg 5.08 0.0611 0.185Community 25 Iron mg/kg 5730 4.63 18.5Community 25 Lead mg/kg 10.6 0.0926 0.37Community 25 Magnesium mg/kg 9450 6.94 23.1Community 25 Manganese mg/kg 152 0.185 0.926Community 25 Nickel mg/kg 11.3 0.0926 0.37Community 25 Potassium mg/kg 1200 74.1 278Community 25 Selenium mg/kg 0.463 U 0.463 0.926Community 25 Silver mg/kg 0.099 U 0.099 0.495Community 25 Sodium mg/kg 317 14.8 46.3Community 25 Thallium mg/kg 0.0643 J 0.0556 0.185Community 25 Vanadium mg/kg 29.5 1.85 9.26Community 25 Zinc mg/kg 29.3 0.37 1.85

Location Type Location Analyte Units Result Lab Data Qualifiers Decision Level (MDL) Detection Limit (PQL)
TABLE C-6. Non-radiological Results by Location for Calendar Year 2010, Soil
Community 62 Aluminum mg/kg 14900 14.6 48.6Community 62 Antimony mg/kg 0.322 U 0.322 0.975Community 62 Arsenic mg/kg 2.18 0.195 0.973Community 62 Barium mg/kg 115 0.0973 0.389Community 62 Beryllium mg/kg 0.625 0.0195 0.0973Community 62 Cadmium mg/kg 0.297 0.0195 0.195Community 62 Calcium mg/kg 20700 32.1 97.3Community 62 Chromium mg/kg 14.4 0.195 0.584Community 62 Cobalt mg/kg 5.34 0.0584 0.195Community 62 Copper mg/kg 7.78 0.0642 0.195Community 62 Iron mg/kg 14200 24.3 97.3Community 62 Lead mg/kg 10.8 0.0973 0.389Community 62 Magnesium mg/kg 3280 1.46 4.86Community 62 Manganese mg/kg 480 0.973 4.86Community 62 Nickel mg/kg 10.8 0.0973 0.389Community 62 Potassium mg/kg 2650 77.8 292Community 62 Selenium mg/kg 0.486 U 0.486 0.973Community 62 Silver mg/kg 0.0975 U 0.0975 0.487Community 62 Sodium mg/kg 49.7 15.6 48.6Community 62 Thallium mg/kg 0.132 J 0.0584 0.195Community 62 Vanadium mg/kg 24.9 1.95 9.73Community 62 Zinc mg/kg 34.1 0.389 1.95On-Site 01 Aluminum mg/kg 14200 14.1 47.1On-Site 01 Antimony mg/kg 0.329 U 0.329 0.998On-Site 01 Arsenic mg/kg 2.44 0.188 0.942On-Site 01 Barium mg/kg 142 0.0942 0.377On-Site 01 Beryllium mg/kg 0.631 0.0942 0.471On-Site 01 Cadmium mg/kg 0.312 0.0188 0.188On-Site 01 Calcium mg/kg 25500 31.1 94.2On-Site 01 Chromium mg/kg 11.1 0.942 2.82On-Site 01 Cobalt mg/kg 6.36 0.282 0.942On-Site 01 Copper mg/kg 12.8 0.311 0.942On-Site 01 Iron mg/kg 14400 23.5 94.2

Location Type Location Analyte Units Result Lab Data Qualifiers Decision Level (MDL) Detection Limit (PQL)
TABLE C-6. Non-radiological Results by Location for Calendar Year 2010, Soil
On-Site 01 Lead mg/kg 11.9 0.0942 0.377On-Site 01 Magnesium mg/kg 5650 7.06 23.5On-Site 01 Manganese mg/kg 376 0.942 4.71On-Site 01 Nickel mg/kg 11.9 0.471 1.88On-Site 01 Potassium mg/kg 5340 75.3 282On-Site 01 Selenium mg/kg 0.471 U 0.471 0.942On-Site 01 Silver mg/kg 0.348 J 0.0998 0.499On-Site 01 Sodium mg/kg 75.3 U 75.3 235On-Site 01 Thallium mg/kg 0.212 0.0565 0.188On-Site 01 Vanadium mg/kg 26.3 1.88 9.42On-Site 01 Zinc mg/kg 50.2 0.377 1.88On-Site 02NE Aluminum mg/kg 6630 2.92 9.75On-Site 02NE Antimony mg/kg 1.4 U 1.4 4.25On-Site 02NE Arsenic mg/kg 1.51 0.195 0.975On-Site 02NE Barium mg/kg 66.6 0.0975 0.39On-Site 02NE Beryllium mg/kg 0.341 0.0195 0.0975On-Site 02NE Cadmium mg/kg 0.287 0.0195 0.195On-Site 02NE Calcium mg/kg 5100 6.43 19.5On-Site 02NE Chromium mg/kg 5.76 0.195 0.585On-Site 02NE Cobalt mg/kg 2.34 0.0585 0.195On-Site 02NE Copper mg/kg 4.91 0.0643 0.195On-Site 02NE Iron mg/kg 6290 4.87 19.5On-Site 02NE Lead mg/kg 42.9 0.0975 0.39On-Site 02NE Magnesium mg/kg 1790 1.46 4.87On-Site 02NE Manganese mg/kg 112 0.195 0.975On-Site 02NE Nickel mg/kg 4.9 0.0975 0.39On-Site 02NE Potassium mg/kg 1650 15.6 58.5On-Site 02NE Selenium mg/kg 0.487 U 0.487 0.975On-Site 02NE Silver mg/kg 0.179 J 0.085 0.425On-Site 02NE Sodium mg/kg 22.6 J 15.6 48.7On-Site 02NE Thallium mg/kg 0.0825 J 0.0585 0.195On-Site 02NE Vanadium mg/kg 10.7 0.39 1.95On-Site 02NE Zinc mg/kg 22.3 0.39 1.95

Location Type Location Analyte Units Result Lab Data Qualifiers Decision Level (MDL) Detection Limit (PQL)
TABLE C-6. Non-radiological Results by Location for Calendar Year 2010, Soil
On-Site 02NW Aluminum mg/kg 7730 2.94 9.78On-Site 02NW Antimony mg/kg 0.329 U 0.329 0.998On-Site 02NW Arsenic mg/kg 2.1 0.196 0.978On-Site 02NW Barium mg/kg 109 0.0978 0.391On-Site 02NW Beryllium mg/kg 0.515 0.0196 0.0978On-Site 02NW Cadmium mg/kg 0.243 0.0196 0.196On-Site 02NW Calcium mg/kg 25900 32.3 97.8On-Site 02NW Chromium mg/kg 7.07 0.196 0.587On-Site 02NW Cobalt mg/kg 3.4 0.0587 0.196On-Site 02NW Copper mg/kg 6.28 0.0646 0.196On-Site 02NW Iron mg/kg 7680 4.89 19.6On-Site 02NW Lead mg/kg 8.16 0.0978 0.391On-Site 02NW Magnesium mg/kg 3110 1.47 4.89On-Site 02NW Manganese mg/kg 174 0.196 0.978On-Site 02NW Nickel mg/kg 7.01 0.0978 0.391On-Site 02NW Potassium mg/kg 2340 15.7 58.7On-Site 02NW Selenium mg/kg 0.489 U 0.489 0.978On-Site 02NW Silver mg/kg 0.0998 U 0.0998 0.499On-Site 02NW Sodium mg/kg 69 15.7 48.9On-Site 02NW Thallium mg/kg 0.107 J 0.0587 0.196On-Site 02NW Vanadium mg/kg 12.6 0.391 1.96On-Site 02NW Zinc mg/kg 29.6 0.391 1.96On-Site 02SE Aluminum mg/kg 7520 2.6 8.65On-Site 02SE Antimony mg/kg 1.5 U 1.5 4.54On-Site 02SE Arsenic mg/kg 1.95 0.173 0.865On-Site 02SE Barium mg/kg 86.6 0.0865 0.346On-Site 02SE Beryllium mg/kg 0.408 0.0173 0.0865On-Site 02SE Cadmium mg/kg 0.44 0.0173 0.173On-Site 02SE Calcium mg/kg 13900 57.1 173On-Site 02SE Chromium mg/kg 6.1 0.173 0.519On-Site 02SE Cobalt mg/kg 2.69 0.0519 0.173On-Site 02SE Copper mg/kg 5.79 0.0571 0.173On-Site 02SE Iron mg/kg 6830 4.33 17.3

Location Type Location Analyte Units Result Lab Data Qualifiers Decision Level (MDL) Detection Limit (PQL)
TABLE C-6. Non-radiological Results by Location for Calendar Year 2010, Soil
On-Site 02SE Lead mg/kg 7.55 0.0865 0.346On-Site 02SE Magnesium mg/kg 2260 1.3 4.33On-Site 02SE Manganese mg/kg 119 0.173 0.865On-Site 02SE Nickel mg/kg 6.18 0.0865 0.346On-Site 02SE Potassium mg/kg 1950 13.8 51.9On-Site 02SE Selenium mg/kg 0.433 U 0.433 0.865On-Site 02SE Silver mg/kg 0.257 J 0.0907 0.454On-Site 02SE Sodium mg/kg 24.7 J 13.8 43.3On-Site 02SE Thallium mg/kg 0.103 J 0.0519 0.173On-Site 02SE Vanadium mg/kg 11.6 0.346 1.73On-Site 02SE Zinc mg/kg 24.6 0.346 1.73On-Site 02SW Aluminum mg/kg 5910 2.98 9.94On-Site 02SW Antimony mg/kg 0.33 U 0.33 1On-Site 02SW Arsenic mg/kg 1.6 0.199 0.994On-Site 02SW Barium mg/kg 63.5 0.0994 0.398On-Site 02SW Beryllium mg/kg 0.297 0.0199 0.0994On-Site 02SW Cadmium mg/kg 0.154 J 0.0199 0.199On-Site 02SW Calcium mg/kg 6810 6.56 19.9On-Site 02SW Chromium mg/kg 6.8 0.199 0.596On-Site 02SW Cobalt mg/kg 2.42 0.0596 0.199On-Site 02SW Copper mg/kg 5.41 0.0656 0.199On-Site 02SW Iron mg/kg 5890 4.97 19.9On-Site 02SW Lead mg/kg 5.53 0.0994 0.398On-Site 02SW Magnesium mg/kg 1800 1.49 4.97On-Site 02SW Manganese mg/kg 122 0.199 0.994On-Site 02SW Nickel mg/kg 4.87 0.0994 0.398On-Site 02SW Potassium mg/kg 1390 15.9 59.6On-Site 02SW Selenium mg/kg 0.497 U 0.497 0.994On-Site 02SW Silver mg/kg 0.1 U 0.1 0.5On-Site 02SW Sodium mg/kg 46.4 J 15.9 49.7On-Site 02SW Thallium mg/kg 0.0805 J 0.0596 0.199On-Site 02SW Vanadium mg/kg 10.2 0.398 1.99On-Site 02SW Zinc mg/kg 31.1 0.398 1.99

Location Type Location Analyte Units Result Lab Data Qualifiers Decision Level (MDL) Detection Limit (PQL)
TABLE C-6. Non-radiological Results by Location for Calendar Year 2010, Soil
On-Site 03 Aluminum mg/kg 9320 2.94 9.8On-Site 03 Antimony mg/kg 1.56 U 1.56 4.73On-Site 03 Arsenic mg/kg 4.47 0.196 0.98On-Site 03 Barium mg/kg 308 0.98 3.92On-Site 03 Beryllium mg/kg 0.352 0.0196 0.098On-Site 03 Cadmium mg/kg 0.232 0.0196 0.196On-Site 03 Calcium mg/kg 74600 64.7 196On-Site 03 Chromium mg/kg 7.42 0.196 0.588On-Site 03 Cobalt mg/kg 3.07 0.0588 0.196On-Site 03 Copper mg/kg 5.14 0.0647 0.196On-Site 03 Iron mg/kg 7380 4.9 19.6On-Site 03 Lead mg/kg 7.81 0.098 0.392On-Site 03 Magnesium mg/kg 5300 1.47 4.9On-Site 03 Manganese mg/kg 101 0.196 0.98On-Site 03 Nickel mg/kg 8.05 0.098 0.392On-Site 03 Potassium mg/kg 1960 15.7 58.8On-Site 03 Selenium mg/kg 0.49 U 0.49 0.98On-Site 03 Silver mg/kg 0.0947 U 0.0947 0.473On-Site 03 Sodium mg/kg 86.8 15.7 49On-Site 03 Thallium mg/kg 0.128 J 0.0588 0.196On-Site 03 Vanadium mg/kg 25.6 3.92 19.6On-Site 03 Zinc mg/kg 23.8 0.396 1.98On-Site 06 Aluminum mg/kg 21400 14.7 49On-Site 06 Antimony mg/kg 0.325 U 0.325 0.986On-Site 06 Arsenic mg/kg 3.28 0.196 0.98On-Site 06 Barium mg/kg 108 0.098 0.392On-Site 06 Beryllium mg/kg 0.82 0.098 0.49On-Site 06 Cadmium mg/kg 0.261 0.0196 0.196On-Site 06 Calcium mg/kg 2970 6.47 19.6On-Site 06 Chromium mg/kg 11.8 0.196 0.588On-Site 06 Cobalt mg/kg 4.01 0.0588 0.196On-Site 06 Copper mg/kg 30.6 0.0647 0.196On-Site 06 Iron mg/kg 14500 24.5 98

Location Type Location Analyte Units Result Lab Data Qualifiers Decision Level (MDL) Detection Limit (PQL)
TABLE C-6. Non-radiological Results by Location for Calendar Year 2010, Soil
On-Site 06 Lead mg/kg 11.4 0.098 0.392On-Site 06 Magnesium mg/kg 3840 7.35 24.5On-Site 06 Manganese mg/kg 163 0.196 0.98On-Site 06 Nickel mg/kg 11.6 0.098 0.392On-Site 06 Potassium mg/kg 3190 15.7 58.8On-Site 06 Selenium mg/kg 0.49 U 0.49 0.98On-Site 06 Silver mg/kg 0.261 J 0.0986 0.493On-Site 06 Sodium mg/kg 78.4 U 78.4 245On-Site 06 Thallium mg/kg 0.175 J 0.0588 0.196On-Site 06 Vanadium mg/kg 26.4 1.96 9.8On-Site 06 Zinc mg/kg 50.8 0.364 1.82On-Site 07 Aluminum mg/kg 6790 2.85 9.49On-Site 07 Antimony mg/kg 0.301 U 0.301 0.912On-Site 07 Arsenic mg/kg 1.69 0.19 0.949On-Site 07 Barium mg/kg 72.2 0.0949 0.38On-Site 07 Beryllium mg/kg 0.379 0.019 0.0949On-Site 07 Cadmium mg/kg 0.156 J 0.019 0.19On-Site 07 Calcium mg/kg 7900 6.26 19On-Site 07 Chromium mg/kg 6.35 0.19 0.569On-Site 07 Cobalt mg/kg 3 0.0569 0.19On-Site 07 Copper mg/kg 5.59 0.0626 0.19On-Site 07 Iron mg/kg 6960 4.74 19On-Site 07 Lead mg/kg 6.46 0.0949 0.38On-Site 07 Magnesium mg/kg 2060 1.42 4.74On-Site 07 Manganese mg/kg 170 0.19 0.949On-Site 07 Nickel mg/kg 5.83 0.0949 0.38On-Site 07 Potassium mg/kg 2240 15.2 56.9On-Site 07 Selenium mg/kg 0.474 U 0.474 0.949On-Site 07 Silver mg/kg 0.128 J 0.0912 0.456On-Site 07 Sodium mg/kg 30.4 J 15.2 47.4On-Site 07 Thallium mg/kg 0.0922 J 0.0569 0.19On-Site 07 Vanadium mg/kg 11.2 0.38 1.9On-Site 07 Zinc mg/kg 24.5 0.38 1.9

Location Type Location Analyte Units Result Lab Data Qualifiers Decision Level (MDL) Detection Limit (PQL)
TABLE C-6. Non-radiological Results by Location for Calendar Year 2010, Soil
On-Site 33 Aluminum mg/kg 14100 26.9 89.8On-Site 33 Antimony mg/kg 0.327 U 0.327 0.992On-Site 33 Arsenic mg/kg 6.11 0.18 0.898On-Site 33 Barium mg/kg 120 0.0898 0.359On-Site 33 Beryllium mg/kg 0.807 0.018 0.0898On-Site 33 Cadmium mg/kg 0.392 0.018 0.18On-Site 33 Calcium mg/kg 49000 59.2 180On-Site 33 Chromium mg/kg 11.2 0.18 0.539On-Site 33 Cobalt mg/kg 4.63 0.0539 0.18On-Site 33 Copper mg/kg 8.57 0.0592 0.18On-Site 33 Iron mg/kg 11800 44.9 180On-Site 33 Lead mg/kg 12.2 0.0898 0.359On-Site 33 Magnesium mg/kg 5520 13.5 44.9On-Site 33 Manganese mg/kg 310 1.8 8.98On-Site 33 Nickel mg/kg 10.5 0.0898 0.359On-Site 33 Potassium mg/kg 3890 144 539On-Site 33 Selenium mg/kg 0.449 U 0.449 0.898On-Site 33 Silver mg/kg 0.0992 U 0.0992 0.496On-Site 33 Sodium mg/kg 141 14.4 44.9On-Site 33 Thallium mg/kg 0.241 0.0539 0.18On-Site 33 Vanadium mg/kg 23.7 3.59 18On-Site 33 Zinc mg/kg 53.2 0.359 1.8On-Site 34 Aluminum mg/kg 12300 29.9 99.6On-Site 34 Antimony mg/kg 0.319 U 0.319 0.965On-Site 34 Arsenic mg/kg 4.19 0.199 0.996On-Site 34 Barium mg/kg 145 0.0996 0.398On-Site 34 Beryllium mg/kg 0.61 0.0199 0.0996On-Site 34 Cadmium mg/kg 0.259 0.0199 0.199On-Site 34 Calcium mg/kg 21000 65.7 199On-Site 34 Chromium mg/kg 10.5 0.199 0.598On-Site 34 Cobalt mg/kg 5.42 0.0598 0.199On-Site 34 Copper mg/kg 7.69 0.0657 0.199On-Site 34 Iron mg/kg 12100 49.8 199

Location Type Location Analyte Units Result Lab Data Qualifiers Decision Level (MDL) Detection Limit (PQL)
TABLE C-6. Non-radiological Results by Location for Calendar Year 2010, Soil
On-Site 34 Lead mg/kg 10.9 0.0996 0.398On-Site 34 Magnesium mg/kg 2940 1.49 4.98On-Site 34 Manganese mg/kg 292 1.99 9.96On-Site 34 Nickel mg/kg 10.4 0.0996 0.398On-Site 34 Potassium mg/kg 2390 15.9 59.8On-Site 34 Selenium mg/kg 0.498 U 0.498 0.996On-Site 34 Silver mg/kg 0.0965 U 0.0965 0.483On-Site 34 Sodium mg/kg 34.2 J 15.9 49.8On-Site 34 Thallium mg/kg 0.124 J 0.0598 0.199On-Site 34 Vanadium mg/kg 19.5 0.398 1.99On-Site 34 Zinc mg/kg 39 0.398 1.99On-Site 41 Aluminum mg/kg 11000 13.9 46.3On-Site 41 Antimony mg/kg 0.315 U 0.315 0.954On-Site 41 Arsenic mg/kg 2.05 0.185 0.926On-Site 41 Barium mg/kg 65.1 0.0926 0.37On-Site 41 Beryllium mg/kg 0.42 0.0185 0.0926On-Site 41 Cadmium mg/kg 0.178 J 0.0185 0.185On-Site 41 Calcium mg/kg 10600 30.6 92.6On-Site 41 Chromium mg/kg 8.28 0.185 0.556On-Site 41 Cobalt mg/kg 3.91 0.0556 0.185On-Site 41 Copper mg/kg 6.56 0.0611 0.185On-Site 41 Iron mg/kg 8970 4.63 18.5On-Site 41 Lead mg/kg 10.8 0.0926 0.37On-Site 41 Magnesium mg/kg 2460 1.39 4.63On-Site 41 Manganese mg/kg 127 0.185 0.926On-Site 41 Nickel mg/kg 6.54 0.0926 0.37On-Site 41 Potassium mg/kg 2720 14.8 55.6On-Site 41 Selenium mg/kg 0.463 U 0.463 0.926On-Site 41 Silver mg/kg 0.123 J 0.0954 0.477On-Site 41 Sodium mg/kg 42.1 J 14.8 46.3On-Site 41 Thallium mg/kg 0.0887 J 0.0556 0.185On-Site 41 Vanadium mg/kg 16.1 0.37 1.85On-Site 41 Zinc mg/kg 30.1 0.397 1.98

Location Type Location Analyte Units Result Lab Data Qualifiers Decision Level (MDL) Detection Limit (PQL)
TABLE C-6. Non-radiological Results by Location for Calendar Year 2010, Soil
On-Site 42 Aluminum mg/kg 9350 2.95 9.82On-Site 42 Antimony mg/kg 0.325 U 0.325 0.986On-Site 42 Arsenic mg/kg 2.29 0.196 0.982On-Site 42 Barium mg/kg 80.2 0.0982 0.393On-Site 42 Beryllium mg/kg 0.502 0.0196 0.0982On-Site 42 Cadmium mg/kg 0.174 J 0.0196 0.196On-Site 42 Calcium mg/kg 25200 64.8 196On-Site 42 Chromium mg/kg 9.2 0.196 0.589On-Site 42 Cobalt mg/kg 3.64 0.0589 0.196On-Site 42 Copper mg/kg 7.28 0.0648 0.196On-Site 42 Iron mg/kg 9030 4.91 19.6On-Site 42 Lead mg/kg 6.8 0.0996 0.398On-Site 42 Magnesium mg/kg 3100 1.47 4.91On-Site 42 Manganese mg/kg 164 0.196 0.982On-Site 42 Nickel mg/kg 8.18 0.0982 0.393On-Site 42 Potassium mg/kg 2810 15.7 58.9On-Site 42 Selenium mg/kg 0.491 U 0.491 0.982On-Site 42 Silver mg/kg 0.0986 U 0.0986 0.493On-Site 42 Sodium mg/kg 41 J 15.7 49.1On-Site 42 Thallium mg/kg 0.147 J 0.0589 0.196On-Site 42 Vanadium mg/kg 17.1 0.393 1.96On-Site 42 Zinc mg/kg 26.3 0.393 1.96On-Site 43 Aluminum mg/kg 8430 2.76 9.21On-Site 43 Antimony mg/kg 0.326 U 0.326 0.988On-Site 43 Arsenic mg/kg 1.91 0.184 0.921On-Site 43 Barium mg/kg 56.1 0.0921 0.368On-Site 43 Beryllium mg/kg 0.337 0.0184 0.0921On-Site 43 Cadmium mg/kg 0.114 J 0.0184 0.184On-Site 43 Calcium mg/kg 6550 6.08 18.4On-Site 43 Chromium mg/kg 6.96 0.184 0.552On-Site 43 Cobalt mg/kg 2.78 0.0552 0.184On-Site 43 Copper mg/kg 5.49 0.0608 0.184On-Site 43 Iron mg/kg 7430 4.6 18.4

Location Type Location Analyte Units Result Lab Data Qualifiers Decision Level (MDL) Detection Limit (PQL)
TABLE C-6. Non-radiological Results by Location for Calendar Year 2010, Soil
On-Site 43 Magnesium mg/kg 2340 1.38 4.6On-Site 43 Manganese mg/kg 113 0.184 0.921On-Site 43 Nickel mg/kg 5.73 0.0921 0.368On-Site 43 Potassium mg/kg 2040 14.7 55.2On-Site 43 Selenium mg/kg 0.46 U 0.46 0.921On-Site 43 Silver mg/kg 0.0988 U 0.0988 0.494On-Site 43 Sodium mg/kg 28.3 J 14.7 46On-Site 43 Thallium mg/kg 0.0917 J 0.0552 0.184On-Site 43 Vanadium mg/kg 14.7 0.368 1.84On-Site 43 Zinc mg/kg 22.3 0.368 1.84On-Site 45 Aluminum mg/kg 7410 2.9 9.67On-Site 45 Antimony mg/kg 0.304 U 0.304 0.923On-Site 45 Arsenic mg/kg 2.83 0.193 0.967On-Site 45 Barium mg/kg 70.5 0.0967 0.387On-Site 45 Beryllium mg/kg 0.386 0.0193 0.0967On-Site 45 Cadmium mg/kg 0.152 J 0.0193 0.193On-Site 45 Calcium mg/kg 12000 63.8 193On-Site 45 Chromium mg/kg 6.65 0.193 0.58On-Site 45 Cobalt mg/kg 2.52 0.058 0.193On-Site 45 Copper mg/kg 5.38 0.0638 0.193On-Site 45 Iron mg/kg 6860 4.84 19.3On-Site 45 Lead mg/kg 6.73 0.0967 0.387On-Site 45 Magnesium mg/kg 2470 1.45 4.84On-Site 45 Manganese mg/kg 121 0.193 0.967On-Site 45 Nickel mg/kg 5.64 0.0967 0.387On-Site 45 Potassium mg/kg 2150 15.5 58On-Site 45 Selenium mg/kg 0.484 U 0.484 0.967On-Site 45 Silver mg/kg 0.0923 U 0.0923 0.461On-Site 45 Sodium mg/kg 34.6 J 15.5 48.4On-Site 45 Thallium mg/kg 0.0979 J 0.058 0.193On-Site 45 Vanadium mg/kg 12.5 0.387 1.93
On-Site 45 Zinc mg/kg 24.8 0.387 1.93

Location Type Location Analyte Units Result Lab Data Qualifiers Decision Level (MDL) Detection Limit (PQL)
TABLE C-6. Non-radiological Results by Location for Calendar Year 2010, Soil
On-Site 46 Aluminum mg/kg 8940 2.8 9.33On-Site 46 Antimony mg/kg 0.302 U 0.302 0.916On-Site 46 Arsenic mg/kg 2.07 0.187 0.933On-Site 46 Barium mg/kg 97 0.0933 0.373On-Site 46 Beryllium mg/kg 0.422 0.0187 0.0933On-Site 46 Cadmium mg/kg 0.248 0.0187 0.187On-Site 46 Calcium mg/kg 21200 30.8 93.3On-Site 46 Chromium mg/kg 8.48 0.187 0.56On-Site 46 Cobalt mg/kg 4.07 0.056 0.187On-Site 46 Copper mg/kg 8.56 0.0616 0.187On-Site 46 Iron mg/kg 10800 23.3 93.3On-Site 46 Lead mg/kg 9.89 0.0933 0.373On-Site 46 Magnesium mg/kg 3590 1.4 4.66On-Site 46 Manganese mg/kg 224 0.933 4.66On-Site 46 Nickel mg/kg 7.59 0.0933 0.373On-Site 46 Potassium mg/kg 2730 14.9 56On-Site 46 Selenium mg/kg 0.466 U 0.466 0.933On-Site 46 Silver mg/kg 0.0916 U 0.0916 0.458On-Site 46 Sodium mg/kg 54.9 14.9 46.6On-Site 46 Thallium mg/kg 0.104 J 0.056 0.187On-Site 46 Vanadium mg/kg 21.4 1.87 9.33On-Site 46 Zinc mg/kg 74.5 0.396 1.98On-Site 49 Aluminum mg/kg 9170 2.92 9.73On-Site 49 Antimony mg/kg 0.302 U 0.302 0.916On-Site 49 Arsenic mg/kg 2 0.195 0.973On-Site 49 Barium mg/kg 97.8 0.0973 0.389On-Site 49 Beryllium mg/kg 0.408 0.0195 0.0973On-Site 49 Cadmium mg/kg 0.314 0.0195 0.195On-Site 49 Calcium mg/kg 15800 32.1 97.3On-Site 49 Chromium mg/kg 8.63 0.195 0.584On-Site 49 Cobalt mg/kg 4.38 0.0584 0.195On-Site 49 Copper mg/kg 8.8 0.0642 0.195On-Site 49 Iron mg/kg 11400 24.3 97.3

Location Type Location Analyte Units Result Lab Data Qualifiers Decision Level (MDL) Detection Limit (PQL)
TABLE C-6. Non-radiological Results by Location for Calendar Year 2010, Soil
On-Site 49 Lead mg/kg 13.5 0.0973 0.389On-Site 49 Magnesium mg/kg 4030 1.46 4.86On-Site 49 Manganese mg/kg 257 0.973 4.86On-Site 49 Nickel mg/kg 8.19 0.0973 0.389On-Site 49 Potassium mg/kg 2710 15.6 58.4On-Site 49 Selenium mg/kg 0.486 U 0.486 0.973On-Site 49 Silver mg/kg 0.113 J 0.0916 0.458On-Site 49 Sodium mg/kg 49.6 15.6 48.6On-Site 49 Thallium mg/kg 0.123 J 0.0584 0.195On-Site 49 Vanadium mg/kg 21.3 1.95 9.73On-Site 49 Zinc mg/kg 40.5 0.375 1.87On-Site 51 Aluminum mg/kg 14200 14.1 47.1On-Site 51 Antimony mg/kg 0.314 U 0.314 0.951On-Site 51 Arsenic mg/kg 2.68 0.188 0.942On-Site 51 Barium mg/kg 99.6 0.0942 0.377On-Site 51 Beryllium mg/kg 0.732 0.0942 0.471On-Site 51 Cadmium mg/kg 0.217 0.0188 0.188On-Site 51 Calcium mg/kg 18500 31.1 94.2On-Site 51 Chromium mg/kg 51.8 0.188 0.565On-Site 51 Cobalt mg/kg 3.44 0.0565 0.188On-Site 51 Copper mg/kg 10.1 0.0621 0.188On-Site 51 Iron mg/kg 11300 23.5 94.2On-Site 51 Lead mg/kg 11.3 0.0942 0.377On-Site 51 Magnesium mg/kg 3670 7.06 23.5On-Site 51 Manganese mg/kg 138 0.188 0.942On-Site 51 Nickel mg/kg 8.26 0.0942 0.377On-Site 51 Potassium mg/kg 2540 15.1 56.5On-Site 51 Selenium mg/kg 0.471 U 0.471 0.942On-Site 51 Silver mg/kg 0.0951 U 0.0951 0.475On-Site 51 Sodium mg/kg 75.3 U 75.3 235On-Site 51 Thallium mg/kg 0.112 J 0.0565 0.188On-Site 51 Vanadium mg/kg 14.6 0.377 1.88On-Site 51 Zinc mg/kg 101 0.39 1.95

Location Type Location Analyte Units Result Lab Data Qualifiers Decision Level (MDL) Detection Limit (PQL)
TABLE C-6. Non-radiological Results by Location for Calendar Year 2010, Soil
On-Site 52 Aluminum mg/kg 8780 2.84 9.47On-Site 52 Antimony mg/kg 0.32 U 0.32 0.969On-Site 52 Arsenic mg/kg 2.74 0.189 0.947On-Site 52 Barium mg/kg 98 0.0947 0.379On-Site 52 Beryllium mg/kg 0.434 0.0189 0.0947On-Site 52 Cadmium mg/kg 0.132 J 0.0189 0.189On-Site 52 Calcium mg/kg 28500 31.3 94.7On-Site 52 Chromium mg/kg 7.3 0.189 0.568On-Site 52 Cobalt mg/kg 3.05 0.0568 0.189On-Site 52 Copper mg/kg 5.1 0.0625 0.189On-Site 52 Iron mg/kg 7880 4.73 18.9On-Site 52 Lead mg/kg 5.41 0.0947 0.379On-Site 52 Magnesium mg/kg 2950 1.42 4.73On-Site 52 Manganese mg/kg 129 0.189 0.947On-Site 52 Nickel mg/kg 7.12 0.0947 0.379On-Site 52 Potassium mg/kg 1720 15.2 56.8On-Site 52 Selenium mg/kg 0.473 U 0.473 0.947On-Site 52 Silver mg/kg 0.0969 U 0.0969 0.484On-Site 52 Sodium mg/kg 44.5 J 15.2 47.3On-Site 52 Thallium mg/kg 0.0913 J 0.0568 0.189On-Site 52 Vanadium mg/kg 16.6 0.379 1.89On-Site 52 Zinc mg/kg 27.8 0.365 1.82On-Site 53 Aluminum mg/kg 11800 13.3 44.3On-Site 53 Antimony mg/kg 0.322 U 0.322 0.975On-Site 53 Arsenic mg/kg 1.97 0.177 0.887On-Site 53 Barium mg/kg 70.6 0.0887 0.355On-Site 53 Beryllium mg/kg 0.422 0.0177 0.0887On-Site 53 Cadmium mg/kg 0.154 J 0.0177 0.177On-Site 53 Calcium mg/kg 3650 5.85 17.7On-Site 53 Chromium mg/kg 9.45 0.177 0.532On-Site 53 Cobalt mg/kg 3.01 0.0532 0.177On-Site 53 Copper mg/kg 5.42 0.0585 0.177On-Site 53 Iron mg/kg 8360 4.43 17.7
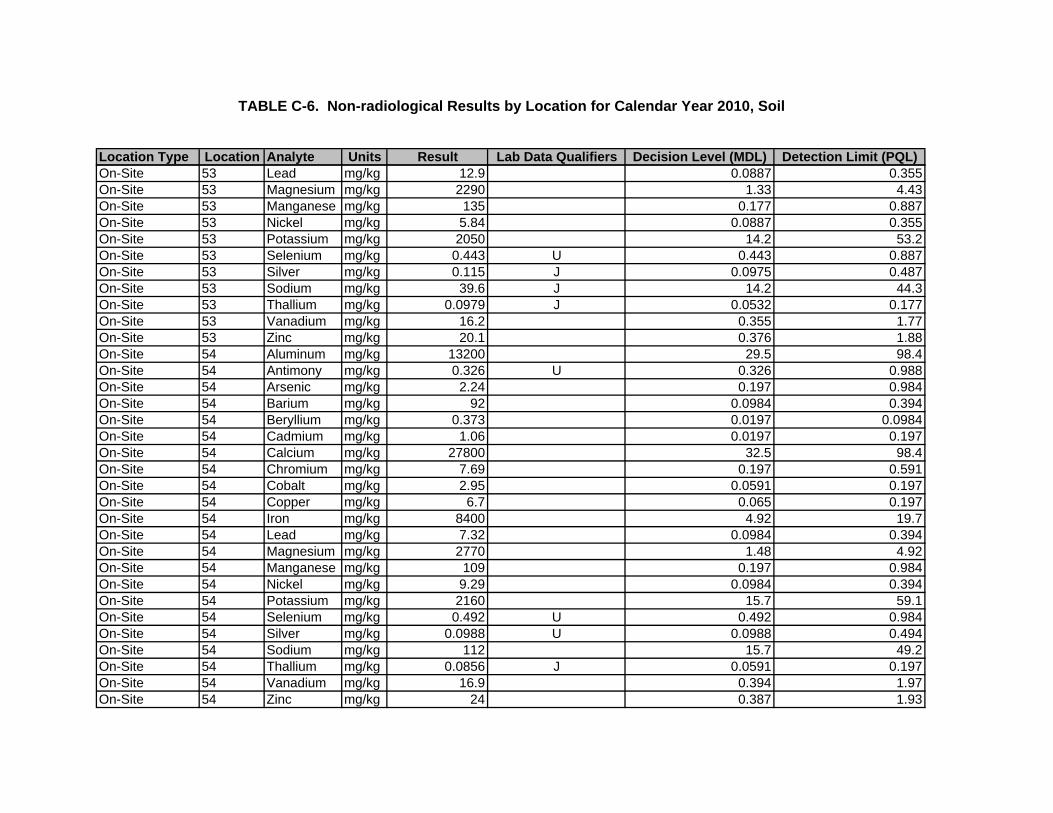
Location Type Location Analyte Units Result Lab Data Qualifiers Decision Level (MDL) Detection Limit (PQL)
TABLE C-6. Non-radiological Results by Location for Calendar Year 2010, Soil
On-Site 53 Lead mg/kg 12.9 0.0887 0.355On-Site 53 Magnesium mg/kg 2290 1.33 4.43On-Site 53 Manganese mg/kg 135 0.177 0.887On-Site 53 Nickel mg/kg 5.84 0.0887 0.355On-Site 53 Potassium mg/kg 2050 14.2 53.2On-Site 53 Selenium mg/kg 0.443 U 0.443 0.887On-Site 53 Silver mg/kg 0.115 J 0.0975 0.487On-Site 53 Sodium mg/kg 39.6 J 14.2 44.3On-Site 53 Thallium mg/kg 0.0979 J 0.0532 0.177On-Site 53 Vanadium mg/kg 16.2 0.355 1.77On-Site 53 Zinc mg/kg 20.1 0.376 1.88On-Site 54 Aluminum mg/kg 13200 29.5 98.4On-Site 54 Antimony mg/kg 0.326 U 0.326 0.988On-Site 54 Arsenic mg/kg 2.24 0.197 0.984On-Site 54 Barium mg/kg 92 0.0984 0.394On-Site 54 Beryllium mg/kg 0.373 0.0197 0.0984On-Site 54 Cadmium mg/kg 1.06 0.0197 0.197On-Site 54 Calcium mg/kg 27800 32.5 98.4On-Site 54 Chromium mg/kg 7.69 0.197 0.591On-Site 54 Cobalt mg/kg 2.95 0.0591 0.197On-Site 54 Copper mg/kg 6.7 0.065 0.197On-Site 54 Iron mg/kg 8400 4.92 19.7On-Site 54 Lead mg/kg 7.32 0.0984 0.394On-Site 54 Magnesium mg/kg 2770 1.48 4.92On-Site 54 Manganese mg/kg 109 0.197 0.984On-Site 54 Nickel mg/kg 9.29 0.0984 0.394On-Site 54 Potassium mg/kg 2160 15.7 59.1On-Site 54 Selenium mg/kg 0.492 U 0.492 0.984On-Site 54 Silver mg/kg 0.0988 U 0.0988 0.494On-Site 54 Sodium mg/kg 112 15.7 49.2On-Site 54 Thallium mg/kg 0.0856 J 0.0591 0.197On-Site 54 Vanadium mg/kg 16.9 0.394 1.97On-Site 54 Zinc mg/kg 24 0.387 1.93
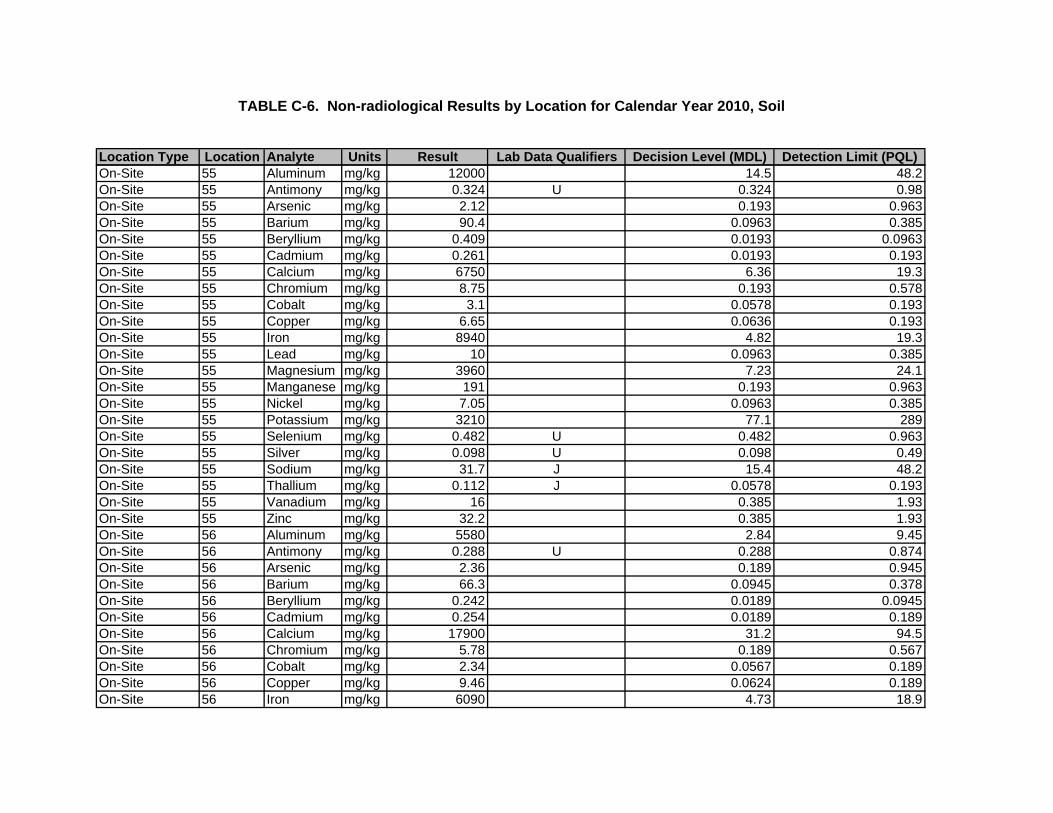
Location Type Location Analyte Units Result Lab Data Qualifiers Decision Level (MDL) Detection Limit (PQL)
TABLE C-6. Non-radiological Results by Location for Calendar Year 2010, Soil
On-Site 55 Aluminum mg/kg 12000 14.5 48.2On-Site 55 Antimony mg/kg 0.324 U 0.324 0.98On-Site 55 Arsenic mg/kg 2.12 0.193 0.963On-Site 55 Barium mg/kg 90.4 0.0963 0.385On-Site 55 Beryllium mg/kg 0.409 0.0193 0.0963On-Site 55 Cadmium mg/kg 0.261 0.0193 0.193On-Site 55 Calcium mg/kg 6750 6.36 19.3On-Site 55 Chromium mg/kg 8.75 0.193 0.578On-Site 55 Cobalt mg/kg 3.1 0.0578 0.193On-Site 55 Copper mg/kg 6.65 0.0636 0.193On-Site 55 Iron mg/kg 8940 4.82 19.3On-Site 55 Lead mg/kg 10 0.0963 0.385On-Site 55 Magnesium mg/kg 3960 7.23 24.1On-Site 55 Manganese mg/kg 191 0.193 0.963On-Site 55 Nickel mg/kg 7.05 0.0963 0.385On-Site 55 Potassium mg/kg 3210 77.1 289On-Site 55 Selenium mg/kg 0.482 U 0.482 0.963On-Site 55 Silver mg/kg 0.098 U 0.098 0.49On-Site 55 Sodium mg/kg 31.7 J 15.4 48.2On-Site 55 Thallium mg/kg 0.112 J 0.0578 0.193On-Site 55 Vanadium mg/kg 16 0.385 1.93On-Site 55 Zinc mg/kg 32.2 0.385 1.93On-Site 56 Aluminum mg/kg 5580 2.84 9.45On-Site 56 Antimony mg/kg 0.288 U 0.288 0.874On-Site 56 Arsenic mg/kg 2.36 0.189 0.945On-Site 56 Barium mg/kg 66.3 0.0945 0.378On-Site 56 Beryllium mg/kg 0.242 0.0189 0.0945On-Site 56 Cadmium mg/kg 0.254 0.0189 0.189On-Site 56 Calcium mg/kg 17900 31.2 94.5On-Site 56 Chromium mg/kg 5.78 0.189 0.567On-Site 56 Cobalt mg/kg 2.34 0.0567 0.189On-Site 56 Copper mg/kg 9.46 0.0624 0.189On-Site 56 Iron mg/kg 6090 4.73 18.9

Location Type Location Analyte Units Result Lab Data Qualifiers Decision Level (MDL) Detection Limit (PQL)
TABLE C-6. Non-radiological Results by Location for Calendar Year 2010, Soil
On-Site 56 Lead mg/kg 6.98 0.0945 0.378On-Site 56 Magnesium mg/kg 1750 1.42 4.73On-Site 56 Manganese mg/kg 97.3 0.189 0.945On-Site 56 Nickel mg/kg 5.37 0.0945 0.378On-Site 56 Potassium mg/kg 1030 15.1 56.7On-Site 56 Selenium mg/kg 0.473 U 0.473 0.945On-Site 56 Silver mg/kg 0.108 J 0.0874 0.437On-Site 56 Sodium mg/kg 46.2 J 15.1 47.3On-Site 56 Thallium mg/kg 0.0567 U 0.0567 0.189On-Site 56 Vanadium mg/kg 12.5 0.378 1.89On-Site 56 Zinc mg/kg 126 0.388 1.94On-Site 57 Aluminum mg/kg 7700 2.98 9.94On-Site 57 Antimony mg/kg 0.312 U 0.312 0.945On-Site 57 Arsenic mg/kg 3.04 0.199 0.994On-Site 57 Barium mg/kg 173 0.0994 0.398On-Site 57 Beryllium mg/kg 0.372 0.0199 0.0994On-Site 57 Cadmium mg/kg 0.214 0.0199 0.199On-Site 57 Calcium mg/kg 44300 32.8 99.4On-Site 57 Chromium mg/kg 7.44 0.199 0.596On-Site 57 Cobalt mg/kg 4.36 0.0596 0.199On-Site 57 Copper mg/kg 12.5 0.0656 0.199On-Site 57 Iron mg/kg 9930 24.9 99.4On-Site 57 Lead mg/kg 8.87 0.0994 0.398On-Site 57 Magnesium mg/kg 4530 1.49 4.97On-Site 57 Manganese mg/kg 189 0.199 0.994On-Site 57 Nickel mg/kg 7.67 0.0994 0.398On-Site 57 Potassium mg/kg 2260 15.9 59.6On-Site 57 Selenium mg/kg 0.497 U 0.497 0.994On-Site 57 Silver mg/kg 0.0945 U 0.0945 0.473On-Site 57 Sodium mg/kg 74.9 15.9 49.7On-Site 57 Thallium mg/kg 0.0905 J 0.0596 0.199On-Site 57 Vanadium mg/kg 27.5 1.99 9.94On-Site 57 Zinc mg/kg 70.1 0.357 1.78

Location Type Location Analyte Units Result Lab Data Qualifiers Decision Level (MDL) Detection Limit (PQL)
TABLE C-6. Non-radiological Results by Location for Calendar Year 2010, Soil
On-Site 76 Aluminum mg/kg 7440 3 10On-Site 76 Antimony mg/kg 0.329 U 0.329 0.998On-Site 76 Arsenic mg/kg 1.88 0.2 1On-Site 76 Barium mg/kg 59.4 0.1 0.4On-Site 76 Beryllium mg/kg 0.394 0.02 0.1On-Site 76 Cadmium mg/kg 0.143 J 0.02 0.2On-Site 76 Calcium mg/kg 2220 6.6 20On-Site 76 Chromium mg/kg 6.67 0.2 0.6On-Site 76 Cobalt mg/kg 2.75 0.06 0.2On-Site 76 Copper mg/kg 5.74 0.066 0.2On-Site 76 Iron mg/kg 6890 5 20On-Site 76 Lead mg/kg 7.04 0.1 0.4On-Site 76 Magnesium mg/kg 2010 1.5 5On-Site 76 Manganese mg/kg 128 0.2 1On-Site 76 Nickel mg/kg 5.87 0.1 0.4On-Site 76 Potassium mg/kg 2490 16 60On-Site 76 Selenium mg/kg 0.5 U 0.5 1On-Site 76 Silver mg/kg 0.169 J 0.0998 0.499On-Site 76 Sodium mg/kg 28.1 J 16 50On-Site 76 Thallium mg/kg 0.0986 J 0.06 0.2On-Site 76 Vanadium mg/kg 11.3 0.4 2On-Site 76 Zinc mg/kg 24.1 0.4 2On-Site 77 Aluminum mg/kg 11800 27.9 92.9On-Site 77 Antimony mg/kg 0.306 U 0.306 0.926On-Site 77 Arsenic mg/kg 2.73 0.186 0.929On-Site 77 Barium mg/kg 137 0.0929 0.372On-Site 77 Beryllium mg/kg 0.512 0.0186 0.0929On-Site 77 Cadmium mg/kg 0.315 0.0186 0.186On-Site 77 Calcium mg/kg 27000 61.3 186On-Site 77 Chromium mg/kg 8.58 0.186 0.558On-Site 77 Cobalt mg/kg 3.83 0.0558 0.186On-Site 77 Copper mg/kg 8.48 0.0613 0.186On-Site 77 Iron mg/kg 9700 46.5 186

Location Type Location Analyte Units Result Lab Data Qualifiers Decision Level (MDL) Detection Limit (PQL)
TABLE C-6. Non-radiological Results by Location for Calendar Year 2010, Soil
On-Site 77 Lead mg/kg 13 0.0929 0.372On-Site 77 Magnesium mg/kg 3600 1.39 4.65On-Site 77 Manganese mg/kg 208 1.86 9.29On-Site 77 Nickel mg/kg 8.26 0.0929 0.372On-Site 77 Potassium mg/kg 2930 14.9 55.8On-Site 77 Selenium mg/kg 0.465 U 0.465 0.929On-Site 77 Silver mg/kg 0.0926 U 0.0926 0.463On-Site 77 Sodium mg/kg 57.4 14.9 46.5On-Site 77 Thallium mg/kg 0.131 J 0.0558 0.186On-Site 77 Vanadium mg/kg 15.7 0.372 1.86On-Site 77 Zinc mg/kg 37 0.372 1.86On-Site 78 Aluminum mg/kg 11400 13.9 46.4On-Site 78 Antimony mg/kg 0.325 U 0.325 0.986On-Site 78 Arsenic mg/kg 2.25 0.186 0.928On-Site 78 Barium mg/kg 79.4 0.0928 0.371On-Site 78 Beryllium mg/kg 0.398 0.0186 0.0928On-Site 78 Cadmium mg/kg 0.233 0.0186 0.186On-Site 78 Calcium mg/kg 2520 6.12 18.6On-Site 78 Chromium mg/kg 11.2 0.186 0.557On-Site 78 Cobalt mg/kg 4.32 0.0557 0.186On-Site 78 Copper mg/kg 7.91 0.0612 0.186On-Site 78 Iron mg/kg 12700 23.2 92.8On-Site 78 Lead mg/kg 11.5 0.0928 0.371On-Site 78 Magnesium mg/kg 3840 1.39 4.64On-Site 78 Manganese mg/kg 258 0.928 4.64On-Site 78 Nickel mg/kg 9.28 0.0928 0.371On-Site 78 Potassium mg/kg 2350 14.8 55.7On-Site 78 Selenium mg/kg 0.464 U 0.464 0.928On-Site 78 Silver mg/kg 0.136 J 0.0986 0.493On-Site 78 Sodium mg/kg 56.5 14.8 46.4On-Site 78 Thallium mg/kg 0.124 J 0.0557 0.186On-Site 78 Vanadium mg/kg 21.8 1.86 9.28On-Site 78 Zinc mg/kg 30 0.399 2

Location Type Location Analyte Units Result Lab Data Qualifiers Decision Level (MDL) Detection Limit (PQL)
TABLE C-6. Non-radiological Results by Location for Calendar Year 2010, Soil
On-Site 86 Aluminum mg/kg 10800 14.1 46.9On-Site 86 Antimony mg/kg 0.327 U 0.327 0.992On-Site 86 Arsenic mg/kg 3.54 0.188 0.938On-Site 86 Barium mg/kg 187 0.469 1.88On-Site 86 Beryllium mg/kg 0.503 0.0188 0.0938On-Site 86 Cadmium mg/kg 0.178 J 0.0188 0.188On-Site 86 Calcium mg/kg 52200 61.9 188On-Site 86 Chromium mg/kg 9.32 0.188 0.563On-Site 86 Cobalt mg/kg 4.04 0.0563 0.188On-Site 86 Copper mg/kg 7.61 0.0619 0.188On-Site 86 Iron mg/kg 12300 23.5 93.8On-Site 86 Lead mg/kg 7.37 0.0938 0.375On-Site 86 Magnesium mg/kg 4420 1.41 4.69On-Site 86 Manganese mg/kg 205 0.938 4.69On-Site 86 Nickel mg/kg 8.25 0.0938 0.375On-Site 86 Potassium mg/kg 2590 75 281On-Site 86 Selenium mg/kg 0.469 U 0.469 0.938On-Site 86 Silver mg/kg 0.0992 U 0.0992 0.496On-Site 86 Sodium mg/kg 113 15 46.9On-Site 86 Thallium mg/kg 0.118 J 0.0563 0.188On-Site 86 Vanadium mg/kg 27.1 1.88 9.38On-Site 86 Zinc mg/kg 30.8 1.88 9.38On-Site 90 Aluminum mg/kg 7060 13.1 43.7On-Site 90 Antimony mg/kg 0.306 U 0.306 0.926On-Site 90 Arsenic mg/kg 1.54 0.175 0.874On-Site 90 Barium mg/kg 60.1 0.0874 0.35On-Site 90 Beryllium mg/kg 0.302 0.0175 0.0874On-Site 90 Cadmium mg/kg 0.203 0.0175 0.175On-Site 90 Calcium mg/kg 2460 5.77 17.5On-Site 90 Chromium mg/kg 7.13 0.175 0.524On-Site 90 Cobalt mg/kg 2.37 0.0524 0.175On-Site 90 Copper mg/kg 5.71 0.0577 0.175On-Site 90 Iron mg/kg 7240 4.37 17.5

Location Type Location Analyte Units Result Lab Data Qualifiers Decision Level (MDL) Detection Limit (PQL)
TABLE C-6. Non-radiological Results by Location for Calendar Year 2010, Soil
On-Site 90 Lead mg/kg 11.1 0.0874 0.35On-Site 90 Magnesium mg/kg 1840 1.31 4.37On-Site 90 Manganese mg/kg 143 0.175 0.874On-Site 90 Nickel mg/kg 4.91 0.0874 0.35On-Site 90 Potassium mg/kg 1870 69.9 262On-Site 90 Selenium mg/kg 0.437 U 0.437 0.874On-Site 90 Silver mg/kg 0.0998 J 0.0926 0.463On-Site 90 Sodium mg/kg 39.2 J 14 43.7On-Site 90 Thallium mg/kg 0.0874 J 0.0524 0.175On-Site 90 Vanadium mg/kg 12.4 0.35 1.75On-Site 90 Zinc mg/kg 36.2 0.35 1.75On-Site 91 Aluminum mg/kg 2630 2.51 8.38On-Site 91 Antimony mg/kg 0.322 U 0.322 0.977On-Site 91 Arsenic mg/kg 1.1 0.168 0.838On-Site 91 Barium mg/kg 31.9 0.0838 0.335On-Site 91 Beryllium mg/kg 0.181 0.0168 0.0838On-Site 91 Cadmium mg/kg 0.105 J 0.0168 0.168On-Site 91 Calcium mg/kg 14800 27.6 83.8On-Site 91 Chromium mg/kg 2.49 0.168 0.503On-Site 91 Cobalt mg/kg 1.47 0.0503 0.168On-Site 91 Copper mg/kg 2.22 0.0553 0.168On-Site 91 Iron mg/kg 4910 4.19 16.8On-Site 91 Lead mg/kg 3.45 0.0838 0.335On-Site 91 Magnesium mg/kg 1010 1.26 4.19On-Site 91 Manganese mg/kg 101 0.168 0.838On-Site 91 Nickel mg/kg 3.05 0.0838 0.335On-Site 91 Potassium mg/kg 643 13.4 50.3On-Site 91 Selenium mg/kg 0.419 U 0.419 0.838On-Site 91 Silver mg/kg 0.0977 U 0.0977 0.488On-Site 91 Sodium mg/kg 16.2 J 13.4 41.9On-Site 91 Thallium mg/kg 0.0611 J 0.0503 0.168On-Site 91 Vanadium mg/kg 9.01 0.335 1.68On-Site 91 Zinc mg/kg 12.5 0.335 1.68
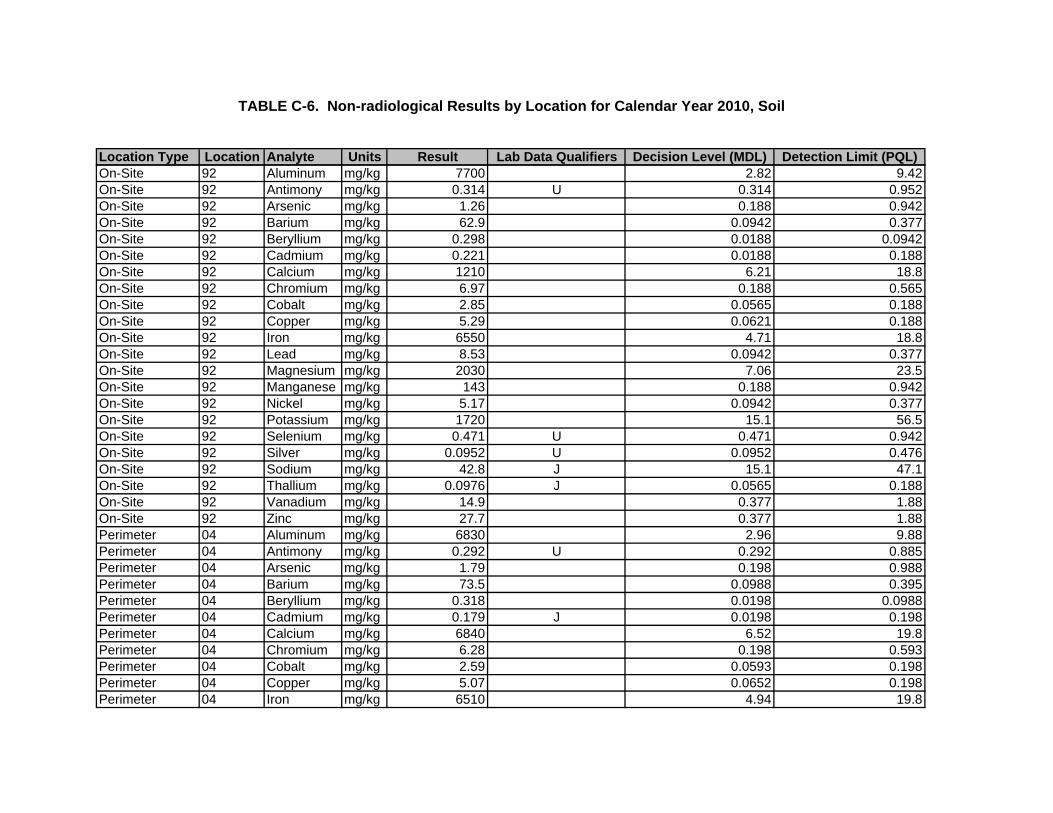
Location Type Location Analyte Units Result Lab Data Qualifiers Decision Level (MDL) Detection Limit (PQL)
TABLE C-6. Non-radiological Results by Location for Calendar Year 2010, Soil
On-Site 92 Aluminum mg/kg 7700 2.82 9.42On-Site 92 Antimony mg/kg 0.314 U 0.314 0.952On-Site 92 Arsenic mg/kg 1.26 0.188 0.942On-Site 92 Barium mg/kg 62.9 0.0942 0.377On-Site 92 Beryllium mg/kg 0.298 0.0188 0.0942On-Site 92 Cadmium mg/kg 0.221 0.0188 0.188On-Site 92 Calcium mg/kg 1210 6.21 18.8On-Site 92 Chromium mg/kg 6.97 0.188 0.565On-Site 92 Cobalt mg/kg 2.85 0.0565 0.188On-Site 92 Copper mg/kg 5.29 0.0621 0.188On-Site 92 Iron mg/kg 6550 4.71 18.8On-Site 92 Lead mg/kg 8.53 0.0942 0.377On-Site 92 Magnesium mg/kg 2030 7.06 23.5On-Site 92 Manganese mg/kg 143 0.188 0.942On-Site 92 Nickel mg/kg 5.17 0.0942 0.377On-Site 92 Potassium mg/kg 1720 15.1 56.5On-Site 92 Selenium mg/kg 0.471 U 0.471 0.942On-Site 92 Silver mg/kg 0.0952 U 0.0952 0.476On-Site 92 Sodium mg/kg 42.8 J 15.1 47.1On-Site 92 Thallium mg/kg 0.0976 J 0.0565 0.188On-Site 92 Vanadium mg/kg 14.9 0.377 1.88On-Site 92 Zinc mg/kg 27.7 0.377 1.88Perimeter 04 Aluminum mg/kg 6830 2.96 9.88Perimeter 04 Antimony mg/kg 0.292 U 0.292 0.885Perimeter 04 Arsenic mg/kg 1.79 0.198 0.988Perimeter 04 Barium mg/kg 73.5 0.0988 0.395Perimeter 04 Beryllium mg/kg 0.318 0.0198 0.0988Perimeter 04 Cadmium mg/kg 0.179 J 0.0198 0.198Perimeter 04 Calcium mg/kg 6840 6.52 19.8Perimeter 04 Chromium mg/kg 6.28 0.198 0.593Perimeter 04 Cobalt mg/kg 2.59 0.0593 0.198Perimeter 04 Copper mg/kg 5.07 0.0652 0.198Perimeter 04 Iron mg/kg 6510 4.94 19.8

Location Type Location Analyte Units Result Lab Data Qualifiers Decision Level (MDL) Detection Limit (PQL)
TABLE C-6. Non-radiological Results by Location for Calendar Year 2010, Soil
Perimeter 04 Lead mg/kg 8.32 0.0988 0.395Perimeter 04 Magnesium mg/kg 2290 1.48 4.94Perimeter 04 Manganese mg/kg 140 0.198 0.988Perimeter 04 Nickel mg/kg 5.54 0.0988 0.395Perimeter 04 Potassium mg/kg 1890 15.8 59.3Perimeter 04 Selenium mg/kg 0.494 U 0.494 0.988Perimeter 04 Silver mg/kg 0.147 J 0.0885 0.442Perimeter 04 Sodium mg/kg 28.6 J 15.8 49.4Perimeter 04 Thallium mg/kg 0.0814 J 0.0593 0.198Perimeter 04 Vanadium mg/kg 11.4 0.395 1.98Perimeter 04 Zinc mg/kg 23.7 0.395 1.98Perimeter 05 Aluminum mg/kg 6130 14.1 47Perimeter 05 Antimony mg/kg 0.297 U 0.297 0.901Perimeter 05 Arsenic mg/kg 1.29 0.188 0.94Perimeter 05 Barium mg/kg 52.1 0.094 0.376Perimeter 05 Beryllium mg/kg 0.289 0.0188 0.094Perimeter 05 Cadmium mg/kg 0.121 J 0.0188 0.188Perimeter 05 Calcium mg/kg 1030 6.2 18.8Perimeter 05 Chromium mg/kg 6.21 0.188 0.564Perimeter 05 Cobalt mg/kg 2.03 0.0564 0.188Perimeter 05 Copper mg/kg 4.11 0.062 0.188Perimeter 05 Iron mg/kg 6040 4.7 18.8Perimeter 05 Lead mg/kg 6.04 0.094 0.376Perimeter 05 Magnesium mg/kg 1830 1.41 4.7Perimeter 05 Manganese mg/kg 115 0.188 0.94Perimeter 05 Nickel mg/kg 4.08 0.094 0.376Perimeter 05 Potassium mg/kg 1850 75.2 282Perimeter 05 Selenium mg/kg 0.47 U 0.47 0.94Perimeter 05 Silver mg/kg 0.0901 U 0.0901 0.45Perimeter 05 Sodium mg/kg 29.9 J 15 47Perimeter 05 Thallium mg/kg 0.0741 J 0.0564 0.188Perimeter 05 Vanadium mg/kg 10.7 0.376 1.88Perimeter 05 Zinc mg/kg 19.7 0.376 1.88

Location Type Location Analyte Units Result Lab Data Qualifiers Decision Level (MDL) Detection Limit (PQL)
TABLE C-6. Non-radiological Results by Location for Calendar Year 2010, Soil
Perimeter 12 Aluminum mg/kg 7720 14.8 49.3Perimeter 12 Antimony mg/kg 0.323 U 0.323 0.978Perimeter 12 Arsenic mg/kg 1.12 0.197 0.986Perimeter 12 Barium mg/kg 52.8 0.0986 0.394Perimeter 12 Beryllium mg/kg 0.219 J 0.0986 0.493Perimeter 12 Cadmium mg/kg 0.196 J 0.0197 0.197Perimeter 12 Calcium mg/kg 1620 32.5 98.6Perimeter 12 Chromium mg/kg 7.8 0.986 2.96Perimeter 12 Cobalt mg/kg 5.02 0.296 0.986Perimeter 12 Copper mg/kg 7.27 0.325 0.986Perimeter 12 Iron mg/kg 8700 24.7 98.6Perimeter 12 Lead mg/kg 8.28 0.0986 0.394Perimeter 12 Magnesium mg/kg 2910 7.4 24.7Perimeter 12 Manganese mg/kg 202 0.986 4.93Perimeter 12 Nickel mg/kg 6.32 0.493 1.97Perimeter 12 Potassium mg/kg 1240 78.9 296Perimeter 12 Selenium mg/kg 0.493 U 0.493 0.986Perimeter 12 Silver mg/kg 0.0978 U 0.0978 0.489Perimeter 12 Sodium mg/kg 78.9 U 78.9 247Perimeter 12 Thallium mg/kg 0.0884 J 0.0592 0.197Perimeter 12 Vanadium mg/kg 8.53 J 1.97 9.86Perimeter 12 Zinc mg/kg 27.1 0.394 1.97Perimeter 16 Aluminum mg/kg 13400 13.1 43.6Perimeter 16 Antimony mg/kg 0.327 U 0.327 0.992Perimeter 16 Arsenic mg/kg 1.92 0.174 0.871Perimeter 16 Barium mg/kg 98.1 0.0871 0.348Perimeter 16 Beryllium mg/kg 0.559 0.0871 0.436Perimeter 16 Cadmium mg/kg 0.275 0.0174 0.174Perimeter 16 Calcium mg/kg 8780 28.7 87.1Perimeter 16 Chromium mg/kg 9.25 0.871 2.61Perimeter 16 Cobalt mg/kg 6.57 0.261 0.871Perimeter 16 Copper mg/kg 12.9 0.287 0.871Perimeter 16 Iron mg/kg 15500 21.8 87.1

Location Type Location Analyte Units Result Lab Data Qualifiers Decision Level (MDL) Detection Limit (PQL)
TABLE C-6. Non-radiological Results by Location for Calendar Year 2010, Soil
Perimeter 16 Lead mg/kg 8.1 0.0871 0.348Perimeter 16 Magnesium mg/kg 4850 6.53 21.8Perimeter 16 Manganese mg/kg 345 0.871 4.36Perimeter 16 Nickel mg/kg 9.78 0.436 1.74Perimeter 16 Potassium mg/kg 3250 69.7 261Perimeter 16 Selenium mg/kg 0.436 U 0.436 0.871Perimeter 16 Silver mg/kg 0.496 U 0.496 2.48Perimeter 16 Sodium mg/kg 69.7 U 69.7 218Perimeter 16 Thallium mg/kg 0.156 J 0.0523 0.174Perimeter 16 Vanadium mg/kg 28.1 1.74 8.71Perimeter 16 Zinc mg/kg 47.7 0.348 1.74Perimeter 19 Aluminum mg/kg 12700 14.3 47.6Perimeter 19 Antimony mg/kg 0.317 U 0.317 0.96Perimeter 19 Arsenic mg/kg 2.78 0.19 0.952Perimeter 19 Barium mg/kg 94 0.0952 0.381Perimeter 19 Beryllium mg/kg 0.439 0.019 0.0952Perimeter 19 Cadmium mg/kg 0.316 0.019 0.19Perimeter 19 Calcium mg/kg 4220 6.29 19Perimeter 19 Chromium mg/kg 15.5 0.19 0.571Perimeter 19 Cobalt mg/kg 6.49 0.0571 0.19Perimeter 19 Copper mg/kg 15 0.0629 0.19Perimeter 19 Iron mg/kg 13600 23.8 95.2Perimeter 19 Lead mg/kg 17.7 0.0952 0.381Perimeter 19 Magnesium mg/kg 4060 1.43 4.76Perimeter 19 Manganese mg/kg 296 0.952 4.76Perimeter 19 Nickel mg/kg 12 0.0952 0.381Perimeter 19 Potassium mg/kg 2790 15.2 57.1Perimeter 19 Selenium mg/kg 0.476 U 0.476 0.952Perimeter 19 Silver mg/kg 0.192 J 0.096 0.48Perimeter 19 Sodium mg/kg 73.6 15.2 47.6Perimeter 19 Thallium mg/kg 0.132 J 0.0571 0.19Perimeter 19 Vanadium mg/kg 26.3 1.9 9.52Perimeter 19 Zinc mg/kg 45.4 0.357 1.79

Location Type Location Analyte Units Result Lab Data Qualifiers Decision Level (MDL) Detection Limit (PQL)
TABLE C-6. Non-radiological Results by Location for Calendar Year 2010, Soil
Perimeter 58 Aluminum mg/kg 16000 14.7 49.1Perimeter 58 Antimony mg/kg 0.313 U 0.313 0.949Perimeter 58 Arsenic mg/kg 3.48 0.196 0.982Perimeter 58 Barium mg/kg 183 0.0982 0.393Perimeter 58 Beryllium mg/kg 0.54 0.0196 0.0982Perimeter 58 Cadmium mg/kg 0.551 0.0196 0.196Perimeter 58 Calcium mg/kg 43100 32.4 98.2Perimeter 58 Chromium mg/kg 10.1 0.196 0.589Perimeter 58 Cobalt mg/kg 5.03 0.0589 0.196Perimeter 58 Copper mg/kg 11.5 0.0648 0.196Perimeter 58 Iron mg/kg 13800 24.6 98.2Perimeter 58 Lead mg/kg 14.1 0.0982 0.393Perimeter 58 Magnesium mg/kg 4650 1.47 4.91Perimeter 58 Manganese mg/kg 229 0.982 4.91Perimeter 58 Nickel mg/kg 9.86 0.0982 0.393Perimeter 58 Potassium mg/kg 3100 15.7 58.9Perimeter 58 Selenium mg/kg 0.491 U 0.491 0.982Perimeter 58 Silver mg/kg 0.0949 U 0.0949 0.474Perimeter 58 Sodium mg/kg 59 15.7 49.1Perimeter 58 Thallium mg/kg 0.14 J 0.0589 0.196Perimeter 58 Vanadium mg/kg 30.6 1.96 9.82Perimeter 58 Zinc mg/kg 41.6 0.4 2Perimeter 59 Aluminum mg/kg 7540 2.87 9.58Perimeter 59 Antimony mg/kg 0.327 U 0.327 0.992Perimeter 59 Arsenic mg/kg 1.93 0.192 0.958Perimeter 59 Barium mg/kg 100 0.0958 0.383Perimeter 59 Beryllium mg/kg 0.367 0.0192 0.0958Perimeter 59 Cadmium mg/kg 0.308 0.0192 0.192Perimeter 59 Calcium mg/kg 23700 31.6 95.8Perimeter 59 Chromium mg/kg 7.52 0.192 0.575Perimeter 59 Cobalt mg/kg 3.29 0.0575 0.192Perimeter 59 Copper mg/kg 9.78 0.0632 0.192Perimeter 59 Iron mg/kg 8280 4.79 19.2

Location Type Location Analyte Units Result Lab Data Qualifiers Decision Level (MDL) Detection Limit (PQL)
TABLE C-6. Non-radiological Results by Location for Calendar Year 2010, Soil
Perimeter 59 Lead mg/kg 25.5 0.0958 0.383Perimeter 59 Magnesium mg/kg 3020 1.44 4.79Perimeter 59 Manganese mg/kg 163 0.192 0.958Perimeter 59 Nickel mg/kg 6.49 0.0958 0.383Perimeter 59 Potassium mg/kg 1890 15.3 57.5Perimeter 59 Selenium mg/kg 0.479 U 0.479 0.958Perimeter 59 Silver mg/kg 0.102 J 0.0992 0.496Perimeter 59 Sodium mg/kg 50.5 15.3 47.9Perimeter 59 Thallium mg/kg 0.0703 J 0.0575 0.192Perimeter 59 Vanadium mg/kg 17 0.383 1.92Perimeter 59 Zinc mg/kg 33.2 0.374 1.87Perimeter 60 Aluminum mg/kg 13000 14.8 49.3Perimeter 60 Antimony mg/kg 1.63 U 1.63 4.93Perimeter 60 Arsenic mg/kg 2.1 0.197 0.986Perimeter 60 Barium mg/kg 138 0.0986 0.394Perimeter 60 Beryllium mg/kg 0.534 0.0986 0.493Perimeter 60 Cadmium mg/kg 0.251 0.0197 0.197Perimeter 60 Calcium mg/kg 27400 32.5 98.6Perimeter 60 Chromium mg/kg 11.6 0.986 2.96Perimeter 60 Cobalt mg/kg 6.01 0.296 0.986Perimeter 60 Copper mg/kg 12.3 0.325 0.986Perimeter 60 Iron mg/kg 13000 24.7 98.6Perimeter 60 Lead mg/kg 9.6 0.0986 0.394Perimeter 60 Magnesium mg/kg 5520 7.4 24.7Perimeter 60 Manganese mg/kg 350 0.986 4.93Perimeter 60 Nickel mg/kg 11.7 0.493 1.97Perimeter 60 Potassium mg/kg 4330 78.9 296Perimeter 60 Selenium mg/kg 0.493 U 0.493 0.986Perimeter 60 Silver mg/kg 0.0986 U 0.0986 0.493Perimeter 60 Sodium mg/kg 78.9 U 78.9 247Perimeter 60 Thallium mg/kg 0.132 J 0.0592 0.197Perimeter 60 Vanadium mg/kg 24.4 1.97 9.86Perimeter 60 Zinc mg/kg 44 0.394 1.97

Location Type Location Analyte Units Result Lab Data Qualifiers Decision Level (MDL) Detection Limit (PQL)
TABLE C-6. Non-radiological Results by Location for Calendar Year 2010, Soil
Perimeter 61 Aluminum mg/kg 8350 14.3 47.5Perimeter 61 Antimony mg/kg 1.64 U 1.64 4.96Perimeter 61 Arsenic mg/kg 2.63 0.19 0.951Perimeter 61 Barium mg/kg 153 0.0951 0.38Perimeter 61 Beryllium mg/kg 0.296 0.019 0.0951Perimeter 61 Cadmium mg/kg 0.179 J 0.019 0.19Perimeter 61 Calcium mg/kg 37600 31.4 95.1Perimeter 61 Chromium mg/kg 5.56 0.19 0.57Perimeter 61 Cobalt mg/kg 2.69 0.057 0.19Perimeter 61 Copper mg/kg 6.81 0.0627 0.19Perimeter 61 Iron mg/kg 6660 4.75 19Perimeter 61 Lead mg/kg 7.19 0.0951 0.38Perimeter 61 Magnesium mg/kg 3340 7.13 23.8Perimeter 61 Manganese mg/kg 110 0.19 0.951Perimeter 61 Nickel mg/kg 5.63 0.0951 0.38Perimeter 61 Potassium mg/kg 1760 76 285Perimeter 61 Selenium mg/kg 0.475 U 0.475 0.951Perimeter 61 Silver mg/kg 0.0992 U 0.0992 0.496Perimeter 61 Sodium mg/kg 68.6 15.2 47.5Perimeter 61 Thallium mg/kg 0.0618 J 0.057 0.19Perimeter 61 Vanadium mg/kg 18.2 0.38 1.9Perimeter 61 Zinc mg/kg 24.1 0.38 1.9Perimeter 63 Aluminum mg/kg 14000 14.9 49.8Perimeter 63 Antimony mg/kg 0.323 U 0.323 0.978Perimeter 63 Arsenic mg/kg 2.72 0.199 0.996Perimeter 63 Barium mg/kg 135 0.0996 0.398Perimeter 63 Beryllium mg/kg 0.56 0.0199 0.0996Perimeter 63 Cadmium mg/kg 0.333 0.0199 0.199Perimeter 63 Calcium mg/kg 22800 32.9 99.6Perimeter 63 Chromium mg/kg 12 0.199 0.598Perimeter 63 Cobalt mg/kg 4.68 0.0598 0.199Perimeter 63 Copper mg/kg 8.13 0.0657 0.199Perimeter 63 Iron mg/kg 13400 24.9 99.6
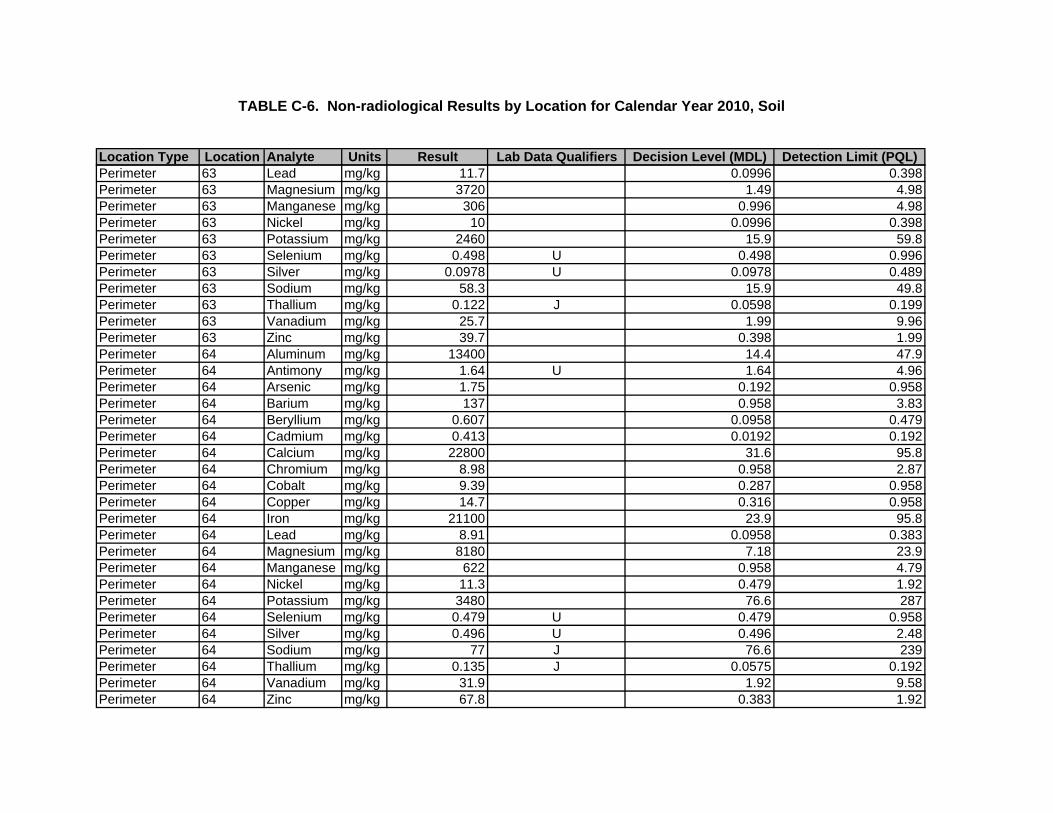
Location Type Location Analyte Units Result Lab Data Qualifiers Decision Level (MDL) Detection Limit (PQL)
TABLE C-6. Non-radiological Results by Location for Calendar Year 2010, Soil
Perimeter 63 Lead mg/kg 11.7 0.0996 0.398Perimeter 63 Magnesium mg/kg 3720 1.49 4.98Perimeter 63 Manganese mg/kg 306 0.996 4.98Perimeter 63 Nickel mg/kg 10 0.0996 0.398Perimeter 63 Potassium mg/kg 2460 15.9 59.8Perimeter 63 Selenium mg/kg 0.498 U 0.498 0.996Perimeter 63 Silver mg/kg 0.0978 U 0.0978 0.489Perimeter 63 Sodium mg/kg 58.3 15.9 49.8Perimeter 63 Thallium mg/kg 0.122 J 0.0598 0.199Perimeter 63 Vanadium mg/kg 25.7 1.99 9.96Perimeter 63 Zinc mg/kg 39.7 0.398 1.99Perimeter 64 Aluminum mg/kg 13400 14.4 47.9Perimeter 64 Antimony mg/kg 1.64 U 1.64 4.96Perimeter 64 Arsenic mg/kg 1.75 0.192 0.958Perimeter 64 Barium mg/kg 137 0.958 3.83Perimeter 64 Beryllium mg/kg 0.607 0.0958 0.479Perimeter 64 Cadmium mg/kg 0.413 0.0192 0.192Perimeter 64 Calcium mg/kg 22800 31.6 95.8Perimeter 64 Chromium mg/kg 8.98 0.958 2.87Perimeter 64 Cobalt mg/kg 9.39 0.287 0.958Perimeter 64 Copper mg/kg 14.7 0.316 0.958Perimeter 64 Iron mg/kg 21100 23.9 95.8Perimeter 64 Lead mg/kg 8.91 0.0958 0.383Perimeter 64 Magnesium mg/kg 8180 7.18 23.9Perimeter 64 Manganese mg/kg 622 0.958 4.79Perimeter 64 Nickel mg/kg 11.3 0.479 1.92Perimeter 64 Potassium mg/kg 3480 76.6 287Perimeter 64 Selenium mg/kg 0.479 U 0.479 0.958Perimeter 64 Silver mg/kg 0.496 U 0.496 2.48Perimeter 64 Sodium mg/kg 77 J 76.6 239Perimeter 64 Thallium mg/kg 0.135 J 0.0575 0.192Perimeter 64 Vanadium mg/kg 31.9 1.92 9.58Perimeter 64 Zinc mg/kg 67.8 0.383 1.92

Location Type Location Analyte Units Result Lab Data Qualifiers Decision Level (MDL) Detection Limit (PQL)
TABLE C-6. Non-radiological Results by Location for Calendar Year 2010, Soil
Perimeter 80 Aluminum mg/kg 14600 14.4 48.1Perimeter 80 Antimony mg/kg 1.6 U 1.6 4.85Perimeter 80 Arsenic mg/kg 3.33 0.192 0.962Perimeter 80 Barium mg/kg 168 0.0962 0.385Perimeter 80 Beryllium mg/kg 0.633 0.0192 0.0962Perimeter 80 Cadmium mg/kg 0.366 0.0192 0.192Perimeter 80 Calcium mg/kg 89600 63.5 192Perimeter 80 Chromium mg/kg 13.8 0.192 0.577Perimeter 80 Cobalt mg/kg 4.96 0.0577 0.192Perimeter 80 Copper mg/kg 8.3 0.0635 0.192Perimeter 80 Iron mg/kg 13600 24 96.2Perimeter 80 Lead mg/kg 9.83 0.0962 0.385Perimeter 80 Magnesium mg/kg 5250 1.44 4.81Perimeter 80 Manganese mg/kg 327 0.962 4.81Perimeter 80 Nickel mg/kg 13.6 0.0962 0.385Perimeter 80 Potassium mg/kg 2950 15.4 57.7Perimeter 80 Selenium mg/kg 0.481 U 0.481 0.962Perimeter 80 Silver mg/kg 0.0971 U 0.0971 0.485Perimeter 80 Sodium mg/kg 69.3 15.4 48.1Perimeter 80 Thallium mg/kg 0.123 J 0.0577 0.192Perimeter 80 Vanadium mg/kg 25.9 1.92 9.62Perimeter 80 Zinc mg/kg 38.5 0.377 1.89Perimeter 81 Aluminum mg/kg 9530 14.9 49.7Perimeter 81 Antimony mg/kg 0.327 U 0.327 0.99Perimeter 81 Arsenic mg/kg 1.94 0.199 0.994Perimeter 81 Barium mg/kg 69.2 0.0994 0.398Perimeter 81 Beryllium mg/kg 0.415 0.0199 0.0994Perimeter 81 Cadmium mg/kg 0.21 0.0199 0.199Perimeter 81 Calcium mg/kg 1620 6.56 19.9Perimeter 81 Chromium mg/kg 8.98 0.199 0.596Perimeter 81 Cobalt mg/kg 3.14 0.0596 0.199Perimeter 81 Copper mg/kg 6.99 0.0656 0.199Perimeter 81 Iron mg/kg 8890 4.97 19.9

Location Type Location Analyte Units Result Lab Data Qualifiers Decision Level (MDL) Detection Limit (PQL)
TABLE C-6. Non-radiological Results by Location for Calendar Year 2010, Soil
Perimeter 81 Lead mg/kg 10.1 0.0994 0.398Perimeter 81 Magnesium mg/kg 2610 1.49 4.97Perimeter 81 Manganese mg/kg 174 0.199 0.994Perimeter 81 Nickel mg/kg 6.49 0.0994 0.398Perimeter 81 Potassium mg/kg 2370 79.5 298Perimeter 81 Selenium mg/kg 0.497 U 0.497 0.994Perimeter 81 Silver mg/kg 0.104 J 0.099 0.495Perimeter 81 Sodium mg/kg 47.5 J 15.9 49.7Perimeter 81 Thallium mg/kg 0.107 J 0.0596 0.199Perimeter 81 Vanadium mg/kg 15.6 0.398 1.99Perimeter 81 Zinc mg/kg 28.9 0.398 1.99Perimeter 82 Aluminum mg/kg 12700 14.3 47.5Perimeter 82 Antimony mg/kg 1.61 U 1.61 4.88Perimeter 82 Arsenic mg/kg 3.49 0.19 0.951Perimeter 82 Barium mg/kg 199 0.475 1.9Perimeter 82 Beryllium mg/kg 0.464 0.019 0.0951Perimeter 82 Cadmium mg/kg 0.18 J 0.019 0.19Perimeter 82 Calcium mg/kg 49300 62.7 190Perimeter 82 Chromium mg/kg 8.99 0.19 0.57Perimeter 82 Cobalt mg/kg 5.06 0.057 0.19Perimeter 82 Copper mg/kg 9 0.0627 0.19Perimeter 82 Iron mg/kg 12200 23.8 95.1Perimeter 82 Lead mg/kg 7.79 0.0951 0.38Perimeter 82 Magnesium mg/kg 4300 1.43 4.75Perimeter 82 Manganese mg/kg 178 0.19 0.951Perimeter 82 Nickel mg/kg 9.2 0.0951 0.38Perimeter 82 Potassium mg/kg 2610 15.2 57Perimeter 82 Selenium mg/kg 0.475 U 0.475 0.951Perimeter 82 Silver mg/kg 0.0977 U 0.0977 0.488Perimeter 82 Sodium mg/kg 80.8 15.2 47.5Perimeter 82 Thallium mg/kg 0.121 J 0.057 0.19Perimeter 82 Vanadium mg/kg 28 1.9 9.51Perimeter 82 Zinc mg/kg 35.5 0.342 1.71

Location Type Location Analyte Units Result Lab Data Qualifiers Decision Level (MDL) Detection Limit (PQL)
TABLE C-6. Non-radiological Results by Location for Calendar Year 2010, Soil
Perimeter 87 Aluminum mg/kg 5170 2.81 9.36Perimeter 87 Antimony mg/kg 0.301 U 0.301 0.911Perimeter 87 Arsenic mg/kg 1 0.187 0.936Perimeter 87 Barium mg/kg 47 0.0936 0.375Perimeter 87 Beryllium mg/kg 0.254 0.0187 0.0936Perimeter 87 Cadmium mg/kg 0.132 J 0.0187 0.187Perimeter 87 Calcium mg/kg 1260 6.18 18.7Perimeter 87 Chromium mg/kg 4.95 0.187 0.562Perimeter 87 Cobalt mg/kg 2.01 0.0562 0.187Perimeter 87 Copper mg/kg 3.82 0.0618 0.187Perimeter 87 Iron mg/kg 5020 4.68 18.7Perimeter 87 Lead mg/kg 6.26 0.0936 0.375Perimeter 87 Magnesium mg/kg 1590 1.4 4.68Perimeter 87 Manganese mg/kg 106 0.187 0.936Perimeter 87 Nickel mg/kg 4 0.0936 0.375Perimeter 87 Potassium mg/kg 1460 15 56.2Perimeter 87 Selenium mg/kg 0.468 U 0.468 0.936Perimeter 87 Silver mg/kg 0.112 J 0.0911 0.455Perimeter 87 Sodium mg/kg 26.7 J 15 46.8Perimeter 87 Thallium mg/kg 0.0607 J 0.0562 0.187Perimeter 87 Vanadium mg/kg 8.67 0.375 1.87Perimeter 87 Zinc mg/kg 17.7 0.375 1.87Perimeter 88 Aluminum mg/kg 3300 2.94 9.78Perimeter 88 Antimony mg/kg 0.327 U 0.327 0.99Perimeter 88 Arsenic mg/kg 0.741 J 0.196 0.978Perimeter 88 Barium mg/kg 30.6 0.0978 0.391Perimeter 88 Beryllium mg/kg 0.156 0.0196 0.0978Perimeter 88 Cadmium mg/kg 0.084 J 0.0196 0.196Perimeter 88 Calcium mg/kg 549 6.46 19.6Perimeter 88 Chromium mg/kg 3.4 0.196 0.587Perimeter 88 Cobalt mg/kg 1.32 0.0587 0.196Perimeter 88 Copper mg/kg 2.37 0.0646 0.196Perimeter 88 Iron mg/kg 3500 4.89 19.6

Location Type Location Analyte Units Result Lab Data Qualifiers Decision Level (MDL) Detection Limit (PQL)
TABLE C-6. Non-radiological Results by Location for Calendar Year 2010, Soil
Perimeter 88 Lead mg/kg 4.06 0.0978 0.391Perimeter 88 Magnesium mg/kg 755 1.47 4.89Perimeter 88 Manganese mg/kg 75.6 0.196 0.978Perimeter 88 Nickel mg/kg 2.42 0.0978 0.391Perimeter 88 Potassium mg/kg 767 15.7 58.7Perimeter 88 Selenium mg/kg 0.489 U 0.489 0.978Perimeter 88 Silver mg/kg 0.112 J 0.099 0.495Perimeter 88 Sodium mg/kg 15.7 U 15.7 48.9Perimeter 88 Thallium mg/kg 0.0587 U 0.0587 0.196Perimeter 88 Vanadium mg/kg 6.13 0.391 1.96Perimeter 88 Zinc mg/kg 10.8 0.391 1.96Perimeter 89 Aluminum mg/kg 5880 14.4 47.9Perimeter 89 Antimony mg/kg 0.328 U 0.328 0.994Perimeter 89 Arsenic mg/kg 1.5 0.192 0.958Perimeter 89 Barium mg/kg 105 0.0958 0.383Perimeter 89 Beryllium mg/kg 0.218 0.0192 0.0958Perimeter 89 Cadmium mg/kg 0.0881 J 0.0192 0.192Perimeter 89 Calcium mg/kg 19300 31.6 95.8Perimeter 89 Chromium mg/kg 4.32 0.192 0.575Perimeter 89 Cobalt mg/kg 1.93 0.0575 0.192Perimeter 89 Copper mg/kg 3.33 0.0632 0.192Perimeter 89 Iron mg/kg 4810 4.79 19.2Perimeter 89 Lead mg/kg 4.02 0.0958 0.383Perimeter 89 Magnesium mg/kg 2550 7.18 23.9Perimeter 89 Manganese mg/kg 91.6 0.192 0.958Perimeter 89 Nickel mg/kg 3.94 0.0958 0.383Perimeter 89 Potassium mg/kg 1280 76.6 287Perimeter 89 Selenium mg/kg 0.479 U 0.479 0.958Perimeter 89 Silver mg/kg 0.0994 U 0.0994 0.497Perimeter 89 Sodium mg/kg 46.1 J 15.3 47.9Perimeter 89 Thallium mg/kg 0.0575 U 0.0575 0.192

Location Type Location Analyte Units Result Lab Data Qualifiers Decision Level (MDL) Detection Limit (PQL)
TABLE C-6. Non-radiological Results by Location for Calendar Year 2010, Soil
Perimeter 89 Vanadium mg/kg 12.9 0.383 1.92Perimeter 89 Zinc mg/kg 44.4 0.383 1.92
NOTES: J = Estimated value, the analyte concentration fell above the effective MDL and below the effective PQL. MDL = Method detection limit. mg/kg = milligram per kilogram PQL = Practical quantitation limit. U = The analyte was analyzed for, but not detected. For organic and inorganic analytes the result is less than the effective MDL concentration.

Location Type Location Analyte Units Result Lab Data Qualifiers Decision Level (MDL) Detection Limit (PQL)Community 68 Aluminum mg/kg 4020 14.4 48Community 68 Antimony mg/kg 1.41 U 1.41 4.28Community 68 Arsenic mg/kg 4.61 0.192 0.96Community 68 Barium mg/kg 132 0.096 0.384Community 68 Beryllium mg/kg 0.269 0.0192 0.096Community 68 Cadmium mg/kg 0.301 0.0192 0.192Community 68 Calcium mg/kg 115000 633 1920Community 68 Chromium mg/kg 5.68 0.192 0.576Community 68 Cobalt mg/kg 2.11 0.0576 0.192Community 68 Copper mg/kg 3.8 0.0633 0.192Community 68 Iron mg/kg 5660 4.8 19.2Community 68 Lead mg/kg 8.31 0.096 0.384Community 68 Magnesium mg/kg 1980 1.44 4.8Community 68 Manganese mg/kg 151 0.192 0.96Community 68 Nickel mg/kg 6.8 0.096 0.384Community 68 Potassium mg/kg 1070 76.8 288Community 68 Selenium mg/kg 0.48 U 0.48 0.96Community 68 Silver mg/kg 0.0856 U 0.0856 0.428Community 68 Sodium mg/kg 71.3 15.4 48Community 68 Thallium mg/kg 0.0808 J 0.0576 0.192Community 68 Vanadium mg/kg 9.78 0.384 1.92Community 68 Zinc mg/kg 23.8 0.384 1.92On-Site 72 Aluminum mg/kg 10800 26.4 88On-Site 72 Antimony mg/kg 0.307 U 0.307 0.929On-Site 72 Arsenic mg/kg 3.69 0.176 0.88On-Site 72 Barium mg/kg 105 0.088 0.352On-Site 72 Beryllium mg/kg 0.548 0.0176 0.088On-Site 72 Cadmium mg/kg 0.183 0.0176 0.176On-Site 72 Calcium mg/kg 34500 58.1 176On-Site 72 Chromium mg/kg 8.52 0.176 0.528On-Site 72 Cobalt mg/kg 3.98 0.0528 0.176On-Site 72 Copper mg/kg 8.44 0.0581 0.176On-Site 72 Iron mg/kg 10400 44 176
TABLE C-7. Non-radiological Results by Location for Calendar Year 2010, Sediment

Location Type Location Analyte Units Result Lab Data Qualifiers Decision Level (MDL) Detection Limit (PQL)
TABLE C-7. Non-radiological Results by Location for Calendar Year 2010, Sediment
On-Site 72 Lead mg/kg 8.68 0.088 0.352On-Site 72 Magnesium mg/kg 3900 1.32 4.4On-Site 72 Manganese mg/kg 235 1.76 8.8On-Site 72 Nickel mg/kg 8.18 0.088 0.352On-Site 72 Potassium mg/kg 1840 14.1 52.8On-Site 72 Selenium mg/kg 0.44 U 0.44 0.88On-Site 72 Silver mg/kg 0.0929 U 0.0929 0.465On-Site 72 Sodium mg/kg 75.9 14.1 44On-Site 72 Thallium mg/kg 0.111 J 0.0528 0.176On-Site 72 Vanadium mg/kg 17.2 0.352 1.76On-Site 72 Zinc mg/kg 32.9 0.352 1.76On-Site 74N Aluminum mg/kg 3400 13.8 46On-Site 74N Antimony mg/kg 0.317 U 0.317 0.96On-Site 74N Arsenic mg/kg 0.955 0.184 0.921On-Site 74N Barium mg/kg 38 0.0921 0.368On-Site 74N Beryllium mg/kg 0.202 0.0184 0.0921On-Site 74N Cadmium mg/kg 0.102 J 0.0184 0.184On-Site 74N Calcium mg/kg 14600 30.4 92.1On-Site 74N Chromium mg/kg 2.51 0.184 0.552On-Site 74N Cobalt mg/kg 2.26 0.0552 0.184On-Site 74N Copper mg/kg 5.29 0.0608 0.184On-Site 74N Iron mg/kg 5290 4.6 18.4On-Site 74N Lead mg/kg 2.75 0.0921 0.368On-Site 74N Magnesium mg/kg 2010 6.91 23On-Site 74N Manganese mg/kg 147 0.184 0.921On-Site 74N Nickel mg/kg 3.62 0.0921 0.368On-Site 74N Potassium mg/kg 818 73.7 276On-Site 74N Selenium mg/kg 0.46 U 0.46 0.921On-Site 74N Silver mg/kg 0.096 U 0.096 0.48On-Site 74N Sodium mg/kg 45.8 J 14.7 46On-Site 74N Thallium mg/kg 0.0552 U 0.0552 0.184On-Site 74N Vanadium mg/kg 11.4 0.368 1.84On-Site 74N Zinc mg/kg 20.5 0.368 1.84

Location Type Location Analyte Units Result Lab Data Qualifiers Decision Level (MDL) Detection Limit (PQL)
TABLE C-7. Non-radiological Results by Location for Calendar Year 2010, Sediment
On-Site 75 Aluminum mg/kg 5420 14.3 47.5On-Site 75 Antimony mg/kg 0.314 U 0.314 0.952On-Site 75 Arsenic mg/kg 1.16 0.19 0.951On-Site 75 Barium mg/kg 34 0.0951 0.38On-Site 75 Beryllium mg/kg 0.269 0.019 0.0951On-Site 75 Cadmium mg/kg 0.137 J 0.019 0.19On-Site 75 Calcium mg/kg 31200 31.4 95.1On-Site 75 Chromium mg/kg 6.47 0.19 0.57On-Site 75 Cobalt mg/kg 4.82 0.057 0.19On-Site 75 Copper mg/kg 9.49 0.0627 0.19On-Site 75 Iron mg/kg 9080 4.75 19On-Site 75 Lead mg/kg 7.94 0.0951 0.38On-Site 75 Magnesium mg/kg 3180 7.13 23.8On-Site 75 Manganese mg/kg 202 0.951 4.75On-Site 75 Nickel mg/kg 7.22 0.0951 0.38On-Site 75 Potassium mg/kg 714 76 285On-Site 75 Selenium mg/kg 0.475 U 0.475 0.951On-Site 75 Silver mg/kg 0.0952 U 0.0952 0.476On-Site 75 Sodium mg/kg 55.3 15.2 47.5On-Site 75 Thallium mg/kg 0.057 U 0.057 0.19On-Site 75 Vanadium mg/kg 18.6 0.38 1.9On-Site 75 Zinc mg/kg 23.2 0.38 1.9On-Site 79 Aluminum mg/kg 13000 28.1 93.8On-Site 79 Antimony mg/kg 1.56 U 1.56 4.72On-Site 79 Arsenic mg/kg 3.56 0.188 0.938On-Site 79 Barium mg/kg 179 0.0938 0.375On-Site 79 Beryllium mg/kg 0.583 0.0188 0.0938On-Site 79 Cadmium mg/kg 0.612 0.0188 0.188On-Site 79 Calcium mg/kg 85600 61.9 188On-Site 79 Chromium mg/kg 12.2 0.188 0.563On-Site 79 Cobalt mg/kg 4.99 0.0563 0.188On-Site 79 Copper mg/kg 9.5 0.0619 0.188On-Site 79 Iron mg/kg 13000 46.9 188

Location Type Location Analyte Units Result Lab Data Qualifiers Decision Level (MDL) Detection Limit (PQL)
TABLE C-7. Non-radiological Results by Location for Calendar Year 2010, Sediment
On-Site 79 Lead mg/kg 11.4 0.0938 0.375On-Site 79 Magnesium mg/kg 4260 1.41 4.69On-Site 79 Manganese mg/kg 305 1.88 9.38On-Site 79 Nickel mg/kg 11.9 0.0938 0.375On-Site 79 Potassium mg/kg 2260 15 56.3On-Site 79 Selenium mg/kg 0.469 U 0.469 0.938On-Site 79 Silver mg/kg 0.0943 U 0.0943 0.472On-Site 79 Sodium mg/kg 56.6 15 46.9On-Site 79 Thallium mg/kg 0.133 J 0.0563 0.188On-Site 79 Vanadium mg/kg 18.2 0.375 1.88On-Site 79 Zinc mg/kg 46.6 0.375 1.88On-Site 83 Aluminum mg/kg 16700 27.2 90.7On-Site 83 Antimony mg/kg 1.64 U 1.64 4.96On-Site 83 Arsenic mg/kg 3.03 0.181 0.907On-Site 83 Barium mg/kg 201 0.907 3.63On-Site 83 Beryllium mg/kg 0.595 J 0.181 0.907On-Site 83 Cadmium mg/kg 0.408 0.0181 0.181On-Site 83 Calcium mg/kg 47700 59.9 181On-Site 83 Chromium mg/kg 12.4 1.81 5.44On-Site 83 Cobalt mg/kg 6.89 0.544 1.81On-Site 83 Copper mg/kg 18.7 0.599 1.81On-Site 83 Iron mg/kg 15300 45.4 181On-Site 83 Lead mg/kg 14.2 0.0907 0.363On-Site 83 Magnesium mg/kg 7200 13.6 45.4On-Site 83 Manganese mg/kg 398 1.81 9.07On-Site 83 Nickel mg/kg 14.3 0.907 3.63On-Site 83 Potassium mg/kg 6060 145 544On-Site 83 Selenium mg/kg 0.454 U 0.454 0.907On-Site 83 Silver mg/kg 0.0992 U 0.0992 0.496On-Site 83 Sodium mg/kg 145 U 145 454On-Site 83 Thallium mg/kg 0.18 J 0.0544 0.181On-Site 83 Vanadium mg/kg 28.8 3.63 18.1On-Site 83 Zinc mg/kg 59.7 0.363 1.81

Location Type Location Analyte Units Result Lab Data Qualifiers Decision Level (MDL) Detection Limit (PQL)
TABLE C-7. Non-radiological Results by Location for Calendar Year 2010, Sediment
On-Site 84 Aluminum mg/kg 8090 13.7 45.5On-Site 84 Antimony mg/kg 0.33 U 0.33 1On-Site 84 Arsenic mg/kg 2.18 0.182 0.911On-Site 84 Barium mg/kg 87.6 0.0911 0.364On-Site 84 Beryllium mg/kg 0.468 0.0182 0.0911On-Site 84 Cadmium mg/kg 0.168 J 0.0182 0.182On-Site 84 Calcium mg/kg 25800 30.1 91.1On-Site 84 Chromium mg/kg 9.34 0.182 0.546On-Site 84 Cobalt mg/kg 5.72 0.0546 0.182On-Site 84 Copper mg/kg 9.81 0.0601 0.182On-Site 84 Iron mg/kg 11000 22.8 91.1On-Site 84 Lead mg/kg 8.25 0.0911 0.364On-Site 84 Magnesium mg/kg 4020 1.37 4.55On-Site 84 Manganese mg/kg 241 0.911 4.55On-Site 84 Nickel mg/kg 8.91 0.0911 0.364On-Site 84 Potassium mg/kg 2040 72.9 273On-Site 84 Selenium mg/kg 0.455 U 0.455 0.911On-Site 84 Silver mg/kg 0.1 U 0.1 0.5On-Site 84 Sodium mg/kg 82.4 14.6 45.5On-Site 84 Thallium mg/kg 0.09 J 0.0546 0.182On-Site 84 Vanadium mg/kg 10.7 1.82 9.11On-Site 84 Zinc mg/kg 35 0.364 1.82On-Site 85 Aluminum mg/kg 8850 2.98 9.94On-Site 85 Antimony mg/kg 1.55 U 1.55 4.69On-Site 85 Arsenic mg/kg 2.99 0.199 0.994On-Site 85 Barium mg/kg 141 0.0994 0.398On-Site 85 Beryllium mg/kg 0.505 0.0199 0.0994On-Site 85 Cadmium mg/kg 0.304 0.0199 0.199On-Site 85 Calcium mg/kg 50700 65.6 199On-Site 85 Chromium mg/kg 10.7 0.199 0.596On-Site 85 Cobalt mg/kg 4.59 0.0596 0.199On-Site 85 Copper mg/kg 8.36 0.0656 0.199On-Site 85 Iron mg/kg 11200 49.7 199
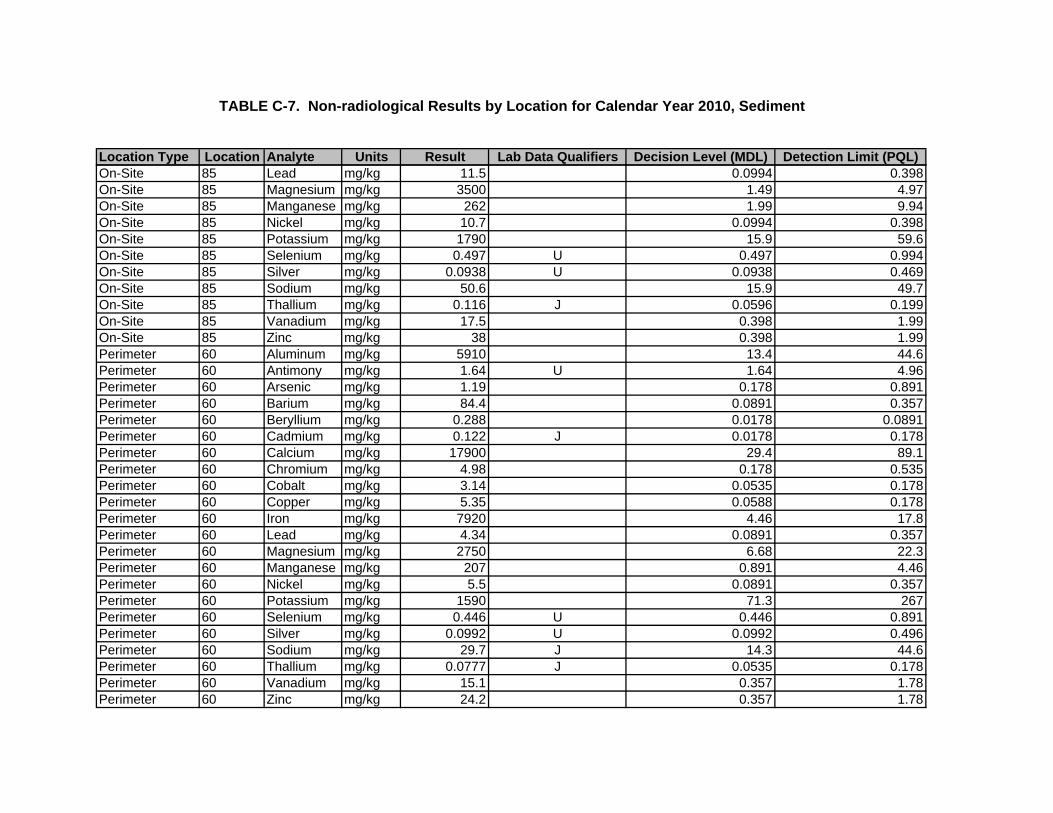
Location Type Location Analyte Units Result Lab Data Qualifiers Decision Level (MDL) Detection Limit (PQL)
TABLE C-7. Non-radiological Results by Location for Calendar Year 2010, Sediment
On-Site 85 Lead mg/kg 11.5 0.0994 0.398On-Site 85 Magnesium mg/kg 3500 1.49 4.97On-Site 85 Manganese mg/kg 262 1.99 9.94On-Site 85 Nickel mg/kg 10.7 0.0994 0.398On-Site 85 Potassium mg/kg 1790 15.9 59.6On-Site 85 Selenium mg/kg 0.497 U 0.497 0.994On-Site 85 Silver mg/kg 0.0938 U 0.0938 0.469On-Site 85 Sodium mg/kg 50.6 15.9 49.7On-Site 85 Thallium mg/kg 0.116 J 0.0596 0.199On-Site 85 Vanadium mg/kg 17.5 0.398 1.99On-Site 85 Zinc mg/kg 38 0.398 1.99Perimeter 60 Aluminum mg/kg 5910 13.4 44.6Perimeter 60 Antimony mg/kg 1.64 U 1.64 4.96Perimeter 60 Arsenic mg/kg 1.19 0.178 0.891Perimeter 60 Barium mg/kg 84.4 0.0891 0.357Perimeter 60 Beryllium mg/kg 0.288 0.0178 0.0891Perimeter 60 Cadmium mg/kg 0.122 J 0.0178 0.178Perimeter 60 Calcium mg/kg 17900 29.4 89.1Perimeter 60 Chromium mg/kg 4.98 0.178 0.535Perimeter 60 Cobalt mg/kg 3.14 0.0535 0.178Perimeter 60 Copper mg/kg 5.35 0.0588 0.178Perimeter 60 Iron mg/kg 7920 4.46 17.8Perimeter 60 Lead mg/kg 4.34 0.0891 0.357Perimeter 60 Magnesium mg/kg 2750 6.68 22.3Perimeter 60 Manganese mg/kg 207 0.891 4.46Perimeter 60 Nickel mg/kg 5.5 0.0891 0.357Perimeter 60 Potassium mg/kg 1590 71.3 267Perimeter 60 Selenium mg/kg 0.446 U 0.446 0.891Perimeter 60 Silver mg/kg 0.0992 U 0.0992 0.496Perimeter 60 Sodium mg/kg 29.7 J 14.3 44.6Perimeter 60 Thallium mg/kg 0.0777 J 0.0535 0.178Perimeter 60 Vanadium mg/kg 15.1 0.357 1.78Perimeter 60 Zinc mg/kg 24.2 0.357 1.78

Location Type Location Analyte Units Result Lab Data Qualifiers Decision Level (MDL) Detection Limit (PQL)
TABLE C-7. Non-radiological Results by Location for Calendar Year 2010, Sediment
Perimeter 65 Aluminum mg/kg 2840 2.76 9.21Perimeter 65 Antimony mg/kg 0.294 U 0.294 0.89Perimeter 65 Arsenic mg/kg 0.85 J 0.184 0.921Perimeter 65 Barium mg/kg 95.2 0.921 3.68Perimeter 65 Beryllium mg/kg 0.202 0.0184 0.0921Perimeter 65 Cadmium mg/kg 0.316 0.0184 0.184Perimeter 65 Calcium mg/kg 37000 30.4 92.1Perimeter 65 Chromium mg/kg 2.48 0.184 0.552Perimeter 65 Cobalt mg/kg 1.92 0.0552 0.184Perimeter 65 Copper mg/kg 4.17 0.0608 0.184Perimeter 65 Iron mg/kg 4630 4.6 18.4Perimeter 65 Lead mg/kg 3.53 0.0921 0.368Perimeter 65 Magnesium mg/kg 2230 6.91 23Perimeter 65 Manganese mg/kg 158 0.184 0.921Perimeter 65 Nickel mg/kg 2.71 0.0921 0.368Perimeter 65 Potassium mg/kg 721 14.7 55.2
Perimeter 65 Selenium mg/kg 0.46 U 0.46 0.921Perimeter 65 Silver mg/kg 0.089 U 0.089 0.445Perimeter 65 Sodium mg/kg 75.8 14.7 46Perimeter 65 Thallium mg/kg 0.0552 U 0.0552 0.184Perimeter 65 Vanadium mg/kg 14.9 0.368 1.84Perimeter 65 Zinc mg/kg 21.4 0.368 1.84Perimeter 73 Aluminum mg/kg 2860 13.9 46.3Perimeter 73 Antimony mg/kg 1.6 U 1.6 4.84Perimeter 73 Arsenic mg/kg 0.447 J 0.185 0.926Perimeter 73 Barium mg/kg 25.4 0.0926 0.37Perimeter 73 Beryllium mg/kg 0.128 0.0185 0.0926Perimeter 73 Cadmium mg/kg 0.083 J 0.0185 0.185Perimeter 73 Calcium mg/kg 30100 30.6 92.6Perimeter 73 Chromium mg/kg 2.08 0.185 0.556Perimeter 73 Cobalt mg/kg 1.75 0.0556 0.185Perimeter 73 Copper mg/kg 3.31 0.0611 0.185

Location Type Location Analyte Units Result Lab Data Qualifiers Decision Level (MDL) Detection Limit (PQL)
TABLE C-7. Non-radiological Results by Location for Calendar Year 2010, Sediment
Perimeter 73 Iron mg/kg 3810 4.63 18.5Perimeter 73 Lead mg/kg 2.2 0.0926 0.37Perimeter 73 Magnesium mg/kg 1630 6.94 23.1Perimeter 73 Manganese mg/kg 123 0.185 0.926Perimeter 73 Nickel mg/kg 3.43 0.0926 0.37Perimeter 73 Potassium mg/kg 772 74.1 278Perimeter 73 Selenium mg/kg 0.463 U 0.463 0.926Perimeter 73 Silver mg/kg 0.0967 U 0.0967 0.484Perimeter 73 Sodium mg/kg 34.4 J 14.8 46.3Perimeter 73 Thallium mg/kg 0.0556 U 0.0556 0.185Perimeter 73 Vanadium mg/kg 7.4 0.37 1.85Perimeter 73 Zinc mg/kg 15.4 0.37 1.85
NOTES: J = Estimated value, the analyte concentration fell above the effective MDL and below the effective PQL. MDL = Method detection limit. mg/kg = milligram per kilogram PQL = Practical quantitation limit. U = The analyte was analyzed for, but not detected. For organic and inorganic analytes the result is less than the effective MDL concentration.

Location Type Location Analyte Sample ID Units Result Qualifier Decision Level (MDL) Detection Limit (PQL)On-Site 02NE Aluminum 088761-001 mg/kg 6630.00 2.92 9.75On-Site 02NE Aluminum 088761-002 mg/kg 6450.00 2.81 9.38On-Site 02NE Aluminum 088761-003 mg/kg 6460.00 2.88 9.62
Aluminum Average 6513.33Aluminum StdDev 101.16CV (%) 1.55
On-Site 02NE Antimony 088761-001 mg/kg 1.40 U 1.40 4.25On-Site 02NE Antimony 088761-002 mg/kg 1.60 U 1.60 4.84On-Site 02NE Antimony 088761-003 mg/kg 1.62 U 1.62 4.91
Antimony Average 1.54Antimony StdDev 0.12CV (%) 7.90
On-Site 02NE Arsenic 088761-001 mg/kg 1.51 0.20 0.98On-Site 02NE Arsenic 088761-002 mg/kg 1.42 0.19 0.94On-Site 02NE Arsenic 088761-003 mg/kg 1.46 0.19 0.96
Arsenic Average 1.46Arsenic StdDev 0.05CV (%) 3.08
On-Site 02NE Barium 088761-001 mg/kg 66.60 0.10 0.39On-Site 02NE Barium 088761-002 mg/kg 66.40 0.09 0.38On-Site 02NE Barium 088761-003 mg/kg 67.00 0.10 0.39
Barium Average 66.67Barium StdDev 0.31CV (%) 0.46
On-Site 02NE Beryllium 088761-001 mg/kg 0.34 0.02 0.10On-Site 02NE Beryllium 088761-002 mg/kg 0.34 0.02 0.09On-Site 02NE Beryllium 088761-003 mg/kg 0.34 0.02 0.10
Beryllium Average 0.34Beryllium StdDev 0.00CV (%) 0.78
On-Site 02NE Cadmium 088761-001 mg/kg 0.29 0.02 0.20On-Site 02NE Cadmium 088761-002 mg/kg 0.28 0.02 0.19On-Site 02NE Cadmium 088761-003 mg/kg 0.22 0.02 0.19
Cadmium Average 0.26Cadmium StdDev 0.04CV (%) 14.67
TABLE C-8. Non-radiological Replicate Results for Calendar Year 2010, Soil
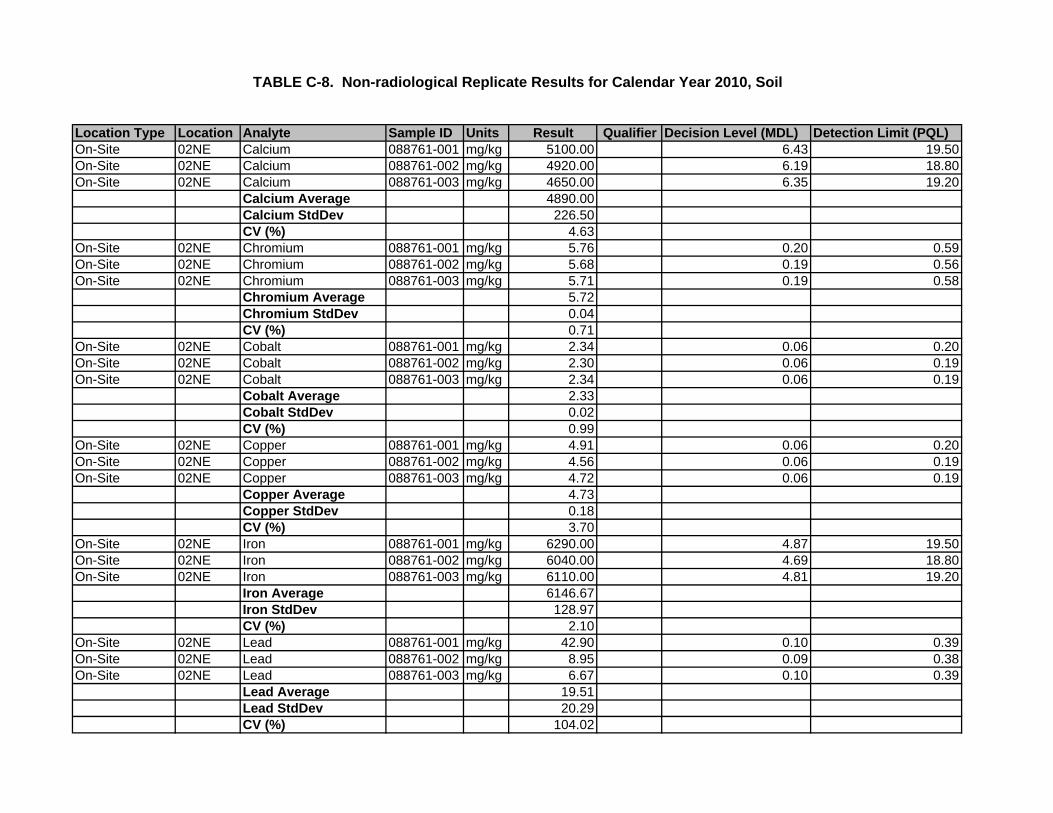
Location Type Location Analyte Sample ID Units Result Qualifier Decision Level (MDL) Detection Limit (PQL)
TABLE C-8. Non-radiological Replicate Results for Calendar Year 2010, Soil
On-Site 02NE Calcium 088761-001 mg/kg 5100.00 6.43 19.50On-Site 02NE Calcium 088761-002 mg/kg 4920.00 6.19 18.80On-Site 02NE Calcium 088761-003 mg/kg 4650.00 6.35 19.20
Calcium Average 4890.00Calcium StdDev 226.50CV (%) 4.63
On-Site 02NE Chromium 088761-001 mg/kg 5.76 0.20 0.59On-Site 02NE Chromium 088761-002 mg/kg 5.68 0.19 0.56On-Site 02NE Chromium 088761-003 mg/kg 5.71 0.19 0.58
Chromium Average 5.72Chromium StdDev 0.04CV (%) 0.71
On-Site 02NE Cobalt 088761-001 mg/kg 2.34 0.06 0.20On-Site 02NE Cobalt 088761-002 mg/kg 2.30 0.06 0.19On-Site 02NE Cobalt 088761-003 mg/kg 2.34 0.06 0.19
Cobalt Average 2.33Cobalt StdDev 0.02CV (%) 0.99
On-Site 02NE Copper 088761-001 mg/kg 4.91 0.06 0.20On-Site 02NE Copper 088761-002 mg/kg 4.56 0.06 0.19On-Site 02NE Copper 088761-003 mg/kg 4.72 0.06 0.19
Copper Average 4.73Copper StdDev 0.18CV (%) 3.70
On-Site 02NE Iron 088761-001 mg/kg 6290.00 4.87 19.50On-Site 02NE Iron 088761-002 mg/kg 6040.00 4.69 18.80On-Site 02NE Iron 088761-003 mg/kg 6110.00 4.81 19.20
Iron Average 6146.67Iron StdDev 128.97CV (%) 2.10
On-Site 02NE Lead 088761-001 mg/kg 42.90 0.10 0.39On-Site 02NE Lead 088761-002 mg/kg 8.95 0.09 0.38On-Site 02NE Lead 088761-003 mg/kg 6.67 0.10 0.39
Lead Average 19.51Lead StdDev 20.29CV (%) 104.02
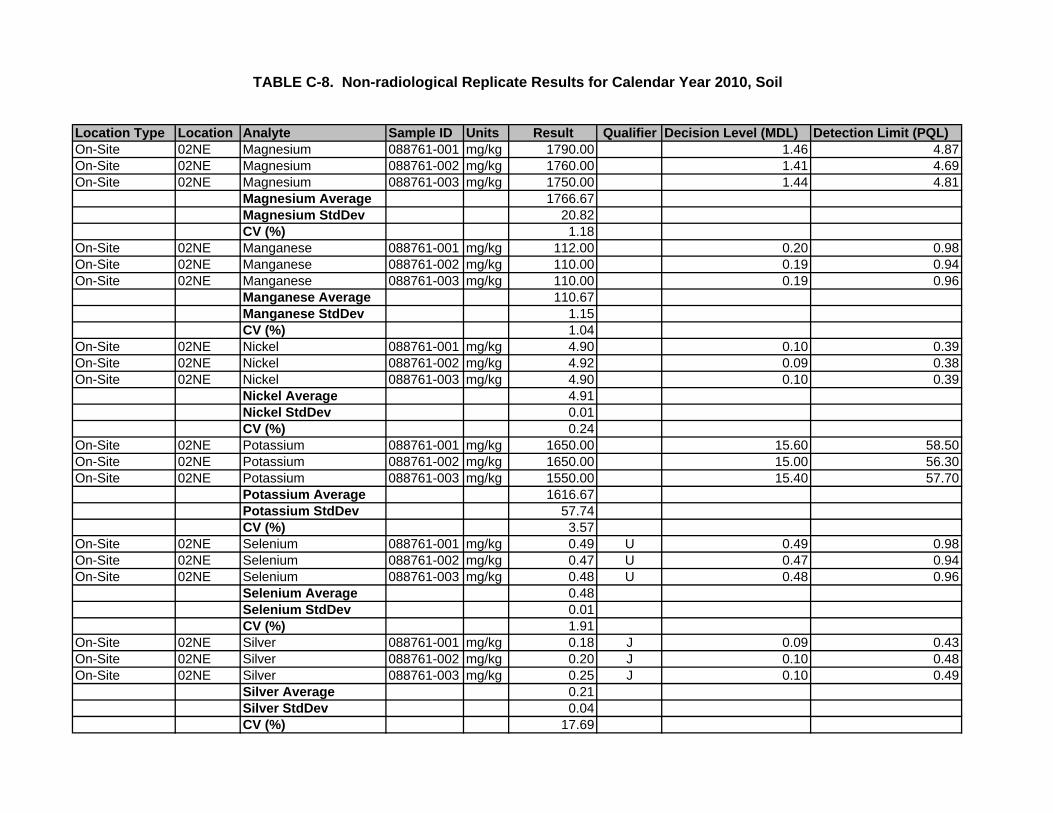
Location Type Location Analyte Sample ID Units Result Qualifier Decision Level (MDL) Detection Limit (PQL)
TABLE C-8. Non-radiological Replicate Results for Calendar Year 2010, Soil
On-Site 02NE Magnesium 088761-001 mg/kg 1790.00 1.46 4.87On-Site 02NE Magnesium 088761-002 mg/kg 1760.00 1.41 4.69On-Site 02NE Magnesium 088761-003 mg/kg 1750.00 1.44 4.81
Magnesium Average 1766.67Magnesium StdDev 20.82CV (%) 1.18
On-Site 02NE Manganese 088761-001 mg/kg 112.00 0.20 0.98On-Site 02NE Manganese 088761-002 mg/kg 110.00 0.19 0.94On-Site 02NE Manganese 088761-003 mg/kg 110.00 0.19 0.96
Manganese Average 110.67Manganese StdDev 1.15CV (%) 1.04
On-Site 02NE Nickel 088761-001 mg/kg 4.90 0.10 0.39On-Site 02NE Nickel 088761-002 mg/kg 4.92 0.09 0.38On-Site 02NE Nickel 088761-003 mg/kg 4.90 0.10 0.39
Nickel Average 4.91Nickel StdDev 0.01CV (%) 0.24
On-Site 02NE Potassium 088761-001 mg/kg 1650.00 15.60 58.50On-Site 02NE Potassium 088761-002 mg/kg 1650.00 15.00 56.30On-Site 02NE Potassium 088761-003 mg/kg 1550.00 15.40 57.70
Potassium Average 1616.67Potassium StdDev 57.74CV (%) 3.57
On-Site 02NE Selenium 088761-001 mg/kg 0.49 U 0.49 0.98On-Site 02NE Selenium 088761-002 mg/kg 0.47 U 0.47 0.94On-Site 02NE Selenium 088761-003 mg/kg 0.48 U 0.48 0.96
Selenium Average 0.48Selenium StdDev 0.01CV (%) 1.91
On-Site 02NE Silver 088761-001 mg/kg 0.18 J 0.09 0.43On-Site 02NE Silver 088761-002 mg/kg 0.20 J 0.10 0.48On-Site 02NE Silver 088761-003 mg/kg 0.25 J 0.10 0.49
Silver Average 0.21Silver StdDev 0.04CV (%) 17.69

Location Type Location Analyte Sample ID Units Result Qualifier Decision Level (MDL) Detection Limit (PQL)
TABLE C-8. Non-radiological Replicate Results for Calendar Year 2010, Soil
On-Site 02NE Sodium 088761-001 mg/kg 22.60 J 15.60 48.70On-Site 02NE Sodium 088761-002 mg/kg 21.50 J 15.00 46.90On-Site 02NE Sodium 088761-003 mg/kg 24.10 J 15.40 48.10
Sodium Average 22.73Sodium StdDev 1.31CV (%) 5.74
On-Site 02NE Thallium 088761-001 mg/kg 0.08 J 0.06 0.20On-Site 02NE Thallium 088761-002 mg/kg 0.08 J 0.06 0.19On-Site 02NE Thallium 088761-003 mg/kg 0.07 J 0.06 0.19
Thallium Average 0.08Thallium StdDev 0.00CV (%) 5.43
On-Site 02NE Vanadium 088761-001 mg/kg 10.70 0.39 1.95On-Site 02NE Vanadium 088761-002 mg/kg 10.20 0.38 1.88On-Site 02NE Vanadium 088761-003 mg/kg 10.60 0.39 1.92
Vanadium Average 10.50Vanadium StdDev 0.26CV (%) 2.52
On-Site 02NE Zinc 088761-001 mg/kg 22.30 0.39 1.95On-Site 02NE Zinc 088761-002 mg/kg 22.40 0.38 1.88On-Site 02NE Zinc 088761-003 mg/kg 20.30 0.39 1.92
Zinc Average 21.67Zinc StdDev 1.18CV (%) 5.47
On-Site 33 Aluminum 088796-001 mg/kg 14100.00 26.90 89.80On-Site 33 Aluminum 088796-002 mg/kg 12900.00 29.10 97.10On-Site 33 Aluminum 088796-003 mg/kg 12100.00 30.00 100.00
Aluminum Average 13033.33Aluminum StdDev 1006.64CV (%) 7.72
On-Site 33 Antimony 088796-001 mg/kg 0.33 U 0.33 0.99On-Site 33 Antimony 088796-002 mg/kg 1.57 U 1.57 4.74On-Site 33 Antimony 088796-003 mg/kg 1.65 U 1.65 5.00
Antimony Average 1.18Antimony StdDev 0.74CV (%) 62.74

Location Type Location Analyte Sample ID Units Result Qualifier Decision Level (MDL) Detection Limit (PQL)
TABLE C-8. Non-radiological Replicate Results for Calendar Year 2010, Soil
On-Site 33 Arsenic 088796-001 mg/kg 6.11 0.18 0.90On-Site 33 Arsenic 088796-002 mg/kg 9.97 0.19 0.97On-Site 33 Arsenic 088796-003 mg/kg 23.00 0.20 1.00
Arsenic Average 13.03Arsenic StdDev 8.85CV (%) 67.94
On-Site 33 Barium 088796-001 mg/kg 120.00 0.09 0.36On-Site 33 Barium 088796-002 mg/kg 151.00 0.10 0.39On-Site 33 Barium 088796-003 mg/kg 120.00 0.10 0.40
Barium Average 130.33Barium StdDev 17.90CV (%) 13.73
On-Site 33 Beryllium 088796-001 mg/kg 0.81 0.02 0.09On-Site 33 Beryllium 088796-002 mg/kg 1.00 0.02 0.10On-Site 33 Beryllium 088796-003 mg/kg 1.95 0.02 0.10
Beryllium Average 1.25Beryllium StdDev 0.61CV (%) 49.01
On-Site 33 Cadmium 088796-001 mg/kg 0.39 0.02 0.18On-Site 33 Cadmium 088796-002 mg/kg 0.38 0.02 0.19On-Site 33 Cadmium 088796-003 mg/kg 0.34 0.02 0.20
Cadmium Average 0.37Cadmium StdDev 0.03CV (%) 7.55
On-Site 33 Calcium 088796-001 mg/kg 49000.00 59.20 180.00On-Site 33 Calcium 088796-002 mg/kg 59000.00 64.10 194.00On-Site 33 Calcium 088796-003 mg/kg 49500.00 66.00 200.00
Calcium Average 52500.00Calcium StdDev 5634.71CV (%) 10.73
On-Site 33 Chromium 088796-001 mg/kg 11.20 0.18 0.54On-Site 33 Chromium 088796-002 mg/kg 11.50 0.19 0.58On-Site 33 Chromium 088796-003 mg/kg 10.40 0.20 0.60
Chromium Average 11.03Chromium StdDev 0.57CV (%) 5.15

Location Type Location Analyte Sample ID Units Result Qualifier Decision Level (MDL) Detection Limit (PQL)
TABLE C-8. Non-radiological Replicate Results for Calendar Year 2010, Soil
On-Site 33 Cobalt 088796-001 mg/kg 4.63 0.05 0.18On-Site 33 Cobalt 088796-002 mg/kg 6.60 0.06 0.19On-Site 33 Cobalt 088796-003 mg/kg 8.26 0.06 0.20
Cobalt Average 6.50Cobalt StdDev 1.82CV (%) 27.97
On-Site 33 Copper 088796-001 mg/kg 8.57 0.06 0.18On-Site 33 Copper 088796-002 mg/kg 9.22 0.06 0.19On-Site 33 Copper 088796-003 mg/kg 8.87 0.07 0.20
Copper Average 8.89Copper StdDev 0.33CV (%) 3.66
On-Site 33 Iron 088796-001 mg/kg 11800.00 44.90 180.00On-Site 33 Iron 088796-002 mg/kg 13600.00 48.50 194.00On-Site 33 Iron 088796-003 mg/kg 13700.00 50.00 200.00
Iron Average 13033.33Iron StdDev 1069.27CV (%) 8.20
On-Site 33 Lead 088796-001 mg/kg 12.20 0.09 0.36On-Site 33 Lead 088796-002 mg/kg 11.80 0.10 0.39On-Site 33 Lead 088796-003 mg/kg 12.70 0.10 0.40
Lead Average 12.23Lead StdDev 0.45CV (%) 3.69
On-Site 33 Magnesium 088796-001 mg/kg 5520.00 13.50 44.90On-Site 33 Magnesium 088796-002 mg/kg 5570.00 14.60 48.50On-Site 33 Magnesium 088796-003 mg/kg 5840.00 15.00 50.00
Magnesium Average 5643.33Magnesium StdDev 172.14CV (%) 3.05
On-Site 33 Manganese 088796-001 mg/kg 310.00 1.80 8.98On-Site 33 Manganese 088796-002 mg/kg 445.00 1.94 9.71On-Site 33 Manganese 088796-003 mg/kg 506.00 2.00 10.00
Manganese Average 420.33Manganese StdDev 100.30CV (%) 23.86

Location Type Location Analyte Sample ID Units Result Qualifier Decision Level (MDL) Detection Limit (PQL)
TABLE C-8. Non-radiological Replicate Results for Calendar Year 2010, Soil
On-Site 33 Nickel 088796-001 mg/kg 10.50 0.09 0.36On-Site 33 Nickel 088796-002 mg/kg 14.00 0.10 0.39On-Site 33 Nickel 088796-003 mg/kg 15.20 0.10 0.40
Nickel Average 13.23Nickel StdDev 2.44CV (%) 18.45
On-Site 33 Potassium 088796-001 mg/kg 3890.00 144.00 539.00On-Site 33 Potassium 088796-002 mg/kg 3410.00 155.00 583.00On-Site 33 Potassium 088796-003 mg/kg 3470.00 160.00 600.00
Potassium Average 3590.00Potassium StdDev 261.53CV (%) 7.29
On-Site 33 Selenium 088796-001 mg/kg 0.45 U 0.45 0.90On-Site 33 Selenium 088796-002 mg/kg 0.49 U 0.49 0.97On-Site 33 Selenium 088796-003 mg/kg 0.50 U 0.50 1.00
Selenium Average 0.48Selenium StdDev 0.03CV (%) 5.48
On-Site 33 Silver 088796-001 mg/kg 0.10 U 0.10 0.50On-Site 33 Silver 088796-002 mg/kg 0.09 U 0.09 0.47On-Site 33 Silver 088796-003 mg/kg 0.10 U 0.10 0.50
Silver Average 0.10Silver StdDev 0.00CV (%) 2.80
On-Site 33 Sodium 088796-001 mg/kg 141.00 14.40 44.90On-Site 33 Sodium 088796-002 mg/kg 249.00 15.50 48.50On-Site 33 Sodium 088796-003 mg/kg 130.00 16.00 50.00
Sodium Average 173.33Sodium StdDev 65.76CV (%) 37.94
On-Site 33 Thallium 088796-001 mg/kg 0.24 0.05 0.18On-Site 33 Thallium 088796-002 mg/kg 0.16 J 0.06 0.19On-Site 33 Thallium 088796-003 mg/kg 0.18 J 0.06 0.20
Thallium Average 0.20Thallium StdDev 0.04CV (%) 20.84

Location Type Location Analyte Sample ID Units Result Qualifier Decision Level (MDL) Detection Limit (PQL)
TABLE C-8. Non-radiological Replicate Results for Calendar Year 2010, Soil
On-Site 33 Vanadium 088796-001 mg/kg 23.70 3.59 18.00On-Site 33 Vanadium 088796-002 mg/kg 25.00 3.88 19.40On-Site 33 Vanadium 088796-003 mg/kg 26.50 4.00 20.00
Vanadium Average 25.07Vanadium StdDev 1.40CV (%) 5.59
On-Site 33 Zinc 088796-001 mg/kg 53.20 0.36 1.80On-Site 33 Zinc 088796-002 mg/kg 49.00 0.39 1.94On-Site 33 Zinc 088796-003 mg/kg 60.80 0.40 2.00
Zinc Average 54.33Zinc StdDev 5.98CV (%) 11.01
On-Site 53 Aluminum 088756-001 mg/kg 11800.00 13.30 44.30On-Site 53 Aluminum 088756-002 mg/kg 10600.00 27.00 90.10On-Site 53 Aluminum 088756-003 mg/kg 8200.00 2.70 8.99
Aluminum Average 10200.00Aluminum StdDev 1833.03CV (%) 17.97
On-Site 53 Antimony 088756-001 mg/kg 0.32 U 0.32 0.98On-Site 53 Antimony 088756-002 mg/kg 0.32 U 0.32 0.96On-Site 53 Antimony 088756-003 mg/kg 0.32 U 0.32 0.98
Antimony Average 0.32Antimony StdDev 0.00CV (%) 1.26
On-Site 53 Arsenic 088756-001 mg/kg 1.97 0.18 0.89On-Site 53 Arsenic 088756-002 mg/kg 1.69 0.18 0.90On-Site 53 Arsenic 088756-003 mg/kg 1.87 0.18 0.90
Arsenic Average 1.84Arsenic StdDev 0.14CV (%) 7.70
On-Site 53 Barium 088756-001 mg/kg 70.60 0.09 0.36On-Site 53 Barium 088756-002 mg/kg 58.60 0.09 0.36On-Site 53 Barium 088756-003 mg/kg 51.20 0.09 0.36
Barium Average 60.13Barium StdDev 9.79CV (%) 16.28

Location Type Location Analyte Sample ID Units Result Qualifier Decision Level (MDL) Detection Limit (PQL)
TABLE C-8. Non-radiological Replicate Results for Calendar Year 2010, Soil
On-Site 53 Beryllium 088756-001 mg/kg 0.42 0.02 0.09On-Site 53 Beryllium 088756-002 mg/kg 0.35 0.02 0.09On-Site 53 Beryllium 088756-003 mg/kg 0.31 0.02 0.09
Beryllium Average 0.36Beryllium StdDev 0.06CV (%) 15.34
On-Site 53 Cadmium 088756-001 mg/kg 0.15 J 0.02 0.18On-Site 53 Cadmium 088756-002 mg/kg 0.17 J 0.02 0.18On-Site 53 Cadmium 088756-003 mg/kg 0.14 J 0.02 0.18
Cadmium Average 0.16Cadmium StdDev 0.02CV (%) 11.95
On-Site 53 Calcium 088756-001 mg/kg 3650.00 5.85 17.70On-Site 53 Calcium 088756-002 mg/kg 3890.00 5.95 18.00On-Site 53 Calcium 088756-003 mg/kg 1780.00 5.94 18.00
Calcium Average 3106.67Calcium StdDev 1155.18CV (%) 37.18
On-Site 53 Chromium 088756-001 mg/kg 9.45 0.18 0.53On-Site 53 Chromium 088756-002 mg/kg 6.73 0.18 0.54On-Site 53 Chromium 088756-003 mg/kg 6.55 0.18 0.54
Chromium Average 7.58Chromium StdDev 1.62CV (%) 21.45
On-Site 53 Cobalt 088756-001 mg/kg 3.01 0.05 0.18On-Site 53 Cobalt 088756-002 mg/kg 2.77 0.05 0.18On-Site 53 Cobalt 088756-003 mg/kg 2.46 0.05 0.18
Cobalt Average 2.75Cobalt StdDev 0.28CV (%) 10.04
On-Site 53 Copper 088756-001 mg/kg 5.42 0.06 0.18On-Site 53 Copper 088756-002 mg/kg 5.73 0.06 0.18On-Site 53 Copper 088756-003 mg/kg 4.74 0.06 0.18
Copper Average 5.30Copper StdDev 0.51CV (%) 9.56

Location Type Location Analyte Sample ID Units Result Qualifier Decision Level (MDL) Detection Limit (PQL)
TABLE C-8. Non-radiological Replicate Results for Calendar Year 2010, Soil
On-Site 53 Iron 088756-001 mg/kg 8360.00 B 4.43 17.70On-Site 53 Iron 088756-002 mg/kg 7110.00 B 4.50 18.00On-Site 53 Iron 088756-003 mg/kg 6590.00 B 4.50 18.00
Iron Average 7353.33Iron StdDev 909.74CV (%) 12.37
On-Site 53 Lead 088756-001 mg/kg 12.90 0.09 0.36On-Site 53 Lead 088756-002 mg/kg 7.80 0.09 0.36On-Site 53 Lead 088756-003 mg/kg 9.80 0.09 0.36
Lead Average 10.17Lead StdDev 2.57CV (%) 25.28
On-Site 53 Magnesium 088756-001 mg/kg 2290.00 1.33 4.43On-Site 53 Magnesium 088756-002 mg/kg 1980.00 1.35 4.50On-Site 53 Magnesium 088756-003 mg/kg 1590.00 1.35 4.50
Magnesium Average 1953.33Magnesium StdDev 350.76CV (%) 17.96
On-Site 53 Manganese 088756-001 mg/kg 135.00 0.18 0.89On-Site 53 Manganese 088756-002 mg/kg 108.00 0.18 0.90On-Site 53 Manganese 088756-003 mg/kg 105.00 0.18 0.90
Manganese Average 116.00Manganese StdDev 16.52CV (%) 14.24
On-Site 53 Nickel 088756-001 mg/kg 5.84 0.09 0.36On-Site 53 Nickel 088756-002 mg/kg 5.02 0.09 0.36On-Site 53 Nickel 088756-003 mg/kg 4.67 0.09 0.36
Nickel Average 5.18Nickel StdDev 0.60CV (%) 11.60
On-Site 53 Potassium 088756-001 mg/kg 2050.00 14.20 53.20On-Site 53 Potassium 088756-002 mg/kg 1830.00 14.40 54.10On-Site 53 Potassium 088756-003 mg/kg 1540.00 14.40 54.00
Potassium Average 1806.67Potassium StdDev 255.80CV (%) 14.16

Location Type Location Analyte Sample ID Units Result Qualifier Decision Level (MDL) Detection Limit (PQL)
TABLE C-8. Non-radiological Replicate Results for Calendar Year 2010, Soil
On-Site 53 Selenium 088756-001 mg/kg 0.44 U 0.44 0.89On-Site 53 Selenium 088756-002 mg/kg 0.45 U 0.45 0.90On-Site 53 Selenium 088756-003 mg/kg 0.45 U 0.45 0.90
Selenium Average 0.45Selenium StdDev 0.00CV (%) 0.90
On-Site 53 Silver 088756-001 mg/kg 0.12 J 0.10 0.49On-Site 53 Silver 088756-002 mg/kg 0.11 J 0.10 0.48On-Site 53 Silver 088756-003 mg/kg 0.12 J 0.10 0.49
Silver Average 0.12Silver StdDev 0.01CV (%) 7.37
On-Site 53 Sodium 088756-001 mg/kg 39.60 J 14.20 44.30On-Site 53 Sodium 088756-002 mg/kg 41.30 J 14.40 45.00On-Site 53 Sodium 088756-003 mg/kg 39.20 J 14.40 45.00
Sodium Average 40.03Sodium StdDev 1.12CV (%) 2.79
On-Site 53 Thallium 088756-001 mg/kg 0.10 J 0.05 0.18On-Site 53 Thallium 088756-002 mg/kg 0.09 J 0.05 0.18On-Site 53 Thallium 088756-003 mg/kg 0.07 J 0.05 0.18
Thallium Average 0.09Thallium StdDev 0.01CV (%) 14.65
On-Site 53 Vanadium 088756-001 mg/kg 16.20 0.36 1.77On-Site 53 Vanadium 088756-002 mg/kg 14.30 0.36 1.80On-Site 53 Vanadium 088756-003 mg/kg 13.60 0.36 1.80
Vanadium Average 14.70Vanadium StdDev 1.35CV (%) 9.15
On-Site 53 Zinc 088756-001 mg/kg 20.10 0.38 1.88On-Site 53 Zinc 088756-002 mg/kg 21.30 0.36 1.78On-Site 53 Zinc 088756-003 mg/kg 22.50 0.37 1.82
Zinc Average 21.30Zinc StdDev 1.20CV (%) 5.63

Location Type Location Analyte Sample ID Units Result Qualifier Decision Level (MDL) Detection Limit (PQL)
TABLE C-8. Non-radiological Replicate Results for Calendar Year 2010, Soil
Perimeter 64 Aluminum 088807-001 mg/kg 13400.00 14.40 47.90Perimeter 64 Aluminum 088807-002 mg/kg 15900.00 14.40 48.00Perimeter 64 Aluminum 088807-003 mg/kg 14800.00 13.50 45.00
Aluminum Average 14700.00Aluminum StdDev 1253.00CV (%) 8.52
Perimeter 64 Antimony 088807-001 mg/kg 1.64 U 1.64 4.96Perimeter 64 Antimony 088807-002 mg/kg 0.40 J 0.33 0.99Perimeter 64 Antimony 088807-003 mg/kg 1.50 U 1.50 4.55
Antimony Average 1.18Antimony StdDev 0.68CV (%) 57.36
Perimeter 64 Arsenic 088807-001 mg/kg 1.75 0.19 0.96Perimeter 64 Arsenic 088807-002 mg/kg 1.89 0.19 0.96Perimeter 64 Arsenic 088807-003 mg/kg 1.73 0.18 0.90
Arsenic Average 1.79Arsenic StdDev 0.09CV (%) 4.87
Perimeter 64 Barium 088807-001 mg/kg 137.00 0.96 3.83Perimeter 64 Barium 088807-002 mg/kg 112.00 0.10 0.38Perimeter 64 Barium 088807-003 mg/kg 99.30 0.09 0.36
Barium Average 116.10Barium StdDev 19.18CV (%) 16.52
Perimeter 64 Beryllium 088807-001 mg/kg 0.61 0.10 0.48Perimeter 64 Beryllium 088807-002 mg/kg 0.67 0.10 0.48Perimeter 64 Beryllium 088807-003 mg/kg 0.52 0.09 0.45
Beryllium Average 0.60Beryllium StdDev 0.08CV (%) 12.79
Perimeter 64 Cadmium 088807-001 mg/kg 0.41 0.02 0.19Perimeter 64 Cadmium 088807-002 mg/kg 0.46 0.02 0.19Perimeter 64 Cadmium 088807-003 mg/kg 0.32 0.02 0.18
Cadmium Average 0.40Cadmium StdDev 0.07CV (%) 17.39

Location Type Location Analyte Sample ID Units Result Qualifier Decision Level (MDL) Detection Limit (PQL)
TABLE C-8. Non-radiological Replicate Results for Calendar Year 2010, Soil
Perimeter 64 Calcium 088807-001 mg/kg 22800.00 31.60 95.80Perimeter 64 Calcium 088807-002 mg/kg 21300.00 31.70 96.00Perimeter 64 Calcium 088807-003 mg/kg 34000.00 29.70 89.90
Calcium Average 26033.33Calcium StdDev 6939.98CV (%) 26.66
Perimeter 64 Chromium 088807-001 mg/kg 8.98 0.96 2.87Perimeter 64 Chromium 088807-002 mg/kg 10.90 0.96 2.88Perimeter 64 Chromium 088807-003 mg/kg 9.08 0.90 2.70
Chromium Average 9.65Chromium StdDev 1.08CV (%) 11.20
Perimeter 64 Cobalt 088807-001 mg/kg 9.39 0.29 0.96Perimeter 64 Cobalt 088807-002 mg/kg 10.90 0.29 0.96Perimeter 64 Cobalt 088807-003 mg/kg 8.09 0.27 0.90
Cobalt Average 9.46Cobalt StdDev 1.41CV (%) 14.87
Perimeter 64 Copper 088807-001 mg/kg 14.70 0.32 0.96Perimeter 64 Copper 088807-002 mg/kg 17.20 0.32 0.96Perimeter 64 Copper 088807-003 mg/kg 12.20 0.30 0.90
Copper Average 14.70Copper StdDev 2.50CV (%) 17.01
Perimeter 64 Iron 088807-001 mg/kg 21100.00 23.90 95.80Perimeter 64 Iron 088807-002 mg/kg 24700.00 24.00 96.00Perimeter 64 Iron 088807-003 mg/kg 18200.00 22.50 89.90
Iron Average 21333.33Iron StdDev 3256.28CV (%) 15.26
Perimeter 64 Lead 088807-001 mg/kg 8.91 0.10 0.38Perimeter 64 Lead 088807-002 mg/kg 12.30 0.10 0.38Perimeter 64 Lead 088807-003 mg/kg 6.93 0.09 0.36
Lead Average 9.38Lead StdDev 2.72CV (%) 28.95

Location Type Location Analyte Sample ID Units Result Qualifier Decision Level (MDL) Detection Limit (PQL)
TABLE C-8. Non-radiological Replicate Results for Calendar Year 2010, Soil
Perimeter 64 Magnesium 088807-001 mg/kg 8180.00 7.18 23.90Perimeter 64 Magnesium 088807-002 mg/kg 9300.00 7.20 24.00Perimeter 64 Magnesium 088807-003 mg/kg 7340.00 6.74 22.50
Magnesium Average 8273.33Magnesium StdDev 983.33CV (%) 11.89
Perimeter 64 Manganese 088807-001 mg/kg 622.00 0.96 4.79Perimeter 64 Manganese 088807-002 mg/kg 695.00 0.96 4.80Perimeter 64 Manganese 088807-003 mg/kg 445.00 0.90 4.50
Manganese Average 587.33Manganese StdDev 128.55CV (%) 21.89
Perimeter 64 Nickel 088807-001 mg/kg 11.30 0.48 1.92Perimeter 64 Nickel 088807-002 mg/kg 13.20 0.48 1.92Perimeter 64 Nickel 088807-003 mg/kg 10.50 0.45 1.80
Nickel Average 11.67Nickel StdDev 1.39CV (%) 11.89
Perimeter 64 Potassium 088807-001 mg/kg 3480.00 76.60 287.00Perimeter 64 Potassium 088807-002 mg/kg 3710.00 76.80 288.00Perimeter 64 Potassium 088807-003 mg/kg 4220.00 71.90 270.00
Potassium Average 3803.33Potassium StdDev 378.73CV (%) 9.96
Perimeter 64 Selenium 088807-001 mg/kg 0.48 U 0.48 0.96Perimeter 64 Selenium 088807-002 mg/kg 0.48 U 0.48 0.96Perimeter 64 Selenium 088807-003 mg/kg 0.45 U 0.45 0.90
Selenium Average 0.47Selenium StdDev 0.02CV (%) 3.63
Perimeter 64 Silver 088807-001 mg/kg 0.50 U 0.50 2.48Perimeter 64 Silver 088807-002 mg/kg 0.49 U 0.49 2.47Perimeter 64 Silver 088807-003 mg/kg 0.46 U 0.46 2.27
Silver Average 0.48Silver StdDev 0.02CV (%) 4.75

Location Type Location Analyte Sample ID Units Result Qualifier Decision Level (MDL) Detection Limit (PQL)
TABLE C-8. Non-radiological Replicate Results for Calendar Year 2010, Soil
Perimeter 64 Sodium 088807-001 mg/kg 77.00 J 76.60 239.00Perimeter 64 Sodium 088807-002 mg/kg 91.60 J 76.80 240.00Perimeter 64 Sodium 088807-003 mg/kg 84.80 J 71.90 225.00
Sodium Average 84.47Sodium StdDev 7.31CV (%) 8.65
Perimeter 64 Thallium 088807-001 mg/kg 0.14 J 0.06 0.19Perimeter 64 Thallium 088807-002 mg/kg 0.15 J 0.06 0.19Perimeter 64 Thallium 088807-003 mg/kg 0.13 J 0.05 0.18
Thallium Average 0.14Thallium StdDev 0.01CV (%) 5.59
Perimeter 64 Vanadium 088807-001 mg/kg 31.90 1.92 9.58Perimeter 64 Vanadium 088807-002 mg/kg 36.50 1.92 9.60Perimeter 64 Vanadium 088807-003 mg/kg 30.40 1.80 8.99
Vanadium Average 32.93Vanadium StdDev 3.18CV (%) 9.65
Perimeter 64 Zinc 088807-001 mg/kg 67.80 0.38 1.92Perimeter 64 Zinc 088807-002 mg/kg 93.30 0.38 1.92Perimeter 64 Zinc 088807-003 mg/kg 58.10 0.36 1.80
Zinc Average 73.07Zinc StdDev 18.18CV (%) 24.88
NOTES: CV = coefficient of variation J = Estimated value, the analyte concentration fell above the effective MDL and below the effective PQL. MDL = Method detection limit. mg/kg = milligram per kilogram PQL = Practical quantitation limit. Std Dev = standard deviation U = The analyte was analyzed for, but not detected. For organic and inorganic analytes the result is less than the effective MDL concentration.
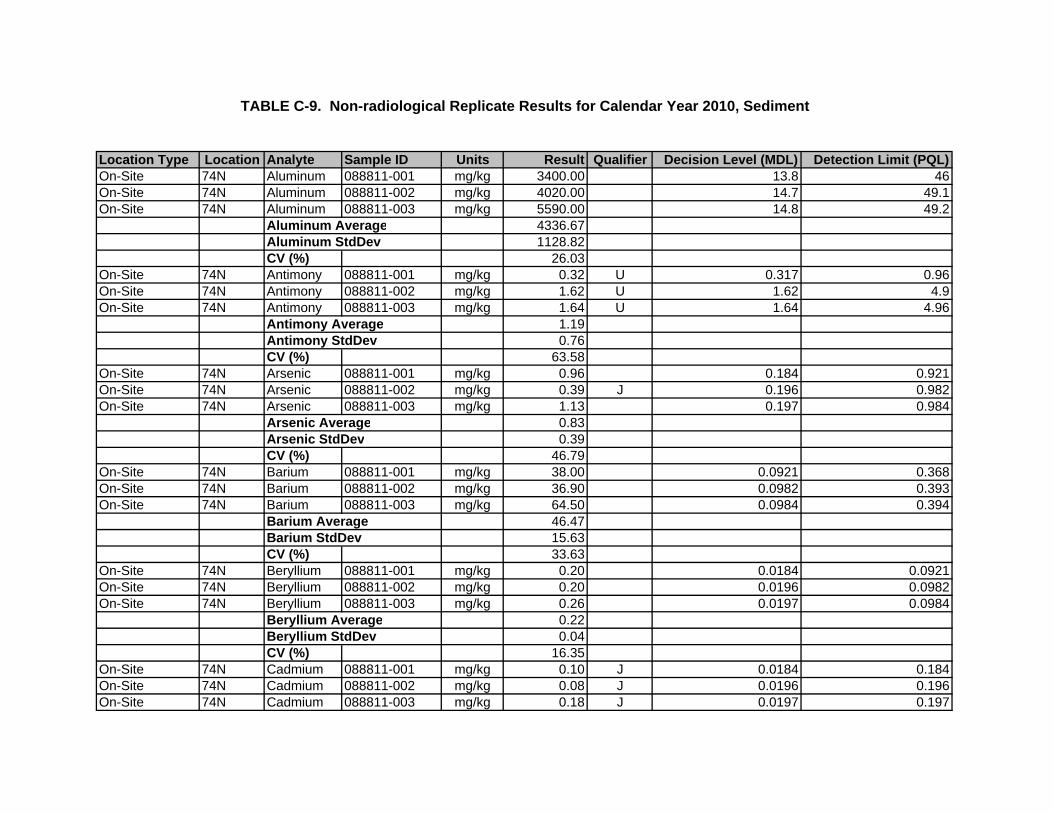
Location Type Location Analyte Sample ID Units Result Qualifier Decision Level (MDL) Detection Limit (PQL)On-Site 74N Aluminum 088811-001 mg/kg 3400.00 13.8 46On-Site 74N Aluminum 088811-002 mg/kg 4020.00 14.7 49.1On-Site 74N Aluminum 088811-003 mg/kg 5590.00 14.8 49.2
Aluminum Average 4336.67Aluminum StdDev 1128.82CV (%) 26.03
On-Site 74N Antimony 088811-001 mg/kg 0.32 U 0.317 0.96On-Site 74N Antimony 088811-002 mg/kg 1.62 U 1.62 4.9On-Site 74N Antimony 088811-003 mg/kg 1.64 U 1.64 4.96
Antimony Average 1.19Antimony StdDev 0.76CV (%) 63.58
On-Site 74N Arsenic 088811-001 mg/kg 0.96 0.184 0.921On-Site 74N Arsenic 088811-002 mg/kg 0.39 J 0.196 0.982On-Site 74N Arsenic 088811-003 mg/kg 1.13 0.197 0.984
Arsenic Average 0.83Arsenic StdDev 0.39CV (%) 46.79
On-Site 74N Barium 088811-001 mg/kg 38.00 0.0921 0.368On-Site 74N Barium 088811-002 mg/kg 36.90 0.0982 0.393On-Site 74N Barium 088811-003 mg/kg 64.50 0.0984 0.394
Barium Average 46.47Barium StdDev 15.63CV (%) 33.63
On-Site 74N Beryllium 088811-001 mg/kg 0.20 0.0184 0.0921On-Site 74N Beryllium 088811-002 mg/kg 0.20 0.0196 0.0982On-Site 74N Beryllium 088811-003 mg/kg 0.26 0.0197 0.0984
Beryllium Average 0.22Beryllium StdDev 0.04CV (%) 16.35
On-Site 74N Cadmium 088811-001 mg/kg 0.10 J 0.0184 0.184On-Site 74N Cadmium 088811-002 mg/kg 0.08 J 0.0196 0.196On-Site 74N Cadmium 088811-003 mg/kg 0.18 J 0.0197 0.197
TABLE C-9. Non-radiological Replicate Results for Calendar Year 2010, Sediment

Location Type Location Analyte Sample ID Units Result Qualifier Decision Level (MDL) Detection Limit (PQL)
TABLE C-9. Non-radiological Replicate Results for Calendar Year 2010, Sediment
Cadmium Average 0.12Cadmium StdDev 0.05CV (%) 42.04
On-Site 74N Calcium 088811-001 mg/kg 14600.00 30.4 92.1On-Site 74N Calcium 088811-002 mg/kg 19800.00 32.4 98.2On-Site 74N Calcium 088811-003 mg/kg 39700.00 32.5 98.4
Calcium Average 24700.00Calcium StdDev 13248.02CV (%) 53.64
On-Site 74N Chromium 088811-001 mg/kg 2.51 0.184 0.552On-Site 74N Chromium 088811-002 mg/kg 2.33 0.196 0.589On-Site 74N Chromium 088811-003 mg/kg 3.99 0.197 0.591
Chromium Average 2.94Chromium StdDev 0.91CV (%) 30.95
On-Site 74N Cobalt 088811-001 mg/kg 2.26 0.0552 0.184On-Site 74N Cobalt 088811-002 mg/kg 2.83 0.0589 0.196On-Site 74N Cobalt 088811-003 mg/kg 3.28 0.0591 0.197
Cobalt Average 2.79Cobalt StdDev 0.51CV (%) 18.32
On-Site 74N Copper 088811-001 mg/kg 5.29 0.0608 0.184On-Site 74N Copper 088811-002 mg/kg 5.42 0.0648 0.196On-Site 74N Copper 088811-003 mg/kg 6.50 0.065 0.197
Copper Average 5.74Copper StdDev 0.66CV (%) 11.58
On-Site 74N Iron 088811-001 mg/kg 5290.00 4.6 18.4On-Site 74N Iron 088811-002 mg/kg 6460.00 4.91 19.6On-Site 74N Iron 088811-003 mg/kg 8820.00 4.92 19.7
Iron Average 6856.67Iron StdDev 1798.12CV (%) 26.22

Location Type Location Analyte Sample ID Units Result Qualifier Decision Level (MDL) Detection Limit (PQL)
TABLE C-9. Non-radiological Replicate Results for Calendar Year 2010, Sediment
On-Site 74N Lead 088811-001 mg/kg 2.75 0.0921 0.368On-Site 74N Lead 088811-002 mg/kg 2.56 0.0982 0.393On-Site 74N Lead 088811-003 mg/kg 4.68 0.0984 0.394
Lead Average 3.33Lead StdDev 1.17CV (%) 35.22
On-Site 74N Magnesium 088811-001 mg/kg 2010.00 6.91 23On-Site 74N Magnesium 088811-002 mg/kg 2580.00 7.37 24.6On-Site 74N Magnesium 088811-003 mg/kg 3210.00 7.38 24.6
Magnesium Average 2600.00Magnesium StdDev 600.25CV (%) 23.09
On-Site 74N Manganese 088811-001 mg/kg 147.00 0.184 0.921On-Site 74N Manganese 088811-002 mg/kg 183.00 0.196 0.982On-Site 74N Manganese 088811-003 mg/kg 273.00 0.984 4.92
Manganese Average 201.00Manganese StdDev 64.90CV (%) 32.29
On-Site 74N Nickel 088811-001 mg/kg 3.62 0.0921 0.368On-Site 74N Nickel 088811-002 mg/kg 3.76 0.0982 0.393On-Site 74N Nickel 088811-003 mg/kg 5.48 0.0984 0.394
Nickel Average 4.29Nickel StdDev 1.04CV (%) 24.16
On-Site 74N Potassium 088811-001 mg/kg 818.00 73.7 276On-Site 74N Potassium 088811-002 mg/kg 1180.00 78.6 295On-Site 74N Potassium 088811-003 mg/kg 1850.00 78.7 295
Potassium Average 1282.67Potassium StdDev 523.60CV (%) 40.82
On-Site 74N Selenium 088811-001 mg/kg 0.46 U 0.46 0.921On-Site 74N Selenium 088811-002 mg/kg 0.49 U 0.491 0.982On-Site 74N Selenium 088811-003 mg/kg 0.49 U 0.492 0.984
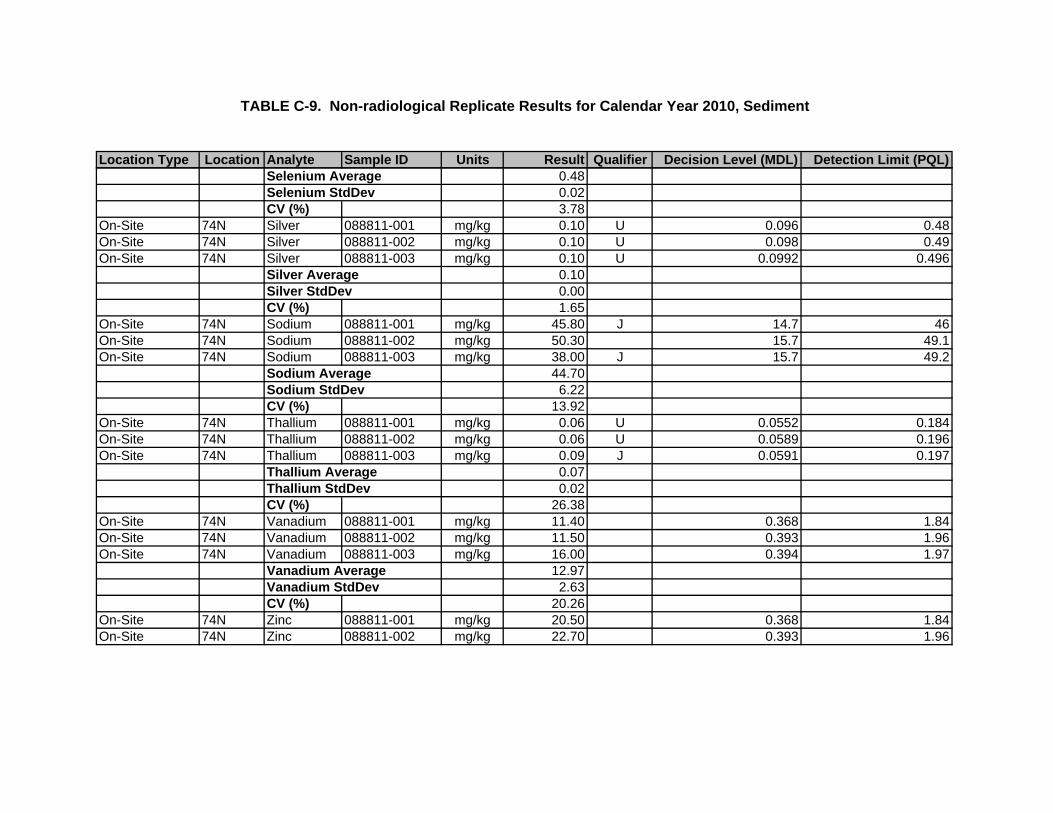
Location Type Location Analyte Sample ID Units Result Qualifier Decision Level (MDL) Detection Limit (PQL)
TABLE C-9. Non-radiological Replicate Results for Calendar Year 2010, Sediment
Selenium Average 0.48Selenium StdDev 0.02CV (%) 3.78
On-Site 74N Silver 088811-001 mg/kg 0.10 U 0.096 0.48On-Site 74N Silver 088811-002 mg/kg 0.10 U 0.098 0.49On-Site 74N Silver 088811-003 mg/kg 0.10 U 0.0992 0.496
Silver Average 0.10Silver StdDev 0.00CV (%) 1.65
On-Site 74N Sodium 088811-001 mg/kg 45.80 J 14.7 46On-Site 74N Sodium 088811-002 mg/kg 50.30 15.7 49.1On-Site 74N Sodium 088811-003 mg/kg 38.00 J 15.7 49.2
Sodium Average 44.70Sodium StdDev 6.22CV (%) 13.92
On-Site 74N Thallium 088811-001 mg/kg 0.06 U 0.0552 0.184On-Site 74N Thallium 088811-002 mg/kg 0.06 U 0.0589 0.196On-Site 74N Thallium 088811-003 mg/kg 0.09 J 0.0591 0.197
Thallium Average 0.07Thallium StdDev 0.02CV (%) 26.38
On-Site 74N Vanadium 088811-001 mg/kg 11.40 0.368 1.84On-Site 74N Vanadium 088811-002 mg/kg 11.50 0.393 1.96On-Site 74N Vanadium 088811-003 mg/kg 16.00 0.394 1.97
Vanadium Average 12.97Vanadium StdDev 2.63CV (%) 20.26
On-Site 74N Zinc 088811-001 mg/kg 20.50 0.368 1.84On-Site 74N Zinc 088811-002 mg/kg 22.70 0.393 1.96

Location Type Location Analyte Sample ID Units Result Qualifier Decision Level (MDL) Detection Limit (PQL)
TABLE C-9. Non-radiological Replicate Results for Calendar Year 2010, Sediment
On-Site 74N Zinc 088811-003 mg/kg 36.40 0.394 1.97Zinc Average 26.53Zinc StdDev 8.62CV (%) 32.47
NOTES: CV = coefficient of variation J = Estimated value, the analyte concentration fell above the effective MDL and below the effective PQL. MDL = Method detection limit. PQL = Practical quantitation limit. Std Dev = standard deviation U = The analyte was analyzed for, but not detected. For organic and inorganic analytes the result is less than the effective MDL concentration.

APPENDIX D2010 STORM WATER SAMPLING RESULTS
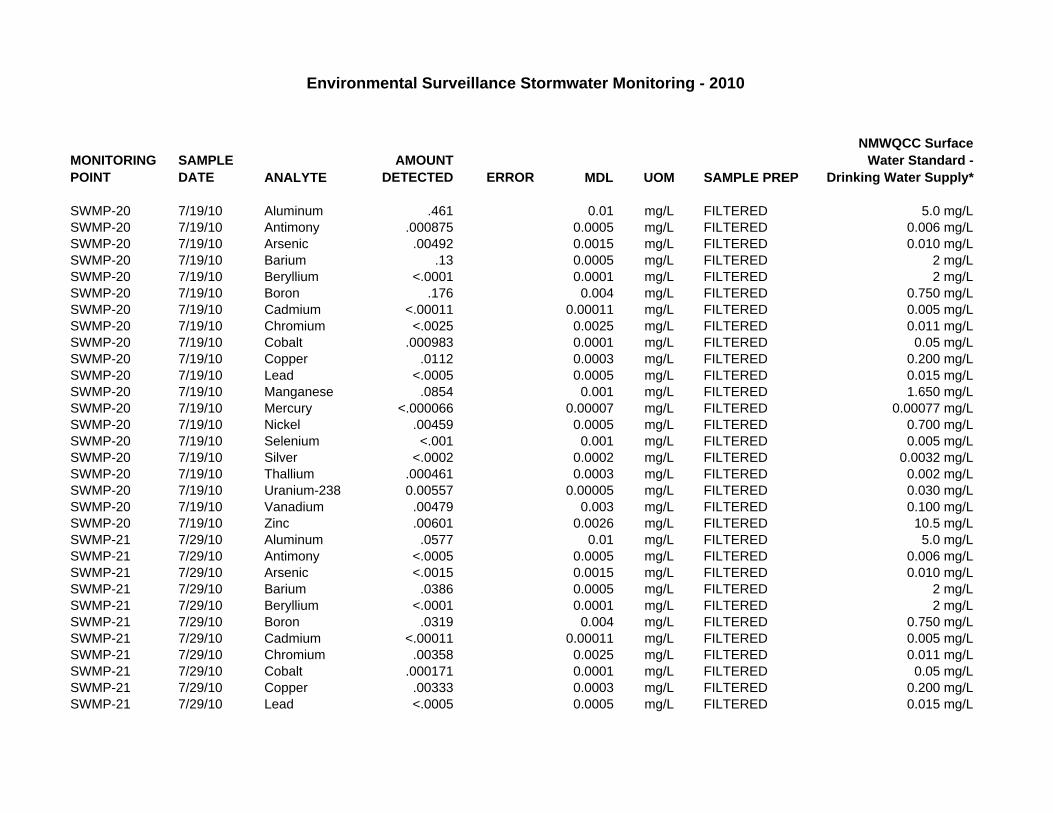
Environmental Surveillance Stormwater Monitoring - 2010
MONITORING POINT
SAMPLE DATE ANALYTE
AMOUNT DETECTED ERROR MDL UOM SAMPLE PREP
NMWQCC SurfaceWater Standard -
Drinking Water Supply*
SWMP-20 7/19/10 Aluminum .461 0.01 mg/L FILTERED 5.0 mg/LSWMP-20 7/19/10 Antimony .000875 0.0005 mg/L FILTERED 0.006 mg/LSWMP-20 7/19/10 Arsenic .00492 0.0015 mg/L FILTERED 0.010 mg/LSWMP-20 7/19/10 Barium .13 0.0005 mg/L FILTERED 2 mg/LSWMP-20 7/19/10 Beryllium <.0001 0.0001 mg/L FILTERED 2 mg/LSWMP-20 7/19/10 Boron .176 0.004 mg/L FILTERED 0.750 mg/LSWMP-20 7/19/10 Cadmium <.00011 0.00011 mg/L FILTERED 0.005 mg/LSWMP-20 7/19/10 Chromium <.0025 0.0025 mg/L FILTERED 0.011 mg/LSWMP-20 7/19/10 Cobalt .000983 0.0001 mg/L FILTERED 0.05 mg/LSWMP-20 7/19/10 Copper .0112 0.0003 mg/L FILTERED 0.200 mg/LSWMP-20 7/19/10 Lead <.0005 0.0005 mg/L FILTERED 0.015 mg/LSWMP-20 7/19/10 Manganese .0854 0.001 mg/L FILTERED 1.650 mg/LSWMP-20 7/19/10 Mercury <.000066 0.00007 mg/L FILTERED 0.00077 mg/LSWMP-20 7/19/10 Nickel .00459 0.0005 mg/L FILTERED 0.700 mg/LSWMP-20 7/19/10 Selenium <.001 0.001 mg/L FILTERED 0.005 mg/LSWMP-20 7/19/10 Silver <.0002 0.0002 mg/L FILTERED 0.0032 mg/LSWMP-20 7/19/10 Thallium .000461 0.0003 mg/L FILTERED 0.002 mg/LSWMP-20 7/19/10 Uranium-238 0.00557 0.00005 mg/L FILTERED 0.030 mg/LSWMP-20 7/19/10 Vanadium .00479 0.003 mg/L FILTERED 0.100 mg/LSWMP-20 7/19/10 Zinc .00601 0.0026 mg/L FILTERED 10.5 mg/LSWMP-21 7/29/10 Aluminum .0577 0.01 mg/L FILTERED 5.0 mg/LSWMP-21 7/29/10 Antimony <.0005 0.0005 mg/L FILTERED 0.006 mg/LSWMP-21 7/29/10 Arsenic <.0015 0.0015 mg/L FILTERED 0.010 mg/LSWMP-21 7/29/10 Barium .0386 0.0005 mg/L FILTERED 2 mg/LSWMP-21 7/29/10 Beryllium <.0001 0.0001 mg/L FILTERED 2 mg/LSWMP-21 7/29/10 Boron .0319 0.004 mg/L FILTERED 0.750 mg/LSWMP-21 7/29/10 Cadmium <.00011 0.00011 mg/L FILTERED 0.005 mg/LSWMP-21 7/29/10 Chromium .00358 0.0025 mg/L FILTERED 0.011 mg/LSWMP-21 7/29/10 Cobalt .000171 0.0001 mg/L FILTERED 0.05 mg/LSWMP-21 7/29/10 Copper .00333 0.0003 mg/L FILTERED 0.200 mg/LSWMP-21 7/29/10 Lead <.0005 0.0005 mg/L FILTERED 0.015 mg/L
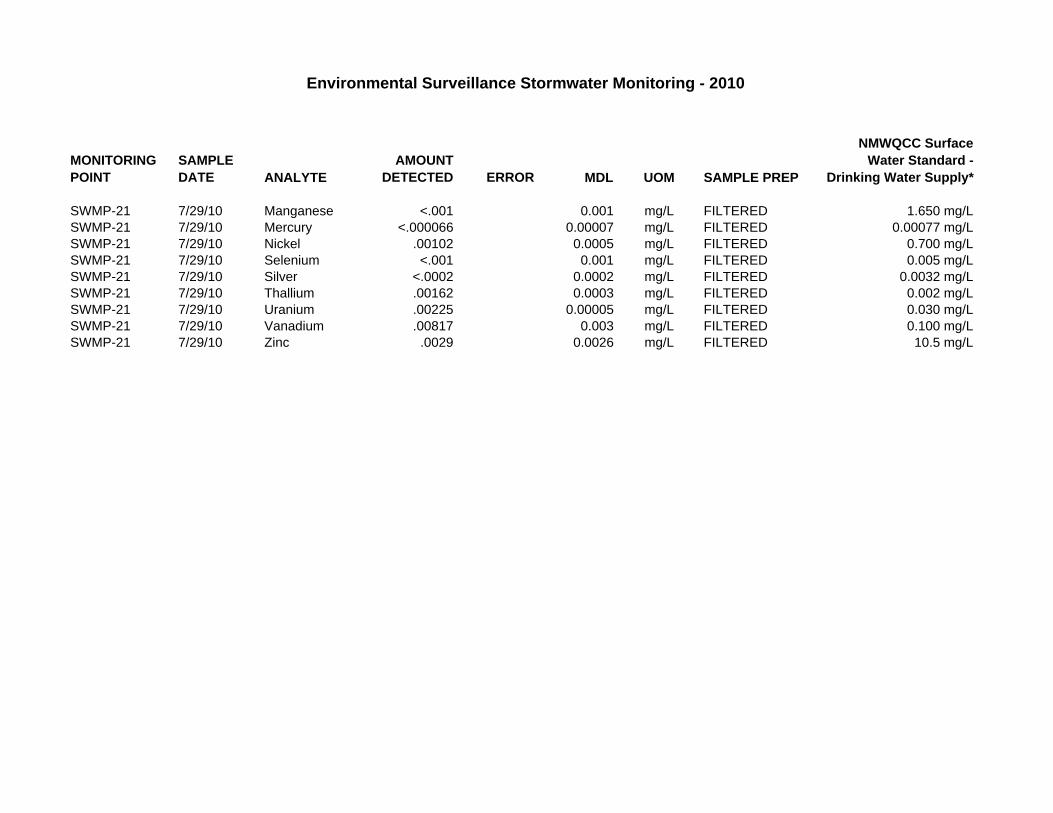
Environmental Surveillance Stormwater Monitoring - 2010
MONITORING POINT
SAMPLE DATE ANALYTE
AMOUNT DETECTED ERROR MDL UOM SAMPLE PREP
NMWQCC SurfaceWater Standard -
Drinking Water Supply*
SWMP-21 7/29/10 Manganese <.001 0.001 mg/L FILTERED 1.650 mg/LSWMP-21 7/29/10 Mercury <.000066 0.00007 mg/L FILTERED 0.00077 mg/LSWMP-21 7/29/10 Nickel .00102 0.0005 mg/L FILTERED 0.700 mg/LSWMP-21 7/29/10 Selenium <.001 0.001 mg/L FILTERED 0.005 mg/LSWMP-21 7/29/10 Silver <.0002 0.0002 mg/L FILTERED 0.0032 mg/LSWMP-21 7/29/10 Thallium .00162 0.0003 mg/L FILTERED 0.002 mg/LSWMP-21 7/29/10 Uranium .00225 0.00005 mg/L FILTERED 0.030 mg/LSWMP-21 7/29/10 Vanadium .00817 0.003 mg/L FILTERED 0.100 mg/LSWMP-21 7/29/10 Zinc .0029 0.0026 mg/L FILTERED 10.5 mg/L

Environmental Surveillance Stormwater Monitoring - 2010
MONITORING POINT
SAMPLE DATE ANALYTE
AMOUNT DETECTED ERROR MDL UOM SAMPLE PREP
NMWQCC SurfaceWater Standard -
Drinking Water Supply*
SWMP-12 8/2/10 Alpha, gross 7.38 1.74 0.298 pCi/L UNFILTERED 15 pCi/LSWMP-12 8/2/10 Aluminum .0736 0.01 mg/L FILTERED 5.0 mg/LSWMP-12 8/2/10 Americium-241 -.216 7.69 6.5 pCi/L UNFILTERED NE, < MDLSWMP-12 8/2/10 Antimony <.0005 0.0005 mg/L FILTERED 0.006 mg/LSWMP-12 8/2/10 Arsenic <.0015 0.0015 mg/L FILTERED 0.010 mg/LSWMP-12 8/2/10 Barium .0266 0.0005 mg/L FILTERED 2 mg/LSWMP-12 8/2/10 Beryllium <.0001 0.0001 mg/L FILTERED 2 mg/LSWMP-12 8/2/10 Beta, gross 10.4 2 0.618 pCi/L UNFILTERED NE, > MDLSWMP-12 8/2/10 Boron .0156 0.004 mg/L FILTERED 0.750 mg/LSWMP-12 8/2/10 Cadmium <.00011 0.00011 mg/L FILTERED 0.005 mg/LSWMP-12 8/2/10 Cesium-137 -1.79 3.31 1.6 pCi/L UNFILTERED NE, < MDLSWMP-12 8/2/10 Chromium .00423 0.0025 mg/L FILTERED 0.011 mg/LSWMP-12 8/2/10 Cobalt .00026 0.0001 mg/L FILTERED 0.05 mg/LSWMP-12 8/2/10 Cobalt-60 .0706 1.88 1.58 pCi/L UNFILTERED NE, < MDLSWMP-12 8/2/10 Copper .0038 0.0003 mg/L FILTERED 0.200 mg/LSWMP-12 8/2/10 Lead <.0005 0.0005 mg/L FILTERED 0.015 mg/LSWMP-12 8/2/10 Manganese .00227 0.001 mg/L FILTERED 1.650 mg/LSWMP-12 8/2/10 Mercury <.000066 0.00007 mg/L FILTERED 0.00077 mg/LSWMP-12 8/2/10 Neptunium-237 -.903 3.11 2.59 pCi/L UNFILTERED NE, < MDLSWMP-12 8/2/10 Nickel .00112 0.0005 mg/L FILTERED 0.700 mg/LSWMP-12 8/2/10 Radium-226/228 -71.7 13.8 35.9 pCi/L UNFILTERED 5 pCi/LSWMP-12 8/2/10 Selenium <.001 0.001 mg/L FILTERED 0.005 mg/LSWMP-12 8/2/10 Silver <.0002 0.0002 mg/L FILTERED 0.0032 mg/LSWMP-12 8/2/10 Sodium-22 .00391 1.65 1.38 pCi/L UNFILTERED NE, < MDLSWMP-12 8/2/10 Thallium .000749 0.0003 mg/L FILTERED 0.002 mg/LSWMP-12 8/2/10 Uranium .000102 0.00005 mg/L FILTERED 0.030 mg/LSWMP-12 8/2/10 Uranium-235 -5.67 14.9 8.62 pCi/L UNFILTERED NE, < MDLSWMP-12 8/2/10 Uranium-238 -70.6 125 69.2 pCi/L UNFILTERED NE, < MDLSWMP-12 8/2/10 Vanadium .00654 0.003 mg/L FILTERED 0.100 mg/LSWMP-12 8/2/10 Zinc .00376 0.0026 mg/L FILTERED 10.5 mg/LSWMP-20 8/3/10 Alpha, gross 18.3 3.95 0.305 pCi/L UNFILTERED 15 pCi/L
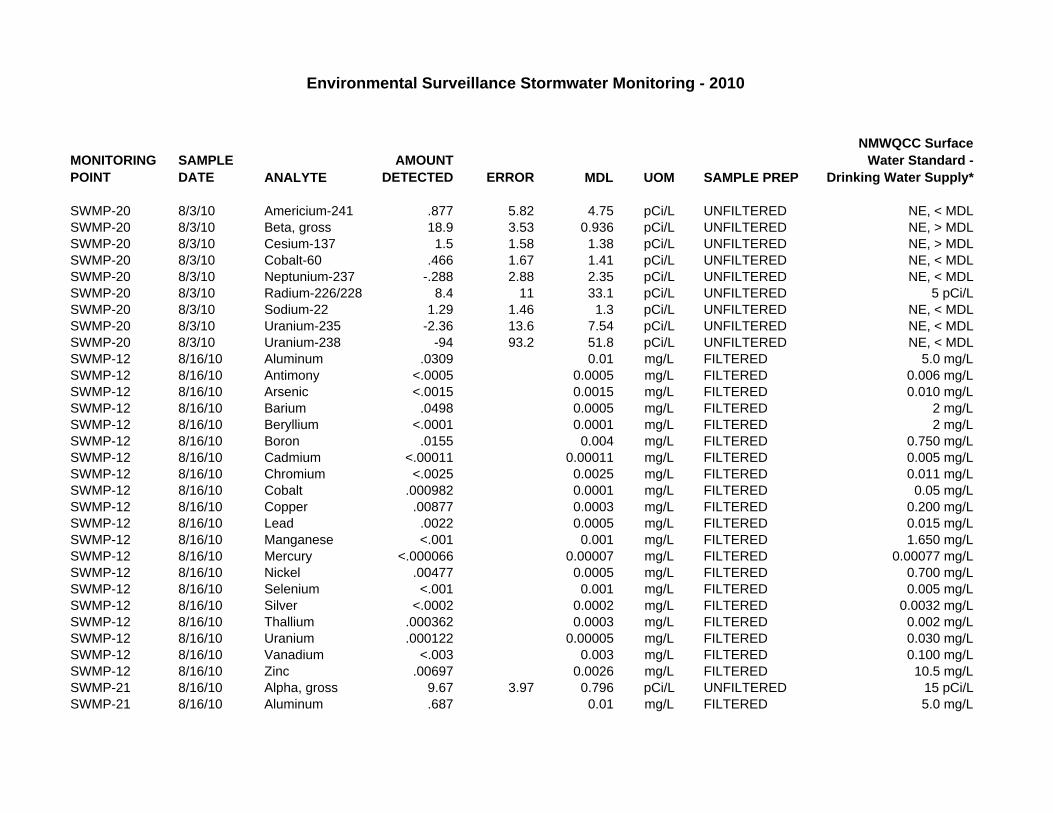
Environmental Surveillance Stormwater Monitoring - 2010
MONITORING POINT
SAMPLE DATE ANALYTE
AMOUNT DETECTED ERROR MDL UOM SAMPLE PREP
NMWQCC SurfaceWater Standard -
Drinking Water Supply*
SWMP-20 8/3/10 Americium-241 .877 5.82 4.75 pCi/L UNFILTERED NE, < MDLSWMP-20 8/3/10 Beta, gross 18.9 3.53 0.936 pCi/L UNFILTERED NE, > MDLSWMP-20 8/3/10 Cesium-137 1.5 1.58 1.38 pCi/L UNFILTERED NE, > MDLSWMP-20 8/3/10 Cobalt-60 .466 1.67 1.41 pCi/L UNFILTERED NE, < MDLSWMP-20 8/3/10 Neptunium-237 -.288 2.88 2.35 pCi/L UNFILTERED NE, < MDLSWMP-20 8/3/10 Radium-226/228 8.4 11 33.1 pCi/L UNFILTERED 5 pCi/LSWMP-20 8/3/10 Sodium-22 1.29 1.46 1.3 pCi/L UNFILTERED NE, < MDLSWMP-20 8/3/10 Uranium-235 -2.36 13.6 7.54 pCi/L UNFILTERED NE, < MDLSWMP-20 8/3/10 Uranium-238 -94 93.2 51.8 pCi/L UNFILTERED NE, < MDLSWMP-12 8/16/10 Aluminum .0309 0.01 mg/L FILTERED 5.0 mg/LSWMP-12 8/16/10 Antimony <.0005 0.0005 mg/L FILTERED 0.006 mg/LSWMP-12 8/16/10 Arsenic <.0015 0.0015 mg/L FILTERED 0.010 mg/LSWMP-12 8/16/10 Barium .0498 0.0005 mg/L FILTERED 2 mg/LSWMP-12 8/16/10 Beryllium <.0001 0.0001 mg/L FILTERED 2 mg/LSWMP-12 8/16/10 Boron .0155 0.004 mg/L FILTERED 0.750 mg/LSWMP-12 8/16/10 Cadmium <.00011 0.00011 mg/L FILTERED 0.005 mg/LSWMP-12 8/16/10 Chromium <.0025 0.0025 mg/L FILTERED 0.011 mg/LSWMP-12 8/16/10 Cobalt .000982 0.0001 mg/L FILTERED 0.05 mg/LSWMP-12 8/16/10 Copper .00877 0.0003 mg/L FILTERED 0.200 mg/LSWMP-12 8/16/10 Lead .0022 0.0005 mg/L FILTERED 0.015 mg/LSWMP-12 8/16/10 Manganese <.001 0.001 mg/L FILTERED 1.650 mg/LSWMP-12 8/16/10 Mercury <.000066 0.00007 mg/L FILTERED 0.00077 mg/LSWMP-12 8/16/10 Nickel .00477 0.0005 mg/L FILTERED 0.700 mg/LSWMP-12 8/16/10 Selenium <.001 0.001 mg/L FILTERED 0.005 mg/LSWMP-12 8/16/10 Silver <.0002 0.0002 mg/L FILTERED 0.0032 mg/LSWMP-12 8/16/10 Thallium .000362 0.0003 mg/L FILTERED 0.002 mg/LSWMP-12 8/16/10 Uranium .000122 0.00005 mg/L FILTERED 0.030 mg/LSWMP-12 8/16/10 Vanadium <.003 0.003 mg/L FILTERED 0.100 mg/LSWMP-12 8/16/10 Zinc .00697 0.0026 mg/L FILTERED 10.5 mg/LSWMP-21 8/16/10 Alpha, gross 9.67 3.97 0.796 pCi/L UNFILTERED 15 pCi/LSWMP-21 8/16/10 Aluminum .687 0.01 mg/L FILTERED 5.0 mg/L

Environmental Surveillance Stormwater Monitoring - 2010
MONITORING POINT
SAMPLE DATE ANALYTE
AMOUNT DETECTED ERROR MDL UOM SAMPLE PREP
NMWQCC SurfaceWater Standard -
Drinking Water Supply*
SWMP-21 8/16/10 Americium-241 -1.91 7.84 6.58 pCi/L UNFILTERED NE, < MDLSWMP-21 8/16/10 Antimony <.0005 0.0005 mg/L FILTERED 0.006 mg/LSWMP-21 8/16/10 Arsenic .00265 0.0015 mg/L FILTERED 0.010 mg/LSWMP-21 8/16/10 Barium .0248 0.0005 mg/L FILTERED 2 mg/LSWMP-21 8/16/10 Beryllium <.0001 0.0001 mg/L FILTERED 2 mg/LSWMP-21 8/16/10 Beta, gross 37.6 6.43 0.457 pCi/L UNFILTERED NE, > MDLSWMP-21 8/16/10 Boron .0981 0.004 mg/L FILTERED 0.750 mg/LSWMP-21 8/16/10 Cadmium <.00011 0.00011 mg/L FILTERED 0.005 mg/LSWMP-21 8/16/10 Cesium-137 -3.9 3.35 1.57 pCi/L UNFILTERED NE, < MDLSWMP-21 8/16/10 Chromium <.0025 0.0025 mg/L FILTERED 0.011 mg/LSWMP-21 8/16/10 Cobalt .000351 0.0001 mg/L FILTERED 0.05 mg/LSWMP-21 8/16/10 Cobalt-60 .364 1.78 1.51 pCi/L UNFILTERED NE, < MDLSWMP-21 8/16/10 Copper .00731 0.0003 mg/L FILTERED 0.200 mg/LSWMP-21 8/16/10 Lead .00408 0.0005 mg/L FILTERED 0.015 mg/LSWMP-21 8/16/10 Manganese .00735 0.001 mg/L FILTERED 1.650 mg/LSWMP-21 8/16/10 Mercury <.000066 0.00007 mg/L FILTERED 0.00077 mg/LSWMP-21 8/16/10 Neptunium-237 1.75 3.38 2.88 pCi/L UNFILTERED NE, < MDLSWMP-21 8/16/10 Nickel .00262 0.0005 mg/L FILTERED 0.700 mg/LSWMP-21 8/16/10 Radium-226/228 -6.4 14.2 36.7 pCi/L UNFILTERED 5 pCi/LSWMP-21 8/16/10 Selenium <.001 0.001 mg/L FILTERED 0.005 mg/LSWMP-21 8/16/10 Silver <.0002 0.0002 mg/L FILTERED 0.0032 mg/LSWMP-21 8/16/10 Sodium-22 -1.48 1.88 1.48 pCi/L UNFILTERED NE, < MDLSWMP-21 8/16/10 Thallium .000646 0.0003 mg/L FILTERED 0.002 mg/LSWMP-21 8/16/10 Uranium .00128 0.00005 mg/L FILTERED 0.030 mg/LSWMP-21 8/16/10 Uranium-235 -5.36 15.7 8.74 pCi/L UNFILTERED NE, < MDLSWMP-21 8/16/10 Uranium-238 34.1 124 69.8 pCi/L UNFILTERED NE, < MDLSWMP-21 8/16/10 Vanadium <.003 0.003 mg/L FILTERED 0.100 mg/LSWMP-21 8/16/10 Zinc .0264 0.0026 mg/L FILTERED 10.5 mg/L
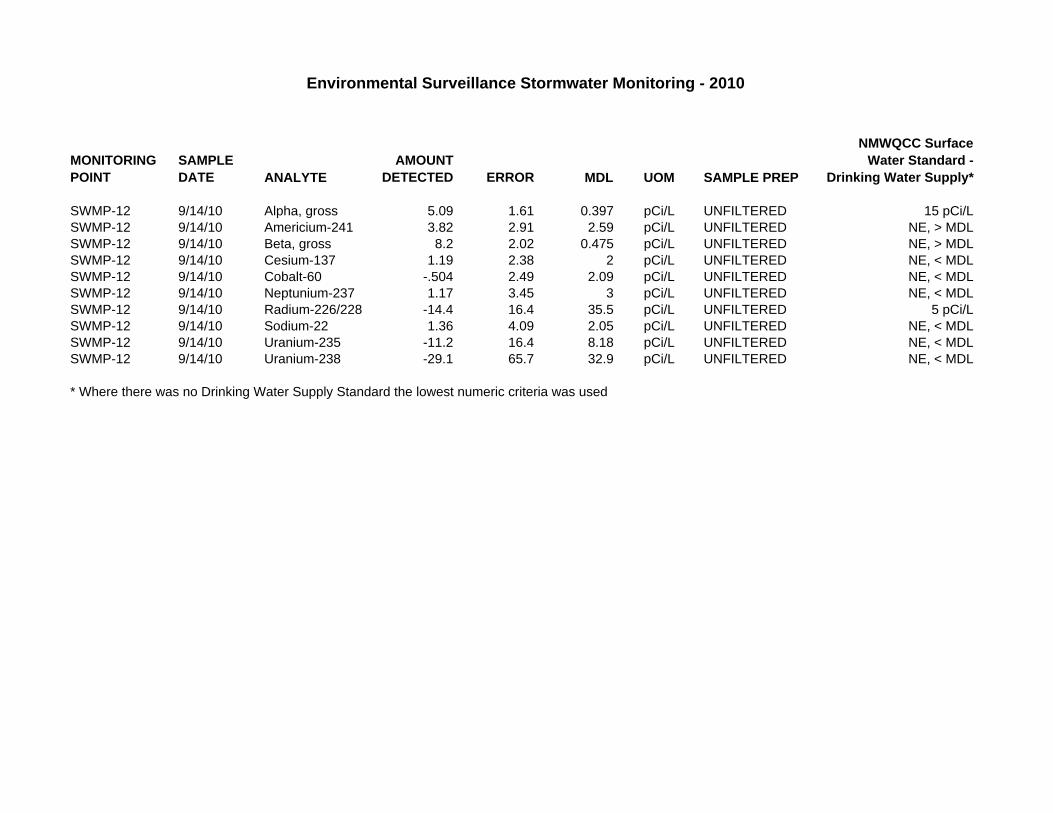
Environmental Surveillance Stormwater Monitoring - 2010
MONITORING POINT
SAMPLE DATE ANALYTE
AMOUNT DETECTED ERROR MDL UOM SAMPLE PREP
NMWQCC SurfaceWater Standard -
Drinking Water Supply*
SWMP-12 9/14/10 Alpha, gross 5.09 1.61 0.397 pCi/L UNFILTERED 15 pCi/LSWMP-12 9/14/10 Americium-241 3.82 2.91 2.59 pCi/L UNFILTERED NE, > MDLSWMP-12 9/14/10 Beta, gross 8.2 2.02 0.475 pCi/L UNFILTERED NE, > MDLSWMP-12 9/14/10 Cesium-137 1.19 2.38 2 pCi/L UNFILTERED NE, < MDLSWMP-12 9/14/10 Cobalt-60 -.504 2.49 2.09 pCi/L UNFILTERED NE, < MDLSWMP-12 9/14/10 Neptunium-237 1.17 3.45 3 pCi/L UNFILTERED NE, < MDLSWMP-12 9/14/10 Radium-226/228 -14.4 16.4 35.5 pCi/L UNFILTERED 5 pCi/LSWMP-12 9/14/10 Sodium-22 1.36 4.09 2.05 pCi/L UNFILTERED NE, < MDLSWMP-12 9/14/10 Uranium-235 -11.2 16.4 8.18 pCi/L UNFILTERED NE, < MDLSWMP-12 9/14/10 Uranium-238 -29.1 65.7 32.9 pCi/L UNFILTERED NE, < MDL
* Where there was no Drinking Water Supply Standard the lowest numeric criteria was used

Storm Water Sampling Results - 2010
MONITORING POINT ANALYTE SAMPLE DATE
SWMP-04 Aluminum, Total Recoverable 6/29/10 1.19 mg/LSWMP-04 Arsenic, Total Recoverable 6/29/10 .00233 mg/LSWMP-04 Cadmium, Total Recoverable 6/29/10 .000801 mg/LSWMP-04 Chemical Oxygen Demand 6/29/10 65.3 mg/LSWMP-04 Copper, Total Recoverable 6/29/10 .0208 mg/LSWMP-04 Iron, Total Recoverable 6/29/10 .874 mg/LSWMP-04 Lead, Total Recoverable 6/29/10 .00518 mg/LSWMP-04 Magnesium, Total Recoverable 6/29/10 2.36 mg/LSWMP-04 Mercury, Total Recoverable 6/29/10 <.000066 mg/LSWMP-04 Selenium, Total Recoverable 6/29/10 <.001 mg/LSWMP-04 Silver, Total Recoverable 6/29/10 <.0002 mg/LSWMP-04 Solids, total suspended 6/29/10 25.8 mg/LSWMP-04 Solids, total suspended 6/29/10 28 mg/LSWMP-04 Zinc, Total Recoverable 6/29/10 .0328 mg/LSWMP-05 Aluminum, Total Recoverable 6/29/10 4.84 mg/LSWMP-05 Ammonia 6/29/10 .033 mg/LSWMP-05 Arsenic, Total Recoverable 6/29/10 .00471 mg/LSWMP-05 Cadmium, Total Recoverable 6/29/10 .000183 mg/LSWMP-05 Copper, Total Recoverable 6/29/10 .0129 mg/LSWMP-05 Iron, Total Recoverable 6/29/10 3.45 mg/LSWMP-05 Lead, Total Recoverable 6/29/10 .00726 mg/LSWMP-05 Magnesium, Total Recoverable 6/29/10 4.57 mg/LSWMP-05 Mercury, Total Recoverable 6/29/10 <.000066 mg/LSWMP-05 Selenium, Total Recoverable 6/29/10 <.001 mg/LSWMP-05 Silver, Total Recoverable 6/29/10 <.0002 mg/LSWMP-05 Zinc, Total Recoverable 6/29/10 .113 mg/LSWMP-11 Aluminum, Total Recoverable 6/29/10 36.1 mg/LSWMP-11 Ammonia 6/29/10 3.03 mg/LSWMP-11 Arsenic, Total Recoverable 6/29/10 .00774 mg/LSWMP-11 Cadmium, Total Recoverable 6/29/10 .0111 mg/LSWMP-11 Chemical Oxygen Demand 6/29/10 287 mg/LSWMP-11 Copper, Total Recoverable 6/29/10 .245 mg/LSWMP-11 Cyanide, total 6/29/10 .0549 mg/LSWMP-11 Iron, Total Recoverable 6/29/10 28.3 mg/LSWMP-11 Lead, Total Recoverable 6/29/10 .0335 mg/LSWMP-11 Magnesium, Total Recoverable 6/29/10 13.3 mg/LSWMP-11 Mercury, Total Recoverable 6/29/10 <.000066 mg/LSWMP-11 Selenium, Total Recoverable 6/29/10 <.001 mg/LSWMP-11 Silver, Total Recoverable 6/29/10 .022 mg/LSWMP-11 Zinc, Total Recoverable 6/29/10 .178 mg/LSWMP-15 Aluminum, Total Recoverable 6/29/10 3.8 mg/LSWMP-15 Ammonia 6/29/10 .38 mg/LSWMP-15 Arsenic, Total Recoverable 6/29/10 .00354 mg/LSWMP-15 Cadmium, Total Recoverable 6/29/10 .000126 mg/LSWMP-15 Chemical Oxygen Demand 6/29/10 191 mg/LSWMP-15 Copper, Total Recoverable 6/29/10 .0111 mg/LSWMP-15 Cyanide, total 6/29/10 .0024 mg/LSWMP-15 Iron, Total Recoverable 6/29/10 2.53 mg/LSWMP-15 Lead, Total Recoverable 6/29/10 .00404 mg/LSWMP-15 Magnesium, Total Recoverable 6/29/10 5.42 mg/LSWMP-15 Mercury, Total Recoverable 6/29/10 <.000066 mg/LSWMP-15 Selenium, Total Recoverable 6/29/10 .00133 mg/LSWMP-15 Silver, Total Recoverable 6/29/10 <.0002 mg/LSWMP-15 Zinc, Total Recoverable 6/29/10 .042 mg/L
RESULTS

Storm Water Sampling Results - 2010
MONITORING POINT ANALYTE SAMPLE DATE RESULTS
SWMP-05 Aluminum, Total Recoverable 7/7/10 2.67 mg/LSWMP-05 Ammonia 7/7/10 .229 mg/LSWMP-05 Arsenic, Total Recoverable 7/7/10 .00192 mg/LSWMP-05 Cadmium, Total Recoverable 7/7/10 <.00011 mg/LSWMP-05 Copper, Total Recoverable 7/7/10 .0122 mg/LSWMP-05 Iron, Total Recoverable 7/7/10 3.03 mg/LSWMP-05 Lead, Total Recoverable 7/7/10 .00328 mg/LSWMP-05 Magnesium, Total Recoverable 7/7/10 2.32 mg/LSWMP-05 Mercury, Total Recoverable 7/7/10 <.000066 mg/LSWMP-05 Selenium, Total Recoverable 7/7/10 <.001 mg/LSWMP-05 Silver, Total Recoverable 7/7/10 <.0002 mg/LSWMP-05 Zinc, Total Recoverable 7/7/10 .0405 mg/LSWMP-15 Aluminum, Total Recoverable 7/7/10 .227 mg/LSWMP-15 Ammonia 7/7/10 .262 mg/LSWMP-15 Arsenic, Total Recoverable 7/7/10 <.0015 mg/LSWMP-15 Cadmium, Total Recoverable 7/7/10 <.00011 mg/LSWMP-15 Chemical Oxygen Demand 7/7/10 48.1 mg/LSWMP-15 Copper, Total Recoverable 7/7/10 .00297 mg/LSWMP-15 Cyanide, total 7/7/10 <.0017 mg/LSWMP-15 Iron, Total Recoverable 7/7/10 .26 mg/LSWMP-15 Lead, Total Recoverable 7/7/10 <.0005 mg/LSWMP-15 Magnesium, Total Recoverable 7/7/10 1.36 mg/LSWMP-15 Mercury, Total Recoverable 7/7/10 <.000066 mg/LSWMP-15 Selenium, Total Recoverable 7/7/10 <.001 mg/LSWMP-15 Silver, Total Recoverable 7/7/10 <.0002 mg/LSWMP-15 Zinc, Total Recoverable 7/7/10 .00579 mg/LSWMP-02 Solids, total suspended 7/16/10 16.8 mg/LSWMP-04 Solids, total suspended 7/16/10 32.6 mg/LSWMP-06 Aluminum, Total Recoverable 7/19/10 13 mg/LSWMP-06 Arsenic, Total Recoverable 7/19/10 .00445 mg/LSWMP-06 Cadmium, Total Recoverable 7/19/10 .00214 mg/LSWMP-06 Copper, Total Recoverable 7/19/10 .0171 mg/LSWMP-06 Iron, Total Recoverable 7/19/10 6.79 mg/LSWMP-06 Lead, Total Recoverable 7/19/10 .0462 mg/LSWMP-06 Magnesium, Total Recoverable 7/19/10 26.3 mg/LSWMP-06 Mercury, Total Recoverable 7/19/10 <.000066 mg/LSWMP-06 Selenium, Total Recoverable 7/19/10 <.001 mg/LSWMP-06 Silver, Total Recoverable 7/19/10 <.0002 mg/LSWMP-06 Zinc, Total Recoverable 7/19/10 .122 mg/LSWMP-20 Aluminum, Total Recoverable 7/19/10 .461 mg/LSWMP-20 Arsenic, Total Recoverable 7/19/10 .00492 mg/LSWMP-20 Cadmium, Total Recoverable 7/19/10 <.00011 mg/LSWMP-20 Copper, Total Recoverable 7/19/10 .0112 mg/LSWMP-20 Iron, Total Recoverable 7/19/10 .348 mg/LSWMP-20 Lead, Total Recoverable 7/19/10 <.0005 mg/LSWMP-20 Magnesium, Total Recoverable 7/19/10 4.65 mg/LSWMP-20 Mercury, Total Recoverable 7/19/10 <.000066 mg/LSWMP-20 Selenium, Total Recoverable 7/19/10 <.001 mg/LSWMP-20 Silver, Total Recoverable 7/19/10 <.0002 mg/LSWMP-20 Zinc, Total Recoverable 7/19/10 .00601 mg/LSWMP-01 Aluminum, Total Recoverable 7/26/10 .431 mg/LSWMP-01 Arsenic, Total Recoverable 7/26/10 .00173 mg/LSWMP-01 Cadmium, Total Recoverable 7/26/10 .000417 mg/LSWMP-01 Copper, Total Recoverable 7/26/10 .00786 mg/L

Storm Water Sampling Results - 2010
MONITORING POINT ANALYTE SAMPLE DATE RESULTS
SWMP-01 Iron, Total Recoverable 7/26/10 .366 mg/LSWMP-01 Lead, Total Recoverable 7/26/10 .00308 mg/LSWMP-01 Magnesium, Total Recoverable 7/26/10 1.08 mg/LSWMP-01 Mercury, Total Recoverable 7/26/10 <.000066 mg/LSWMP-01 Selenium, Total Recoverable 7/26/10 .00114 mg/LSWMP-01 Silver, Total Recoverable 7/26/10 <.0002 mg/LSWMP-01 Zinc, Total Recoverable 7/26/10 .0559 mg/LSWMP-04 Aluminum, Total Recoverable 7/26/10 .248 mg/LSWMP-04 Arsenic, Total Recoverable 7/26/10 .00212 mg/LSWMP-04 Cadmium, Total Recoverable 7/26/10 .000173 mg/LSWMP-04 Chemical Oxygen Demand 7/26/10 59.9 mg/LSWMP-04 Copper, Total Recoverable 7/26/10 .00572 mg/LSWMP-04 Iron, Total Recoverable 7/26/10 .134 mg/LSWMP-04 Lead, Total Recoverable 7/26/10 .0019 mg/LSWMP-04 Magnesium, Total Recoverable 7/26/10 1.12 mg/LSWMP-04 Mercury, Total Recoverable 7/26/10 <.000066 mg/LSWMP-04 Selenium, Total Recoverable 7/26/10 <.001 mg/LSWMP-04 Silver, Total Recoverable 7/26/10 <.0002 mg/LSWMP-04 Solids, total suspended 7/26/10 16 mg/LSWMP-04 Zinc, Total Recoverable 7/26/10 .0272 mg/LSWMP-05 Chemical Oxygen Demand 7/26/10 57.6 mg/LSWMP-05 Cyanide, total 7/26/10 <.0017 mg/LSWMP-05 Solids, total suspended 7/26/10 17.1 mg/LSWMP-05 Solids, total suspended 7/26/10 215 mg/LSWMP-07 Aluminum, Total Recoverable 7/27/10 3.76 mg/LSWMP-07 Arsenic, Total Recoverable 7/27/10 .00226 mg/LSWMP-07 Cadmium, Total Recoverable 7/27/10 .000321 mg/LSWMP-07 Copper, Total Recoverable 7/27/10 .00832 mg/LSWMP-07 Iron, Total Recoverable 7/27/10 1.65 mg/LSWMP-07 Lead, Total Recoverable 7/27/10 .01 mg/LSWMP-07 Magnesium, Total Recoverable 7/27/10 2.62 mg/LSWMP-07 Mercury, Total Recoverable 7/27/10 <.000066 mg/LSWMP-07 Selenium, Total Recoverable 7/27/10 .0014 mg/LSWMP-07 Silver, Total Recoverable 7/27/10 <.0002 mg/LSWMP-07 Zinc, Total Recoverable 7/27/10 .0401 mg/LSWMP-16 Aluminum, Total Recoverable 7/27/10 5.94 mg/LSWMP-16 Ammonia 7/27/10 .781 mg/LSWMP-16 Arsenic, Total Recoverable 7/27/10 .00265 mg/LSWMP-16 Cadmium, Total Recoverable 7/27/10 .000505 mg/LSWMP-16 Chemical Oxygen Demand 7/27/10 19.1 mg/LSWMP-16 Copper, Total Recoverable 7/27/10 .00678 mg/LSWMP-16 Cyanide, total 7/27/10 <.0017 mg/LSWMP-16 Iron, Total Recoverable 7/27/10 2.57 mg/LSWMP-16 Lead, Total Recoverable 7/27/10 .0121 mg/LSWMP-16 Magnesium, Total Recoverable 7/27/10 4.54 mg/LSWMP-16 Mercury, Total Recoverable 7/27/10 <.000066 mg/LSWMP-16 Selenium, Total Recoverable 7/27/10 <.001 mg/LSWMP-16 Silver, Total Recoverable 7/27/10 <.0002 mg/LSWMP-16 Zinc, Total Recoverable 7/27/10 .033 mg/LSWMP-06 Ammonia 7/29/10 .254 mg/LSWMP-06 Cyanide, total 7/29/10 <.0017 mg/LSWMP-13 Aluminum, Total Recoverable 7/29/10 8.14 mg/LSWMP-13 Ammonia 7/29/10 .0874 mg/LSWMP-13 Arsenic, Total Recoverable 7/29/10 .00505 mg/L

Storm Water Sampling Results - 2010
MONITORING POINT ANALYTE SAMPLE DATE RESULTS
SWMP-13 Cadmium, Total Recoverable 7/29/10 .000232 mg/LSWMP-13 Chemical Oxygen Demand 7/29/10 12.3 mg/LSWMP-13 Copper, Total Recoverable 7/29/10 .0154 mg/LSWMP-13 Cyanide, total 7/29/10 <.0017 mg/LSWMP-13 Iron, Total Recoverable 7/29/10 6.39 mg/LSWMP-13 Lead, Total Recoverable 7/29/10 .0679 mg/LSWMP-13 Magnesium, Total Recoverable 7/29/10 2.06 mg/LSWMP-13 Mercury, Total Recoverable 7/29/10 <.000066 mg/LSWMP-13 Selenium, Total Recoverable 7/29/10 <.001 mg/LSWMP-13 Silver, Total Recoverable 7/29/10 .000245 mg/LSWMP-13 Zinc, Total Recoverable 7/29/10 .0377 mg/LSWMP-21 Aluminum, Total Recoverable 7/29/10 .0577 mg/LSWMP-21 Arsenic, Total Recoverable 7/29/10 <.0015 mg/LSWMP-21 Cadmium, Total Recoverable 7/29/10 <.00011 mg/LSWMP-21 Copper, Total Recoverable 7/29/10 .00333 mg/LSWMP-21 Iron, Total Recoverable 7/29/10 .0956 mg/LSWMP-21 Lead, Total Recoverable 7/29/10 <.0005 mg/LSWMP-21 Magnesium, Total Recoverable 7/29/10 1.77 mg/LSWMP-21 Mercury, Total Recoverable 7/29/10 <.000066 mg/LSWMP-21 Selenium, Total Recoverable 7/29/10 <.001 mg/LSWMP-21 Silver, Total Recoverable 7/29/10 <.0002 mg/LSWMP-21 Zinc, Total Recoverable 7/29/10 .0029 mg/LSWMP-22 Aluminum, Total Recoverable 7/29/10 7.74 mg/LSWMP-22 Arsenic, Total Recoverable 7/29/10 .00651 mg/LSWMP-22 Cadmium, Total Recoverable 7/29/10 .0014 mg/LSWMP-22 Copper, Total Recoverable 7/29/10 .021 mg/LSWMP-22 Iron, Total Recoverable 7/29/10 3.71 mg/LSWMP-22 Lead, Total Recoverable 7/29/10 .0256 mg/LSWMP-22 Magnesium, Total Recoverable 7/29/10 4.69 mg/LSWMP-22 Mercury, Total Recoverable 7/29/10 <.000066 mg/LSWMP-22 Selenium, Total Recoverable 7/29/10 <.001 mg/LSWMP-22 Silver, Total Recoverable 7/29/10 <.0002 mg/LSWMP-22 Zinc, Total Recoverable 7/29/10 .142 mg/L

Storm Water Sampling Results - 2010
MONITORING POINT ANALYTE SAMPLE DATE RESULTS
SWMP-12 Aluminum, Total Recoverable 8/2/10 .0736 mg/LSWMP-12 Arsenic, Total Recoverable 8/2/10 <.0015 mg/LSWMP-12 Cadmium, Total Recoverable 8/2/10 <.00011 mg/LSWMP-12 Copper, Total Recoverable 8/2/10 .0038 mg/LSWMP-12 Iron, Total Recoverable 8/2/10 .117 mg/LSWMP-12 Lead, Total Recoverable 8/2/10 <.0005 mg/LSWMP-12 Magnesium, Total Recoverable 8/2/10 .69 mg/LSWMP-12 Mercury, Total Recoverable 8/2/10 <.000066 mg/LSWMP-12 Selenium, Total Recoverable 8/2/10 <.001 mg/LSWMP-12 Silver, Total Recoverable 8/2/10 <.0002 mg/LSWMP-12 Zinc, Total Recoverable 8/2/10 .00376 mg/LSWMP-23 Aluminum, Total Recoverable 8/2/10 18.7 mg/LSWMP-23 Ammonia 8/2/10 .332 mg/LSWMP-23 Arsenic, Total Recoverable 8/2/10 .00394 mg/LSWMP-23 Cadmium, Total Recoverable 8/2/10 .000493 mg/LSWMP-23 Chemical Oxygen Demand 8/2/10 92.2 mg/LSWMP-23 Copper, Total Recoverable 8/2/10 .0171 mg/LSWMP-23 Iron, Total Recoverable 8/2/10 11.2 mg/LSWMP-23 Lead, Total Recoverable 8/2/10 .0169 mg/LSWMP-23 Magnesium, Total Recoverable 8/2/10 12.3 mg/LSWMP-23 Mercury, Total Recoverable 8/2/10 .000098 mg/LSWMP-23 Selenium, Total Recoverable 8/2/10 <.001 mg/LSWMP-23 Silver, Total Recoverable 8/2/10 <.0002 mg/LSWMP-23 Zinc, Total Recoverable 8/2/10 .143 mg/LSWMP-04 Aluminum, Total Recoverable 8/11/10 .774 mg/LSWMP-04 Arsenic, Total Recoverable 8/11/10 .00636 mg/LSWMP-04 Cadmium, Total Recoverable 8/11/10 .000152 mg/LSWMP-04 Copper, Total Recoverable 8/11/10 .0101 mg/LSWMP-04 Iron, Total Recoverable 8/11/10 .509 mg/LSWMP-04 Lead, Total Recoverable 8/11/10 .00107 mg/LSWMP-04 Magnesium, Total Recoverable 8/11/10 4.72 mg/LSWMP-04 Mercury, Total Recoverable 8/11/10 <.000066 mg/LSWMP-04 Selenium, Total Recoverable 8/11/10 .00116 mg/LSWMP-04 Silver, Total Recoverable 8/11/10 <.0002 mg/LSWMP-04 Zinc, Total Recoverable 8/11/10 .00891 mg/LSWMP-05 Aluminum, Total Recoverable 8/11/10 20.3 mg/LSWMP-05 Arsenic, Total Recoverable 8/11/10 .00896 mg/LSWMP-05 Cadmium, Total Recoverable 8/11/10 .00166 mg/LSWMP-05 Copper, Total Recoverable 8/11/10 .028 mg/LSWMP-05 Iron, Total Recoverable 8/11/10 16.7 mg/LSWMP-05 Lead, Total Recoverable 8/11/10 .0837 mg/LSWMP-05 Magnesium, Total Recoverable 8/11/10 8.37 mg/LSWMP-05 Mercury, Total Recoverable 8/11/10 <.000066 mg/LSWMP-05 Selenium, Total Recoverable 8/11/10 <.001 mg/LSWMP-05 Silver, Total Recoverable 8/11/10 .000249 mg/LSWMP-05 Zinc, Total Recoverable 8/11/10 .118 mg/LSWMP-15 Aluminum, Total Recoverable 8/11/10 .438 mg/LSWMP-15 Arsenic, Total Recoverable 8/11/10 .00621 mg/LSWMP-15 Cadmium, Total Recoverable 8/11/10 <.00011 mg/LSWMP-15 Copper, Total Recoverable 8/11/10 .00506 mg/LSWMP-15 Iron, Total Recoverable 8/11/10 .285 mg/LSWMP-15 Lead, Total Recoverable 8/11/10 <.0005 mg/LSWMP-15 Magnesium, Total Recoverable 8/11/10 2.47 mg/LSWMP-15 Mercury, Total Recoverable 8/11/10 <.000066 mg/L

Storm Water Sampling Results - 2010
MONITORING POINT ANALYTE SAMPLE DATE RESULTS
SWMP-15 Selenium, Total Recoverable 8/11/10 <.001 mg/LSWMP-15 Silver, Total Recoverable 8/11/10 <.0002 mg/LSWMP-15 Zinc, Total Recoverable 8/11/10 .00543 mg/LSWMP-04 Aluminum, Total Recoverable 8/16/10 1.1 mg/LSWMP-04 Arsenic, Total Recoverable 8/16/10 <.0015 mg/LSWMP-04 Cadmium, Total Recoverable 8/16/10 .000487 mg/LSWMP-04 Chemical Oxygen Demand 8/16/10 28 mg/LSWMP-04 Copper, Total Recoverable 8/16/10 .0113 mg/LSWMP-04 Iron, Total Recoverable 8/16/10 .89 mg/LSWMP-04 Lead, Total Recoverable 8/16/10 .00418 mg/LSWMP-04 Magnesium, Total Recoverable 8/16/10 2.32 mg/LSWMP-04 Mercury, Total Recoverable 8/16/10 <.000066 mg/LSWMP-04 Selenium, Total Recoverable 8/16/10 <.001 mg/LSWMP-04 Silver, Total Recoverable 8/16/10 <.0002 mg/LSWMP-04 Solids, total suspended 8/16/10 28 mg/LSWMP-04 Zinc, Total Recoverable 8/16/10 .0419 mg/LSWMP-05 Ammonia 8/16/10 .686 mg/LSWMP-05 Chemical Oxygen Demand 8/16/10 107 mg/LSWMP-12 Aluminum, Total Recoverable 8/16/10 .0309 mg/LSWMP-12 Arsenic, Total Recoverable 8/16/10 <.0015 mg/LSWMP-12 Cadmium, Total Recoverable 8/16/10 <.00011 mg/LSWMP-12 Copper, Total Recoverable 8/16/10 .00877 mg/LSWMP-12 Iron, Total Recoverable 8/16/10 .0835 mg/LSWMP-12 Lead, Total Recoverable 8/16/10 .0022 mg/LSWMP-12 Magnesium, Total Recoverable 8/16/10 .955 mg/LSWMP-12 Mercury, Total Recoverable 8/16/10 <.000066 mg/LSWMP-12 Selenium, Total Recoverable 8/16/10 <.001 mg/LSWMP-12 Silver, Total Recoverable 8/16/10 <.0002 mg/LSWMP-12 Zinc, Total Recoverable 8/16/10 .00697 mg/LSWMP-13 Aluminum, Total Recoverable 8/16/10 13.1 mg/LSWMP-13 Ammonia 8/16/10 .117 mg/LSWMP-13 Arsenic, Total Recoverable 8/16/10 .00333 mg/LSWMP-13 Cadmium, Total Recoverable 8/16/10 .000259 mg/LSWMP-13 Chemical Oxygen Demand 8/16/10 18.5 mg/LSWMP-13 Copper, Total Recoverable 8/16/10 .0155 mg/LSWMP-13 Cyanide, total 8/16/10 <.0017 mg/LSWMP-13 Iron, Total Recoverable 8/16/10 8.82 mg/LSWMP-13 Lead, Total Recoverable 8/16/10 .062 mg/LSWMP-13 Magnesium, Total Recoverable 8/16/10 3.16 mg/LSWMP-13 Mercury, Total Recoverable 8/16/10 <.000066 mg/LSWMP-13 Selenium, Total Recoverable 8/16/10 <.001 mg/LSWMP-13 Silver, Total Recoverable 8/16/10 <.0002 mg/LSWMP-13 Zinc, Total Recoverable 8/16/10 .0346 mg/LSWMP-16 Aluminum, Total Recoverable 8/16/10 65.3 mg/LSWMP-16 Arsenic, Total Recoverable 8/16/10 .0127 mg/LSWMP-16 Cadmium, Total Recoverable 8/16/10 .00137 mg/LSWMP-16 Copper, Total Recoverable 8/16/10 .0281 mg/LSWMP-16 Iron, Total Recoverable 8/16/10 42.1 mg/LSWMP-16 Lead, Total Recoverable 8/16/10 .0499 mg/LSWMP-16 Magnesium, Total Recoverable 8/16/10 16.8 mg/LSWMP-16 Mercury, Total Recoverable 8/16/10 <.000066 mg/LSWMP-16 Selenium, Total Recoverable 8/16/10 <.001 mg/LSWMP-16 Silver, Total Recoverable 8/16/10 .000277 mg/LSWMP-16 Zinc, Total Recoverable 8/16/10 .179 mg/L

Storm Water Sampling Results - 2010
MONITORING POINT ANALYTE SAMPLE DATE RESULTS
SWMP-17 Aluminum, Total Recoverable 8/16/10 7.92 mg/LSWMP-17 Arsenic, Total Recoverable 8/16/10 <.0015 mg/LSWMP-17 Cadmium, Total Recoverable 8/16/10 .00025 mg/LSWMP-17 Copper, Total Recoverable 8/16/10 .00822 mg/LSWMP-17 Iron, Total Recoverable 8/16/10 5.28 mg/LSWMP-17 Lead, Total Recoverable 8/16/10 .00992 mg/LSWMP-17 Magnesium, Total Recoverable 8/16/10 2.39 mg/LSWMP-17 Mercury, Total Recoverable 8/16/10 <.000066 mg/LSWMP-17 Selenium, Total Recoverable 8/16/10 <.001 mg/LSWMP-17 Silver, Total Recoverable 8/16/10 <.0002 mg/LSWMP-17 Zinc, Total Recoverable 8/16/10 .0425 mg/LSWMP-21 Aluminum, Total Recoverable 8/16/10 .687 mg/LSWMP-21 Arsenic, Total Recoverable 8/16/10 .00265 mg/LSWMP-21 Cadmium, Total Recoverable 8/16/10 <.00011 mg/LSWMP-21 Copper, Total Recoverable 8/16/10 .00731 mg/LSWMP-21 Iron, Total Recoverable 8/16/10 .425 mg/LSWMP-21 Lead, Total Recoverable 8/16/10 .00408 mg/LSWMP-21 Magnesium, Total Recoverable 8/16/10 1.19 mg/LSWMP-21 Mercury, Total Recoverable 8/16/10 <.000066 mg/LSWMP-21 Selenium, Total Recoverable 8/16/10 <.001 mg/LSWMP-21 Silver, Total Recoverable 8/16/10 <.0002 mg/LSWMP-21 Zinc, Total Recoverable 8/16/10 .0264 mg/LSWMP-22 Aluminum, Total Recoverable 8/16/10 16.5 mg/LSWMP-22 Arsenic, Total Recoverable 8/16/10 .00322 mg/LSWMP-22 Cadmium, Total Recoverable 8/16/10 .00039 mg/LSWMP-22 Copper, Total Recoverable 8/16/10 .0157 mg/LSWMP-22 Iron, Total Recoverable 8/16/10 11.2 mg/LSWMP-22 Lead, Total Recoverable 8/16/10 .0158 mg/LSWMP-22 Magnesium, Total Recoverable 8/16/10 5.65 mg/LSWMP-22 Mercury, Total Recoverable 8/16/10 <.000066 mg/LSWMP-22 Selenium, Total Recoverable 8/16/10 <.001 mg/LSWMP-22 Silver, Total Recoverable 8/16/10 <.0002 mg/LSWMP-22 Zinc, Total Recoverable 8/16/10 .0742 mg/LSWMP-04 Solids, total suspended 8/23/10 4.7 mg/LSWMP-04 Solids, total suspended 8/23/10 5 mg/LSWMP-05 Cyanide, total 8/23/10 <.0017 mg/LSWMP-05 Solids, total suspended 8/23/10 246 mg/LSWMP-11 Aluminum, Total Recoverable 8/23/10 69.6 mg/LSWMP-11 Ammonia 8/23/10 5.33 mg/LSWMP-11 Arsenic, Total Recoverable 8/23/10 .00273 mg/LSWMP-11 Cadmium, Total Recoverable 8/23/10 .0121 mg/LSWMP-11 Chemical Oxygen Demand 8/23/10 114 mg/LSWMP-11 Copper, Total Recoverable 8/23/10 .206 mg/LSWMP-11 Cyanide, total 8/23/10 .0753 mg/LSWMP-11 Iron, Total Recoverable 8/23/10 58 mg/LSWMP-11 Lead, Total Recoverable 8/23/10 .0266 mg/LSWMP-11 Magnesium, Total Recoverable 8/23/10 5.3 mg/LSWMP-11 Mercury, Total Recoverable 8/23/10 <.000066 mg/LSWMP-11 Selenium, Total Recoverable 8/23/10 <.001 mg/LSWMP-11 Silver, Total Recoverable 8/23/10 .0575 mg/LSWMP-11 Zinc, Total Recoverable 8/23/10 .0931 mg/L

Storm Water Sampling Results - 2010
MONITORING POINT ANALYTE SAMPLE DATE RESULTS
SWMP-08 Solids, total suspended 9/14/10 383 mg/LSWMP-12 Aluminum, Total Recoverable 9/14/10 .153 mg/LSWMP-12 Arsenic, Total Recoverable 9/14/10 <.0015 mg/LSWMP-12 Cadmium, Total Recoverable 9/14/10 <.00011 mg/LSWMP-12 Copper, Total Recoverable 9/14/10 .0029 mg/LSWMP-12 Iron, Total Recoverable 9/14/10 .131 mg/LSWMP-12 Lead, Total Recoverable 9/14/10 <.0005 mg/LSWMP-12 Magnesium, Total Recoverable 9/14/10 .774 mg/LSWMP-12 Mercury, Total Recoverable 9/14/10 <.000066 mg/LSWMP-12 Selenium, Total Recoverable 9/14/10 <.001 mg/LSWMP-12 Silver, Total Recoverable 9/14/10 <.0002 mg/LSWMP-12 Zinc, Total Recoverable 9/14/10 .00514 mg/LSWMP-04 Aluminum, Total Recoverable 9/24/10 .373 mg/LSWMP-04 Arsenic, Total Recoverable 9/24/10 .00191 mg/LSWMP-04 Cadmium, Total Recoverable 9/24/10 .000488 mg/LSWMP-04 Chemical Oxygen Demand 9/24/10 27.3 mg/LSWMP-04 Copper, Total Recoverable 9/24/10 .0106 mg/LSWMP-04 Iron, Total Recoverable 9/24/10 .347 mg/LSWMP-04 Lead, Total Recoverable 9/24/10 .003 mg/LSWMP-04 Magnesium, Total Recoverable 9/24/10 1.84 mg/LSWMP-04 Mercury, Total Recoverable 9/24/10 <.000066 mg/LSWMP-04 Selenium, Total Recoverable 9/24/10 <.001 mg/LSWMP-04 Silver, Total Recoverable 9/24/10 <.0002 mg/LSWMP-04 Solids, total suspended 9/24/10 8.67 mg/LSWMP-04 Zinc, Total Recoverable 9/24/10 .0134 mg/LSWMP-05 Aluminum, Total Recoverable 9/24/10 3.62 mg/LSWMP-05 Arsenic, Total Recoverable 9/24/10 <.0015 mg/LSWMP-05 Cadmium, Total Recoverable 9/24/10 .00131 mg/LSWMP-05 Copper, Total Recoverable 9/24/10 .0848 mg/LSWMP-05 Iron, Total Recoverable 9/24/10 2.5 mg/LSWMP-05 Lead, Total Recoverable 9/24/10 .0644 mg/LSWMP-05 Magnesium, Total Recoverable 9/24/10 4.23 mg/LSWMP-05 Mercury, Total Recoverable 9/24/10 <.000066 mg/LSWMP-05 Selenium, Total Recoverable 9/24/10 <.001 mg/LSWMP-05 Silver, Total Recoverable 9/24/10 <.0002 mg/LSWMP-05 Solids, total suspended 9/24/10 173 mg/LSWMP-05 Zinc, Total Recoverable 9/24/10 .599 mg/LSWMP-05 Zinc, Total Recoverable 9/24/10 .679 mg/LSWMP-06 Aluminum, Total Recoverable 9/24/10 7.82 mg/LSWMP-06 Ammonia 9/24/10 .132 mg/LSWMP-06 Arsenic, Total Recoverable 9/24/10 .00173 mg/LSWMP-06 Cadmium, Total Recoverable 9/24/10 .000135 mg/LSWMP-06 Chemical Oxygen Demand 9/24/10 38.7 mg/LSWMP-06 Copper, Total Recoverable 9/24/10 .00767 mg/LSWMP-06 Iron, Total Recoverable 9/24/10 5.13 mg/LSWMP-06 Lead, Total Recoverable 9/24/10 .00747 mg/LSWMP-06 Magnesium, Total Recoverable 9/24/10 6.25 mg/LSWMP-06 Mercury, Total Recoverable 9/24/10 <.000066 mg/LSWMP-06 Selenium, Total Recoverable 9/24/10 <.001 mg/LSWMP-06 Silver, Total Recoverable 9/24/10 <.0002 mg/LSWMP-06 Zinc, Total Recoverable 9/24/10 .0241 mg/LSWMP-13 Aluminum, Total Recoverable 9/24/10 .931 mg/LSWMP-13 Ammonia 9/24/10 .023 mg/LSWMP-13 Arsenic, Total Recoverable 9/24/10 <.0015 mg/L

Storm Water Sampling Results - 2010
MONITORING POINT ANALYTE SAMPLE DATE RESULTS
SWMP-13 Cadmium, Total Recoverable 9/24/10 <.00011 mg/LSWMP-13 Chemical Oxygen Demand 9/24/10 25.1 mg/LSWMP-13 Copper, Total Recoverable 9/24/10 .0151 mg/LSWMP-13 Iron, Total Recoverable 9/24/10 .616 mg/LSWMP-13 Lead, Total Recoverable 9/24/10 .0149 mg/LSWMP-13 Magnesium, Total Recoverable 9/24/10 .804 mg/LSWMP-13 Mercury, Total Recoverable 9/24/10 <.000066 mg/LSWMP-13 Selenium, Total Recoverable 9/24/10 <.001 mg/LSWMP-13 Silver, Total Recoverable 9/24/10 <.0002 mg/LSWMP-13 Zinc, Total Recoverable 9/24/10 .0429 mg/LSWMP-15 Aluminum, Total Recoverable 9/24/10 3.88 mg/LSWMP-15 Ammonia 9/24/10 .509 mg/LSWMP-15 Arsenic, Total Recoverable 9/24/10 <.0015 mg/LSWMP-15 Cadmium, Total Recoverable 9/24/10 .000483 mg/LSWMP-15 Copper, Total Recoverable 9/24/10 .0163 mg/LSWMP-15 Iron, Total Recoverable 9/24/10 1.42 mg/LSWMP-15 Lead, Total Recoverable 9/24/10 .0162 mg/LSWMP-15 Magnesium, Total Recoverable 9/24/10 4.32 mg/LSWMP-15 Mercury, Total Recoverable 9/24/10 <.000066 mg/LSWMP-15 Selenium, Total Recoverable 9/24/10 <.001 mg/LSWMP-15 Silver, Total Recoverable 9/24/10 <.0002 mg/LSWMP-15 Zinc, Total Recoverable 9/24/10 .117 mg/LSWMP-16 Ammonia 9/24/10 .063 mg/LSWMP-16 Chemical Oxygen Demand 9/24/10 13.7 mg/LSWMP-16 Cyanide, total 9/24/10 <.0017 mg/LSWMP-17 Aluminum, Total Recoverable 9/24/10 .68 mg/LSWMP-17 Ammonia 9/24/10 .064 mg/LSWMP-17 Arsenic, Total Recoverable 9/24/10 <.0015 mg/LSWMP-17 Cadmium, Total Recoverable 9/24/10 <.00011 mg/LSWMP-17 Chemical Oxygen Demand 9/24/10 16 mg/LSWMP-17 Copper, Total Recoverable 9/24/10 .00218 mg/LSWMP-17 Cyanide, total 9/24/10 <.0017 mg/LSWMP-17 Iron, Total Recoverable 9/24/10 .306 mg/LSWMP-17 Lead, Total Recoverable 9/24/10 .00312 mg/LSWMP-17 Magnesium, Total Recoverable 9/24/10 .853 mg/LSWMP-17 Mercury, Total Recoverable 9/24/10 <.000066 mg/LSWMP-17 Selenium, Total Recoverable 9/24/10 <.001 mg/LSWMP-17 Silver, Total Recoverable 9/24/10 <.0002 mg/LSWMP-17 Zinc, Total Recoverable 9/24/10 .00755 mg/LSWMP-19 Aluminum, Total Recoverable 9/24/10 5.62 mg/LSWMP-19 Ammonia 9/24/10 .037 mg/LSWMP-19 Arsenic, Total Recoverable 9/24/10 <.0015 mg/LSWMP-19 Cadmium, Total Recoverable 9/24/10 <.00011 mg/LSWMP-19 Chemical Oxygen Demand 9/24/10 18.3 mg/LSWMP-19 Copper, Total Recoverable 9/24/10 .00555 mg/LSWMP-19 Cyanide, total 9/24/10 <.0017 mg/LSWMP-19 Iron, Total Recoverable 9/24/10 3.5 mg/LSWMP-19 Lead, Total Recoverable 9/24/10 .00314 mg/LSWMP-19 Magnesium, Total Recoverable 9/24/10 3.82 mg/LSWMP-19 Mercury, Total Recoverable 9/24/10 <.000066 mg/LSWMP-19 Selenium, Total Recoverable 9/24/10 <.001 mg/LSWMP-19 Silver, Total Recoverable 9/24/10 <.0002 mg/LSWMP-19 Zinc, Total Recoverable 9/24/10 .025 mg/LSWMP-22 Ammonia 9/24/10 .258 mg/L
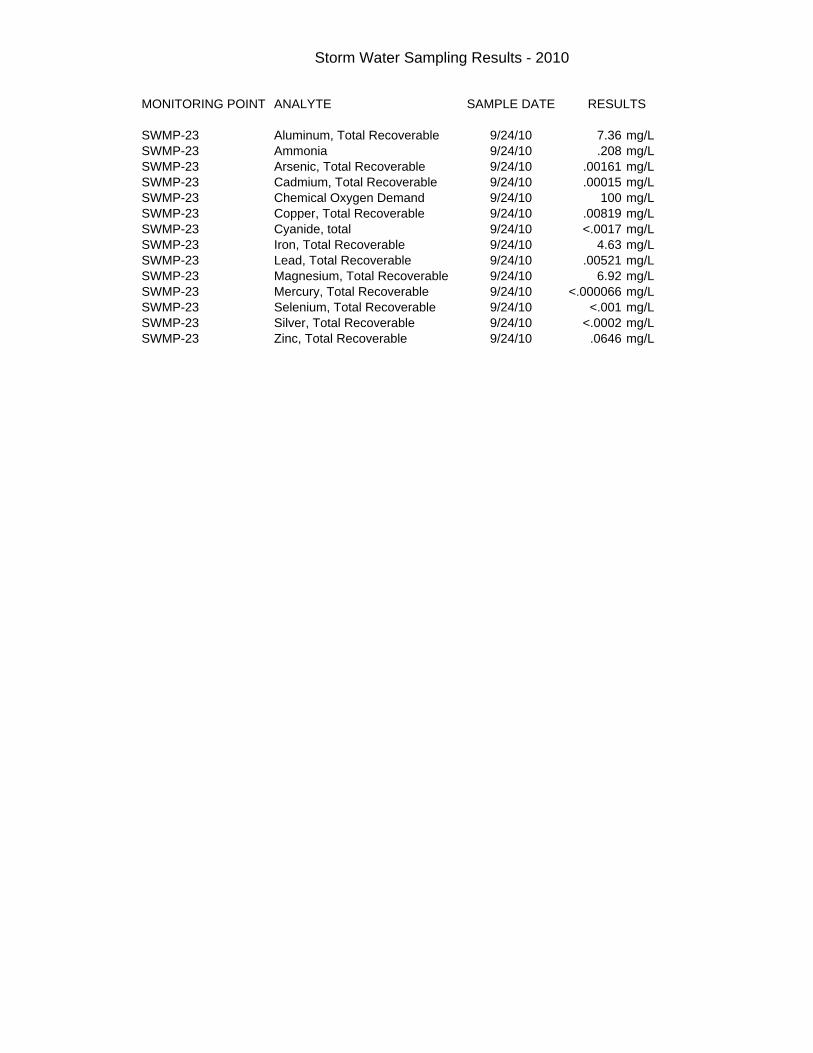
Storm Water Sampling Results - 2010
MONITORING POINT ANALYTE SAMPLE DATE RESULTS
SWMP-23 Aluminum, Total Recoverable 9/24/10 7.36 mg/LSWMP-23 Ammonia 9/24/10 .208 mg/LSWMP-23 Arsenic, Total Recoverable 9/24/10 .00161 mg/LSWMP-23 Cadmium, Total Recoverable 9/24/10 .00015 mg/LSWMP-23 Chemical Oxygen Demand 9/24/10 100 mg/LSWMP-23 Copper, Total Recoverable 9/24/10 .00819 mg/LSWMP-23 Cyanide, total 9/24/10 <.0017 mg/LSWMP-23 Iron, Total Recoverable 9/24/10 4.63 mg/LSWMP-23 Lead, Total Recoverable 9/24/10 .00521 mg/LSWMP-23 Magnesium, Total Recoverable 9/24/10 6.92 mg/LSWMP-23 Mercury, Total Recoverable 9/24/10 <.000066 mg/LSWMP-23 Selenium, Total Recoverable 9/24/10 <.001 mg/LSWMP-23 Silver, Total Recoverable 9/24/10 <.0002 mg/LSWMP-23 Zinc, Total Recoverable 9/24/10 .0646 mg/L