sap sales insights for retail 3 - sap help portal · pdf fileuser guide customer document...
TRANSCRIPT

User Guide Document Version: 1.0 – Final Date: September 24, 2014
CUSTOMER
SAP Sales Insights for Retail 3.0 User Guide
User Guide CUSTOMER
Typographic Conventions
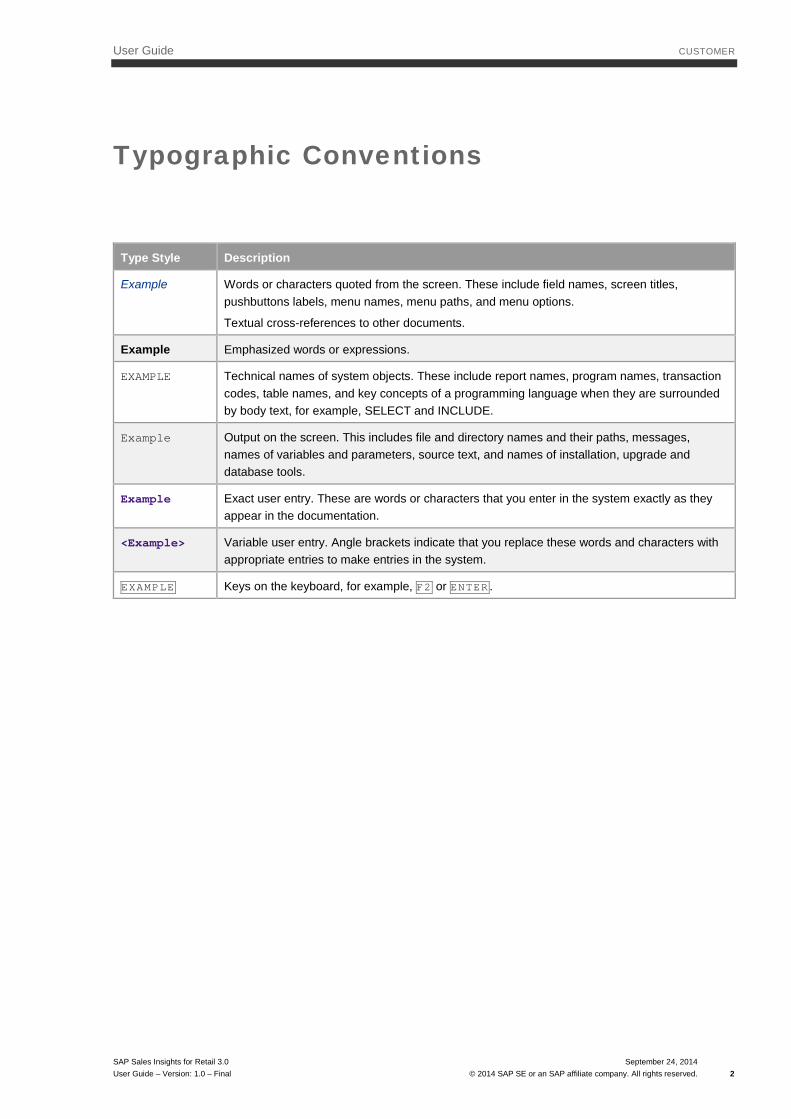
Type Style Description
Example Words or characters quoted from the screen. These include field names, screen titles, pushbuttons labels, menu names, menu paths, and menu options.
Textual cross-references to other documents.
Example Emphasized words or expressions.
EXAMPLE Technical names of system objects. These include report names, program names, transaction codes, table names, and key concepts of a programming language when they are surrounded by body text, for example, SELECT and INCLUDE.
Example Output on the screen. This includes file and directory names and their paths, messages, names of variables and parameters, source text, and names of installation, upgrade and database tools.
Example Exact user entry. These are words or characters that you enter in the system exactly as they appear in the documentation.
<Example> Variable user entry. Angle brackets indicate that you replace these words and characters with appropriate entries to make entries in the system.
EXAMPLE Keys on the keyboard, for example, F2 or ENTER .
SAP Sales Insights for Retail 3.0 User Guide – Version: 1.0 – Final
September 24, 2014 © 2014 SAP SE or an SAP affiliate company. All rights reserved. 2

User Guide CUSTOMER
Document History
Version Status Date Change
1.0 Final September 24, 2014 Final version
SAP Sales Insights for Retail 3.0 User Guide – Version: 1.0 – Final
September 24, 2014 © 2014 SAP SE or an SAP affiliate company. All rights reserved. 3
User Guide CUSTOMER
Table of Contents
1 Getting Started ..................................................................................................................... 6 1.1 Before You Start ................................................................................................................................................ 6 1.2 What Is SAP Sales Insights for Retail? .............................................................................................................. 6 1.3 Key Concepts .................................................................................................................................................... 7
2 SAP Sales Insights for Retail Basics .................................................................................... 8 2.1 Logging On to the Application............................................................................................................................ 8 2.2 Getting to Know the Application......................................................................................................................... 8 2.3 Key Metrics (KPIs) ........................................................................................................................................... 11
3 Setting the Scope of the Analysis ...................................................................................... 13 3.1 Selecting a Store Set ....................................................................................................................................... 14 3.2 Selecting Product Sets .................................................................................................................................... 16 3.3 Setting Additional Filters .................................................................................................................................. 18 3.4 Setting the Time Frame ................................................................................................................................... 18 3.5 Setting Options for the Affinity and Key Item List Calculation .......................................................................... 19 3.6 Restoring Previous Filters ............................................................................................................................... 22
4 Performing the Analysis ...................................................................................................... 23 4.1 Affinity Insight .................................................................................................................................................. 23 4.2 Key Item List .................................................................................................................................................... 26 4.3 Value Driver Tree ............................................................................................................................................ 28 4.4 Saving the Results for Further Analysis ........................................................................................................... 31
SAP Sales Insights for Retail 3.0 User Guide – Version: 1.0 – Final
September 24, 2014 © 2014 SAP SE or an SAP affiliate company. All rights reserved. 4
User Guide CUSTOMER
Table of Figures
Figure 1: Login Screen ................................................................................................................................................... 8 Figure 2: Available Workspaces..................................................................................................................................... 9 Figure 3: Parameter Selection Menu ........................................................................................................................... 10 Figure 4: Restoring Filters ............................................................................................................................................ 13 Figure 5: Selecting a Set of Stores .............................................................................................................................. 14 Figure 6: Searching for Stores ..................................................................................................................................... 15 Figure 7: Selecting Tags for Stores .............................................................................................................................. 15 Figure 8: Selecting Product Sets .................................................................................................................................. 16 Figure 9: Searching for Products ................................................................................................................................. 17 Figure 10: Selecting Tags for Products ........................................................................................................................ 17 Figure 11: Setting Additional Filters ............................................................................................................................. 18 Figure 12: Setting the Time Frame .............................................................................................................................. 19 Figure 13: Additional Option for the Affinity Calculation ............................................................................................... 20 Figure 14: Switching Between Product Levels ............................................................................................................. 20 Figure 15: Specifying the Key Item Level ..................................................................................................................... 21 Figure 16: Rating the Metrics for the Key Item List ...................................................................................................... 22 Figure 17: Restoring Previous Filters ........................................................................................................................... 22 Figure 18: Switching Between Screen Areas ............................................................................................................... 23 Figure 19: Affinity Heat Map ........................................................................................................................................ 24 Figure 20: Affinity Pie Chart ......................................................................................................................................... 25 Figure 21: Key Item List: Table-Based View ................................................................................................................ 26 Figure 22: Sorting and Filtering the Key Item List ........................................................................................................ 27 Figure 23: Displaying the Development over Time for Key Items ................................................................................ 27 Figure 24: Key Item Scatter Plot Chart ........................................................................................................................ 28 Figure 25: Displaying Details in the Scatter Plot Chart ................................................................................................ 28 Figure 26: Setting Time Frames for the Value Driver Tree .......................................................................................... 29 Figure 27: Value Driver Tree ........................................................................................................................................ 29 Figure 28: Vendor Bar Chart ........................................................................................................................................ 30 Figure 29: Creating Snapshots .................................................................................................................................... 31
SAP Sales Insights for Retail 3.0 User Guide – Version: 1.0 – Final
September 24, 2014 © 2014 SAP SE or an SAP affiliate company. All rights reserved. 5

User Guide CUSTOMER
1 Getting Started
1.1 Before You Start
Before you start working with SAP Sales Insights for Retail, make sure that the following prerequisites are met:
• One of the following web browsers is installed on your machine:
o Microsoft Internet Explorer 10
o Mozilla Firefox 32 or above
o Google Chrome 37 or above
• You have been provided the URL to call up the application.
• You are authorized to access the application.
1.2 What Is SAP Sales Insights for Retail?
SAP Sales Insights for Retail is tailored to meet your needs as retail category managers and merchandizing managers. This highly flexible reporting tool allows you to analyze your point-of-sales data on market basket level and to determine product affinities.
For example, you can analyze the following:
• Absolute numbers of market baskets that contain products from two selected sets of the product hierarchy
• Average multiplicities of products in market baskets
• Change of multiplicities during promotion
• Causal relationships between products
• Total market basket sales or profits associated with specific products
• Most successful and least successful products or product groups for the selected stores and time frame
• Root causes for changes in revenue and profit for the selected stores and products
SAP Sales Insights for Retail is based on SAP HANA®, SAP's in-memory database. This technology allows you to perform real-time computations on large data sets.
SAP Sales Insights for Retail 3.0 User Guide – Version: 1.0 – Final
September 24, 2014 © 2014 SAP SE or an SAP affiliate company. All rights reserved. 6

User Guide CUSTOMER
1.3 Key Concepts
Concept Explanation
Affinity A quantitative relationship that is determined based on two products or product sets purchased together in one market basket.
Analyzing the affinity allows you to discover co-occurrence relationships among products or product groups in a set of market baskets. The affinity is calculated by applying certain metrics and filters on the point-of-sales data in the database.
Heat map The graphical representation of data, where the individual values contained in a matrix are visualized as colors.
Line item A distinct SKU that is purchased in one sales transaction.
Market basket A sales transaction comprising the goods purchased by a certain customer at a certain point in time at a certain location.
Metric A key performance indicator (KPI) that is included in or can be directly derived from point-of-sales data.
Product set Any combination of items from any level of the product hierarchy.
Snapshot A set of filters and analysis results that is saved for later reference.
Stockkeeping Unit (SKU)
A distinct item that is offered for sale. The SKU is the lowest level in the product hierarchy.
Value driver tree The graphical representation of a metric concept that splits value-based metrics into their sub-metrics to show the source of the value added.
The value driver tree shows how KPIs change over time and how they affect each other. This allows you to quickly analyze root causes for revenue and profit changes in any set of stores and on any level of the product hierarchy.
SAP Sales Insights for Retail 3.0 User Guide – Version: 1.0 – Final
September 24, 2014 © 2014 SAP SE or an SAP affiliate company. All rights reserved. 7
User Guide CUSTOMER
2 SAP Sales Insights for Retail Basics
The following sections help you to familiarize yourself with SAP Sales Insights for Retail. They provide information about the available workspaces as well as filter and configuration options so that you can quickly get up to speed with the application.
2.1 Logging On to the Application
To open the SAP Sales Insights for Retail workspace, proceed as follows:
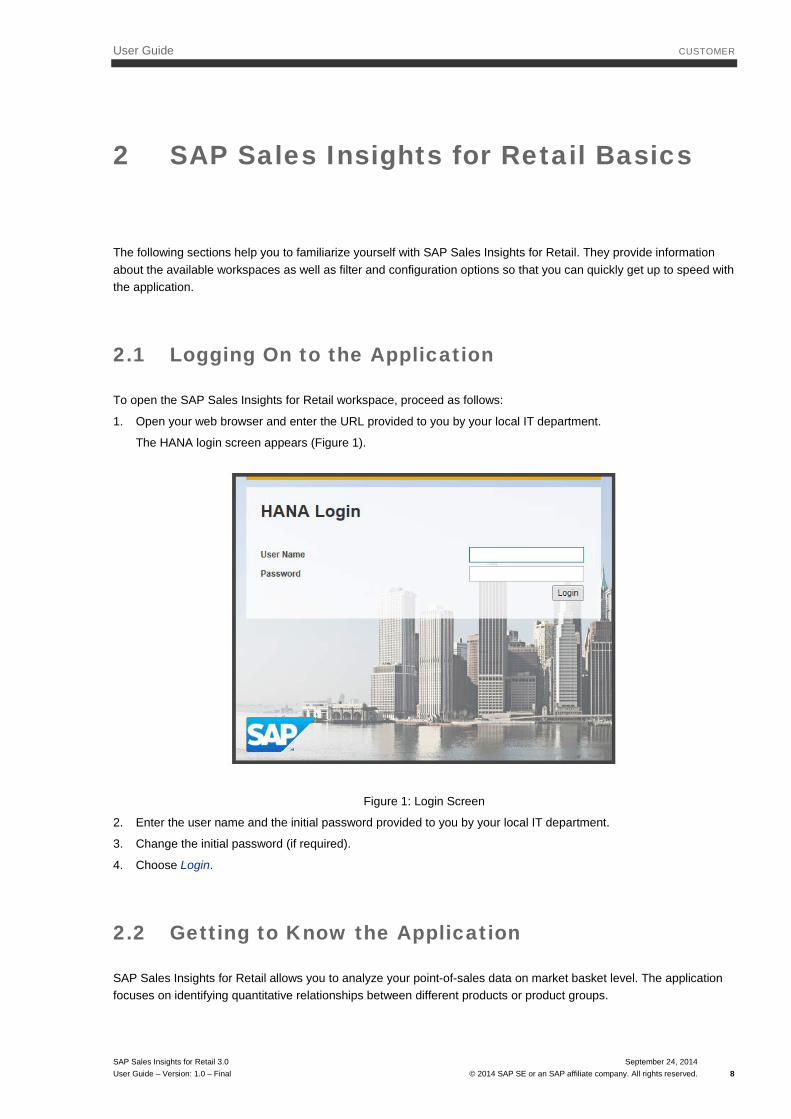
1. Open your web browser and enter the URL provided to you by your local IT department.
The HANA login screen appears (Figure 1).
Figure 1: Login Screen
2. Enter the user name and the initial password provided to you by your local IT department.
3. Change the initial password (if required).
4. Choose Login.
2.2 Getting to Know the Application
SAP Sales Insights for Retail allows you to analyze your point-of-sales data on market basket level. The application focuses on identifying quantitative relationships between different products or product groups.
SAP Sales Insights for Retail 3.0 User Guide – Version: 1.0 – Final
September 24, 2014 © 2014 SAP SE or an SAP affiliate company. All rights reserved. 8

User Guide CUSTOMER
You select the data you want to analyze by specifying various filter criteria, for example, stores, product sets, and time frame for the analysis.
Note
The screenshots in this document are intended to provide an example of the user interface. The actual options available to you may differ. This depends on the data in your database as well as on the system setup.
Available Workspaces
You can use the following workspaces to analyze your point-of-sales data (Figure 2):
Figure 2: Available Workspaces
• Affinity Insight
This workspace enables you to analyze the composition of market baskets, for example, by determining how many customers purchased a certain combination of products.
• Key Item List
This workspace helps you to find the most successful or least successful products or product groups in the selected stores or in a certain area of your assortment. You can also use the key item list to identify the stores or regions that are most or least successful at selling a selected set of products.
• Value Driver Tree
This workspace allows you to identify what drives an increase or decrease in business performance for the selected stores and products or product groups by comparing profit-related KPIs in two different time frames.
For more information about the individual workspaces, see Performing the Analysis.
Parameter Selection Menu
The parameter selection menu is available in all three workspaces. Using the menu, you set the scope of the analysis and trigger the calculation run (Figure 3).
SAP Sales Insights for Retail 3.0 User Guide – Version: 1.0 – Final
September 24, 2014 © 2014 SAP SE or an SAP affiliate company. All rights reserved. 9

User Guide CUSTOMER
Figure 3: Parameter Selection Menu
The menu consists of six panels:
• STORES
Using this panel you select a list of stores that you want to include in the analysis.
• PRODUCTS
Using this panel you select the product sets on which you want to base your analysis.
• FILTERS
Using this panel you limit the scope of your analysis by setting filters, such as customer type, products on promotion only or time of day at which the purchase was made.
• TIME
Using this panel you set the time frame for the analysis.
• OPTIONS
Using this panel you can make further settings that are related to the calculation and display of the analysis results. For example, you rate the metrics used to display the key item list to define the sequence in which the results are displayed.
• CALCULATE
By clicking on this panel, you trigger the analysis for the current settings. Note that the system calculates the results for the workspace that is currently displayed.
For more information about how to set the scope of your analysis, see Setting the Scope of the Analysis.
SAP Sales Insights for Retail 3.0 User Guide – Version: 1.0 – Final
September 24, 2014 © 2014 SAP SE or an SAP affiliate company. All rights reserved. 10
User Guide CUSTOMER
2.3 Key Metrics (KPIs)
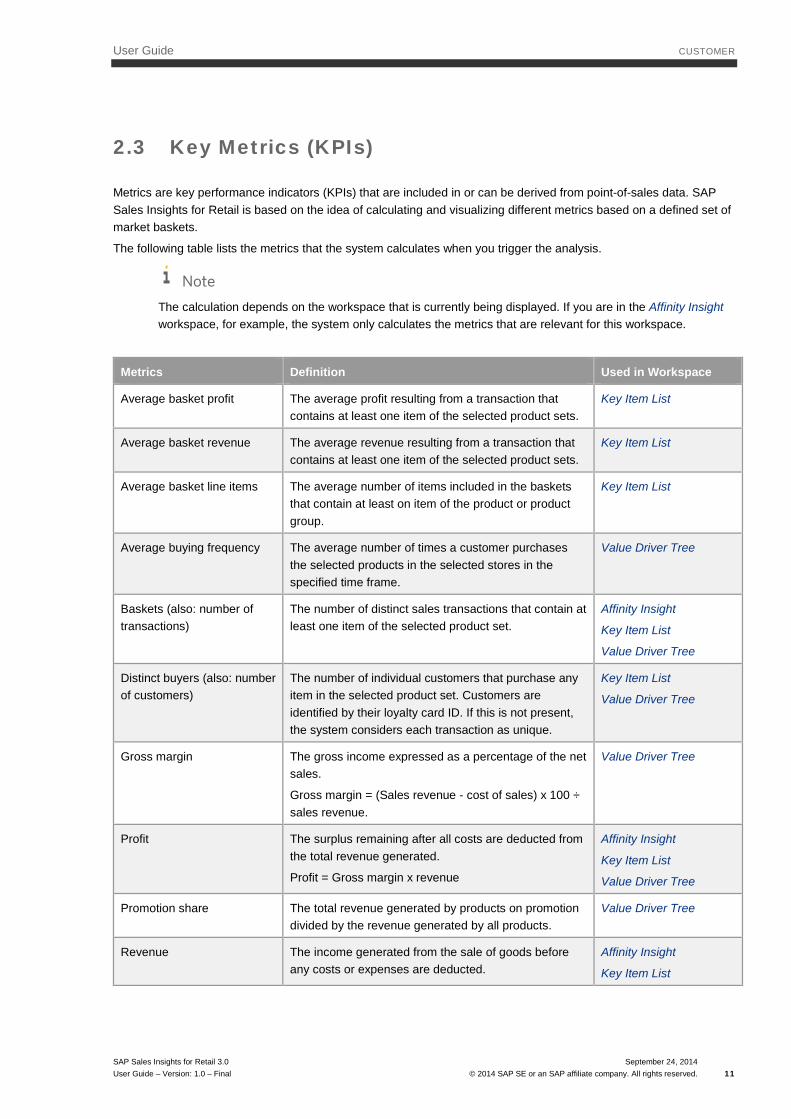
Metrics are key performance indicators (KPIs) that are included in or can be derived from point-of-sales data. SAP Sales Insights for Retail is based on the idea of calculating and visualizing different metrics based on a defined set of market baskets.
The following table lists the metrics that the system calculates when you trigger the analysis.
Note
The calculation depends on the workspace that is currently being displayed. If you are in the Affinity Insight workspace, for example, the system only calculates the metrics that are relevant for this workspace.
Metrics Definition Used in Workspace
Average basket profit The average profit resulting from a transaction that contains at least one item of the selected product sets.
Key Item List
Average basket revenue The average revenue resulting from a transaction that contains at least one item of the selected product sets.
Key Item List
Average basket line items The average number of items included in the baskets that contain at least on item of the product or product group.
Key Item List
Average buying frequency The average number of times a customer purchases the selected products in the selected stores in the specified time frame.
Value Driver Tree
Baskets (also: number of transactions)
The number of distinct sales transactions that contain at least one item of the selected product set.
Affinity Insight
Key Item List
Value Driver Tree
Distinct buyers (also: number of customers)
The number of individual customers that purchase any item in the selected product set. Customers are identified by their loyalty card ID. If this is not present, the system considers each transaction as unique.
Key Item List
Value Driver Tree
Gross margin The gross income expressed as a percentage of the net sales.
Gross margin = (Sales revenue - cost of sales) x 100 ÷ sales revenue.
Value Driver Tree
Profit The surplus remaining after all costs are deducted from the total revenue generated.
Profit = Gross margin x revenue
Affinity Insight
Key Item List
Value Driver Tree
Promotion share The total revenue generated by products on promotion divided by the revenue generated by all products.
Value Driver Tree
Revenue The income generated from the sale of goods before any costs or expenses are deducted.
Affinity Insight
Key Item List
SAP Sales Insights for Retail 3.0 User Guide – Version: 1.0 – Final
September 24, 2014 © 2014 SAP SE or an SAP affiliate company. All rights reserved. 11

User Guide CUSTOMER
Metrics Definition Used in Workspace
Value Driver Tree
Score A numeric expression that is calculated based on the rating of a metric on a scale from 0 to 100. The final score is the weighted average value resulting from the values calculated for the individual metrics.
Key Item List
Share The number of times (in percent) items of both product sets A and B appear together in distinct transactions relative to the total number of distinct transactions.
Affinity Insight
Share of A in baskets containing B
The share of transactions that include product set A relative to the number of transactions that include product set B.
Affinity Insight
Share of B in baskets containing A
The share of transactions that include B relative to the number of transactions that include A
Affinity Insight
Unit sales The total number of units (SKUs) of a product that are sold in distinct transactions.
Affinity Insight
Key Item List
SAP Sales Insights for Retail 3.0 User Guide – Version: 1.0 – Final
September 24, 2014 © 2014 SAP SE or an SAP affiliate company. All rights reserved. 12

User Guide CUSTOMER
3 Setting the Scope of the Analysis
You set the scope of your analysis using the panels in the parameter selection menu. The panels are displayed in all three workspaces and allow you to adjust your settings at any time.
The available settings may vary depending on the workspace you are in. For example, to calculate product affinities, you need to select two product sets A and B. In contrast, the metrics for the key item list and the value driver list are calculated for one product set only.
Note
If you calculate product affinities in the Affinity Insight workspace and you do not change your product selection for the other workspaces, the system uses product set A when calculating the metrics for the key item list and the value driver tree.
To make settings, you simply click on the respective panel. This opens a dialog box. Once you have made your selection, simply close the dialog box again to apply your settings.
The overall process is as follows:
1. You define a set of stores.
2. a) To analyze product affinities, you define two product sets.
b) To calculate the metrics for the key item list or the value driver tree, you define one product set.
3. You set additional filters as required.
4. a) You set a time frame for the analysis.
b) To generate a value driver tree for the selected product set, you set two time frames.
5. You define further options. For example, you can define whether product affinities are calculated on SKU level. In addition, you rate the metrics for the key item list.
6. You start the analysis by triggering the calculation run.
You can change your settings at any time during a session. Simply choose CALCULATE to apply the new settings once you have finished adjusting the scope.
Note
You can restore the filters that were applied in the last analysis run. To do so, choose Restore Filters (Figure 4). Note that this is only possible until you trigger a new calculation run. The time stamp next to the button shows the date and time of the last calculation run.
Figure 4: Restoring Filters
The following sections provide more detailed information about the individual steps.
SAP Sales Insights for Retail 3.0 User Guide – Version: 1.0 – Final
September 24, 2014 © 2014 SAP SE or an SAP affiliate company. All rights reserved. 13
User Guide CUSTOMER
3.1 Selecting a Store Set
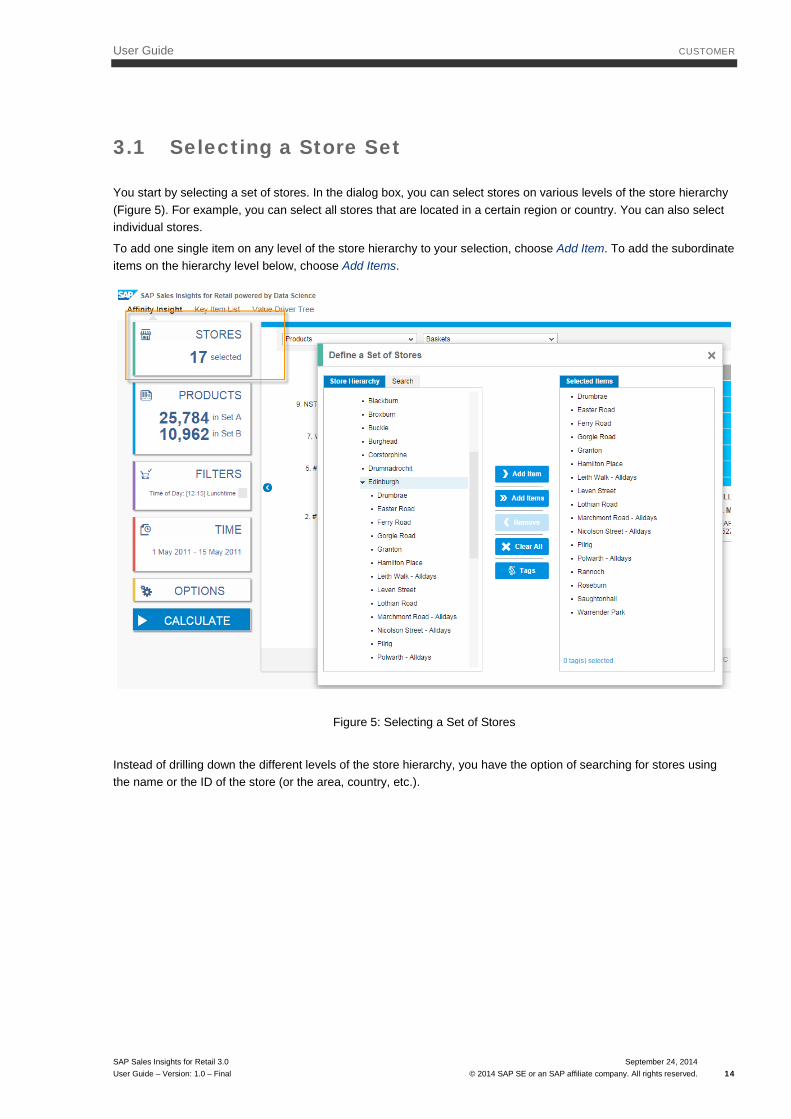
You start by selecting a set of stores. In the dialog box, you can select stores on various levels of the store hierarchy (Figure 5). For example, you can select all stores that are located in a certain region or country. You can also select individual stores.
To add one single item on any level of the store hierarchy to your selection, choose Add Item. To add the subordinate items on the hierarchy level below, choose Add Items.
Figure 5: Selecting a Set of Stores
Instead of drilling down the different levels of the store hierarchy, you have the option of searching for stores using the name or the ID of the store (or the area, country, etc.).
SAP Sales Insights for Retail 3.0 User Guide – Version: 1.0 – Final
September 24, 2014 © 2014 SAP SE or an SAP affiliate company. All rights reserved. 14

User Guide CUSTOMER
Figure 6: Searching for Stores
You can even search for a list of stores. For example, to search for multiple IDs or names, you can copy a list of store IDs or store names from a document and paste them into the search field (Figure 6). Note that the individual entries must be separated by line breaks.
Example
You type 0002 into the search field and press Enter . You then enter 0003.The system shows all stores with the ID number 0002 and all stores with the ID number 0003.
You can further narrow down your selection by filtering the available stores using one or multiple tags that are currently assigned to them (if available) (Figure 7).
Figure 7: Selecting Tags for Stores
Once you have defined a set of stores, close the dialog box. The system displays the total number of selected stores in the STORES panel.
SAP Sales Insights for Retail 3.0 User Guide – Version: 1.0 – Final
September 24, 2014 © 2014 SAP SE or an SAP affiliate company. All rights reserved. 15
User Guide CUSTOMER
3.2 Selecting Product Sets
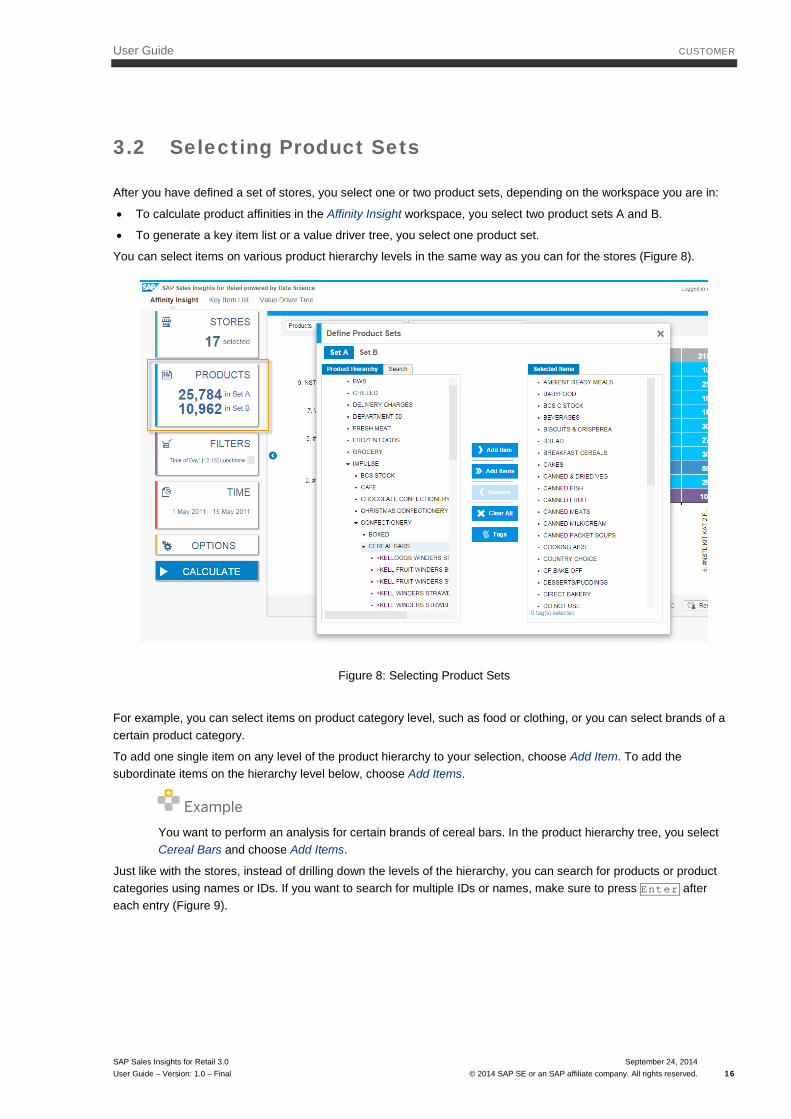
After you have defined a set of stores, you select one or two product sets, depending on the workspace you are in:
• To calculate product affinities in the Affinity Insight workspace, you select two product sets A and B.
• To generate a key item list or a value driver tree, you select one product set.
You can select items on various product hierarchy levels in the same way as you can for the stores (Figure 8).
Figure 8: Selecting Product Sets
For example, you can select items on product category level, such as food or clothing, or you can select brands of a certain product category.
To add one single item on any level of the product hierarchy to your selection, choose Add Item. To add the subordinate items on the hierarchy level below, choose Add Items.
Example
You want to perform an analysis for certain brands of cereal bars. In the product hierarchy tree, you select Cereal Bars and choose Add Items.
Just like with the stores, instead of drilling down the levels of the hierarchy, you can search for products or product categories using names or IDs. If you want to search for multiple IDs or names, make sure to press Enter after each entry (Figure 9).
SAP Sales Insights for Retail 3.0 User Guide – Version: 1.0 – Final
September 24, 2014 © 2014 SAP SE or an SAP affiliate company. All rights reserved. 16

User Guide CUSTOMER
Figure 9: Searching for Products
If tags have been assigned to products or product categories, you can further narrow down your selection by selecting one or multiple tags (Figure 10).
Figure 10: Selecting Tags for Products
Once you have made your selection, close the dialog box. In the PRODUCTS panel, the system displays the total number of products you have selected.
SAP Sales Insights for Retail 3.0 User Guide – Version: 1.0 – Final
September 24, 2014 © 2014 SAP SE or an SAP affiliate company. All rights reserved. 17
User Guide CUSTOMER
3.3 Setting Additional Filters
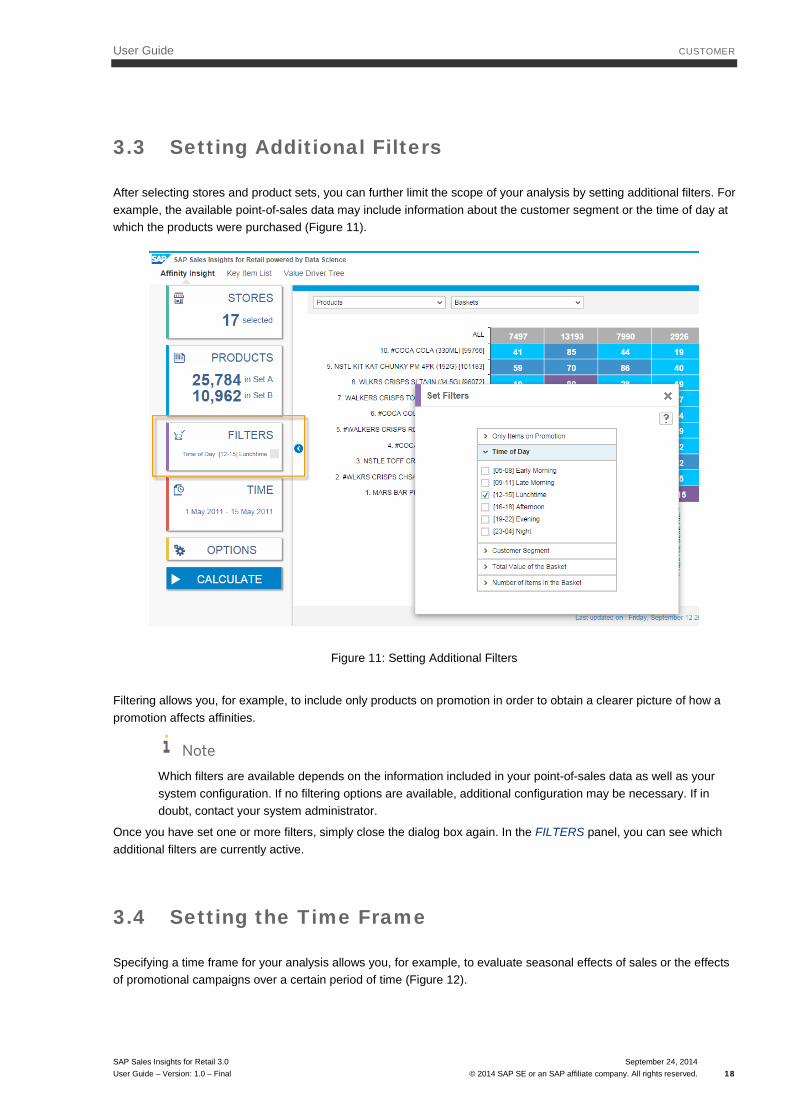
After selecting stores and product sets, you can further limit the scope of your analysis by setting additional filters. For example, the available point-of-sales data may include information about the customer segment or the time of day at which the products were purchased (Figure 11).
Figure 11: Setting Additional Filters
Filtering allows you, for example, to include only products on promotion in order to obtain a clearer picture of how a promotion affects affinities.
Note
Which filters are available depends on the information included in your point-of-sales data as well as your system configuration. If no filtering options are available, additional configuration may be necessary. If in doubt, contact your system administrator.
Once you have set one or more filters, simply close the dialog box again. In the FILTERS panel, you can see which additional filters are currently active.
3.4 Setting the Time Frame
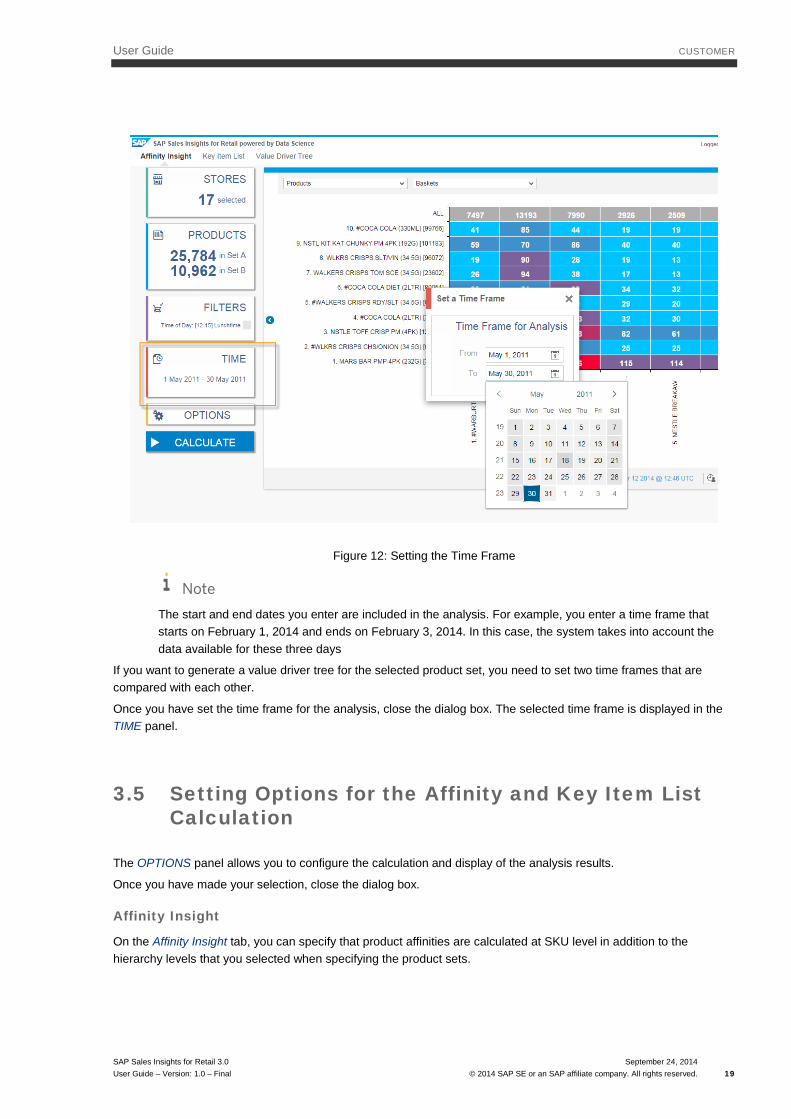
Specifying a time frame for your analysis allows you, for example, to evaluate seasonal effects of sales or the effects of promotional campaigns over a certain period of time (Figure 12).
SAP Sales Insights for Retail 3.0 User Guide – Version: 1.0 – Final
September 24, 2014 © 2014 SAP SE or an SAP affiliate company. All rights reserved. 18
User Guide CUSTOMER
Figure 12: Setting the Time Frame
Note
The start and end dates you enter are included in the analysis. For example, you enter a time frame that starts on February 1, 2014 and ends on February 3, 2014. In this case, the system takes into account the data available for these three days
If you want to generate a value driver tree for the selected product set, you need to set two time frames that are compared with each other.
Once you have set the time frame for the analysis, close the dialog box. The selected time frame is displayed in the TIME panel.
3.5 Setting Options for the Affinity and Key Item List Calculation
The OPTIONS panel allows you to configure the calculation and display of the analysis results.
Once you have made your selection, close the dialog box.
Affinity Insight
On the Affinity Insight tab, you can specify that product affinities are calculated at SKU level in addition to the hierarchy levels that you selected when specifying the product sets.
SAP Sales Insights for Retail 3.0 User Guide – Version: 1.0 – Final
September 24, 2014 © 2014 SAP SE or an SAP affiliate company. All rights reserved. 19

User Guide CUSTOMER
Figure 13: Additional Option for the Affinity Calculation
Example
You select set A = Beverages and set B = Bread. If you do not activate the calculation at SKU level, the system analyzes how many transactions contain at least one item from the beverages category and one item from the bread category. If you activate the calculation at SKU level, the analysis is performed for any possible combination of SKUs in these categories.
When the results are displayed in the Affinity Insight workspace (Figure 14), you can use the combo box to switch between displaying the results for the selected product category level (Levels) or on SKU level (Products).
Figure 14: Switching Between Product Levels
Key Item List
On the Key Item List tab, you configure the calculation and display of the key item list:
1. You specify the key item level (Figure 15). This is the hierarchy level for which the system calculates the metrics.
SAP Sales Insights for Retail 3.0 User Guide – Version: 1.0 – Final
September 24, 2014 © 2014 SAP SE or an SAP affiliate company. All rights reserved. 20

User Guide CUSTOMER
Figure 15: Specifying the Key Item Level
You can choose between the following levels.
Note
Which levels are available to you and how these are named depends on your system configuration.
o Product SKU.
You need to select this level if you want to evaluate the unit sales and items per basket in the key item list.
o Product subcategory
o Product category
o Product division
o Product department
o Store
o Store area
o Store country
o Store chain
2. You determine which metrics in the key item list are most important by rating them on a scale from 1 to 100 (Figure 16).
SAP Sales Insights for Retail 3.0 User Guide – Version: 1.0 – Final
September 24, 2014 © 2014 SAP SE or an SAP affiliate company. All rights reserved. 21

User Guide CUSTOMER
Figure 16: Rating the Metrics for the Key Item List
The following metrics are available:
o Revenue
o Profit
o Unit sales
o Distinct buyers
o Average basket revenue
o Average basket profit
o Number of baskets
o Average item lines
Based on your rating, the system calculates the score for all metrics. The overall score that is displayed in the key item list is the weighted average value created from the score for the individual metrics.
3. You specify whether to display the items with the highest score or those with the lowest score in the key item list.
To display the items with the highest score, you select the Higher Is Better radio button. To display the items with the lowest score, you select the Lower is Better radio button (Figure 16).
3.6 Restoring Previous Filters
You can restore the filters that were applied in the last analysis run. To do so, choose Restore Filters (Figure 17). Note that this is only possible until you trigger a new analysis run. The time stamp next to the button shows the date and time of the last calculation.
Figure 17: Restoring Previous Filters
SAP Sales Insights for Retail 3.0 User Guide – Version: 1.0 – Final
September 24, 2014 © 2014 SAP SE or an SAP affiliate company. All rights reserved. 22

User Guide CUSTOMER
4 Performing the Analysis
This section of the user guide describes the available workspaces that you can use to analyze your point-of-sales data. Each workspace consists of two screen areas that allow you to visualize the analysis results according to your requirements.
To switch back and forth between the screen areas, use the centered arrows at the edge of the screen area (Figure 18).
Figure 18: Switching Between Screen Areas
4.1 Affinity Insight
The Affinity Insight workspace allows you to calculate product affinities, for example, by calculating how often products of the two selected product sets are sold together.
You can visualize the calculation results as a heat map or as a pie chart.
Heat Map
Using the combo boxes you can specify whether to display the results for the top product levels or for the top product pairs (SKUs).
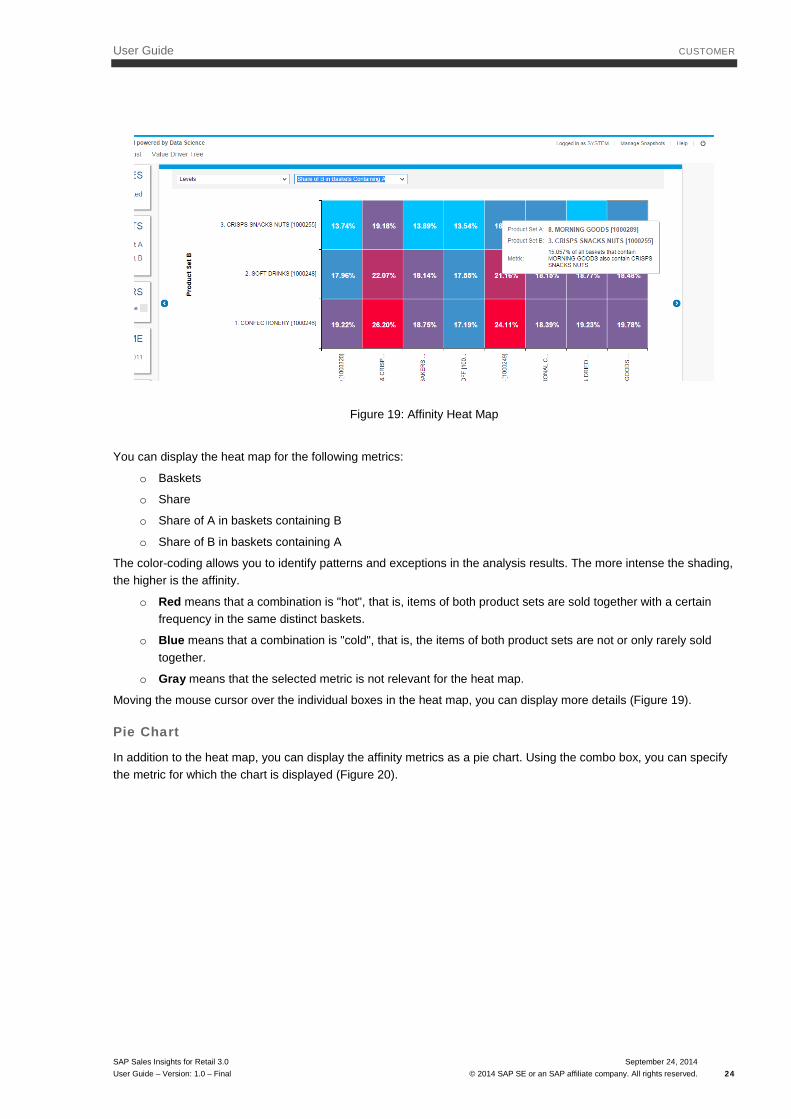
The items in product set A are displayed on the x-axis and the items of product set B are displayed on the y-axis of the heat map (Figure 19).
SAP Sales Insights for Retail 3.0 User Guide – Version: 1.0 – Final
September 24, 2014 © 2014 SAP SE or an SAP affiliate company. All rights reserved. 23
User Guide CUSTOMER
Figure 19: Affinity Heat Map
You can display the heat map for the following metrics:
o Baskets
o Share
o Share of A in baskets containing B
o Share of B in baskets containing A
The color-coding allows you to identify patterns and exceptions in the analysis results. The more intense the shading, the higher is the affinity.
o Red means that a combination is "hot", that is, items of both product sets are sold together with a certain frequency in the same distinct baskets.
o Blue means that a combination is "cold", that is, the items of both product sets are not or only rarely sold together.
o Gray means that the selected metric is not relevant for the heat map.
Moving the mouse cursor over the individual boxes in the heat map, you can display more details (Figure 19).
Pie Chart
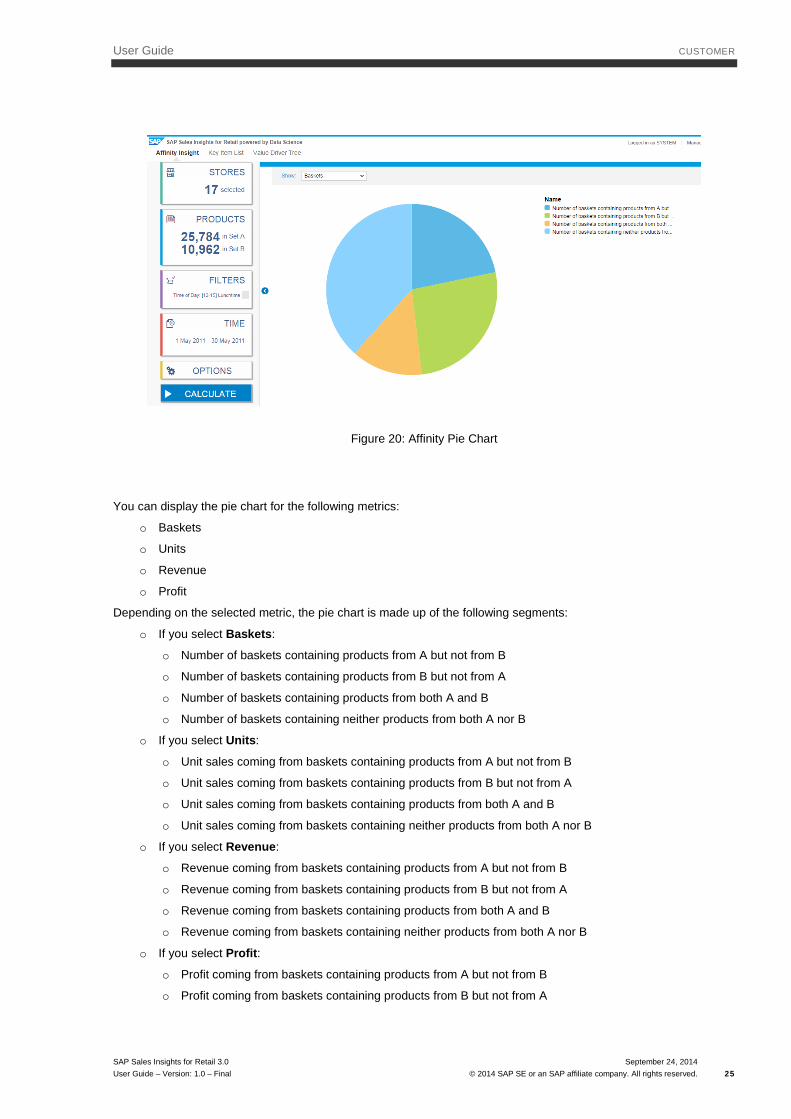
In addition to the heat map, you can display the affinity metrics as a pie chart. Using the combo box, you can specify the metric for which the chart is displayed (Figure 20).
SAP Sales Insights for Retail 3.0 User Guide – Version: 1.0 – Final
September 24, 2014 © 2014 SAP SE or an SAP affiliate company. All rights reserved. 24
User Guide CUSTOMER
Figure 20: Affinity Pie Chart
You can display the pie chart for the following metrics:
o Baskets
o Units
o Revenue
o Profit
Depending on the selected metric, the pie chart is made up of the following segments:
o If you select Baskets:
o Number of baskets containing products from A but not from B
o Number of baskets containing products from B but not from A
o Number of baskets containing products from both A and B
o Number of baskets containing neither products from both A nor B
o If you select Units:
o Unit sales coming from baskets containing products from A but not from B
o Unit sales coming from baskets containing products from B but not from A
o Unit sales coming from baskets containing products from both A and B
o Unit sales coming from baskets containing neither products from both A nor B
o If you select Revenue:
o Revenue coming from baskets containing products from A but not from B
o Revenue coming from baskets containing products from B but not from A
o Revenue coming from baskets containing products from both A and B
o Revenue coming from baskets containing neither products from both A nor B
o If you select Profit:
o Profit coming from baskets containing products from A but not from B
o Profit coming from baskets containing products from B but not from A
SAP Sales Insights for Retail 3.0 User Guide – Version: 1.0 – Final
September 24, 2014 © 2014 SAP SE or an SAP affiliate company. All rights reserved. 25
User Guide CUSTOMER
o Profit coming from baskets containing products from both A and B
o Profit coming from baskets containing neither products from both A nor B
Moving the mouse over the individual segments, you can display more detailed information.
4.2 Key Item List
The Key Item List workspace allows you to quickly identify the most successful and the least successful products or product groups. The system creates the key item list based on the stores and product set you selected.
Note
If you calculate product affinities in the Affinity Insight workspace and you do not change your product selection when moving to the Key Item List workspace, the system takes product set A as a basis when calculating the metrics for the key item list.
You can visualize the calculation results as a table or as a scatter plot chart.
Table-Based View
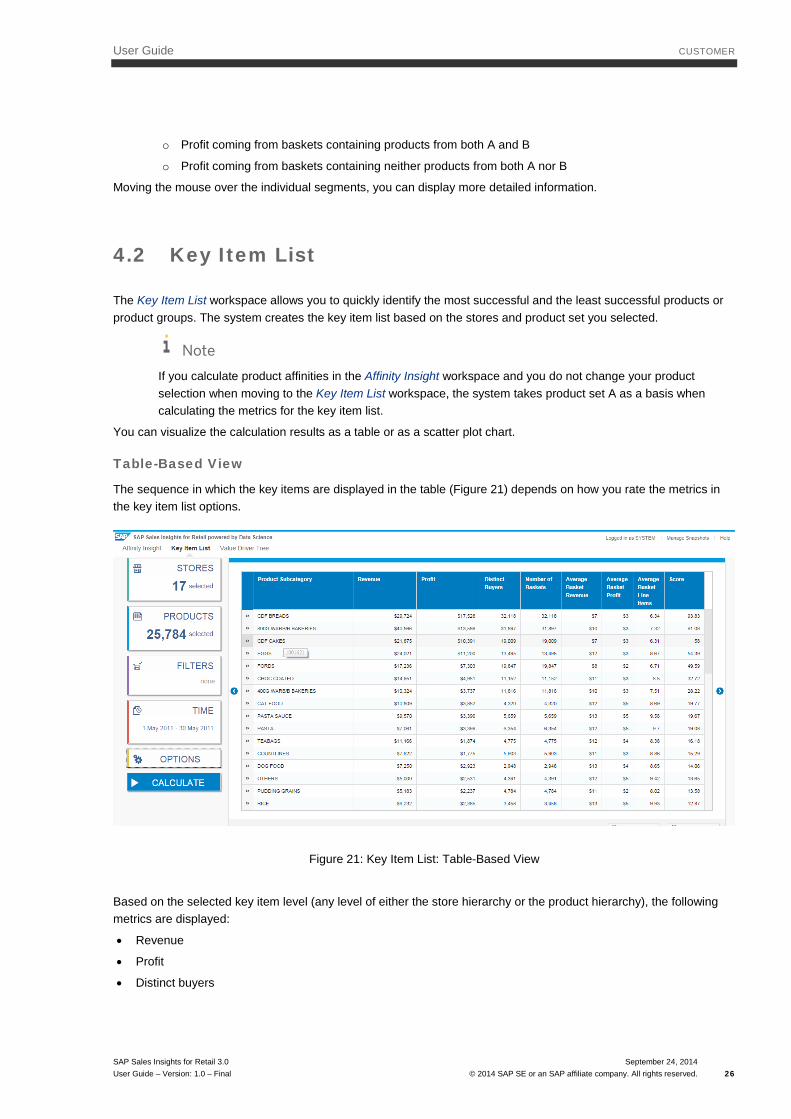
The sequence in which the key items are displayed in the table (Figure 21) depends on how you rate the metrics in the key item list options.
Figure 21: Key Item List: Table-Based View
Based on the selected key item level (any level of either the store hierarchy or the product hierarchy), the following metrics are displayed:
• Revenue
• Profit
• Distinct buyers
SAP Sales Insights for Retail 3.0 User Guide – Version: 1.0 – Final
September 24, 2014 © 2014 SAP SE or an SAP affiliate company. All rights reserved. 26
User Guide CUSTOMER
• Number of baskets
• Average basket revenue
• Average basket profit
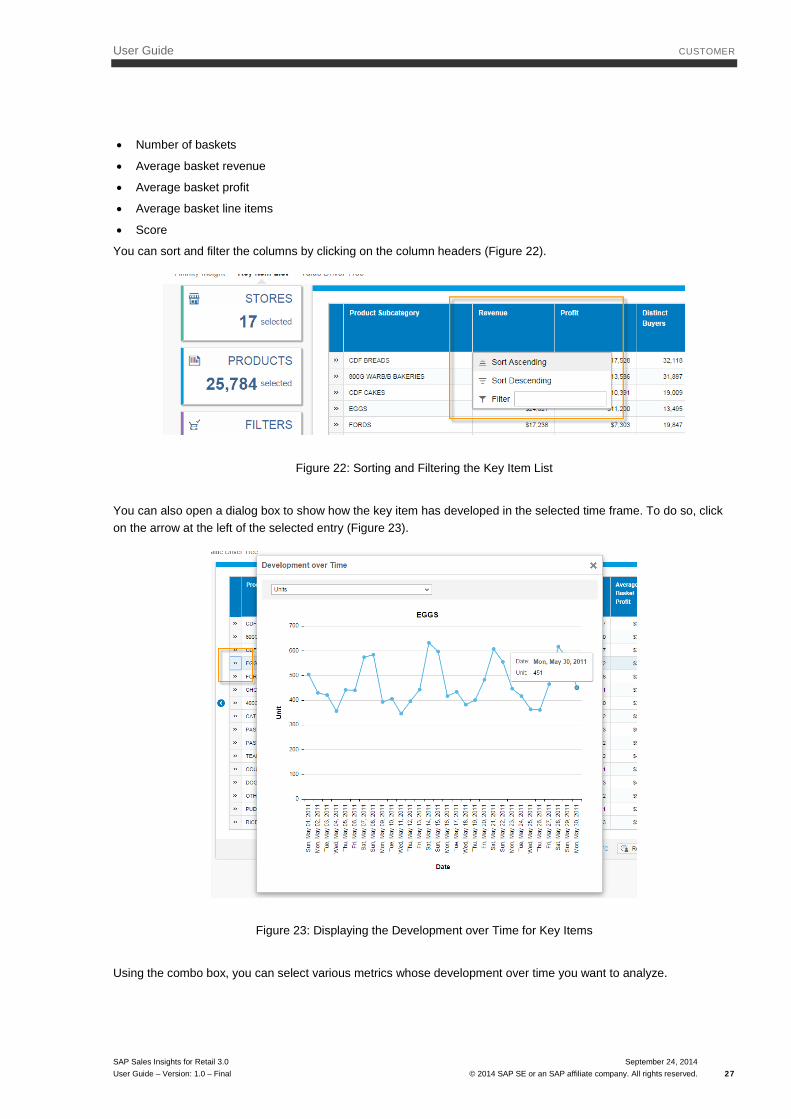
• Average basket line items
• Score
You can sort and filter the columns by clicking on the column headers (Figure 22).
Figure 22: Sorting and Filtering the Key Item List
You can also open a dialog box to show how the key item has developed in the selected time frame. To do so, click on the arrow at the left of the selected entry (Figure 23).
Figure 23: Displaying the Development over Time for Key Items
Using the combo box, you can select various metrics whose development over time you want to analyze.
SAP Sales Insights for Retail 3.0 User Guide – Version: 1.0 – Final
September 24, 2014 © 2014 SAP SE or an SAP affiliate company. All rights reserved. 27
User Guide CUSTOMER
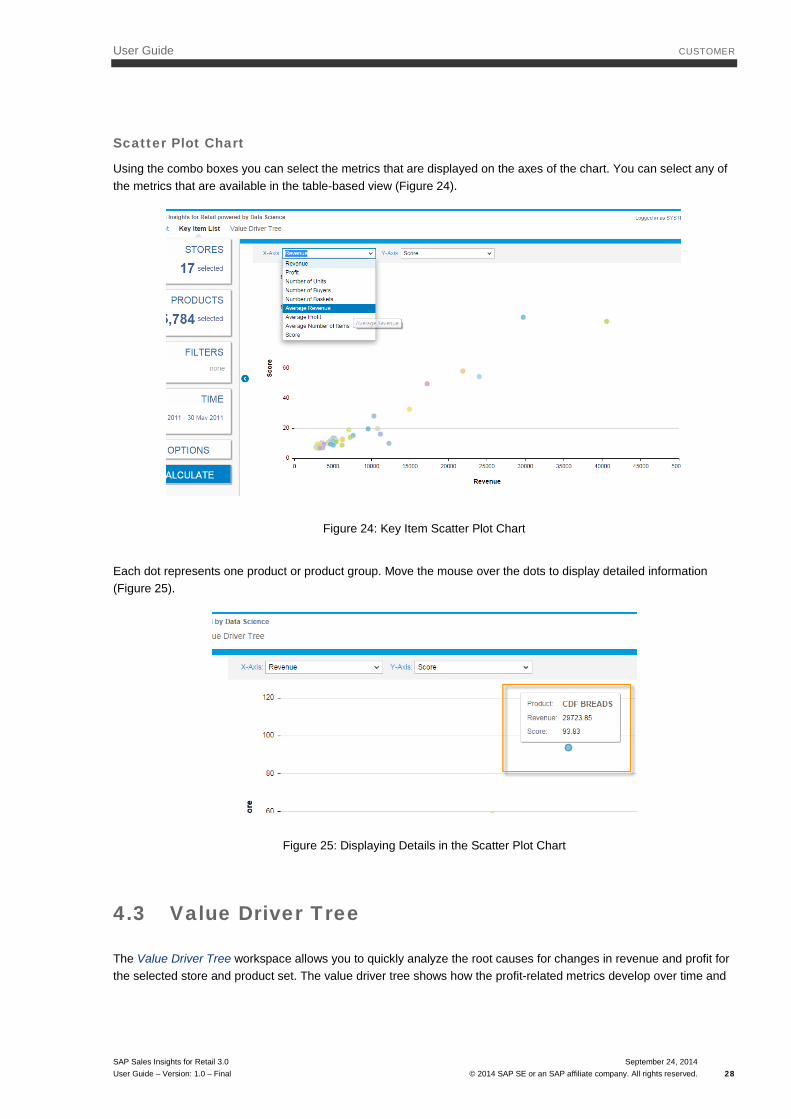
Scatter Plot Chart
Using the combo boxes you can select the metrics that are displayed on the axes of the chart. You can select any of the metrics that are available in the table-based view (Figure 24).
Figure 24: Key Item Scatter Plot Chart
Each dot represents one product or product group. Move the mouse over the dots to display detailed information (Figure 25).
Figure 25: Displaying Details in the Scatter Plot Chart
4.3 Value Driver Tree
The Value Driver Tree workspace allows you to quickly analyze the root causes for changes in revenue and profit for the selected store and product set. The value driver tree shows how the profit-related metrics develop over time and
SAP Sales Insights for Retail 3.0 User Guide – Version: 1.0 – Final
September 24, 2014 © 2014 SAP SE or an SAP affiliate company. All rights reserved. 28
User Guide CUSTOMER
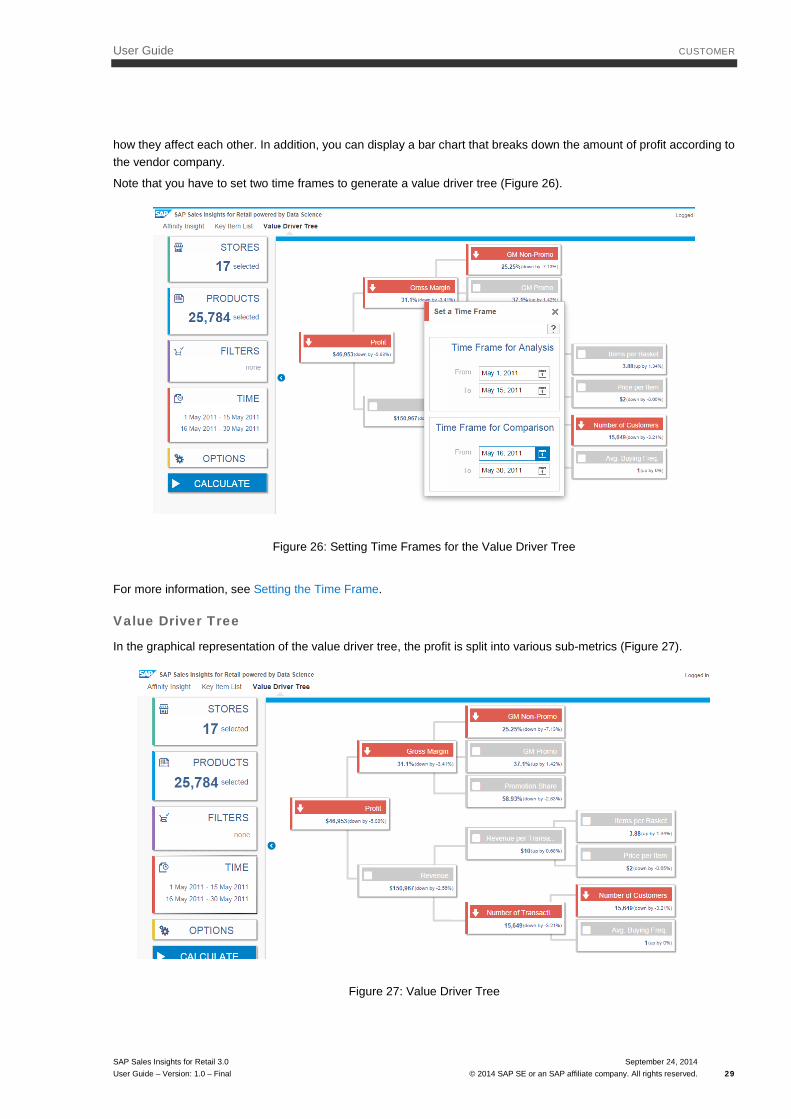
how they affect each other. In addition, you can display a bar chart that breaks down the amount of profit according to the vendor company.
Note that you have to set two time frames to generate a value driver tree (Figure 26).
Figure 26: Setting Time Frames for the Value Driver Tree
For more information, see Setting the Time Frame.
Value Driver Tree
In the graphical representation of the value driver tree, the profit is split into various sub-metrics (Figure 27).
Figure 27: Value Driver Tree
SAP Sales Insights for Retail 3.0 User Guide – Version: 1.0 – Final
September 24, 2014 © 2014 SAP SE or an SAP affiliate company. All rights reserved. 29

User Guide CUSTOMER
The display is based on the following hierarchy:
Profit
• Gross margin
o Gross margin of products that are not on promotion
o Gross margin of products that are on promotion
o Promotion share
• Revenue
o Average basket size
o Items per basket
o Price per item
o Number of transactions
o Number of customers
o Average buying frequency
The color coding allows you to see immediately whether and to what extent a metric is trending upwards or downwards:
• Green means that the trend shows an increase of more than 3 %.
• Red means that the trend shows a decrease of more than 3 %.
• Gray means that the upward or downward trend is below 3 %.
Bar Chart
In addition to the actual value driver tree, you can also display a bar chart that breaks down the amount of profit according to the vendor company (Figure 28).
Figure 28: Vendor Bar Chart
Recommendation
If you want to limit the value driver analysis to one specific vendor, select the vendor as a tag when defining the product sets. Note that it depends on the configuration of your point-of-sales data whether or not tags are available.
SAP Sales Insights for Retail 3.0 User Guide – Version: 1.0 – Final
September 24, 2014 © 2014 SAP SE or an SAP affiliate company. All rights reserved. 30
User Guide CUSTOMER
4.4 Saving the Results for Further Analysis
Creating Snapshots
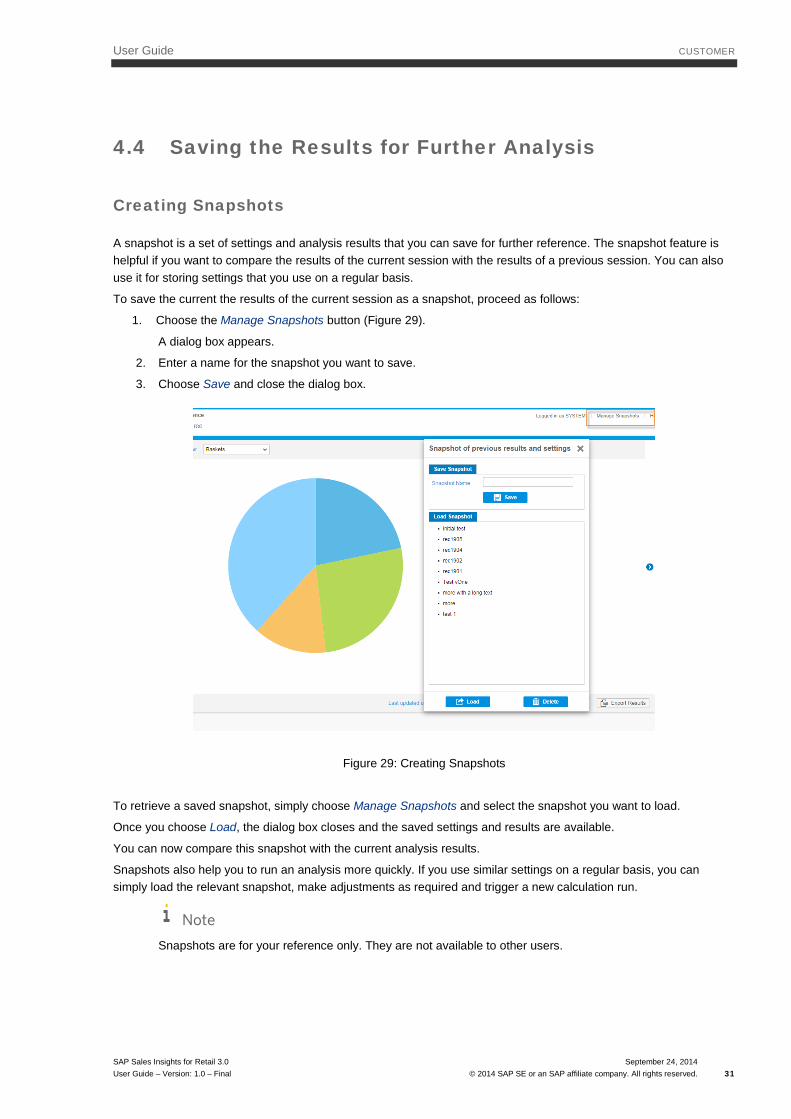
A snapshot is a set of settings and analysis results that you can save for further reference. The snapshot feature is helpful if you want to compare the results of the current session with the results of a previous session. You can also use it for storing settings that you use on a regular basis.
To save the current the results of the current session as a snapshot, proceed as follows:
1. Choose the Manage Snapshots button (Figure 29).
A dialog box appears.
2. Enter a name for the snapshot you want to save.
3. Choose Save and close the dialog box.
Figure 29: Creating Snapshots
To retrieve a saved snapshot, simply choose Manage Snapshots and select the snapshot you want to load.
Once you choose Load, the dialog box closes and the saved settings and results are available.
You can now compare this snapshot with the current analysis results.
Snapshots also help you to run an analysis more quickly. If you use similar settings on a regular basis, you can simply load the relevant snapshot, make adjustments as required and trigger a new calculation run.
Note
Snapshots are for your reference only. They are not available to other users.
SAP Sales Insights for Retail 3.0 User Guide – Version: 1.0 – Final
September 24, 2014 © 2014 SAP SE or an SAP affiliate company. All rights reserved. 31
User Guide CUSTOMER
Exporting the Analysis Results
You can export and save the analysis results as CSV files. The system creates a .zip file containing several MS Excel files. The data in these files is not formatted. You can use this data for further analysis, for example, when running ad-hoc reports.
SAP Sales Insights for Retail 3.0 User Guide – Version: 1.0 – Final
September 24, 2014 © 2014 SAP SE or an SAP affiliate company. All rights reserved. 32


www.sap.com/contactsap
© 2014 SAP SE or an SAP affiliate company. All rights reserved.