sat/act results for graduating class of 2007
DESCRIPTION
SAT/ACT Results for Graduating Class of 2007. A Presentation to the KSD Board of Directors September 12, 2007. Key Points - SAT. KSD’s SAT Reading scores were up 4 points in contrast to the one-point declines in WA and nationally. - PowerPoint PPT PresentationTRANSCRIPT

SAT/ACT Results for Graduating SAT/ACT Results for Graduating Class of 2007Class of 2007
A Presentation to the A Presentation to the
KSD Board of DirectorsKSD Board of Directors
September 12, 2007September 12, 2007

Key Points - SATKey Points - SAT KSD’s SAT Reading scores were up 4 points in contrast to the one-point KSD’s SAT Reading scores were up 4 points in contrast to the one-point
declines in WA and nationally.declines in WA and nationally. KSD’s SAT Reading scores are the highest they have been since the 1999 KSD’s SAT Reading scores are the highest they have been since the 1999
graduating class.graduating class. KSD’s SAT Math scores continue to be at an all-time high in contrast to WA KSD’s SAT Math scores continue to be at an all-time high in contrast to WA
and national declines. and national declines. KSD’s Black/African American and Hispanic/Latino students outperform their KSD’s Black/African American and Hispanic/Latino students outperform their
WA and national peers in both SAT Reading and Math. The number of test-WA and national peers in both SAT Reading and Math. The number of test-takers for these groups remains small.takers for these groups remains small.
KSD’s White students continue to outperform their WA and national peers in KSD’s White students continue to outperform their WA and national peers in Math; in Reading they outperform their national but not their WA peers.Math; in Reading they outperform their national but not their WA peers.
KSD’s English language-only students outperform their national and WA peers KSD’s English language-only students outperform their national and WA peers in Math; in Reading they scored higher than their national but not their WA in Math; in Reading they scored higher than their national but not their WA peers.peers.
KSD participation rates are identical to WA’s of 53% and slightly higher than KSD participation rates are identical to WA’s of 53% and slightly higher than the national rate of 48%.the national rate of 48%.

SAT Math PerformanceSAT Math Performance
500
510
520
530
540
550
US Math WA Math KSD Math
1998-1999
1999-2000
2000-2001
2001-2002
2002-2003
2003-2004
2004-2005
2005-2006
2006-2007

SAT Reading PerformanceSAT Reading Performance
500
510
520
530
540
550
US Reading WA Reading KSD Reading
1998-19991999-20002000-20012001-20022002-20032003-20042004-20052005-20062006-2007

Issues of Equity - SATIssues of Equity - SAT
With the exception of Asian/Asian-American students, each of With the exception of Asian/Asian-American students, each of the major ethnic groups outperforms their national peers in the major ethnic groups outperforms their national peers in Reading and in Math. The small number of American Indian Reading and in Math. The small number of American Indian participants (8) precludes generalizations.participants (8) precludes generalizations.
Disparities exist in levels of group achievement with African Disparities exist in levels of group achievement with African American/Black students scoring lower than other ethnic groups.American/Black students scoring lower than other ethnic groups.
Participation rates by African American/Black and Participation rates by African American/Black and Hispanic/Latino students remain low but have increased.Hispanic/Latino students remain low but have increased.
In Math, KSD males outperform their WA and national peers. In Math, KSD males outperform their WA and national peers. They also outperform KSD females. They also outperform KSD females.
In Reading, KSD male and female scores are identical. Both In Reading, KSD male and female scores are identical. Both outscore their national but not state peers. outscore their national but not state peers.
Females represent a greater share of test-takers locally and Females represent a greater share of test-takers locally and nationally.nationally.

SAT Math Performance by EthnicitySAT Math Performance by Ethnicity2006 and 2007 Graduates2006 and 2007 Graduates
0
100
200
300
400
500
600
700
KSD Math 06 KSD Math 07 National 07
0
100
200
300
400
500
600
700
KSD Math 06 KSD Math 07 National 07

SAT Reading Performance by EthnicitySAT Reading Performance by Ethnicity2006 and 2007 Graduates2006 and 2007 Graduates
0
100
200
300
400
500
600
American Indian Asian Black/AfricanAmerican
Mexican/MexicanAmerican
OtherHispanic/Latino
White
KSD Reading 06 KSD Reading 07 National 07

SAT SAT Students in Top 10Students in Top 10thth Class Rank Class Rank
578591
578590 594
585575
585 580
602620 614
623633
624610
599 602
400
450
500
550
600
650
700
2001 2002 2003 2004 2005 2006 2007 WA 2007 US 2007
ReadingMath
USWAKSD

Key Points - ACTKey Points - ACT Far fewer 2007 KSD grads took the ACT (171) than the SAT Far fewer 2007 KSD grads took the ACT (171) than the SAT
(819). (819). Results should be viewed with the caveat of the low Results should be viewed with the caveat of the low
participation rates.participation rates. KSD students’ Math scores were equal to those of WA and KSD students’ Math scores were equal to those of WA and
higher than those of their US peers.higher than those of their US peers. KSD’s English and Reading scores lower than those of WA but KSD’s English and Reading scores lower than those of WA but
higher than those of the US.higher than those of the US. KSD’s Science results were slightly lower than WA but higher KSD’s Science results were slightly lower than WA but higher
than the US.than the US. Disaggregation of scores by ethnicity would not be appropriate Disaggregation of scores by ethnicity would not be appropriate
for this number of test takers though even with the few test-for this number of test takers though even with the few test-takers of color, achievement gaps similar to the SAT exist.takers of color, achievement gaps similar to the SAT exist.

ACT Performance ACT Performance 2007 Grads2007 Grads
15
16
17
18
19
20
21
22
23
24
25
English Math Reading Science Composite
AC
T S
core KSD
WAUS

Questions?Questions?

KSD Student Learning as KSD Student Learning as Measured by the Measured by the Spring 2007 WASLSpring 2007 WASL
A Presentation to the A Presentation to the
KSD Board of DirectorsKSD Board of Directors
September 12, 2007September 12, 2007
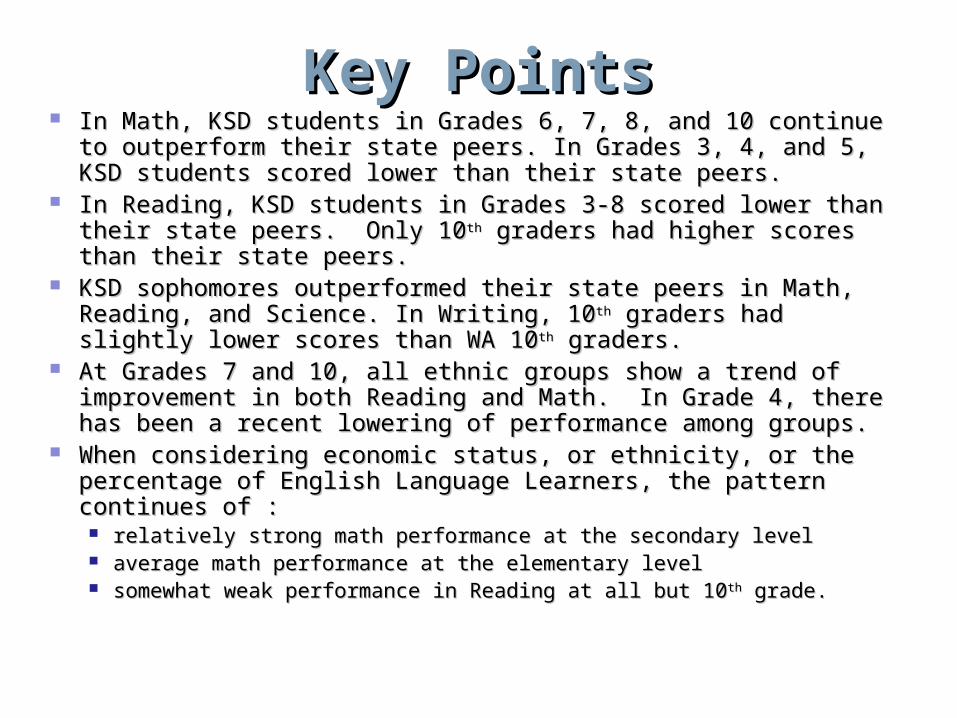
Key PointsKey Points In Math, KSD students in Grades 6, 7, 8, and 10 continue to In Math, KSD students in Grades 6, 7, 8, and 10 continue to
outperform their state peers. In Grades 3, 4, and 5, KSD students outperform their state peers. In Grades 3, 4, and 5, KSD students scored lower than their state peers.scored lower than their state peers.
In Reading, KSD students in Grades 3-8 scored lower than their state In Reading, KSD students in Grades 3-8 scored lower than their state peers. Only 10peers. Only 10thth graders had higher scores than their state peers. graders had higher scores than their state peers.
KSD sophomores outperformed their state peers in Math, Reading, KSD sophomores outperformed their state peers in Math, Reading, and Science. In Writing, 10and Science. In Writing, 10 thth graders had slightly lower scores than graders had slightly lower scores than WA 10WA 10thth graders. graders.
At Grades 7 and 10, all ethnic groups show a trend of improvement in At Grades 7 and 10, all ethnic groups show a trend of improvement in both Reading and Math. In Grade 4, there has been a recent lowering both Reading and Math. In Grade 4, there has been a recent lowering of performance among groups.of performance among groups.
When considering economic status, or ethnicity, or the percentage of When considering economic status, or ethnicity, or the percentage of English Language Learners, the pattern continues of :English Language Learners, the pattern continues of : relatively strong math performance at the secondary levelrelatively strong math performance at the secondary level average math performance at the elementary level average math performance at the elementary level somewhat weak performance in Reading at all but 10somewhat weak performance in Reading at all but 10 thth grade. grade.

WASL Reading Grade 4WASL Reading Grade 4
0%
10%
20%
30%
40%
50%
60%
70%
80%
90%
100%
2001-02 2002-03 2003-04 2004-05 2005-06 2006-07
KSD Grade 4
WA Grade 4

WASL Reading Grade 7WASL Reading Grade 7
0%
10%
20%
30%
40%
50%
60%
70%
80%
90%
100%
2001-02 2002-03 2003-04 2004-05 2005-06 2006-07
KSD Grade 7
WA Grade 7

WASL Reading Grade 10WASL Reading Grade 10
0%
10%
20%
30%
40%
50%
60%
70%
80%
90%
100%
2001-02 2002-03 2003-04 2004-05 2005-06 2006-07
KSD Grade 10
WA Grade 10

WASL Math Grade 4WASL Math Grade 4
0%
10%
20%
30%
40%
50%
60%
70%
80%
90%
100%
2001-02 2002-03 2003-04 2004-05 2005-06 2006-07
KSD Grade 4
WA Grade 4

WASL Math Grade 7WASL Math Grade 7
0%
10%
20%
30%
40%
50%
60%
70%
80%
90%
100%
2001-02 2002-03 2003-04 2004-05 2005-06 2006-07
KSD Grade 7
WA Grade 7

WASL Math Grade 10WASL Math Grade 10
0%
10%
20%
30%
40%
50%
60%
70%
80%
90%
100%
2001-02 2002-03 2003-04 2004-05 2005-06 2006-07
KSD Grade 10
WA Grade 10

WASL Reading WASL Reading All Tested Grades KSD and WAAll Tested Grades KSD and WA
0%
10%
20%
30%
40%
50%
60%
70%
80%
90%
Grade 3 Grade 4 Grade 5 Grade 6 Grade 7 Grade 8 Grade 10
KSD
WA

WASL Math WASL Math All Tested Grades KSD and WAAll Tested Grades KSD and WA
0%
10%
20%
30%
40%
50%
60%
70%
80%
Grade 3 Grade 4 Grade 5 Grade 6 Grade 7 Grade 8 Grade 10
KSD
WA

WASL Writing Grade 4WASL Writing Grade 4
0%
10%
20%
30%
40%
50%
60%
70%
80%
90%
100%
2001-02 2002-03 2003-04 2004-05 2005-06 2006-07
KSD Grade 4
WA Grade 4

WASL Writing Grade 7WASL Writing Grade 7
0%
10%
20%
30%
40%
50%
60%
70%
80%
90%
100%
2001-02 2002-03 2003-04 2004-05 2005-06 2006-07
KSD Grade 7
WA Grade 7

WASL Writing Grade 10WASL Writing Grade 10
0%
10%
20%
30%
40%
50%
60%
70%
80%
90%
100%
2001-02 2002-03 2003-04 2004-05 2005-06 2006-07
KSD Grade 10
WA Grade 10

Grade 10 WASL Performance by Grade 10 WASL Performance by EthnicityEthnicity
0%
10%
20%
30%
40%
50%
60%
70%
80%
90%
100%
Reading Math Writing
AmericanIndian/Alaskan NativeAsian
Black/African American
Hispanic/Latino
White

WASL Grade 10 Math and Non-Asian Minorities
Districts of Enrollment > 10,000
0%
10%
20%
30%
40%
50%
60%
70%
80%
90%
100%
0 10 20 30 40 50 60 70 80
% Students of Non-Asian Minorities
%M
et S
td
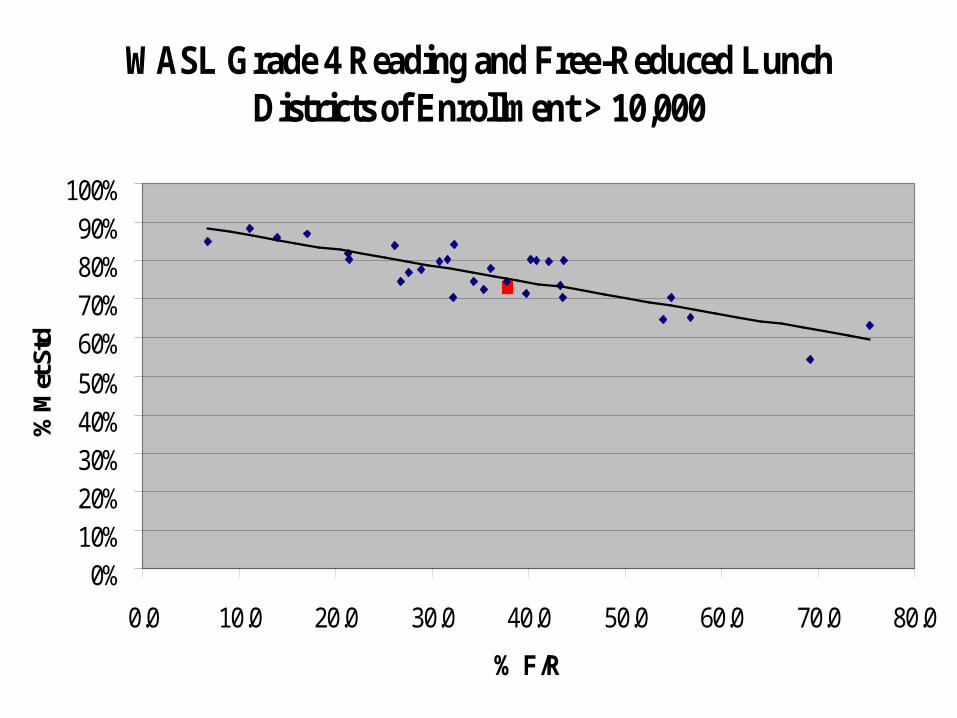
WASL Grade 4 Reading and Free-Reduced LunchDistricts of Enrollment > 10,000
0%10%20%30%40%50%
60%70%80%90%
100%
0.0 10.0 20.0 30.0 40.0 50.0 60.0 70.0 80.0
% F/R
%M
et S
td

WASL Grade 10 Reading and Non-Asian Minorities Districts of Enrollment > 10,000
0%
10%
20%
30%
40%
50%
60%
70%
80%
90%
100%
0 10 20 30 40 50 60 70 80
% Students of Non-Asian Minorities
%M
et S
td

Students Enrolled in KSD for Grade 4 and again Students Enrolled in KSD for Grade 4 and again for Grade 10 WASL Performancefor Grade 10 WASL Performance
76%
56%
91%
69%
54%
31%
0%
10%
20%
30%
40%
50%
60%
70%
80%
90%
100%
Reading Math
% M
et S
tan
dar
d
Met Std Grade 4 (2000-01) Met Std Grade 10 (2006-07)
Met Std Grade 10 Enrolled after Grade 4
Represents about 52% of Grade 10 students

WASLWASL Science Grade 5Science Grade 5
0.0%
10.0%
20.0%
30.0%
40.0%
50.0%
60.0%
70.0%
80.0%
90.0%
100.0%
2003-04 2004-05 2005-06 2006-07
KSD Grade 5WA Grade 5

WASL Science Grade 8WASL Science Grade 8
0%
10%
20%
30%
40%
50%
60%
70%
80%
90%
100%
2002-03 2003-04 2004-05 2005-06 2006-07
KSD Grade 8WA Grade 8

WASL Science Grade 10WASL Science Grade 10
0%
10%
20%
30%
40%
50%
60%
70%
80%
90%
100%
2002-03 2003-04 2004-05 2005-06 2006-07
KSD Grade 10WA Grade 10

Questions?Questions?

KSDKSDAdequate Yearly ProgressAdequate Yearly Progress
A Presentation to the Board of A Presentation to the Board of DirectorsDirectors
September 12, 2007September 12, 2007

• ALL students “proficient” by 2014
• Separate, measurable goals in reading, in mathematics, in attendance rates (elementary and middle), and in graduation rates (high schools) -- State Uniform Bars
• Separate, measurable objectives/disaggregated data and goals for: • All Children
• Racial/Ethnic Groups
• Students with Disabilities (Special Education)
• Students with Limited English Proficiency (ELL)
• Students from Low-Income Families
NCLB Adequate Yearly Progress Elements

Changes to AYP and their ImpactChanges to AYP and their Impact Grades 3, 5, 6, and 8 are now included in AYP.Grades 3, 5, 6, and 8 are now included in AYP. Inclusion of additional grade levels means more cells Inclusion of additional grade levels means more cells
will count toward meeting AYP. will count toward meeting AYP. The inclusion of more cells means many more schools The inclusion of more cells means many more schools
and districts will not meet AYP.and districts will not meet AYP. The ELL and SPED cells are inherently difficult cells in The ELL and SPED cells are inherently difficult cells in
which to meet AYP.which to meet AYP. How many districts in WA of over 5,000 students How many districts in WA of over 5,000 students
met AYP? None.met AYP? None.

Large Districts:Large Districts:
1% of District Enrollment for 1% of District Enrollment for Cell to CountCell to Count
Schools:Schools: at least 30-40 Students at least 30-40 Students in Cell to Countin Cell to Count
Percent ProficientPercent Proficient
Reading Reading MathMath
Percent Percent ParticipationParticipation
Reading MathReading Math
Unexcused Unexcused Absence/ Absence/
Graduation Graduation RateRate
All StudentsAll Students
American IndianAmerican Indian
Asian/Pac. Is.Asian/Pac. Is.
BlackBlack
HispanicHispanic
WhiteWhite
Special EducationSpecial Education
Limited English (ELL)Limited English (ELL)
Low IncomeLow Income
AYP MatrixAYP Matrix

GRADES 3 ,4, & 5 YEARLY TARGETSGRADES 3 ,4, & 5 YEARLY TARGETS
Reading Mathematics100.0
0
10
20
30
40
50
60
70
80
90
100
2005 2006 2008 2010 2011 2012 2013 2014
Per
cen
t M
eeti
ng
Sta
nd
ard
AYP can be made if the percent meeting standard is below the yearly target either via safe harbor or when the standard error is included in the total.
(Increments are rounded)
88.1
2009
76.1
2007
64.2
2004
52.2
29.7
2002 2003
47.3
64.9
82.4
100.0
Mathematics
Reading

GRADES 6, 7 & 8 YEARLY TARGETSGRADES 6, 7 & 8 YEARLY TARGETS
30.1
47.6
65.1
82.5
100.0
0
20
30
40
50
60
70
80
90
100
2002 2003 2004 2005 2006 2007 2008 2009 2010 2011 2012 2013 2014
Per
cen
t M
eeti
ng
Sta
nd
ard
Reading Mathematics
AYP can be made if the percent meeting standard is below the yearly target either via safe harbor or when the standard error is included in the total.
(Increments are rounded)
58.7
79.3
17.310
38.0
100.0
Mathematics
Reading

GRADE 10 YEARLY TARGETSGRADE 10 YEARLY TARGETS
61.5
74.3
87.2
100.0
48.6
0
10
20
30
40
50
60
70
80
90
100
2002 2003 2004 2005 2006 2007 2008 2009 2010 2011 2012 2013 2014
Per
cent
Mee
ting
Sta
ndar
d
Reading Mathematics
AYP can be made if the percent meeting standard is below the yearly target either via safe harbor or when the standard error is included in the total.
(Increments are rounded)
43.6
62.4
81.2
24.8
100.0
Mathematics
Reading

Key AYP PointsKey AYP Points KSD did not meet AYP.KSD did not meet AYP. Penalties exist only for Title I schools and districts “needing Penalties exist only for Title I schools and districts “needing
improvement.”improvement.” It takes two years of not meeting AYP for a school to be on the It takes two years of not meeting AYP for a school to be on the
improvement list and two years of meeting AYP to get off the list.improvement list and two years of meeting AYP to get off the list. KSD is KSD is notnot classified as “needing improvement.” classified as “needing improvement.” No KSD No KSD Title ITitle I schools are in “need of improvement.” schools are in “need of improvement.” Twelve (12) elementary schools did not make AYP for the first time Twelve (12) elementary schools did not make AYP for the first time
this past year – 9 of these are Title I.this past year – 9 of these are Title I. Seven (7) middle schools did not make AYP – five (5) for the first Seven (7) middle schools did not make AYP – five (5) for the first
time.time. Three (3) high schools did not make AYP – none for the first time.Three (3) high schools did not make AYP – none for the first time.

AYP Comparison AYP Comparison 2005-06 and 2006-072005-06 and 2006-07
2005-062005-06 2006-072006-07
KSD District Cells KSD District Cells not making AYPnot making AYP
1 1 (Grade 10 Math Low (Grade 10 Math Low
Income)Income)
14 14 (primarily SPED, ELL, (primarily SPED, ELL,
Low Income,Low Income,
African-AmericanAfrican-American))
KSD Cells making KSD Cells making AYP AYP
5050 6969
KSD Schools not KSD Schools not making AYPmaking AYP
66 2323
Percent ProficientPercent Proficient
Reading Reading MathMath
Percent ParticipationPercent Participation
Reading MathReading Math
Unexcused Unexcused AbsenceAbsence
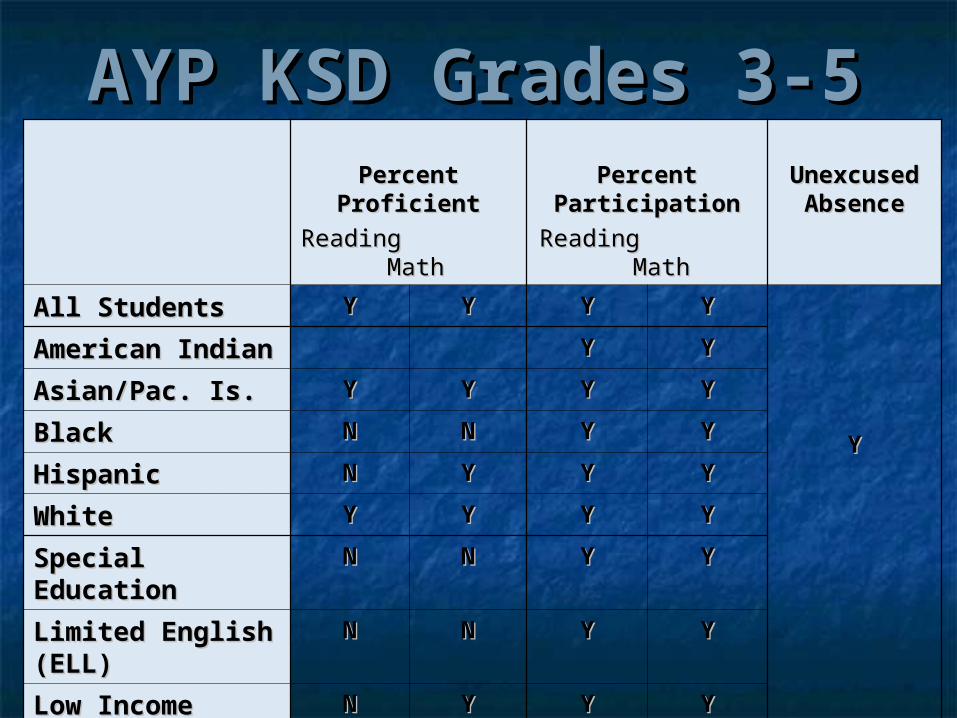
All StudentsAll Students YY YY YY YY
YY
American IndianAmerican Indian YY YY
Asian/Pac. Is.Asian/Pac. Is. YY YY YY YY
BlackBlack NN NN YY YY
HispanicHispanic NN YY YY YY
WhiteWhite YY YY YY YY
Special EducationSpecial Education NN NN YY YY
Limited English Limited English (ELL)(ELL)
NN NN YY YY
Low IncomeLow Income NN YY YY YY
AYP KSD Grades 3-5AYP KSD Grades 3-5

Percent ProficientPercent Proficient
Reading Reading MathMath
Percent ParticipationPercent Participation
Reading MathReading Math
Unexcused Unexcused AbsenceAbsence
All StudentsAll Students YY YY YY YY
YY
American IndianAmerican Indian
Asian/Pac. Is.Asian/Pac. Is. YY YY YY YY
BlackBlack YY NN
HispanicHispanic YY YY
WhiteWhite YY YY YY YY
Special EducationSpecial Education NN NN
Limited English Limited English (ELL)(ELL)
NN NN
Low IncomeLow Income YY YY YY YY
AYP KSD Grades 7-8AYP KSD Grades 7-8

Percent ProficientPercent Proficient
Reading Reading MathMath
Percent ParticipationPercent Participation
Reading MathReading Math
Graduation Graduation RateRate
All StudentsAll Students YY YY YY YY
YY
American IndianAmerican Indian
Asian/Pac. Is.Asian/Pac. Is. YY YY YY YY
BlackBlack
HispanicHispanic
WhiteWhite YY YY YY YY
Special EducationSpecial Education
Limited English Limited English (ELL)(ELL)
NN NN
Low IncomeLow Income YY NN YY YY
AYP KSD Grade 10AYP KSD Grade 10

School Improvement
Plan
Continue:
Public School Choice
Continue: Public School
Choice Supplemental
Continue: Public School
ChoiceSupplemental
Services
Public School Choice
Supplemental
Services
Corrective
Action
Plan for AlternativeGovernance
AYP AYPAYPAYP AYP
Step 1 Step 2 Step 3 Step 4
Implement Plan For
Alternative Governance
Step 51 2
AYP AYP
AYP TIMELINE FOR SCHOOLS
Consequences apply only to schools receiving Title I
funds
Identified for School Improvement
2004-2005 School Year
WASL2003
WASL 2004

Questions?Questions?

KSDKSDAction PlanAction Plan
A Presentation to the Board of A Presentation to the Board of DirectorsDirectors
September 12, 2007September 12, 2007

Action PlanAction Plan
The next slides outline current The next slides outline current Instructional and Integrated Learning Instructional and Integrated Learning Services plans to increase student Services plans to increase student performanceperformance
The plans will be modified as further data The plans will be modified as further data analysis is completed.analysis is completed.

General Educational Services
•Curriculum & Instruction
•Assessment & Monitoring
•Intervention & Learning Opportunities
•Professional Development
Differentiated Educational Services
Focused Emphasis on Academic Achievement
.
•Communication•Coordination•Collaboration
•Literacy/Numeracy•Core Standards
•Systemic Data Profiles•Look Fors & Checkpoints
•Safeguards•Continuum of Services
•Instructional Staff•Leadership Capacity
Coherence

ReadingReading
Implementation of reading comprehension and Implementation of reading comprehension and spelling resources spelling resources (K-6)(K-6)
Implementation of reading resources Implementation of reading resources (7—8)(7—8)
Increase use of high interest, varied reading Increase use of high interest, varied reading level materials level materials (7-12)(7-12)
Continue field test of reading comprehension Continue field test of reading comprehension program program (9-12)(9-12)

WritingWriting
Implement writing resource (K-6)Implement writing resource (K-6) Select writing resource to support Select writing resource to support
expository and narrative writing (7-12)expository and narrative writing (7-12) Review data on Summer School Review data on Summer School
effectivenesseffectiveness Calibrate instructional expectations and Calibrate instructional expectations and
instructional practiceinstructional practice

MathematicsMathematics Implement new resources Implement new resources (7-8)(7-8)
Calibrate expectations & assessment Calibrate expectations & assessment (7-12)(7-12)
Monitor & adjust placement criteria Monitor & adjust placement criteria (6-12)(6-12)
Increase participation in Algebra at middle schoolIncrease participation in Algebra at middle school Capitalize on partnershipsCapitalize on partnerships
GRCC Project TimeGRCC Project Time Microsoft Math PartnershipMicrosoft Math Partnership
Expand professional development for principals and Expand professional development for principals and teachers teachers (K-12)(K-12)

ScienceScience
Expand science kit training Expand science kit training (K-6)(K-6)
Conduct curriculum audit Conduct curriculum audit (K-12)(K-12)
Develop strategic plan to meet 2013 goalDevelop strategic plan to meet 2013 goal Capitalize on partnershipsCapitalize on partnerships
LASERLASER BoeingBoeing WABSWABS

EquityEquityAccessAccessConsistencyConsistencyCalibrationCalibrationAVIDAVID InterventionsInterventions
Extended DayExtended Day Technology resourcesTechnology resources Double doseDouble dose

TrainingTraining
Core curriculum for all Core curriculum for all Resources after trainingResources after training Available resourcesAvailable resources MandatoryMandatory Cross-grade level discussionsCross-grade level discussions

ResourcesResources
Core resources for all: ELL, SP Ed, Gen EdCore resources for all: ELL, SP Ed, Gen Ed
Core supplemental resources for allCore supplemental resources for all
Controlled Field Testing Controlled Field Testing

Questions?Questions?