satellite power system salvage -es - nasa · satellite power system and disposal alternativ salvage...
TRANSCRIPT

- - -
NASA Contractor Report 3349
Satellite Power System and Disposal Alternativ
Salvage -es
CONTRACT NASs-33783 NOVEMBER 1980
https://ntrs.nasa.gov/search.jsp?R=19810002948 2020-03-29T00:20:12+00:00Z


TECH LIBRARY KAFB, NM
Chapter Page
List of Figures V
TABLE OF CONTENTS IInlllllllllll~llllllllllHIIIIIllllllul 0062d3b
List of Tables vi.
1. Introduction 1
1.1 Background 2 1.2 Approach 4 1.3 Results 9 1.4 Conclusions and Recommendations 13 1.5 Backup Documentation 15
2. A Post-2000 Mission Model 16
2.1 The Period 2000 to 2030 22 2.2 The Post-2030 Time Period 26
3.
4.
SPS Demonstration Satellite Salvage Alternatives
3.1 Growth to Full-Scale Satellite 3.2 Demonstration Satellite Use as a Power Supply for Non-SPS
Space Activities 3.3 Power Supply for a Laser Orbit-to-Orbit Transportation System 3.4 Source of Space-Based Materials
Full-Scale Satellite Salvage Alternatives
28
33
37 46 49
50
4.1 Salvage for SPS Reuse 50 4.2 Power Supply for Non-SPS Space Activities 52 4.3 Power Supply for a Laser Orbit-to-Orbit Transportation Systems 53 4.4 Power Supply for Laser-Propelled Aircraft 54 4.5 Asteroid Capture and Mining 57 4.6 Source of Space-Based Materials 59 4.7 Miscellaneous Salvage Uses 60 4.8 Continued Use 61
5. SPS Salvage Value 64
5.1 SPS Demonstration Satellite Salvage‘ Value 64 5.2 Full-Scale SPS Satellite Salvage Value 66 5.3 Programmatic Implications 68
. . . 111
TABLE OF CONTENTS (Continued)
Chapter Page
6. SPS Disposal 71
6.1 Disposal Alternatives 71 6.2 Disposal Costs 78
Appendix A Supporting Data for Value of the Demonstration Satellite Used as a Power Source for Other Activities 80
iv

LIST OF FIGURES
Figure
1.1
1.2
2.1
2.2
2.3
3.1
3.2
3.3
3.4
3.5
3.6
3.7
3.8
3.9
4.1
4.2
5.1
5.2
6.1
6.2
6.3
Reference Satellite Configuration
Salvageable SPS Mass and Generation Capacity
Geostationary Satellites--To Date and Planned
Potential Space Activity Levels, 1980-2060
Historical and Projected Growth of Spacecraft Power and Lifetime
SPS Demonstration Satellite in Final Phases of Construction
Full-Scale Operational SPS Satellite Configuration
Salvage Value-- Growth to Full-Scale Satellite
Present Value of Demonstration Satellite When Used as an Initial Element in a Full-Scale Satellite
Supply & Demand for Power from Demonstration SPS Satellite
Salvage Value-- SPS Demonstration Satellite Used as a Source of Power and Other Subsystems for Other Activities
Salvage Value of the SPS Demonstration Satellite When Used as a Source of Power for Other Activities
Salvage Value of SPS Demonstration Satellite When Used as a Source of Power and Other Subsystems for Other Activities
LEO to CEO Traffic Growth
Continued Use SPS Salvage Value
The Decision to Decommission an SPS Satellite
Summary of Demonstration and Full-Scale Satellite Salvage Applications
Programmatic Implication of Demonstration Satellite Salvage Value
Lagrangian Points in the Earth-Moon System
EOTV Configuration
Alternative Trajectory Modes
Page
2
5
19
21
25
29
30
34
38
39
40
45
45
48
62
63
65
69
73
76
77
V
I

LIST OF TABLES
Table
1.1
1.2
1.3
2.1
3.1
3.2
Reference Satellite Characteristics
SPS Satellite and Rectenna Salvage Value
Disposal Options and Costs
Traffic to Support CEO Platforms
Demonstration Satellite Cost Structure
Mass Properties of Full-Scale and Demonstration SPS Satellites
4.1 Current Oceanic Air Traffic
4.2 Characteristics of Amor and Apollo Asteriods
4.3 Value of SPS Satellite Materials--GaAs, CR=2
Page
3
10
13
26
31
32
55
58
60
vi

1. INTRODUCTION
SPS system cost and trade studies conducted to date have, by and large,
assumed a 30-year satellite life with zero net salvage value at the end of that
time. Many factors make this assumption inappropriate:
1. The SPS satellite represents a very large source of power in geosyn- chronous orbit that might be put to many uses, such as:
0 Power for other space-based platforms, satellites, habitats, manu- f acturing facilities, bases, etc.
0 Power for laser transportation systems including geocentric space, earth escape and laser-powered aircraft
0 Power for a large, low-thrust space transportation system for missions such as asteriod recovery
0 Power for space-based science such as particle physics.
2. The SPS satellite represents a large supply of subsystems and compo- nents for use in other space activities such as:
0 Spares and materials for other SPS satellites
0 Solar arrays and other components for non-SPS satellites.
3. The SPS satellite represents a fairly large source of raw materials located in geosynchronous orbit that might be recovered and put to use either in space or returned to earth for reuse.
The first SPS satellite will approach the end of its useful life around the year 2030;
some 30 years sooner, the SPS demonstration satellite will have served its initial
purpose. The demonstration satellite represents a somewhat similar, albeit
considerably smaller, resource.
To the extent to which there develops a demand for energy, SPS-like
subsystems and raw materials in space, one can expect that SPS will derive some
salvage value. If, on the other hand, no such demand develops, the SPS satellite will
have to be removed from geosynchronous orbit (CEO), either for storage and

2
possible later salvage use or for permanent disposal. In this case it is important to
have estimates of the cost of SPS satellite disposal.
The objectives of this study are to find potential salvage uses for. both the
SPS demonstration and full-scale satellites, to determine the satellite salvage
values for each potential use, to prioritize these uses in order to determine likely
salvage value per satellite as a fraction of satellite capital cost and to determine
the cost of disposal for unsalvaged satellites or portions thereof.
1.1 Background
The salvage uses and values and disposal costs estimated in this study are
based on the Rockwell International SPS satellite configuration and development
program. The basic satellite configuration is shown in Figure 1.1 and its major
pnysical characteristics are provided in Table 1.1. The satellite uses gallium
aluminum arsenide solar cells with a concentration ratio of 2 and a graphite
composite structure.
SOURCE : SATELLITE POWER SYSTEMS (SPS) CONCEPT DEFINITION’ STUDY, EXECUTIVE SUMM4RY, SSD 79-0010- 1, ROCKWELL INTER- NATIONAL, DOWNEY, CA, MARCH 1979.
FIGURE 1.1 REFERENCE SATELLITE CONFIGURATION
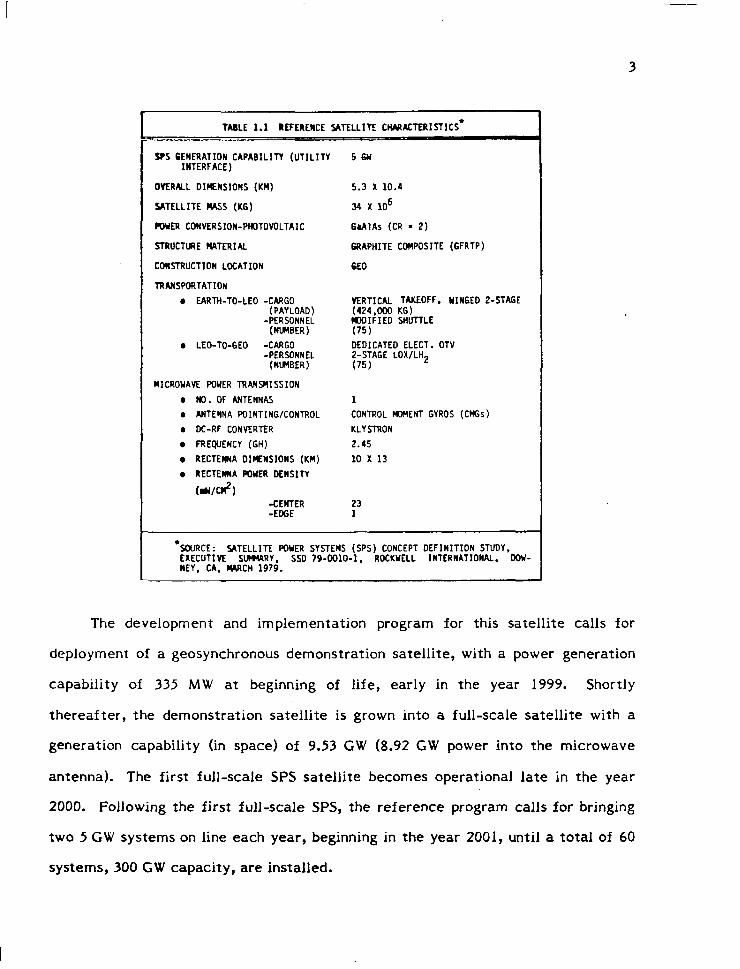
TABLE 1.1 REFERENCE SATELLITE CtWMCTERISTlCS* .;==----- =_
YS GENERATION CAPABILITY (UTILITY 5 GU INTERFACE)
OVER&L DIMNSIONS (Kl’l)
SATELLITE MS (KC)
COYER CONVERSION-PHOTOVOLTAIC
STRUCTIRE MATERIAL
CONSTRUCTION LOCATION
TRANSPORTATION
l EARTH-TO-LEO -CARGO (PAYLOAD)
-PERSONNEL (NUMBER)
l LEO-TO-GE0 -CARGO -PERSONNEL
(NUPIBER)
5.3 x 10.4
34 x 105
hAlAs (CR = 2)
GRAPHITE COMPOSITE (GFRTP)
6EO
VERTICAL TAKEOFF. YIN6EO 2-STAGE (424,000 KG) ClDOIFIED SHUTTLE (75) DEDICATED ELECT. OTV 2-STAGE LOX/LH2 (75)
MICROWAVE POKER TRANSMISSION
0 n0. OF ANTENNAS 1 l AnTENNA POINTING/CONTROL CONTROL WENT GYROS (CMGs)
l DC-RF CONVERTER KLYSTRON
l FRE’JJENCY (GH) 2.45 l RECTENNA DI=NSIONS (KM) 10 x 13 l RECTEWA POWER DENSITY
wcl?‘) -CENTER 23 -EDGE 1
l SDURCE : SATELLITE POWER SYSTEMS (SPS) CONCEPT DEFINITION STUDY, EXECUTIVE SIBWRY. SSD 79-0010-l. RDCKYELL INTERNATIONAL. MU- NEY. CA. WCH 1979.
The development and implementation program for this satellite calls for
deployment of a geosynchronous demonstration satellite, with a power generation
capability of 335 MW at beginning of life, early in the year 1999. Shortly
thereafter, the demonstration satellite is grown into a full-scale satellite with a
generation capability (in space) of 9.53 CW (8.92 GW power into the microwave
antenna). The first full-scale SPS satellite becomes operational late in the year
2000. Following the first full-scale SPS, the reference program calls for bringing
two 5 CW systems on line each year, beginning in the year 2001, until a total of 60
systems, 300 GW capacity, are installed.

4
Using the above program plan, the demonstration satellite becomes available
for salvage early in the year 2000 and full-scale SPS satellites become available for
salvage at the rate of two per year beginning late in the year 2030. Concurrent
with the full-scale satellites, the rectenna also becomes available for salvage. It is
possible that the rectenna will be used for a subsequent SPS if the program
continues. If this is the case, some amount of refurbishment may be necessary
and/or desirable, thus allowing evolutionary changes in the satellite portion of the
system, such as beam power density, beam shape and size, frequency and
polarization. In any event, rectenna reuse may be considered to be a salvage use.
Figure 1.2 shows the amount of SPS materials which will have become available for
salvage as a function of time.
The utilization of geosynchronous orbit in the post-2000 time period is likely
to be quite intense. Thus it is likely that any structures or satellites that are
placed in this orbit will have to be removed upon completion of their useful life.
Accordingly, any unsalvaged SPS-related structures, facilities or satellites will
have to be disposed of at the end of their useful life.
1.2 Approach
It is clear from Figure 1.2 that all salvage and disposal activities will occur in
the post-2000 time period. Salvage or disposal of the demonstration satellite will
occur somewhere in the 2000 to 2010 time period; salvage or disposal of full-scale
satellites will begin sometime after 2030 and continue at least through 2060. In
order to make any estimates of salvage uses and salvage values, it is necessary to
place the potential salvage activities into the context of a space program. Thus it
is necessary first to establish a mission model for the period 2000 to 2060 as a basis
for analysis. Obviously any such mission model will suffer from major uncertain-
ties and, in the end, one can identify only certain long-term trends without
becoming specific about particular missions.

1.0
0.5
0
300
200
MISC.
K+P$!! ui a s ALUMINUM
SAPPHIRE
COPPER
STAINLESS STEEL
GFRTP
2000 2030 2040 2050 CALENDAR YEAR
(a) CUMULATIVE SALVAGEABLE MASS
2060
2000 2030 2040 2050 2060
CALENDAR YEAR
(b) CUMULATIVE SALVAGEABLE GENERATION CAPACITY
FIGURE 1,.2 SALVAGEABLE SPS MASS AND GENERATION CAPACITY

6
The generic trends which one can identify today that are likely to carry over
into the 21st century include mainly an t’industrialization” of Space; that is, a
gradual transition from government-funded activities primarily of a research
nature to activities promoted and conducted in the private sector because they are
profitable. It is likely that these activities will be encouraged by significant
reductions in the cost of space-based activities resulting from a transition to the
Space Shuttle and more advanced space transportation systems, and by the
introduction and proliferation of multipurpose platforms.
Much of the activity in space in the post-2000 time period will take place in
geosynchronous orbit. This activity is likely to generate a considerable amount of
low earth orbit (LEO) to GE0 traffic, independent of SPS. There is also likely to
be considerable other geocentric traffic, however, including LEO to GEO, GE0 to
GE0 and lunar traffic, as well as earth escape traffic. Within the context of these
space activities, potential salvage uses for both the SPS demonstration satellite
and full-scale SPS satellites were identified and evaluated.
It is not clear today that the SPS demonstration will be a success; that is,
that upon completion of the demonstration satellite project, it will be found
desirable to proceed with construction of full-scale SPS satellites as planned. (If it
were known today that the demonstration would be successful, it would be
unnecessary.) Thus salvage uses of the demonstration satellite need to recognize
that there may or may not be a continuing SPS program.
On the other hand, salvage of full-scale SPS satellites will occur only if there
is an SPS program and, consequently, the salvage uses for full-scale SPS satellites
are appropriately identified in the context of a space program which includes SPS.
Such a program clearly requires a space transportation system that can inexpen-
sively transport large amounts of materials to geocentric space, and it includes

7
capabilities in large space structures, space-based construction, manned LEO and
CEO facilities, and so on. These capabilities infer such space-based activities as
space manufacturing, the utilization of large applications platforms, lunar explora-
tion and exploitation, and physics and astronomy.
The above space-based activities lead to identification of the following
potential salvage uses:
Demonstration Satellite
0 Growth into full-scale SPS satellite (Rockwell International reference program plan, applicable only if the demonstration is successful)
0 Use .as a source of power for other space activities such as CEO platforms, a manufacturing base or an electric orbit transfer vehicle
0 Use as a power supply for a laser space transportation system
0 Use as a source of raw material.
Full-Scale SPS Satellites
0 Use as spares and materials for other SPS satellites
0 Use as a power supply and platform for other space activities such as platforms, a manufacturing base, a lunar base or space habitats
0 Use as. a power supply for laser transportation systems including geocentric space, especially LEO to CEO, earth escape and aircraft on oceanic routes
0 Use as a power supply to recover Amor and Apollo asteriods
0 Use as a power supply for a high-energy, high-vacuum physics labora- tory in space.
Next, the salvage value of the SPS satellites was estimated for most of the
above potential uses. In all cases the salvage value is taken to be the present
value of the cost savings afforded by the salvage use referenced to the initial
operation date of the salvaged article. The discount rate used throughout this
study is a real (i.e., inflationary effects removed) rate of 4 percent. Thus, the
salvage values presented represent the effective amount by which the capital cost

8
of the satellite is reduced because it will provide a positive net salvage value. The
present value of SPS revenue requirements, reflected in the SPS charge’ rates, may
accordingly be reduced by this amount. For example, if it is found that the salvage
value of an SPS satellite is equal to ten percent of the capital cost of the satellite,
then the annual capital carrying charge for the satellite, for purposes of com-
parison to alternative systems, may be reduced by ten percent.
Any SPS satellites or portions thereof which are not salvaged will, in all
likelihood, have to be removed from geosynchronous orbit. An objective of this
study is to estimate SPS satellite disposal costs. To do this a number of disposal
alternatives were identified, the velocity requirements for each were estimated
and then the costs of each were determined. SPS disposal costs include four
major cost categories: cost of propellant, cost of transporting the propellant to
CEO, cost of modifying the SPS satellite as necessary (mainly installation of
thrusters, tankage and controls) and the cost of mission operations. cost
estimates provided are based on the assumption that the satellite is disposed of
intact.
Wherever possible cost estimates used in this study were derived from the
SPS Concept Definition Study performed by Rockwell International,* and are in
1977 dollars, consistent with this report. Thus while these cost estimates contain
considerable uncertainty, the variation in estimates of salvage value and disposal
costs are likely to approximate the variations in satellite captial costs. Hence the
estimates provided can be taken to be relatively firm when viewed in comparison
to the capital cost estimates.
7 Satellite Power Systems (SPS) Concept Definition Study, System Engineering, Part 2 (Cost and Programmatics, Rockwell International Report No. SSD 79- 0010-2-2, March 1979.

9
1.3 Results
Discussion of the results is appropriately divided into four parts: salvage
value for potential salvage uses of the demonstration satellite, salvage -value for
potential salvage uses of full-scale SPS satellites, salvage value of rectennae and
disposal costs for the demonstration and full-scale satellites. The major study
results are summarized in Table 1.2.
Two principal salvage uses for the demonstration satellite are apparent:
growth to a full-scale satellite and use as a power supply for a laser space
transportation system. Obviously, the former use applies only if the demonstration
program is a success; that is, if it is found desirable to continue the SPS program
beyond the demonstration phase. If this salvage use is implemented, the salvage
value of the demonstration satellite is about 80 percent of the on-orbit cost of the
salvageable hardware. Since almost all of the demonstration satellite is salvage-
able (except perhaps the ion thrusters and associated systems used to transport it
from LEO to GEO), one can take the salvage value to be essentially 80 percent of
the on-orbit cost of the demonstration satellite. The reason that the salvage value
of the demonstration satellite is not 100 percent of its cost is because of the time
value of money (discounting) and the time delay between investment in the
demonstration satellite and start of construction of the full-scale satellite.
The second principal salvage use of the demonstration satellite, use as a
power source for a laser space transportation system, is a viable salvage use
whether the demonstration program is a success or not. The salvage value for this
use derives mainly from cost savings in the cost of transporting chemical
propellants from earth to LEO for use in LEO to CEO transportation of personnel
and logistics. The considerably higher specific impulse of a laser rocket permits
about a 70 percent reduction in the mass of propellant that must be transported to

POTENTIAL DEMAND POTENTIAL SALVAGE USE SALVAGE VALUE FOR SALVAGE USE REMARKS
DEMMSTRATDM SATELLITE
l GROUTH TO FULL-SCALE
l POUER SUPPLY FOR OTHER SPACE ACTIVITIES
80% OF ON-ORBIT COST ENTIRE DEMINSTRATION VALID USE ONLY IF DEMONSTRATIDR OF SALVAGEABLE HARDWARE SATELLITE IS SUCCESSFUL
SMALL LIMITED TO MALL SALVAGE SPREAD OVER SEVERAL FRACTION OF AVAILABLE YEARS POUER
a POUER SUPPLY Fa\ LASER SPACE TRANSFORTATIOR SYSTEM
11.7 BILLION + DOES MIT RAKE USE OF BENEFIT OF SALVAGE USE LIKELY TRAJISHITTING ANTENNA TO BE CONSIDERABLY HIGHER IF
DEWINSTRATION IS SUCCESSFUL
l SEHRtCE OF RAY ClATERIAL
FULL-SCALE SPS SATELLITES
VERY SHALL VERY LIMITED MIT A LIKELY SALVAGE USE
0 SPARES AND MATERIALS FOR OTHER SPS SATELLITES
VERY SRUL SUBSTANTIAL DENAND MIT CLEAR THAT ANY SPS FOR KLYSTRONS--LIMITED COMPONENTS UILL BE REUSABLE DEClAND FOR OTHER AFTER SERVICE COMPONENTS
l POUER SUPPLY FOR OTHER SPACE ACTIVITIES
0 WUER SUPPLY FOR LASER' TRAnSPCRTATION SYSTEMS
0 FDUER SUPPLY TO RECOVER AMR AND APOLLO ASTEROIDS
VERY SMALL
$1-3 BILLION
f.5-3 BILLION
DEMND FOR POUER IN LIKELY THAT SME REUSE OF SPACE LIKELY TO BE ONLY SPS SDLAR ARRAYS WULD DCCUR A VERY WALL FRACTION OF AVAILABLE POWER
TOTAL DEMAND COULD VERY PROMISING SALVAGE USE REACH OVER 20 SATELLITES
DEPENDS ON LEVEL OF IOT SUFFICIENT KIIOWLEDCE TO SPACE ACTIVITY OETERRINE VALUE ACCURATELY--
COULD USE Iv\NY SATELLITES
0 POWER SUPPLY FIX HIGH-ENERGY, HIGH-VACUUI PHYSICS LAB
RECTENNAE
IOT DETERMINED POSSIBLY WRE THAN ONE SATELLITE
0 SALVAGE AND RESALE OF LAND $30 MILLION ALL RECTENNA SITES SALVAGE VALUE OF 'STEEL AND ALUMINUM OFFSET BY REII)VAL COST FOR CONCRETE
0 REUSE UITH NEW SATELLITE UP TD 30% OF RECTENRA COST
ALL RECTEWA SITES SALVAGE VALUE DEPENDS MI REFURBISHIIENT COST
4
TABLE 1.2 SPS SATELLITE AND RECTENNA SALVAGE VALUE

11
LEO compared to chemical rockets. The availability of a multi-lOO.MW power
supply enables laser rocket transfer times from LEO to CEO to be quite
comparable to chemical rocket transfer times.
The value of a laser space transportation system is clearly dependent upon
the amount of LEO to GE0 and other geocentric space traffic. If the SPS program
does not proceed beyond the demonstration phase, the bulk of the geocentric
traffic will be in support of geosynchronous platforms, providing the salvage value
shown in Table 1.2. If the SPS program continues into an operational phase,
however, the value of a laser space transportation system is substantially greater.
Particularly with a continuing SPS program, the laser space transportation system
appears so attractive that it is likely that it will be developed and used independent
of what.is done with the demonstration satellite.
Many potential salvage uses of substantial value exist for full-scale SPS
satellites. Their value, however, is very uncertain due to the fact that these uses
occur 50 to 80 years in the future. The uses which appear to be most attractive
include laser transportation systems, both space-to-space and for aircraft on
oceanic routes, as a power supply to recover Amor and Apollo asteroids and,
although not quantitatively evaluated, as a power supply for a high-energy,
high-vacuum physics laboratory in space. It is conceivable that these uses, plus
other less exciting salvage uses such as power for a space manufacturing base or
space habitat, could provide sufficient demand for salvage use of an entire fleet of
60 5CW SPS satellites.
The SPS rectennae will most likely all be salvaged. The salvage will include
recovery of steel and aluminum which have a combined value of about $290 million
(at current prices) less removal cost plus recovery of the land. Taking the removal
cost to be 25 percent of value (and adding discounting) the net salvage value of

12
these materials would be about $67 million. It is likely, however, that the cost of.
removing the concrete for recovery of the land would be approximately equal to the
net value of the steel and aluminum. Thus the principal salvage value of the
rectennae is likely to be the present value of the land referenced to the initial
operation date of the system. This is approximately $33 million* at a land value of
about $1,000 per acre.
A more valuable salvage use of the rectennae would be their reuse with new
SPS satellites. In this case, especially if existing concrete footings and other
components are reusable, the salvage value of the rectennae could approach
30 percent of their new cost. Since the rectennae cost represents about 26 percent
of the total SPS cost of about $13.9 billion, this value could approach $1.1 billion.
If only land and the rectenna support structures are salvageable, the salvage value
is about $620 million. This lower number allows substantial evolution to occur in
the rectenna technology.
Finally; those items which are not salvaged must be disposed of. The disposal
options considered and their respective costs are given in Table 1.3. Five disposal
options are considered. Disposal to L4 or Lg, the stable (equilateral) libration
points in the earth-moon system would provide a location where the satellites
might be recovered at some point in the distant future and salvaged for some,
presently unknown, use. No stationkeeping or control of the satellites would be
necessary once they are in this orbit. The second disposal option presented is to
boost the satellite to an orbit above GEO. Twice GE0 is presented arbitrarily.
The AV required is obviously a function of how high the satellite is boosted and the
value provided is nominal. This orbit could utlimately require some stationkeeping
* Corresponds to WBS item 1.4.1.1.1 in the Rockwell International cost estimate.

13
OPTION
SUPRA-GE0 (2X)
HELIOCENTRIC ORBIT
EARTH REENTRY
TARI F 1.3 BICPOSN OPTIONS AJ#D COSTS
3.23
1.75 66
125
REMARKS
3.23 SATELLITE IS REClOVED FOREVER BY IMPACT ON LUNAR SURFACE
-5.00 SOHEYHAT MIRE EXPENSIVE BUT REWOVAL IS PERMANENT
6.03 K)ST EXPENSIVE OPTION MD PROBABLY WJT ACCEPTABLE DUE TO ENVIRONMENTAL AND RISK CONSIDERATIONS
AV (VELOCITY INCREMENT) DEPENDS ON MISSION WOE. NUnBERS PRESENTED ARE BASED ON NICE IHPLUSIVE AV RCQJIRMNTS YHICH APPROXIWATE CONTINUOUS LOU TKWST AV. LWER IMPULSE REpUIREMENTS CQULO BE A!ZHIEVED BY LENGTHENING TRIP TIME. THIS UUJLD REDUCE PROPELLANT-ASSOCIATED COSTS WI INCREASE MISSION ASSCK IATED COSTS. THE MET EFFECT WOULD BE SOME REDUCTION IN TOTAL DISPOSAL COST. HENCE, COSTS PRESENTED ARE PROBABLY SWEWliAT CONSERVATIVE.
STABLE LOCATIONS, SATELLITES COULD BE AVAILABLE FOR SALVAGE AT SOME FUTURE DATE, NO STATIONKEEPING NECESSARY
LOU AV REQUIREMENTS BUT MNY REQUIRE SOME FORM OF ACTIVE CONTROL OR REWVAL AT A DISTANT TIME IN THE FUTURE
activity; however, this activity might be very minimal (once every 1000 years, for
example, depending on requirements).
The third and fourth options dispose of the satellite forever by removing it
from geocentric space. These could be desirable options if it becomes important to
assure that no future concern need be given to the satellite.
The final disposal option, earth reentry, is probably the least desirable from
not only the aspect of cost --it requires the highest velocity increment--but from
environmental and risk concerns as well. This disposal mode is unlikely to be
implemented.
1.4 Conclusions and Recommendations
The conclusions and recommendations with respect to the demonstration
satellite are as follows. The preferred salvage use is to use the demonstration
satellite as a power source for a laser space transportation system. This will
require installation of a laser power transmitter on the satellite. Accordingly it is
recommended that the demonstration satellite be equipped with both a microwave

14 .
power transmitter and a laser power transmitter and be used to demonstrate both
SPS configurations. Upon completion of the demonstration, the microwave power
transmission system could be salvaged for use on a full-scale SPS satellite if the
microwave SPS option is found desirable. The demonstration vehicle, however,
,would remain in GE0 and, using the laser power transmission system, power laser
rockets for LEO to CEO transportation.
The value of the recommended salvage use is strongly dependent on the
continuation of the SPS program, but even in the absence of a continuing SPS
program, it appears sufficient to justify the development of a laser space transpor-
tation system exclusive of the SPS demonstration project. For planning purposes
it is reasonable to assume that this salvage use will offset about 80 percent of the
on-orbit cost of the demonstration satellite hardware.
The conclusions and recommendations with respect to the full-scale satellites
are as follows. Several potential salvage uses exist for full-scale SPS satellites,
each with a salvage value ranging up to about $3 billion. Preferred salvage uses
appear to be use as a power supply for a laser space transportation system, use as a
power supply for powering aircraft on oceanic routes, use as a power supply to
recover Amor and Apollo asteroids and use as a power supply for a high-energy,
high-vacuum physics laboratory in space.
The average salvage value of an SPS satellite appears to be in the range of 5
to 10 percent of the satellite capital cost or about $500 million to $1 billion. Some
specific uses, however, may provide significantly higher salvage values, but they
are likely to be limited to only a few satellites.
A basic theme which seems to dominate the salvage value results is that the
uses which utilize the entire satellite intact have a higher value than those
which require segmenting the satellite. The more the satellite is cut up, the less it
appears to be worth as salvage.

In any event, if it becomes necessary to dispose of SPS satellites, a number of
disposal options appear feasible. The cost of disposal is on the order of
$100 million. This amount has a present value referenced to the initial -operation
date of the satellite of about $30 million or only about 0.3 percent of the capital
investment cost of the satellite.
It is clear from the above analysis that an assumption of zero net salvage and
disposal cost for the SPS satellites is conservative. A less conservative assump-
tion, for purposes of comparing SPS to alternative systems, would be to take a net
salvage value between 5 and 10 percent of satellite capital investment cost.
1.5 Backup Documentation
The remaining sections of this report provide backup documentation to the
results shown above. Both in review of the backup documentation and interpreta-
tion of the above results, the reader should keep in mind that the analyses and
results presented here are based upon long-range projections of space and other
activities and thus contain considerable uncertainty.

16
2. A POST-2000 MISSION MODEL
Oscar Morgenstern once said, “Predicting things is very difficult, especially
the future.” Yet, if one is to establish the salvage value of SPS demonstration and
full-scale satellites, one must describe the environment within which these
satellites are salvaged. At the very least, this means identifying a space mission
model for the time period during which the salvage operation will take place.
Basically this time period may be divided into two parts: the years 2000 to 2030
during which time the principal object of salvage is the SPS demonstration
satellite; and the period 2030 to 2060, and possibly beyond, when full-scale SPS
satellites would become available for salvage.
To begin with, one should recognize that these time frames, at least in terms
of specific economic projections, are quite far in the future. The earlier time
frame begins 20 years from now and spans a period of 30 years, ending half a
century from today. The second period, beginning in the year 2030, is a period of
projection that is one-half a century and more in the future. On the scale of life of
five-year and ten-year plans, and of long-range planning that does not go beyond the
end of the 20th century, it is, for all practical purposes, impossible to develop a
mission model containing specific space missions. Rather, over the period 2000 to
2030, projections of space activities are highly uncertain, although there is some
hope to identify and establish general trends. These trends can be identified on the
basis of existing technologies and technology projections for the relatively near
term. For example, an operational space transportation system based on the Space
Shuttle and advanced Shuttle derivatives is likely to lead to reduced costs for space
activities and, subsequently, to an increasing level of commercial business in space.

17
Furthermore, there is some hope for identifying the major directions which this
“industrialization of space” will take.
Beyond the year 2030, however, one’s ability to project even general trends
diminishes greatly. A fifty-year period is sufficient for major new and totally
unforeseen technologies to develop and become commercialized. Without specific
knowledge of these technologies (and that knowledge cannot be had today),
projections of post-2030 space activities are entirely speculative. It is with the
above qualifications that the following projections of future space activities are
made. The first steps in making a long-range projection of space activities is to
determine where the impetus for such activities will arise. At the present time
funding for space activities derives almost entirely from national governments;
principally the U.S. and U.S.S.R. U.S. Federal Government expenditures on space,
spanning both DOD and NASA, encompass about $6 billion for FY 1980.* Looking
at free world activities and taking this $6 billion to be a measure of free world
government sponsorship of space activities and assuming, furthermore, that at the
very most this government sponsorship is unlikely to accelerate at a real rate of
growth greater than 3 percent per year, one sees a potential level of government-
sponsored activitiy in space by the year 2060 of only some ten times larger, or $60
billion per year (1980 $1, than the present amount. A space program sponsored only
by NASA and DOD (assuming that they exist in the year 2060) at the level of $60
billion per year could possibly support some salvage activities on SPS satellites, but
they would be severely limited.
It is highly unlikely, however, that one would be faced with the problem of
salvaging SPS satellites in a space program that is principally funded by NASA and
DOD, and to a lesser extent by other governments. The simple fact is that one
*The Budget of the United States Government, Fiscal Year 1980.

18
would not be concerned about salvage of SPS satellites unless an SPS program is
indeed implemented. Furthermore the presence of an SPS program infers, in
itself, the successful development of a number of space-based technologies that
should lead to widely expanding use of space by the private sector. The transition
from federal funding to private sector funding for space activities is already
evident with communications and information satellite programs, and the accelera-
tion of these trends due to improved space transportation technologies is clearly
forthcoming. The successful implementation of an SPS program assures that highly
advanced technologies in.low cost space transportation including both earth to LEO
and LEO to CEO will have been successfully developed. In addition, technologies
for the construction and deployment of large-scale space structures, long duration
manned facilities and low cost solar cells are assured. These technologies will be
available by about the year 2000, or at the time of implementation of the SPS
system, and will thus contribute to the economic development of space in the
intervening period (2000 to 2030).
At the present time the private sector is making significant strides forward
in space-based activities with a focus on communications and data gathering.
Present communications activities in the private sector include not only COMSAT
(a quasi-private sector organization) but a number of U.S. corporations such as
Western Electric, RCA, IBM and so on. These activities should begin to mature
around the year 2000 with the implementation of large communications platforms
in geosynchronous orbit. Both these and lower altitude platforms will also probably
be implemented by the private sector for data collection. The data collection
systems will include both natural resources and environment monitoring such as the
LANDSAT and SEASAT satellites have done to date. It is conceivable that the
communications industry alone could grow to a level of expenditure of between

19
$15 billion and $100 billion per year by the year 2060, and that data collection
activities would be on the order of $10 billion to $100 billion per year by that time.
Space-based communications expenditures are likely to grow in order ‘to
handle personal communications, business data transfer and video communications
including teleconferencing. The advantages of teleconferencing in business appli-
cations are fast becoming apparent and this mode of communication is likely to
supplant a significant fraction of business travel. It is an interesting aside to note
that advanced communications activities such as this are highly energy conserva-
tive. By the year 2060 it is conceivable that between 30 and 60 large communica-
tions platforms will be in place, many in geosynchronous equatorial orbit, but some
in other orbits to serve more extreme latitudes. The present desire for geo-
stationary satellites is clearly shown in Figure 2.1. By the year 1990 some 150
satellites will have served various functions, mostly communications, in that orbit.
FIGURE 2.1 GEOSTATIONARY SATELLITES--TO DATE AND PLANNED

20
As data collection in space becomes an economic reality, it is rapidly found
that satellites can produce prodigious quantities of data. A single advanced earth
resources satellite, for example, might produce as much as lo9 bits of data per
second. Clearly, no human will ever examine all of the available data. Thus it is
reasonable to expect a substantial amount of space-based data processing in order
to reduce these data to an informational level upon which decisions can be based.
Space-based data processing in large (by current standards) computers, co-located
with the data collection sensors in space, thus enabling the communications link
with earth to carry minimal amounts of processed data, is likely.
An intriguing and totally unpredictable area of space activity is space-based
manufacturing. Space, of course, offers a unique environment including high
vacuum and zero gravity which should be of considerable benefit to particular
manufacturing processes. The unfortunate fact at this time is that since this
environment has heretofore not been available to the private sector, the tech-
nology for using it has not been developed. As a result, to date, NASA and others
have studied a variety of products that might potentially be manufactured in space
and found that indeed there may be benefits in doing so. Unfortunately there is a
considerable time lag between today and the date at which commercial space-
based manufacturing facilities will be available to the private sector. Thus the
principal conclusion to which one might arrive is that there are many potential
products that could be beneficially manufacturered in space, but none of them are
the products that have been examined to date, nor are they products that one
would choose to manufacture in space based upon what is known today. Accord-
ingly the annual expenditures on space-based manufacturing is highly uncertain at
this time. Conceivably they could be as low as a fraction of a percent or as high
as possibly 10 percent of the gross national product, say a range of $10 billion to
$500 billion per year.

21
The third major category of private sector activity in space is energy. If SPS
is implemented, these expenditures will be quite high. For example, the operation
and maintenance expense on a fleet of 60 SPS satellites will be on the order of $30
billion per year. Capital construction of new SPS satellites could add another $20
. billion to $50 billion or more to this amount. Worldwide implementation of SPS on
a large scale plus construction of space-based energy systems for lunar exploration,
asteriod retrieval and space habitation could increase this amount to as much as
$250 billion per year.
In addition to the above four categories of space-based activities, there are a
number of other activities that are likely to occur in space. These include physics
and astronomy, solar system exploration, basic and applied research, space tourism,
space-based navigation systems and so on. These miscellaneous activities are
likely to involve expenditures in the range of $5 billion to $50 billion per year by
the year 2060. Summing these figures as shown in Figure 2.2, the private sector
potential activities in space range from a low of about $65 billion per year in the
year 2060 to a high of about $1 trillion per year.
ANNUAL EXPENDITURE
ON SPACE, 19806
NASA DOD
1980 2060 YEAR
PRIVATE SECTOR POTENTIAL
ENERGY $25- 2508 COMM . 15-100 DATA 10-100 &AN. lo- 500 MISC.
5655~iOo500
1 3X/YR REAL GROWTH
FIGURE 2.2 POTENTIAL SPACE ACT.IVITY LEVELS, 1980-2060

22
The major observation which one draws from Figure 2.2 is that dramatic
growth in space-based activities, if such growth indeed occurs between now and the
year 2060, will derive mainly from private sector ventures undertaken because they
are economic. The challenge to NASA is to focus space programs between now and
the year 2000 in such a way as to promote the economic utilization of space.
Given the proper opportunities, it is conceivable that as much as 20 percent of the
gross national product in the year 2060, or say $1 trillion per year, will be derived
from space-based activities. On the other hand, without proper encouragement and
technology development from NASA and other government agencies, this amount
could be very much smaller and the government could still dominate annual
expenditures on space activities as late as the year 2060.
2.1 The Period 2000 to 2030
In the context of the above discussion, it is possible to make useful
observations on space-based activities during the period 2000 to 2030. A principal
activity in space during this period will quite clearly be space-based communica-
tions, data collection and data processing. It is also evident that the current trend
of placing an ever increasing number of relatively small satellites in geosyn-
chronous orbit cannot continue. Communications and data needs will be satisfied
in the future by the use of large geosynchronous platforms rather than by a number
of smaller satellites. Accordingly the following general trends are identified for
the post-2000 time period:
1. Space will be populated with fewer larger spacecraft. This will be accomplished by transition to large mutli-purpose platforms.
2. Bandwidth limitations will be overcome by using higher power levels and spot beams.
3. Multi-purpose platforms will not be co-located with SPS due to con- flicting requirements such as the potential need for turning SPS satellites out of the sun during maintenance periods.

23
4. Mutli-purpose platforms will occupy many important orbits, not only GEO.
5. On-orbit servicing capability will be maintained for all multi-purpose platforms. Because of their high value, downtime on these platforms will be extremely expensive. The balance between man and robotics for providing on-orbit servicing capability is very uncertain at this time.
6. Many activities in space will be internationally sponsored, and it is likely that large geosynchronous platforms will be considered multi- national territory.
7. Many of the activities performed in space in the post-2000 period will be performed there because it is economic to do so independent of government funding. These activities will thus represent a significant transformation of space-based activities from the government to the private sector.
8. A fully reusable space transportation system and multi-purpose plat- forms will dramatically lower the cost of the space activities and thus promote increasing private sector investments in space.
9. System complexity will shift from the ground segment where it is presently to the space segment, enabling ground-based users to partici- pate in the use of space-based communications and data collection with relatively low investment. However this does not infer that the majority of expenditures on a particular system will be on the space segment. To the contrary, the lowering of costs for ground-based users is likely to increase the number of ground-based users dramatically, thus maintaining the preponderance of expenditures on the ground segment. For example, if the worldwide market for personal communicators at $100 per communicator is 100 million units, a total expenditure on the ground,segment of some $10 billion will ensue. This might be compared to an expenditure on the space segment in support of these communi- cators of, say, $5 billion.
Of particular interest in the post-2000 time period are geosynchronous
platforms. It has already been observed that geosynchronous orbit will be
dominated by large platforms during this period. The seeds of this transformation
have already been sown, and it is expected that during the late 80s and early 90s a
number of U.S. domestic and Intelsat platforms in the 25 kilowatt class will be
placed in geosynchronous orbit. During the period of the mid-90s to about the year
2010, the placement of some five to ten larger platforms in the 100 to 500 kW class is
likely. Beyond the year 2010 one can look for the replacement of the earlier

24
platforms by a new class of platforms in the 1 to 5 MW class, growing to a total of
some 15 to 30 platforms by the year 2030. The larger platforms are likely to be
manned either by robots or by two-man crews rotated periodically. The purpose’of
man will be to effect immediate service, repair and maintenance as necessary to
keep the platform properly functioning. The cost of the advanced platforms will be
in the range of $2 billion to $10 billion each, and they will have a structure and
power supply life approaching 50 years with other systems being updated on about a
ten-year cycle.
The advanced geosynchronous platforms will be supported by a manned
geosynchronous facility which is also likely to be a space-based manufacturing
facility to manufacture and rebuild components and subsystems for the geosyn-
chronous and other space platforms. As a result it is likely that 50 to 500 persons
will be stationed in geosynchronous orbit in support of the geosynchronous
platforms.
Spacecraft power and lifetime trends to date, as shown in Figure 2.3, clearly
reflect these trends. Twenty-five kW platforms are presently in the planning
stage* and studies on 100 to 500 kW platforms for the late 1990s time period have ++
already been performed. The continuing improvements in lifetime and growth in
power levels shown in Figure 2.3 are fully compatible with SPS-based technologies.
It is interesting to consider the traffic necessary to support the geosyn-
chronous platforms that are likely to be put in place in the 2000 to 2030 period.
* Payloads Requirements/Accommodations Assessment Study for Science and Applications Space Platforms, Second Quarterly Review, TRW, June 10, 1980.
Third Quarter Briefin f
: Conceptual Design Study--Science and Applications Space Platform (SASP , McDonnell Douglas Astronautics Company, June 11, 1980.
** Space Industrialization --Background, Needs and Opportunities, Rockwell In- ternational, Report No. SD-78-AP-0055, April 14, 1978.

25
10,000,000
5,ooo.~
1,OOo.ooo
500,000
100,000 50,000
E
2 10.000
E s
5.000 a.
x 1.000
500
100
50
10
l INTELSAT (YR OF FlR!ZT LAUNCH)
- .-.e--
. REFERENCE MISSIONS ,l
m nmFl
SOURCE: NASA ADVISORY COWCIL SUBCOMMITTEE ON POWER TECHNOLOGY FOR FUTURE SYNCHRONOUS SATELLITES AND PLATFORMS, MINUTES OF MEETING DEC. 13 L 14, 1978.
1965 1975 1985 1995 2005 2015 2025
YEAR
FIGURE 2.3 HISTORICAL AND PROJECTED GROWTH OF SPACECRAFT POWER AND LIFETIME
These traffic requirements are shown in Table 2.1. This table reflects the fact
that there are two fundamentally different classes of payloads which need to be
transported to geosynchronous orbit. The first class involves durable goods such as
the materials for construction of new platforms. It is probably economic to
transport these materials between LEO and CEO using a low-thrust electric cargo
orbit transfer vehicle (COTV). The implications in this decision indicate that the
cost of capital for the durable goods during the period of transportation is more
than offset by the cost savings afforded by the electric COTV. Nondurable goods,
however, such as man and his logistics, require more rapid forms of transportation.
The present option for the personnel orbit transfer vehicle (POTV) involves the use

26
. UATERIAL FOR COWSTRUCTICM OF NEY PlATFtWS (50,000-2OO.CJODffi EACH)
. REPLACE#NTS.CH&JGEWTSANDSPARES (5% CMNGEOUT/YR, MLF BROUGHT UP
l k4N (100-1000 PERSON-TRIPS LEO- GEO--6 Ml. YORK CYCLE, 50-5DO 6EO-GE0 PERSDN-TRIPS)
l LOGISTICS (1800 KG/PERSON-YR)
l COTV AND POTV PAYLOAD WYIWLES
- COTV (52 OF PAYLOAD)
25.000 - 3oo.ooo 25,000 - 3D0,ooo
4wm - 300,ooo
8,ooO- 80.000
30,000 - 300,ow
177.000 - 1,775.DOo 116,000 - 1,106.000 - COTV TRAFFIC ( 47,DOO - 473,000) ( 68,OOfl - 625,000
l PROPELlAM
- cow (~EcTRIc, 10,000 SEC) 6,000 - 60,DOO NIL - POTV (CHEHICAL. 460 SEC) 400,000 -4,oDO.ooD 1,oOD - lO.MKl
of chemical propellants (oxygen and hydrogen) to enable LEO to CEO trips to be
made on the order of one-half day. It is evident from Table 2.1 that rather large
quantities of chemical propellants are necessary to support a POTV system. It is
thus apparent that alternatives to the use of a chemical POTV could be quite
advantageous.
2.2 The Post-2030 Time Period
Very little more can be said about space activities in the post-2030 time
period than has been noted already above. It is likely that this period will see the
widespread use of space by man including space habitation and utilization of
extraterrestrial resources. It is also likely that many scientific endeavors will move
into space: astrophysics, astronomy, high-energy physics and biological research

27
are examples. It is this context in which salvage value of SPS satellites was
considered.

28
3. SPS DEMONSTRATION SATELLITE SALVAGE ALTERNATIVES
According to the Rockwell International SPS development program. plan,* the
completion of the SPS Technology Advancement phase by 1990 will provide the
technical confidence to proceed with a pilot plant demonstration phase. The
primary objective of this development phase would be the demonstration of all SPS
technologies to those utility firms and consortiums that would ultimately capitalize
and operate the production or full scale operational system.
The pilot-plant or demonstration satellite will be constructed in low earth
orbit using a heavy lift launch vehicle (HLLV) for mass transportation and
construction support systems. The demonstration satellite will be transferred to
geosynchronous orbit by an on-board electric propulsion system. The demonstra-
tion satellite will operate in the same mode as the full-scale SPS satellite by
directing a microwave power beam at a total power level of a few hundred MW to a
standard modular segment of the proposed operational ground rectenna. The
demonstration/operational period may range from six months to a few years, during
which time the SPS elements of the full-scale solar power satellite will be operated
in the operational environment. Operational data will provide the quantitative
basis for analyses which will support full SPS commercial capability.
The initial step will be to establish a base in low-earth orbit that is capable
of constructing the demonstration satellite. The demonstrator satellite, shown near
completion in Figure 3.1, is sized to the projected electric orbit transfer vehicle
(EOTV) power level of 335 MW at the array. Allowing for radiation degradation
*Satellite Power Systems (SPS) Concept Definition Study, Final Report, Vol. 1, Rockwell International, Contract NAS&32475, March 1979.

29
FIGURE 3.1 SPS DEMONSTRATION SATELLITE IN FINAL PHASES OF CONSTRUCTION (SOURCE: ROCKWELL INTERNATIONAL)
and power distribution losses, power to the microwave antenna will be approxi-
mately 285 MW. Microwave transmission losses further reduce this value to about
230 MW at the rectenna, resulting in recovery of 8 h4W of power for a sparsely
populated 7-km-diameter demonstration rectenna or 2 MW of power for a 1.7%km
demonstration rectenna.
The demonstration satellite is a single unit or bay of the operational SPS
which consists of 30 such bays as shown in Figure 3.2. A list of the basic items
which comprise the demonstration satellite and their related DDT&E and first unit
costs are summarized in Table 3.1. The mass properties of the full-scale and
demonstration satellites are summarized in Table 3.2.
Because of the large investment in the demonstration satellite and the
associated transportation costs and the on-orbit capability that will exist, there is

.w I -n-m - .__. --.-- _- .._. ----
FIGURE 3.2 FULL-SCALE OPERATIONAL SPS SATELLITE CONFIGURATION (SOURCE: ROCKWELL INTERNATIONAL)
a natural concern as to the alternative uses of the demonstration satellite upon
completion of the demonstration program, and the economic value associated with
these uses. The following sections discuss alternative uses, and the value derived
therefrom, to which the demonstration satellite may be put upon completion of the
demonstration program. Four alternative uses have been considered, namely:
1. Use of the demonstration satellite as the first building-block of the first full- scale SPS satellite. The economic value, or salvage value, of the demonstra- tion satellite derives primarily from the costs which would be foregone in the construction of the full-scale satellite through the incorporation of the demonstration satellite into the full-scale satellite.
2. Use of the demonstration satellite as a source of power for non-SPS space activities. This use requires the systematic disassembly of the demonstration satellite and transferral and use of the disassembled power subsystems as power supplies in other space missions. Here the salvage value of the demonstration satellite derives primarily from the costs (both hardware and associated transportation) foregone by the other space missions through their use of the demonstration satellite power subsystems.

- -
TABLE 3.1 DEWONSTRATION SATELLITE COST STRUCTURE*
HORK BREAKDOYN STRUCTURE NLWBER
SWITCHGEAR ii CONVERTERS--E.C. CONDUCTORS & INSULATION--E.C. ACS HARDWARE--E.C. SLIPRINGS--PRECURSOR PRIMARY STRUCTURE--INTERFACE
1.1.9.1.10 SECONDARY STRUCTURE--INTERFACE 1.1.9.1.11 MECHANISMS--INTERFACE 1.1.9.1.12 CONDUCTORS L INSULATION
SLIPRINGS BRUSHES--PRECURSOR PRIMARY STRUCTURE--POWER TRANS.
1.1.9.1.15 SECONDARY STRUCTURE--POUER TRANS. 1.1.9.1.16 TRANSMITTER SUBARRAYS--KLYSTRONS 1.1.9.1.17 SWITCHGEAR & CONVERTERS--P.T. PRECURSOR
CONDUCTORS & INSULATION--P.T. PRECURSOR BATTERIES--P.T. PRECURSOR
1.1.9.1.20 ULATION--PRECURSOR
*SOURCE: SATELLITE POWER SYSTEMS (SPS) CONCEPT DEFINITION STUDY, VOL. II, ROCKWELL INTERNATIONAL, MARCH 1979.
+1977 DOLLARS.
w c
I

. . _ . . .--
32
TABLE 3.2 MASS PROPERTIES OF FULL-SCALE AND DEMONSTRATION SPS
SATELLITES (lo6 KG)
SECONDARY STRUCTURE SOLAR BLANKETS CONCENTRATORS
ON 8 CONDITIONING GEMENT & CONTROL
RY STRUCTURE DARY STRUCTURE
TRANSMITTER SUBARRAYS POWER DISTRIBUTION & CONDITIONING THERMAL CONTROL
*SOURCE: SATELLITE POWER SYSTEMS (SPS) CONCEPT DEFINITION STUCY, FINAL REPORT, VOL. II, ROCKWELL INTERNATIONAL, CONTRACT NAS8-32475, MARCH 1979.
+DEMONSTRATION SATELLITE SCALED FROM FULL-SCALE SATELITE ACCORDING TO THE RATIO OF POWER GENERATED.

33
3. Use of the demonstration satellite as a power supply for a laser orbit-to-orbit transportation system. A laser orbit-to-orbit transportation system would derive value through transportation cost savings primarily on the cost of transporting otherwise-needed propellants to LEO.
4. Use of the demonstration satellite as a source of space-based materials. The salvage value of this use derives from transportation costs and material costs which may be foregone by using the basic materials existing in the demon- stration satellite.
3.1 Growth to Full-Scale Satellite
It is currently envisioned that the demonstration satellite will consist of an
energy conversion segment, an interface segment and a power transmission
segment. The energy conversion segment will consist of primary and secondary
structure, concentrators, solar blankets, switchgear and converters, conductors and
insulation, attitude control and information management subystems. The interface
segment includes the primary and secondary structure, mechanisms, conductors/in-
sulation and slipring brushes. The power transmission segment will be representa-
tive of the full-scale satellite antenna to the extent of using identical components.
It will include structures, transmitter subarrays, power distribution and condition-
ing, batteries, insulation and phase control elements.
Current plans call for growth of the demonstration satellite into the first
full-scale SPS satellite. By growing the demonstration satellite into the first full-
scale satellite, certain costs may be foregone (that is, a cost item that would have
to be incurred if the demonstration satellite were not available for use, would not
be incurred since the demonstration satellite & available for use) whereas others
may be incurred. The present value of the net of these costs referenced to the
initial operation date of the demonstration satellite, is the salvage value that may
be derived from this use of the demonstration satellite. It is assumed throughout
the following that the demonstration satellite is in orbit and all associated DDT&E
and first unit costs are sunk.

-
34
The salvage value of the demonstration satellite when used as an initial
element in a full-scale satellite is summarized in Figure 3.3 and discussed below.
The salvage value, SV, is
sv = PVI + PV2 - PV3 - PV4
wheie PVI is the present value of the full-scale satellite costs that may be
foregone. PVl accounts for the hardware costs for providing a capability
equivalent to the demonstration satellite capability and the transportation costs
associated with transporting this equivalent capability. The demonstration satel-
lite capability must be adjusted for degradation effects which are a function of
time (the time interval to the deployment of the first full-scale satellite) and both
hardware and transportation costs must be adjusted for learning effects (assumed
to be a function of time) that may also take place during this interim period. PV2
is the present value of consumer surplus benefits that will result if the marginal
VALUE OF SV- SPS DEt40 = I I SATELLITE
'RESENT VMUE OF INITIAL INVESTMENT FOREGONE
a SPACE HARDWARE COSTS FOR PROVIDING CAPABILITY ECJJIVALENT TO mo-sps (ADJUSTED FOR LEARNING a TIMING)
l COSTS FOR TRANSPORTING EQUIVALENT OF DEW-SPS II - PVl
I PRESENT VALUE OF CONSUMER SURPLUS BENEFITS I
+ l REDUCED PRICE OF ELECTRICITY FROM USE OF DEMO-SPS IN THE TIME INTERVAL TO ON-ORBIT CONSTRUCTION OF OPERATIONAL SPS
- PV2
I
-I
PRESENT VALUE OF INCREASE IN CONSTRUCTION (INTERFACE) COSTS
o CANNOT TAKE ADVANTAGE (AT LEAST FOR INTERFACING WITH DE!@-
I
-PV3 SPS) OF KNOWLEDGE GAINED FROM DE140 PROGRAM
- PRESENT VALUE OF INCREASE IN DEMO-SPS INVESTMENT COST TO ACHIEVE RELIABILITY CHARACTERISTICS OF OPERATIONAL SPS
- PV4
FIGURE 3.3 SALVAGE VALUE--GROWTH TO FULL-SCALE SATELLITE

35
cost of energy from the SPS system is below that resulting from other energy
sources. The consumer surplus benefits are directly proportional to the price
differential, the energy produced and the time interval from demonstration
completion to on-orbit construction of the operational satellite. PV3 is the present
value of possible increases in construction (interface) costs that result from not
being able to take advantage of knowledge gained from the demonstration program.
PV4 is the present value of the increase in demonstration satellite investment cost
to achieve the same reliability characteristics that would be achieved by the first
full-scale operational satellite. Since no information is available on demonstration
satellite cost in terms of reliability characteristics, PV4 has been assumed to be
zero. The detailed value model is indicated below together with definitions of the
variables and the nominal values utilized in the analysis. It should be noted that
the annual transportation investment cost is treated parametrically and is obtained
by spreading the cost to deliver 1.618 X lo6 kg to geosynchronous orbit over a three
year period (30%, 40% and 30% respectively). The basic range of transportation
cost has been considered from 0 to 100 $/kg predicated upon the assumption that
10~ transportation costs will have to be achieved in order to proceed with an
economically viable full-scale operational SPS system.
PV 1 = (IOD-IOC)L1 * ( l-&)loD-loC + $ DCSTIHi + (l+& DR I-i
i=l
+ (IOD-IOC)L2 + 2 DCSTITi * (l+g )I-’ i=l
where L 1 = (log 10LINVH-2.0)/leg lo2.
L2 = (loglOLINVT-2.0)/loglo2.

36
IOD-IOC PV2 = 876 * DSPSP * s (PCONEi-PSPSEi) * (1 DR 2000-IOC-i -gj)’ * (I+m)
i=l
PV3 = CINTF * PclI;OTF * DSPSP * (1,s )2000-10D
PV4=0
Variable
DR
IOC
IOD
DCSTIHi
DCSTITi
LINVH
LINVT
PCONE. 1
PSPSEi
DSPSP
Definition
Time subscript (years)
Number of years from time of first unit cost expenditure to 2000
Discount rate (%)
Date of initial operating capability for supplying electric energy to the grid from the demonstration satellite (year)
Date of initial operating capability for supplying electric energy to the grid from the SPS operational satellite (year)
Annual nontransportation investment cost of demonstra- tion satellite ($/year)
Annual transportation investment of demonstration satellite ($/year)
Cumulative average learning rate for SPS nontransportation costs (%)
Cumulative average learning rate for SPS transportation costs (46)
Average cost of energy from non-SPS sources displaced by SPS in year i (mills/kWh) Cost of energy from SPS in year i (mil.ls/kWh)
Demonstration satellite power available to grid (kW)
Nominal Value
3
4
1998
2000
521X106 (1996) 695X lo6 (1997) 521X106 (1998)
See Text
90
90
Differences Assumed Small
162X 103kW

37
Variable Definition _Nominal Value
D
CINTF
PCINTF
Percent power degradation (due to both random non- replaced failures and radiation effects) of SPS power supply per year (%/year)
1
Cost per kilowatt for interfacing operational SPS satellite power modules with other operational SPS satellite power modules ($/kW)
--
Percent increase in cost of interfacing operational SPS power modules with demonstra- tion satellite power modules (%)
Assumed to be zero
The results of the analysis are illustrated in Figure 3.4 where the present
value of the demonstration satellite is indicated as a function of transportation
cost ($/kg) and the time interval between the initial operations dates of the full-
scale operational satellite and the demonstration satellite. The basic conclusion
that may be reached from the data presented in Figure 3.4 is that the salvage value
($l.l-$1.7 billion) of the demonstration satellite may be a large percentage of the
demonstration satellite on-orbit cost (first unit plus transportation cost). The
salvage value may be in the range of 60-90 percent of the on-orbit cost of the
demonstration satellite depending upon transportation cost achieved and the time
interval from demonstration satellite operations to operation of the first full-scale
SPS satellite.
3.2 Demonstration SateI+ &e--as-a Power- Supply for Non-SPS Space Activities -~_-- .~
If the demonstration satellite is not utilized as an initial ‘element of a full-
scale operational SPS satellite, it may serve as a source of power (335 MW) and
major subsystems for other space activities. When used in this manner its value is
a function. of the demand for space power and other major subsystems and the
timing of this demand. The value of the demonstration satellite when used as a
power supply for non-SPS space activities is the value of the power supplies and

38
.2000
t
2 YEARS
INCREASING TIME BETYEEN CONSTRUCTION OF DEW L F/S SATELLITE (IOO-lot)
01 I 1 0 50 100
TRANSPORTATION COST, $/KG
FIGURE 3.4 PRESENT VALUE OF DEMONSTRATION SATELLITE WHEN USED AS AN INITIAL ELEMENT IN A FULL-SCALE SATELLITE
major subsystems that would not have to be procured and transported for the other
space activities less the specific costs associated with segmenting the demon-
stration satellite into the useful power modules and other major subsystems and the
incremental costs of installing these on other mission spacecraft.
Since it is not possible to accurately forecast the demand for space power in
the 2000 to 2030 time frame, the demand has been treated parametrically in terms
of MW required per year. This demand has been considered in the range of 1 to
15 MW/yr as illustrated by the solid lines in Figure 3.5. The dashed curve in
Figure 3.5 indicates the avaiIable supply, taking into account a l%/yr degradation in
power and an assumed inefficiency (25% salvage loss) or loss resulting from the
salvage segmentation process. The intersection of the supply and cumulative
demand curves yields the number of years that the demonstration satellite power

39
3DO-335WEKlLPWER 8 l'Z/YR DEGRAOATIOH
I 252 SALVAGE LOSS B
E e *cQ- 5 2 2
= 5 WYR
2DDo 2010 2020 2030 2040
CALENDAR YEAR
FIGURE 3.5 SUPPLY & DEMAND FOR POWER FROM DEMONSTRATION SPS SATELLITE
supply will last (for example, at demand rates of 15, 10, 5 and 1 MU’/yr, the
demonstration satellite power supply will last 12, 20, 33 and 96 years respective-
ly). It was assumed for the analyses reported in the following paragraphs that the
demonstration satellite would have a maximum life of 30 years for being able to
remove portions of the power supply.
The salvage value of the demonstration satellite when used as a source of
power and other major subsystems for other space activities is summarized in
Figure 3.6 and discussed below. The salvage value, SV, is
SV=PVI-PV2-PV3-PV4-PV5
where PVl is the present value of the non-SPS mission investment costs that may
be foregone because of the utilization of the SPS demonstration satellite hardware.
The costs that may be foregone include both the space hardware costs and the

40
I
PRESENT VALUE OF NON-SPS MISSION INVESTMENT COSTS FOREGONE -
l SPACE HARDWARE COSTS (POWER L OTHER SUBSYSTEllS)
l TRANSPORTATION COSTS FOR SPACE HARDWARE
- I
\ PRESENT VALUE OF INCREMENTAL MISSION KAINTENANCE COSTS
l RANDOM FAILURES
m WEAROUT FAILURES
-pv2
PRESENT VALUE OF INCREMENTAL DEMONSTRATION SATELLITE OPERATION COSTS
s -pv3 a CONTINUING OPERATIONS 6 MAINTENANCE OF DEMONSTRA-
TION SATELLITE
PRESENT VALUE OF INCREASE IN MISSIUN OPERATIONS COSTS
l SEGMENTING OF DEMONSTRATION SATELLITE POWER SYSTEM
I
-PV4
l INSTALLING SEGMENTED DEMONSTRATION SATELLITE POWER SYSTEM ON MISSION SPACECRAFT
- { PRESENT VALUE OF DISPOSING OF UNUSED PORTION OF DEMDN- STRATION SATELLITE > - PV5
FIGURE 3.6 SALVAGE VALUE--SPS DEMONSTRATION SATELLITE USED AS A SOURCE OF POWER AND OTHER SUBSYSTEMS FOR OTHER ACTIVITIES
transportation costs incurred in placing the hardware in the desired orbit. PV2 is
the present value of incremental mission maintenance costs incurred as a result of
using the demonstration satellite hardware in lieu of mission specific hardware.
For this analysis PV2 has been assumed to be zero. PV3 is the present value of
incremental demonstration satellite operations costs incurred as a result of con-
tinuing the SPS demonstration satellite operations throughout the salvage period
and providing the necessary maintenance. PV4 is the present value of the increase
in mission operations costs and includes those costs incurred to segment the
demonstration satellite power system and to install the segmented power system on
the other mission spacecraft. PV5 is the present value of the costs associated with
disposing of the unused portion of the demonstration satellite. The detailed value
model is indicated below with the definition of variables and nominal values for the
variables also indicated.
41
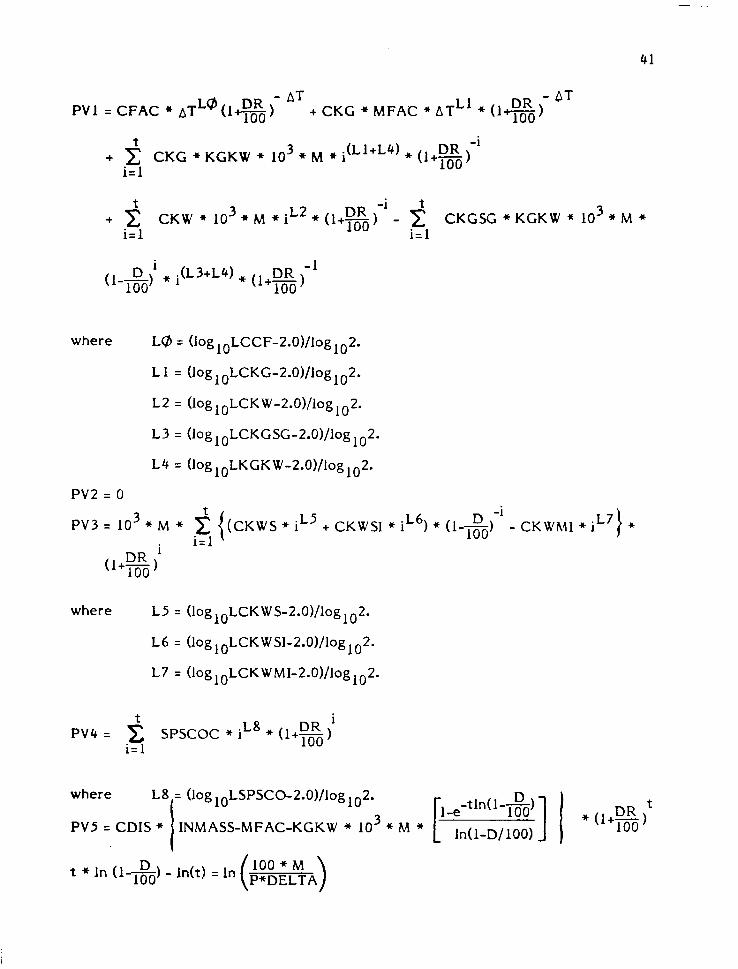
PVl = CFAC + ATL@(lB) - AT
+ CKG + MFAC * ATL1 * (I+@ *T
+i i=l
CKC + KCKW + lo3 + M * i(L1+L4) + (l+zJ-’
CKW * 103*M *iL2*(l+s) CKCSC + KGKW * lo3 *M+ i=l i=l
(1 . D, -100 + i(L3+L4) + (l+DR )-I
100
where L@ = (loglOLCCF-2.0)/log102.
Ll = (loglOLCKG-2.0)/log102.
L2 = (logloLCKW-2.0)/log102.
L3 = (loglOLCKGSG-2.0)/log102.
L4 = (loglOLKGKW-2.0)/loglo2.
PV2 = 0
PV3 = IO3 * iv + CKWS + iL5 + CKWSI + iL6) * (l-&yi - CKWAII + i”} +
(1 DR) +im
where L5 = (loglOLCKWS-2.0)/log102.
L6 = (loglOLCKWSI-2.0)/loglo2.
L7 = (log10LCKWMI-2.0)/log102.
PV4 = i SPSCOC + iL8 i=l
+ (I+!&
where = (log loLsPsco-2.0)/log lo2.
PV5 = CDIS + INMASS-MFAC-KGKW * IO3
D t * In (lm ) - In(t) = In (;%?A)

42
Variable
i
t
M
P
D
DELTA
DR
CKGSG
CKWS
CKWSI
CKWMI
SPSCOC
INMASS
KGKW
Definition
Time subscript referenced to year 2000 (years)
The time at which demonstration satellite power is consumed (years)
Rate of increase in the demand for space power (MW/year)
Power available from the demon- stration satellite in 2000 for space operations (W)
Percent power degradation (due to both random nonreplaced failures and radiation effects) (%/year)
Percentage of the demonstration satellite power that may be efficiently utilized for other missions (%I
Discount rate (%)
Cost per kilogram for transporting power subsystem from the demon- stration satellite orbit to mission orbit ($/kg)
Cost per kilowatt for segmenting the demonstration satellite into useful size power modules ($/kW 1
Cost per kilowatt for installing the demonstration satellite system segment on a mission spacecraft ($/IN)
Cost per kilowatt for installing non-SPS power system on a mission spacecraft ($/kW)
Demonstration satellite continuing operations costs (during salvage operations) ($/year)
Initial mass of demonstration satellite just prior to start of salvage operations (kg)
Achievable power density of power system (kg/kW)
Nominal Value
See Figure 3.5
Treated Parametrically
335x lo6
1
75
4
Negligible
152 (See Appendix A)
(See Appzzdix A)
15
0.6X IO6
1.618X10⁶
,825 (See Appendix A)

Definition Variable --
T
CKW
CKG
CDIS
MFAC
CFAC
LCCF
LCKG
LCKW
LCKGSG
LKGKW
LCKWS
LCKWSI
Time, measured from year 2000, when nonpower salvageable pieces are removed (years)
Treated Parametrically
Cost per kilowatt of power not 1.67X lo3 including delivery costs (it is assumed (See Appendix A) that the cost of SPS and mission power are equal) ($/kW)
Cost per kilogram delivered to Treated CEO from Earth ($/kg) Parametrically
Cost per kilogram of disposing of nonsalvageable mass of the demonstration satellite ($/kg)
Mass of usable demonstration satellite facilities (kg)
Cost of usable demonstration satellite facilities ($)
Small Compared to CKG
87600 KG
134x106
Cumulative average learning rate for cost of other salvagaeble pieces of the demonstration satellite (%)
90
Cumulative average learning rate for cost per kilogram delivered to CEO from Earth (%)
Cumulative average learning rate for cost per kilowatt of power not including delivery costs (%)
Cumulative average learning rate for cost per kilogram for trans- porting power subsystem from the demonstration satellire orbit to mission orbit (96)
Cumulative average learning rate for achievable power density of power system (%)
Cumulative average learning rate for cost per kilowatt for segmenting the demonstration satellite into power modules (%)
Cumulative average learning rate for cost per kilowatt for installing SPS segmented power module on mission spacecraft (%)
90
90
90
90
90
90

44
Variable Definition Nominal Value
LCKWMI
LSPSCO
Cumulative average learning rate 90 for installing non-SPS power system on mission spacecraft (%)
Cumulative average learning rate 90 for the annual cost of operating the demonstration satellite (%)
The results of the analysis are summarized in Figures 3.7 and 3.8. Figure 3.7
indicates the salvage value (present value) of the demonstration sate!lite when the I
demonstration satellite is used as a source of power for other space activities such
as GE0 platforms, manufacturing bases, OTV or space exploration vehicles. The
salvage value is shown as a function of the annual demand for space power and the
cost of earth to GE0 transportation. It can be seen that the salvage value is not
materially impacted by transportation costs but is directly related to demand
(MW/yr). At very high demand levels the salvage value can approach $150 -
170 million and at a demand level of less than 1.5 MW/yr the salvage value is zero.
It is possible that other major (nonpower) subsystems such as slip-
rings, mechanisms, transmitter subarray and switchgear and converters will be
salvageable for other space missions. Figure 3.8 illustrates the salvage value of
the SPS demonstration satellite when the power supply and several other major
subsystems are salvageable. The salvage value is shown as a function of annual
demand for power, the cost of earth-GE0 transportation and the time (relative to
2000) at which the nonpower subsystems are salvaged.* Salvage value may
approach $400 million when other subsystems are salvaged and the demand for
* It should be noted that certain of these curves terminate abruptly. For example, the curves for 20 year time delay terminate at a demand of 10 MW/yr indicating that the power subsystem would be completely segmented at the end of 20 years. It is assumed that other subsystems are not salvageable after the power supply is completely segmented.

45
0 5 10 15
OOWD. )Y/YR.
FIGURE 3.7 SALVAGE VALUE OF THE SPS DEMONSTRATION SATELLITE WHEN USED AS A SOURCE 0~ POWER FOR OTHER ACTIVITIES (GEO PLATFORMS, MANUFACTUR- ING BASE, OTV OR SPACE EXPLORATION VEHICLES) '
---- 0 - ' TIM CtLAY (YEARS FROM
0 ZODO) TO SUVKif OF DH-
0 KMER SUBSYSTEMS
0
ASSIMES USE OF SLIPRINGS. M3ANISHS. TRANSMITTER SUBARRAY AJID SYlTCHGEAR AND CONVERTERS
- - - 8M$/KG ECATH-GE0
- 701/t% TRAllSPORlATIOII COST
01 1 - . . 1 . A . . I . . . . I c
0 5 10 I5
DUIISID. WYR
FIGURE 3.8 SALVAGE VALUE OF SPS DEMONSTRATION SATELLITE WHEN USED AS A SOURCE OF POWER AND OTHER SUBSYSTEMS FOR OTHER ACTIVITIES (GEO PLATFORMS, MANUFACTURING BASE, OTV 0~ SPACE EXPLORATION VEHICLES)

46
power is high. Salvage value may approach as much as $200 million when other
subsystems are salvaged and the demand for power is low.
3.3 Power Supply for a Laser Orbit-to-Orbit Transportation System
Table 2.1 shows that whether or not the SPS program moves into an
implementation phase, there is likely to be a substantial level of LEO to CEO
traffic. A considerable fraction of this traffic will include man and logistics and
must be transported relatively quickly, thus prohibiting the use of low thrust,
electrically propelled orbit transfer vehicles. The presently planned mode for
providing LEO to CEO transportation of personnel and logistics is to use a chemical
rocket personnel orbit transfer vehicle (POTV). As Table 2.1 shows, the propellant
requirements for the chemical POTV are considerable. These propellants must be
transported from earth to LEO. The implementation of a laser space transporta-
tion system with a specific impulse of 2,000 s could reduce the propellant mass
requirements by about 72 percent.*
Assuming that propellant costs remain constant, and that the POTV capital
cost and per flight maintenance costs are approximately equal for both the
chemical and laser configurations, the principal benefit attributable to a laser
space transportation system will be derived by means of cost savings in earth to
LEO transportation of propellants. Furthermore, it is likely that the cost of
transportation from earth to LEO will depend upon whether or not the SPS program
proceeds into an implementation phase. Since transportation costs are a major
fraction of total SPS capital costs, the transportation costs are likely to be low if
forced by SPS technology development. They are likely to be significantly higher if
SPS is not implemented thus alleviating much of the need to achieve low
* Laser Rocket System Analysis, Final Report, Lockheed Missiles and Space Company, Inc., NASA CR-159521, September 1978.

47
transportation costs. At the same time, the demand placed upon a laser space
transportation system will be very much higher if the SPS program proceeds into an
implementation phase than if it does not. Thus the fact that the SPS program is
likely to result in technologies leading to reduced launch costs, and thus to reduce
benefits for a laser space transportation system, is substantially offset by the
increased traffic that implementation of the SPS would cause. Accordingly the
benefits of a laser space transportation system are evaluated using as a baseline
the LEO to CEO POTV traffic model identified in Table 2.1. Earth to LEO
transportation costs are assumed to be $70 per kg. A second case is also
considered using an earth to LEO transportation cost of $800 per kg representative
of an advanced Space Shuttle or Shuttle derivative vehicle.
To compute a salvage value for this use it is necessary to determine year-by-
year savings achieved by the laser space transportation system. To obtain a LEO
to GE0 traffic model year by year during the period 2000 to 2030, it is assumed
that the lower bound of the transportation requirements given in Table 2.1 apply to
the year 2000 and the upper bound apply to the year 2030, and that traffic growth
between these years is linear as shown in Figure 3.9. The present value of savings
obtained by this traffic model, at a 4 percent discount rate, is equal to 83.8 times
the year 2000 savings.
The present value of the demonstration satellite in this use for the baseline
case with transportation costs of $70 per kg is $1.68 billion, and at $800 per kg
transportation costs to LEO is $19.27 billion. These numbers, of course, are likely
to apply if the SPS program does not proceed into an implementation phase. If the
.SPS program proceeds into an implementation phase, the benefit from this salvage
value would be very much larger. Thus it is clear that it is desirable to devleop and
implement the laser space transportation system independent of the SPS program.

48
0 I
2000 2030
FIGURE 3.9 LEO TO GE0 TRAFFIC GROWTH
Since the laser SPS configuration is presently under consideration, it would
appear an interesting option to include a laser power transmitter on the demonstra-
tion satellite such that demonstration tests for both the microwave and laser SPS
configurations could be performed with the demonstration satellite and such that,
upon completion of these tests, the satellite could be easily converted to use as a
power supply and laser power transmitter for a laser space transportation system.
These arguments are reinforced by the fact that the benefits of a laser space
transportation system are of sufficient magnitude to warrant its development even
if an SPS demonstration satellite is not constructed.
Since the benefits of a laser space transportation system are likely to exceed
the costs of the SPS demonstration, the salvage value of the demonstration
satellite in this use is equal to the present value of a power supply for a laser space
transportation system, discounted from the initial date of operation of the laser
space transportation System to the initial operation date of the SPS demonstratjon
satellite. If this time period is very short, the salvage value of the demonstration
satellite becomes approximately equal to the cost of the demonstration program
less the cost of the microwave transmitting antenna and associated systems. These
equipments, however, could be salvaged for use on the first full-scale SPS satellite,

49
provided that the program enters an implementation phase.
3.4 Source of Space-Based Materials
A potential use of the SPS demonstration satellite is as a source of materials
conveniently located in geosynchronous orbit. In this salvage use the demon-
stration satellite would be cut up into small sections, possibly melted down and
reused as raw materials for space-based manufacturing processes. This salvage use
is considered in more detail in Section 4.6 relative to full-scale SPS satellites. It is
found that the value of the raw materials which make up the demonstration
satellite is relatively small, roughly on the order of $157 million. The fact that
these materials are located in geosynchronous orbit, however, adds an incremental
value of about $50 million (at SPS transportation costs, 50,08O$/MT), bringing their
on-orbit value up to approximately $217 million. Unfortunately not all of the
materials contained in the demonstration satellite would be salvageable. The
majoi items in question include sapphire and GaAs. These materials alone
constitute about 63 percent of the total on-orbit value. Thus if they are not
salvageable, the on-orbit value of the SPS materials decreases to about $81 million.
Even so, much of this value is made up of materials which are not likely to be
easily salvaged for use as raw materials in manufacturing processes.
Because of the relatively low value that the demonstration satellite has as a
source of raw materials in space, this is not a very desirable salvage option.
Furthermore, the return of these materials to earth for reuse would, in all
likelihood, cost substantially more than their value on earth.

50
4. FULL-SCALE SPS SATELLITE SALVAGE ALTERNATIVES
Starting in the year 2001 and continuing through the year 2030, two full-scale’
SPS satellites will become operational each year in addition to a full-scale SPS
satellite becomming operational in the year 2000. The full-scale satellite
characteristics are summarized in Tables 1.1 and 3.2. Current plans call for these
satellites remaining in operation for a period of 30 years at which time they will be
taken out of service. When this occurs it is likely that major portions of the full-
scale satellites will prove useful in other space activities. The full-scale SPS
satellites will thus have a salvage value that is related to their value when used in
other space activities. The salvage value, as measured by costs that will be
foregone because of the use of full-scale SPS satellites, will derive from the use of
the full-scale satellites:
1. In a continuing SPS program (termed “SPS reuse”)
2. As a source of power for non-SPS space activities
3. As a power supply for a laser orbit-to-orbit transportation system
4. As a power supply for laser propelled aircraft
5. As a source of power for accomplishing asteroid capture and mining
6. As a source of space-based materials.
These potential uses and the derived salvage value of the full-scale satellites are
discussed in the following paragraphs.
4.1 Salvage for SPS Reuse
The full-scale operational satellite consists of a power generation system
utilizing gallium aluminum arsenide (CaAlAs) solar cells with a concentration ratio
of two; an attitude control/station keeping system utilizing argon ion thrusters; a

51
power distribution system consisting of switchgear and converters; conductors and
insulation; structure; a microwave power transmission system including waveguides
and klystrons for converting DC to RF energy; a structure system comprised of
aluminum and graphite fiber reinforced thermal plastic and an information
management system. The components, subsystems and systems are designed such
that 5 GW of power are delivered at the utility interface. To accomplish this in an
economic manner, certain systems are designed to achieve a life of 30 years (for
example, the graphite structure), whereas other systems may achieve shorter
useful lives and must be maintained and/or replaced periodically during the 30 year
life of the full-scale satellite (for example, the klystrons will be replaced at ten
year intervals). It is obvious that such a complex system will not completely
deteriorate instantaneously at the end of 30 years but will continue to function in a
degrading fashion for some time beyond its design life. Thus certain systems may
be salvageable for use in other full-scale SPS operational satellites or a full-scale
satellite may continue to be utilized beyond its 30 year nominal life. The actual
life, including specific maintenance/replacement policies, will be determined as a
result of the overall system economics, evolving design and design philosophy, and
operational procedures all of which have been considered in insufficient detail at
this time to specifically establish which components/subsystem/system mainte-
nance/repair procedures and policies* will be accomplished and which com-
ponents/subsystems/systems will be economically salvageable.
+ It should be noted that these policies and procedures will be a function of technology and improvements in reliability. For example, if klystrons have a ten-year life, then they will be replaced twice and have little salvage value at the end of 30 years. If, however, klystrons achieve a 14-year life, the SPS satellite may have a 28-year life with one klystron replacement, or it may have a 30-year life with economically salvageable klystrons (for other SPS satellites).

52
The salvage value of reuse of components of a, full-scale SPS satellite
depends upon which specific components, subsystems and systems are available for
reuse at the end of the 30-year life of the satellite. To determine specifically
which l’piecesVV will be available requires a detailed reliability/replacement/repair
analysis which has not yet been accomplished.
In the absence of such an analysis only a rough estimate of value may be
accomplished by considering the value of extending the useful life of a full-scale
satellite. The value of extending the useful life may be established as the
difference in the present value of the cost of a series of full-scale satellites which
become operational at 30-year intervals and the present value of the cost of a
series of full-scale satellites which become operational at 30 + AT year intervals.
With a real discount rate of 4 percent, a one year (AT = 1) increase in life
corresponds to a salvage value of 2-3 percent of the satellite cost. This increases
to 17 percent of the satellite cost when AT = 10 years.
4.2 Power Supply for Non-SPS Space Activities
In the same manner that the demonstration SPS satellite was viewed as a
potential source of power (335 MW) for other space activities, so may the full-scale
satellite be considered as a potential source’ of power (9.52 CW) for other space
activities. The salvage value will depend upon the demand for power created by
other space activities. The supply of power will be incremented by up to 19 GW
per year, starting in the year 2030, and decremented by the rate of degradation of
the power supplies. Since a mission model for non-SPS activities cannot be
established for the mid-21st century, it is not reasonable to compare supply and
demand (as was done for the demonstration SPS satellite--see Section 3.2) to
establish the salvage value in terms of the demand for space power satisfied by the
SPS satelites. It is likely, however, that the supply will far exceed the demand. At

53
an annual (new capacity) demand growth of 15 MW/yr, a maximum of 450 MW will
be supplied by an SPS satellite if it lasts 30 years beyond its useful life. Since this is
but a small percentage of the.design power level of the full-scale satellite, it may
be concluded that the salvage value derived from this use will be a small
percentage of the cost of one full-scale SPS satellite.
4.3 Power Supply for a -to-Orbit Transportation System
As in the case of the demonstration satellite, an interesting potential salvage
use of full-scale SPS satellites is as a power supply for a laser orbit-to-orbit
transportation system. The economics of this use are quite similar to the
demonstration satellite case; however, the full-scale satellite provides some 30
times more power and would thus be appropriate for use with much larger and
higher payload vehicles. The benefits of this salvage use are strongly dependent
upon geocentric traffic in the post-2030 period. They could be considerable if
there are massive manned activities in space, such as large manufacturing bases,
space habitats and so on. Alternatively the benefits could be quite small if the
traffic remains relatively small. At this point in time the only traffic that would
clearly exist beyond that noted in Table 2.1 is the traffic necessary to support the
construction and maintenance of the SPS fleet. This traffic, as envisioned by
Rockwell International, would involve on the order of 150 POTV flights per year or
one every other day. This level of traffic can be supported by a power supply
which is on the order of hundreds of megawatts rather than gigawatts. The
advantage of a multi-gigawatt system would be to allow higher thrust levels,
possibly higher specific impulse and possibly to provide power for ascent from
earth-to-LEO. Unless the earth to LEO traffic becomes a major factor, or unless
it becomes desirable to station satellites to provide a capability for continuous or
unconstrained thrusting, it does not appear that this salvage use will require more

54
than one full-scale SPS satellite. Because of the speculative nature of the benefits
resulting from this salvage use, they are not quantified further.
4.4 Power Supply for Laser-Propelled Aircraft
It has been proposed by researchers at the University of Washington and
Lockheed Missiles and Space Company that space-based lasers be used to power
aircraft on transoceanic flights.* Conceptually, oceanic flights would be con-
ducted by means of conventional kerosene-powered jet engines for takeoff and
climb to altitude. Upon reaching altitude, at some point over the ocean, the
kerosene combustors would be shut down and the aircraft provided energy from a
laser beam originating in space. Energy in the laser beam would be intercepted by
a laser receiver mounted on the top of the aircraft and used as thermal energy to
power turbofan engines. Upon descent the laser power would be discontinued and
the use of kerosene resumed.
It seems reasonable to base projections of the demand for power by oceanic
aircraft on the assumption that the number of oceanic flights beyond the year 2030
is equal to the current number of oceanic flights. It is furthermore reasonable to
assume that all aircraft in the oceanic regions at that point in time will be
comparable to current ‘heavy aircraft such as the DC-10 and 747. Table 4.1
summarizes the current oceanic air traffic. There are presently about 3000
aircraft-hours spent in the oceanic sectors each day.
The power requirements of a wide-bodied aircraft are typified by the 747 and
DC- 10. The 747 burns an average of about 24,000 pounds per hour of fuel at cruise
and the DC-10 17,000 pounds per hour. These numbers correspond to power levels
of 133.6 MW thermal and 94.6 MW thermal respectively. Thus the average energy
Hertzberg, Abraham, Kenneth Sun and Wayne Jones, Laser Aircraft, Astro- nautics and Aeronautics, March 1979, pp. 41-49.

55
TABLE 4.1 CURRENT OCEANIC AIR TRAFFIC
REGION FLIG,HTS/DAY HRS/FLIGHT
NORTH ATLANTIC (NAT) 500 3.5
CENTRAL EAST PACIFIC (CEP) 120 3.5
NORTH PACIFIC (NOPAC) 60 6.0
CARRIBEAN 100 2.0
SOUTH ATLANTIC 75 2.0
SOUTH PACIFIC 10 3.0
WEST PACIFIC 25 3.5
TOTAL -3000 OCEANIC FLIGHT HOURS/DAY
consumption across the day is at the rate of about 15 GW. Assuming a peak to
average power ratio of 2, it follows that the peak energy consumption rate is about
30 GW. Further assuming an “end-to-end” efficiency (power into the jet engine
divided by power into the laser power transmission system) of 20 percent, 30 GW of
thermal energy at the aircraft requires an input of 150 GW to the laser power
transmission systems in space. Thus to service this level of traffic will require 17
or more full-scale SPS satellites, depending upon the extent to which they have
degraded at the time of salvage.
The next step is to consider the economics of this salvage use. Taking the
cost of jet fuel to be $1.00 per gallon (roughly the present price paid by oceanic
aircraft), the cost of the thermal energy derived from this fuel is 23.5 mills/kWh.
It is this number which must be compared to the cost of SPS-supplied energy.
Taking the oneration and maintenance cost for the SPS. in the salvage mode, to be
$200 million per year (note that in this salvage mode it is not necessary to continue
to refurbish the microwave power transmission system) and assuming that each

56
satellite is used at 50 percent of capacity (corresponding to a peak to average load
ratio of 21, each satellite provides roughly 40.3 X 10’kWh per year. This results in a
marginal cost of energy at the satellite bus bar of 5.0 mills/kWh. Again, using the
20 percent conversion/transmission efficiency, the cost of laser-delivered energy is
about 25.0 mills/kWh. Thus it appears that, at the present price of jet fuel, this
salvage use does not have economic benefit.
On the other hand, however, it is likely that the cost of jet fuel will continue
to inflate at a rate which is somewhat above the level of general inflation. Thus it
becomes interesting to consider the potential benefit of this salvage use at inflated
jet fuel costs. If all oceanic aircraft shown in Table 4.1 made use of laser energy
on the oceanic segment, a total 1.3 X 10¹¹ kWh of energy would be supplied each
year to these aircraft from SPS satellites. Taking an infinite horizon benefit
approach and a 4 percent discount rate, this would yield a cost saving benefit of
$3.3 billion (net present value referenced to the date at which the system is fully
operational) per mill/kWh cost savings obtained by the use of SPS power over jet
fuel. This breaks down to a benefit of $193 million per satellite.
To continue the above example, if the price of jet fuel escalates to a level of
$2 per gallon (1977 dollars), the benefit becomes $4.2 billion per satellite.
Assuming that salvage to this use would occur at the end of the satellite% nominal
30-year lifetime, the salvage value thus becomes this $4.2 billion amount
discounted back to the initial operation date of the satellite (30 years). Accord-
ingly the salvage value for this use, assuming $2 per gallon jet fuel, is $1.3 billion
per satellite.
It is interesting to note as an aside that this SPS satellite salvage use would
make use of orbital positions over the ocean as opposed to over the continents and
thus would not conflict with operational SPS satellites.

57
4.5 Asteroid Capture and Mining
It has been proposed by Brian O’Leary* that Amor and Apollo asteroids could
be captured and placed into earth orbit to provide a source of raw materials for
various space activities. Typical characteristics of Amor and Apollo asteroids are
shown in Table 4.2. The estimated population of these asteroids greater than 100
m in diameter is about 150,000. They are presently being discovered at the rate of 2
to 3 per year. The Apollo and Amor asteroids appear to be typical of ordinary and
carbonaceous chondrites and contain a number of free metals including nickle, iron,
gold, silver, platinum and so on. They are located in orbits close to that of the
earth and require only about 3 km/s velocity increment for capture.
O’Leary proposes the use of a mass driver that is capable of using asteroidial
material to provide the necessary impulse for asteroid capture. This mode of
capture would consume a significant fraction of the asteroid. Another mode, that
examined here, proposes the use of argon propellant at 10,000 s specific impulse
and the use of the SPS satellite as a power supply to effect asteroid capture. Taking
a AV of 3 km/s each way and a 100 m diameter asteroid, 1.25 million MT, the
propellant requirements are 2,300 MT outbound and 39,100 MT inbound for a total
of 41,400 MT. Using this trajectory mode, a thrust duration of somewhat in excess
of one year is required to impart the AV with the asteroid in tow.
The economics of asteroid recovery depend strongly on the materials
contained in the asteroid and the demand for these materials in space. Typical
values of iron and nickle contained in a 100 m diameter asteroid are as follows: A
10 percent yield of iron would provide 0.125 million MT with a gross value, at $210
O’Leary, Brian, Mass Driver Retrieval of Earth-Approaching Asteroids, presented at the Third Princeton/AIAA Conference on Space Manufacturing Facilities, Princeton, NJ, May 9-12, 1977.

58
TABLE 4.2 CHARATERISTICS OF ACW)R AND APOLLO ASTEROIDS ,
l . POPULATION BY DIAMETER
> loom -150.000 > 5ochn - 6,000 >lOOch 1.600~800
DISCOVERY RATE 2-3/YR NUMBER OF FJUMN APDLLO/MtR ASTEROIDS 37 (AS OF 1977)
l COMPOSITION, X (TYPICAL OF ORDINARY AND CARBONACEOUS CHONDRITES)
SILICATES 75-90 WATER O-20 FREE METALS O-20 CARBON WATERIALS o-7.5 NITROGEN o-o.3
FREE METALS INCLUDE NICKLE. IRON AND LESSER QUANTITIES OF GOLD. PLATINIB. SILVER, ETC.
l TYPlCAL AV REQUIRED FOR CAPTURE- 3Kn/SEC
l ASTEROID MWi BY DIAMETER
10&n 1.25 X lo6 MT
5oOm 150 x 105 MT
1OOOlll 1.25 X 10' MT
per MT for pig iron, of $26 million equivalent value on earth or $6.286 billion at
geosynchronous orbit. A one percent yield of nickle would yield 12,500 MT with a
gross value at $4,590 per MT of $57 million on the earth or $683 million at
geosynchronous orbit. Beyond iron and nickle the total value of an asteroid will
depend strongly on the quantities of rare materials which it contains. Sizeable
deposits of silver, gold, platinum, rhodium, osmium, etc. could drive the total value
of the asteroid up substantially. But the quantities of these materials likely to be
found in any particular asteroid are highly uncertain at the present time.
Conceivably, the value of a 100 m diameter asteroid in geosynchronous orbit could
be as high as $10 billion. However, much lower values are likely, especially due to
the fact that there would not exist an on-orbit demand for all of the metals which
the asteroid contains.

59
The value of the materials contained in an asteroid located in geosynchronous
orbit must be compared to the cost of recovering the asteroid. The cost of
providing sufficient propellants (assuming the trajectory mode stated) ‘at geosyn-
chronous orbit, is approximately $2.1 billion. It follows that the total cost of an
asteroid recovery mission would be on the order of $2.5 billion to $3 billion.
Consequently, if the net on-orbit value of the minerals recovered from the asteroid
is on the order of $7 billion to $8 billion, the net salvage value of SPS used for an
asteroid recovery mission would be on the order of $1 billion to $2 billion (after
discounting).
4.6 Source of Space-Based Materials
If no salvage uses can be found for a particular SPS satellite, its subsystems
or components, that satellite may nonetheless be salvaged as raw materials for use
in space-based manufacturing processes. Table 4.3 summarizes the materials
contained in a full-scale SPS satellite. While the total value of these materials is
approximately $4.5 billion on the earth, most of this value is contained in the
sapphire and CaAs which make up the solar array blanket. The major metals
contained in the satellite have a value on earth of only $205 million. In
geosynchronous orbit, accounting for cost of transportation, these materials would
have a value of approximately $1 billion. Thus, depending upon the demand for
their use in space, these materials could have reasonably significant salvage value.
However it is unlikely that any but very special materials such as silver could be
economically transported back to earth for terrestrial reuse.
Two satellite materials, sapphire and CaAs, which contain over 60 percent of
the total on-orbit value of SPS satellite materials, present an interesting salvage
possibility. Thus if there is a demand for them and if they can be economically
processed for reuse in space, they would be of considerable salvage value. If such

60
TABLE 4.3 VALUE OF SPS SATELLITE MATERIALS--GaAs. CR=2
MSS UNIT COST VALUE VALUE AT GEO* MATERIAL METRIC TONS (KT) f/MT $ BILLIONS $ MILLIONS
6FRTP 7.680 57.200 439 824
l STAINLESS STEEL 5.305 1.370 7 273
l COPPER 4,834 1,570 8 ,250 b SAPPHIRE 3,376 8OD.000 2.701 i.870
l ALWINIM 4,122 1.1.70 5 211
b G~AS (DEP) 1,354 700,000 948 1,016
TEFLON 1.152 6.820 8 66
'KAPTON 2,719 66,000 179 315
l SILVER 928 196,000 182 228 MERCURY 89 4,500 0 4
l TUNGSTEN 646 32.400 3 35
HISC. 1,947 98n
34.152 4.460 6,190
l EARTH-TO-GE0 TRANSPORTATION COST = 50,080 f/MT t+ TRANSPORTATION COST ONLY
0 SALVAGE OF KAJOR METALS--f205H ON EARTH, f997H AT GEO--COST TO RECOVER AND RETURN MAJOR HETALS TO EARTH-$18 ($79W FOR TRANSPORTATION ALONE)
b SAPPHIRE AND GaAs PRESENT-AN INTERESTING SALVAGE POSSIBILITY
-
]
reuse is economically viable it would probably be for the purpose of making new
solar arrays both for new SPS satellites and for other space power requirements.
4.7 Miscellaneous Salvage Uses
It is likely that there will be other potential applications of decommissioned
full-scale SPS satellites. In the mid-21st century, space industrialization will come
into its own with the need for large space stations, high power and raw materials.
It is also likely that there will be large laboratory facilities (for example, a high
energy physics laboratory) in geosynchronous orbit. It is hard to establish a value
for salvage use of SPS satellites for these activities because they do not lead to
economic activities that can be easily evaluated. For example, salvage of an SPS
satellite may make the establishment of a high energy physics laboratory in space

61
viable, but the salvage value of the SPS satellite in this use would not equal the
cost savings afforded since the availability of the SPS satellite would.enable this
mission, not merely benefit it. Accordingly estimates of salvage value for these
uses would be highly speculative and are not included here.
4.8 Continued Use
An obvious potential use of a 30 year old SPS satellite is to simply continue
to use it as an SPS satellite. Since the satellite would be fully depreciated at this
time, its continued use would provide, in essence, a salvage value. The only thing
which would prevent a satellite from obtaining salvage value from continued use
would be if there is a wearout failure mode for the satellite which occurs shortly
after it has been in use for 30 years. If, on the other hand, the satellite degrades
exponentially with time at a rate 6 then the net salvage value (net of disposal costs
at the end of its economic life) is approximately given by the following equation:
EOr %= Pi% 1
(1+/J+ a)l-f - (I+P+a)‘-T ]- CoM [ - P
(I+PP - (l+p)1-T - CD (l+p)-T 3
where EOis the beginning-of-life energy produced by the satellite per year, r is the
revenue generated in mills/kWh, t is system age when salvaged in years, COM is
the annual operation and maintenance. cost, CD, is the disposal cost and P is the
discount rate. T is the satellite age at the end of its economic life (when revenues
equal marginal operating costs):
T= ldEor/coM)
In(l+a)
For typical values of these parameters, Figure 4.1 shows the continued-use SPS
salvage value. Clearly, for degradation rates between 0 and 2 percent, this salvage
use produces a considerable salvage value at t = 30 years. It is also clear, however,

62
PV OF SALVAGE USE REFERENCED
TO IOD. $ BILLIONS
ASSUMES I 0
.5 I \ r = 50 HILLS/kWh CAPi KITY FACTOR = 0.9
I'\ BOL POWER = 5 GW C,, = $0.65 B/YR
IR
0 lo 20 30 40 50 60 70 80 go 100
SYSTEM AGE WHEN SALVAGED, YRS
FIGURE 4.1 CONTINUED USE SPS SALVAGE VALUE
that for degradation rates approaching 5 percent, the SPS system will not have an
economic lifetime of 30 years. Since Rockwell International projects the degrada-
tion rate to be on the order of 0.5 percent per year, the present value of continued
use of the SPS, referenced to the initial operation date, will be in excess of $6
billion (conditioned on the assumption that there are no sudden wearout failure
modes).
The notion of continued use can be expanded to verify estimates of salvage
value obtained by direct estimation techniques, such as those employed in the
sections above. This can be done by examining the decision to decommission an
SPS satellite. At any point in time there are essentially five options: to continue
operation of the satellite; to discontinue operation and dispose of the satellite; to
discontinue operation, dispose of the satellite and replace it with a new satellite;
to discontinue operation and salvage the satellite; or to discontinue operation,
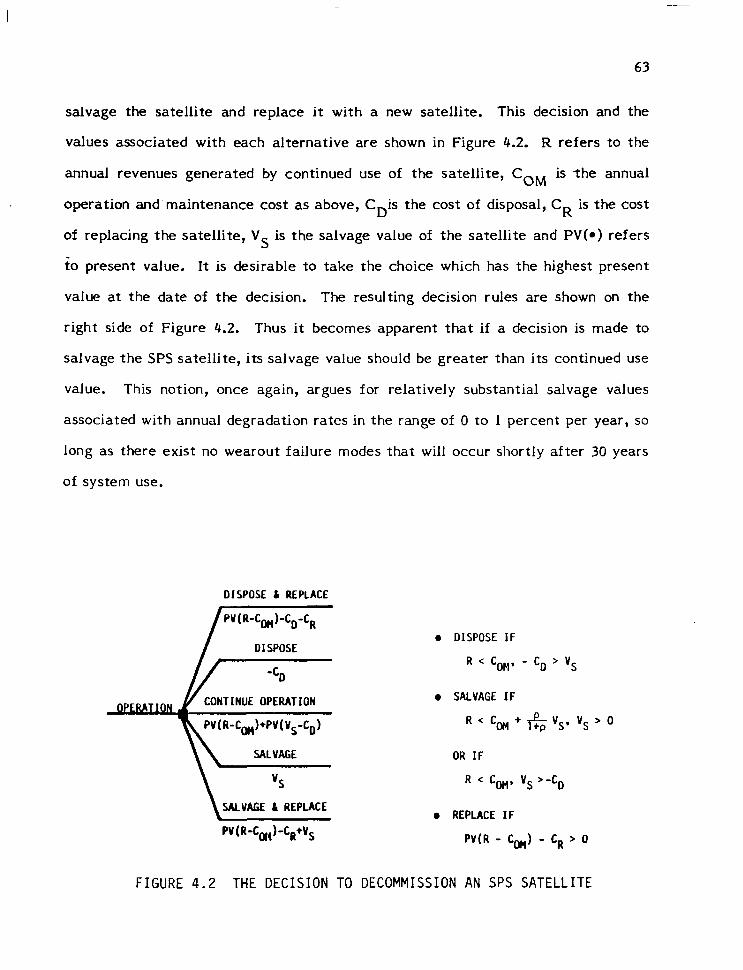
63
salvage the satellite and replace it with a new satellite. This decision and the
values associated with each alternative are shown in Figure 4.2. R refers to the
annual revenues generated by continued use of the satellite, COM is the annual
operation and’maintenance cost as above, CDis the cost of disposal, CR is the cost
of replacing the satellite, Vs is the salvage value of the satellite and PV(*) refers
to present value. It is desirable to take the choice which has the highest present
value at the date of the decision. The resulting decision rules are shown on the
right side of Figure 4.2. Thus it becomes apparent that if a decision is made to
salvage the SPS satellite, its salvage value should be greater than its continued use
value. This notion, once again, argues for relatively substantial salvage values
associated with annual degradation rates in the range of 0 to 1 percent per year, so
long as there exist no wearout failure modes that will occur shortly after 30 years
of system use.
DISPOSE L REPLACE
CONTINUE OPERATION
l DISPOSE IF
R < cow - CD > vs
l SALVAGE IF
R<C @4 + l-g VS’ vs ’ O
OR IF
R c CO,,, Vs >-CD
SALVAGE & REPUCE
PV ( R-C,-&-CR+VS l REPLACE IF
PV(R - Con) - CR > 0
FIGURE 4.2 THE DECISION TO DECOMMISSION AN SPS SATELLITE

64
5. SPS SALVAGE VALUE
5.1 SPS Demonstration Satellite Salvage Va!ue
Section 3 developed the salvage value for the demonstration satellite that
will result from its use as part of a full-scale operational SPS satellite, as a source
of power for non-SPS space activities, as a power supply for a laser orbit-to-orbit
transportation system and as a source of space-based materials. These applica-
tions of the demonstration satellite are summarized in Figure 5.1 which indicates
their relative timing and salvage value.
The laser orbit-to-orbit transportation system utilizes the demonstration
satellite as a power source for a laser space transportation system. The microwave
power transmission system is not needed in this salvage use and is thus available
for use by the first full-scale SPS satellite. The salvage value derives primarily
from cost savings in the cost of transporting chemical propellants from earth to
LEO for use in LEO to GE0 transportation of personnel and logistics. The
considerably higher specific impulse of a laser rocket permits about a 70 percent
reduction in the mass of propellant that must be transported to LEO compared to
chemical rockets. The value of the demonstration satellite .when used in this
manner is in excess of $1.7 billion.
If the demonstration program is successful, that is if it is found desirable to
continue the SPS program beyond the demonstration phase, the demonstration
satellite can be used as a component of the first full-scale SPS satellite. In this
application the demonstration satellite has a salvage value of slightly less than
$1.7 billion.

DEKMl'RAllON SATELLITE APPLICATIcmS
1. USER ORBIT-TO-ORBIT ~AW'ORTATION SYSTEM
2. m TU FULL-SCALE SPS SATELLITE
3. SOURCE OF PCAKR FOR )Ioll-SPS SPACE ACTIVITES
4. SCURCE OF SPACE-BASED MATERIALS
FUN-SCALE SATELLITE APPllCATI~S
1. LASER TRAJWORTATION 2/YEAR FOR UP TO 20 ACTIVE SATELLITES SYSTEM PLUS REPLACEMtNlS
$l.JB/SATELLlTE
2. ASTEROID CAPTURE AND MINING
A A A JlB/SATELltTE
3. POUER MD CUTERIALS ONE PER 30 YEARS
4. PNVSICS LABORATORY
- - -- - $O.lB
A A
2um ZQlO 2020
t I I
DEIW) SATELLITE
F POMR SYSTEM 6 LASER
MICRWAVE POYER TRANSMISSIOH SYSTEM USED ON FULL-SCALE SATELLITE
A < $1.10
2030 2040 2050 ml
ittt I I
. . . . . . (2 PER YEAR)............................
FULL-SCALE SPS SATELLITES
>$l.?B
A- - - - - - - . . . . . < $0.28
h - - - - - . . $0.02 - $lJ.OXl
FIGURE 5.1 SUMMARY OF DEMONSTRATION AND FULL-SCALE SATELLITE SALVAGE APPLICATIONS

66
If the demonstration program is not successful, and if it is not desirable to
use the demonstration satellite as a power source for a laser space transportation
system, it will be available as a source of power and subsystems for non-SPS space
activities or as a source of space-based raw materials. Both of these applications
of the demonstration satellite require the segmenting of the satellite and the
utilization of the segments over extended periods of time depending upon the
non-SPS space activities’ demands for power, subsystems and raw materials. When
the demonstration satellite is used as a source of power and subsystems for other
space activities, its salvage value is on the order of $0.2 billion. This value derives
from costs (both hardware and transportation) that would be foregone by the other
space activities because of the use of the demonstration. satellite subsystems.
When the demonstration satellite is used as a source of raw materials, its salvage
value is relatively small, being on the order of $0.1 billion. A large part of this
value is the result of transportation costs that may be foregone since the materials
are already in geosynchronous orbit. Clearly these salvage uses are less preferred
than the former uses.
5.2 Full-Scale SPS Satellite Salvage Value
Section 4 developed the salvage value for a full-scale..SPS satellite relative
to its date of initial operation. The salvage value was developed for continued use
of the satellites in the SPS program, as a power supply for non-SPS space.
activities, as a power supply for laser transportation (orbit-to-orbit and air-
craft) systems, as a facility for asteroid capture and mining and as a source of
space-based materials. These applications of the full-scale SPS satellites are
summarized in Figure 5.1. The salvage value of the SPS satellites for these uses
occur 50 to 80 years in the future. The uses which appear to be most attractive
include laser transportation systems, both space-to-space and for aircraft on

67
oceanic routes, as a power supply to recover Amor and Apollo asteroids and,
although not quantitatively evaluated, as a power supply for a high-energy,
high-vacuum physics laboratory in space. It is conceivable that these uses, plus
other uses such as power for space manufacturing, could provide sufficient demand
for salvage use of an entire fleet of 60 5 GW SPS satellites.
The relative timing of the salvage use of full-scale SPS satellites is indicated
in Figure 5.1. The bulk of the salvageable full-scale satellites (20) will be used for
the laser transportation system with three additional satellites used for asteroid
capture and mining, one additional satellite used for providing power and materials
for other space activities and two additional satellites used for high energy physics
laboratories. The remaining 34 satellites are disposed of at a disposal cost of $100
million ($30 million present value at the initial operation date). The salvage value
is taken at $1.3 billion for each full-scale satellite used in the laser transportation
system with this figure based upon infinite horizon discounting. It should be noted,
however, that if the satellite must be replaced periodically, the replacement
satellite does not have to be disposed of but the replaced satellite must be disposed
of instead. Thus replacement considerations do not alter the computed average
satellite salvage value. The salvage value associated with asteroid capture and
mining is taken to be $1.0 billion per satellite. The maximum possible salvage
value associated with the use of the satellite as a source of space-based materials
is on the order of $0.3 billion for the major metals (not including nonsalvageable
items such as sapphire and CaAs). Assuming that one-third of the available major
metals are actually salvaged, the salvage value is on the order of $0.1 billion.
All of the above numbers are per satellite salvage values and disposai costs,
and are referenced to the time of initial operation of each satellite. It is desired
next to combine all salvage uses and disposals to estimate the average salvage

68
value per satellite. This is accomplished by disounting the salvage value and
disposal “cash flow” stream back to the date of initial operation of the first
full-scale satellite yielding a present value of the net program salvage values. (A
component of this cash flow stream is the present value of the disposal cost, of
$0.03 billion, associated with each satellite that is not salvaged.) There are
26 full-scale satellites that are salvaged over a 30-year period in the indicated
scenario and 34 full-scale satellites that have to be disposed of. The present value
of the “sal’vage value cash flow stream” (at a 4% discount rate) is approximately
$22 billion. An equivalent annuity may be established which over the 30-year time
period (60 satellites) has the same present value as the salvage value cash flow
stream. This annuity, approximately $0.64 billion per satellite or about 6 percent
of the satellite capital cost, corresponds to the average net salvage value per
satellite. It should be noted that this value could increase substantially if salvage
uses are found for the 34 satellites that are disposed of in the scenario presented.
5.3 Programmatic Implications
There are two significant programmatic implications of positive SPS demon-
stration satellite and full-scale satellite salvage values. The first deals with the
salvage value of the demonstration satellite. Although the salvage value of the
demonstration satellite is very much smaller than the salvage value of the
full-scale SPS satellites, it is probably a more important consideration from a
programmatic standpoint. The second programmatic implication deals with the
effects of salvage value upon the cost of SPS-generated electricity and hence on
the perceived benefits that development of the SPS concept would provide.
The implications of the demonstration satellite salvage value are shown in
Figure 5.2. In advance of performing the demonstration research phase, it cannot
be known that this effort will be successful; that is, that upon completion of the

69
DEMO COHIERC IALI ZAT ION
cD BsPs
(a) PROGRAM DECISION TREE WITHOUT SALVAGE
PRE-DEMO PHASES
,'P/D
LASER TRANS. SYS.
LTS - 'P/D - cD)
(BLTS + BSPS - CP/D - CD)
PRE-DEMO DEf10 COMMERCIAL I ZAT ION PHASES + LASER TRANS. SYS.
'P/D cD BSPS' BLTS
(b) PROGRAM DECISION TREE WITH SALVAGE
FIGURE 5.2 PROGRAMMATIC IMPLICATION OF DEMONSTRATION SATELLITE SALVAGE VALUE
demonstration phase it will be decided to commercialize or implement the SPS
technology. Thus two options may be considered to exist upon completion of the
demonstration phase. These are termination of the SPS program and commerciali-
zation or continuation of the SPS program into an implementation phase. The
consequences of a termination or stop decision would be that the costs sunk in the
SPS program, Cp,l, and Cl, in Figure 5.2, would be lost and the beneifts of
commerialization, B sps, would not be realized. It is only through’the commerciali-
zation phase that the SPS development costs would in any way be recovered
(Figure 5.2(a)).
On the other hand if the demonstration satellite can be salvaged say, for
example, for use as a power supply for a laser space transportation system, this
salvage use provides a benefit, BLTS in Figure 5.2(b), that directly offsets the SPS

70
development costs, even in the event that the SPS program does not continue into
an implementation phase. This effect becomes very dramatic when one reaches
the decision to proceed with the demonstration phase. At this point the net cost of
the demonstration is CT., - BLTS rather than CD. The difference which the term
BLTS makes in the decision to pursue the SPS concept through the demonstration
phase is profound indeed, especially as the magnitude of BLTS is on the order of
80 percent of the magnitude of CD.
Finally, the salvage value of full-scale SPS satellites can have a strong
impact on the perceived benefits of development of the SPS concept. For example,
assume that without salvage the levelized cost of power from an SPS is
50 mills/kWh. Assume also that the cost of power from alternative energy sources
is 55 mills/kWh. One would then perceive that a cost savings benefit to society
would obtain from the use of SPS-generated energy versus alternative sources with
a magnitude of 5 mills/kWh.
If, however, the SPS has a salvage value equal to 10 percent of its capital
cost, this salvage value will reduce the levelized generation costs for the SPS
system by about 5 percent, resulting in a net 50 percent increase in the perceived
benefit of the SPS. Although it may not be prudent from the point of view of a
regulated utility to reduce its energy rates in accordance with the expected
salvage value for SPS, incorporation of this value in the federal government’s
planning process is entirely appropriate.

71
6. SPS DISPOSAL
The principal articles considered for disposal in this study include the SPS
demonstration satellite and full-scale satellites. These satellites may be disposed
of either intact or in varying states of disassembly depending upon the extent to
which they are salvaged prior to disposal. The demonstration satellite or sections
of it, if any, will require disposal somewhere in the time period 2000 to 2030.
Unsalvaged full-scale SPS satellites will require disposal beyond the year 2030.
It is important to consider disposal of SPS satellites upon completion of their
useful life and salvage for further use due to the fact that the geosynchronous orbit
is a limited natural resource and must be conserved for important uses. It is
prudent in consideration of SPS life cycle costs to acknowledge costs associated
with satellite disposal and consider them as a part of the capital investment in the
SPS system. Although SPS differs from many electric energy systems in that there
appear to be a number of relatively valuable salvage uses, once it has reached the
end of its useful life there is little doubt that at least some of the SPS hardware
will require disposal. Placing a value on SPS disposal costs is in essence a
matter of placing a lower bound on net salvage value. The data presented in this
section should be interpreted accordingly.
6.1 Disposal Alternatives
Unlike terrestrial power plants where disposal infers physical disassembly of
the plant, structures and equipment and recovery of land for alternative uses,
disposal of SPS satellites may infer simple removal of those satellites from
geosynchronous orbit to another orbit or location in space where they will not
interfere with other space activities. A number of interesting possibilities exist.

72
First, however, it is worth noting that not all disposal options are clearly
distinguishable from salvage. For example, it may be desirable to collect SPS
satellites that have reached the end of their useful life at a repository location in
geosynchronous or bit. This location might be co-located with a manufacturing
base that, over an extended period of time, would make use of the SPS material.
Disposal of SPS satellites to a common geosynchronous location is a trivial matter
requiring only a few m/s of velocity increment and which could be accomplished
over a period of one to a few months at very little cost. This disposal option has
been discussed in part in Section 4.6 and is not considered further here. The major
disposal options considered here include those shown in Table 1.3; L4 or L5,
supra-CEO, moon, heliocentric orbit and earth reentry.
The L4 or Lg disposal option is illustrated in Figure 6.1. There exists in a two
body gravitational system five points at which gravitational forces and accelera-
tions cancel each other such that an object placed at these positions remains
stationary with respect to both of the major bodies. The five points are referred to
as libration or Lagrangian points. Points LL, L2 and L3 are unstable in the sense
that if the body placed there is subjected to a small perturbation from the precise
position of the Lagrangian point, it will drift away or assume an orbit which
diverges from the Lagrangian point. Points L4 and L5, sometimes referred to as
the equilatoral Lagrangian points, however, are stable. That is to say if an object
is placed near these points, it will tend to orbit stably around the Lagrangian point,
at least for extremely long periods of time. Thus if SPS satellites were disposed
of in these locations, one could expect that they would remain there unattended,
essentially forever. The only qualification to this mode of disposal would be that it
might become desirable to lash together all of the satellites located at each of
these points in order to keep them from bumping violently into each other. Since
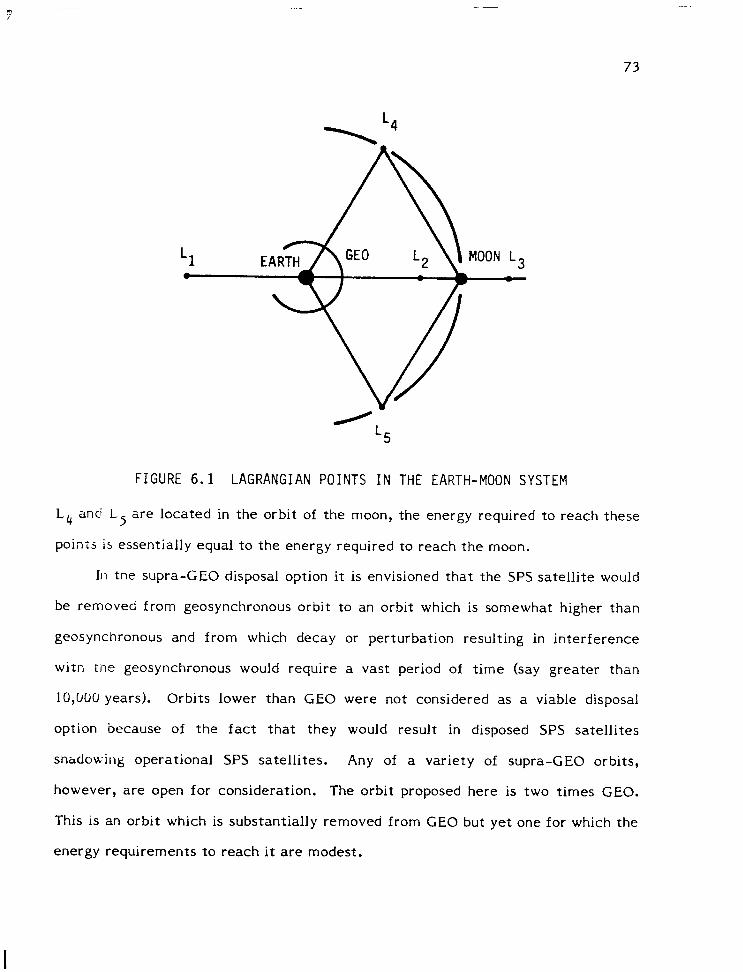
73
FIGURE 6.1 LAGRANGIAN POINTS IN THE EARTH-MOON SYSTEM
L4 and L 5 are located in the orbit of the moon, the energy required to reach these
point is essentially equal to the energy required to reach the moon.
In tne supraGE disposal option it is envisioned that the SPS satellite would
be removed from geosynchronous orbit to an orbit which is somewhat higher than
geosynchronous and from which decay or perturbation resulting in interference
witn tile geosynchronous would require a vast period of time (say greater than
10,WO years). Orbits lower than GE0 were not considered as a viable disposal
option because of the fact that they would result in disposed SPS satellites
snadowillg operational SPS satellites. Any of a variety of supra-CEO orbits,
however, are open for consideration. The orbit proposed here is two times CEO.
This is an orbit which is substantially removed from CEO but yet one for which the
energy requirements to reach it are modest.

74
The third option is considered as a means for removing the SPS satellite
permanently from space. In this option the satellite is impacted on the lunar
surface. Naturally any such impact would have to be carefully coordinated with
lunar activities at the time of impact. Although it might be possible to recover
some of the SPS materials after impact, this is not accepted as a realistic benefit
of this mode of disposal at this time.
The fourth disposal option considered is removal of SPS satellites to a
heliocentric orbit such as 0.8 AU. This option removes the SPS satellites
sufficiently far from the earth that they are effectively gone forever. The energy
requirement for this mode of disposal is, of course, dependent upon the heliocentric
orbit into which the satellite is placed.
The final disposal option considered is earth reentry. This disposal option
arouses some amount of interest because of the possibility of recovering some SPS
materials for reuse on earth if the reentry can be sufficiently wellcontrolled.
Unfortunately, however, this mode of disposal not only requires the highest energy
increment and is, thus, the most expensive disposal option, it probably is not
acceptable due to environmental and risk considerations, especially in light of the
absurd extent to which the Skylab reentry risks were escalated in the media.
Within each of the above disposal options there exists several suboptions.
The principal suboptions include the trajectory mode and thrust level for the
disposal mission. It is envisioned that the disposal would occur using argon
thrusters at a 10,000 s specific impulse. Disposal could be by means of the last
flight of a COTV. The COTV could use its own power supply or it could be
augmented by power provided from the SPS satellite. In the event that it uses its
own power, the SPS satellite could be disposed of in varying states of salvage
incuding one in which essentially all of the solar arrays have been removed. In the

75
event that the satellites are disposed intact, power from the SPS satellite can be
used and propellant tankage, controls and thrusters from the COTV could be placed
on the SPS satellite to provide the necessary thrust and control. In this mode it ii
likely that one would choose to use equipment that was essentially at the end of its
useful life and was salvaged from a COTV.
The Rockwell International cargo orbit transfer vehicle is referred to in their
study* as an electric orbit transfer vehicle (EOTV), Figure 6.2. It has a dry mass of
1,000 MT and carries 670 MT of propellant. This amount of propellant is sufficient
to impart a velocity increment of 1.9 km/s to the SPS satellite. Thus, for the
higher energy disposal option, additional propellant tankage will be required. The
Rockwell International EOTV configuration includes 144 thrusters of which 20 per-
cent are spares. The present specification on these thrusters is a lifetime of
8,000 hours. This is not sufficient to complete a disposal mission that requires
more than 333 days of thrusting time. Thus, for some dispsal options, longer
lifetime thrusters or additional spares may be necessary. An alternative to the use
of the EOTV thrusters is the use of the attitude control and stationkeeping
thrusters of the SPS satellite. Sixteen thrusters are located on each corner of the
SPS satellite making a total of 64 thrusters. These thrusters provide a total thrust
of 832 newtons at a specific impulse of 13,000 s. Combined, these thrusters can
impart an acceleration of about 23 x 10 -6 2 m/s to the SPS satellite. At this
acceleration it requires 503 days to obtain a velocity increment of 1 km/s. At this
rate it would require several years to dispose of an SPS satellite by means of the
disposal options presented. However, with augmentation from the EOTV thrusters,
this period of time is dramatically reduced.
*Satellite Power Systems (SPS) Concept Definition Study, Final Report, Vol. I, Executive Summary, Rockwell International Report No. SSD-79-0010- 1, March 1979.

76
carv~Wvrt.-ldK0 ,,..‘wnw.-WXldno PAVLOMWL-S.YXIdUi
1 h2. 1 II
*
FIGURE 6.2 EOTV CONFIGURATION
The use of very low thrusts also raises an issue as to specifically which
trajectory mode should be used. Due to the very low thrust levels and long
thrusting periods required of electrically propelled vehicles, the trajectory mode
selected for their use generally entails continuous thrusting in geosynchronous
space, resulting in spiral trajectories as those shown in Figure 6.3(a). The velocity
increment for such a trajectory is approximately twice that of the optimal, high
thrust or impulsive trajectory mode. By lengthening the mission timing, however,
as shown in Figure 6.3(b), thrusting only in the vicinity of periapse and apoapse of
the transfer orbit, it is possible to devise trajectory modes where the velocity
increments required of a low thrust vehicle approach that of the optimal high
thrust transfer. Thus one cannot choose a specific velocity increment for the
disposal options presented here as these require further analysis and cost optimiza-

77
THRUST ARC (NO COAST)
(a) CONTINUOUS THRUST SPIRAL TRAJECTORY MODE
COAST ARC
\\I i \ \-&
THRUST ARC-
(b) INTERMITTENT THRUST, QUASI IMPULSIVE TRAJECTORY MODE
FIGURE 6.3 ALTERNATIVE TRAJECTORY MODES

78
tion. The numbers chosen were conservatively selected at two times the velocity
increment required for an impulsive transfer. Thus the velocity increment or AV
numbers shown in Table 1.3, and subsequently the propellant requirements to
provide those velocity increments, are probably somewhat higher than the amounts
which will be ultimately decided upon. However, this overestimate in cost will be
somewhat offset by the increase in mission operations cost due to the lengthened
disposal mission time resulting from the cost optimization of the trajectory mode.
6.2 Disposal Costs
There are four principal elements of dispoal costs:
1. The cost of modifications to the SPS satellite to ready it for the disposal mission. These costs include added thrusters, propellant tankage, controls and so on. Depending upon the state of salvage of the satellite, some structural modifications for adaptation of an EOTV may be necessary.
2. The cost of propellants.
3. The cost of transporting propellants to the SPS satellite in geosyn- chronous orbit.
4. The cost of mission operations.
Assuming argon to be the propellant and a specific impulse of 10,000 s,
342 MT of propellant is required for each km/s of velocity increment imparted to a
full-scale SPS satellite. The cost of argon is presently $240 per MT thus resulting
in a cost of propellant of $81,960 per km/s of velocity increment imparted to the
satellite.
Taking the cost of cargo transportation from earth to CEO to be $50,080 per
MT, the cost of transporting propellants to the SPS satellite in GE0 is $17,102,000
per km/s of velocity increment imparted to the satellite.
The cost of modifications to the SPS satellite in preparation for the disposal
mission is obviously somewhat variable. A reasonable estimate for this cost can be

79
obtained from the assumption that the entire EOTV vehicle is used on its last or
20th flight to carry out disposal missions. Thus taking one twentieth of the cost of
an EOTV, $690 million, an estimate of $34.5 million is obtained for satellite
modifications.
The final cost, that of mission operations, is a time dependent cost. It is
assumed here that the mission operations costs for the disposal mission are equal to
mission operations costs for EOTV flights. This amount is $4.8 million per year.
Using the EOTV thruster packs, it requires about 62 days to impart a velocity
increment of 1 km/s to the SPS satellite. Thus the mission operations costs,
assuming continuous thrust operation, amount to about $818,000 per kilometer per
second of velocity increment.
Combining the above costs leads to a velocity-dependent cost estimating
relationship for SPS disposal cost as follows:
Disposal cost = $(34.5 + 18.0 AV) million.
This cost is given in 1977 dollars, comparable to the SPS cost estimates. It is the
cost presented in Table 1.3. In order to compare these costs to the satellite capital
investment cost, they must be discounted back to the initial operation date of the
satellite. This discount factor is (1 + P) -L where is the discount rate and L is the
satellite lifetime. Taking P = 0.04 and L = 30 years, (1 + P)-~ = 0.308. Thus the
present value of disposal costs referenced to the initial operation date of the
satellite are on the order of $30 million or 0.3 percent of the capital cost of the
satellite.

80
APPENDIX A
Supporting Data for Value of the Demonstration Satellite Used as a Power Source for Other Activities
A.1 Cost of Segmenting the DemonstrationSatellite-CKWS
The SPS demonstration satellite is constructed at LEO and then flown up to
CEO. The construction requires 120 men in orbit for 15 months with 5-6 months
required for blanket construction. Crews are changed every three months. It is
thus necessary to transport 600 men to accomplish the construction.
It is assumed that the major cost associated with segmenting the demonstra-
tion satellite is the transportation cost (Earth-CEO-Earth) for men and supplies.
It is further assumed that the segmenting can be accomplished at CEO without
transporting the construction facilities from LEO to CEO. The efficiency of
segmentation will depend upon the size of the components/subsystems/systems that
are salvaged. Since the solar blanket will be constructed in about six months it is
assumed that a total of 240 man-trips will be required to segment the power
supply. Therefore:
CKWS &Transportation cost for 240 men plus supplies 335,000 KW
Trans. Cost = Cost from Earth to LEO + Cost from LEO to GE0
0 Unit Cost of POTV = 63 X 106$
0 Design Life of POTV = 300 flights
0 Cost per POTV Flight = .09 X 106$
0 No. of People/POTV Flight.= 48
0 Number of HLLV Flights/POTV Flight = 3
0 Unit Cost of HLLV = 611 X 106$
0 Design Life of HLLV = 300 flights

I -
81
0 Cost per HLLV Flight = 1.25 X 10⁶$
0 HLLV Load Factor = .9 I 81900 kg
0 HLLV Payload (to LEO) = 91000 kg
CKWS I I[
Unit Cost of POTV ----r- Design Life of POTV + POTV Cost/flight 1 X 4~~~ne;lt
Unit Cost of HLLV + Design Life of HLLV + HLLV Cost/flight X wt X
I 1 no. of HLVV Flights/POTV Flight
-I[ 1. 63X lo6 300
CKWS I’ 152$/kW
A.2 Cost of Installing Segmented Demonstration Satellite Power-CKWSI
It is assumed that since the installation will probably be accomplished at the
time of segmentation that this cost may be somewhat less than the segmentation
cost. It is assumed (more or less arbitrarily) that the installation cost is on the
order of 20 percent of the segmentation cost.
CKWSI : 30$/kW
A.3 Jnitial M-ass of Demonstration Satellite (Just Prior to Start of Salvage)- ~NMASS
Extrapolated from the data presented in the Rockwell Report SPS Concept
Def. Study, Vol. VII, March 1979, the initial mass of the demonstration satellite is
obtained as indicated in Table 3.2 and summarized below:
Solar Array .464X 106kg
Antenna .683X 106kg
Array/Antenna Interfaces .147X106k_g
Subtotal 1.294X 10⁶kg
Contingency (25%) 0.324X 10⁶kg
Total 1.618X10⁶kg
INMASS = 1.618X 10⁶kg.

82
A.4 Achievable Power Density of Power Systems-KGKW
From Table 3.1-2 Rockwell Report, SPS Concept Def. Study, Vol. VII, March
1979.
Solar Cell and blanket & reflector mass = 7.855X10⁶kg
Array output to Distribution Bus (EOL) = 9520 MW.
KGKW = 7*855X106kg = .825 kg/kU/ 9.520X 10⁶kW
A.5 Cost)-CKW
From Table B-5 Rockwell Report, SPS Concept Def. Study, Vol. VII, March
1979.
1.1.9.1.1 Primary Structure
1.1.9.1.2 Secondary Structure 335
(69.5X 9520)
1.1.9.1.3 Concentrator
1.1.9.1.4 Solar Blanket
1.1.9.1.5 Switchgear h Converters
1.1.9.1.6 Conductors & Insulation
1.5x 10⁶$
2.4X 10⁶$
2.8X 10⁶$
60.3X 10⁶$
1.7x10⁶$
1.4x 10⁶$
1.1.9.1.7 ACS Hardware
(72.5X G )
1.1.9.1.8 Sliprings 335
(27-6X 9520 )
2.6X 10⁶$
1.0x 10⁶$
1.1.9.1.9 Primary Structure- Interface
1.1.9.1.10 Secondary Structure- Interface
.
.
1.1.9.1.23 .5x 106$
558.6X 10⁶$

83
CKW 5 - = l.&'X103$/kW 335kWX103