school of accounting seminar series - unsw business …€¦ · · 2014-04-29school of accounting...
TRANSCRIPT

School of Accounting Seminar Series Semester 2, 2013
Field evidence on auditors’ and investors’ views on audit quality
Brant Christensen
Texas A&M University
Date: Friday 25th October 2013
Time: 3.00pm – 4.30pm
Venue: ASB 216
Australian School of Business School of Accounting

Field Evidence on Auditors’ and Investors’ Views on Audit Quality
Brant E. Christensen
Mays Business School
Texas A&M University
Steven M. Glover
School of Accountancy
Brigham Young University
Thomas C. Omer
School of Accountancy
University of Nebraska-Lincoln
Marjorie K. Shelley
School of Accountancy
University of Nebraska-Lincoln
October 2013
Acknowledgements: We thank the six participating audit firms and the Center for Audit Quality’s
Research Advisory Board for helping refine our study materials and for funding this project. We
also thank Tara Voskamp for assistance in identifying investor participants. We are grateful for
helpful comments from Brian Fitzgerald, James Flagg, Andrew McMartin, Stevie Neuman, Nate
Sharp, Kecia Smith, Frances Tice, Chris Wolfe, and workshop participants at Texas A&M
University and the 2013 Texas A&M FDS Conference. Brant Christensen acknowledges funding
from the Deloitte Foundation, Steven Glover acknowledges funding from the Driggs Endowed
Professorship in Accounting, and Thomas Omer acknowledges funding from the Delmar
Lienemann Sr. Chair of Accounting at the University of Nebraska-Lincoln. The views expressed
in this article and its content are those of the authors alone and not those of the Center for Audit
Quality or the participating firms.

Field Evidence on Auditors’ and Investors’ Views on Audit Quality
Abstract: We obtain and analyze responses from audit partners, senior managers, and investors
on their views, definitions, and potential measures of audit quality. We find important similarities
and differences with respect to how the two stakeholder groups define audit quality, how they view
the factors that contribute to or detract from audit quality, and how they suggest users can identify
low audit quality using publicly available information. Key findings include: support for some
commonly used measures of audit quality in archival research; differences in the definition of audit
quality between audit professionals (GAAS compliance) and investors (individual auditor
competence); agreement among stakeholder groups that audit team characteristics are among the
most important determinants of audit quality; different views on the importance of audit
committees between audit professionals (increases audit quality) and investors (has no effect);
different views among stakeholder groups on the association between PCAOB inspections and
audit firm quality; agreement among stakeholder groups that high estimation uncertainty threatens
audit quality; and agreement that although not a perfect signal, restatements may be the best
publicly available signal of low audit quality. We employ factor analysis to organize our findings
into discrete key indicators of audit quality.
Keywords: Audit quality, audit quality indicators, PCAOB inspections, estimation uncertainty
Data Availability: Contact the authors.

1
I. INTRODUCTION
Auditing standards require auditors to plan and perform audits to obtain reasonable
assurance about whether or not the financial statements are free of material misstatements and to
express an opinion about the accuracy of the financial statements (PCAOB 2010a).1 The degree
to which financial statement users can rely on an audit opinion depends on the quality of the
audit performed. Despite the importance of audit quality to the stability of the capital markets,
and the large body of research investigating the topic, regulators, investors, and researchers
continue to debate the definition, composition, and measurement of audit quality (Francis 2011;
Knechel et al. 2013). Furthermore, projects seeking to define, measure, and evaluate audit quality
are on the agendas of the International Auditing and Assurance Standards Board (IAASB 2013),
the U.S. Department of the Treasury (2008), the Public Company Accounting Oversight Board
(PCAOB 2012a, 2013), and the Center for Audit Quality (CAQ 2012, 2013), as well as audit
firms themselves (KPMG 2011). In a recent speech, PCAOB board member Jeanette Franzel
listed the task of assessing and tracking audit quality as the Board’s first priority (Franzel 2013).
Given the increased interest in audit quality, this study seeks the insights into audit quality of two
key stakeholders in the financial reporting process: auditors and investors.2
The PCAOB provides information regarding the quality of the audit process through the
release of Parts 1 and 2 of its inspection reports, as well as instructions to audit committee
members regarding discussion of these reports with the auditor (PCAOB 2012b). In order to
create a well-rounded view of audit quality, it is critical to obtain input from the auditors who
1 The PCAOB has defined “reasonable assurance” as “high” assurance (PCAOB 2004a). 2 We use the term “auditors or “audit professionals” throughout the paper to describe both partner and senior
manager participants; over 80 percent of our survey responses are from partners. Untabulated analysis indicates that
the two groups’ responses are not statistically different (p > 0.10 in all comparisons). Further, we use the term
“investors” throughout the paper to describe our investor participants. While these participants are not professional
investors, their educational background and reported investing experience suggests they are experienced and
knowledgeable investors. See Section III for additional details.

2
attest to, and investors who rely on, the financial reports directly affected by audit quality. We
use a survey to obtain audit professionals’ and investors’ insights into audit quality by asking
participants to define and measure audit quality; evaluate the association with audit quality of
various engagement-, team-, and entity-specific characteristics; evaluate the association between
PCAOB inspection findings and the quality of the audit firm as a whole; assess the impact of
estimation uncertainty on perceived audit quality; and identify publicly available signals of low
audit quality. Prior archival studies use a variety of proxies for audit quality, including client
restatements, audit fees, going concern opinions, lawsuits filed against auditors, client
bankruptcies, level of abnormal accruals, and SEC enforcement actions (e.g., Carcello and Nagy
2004; Francis et al. 1999; Francis and Michas 2012; Lambert et al. 2011; Lennox 1999; Palmrose
1998; Stanley and DeZoort 2007). Further, the PCAOB has initiated its own project to define and
measure audit quality (PCAOB 2013). Our results seek to inform efforts to define and measure
audit quality by providing evidence on audit professionals’ and investors’ perceptions,
definitions, and measurements of audit quality.
Surveys serve a critical role in understanding and gaining insight into theoretical
constructs that are often unobservable and, when studied archivally, subject to measurement
error and omitted correlated variables biases (Dichev et al. 2013; Nelson et al. 2002). Auditors
have been surveyed on topics such as earnings management (Nelson et al. 2002), the effect of
auditor behavior on audit quality (Herrbach 2001), the effect of budget time-pressure on audit
quality (Coram et al. 2003), in-person versus electronic review (Agoglia et al. 2010), and auditor
identification of fraud risks (Graham and Bedard 2003), but research on the definition and
determinants of audit quality is more limited. Previous studies used surveys of auditors (e.g.,
Carcello et al. 1992; Schroeder et al. 1986), financial statement users, and preparers to rank
3
various audit characteristics (e.g., industry specialization, auditor independence, provision of
non-audit services, etc.) with respect to their importance in determining audit quality. Similarly,
Duff (2004) conducted a survey of U.K. auditors, finance directors, and fund managers to rank
the importance of characteristics identified in the audit quality literature as determinants of audit
quality. However, none of the studies solicited auditors’ opinions on audit quality beyond the
pre-determined characteristics presented in the survey, and previous surveys were conducted
before the Sarbanes-Oxley Act of 2002 (SOX) and the creation of the PCAOB, which
fundamentally changed the audit industry. This study examines audit quality in the current
regulatory and inspection environment.
In addition to professional auditors’ views of audit quality, prior research has
documented an “expectations gap” between what auditors and investors expect of the audit
function (Church et al. 2008; Maijoor et al. 2002; Mock et al. 2012). Because the PCAOB has
initiated a discussion that is likely to influence expectations about audit quality and because an
expectations gap may lead to differing views on audit quality, our study compares responses
between audit professionals and investors, extending the current literature on audit quality.
Gathering and analyzing audit professionals’ and investors’ opinions about the factors that
compose audit quality, along with in-depth interviews with audit partners, contributes to the
public debate on audit quality and may help regulators, standard setters, practitioners, and
researchers develop common understanding and measures of audit quality.
We present five categories of response analyses. The first category is the definition and
measurement of audit quality; the second category relates to the association between various
audit engagement-, team-, and entity-specific characteristics and audit quality. Our third and
fourth categories relate to the association between PCAOB inspection findings and the quality of

4
the audit firm as a whole and to the effect of estimation uncertainty on audit quality. Our final
category relates to publicly available signals of lower audit quality.
We find that audit professionals define audit quality primarily in terms of compliance
with professional standards, whereas investors rely more on the individual characteristics of the
auditors and audit teams who perform the audit. Other definitions of audit quality mentioned by
participants include an audit that results in financial statements consisting of accurate, reliable
information that the investing public can rely upon as evidenced by hindsight; a well-planned
engagement that addresses the significant risks of the company; and an engagement performed
by independent, skeptical auditors. In terms of engagement-specific characteristics of audit
quality, we find that both audit professionals and investors perceive characteristics of the audit
opinion, outcomes from the review process and the payment of reasonable audit fees as pertinent
to determining audit quality. When examining characteristics at the engagement team level, we
find almost unanimous agreement that individual auditor characteristics impact audit quality.
Additionally, we find evidence that input from parties outside the core engagement team such as
the national office and engagement review partners is an important component of audit quality.
We also find evidence that client-specific characteristics such as restatements, SEC enforcement
actions, and the frequency of committee meetings are significant attributes of audit quality. A
factor analysis of these characteristics and their associations with audit quality identified nine
(six) distinct factors of audit quality based on responses from audit professionals (investors) that
may prove useful for identifying the underlying dimensions of audit quality.
We also find evidence of a negative impact on audit quality of estimation uncertainty and
of an unintended interpretation of PCAOB inspection reports. Finally, we find evidence that
auditors and investors view financial statement restatements as one of the strongest publicly

5
available indicators of low audit quality. We believe the insights reported from audit
professionals and investors add to the public discussion of audit quality and highlight the
similarities and differences between professional auditors’ and investors’ views and expectations
of financial statement audit quality.
The remainder of this paper is organized as follows. Section II discusses the survey
instrument design and the data collection process, and Section III describes our survey
participants. Sections IV through VII discuss our audit quality findings, Section VIII discusses
supplemental analyses, and Section IX concludes.
II. RESEARCH DESIGN AND DATA COLLECTION
Research Questions
Standard setters, regulators, and academics are currently undertaking efforts to define,
measure, and evaluate audit quality. The eventual definition and measurement of audit quality
could influence decisions made by regulators, standard setters, audit firms and investors. The
PCAOB’s efforts to define audit quality may change both auditors’ and investors’ views of audit
quality as well as the differences in their perceptions of audit quality that were observed prior to
SOX and the formation of the PCAOB (Church et al. 2008; Maijoor et al. 2002; Mock et al.
2012). Therefore, our study compares responses between these two key stakeholders—audit
professionals and investors—in the current regulatory climate, extending the current literature on
audit quality and informing the discussion regarding the definition and measurement of audit
quality. Specifically, auditors and investors responses address the following five research
questions:
RQ 1) What is the definition of audit quality, and how can it be measured?
RQ 2) What factors contribute to or detract from audit quality?

6
RQ 3) What is the association between findings in PCAOB inspection reports and firm-
wide quality?
RQ 4) How does estimation uncertainty in reported values impact audit quality?
RQ 5) What publicly available information signals lower audit quality?
To address these research questions, auditors (investors) responded to 29 (23) queries
regarding audit quality.3
Survey Design
Feedback on the survey design and valuable insights into different perspectives on audit
quality were provided by senior members of the participating firms and the CAQ’s Research
Advisory Board improved the clarity of the survey questions. The survey instrument was pilot
tested by the participating firms and subsequently revised. The final version of the survey was
then distributed to the participating firms.
Due to differences between audit professionals’ and investors’ professional experience,
understanding, and exposure to the terminology and concepts associated with financial statement
audits, some of the language in the survey had to be tailored to each group. For example, while
audit professionals clearly understand terms such as going concern, engagement team structure,
and the PCAOB inspection reports and processes, slight re-wording of a few questions was
necessary to clarify those concepts for investor participants. To ensure that responses from the
participant groups could be meaningfully compared, care was taken to keep the fundamental
3 The length of our survey is equal to, or shorter than, other contemporaneous surveys (e.g., Dichev et al. 2013;
Nelson et al. 2002). We also note that the order of the questions presented to participants was not randomized. This
was done primarily because questions were presented in meaningful orders and topical groupings that were
generally confirmed using factor analysis. While order effects cannot be ruled out, participants’ responses to scale-
based questions are generally consistent with open-ended questions (e.g., lack of restatements is positively
associated with audit quality in question 6.2, and open-ended responses in Table 9 indicate that the presence of
restatements is an indicator of lower quality), thus indicating that the order of question presentation did not drive
results.
7
meaning of the revised questions the same between groups.4 We also did not ask investors
questions that were specific to the audit process itself (e.g., timeliness of audit planning). The
investor version of the survey was distributed to a small pilot sample of investors for feedback
and revised accordingly before final distribution.
Data Collection
The CAQ’s Research Advisory Board coordinated with the six participating audit firms
(including all four Big 4 firms) to identify auditor participants. The only restriction we placed on
participants was that they have experience servicing public company clients subject to PCAOB
inspection. Upon identification of potential auditor participants, the survey was provided to the
firms by the CAQ. Most firms used the web-based survey administered by Qualtrics.com; the
alternative administration was paper-based. Of the 109 auditor participants who started the
survey, we received usable responses from 93, for a completion rate of 85 percent.5
Investor participants are knowledgeable, nonprofessional investors. To restrict the
participant pool to individuals with a fundamental understanding of financial statements, we
required that all participants have a business degree from a large U.S. university.6 To increase the
likelihood that participants had the necessary financial capital to make investment decisions on
their own behalf, we required that participants be at least ten years beyond graduation. By setting
these restrictions, we believe we identified a pool of participants with the knowledge, ability and
experience to make reasonable decisions as investors. In coordination with the University’s
Alumni Association, a randomly selected subset of alumni from the pool, described above, were
4 For example, whereas the audit professionals were asked about the association between audit quality and “the
entity being audited by a large U.S. audit firm with a strong global network,” investors were asked about “the audit
being performed by a large U.S. audit firm with a strong global network.” 5 Completion rate of individual firms ranged from a low of 70% (one firm) to 100% (three firms). 6 As detailed in Table 2, many participants did not stop their education with an undergraduate degree. As such, many
participants received various additional degrees.

8
sent e-mail invitations to participate in the web-based survey administered by Qualtrics.com. The
University’s Alumni Association sent two reminder e-mails after the initial mailing. Of the 243
participants who initiated the survey, we obtained usable responses from 102, for a completion
rate of approximately 42 percent.7
Follow-Up Interviews
To add additional insight into partners’ perceptions of audit quality and to obtain
reactions to the survey findings, we performed follow-up interviews with six audit partners from
the participating firms. Our interview protocol consisted of seven questions that would elicit
partners’ reactions to our survey results. The protocol was reviewed by the CAQ, after which
phone interviews were organized with the partners. Quotes from the interviews were transcribed
by the authors and then verified with the interviewee for accuracy. We note that individual
quotes do not necessarily represent the opinion of the Center for Audit Quality, its Research
Advisory Board, or the participating audit firms.
III. PARTICIPANTS
Audit Professionals
Descriptive statistics for our auditor sample are detailed in Table 1.8 Seventy-three
partners and 17 senior managers completed the survey. On average, partners and senior
managers had held their current title for just over 11 and 3 years and had worked in public
accounting for over 23 and 11 years, respectively.
<insert Table 1 here>
7 For both auditors and investors, we included any responses in which the participant had responded to at least half
of the survey questions. Of the 93 auditor responses used, 90 completed the entire survey (97%). Of the 102 investor
responses used, 98 completed the entire survey (96%). 8 Demographic information from audit professionals was limited to questions approved by the participating firms. In
the case of one firm, demographic information was provided only at an aggregate level.
9
Auditors reported that, on average, two-thirds of their client portfolio is composed of
companies that are publicly traded. Participants were asked to indicate industries in which they
deemed themselves to be experts; the two industries most frequently indicated were
Manufacturing and Banking/Finance/Insurance (approximately 32 percent each). Our participant
pool also reported expertise in the Retail/Wholesale (22 percent), Technology (22 percent),
Transportation/Energy (17 percent) and Service/Consulting (11 percent) industries. The
remaining industries had expertise levels under 10 percent. Based on the data in Table 1,
participants have experience performing audits in a wide range of industries, consistent with a
recent survey of CFOs (Dichev et al. 2013).
Investors
Table 2 contains descriptive statistics for our sample of investors. Approximately 77
percent of participants are between the ages of 41 and 60, an age range consistent with Dichev et
al. (2013). All participants have undergraduate business degrees and 48 percent have advanced
degrees. On average, participants had worked a total of 24 years and were employed in a variety
of industries, with no single industry being selected by more than 15.8 percent of participants.9
<Insert Table 2 here>
Because education alone does not necessarily equate to investing experience, we asked a
series of questions about actual investing knowledge and experience. On average, our
participants read the business press (e.g., The Wall Street Journal or Bloomberg) approximately
weekly and a high proportion of participants currently invest in a retirement account such as a
401(k) or IRA (93.9 percent), individual mutual funds (86.6 percent), and/or individual stocks
9 We note that investors were only asked to select one industry (the industry that best matches their current job)
while auditors were able to select multiple areas of expertise. The different phrasing of the question is due to the
inherent difference between professionals in industry versus public company auditors who may have expertise
across industries.
10
(84.1 percent).10 Approximately 89 percent of participants have used financial statement
information to evaluate at least one company in the past five years and 93 percent report a total
portfolio value of at least $50,000. Taken together, demographic data from Table 2 indicates that
our investor participants are knowledgeable, nonprofessional investors with reasonable investing
experience.
IV. DEFINITIONS AND MEASURES OF AUDIT QUALITY
The definition and measurement of audit quality can differ markedly from one observer
to the next. Because a respondent’s reference point can affect her/his definition of audit quality,
several recent academic papers have opted to develop frameworks that discuss components of
audit quality, rather than a single overarching construct. A recent review of the audit quality
literature (Knechel et al. 2013) focuses on four dimensions of audit quality: audit inputs (e.g.,
expertise), audit process (e.g., auditor judgment and work performed), outcomes (e.g.,
restatements) and context (e.g., auditor tenure). Similarly, Francis (2011) proposes a framework
that includes inputs, processes, the audit firms themselves (e.g., firm industry expertise), the
audit industry and market (e.g., market competition), institutions (e.g., the PCAOB), and
economic consequences of audit outcomes (e.g., types of opinions issued). In addition to these
academic frameworks, the CAQ, PCAOB, IAASB, and KPMG have proposed their own audit
quality frameworks referencing components similar to those listed above (CAQ 2013; IAASB
2013; KPMG 2011; PCAOB 2013). In this study, we asked participants to provide their own
definition(s) of audit quality and to assess the validity of audit quality indicators suggested in
10 It is possible that investor responses differ based on actual investing experience. We use MANOVA to compare
all responses from investors who use individual stock as a primary investment tool versus those who do not;
responses are not significantly different (MANOVA F-statistic = 1.19, p = 0.29), indicating that the two investor
groups can be analyzed together. Further, when we compare all responses of auditors and only experienced
investors, we continue to find evidence of fundamental differences between auditors and investors (MANOVA F-
statistic = 10.22, p < 0.01).

11
prior research. These insights provided by audit professionals and investors add context and
substance to the proposed theoretical frameworks.
An open-ended question asked participants to provide up to four definitions of audit
quality, as well as how each definition could be practically measured. We received 181
individual responses. After reviewing the responses, the author team created 18 categories for
definitions of audit quality into which two PhD students acting as independent raters categorized
all responses. The Cohen’s Kappa measure was 0.64, an agreement level that is significantly
different from zero (p < 0.001) and that indicates a significant level of inter-rater agreement
above and beyond random chance. The raters later resolved all coding differences; the results
reported in Table 3 represent the consensus of the two independent raters.
As reported in Table 3, Panel A, the most frequently mentioned definition of audit quality
by audit professionals is an audit performed in accordance with GAAS that obtains reasonable
assurance that the financial statements are fairly stated in all material respects.11 This definition
is consistent with the process portion of the audit quality frameworks discussed earlier. To
measure this definition, audit professionals recommend using results of internal and external
review; lack of future restatements; and individual auditor expertise. Auditors’ second most
frequently mentioned definition is an audit that results in financial statements with accurate,
reliable information that the investing public can rely upon as evidenced by hindsight (e.g., lack
of subsequent financial statement restatement). This definition is consistent with the output
portion of the prior frameworks and can be measured by restatements and/or SEC action in
subsequent years. Auditor’s third most frequently mentioned definition is a well-planned
11 Regarding the notion of reasonable versus absolute assurance, one partner responded: “[even] though the audit
standards state and everybody knows that the audit does not provide absolute assurance, when you have one audit
that did not have the right opinion, all of that is of virtually no help. At that point, that notion that the audit is not
designed to be perfect is of almost no help.”

12
engagement that addresses the significant risks of the company, as measured by the results of
internal and external inspection.
<insert Table 3 here>
We present investor responses in Table 3, Panel B. The most frequently mentioned
investor definition of audit quality is one performed by well-trained, competent auditors as
measured by auditor experience, inspection results, and the size of the audit firm. This response
is consistent with the input portion of prior audit quality frameworks and provides evidence that
investors view individual auditor characteristics as an important determinant of audit quality and
provides some support for disclosure of engagement team characteristics (Knechel et al. 2013).
In response to this finding, one partner we interviewed stated, “investors don’t want to hear
auditors talk about GAAS, compliance, etc. because in some respects that’s seen as a curtain
auditors can hide behind. Investors and audit committee members want to know who is on the
team? Do we have the right team? Do they have the right experience? Don’t tell me about
GAAS, tell me about the team.” Another partner, however, expressed skepticism about this
investor viewpoint, and stated that “you can have the right staffing levels, training and expertise,
but I’m not convinced that automatically translates into audit quality.” This partner went on to
state that “[you] have to combine [those team characteristics] with performing the audit in
accordance with GAAS. Compliance with GAAS is the minimum requirement, but then the
quality of the audit can be improved upon by increasing the quality of the staff through
additional training, expertise, etc.” Several partners expressed the opinion that the different
definitions between the two groups is understandable given their different points of view, but
that the investors’ definition can be viewed as a subset of the auditors’ definition because GAAS
explicitly requires engagement teams to be adequately staffed and trained.

13
Like audit professionals, investors defined a quality audit as a well-planned engagement
that addresses significant client risks (investor ranking #2; auditor ranking #3); an audit
performed in accordance with standards (investor ranking #4; auditor ranking #1); and an audit
that results in reliable financial statements (investor ranking #4; auditor ranking #2). However,
unlike audit professionals, investors also mentioned the need for a quality audit to be performed
by independent, skeptical auditors (investor ranking #3), which they suggested could be
measured by non-audit fees and auditor rotation. This explicit reference to auditor independence
is consistent with concerns recently voiced by regulators (Franzel 2012).
V. ATTRIBUTES OF AUDIT QUALITY
Tables 4, 5 and 6 report audit professionals’ and investors’ responses regarding how the
quality of a specific audit engagement is impacted by a given characteristic. Based on
consultation with audit professionals and based on our understanding of the audit function, the
characteristics listed were sorted into three groups, each of which relates to a different aspect of
the audit: 1) the audit engagement; 2) resources available to the audit team; and 3) the audited
entity. Participants were asked to evaluate the extent to which the quality of an audit engagement
is affected by the given characteristic by marking their response on an 11-point Likert scale
bounded by “Lower Audit Quality” (1) and “Higher Audit Quality” (11) with a midpoint of “No
Association with Audit Quality” (6).12 We compare auditor and investor responses using
12 As with any analysis using a Likert scale, there is the potential that some individual participants will
misunderstand the question and respond on the opposite end of the scale from the rest of the group. As shown in
subsequent tables, it appears that several individual participants did misunderstand certain questions; their responses
were reversed relative to the majority of participants. Upon review of the data, there did not appear to be an
identifiable group of participants who misinterpreted all questions; rather, the reversals appeared to be randomly
distributed across participants. Using factor analysis, we found that 95 percent of auditors and 96 percent of
investors treated the Likert scales in the same manner, providing evidence that the scales were not broadly
misinterpreted.

14
ANOVA and compare each group’s mean response to the midpoint using t-tests.13
Characteristics of the Audit Engagement: Audit Firm Size
Question 1 in Table 4 (Question 4.1) asks participants to indicate the extent to which
being audited by a U.S. audit firm with a strong global network affects audit quality. Audit
professionals indicated that audit firms with this characteristic are strongly associated with
higher audit quality, (mean score of 9.40 on the 11-point scale; different from midpoint at p <
0.01). Investors also associated larger audit firms with higher audit quality (mean score of 7.47;
different from midpoint at p < 0.01), but investors’ perceptions of the association between a
larger audit firm size and audit quality is significantly weaker than that of audit professionals (p
< 0.01). Responses of both audit professionals and investors indicate a positive association
between audit firm size and higher audit quality, generally supporting academics’ use of audit
firm size as a proxy for audit quality (e.g., Francis et al. 1999; Kim et al. 2003). One partner
suggested “by definition the firm would have to be large to perform a quality audit of a large
organization…because only a few firms can actually have the resources and ability to audit the
largest companies that are located in multiple jurisdictions.” However, several partners also
cautioned that a large firm does not automatically perform higher quality audits than a smaller
firm, especially in the case of smaller clients and in certain industries.
<insert Table 4 here>
Characteristics of the Audit Engagement: The Audit Report
Questions 4.2-4.4 investigate the extent to which characteristics of the audit report are
associated with audit quality. Question 4.2 addresses unqualified, or “clean,” audit opinions. In
13 Due to the skewness inherent in testing means between groups, we augment our analysis by testing median
responses for each question between auditors and investors. Inferences are robust to these alternative
(nonparametric) tests.
15
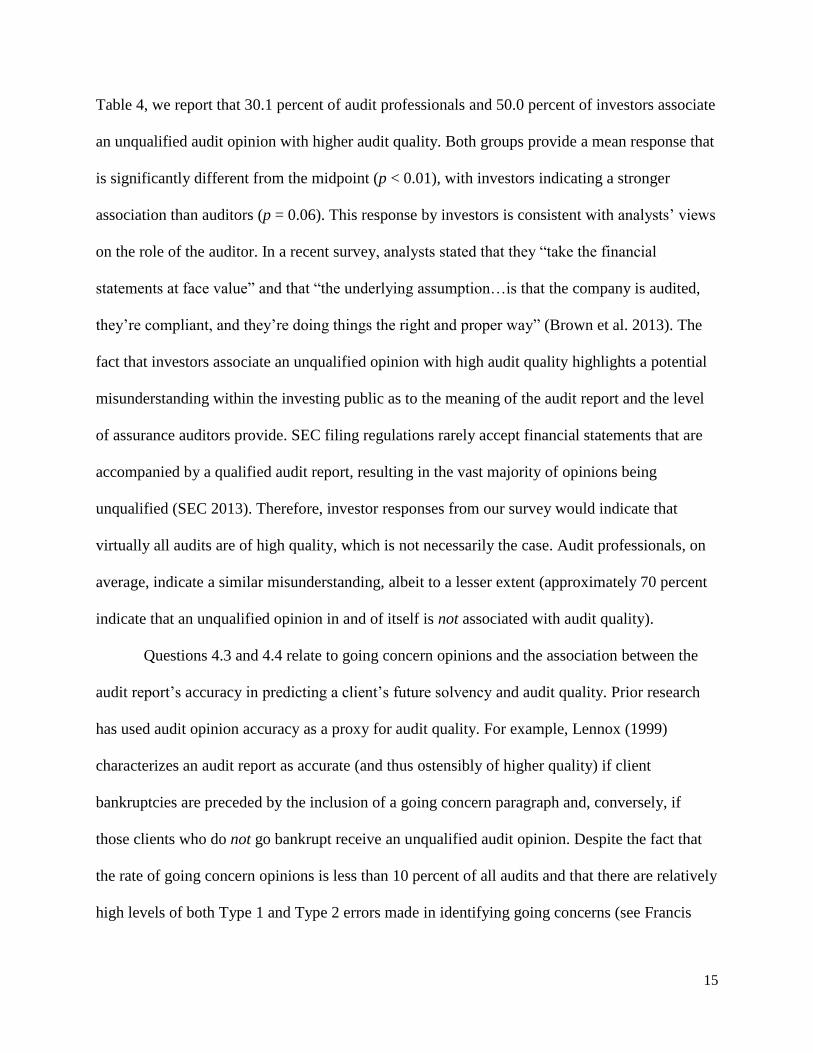
Table 4, we report that 30.1 percent of audit professionals and 50.0 percent of investors associate
an unqualified audit opinion with higher audit quality. Both groups provide a mean response that
is significantly different from the midpoint (p < 0.01), with investors indicating a stronger
association than auditors (p = 0.06). This response by investors is consistent with analysts’ views
on the role of the auditor. In a recent survey, analysts stated that they “take the financial
statements at face value” and that “the underlying assumption…is that the company is audited,
they’re compliant, and they’re doing things the right and proper way” (Brown et al. 2013). The
fact that investors associate an unqualified opinion with high audit quality highlights a potential
misunderstanding within the investing public as to the meaning of the audit report and the level
of assurance auditors provide. SEC filing regulations rarely accept financial statements that are
accompanied by a qualified audit report, resulting in the vast majority of opinions being
unqualified (SEC 2013). Therefore, investor responses from our survey would indicate that
virtually all audits are of high quality, which is not necessarily the case. Audit professionals, on
average, indicate a similar misunderstanding, albeit to a lesser extent (approximately 70 percent
indicate that an unqualified opinion in and of itself is not associated with audit quality).
Questions 4.3 and 4.4 relate to going concern opinions and the association between the
audit report’s accuracy in predicting a client’s future solvency and audit quality. Prior research
has used audit opinion accuracy as a proxy for audit quality. For example, Lennox (1999)
characterizes an audit report as accurate (and thus ostensibly of higher quality) if client
bankruptcies are preceded by the inclusion of a going concern paragraph and, conversely, if
those clients who do not go bankrupt receive an unqualified audit opinion. Despite the fact that
the rate of going concern opinions is less than 10 percent of all audits and that there are relatively
high levels of both Type 1 and Type 2 errors made in identifying going concerns (see Francis

16
2011), research shows that going concern reports are associated with negative stock price
reactions, indicating that investors deem the going concern opinion as informative (Menon and
Williams 2010).
Question 4.3 asks participants the extent to which issuing an unqualified audit opinion is
associated with audit quality if the client subsequently files for bankruptcy. A large percentage,
43.3 percent, of audit professionals indicate that such an occurrence has no association with
audit quality, and an almost equal percentage (44.4 percent) of audit professionals associate
issuing an unqualified audit opinion to a client that subsequently goes bankrupt with lower audit
quality (mean score of 5.43; different from midpoint at p < 0.01). The majority of investor
participants (69.6 percent) also associate this situation with lower audit quality (mean score of
4.00; different from midpoint at p < 0.01) and they do so at a significantly higher level than do
auditors (mean scores of 5.43 and 4.00; different at p < 0.01).
While question 4.3 addresses Type 2 going concern misidentification errors, question 4.4
addresses Type 1 misidentification errors, wherein a going concern paragraph is included and the
client does not fail in a subsequent period. On average, both audit professionals (mean score of
6.94; different from midpoint at p < 0.01) and investors (mean score of 7.08; different from
midpoint at p < 0.01) associate this seemingly conservative reporting pattern with higher audit
quality. In summary, responses from questions 4.3 and 4.4 indicate that audit professionals and
investors view the failure to add a going concern paragraph followed by subsequent client
insolvency as an indicator of lower audit quality, whereas adding such a paragraph followed by
no client insolvency is viewed as an indicator of higher audit quality. These responses provide
some support for using going concern opinions (or the lack thereof) as a proxy for audit quality
(Lennox 1999), keeping in mind the low base rate of going concern opinions (Francis 2011).

17
Characteristics of the Audit Engagement: Review and Inspection Results
The most direct evaluation of an audit’s quality occurs during the rigorous, iterative
review process that all audits undergo. The process begins with real-time reviews during the
audit (PCAOB 2004b), continues with internal firm review performed by the engagement review
partner (PCAOB 2009) 14 and possible additional internal quality control review, and concludes
with external reviews by peer firms and the PCAOB. Audit deficiencies identified throughout the
review process would indicate a departure from standards, thus indicating a decrease in the
quality of the audit.
Questions 4.5 through 4.8 examine how participants view the association between the
audit review process and audit quality. In response to question 4.5, 79.5 percent of audit
professionals indicate that finding fewer audit deficiencies during real-time review is associated
with higher audit quality (mean score of 8.33; different from midpoint at p < 0.01), indicating
that auditors acknowledge the importance of rigorous real-time review. Additionally, this
negative association between the number of deficiencies identified and audit quality persists
through various levels of review including internal quality review (question 4.6), peer-review
(question 4.7), and PCAOB review (question 4.8). In all cases, more than 70 percent of audit
professionals associated fewer deficiencies identified by the review function with higher audit
quality, and only in the case of PCAOB reviews did auditors view the association as being
significantly stronger than did investors (p < 0.05).15 One partner interpreted this significant
14 We note that review by the engagement review partner is also a part of “real-time” review, but will be addressed
along with other consultations from parties outside the core engagement team in Table 5. 15 In untabulated within-subjects analysis, we compare the mean scores among the varying levels of review to
determine whether certain types of review are more strongly associated with audit quality than others. We find that
audit professionals indicate that real-time review (mean value 8.33) has the strongest association with audit quality,
although only statistically different from the more formal internal quality review, in which audit engagements are
selected for review by the firm’s national office (mean score 7.97; different at p = 0.04). Among investors, we find
that peer-review has the strongest association with audit quality (mean score of 8.05) and that this association is
significantly stronger than either internal quality review (p < 0.01) or PCAOB review (p < 0.01).

18
difference between partners and investors as meaning that “investors aren’t as concerned about
the PCAOB inspection process as we the partners are.” Another partner suggested that the
difference is because many PCAOB deficiencies relate to documentation only, and that “better
audit documentation is not necessarily consistent with what the investor public desires.”
Regarding PCAOB inspections, one partner stated that because “there aren’t many measuring
sticks available, I’m not surprised [investors] connect PCAOB deficiencies with audit quality. In
some respects…it speaks well of the inspection process” and another agreed with a negative
correlation between individual engagement quality and the number of PCAOB deficiencies.
Along these lines, several partners noted that the firms take the PCAOB inspections very
seriously, with one partner stating that “the PCAOB has and continues to have a lot of impact,
particularly by focusing on the systems of quality control at the firms. I wish [the PCAOB] put
more emphasis on the quality control system at the firms.”
Characteristics of the Audit Engagement: Timeliness of Procedures
Questions 4.9 and 4.10 investigate the association between the timely completion of
various audit procedures and audit quality.16 The PCAOB’s standard on audit planning (2010b)
states that audit planning is not a “discrete” event but rather a process that takes place starting at
the completion of the prior year’s audit through the completion of the current year’s audit (AS
9¶4). The majority of the planning procedures, however, are performed before fieldwork
commences and are adjusted as necessary. As shown in Table 4, audit professionals view
planning procedures as an integral part of audit quality with 94.6 percent indicating that the
timely completion of planning procedures is associated with higher audit quality. Audits planned
on a timely basis signal that the engagement team has analyzed the client’s risks and designed
16 Due to the subject matter, these questions were only posed to audit professionals.

19
audit procedures to appropriately address those risks. Audit firms’ electronic workpapers makes
this information available to audit firms and to the PCAOB. Responses to question 4.9 indicate
that disclosure of such information, either by the firms or by the PCAOB, may provide valuable
information to investors about factors that drive audit quality.
In addition to the timeliness of audit planning, audit quality is affected by the timeliness
of audit fieldwork completion. Failure to complete audit fieldwork in a timely manner results in
additional time and budgetary pressure, reducing audit quality (Agoglia et al. 2010; Coram et al.
2004; Houston 1999; Lopez and Peters 2012; McDaniel 1990). In support of this notion, 89.3
percent of audit professionals associate the timely completion of audit fieldwork with higher
audit quality. Lambert et al. (2011) indirectly investigate the effect of audit completion
timeliness by investigating the impact of accelerated filing dates on audit quality. When filing
dates are accelerated, auditors have less time in which to perform their work and thus encounter
more time pressure, potentially reducing audit quality. The authors find that acceleration of the
audit report date by 15 days or more results in higher discretionary accruals and a greater
likelihood of just meeting or beating analyst forecasts, measures that have been used to proxy for
audit quality in prior literature (e.g., Davis et al. 2009; Myers et al. 2003). One partner we
interviewed specifically mentioned time pressure as an impediment to audit quality, stating that
“[when I speak of time pressure as an impediment to audit quality], I’m talking about the
findings or the need for information that comes right at the end…and there’s a lot of pressure
from management, and with some clients from the audit committee, in my opinion, to go ahead
and sign the audit opinion without getting that evidence.” In summary, responses from audit
professionals to both questions 4.9 and 4.10 indicate a positive association between the timely
completion of audit procedures and audit quality.

20
Characteristics of the Audit Engagement: Other
Question 4.11 investigates the association between the lack of subsequent lawsuits
against the audit firm and the quality of the audit engagement (Palmrose 1998). Responses to
question 4.11 indicate that, on average, audit professionals associate the lack of a lawsuit with
higher audit quality (mean score of 6.60; different from midpoint at p < 0.01). Investors’ views
of this association are similar to auditors’ (mean score 6.86; different from midpoint at p < 0.01).
Finally, question 4.12 investigates the association between audit fees and audit quality.
All else held constant, auditors’ compensation must be sufficient to motivate audit effort and
gather sufficient audit evidence to justify the audit opinion (Messier et al. 2010; PCAOB 2010a;
Simunic 1980). In response to question 4.12, 72.0 percent of audit professionals indicate a
positive association between audit fees and audit quality. Additionally, the mean auditor
response is significantly higher than that of investors (p < 0.05), of whom only 52.9 percent
indicate a positive association between audit fees and audit quality. While the payment of higher
audit fees does not always ensure higher audit quality, participants’ responses suggest that higher
fees tend to be associated with higher quality.
In summary, results documented in Table 4 indicate that audit firm size; unqualified,
accurate and conservative audit opinions; fewer identified deficiencies; timely completion of
audit planning and audit fieldwork; lack of litigation; and reasonable audit fees are indicators of
higher audit quality.
Resources Available for the Audit Team: Engagement Team Qualifications
Questions in Table 5 examine the resources available to the audit engagement team.
Questions 5.1 through 5.3 address individual characteristics of the audit team, including adequate
staffing, auditor training, and auditor expertise.

21
<insert Table 5 here>
Question 5.1 investigates the sufficiency of engagement team staffing and audit quality.
In response to this question, 100 percent of audit professionals associate adequate team staffing
with high audit quality; with a mean response of 10.02 on an 11-point scale, auditors consider
this association to be very strong. Investors on average agree with this assessment (mean
response of 8.80), but the strength of the association is significantly lower than audit
professionals’ (p < 0.01). Clearly, both groups indicate that adequate staffing is a prerequisite to
achieving a high-quality audit. Consistent with this result, interview participants emphasized that
current staffing practices at audit firms are very rigorous to ensure that high-quality staff are
assigned to each engagement. Adequately-staffed audit teams can improve audit quality by
allocating audit procedures among more engagement team members, thus decreasing the amount
of work assigned to each individual, as well as by appropriately allocating work to those team
members most qualified for the task (Bonner 1990; Griffin and Ricchiute 2011; Hanson 2013).
Question 5.2 investigates the association between audit quality and having well-trained
auditors. Results reported in Table 5 indicate that 100 percent of both audit professionals (mean
score of 10.14) and investors (mean score of 9.66) associate having well-trained auditors with
higher audit quality. In a similar vein, question 5.3 investigates the association between auditor
expertise (e.g., industry-based or transaction-based) and audit quality. Similar to the previous
question, 100 percent of both audit professionals (mean score of 9.82) and investors (mean score
of 9.88) associate auditor expertise with higher levels of audit quality.
The first three questions in Table 5 relate to individual characteristics of the audit
engagement team and its members. Both stakeholder groups overwhelmingly associate these
individual characteristics with high audit quality. Among survey responses, these three questions

22
receive the three highest average scores among any of the questions focused on audit quality,
supporting findings from prior literature that additional knowledge and expertise leads to higher
audit quality overall (e.g., Bedard 1989; Hammersley 2006; Low 2004; Owhoso et al. 2002;
Taylor 2000;Wright and Wright 1997). This finding is also consistent with recent archival
literature that finds that auditor training is positively associated with accruals-based measures of
audit quality, while staff and partner workload are negatively associated with audit quality (Van
Linden and Willekens 2013). Additionally, these findings are consistent with accounting firms’
recent emphasis on key process inputs, such as auditor expertise and training, as crucial to audit
quality (CAQ 2012; KPMG 2011).
Our results provide evidence that individual auditor characteristics are viewed as an
important determinant of audit quality and provide some support for disclosure of engagement
team characteristics (Knechel et al. 2013). One partner indicated that these indicators could be
“reported without embarrassing anybody” while another said that disclosure of these indicators
would be appropriate as long as the nature of the information disclosed is “predetermined” by
standards. However, most partners we interviewed suggested that making such disclosures
comparable would be difficult. For example, one partner stated, “each engagement really is
unique…and potentially has different staffing needs and requirements. If I look at my practice
with clients of similar size, the staffing models may be different due to individual characteristics
of the clients.” Additionally, another partner mentioned, “the intangibles, the qualitative portion
[of engagement team characteristics], would get lost in disclosing to the public those particular
quantitative factors that are important.” As an alternative, this partner noted that perhaps firms
could disclose “a description of the process by which the sufficiency of an engagement team is
evaluated” by the firm itself and disclose items such as engagement risk, internal control

23
effectiveness, prior year audit concerns, etc. to provide more client-specific information on how
the firm evaluates staffing needs. This is consistent with the firms’ willingness to disclose more
information regarding their own internal quality monitoring programs (PwC 2013).
Regarding team characteristics and audit quality, one partner indicated that while he
agreed that engagement team characteristics such as staffing, training, and expertise are
indicators of audit quality, “they don’t define audit quality.” The partner went on to explain that
regardless of how strong the staff members are, the manager and partner can override them.
Specifically, this partner stated that important potential impediments to audit quality are “the
personality and the personal characteristics of the audit partner and manager as to what is driving
them from a personal standpoint. I think both of these things can dramatically change the
outcome of the audit regardless of the quality of the engagement team inputs.” Another partner
suggested that instead of disclosing information about the entire engagement team, the disclosure
could perhaps be limited to characteristics related to the senior leadership of the audit
engagement team (e.g., partners, senior managers).
Resources Available for the Audit Team: Consultations
Questions 5.4 through 5.7 evaluate how consulting with individuals outside to the day-to-
day operations of the audit team impacts audit quality. Input from sources such as engagement
review partners, national office partners, external experts, and internal audit firm specialists also
play an important role in ensuring audit quality, especially when the engagement team
encounters subjective and complicated accounts and transactions. These advisors can have a
significant impact on audit quality and are therefore important to examine.17
17 Due to the inherently specialized nature of these external advisors, we did not pose these questions to investors.

24
Audit standards require audits to be reviewed by an engagement review partner (ERP),
who has the necessary expertise to understand the client but is not directly responsible for, or
involved in the day-to-day activities of, the audit engagement (PCAOB 2009, AS 7 ¶2). We ask
audit professionals to indicate the extent to which the number of hours billed by an ERP is
associated with audit quality. Responses to question 5.4 indicate that 78.4 percent of audit
professionals associate greater involvement by the ERP with higher audit quality (mean score of
7.63; different from midpoint at p < 0.01).
Engagement teams may also contact the firm’s national office for guidance during the
audit. These national office consultations do not occur during every audit engagement, but rather
only when needed to address difficult technical accounting matters, unusual and material
transactions (e.g., mergers and acquisitions), infrequently encountered audit risks (e.g., material
legal contingencies) or other audit methodology judgments for which an audit engagement team
would prefer to receive counsel from the national office. When asked about the association
between the number of national office consultations and audit quality, 69.9 percent of audit
professionals associate national office consultations with higher audit quality, with 25.8 percent
indicating no association between the number of such consultations and audit quality. With an
average response of 7.14 (different from midpoint at p < 0.01), audit professionals on average
perceive a benefit with respect to audit quality from engaging in national office consultations
when needed.
Questions 5.6 and 5.7 investigate the perceived impact of external experts and internal
specialists, respectively, on audit quality. When asked about the association between audit
quality and the number of consultations with external experts, 59.1 percent of audit professionals
associate input from external experts with higher audit quality. On the other hand, when asked

25
about internal firm specialists and audit quality, 82.9 percent of audit professionals associate
consulting with internal firm specialists with higher audit quality. The mean responses for the
two questions, 6.77 and 7.68 respectively, are significantly different (p < 0.01). Based on these
responses, consulting with internal specialists is preferred to consulting with experts outside of
the firm. This finding may be due, in part, to the fact that accounting firms are typically large
enough to employ most types of specialists, reducing the need to seek counsel from external
specialists. However, relying solely on within-firm guidance potentially discounts the value of
advice from a more independent third-party.
In summary, results documented in Table 5 indicate that both stakeholder groups
associate characteristics of the individual audit team such as staffing levels, training, and
expertise with higher audit quality. Additionally, audit professionals generally associate
consulting with individuals outside the core audit engagement team with higher audit quality,
although consulting within the firm (i.e., with internal specialists, the national office and
engagement review partners) is viewed more favorably than consulting outside of the firm.
Characteristics of the Audited Entity: Accruals
In addition to characteristics of the audit engagement and the audit engagement team,
characteristics of the audited entity itself also may be associated with higher or lower audit
quality. These characteristics, such as the entity’s accruals, subsequent outcomes related to the
company’s financial statements, and the entity’s committee meetings are investigated and
reported in Table 6.
<insert Table 6 here>
Question 6.1 investigates the entity’s financial reporting quality as measured by the
conservatism reflected in a company’s accruals. Although an entity’s level of discretionary

26
accruals is a commonly used proxy for earnings quality (see Dechow et al. 2010 for a review), it
has also been associated with audit quality. Studies show that higher discretionary accruals—
which would in theory signal more accounting manipulation by management—is negatively
associated with audits by Big N auditors (Francis et al. 1999; Kim et al. 2003), audit firm office-
specific size (Francis and Yu 2009), audit firm specialization (Balsam et al. 2003), audit firm
tenure (Myers et al. 2003), and is positively associated with past restatements (Francis and
Michas 2012).
We find that 54.8 percent of audit professionals indicate that conservative reserve
balances are associated with higher audit quality. While 37.6 percent of auditors indicate that
there is no association between reserve balances and audit quality, their responses also indicate
that on average audit professionals associate higher quality audits with more conservative
financial reporting by their clients, using accruals levels to represent conservatism (mean score
of 6.89; different from midpoint at p < 0.01). When the same question was posed to investors,
they responded similarly on average (mean score 6.62, different from midpoint at p < 0.01).
Taken together, both stakeholders view conservative accruals as indicating higher audit quality,
providing some support for the use of accruals as a proxy for audit quality.
Characteristics of the Audited Entity: Subsequent Outcomes
Due to data limitations, many studies of audit quality have focused on publicly
observable outcomes related to the audited entity. Questions 6.2 through 6.4 investigate three of
these outcomes: restatements, SEC enforcement actions, and fraud.
Question 6.2 addresses the association between audit quality and the lack of future
restatements by the audited entity related to the period under audit. Restatements are one of the
more visible signals that material information was either omitted or misstated in published

27
financial statements. Restatements have been used as a proxy for lower audit quality under the
assumption that if audit quality had been higher, the auditors would have identified the material
misstatement during the audit process (e.g., Stanley and DeZoort 2007). Consistent with this
notion, 75.3 percent of audit professionals indicate that the lack of future financial statement
restatements is associated with higher audit quality. With a mean response of 7.87 (different
from midpoint at p < 0.01), audit professionals, on average, indicate a positive association
between audit quality and the lack of financial statement restatements. When investors are asked
the same question, 62.8 percent indicate that a lack of future restatements is associated with
higher audit quality, although the perceived association is weaker among investors than auditors
(p = 0.03). In follow-up interviews, partners agreed with these results, stating that using
restatement trends or the lack thereof as an indicator of audit quality “is not 100 percent perfect,
but it’s a fairly good indicator as to whether or not audit quality is improving.” Several partners
we interviewed were surprised that the percentage of investors viewing a lack of restatements as
higher audit quality was not higher than 62.8 percent.
Question 6.3 examines the association between SEC enforcement actions and audit
quality. SEC enforcement actions, as made publicly available through the release of an
Accounting and Auditing Enforcement Release (AAER), are issued as a result of a violation of
the financial reporting requirements in the Securities Exchange Act of 1934 (Dechow et al. 1996;
Pincus et al. 1988). If a company’s SEC filings are the target of an AAER for material
misstatement, users may blame auditors for not identifying and correcting the error before the
release of the financial statements. Accordingly, AAER’s have been used in research to proxy for
low audit quality (e.g., Carcello and Nagy 2004).

28
When we asked audit professionals about the association between audit quality and the
lack of SEC enforcement actions, 70.9 percent of practitioner respondents report that a lack of
SEC enforcement action indicates higher audit quality, consistent with the view expressed
regarding restatements. Similarly, 62.7 percent of investors associate the lack of SEC
enforcement action with higher audit quality. In untabulated results, auditors’ average perceived
association between SEC enforcement actions and audit quality is significantly lower than the
perceived association between restatements and audit quality (p < 0.05), indicating that from the
average audit professional’s perspective, restatements are more strongly associated with audit
quality than are AAERs. One partner explained this significant difference as being “due to the
frequency of occurrence [of the two outcomes]. Very few partners ever deal with an SEC
enforcement action, but almost everyone, at some time in their career, has dealt with a
restatement or two.”
Finally, question 6.4 investigates the association between the lack of future fraud
identification and audit quality. Consistent with responses regarding restatements and SEC
enforcement actions, 62.8 percent of investors associate the lack of future fraud identification
with higher audit quality. The fact that “only” 62 percent of investors view the lack of future
fraud as indicative of high audit quality is somewhat surprising when we take into account
investors’ high expectations of auditors in regard to identifying fraud (Hogan et al. 2008;
McEnroe and Martens 2001).
These external indicators of audit quality are among the most easily observable, but are
also subject to hindsight bias when evaluating the performance of the auditor. One partner stated
the following regarding this bias:
After Pearl Harbor, and after the attacks of 9/11, we do these investigations and we piece
together these things that, looking backward, we can connect these dots, this action or
29
inaction with that one and that one and that one and we can construct all of these things
that led up to this horrible event. And then we can look at the people who were involved
and say ‘my gosh, how could you possibly have not seen this coming?’ Now the problem
with that is that in the real world, we’re always in the beginning of that sequence of
events. Any one of those events by itself, the results are typically benign and yet it’s the
combination over time that eventually causes the problems.
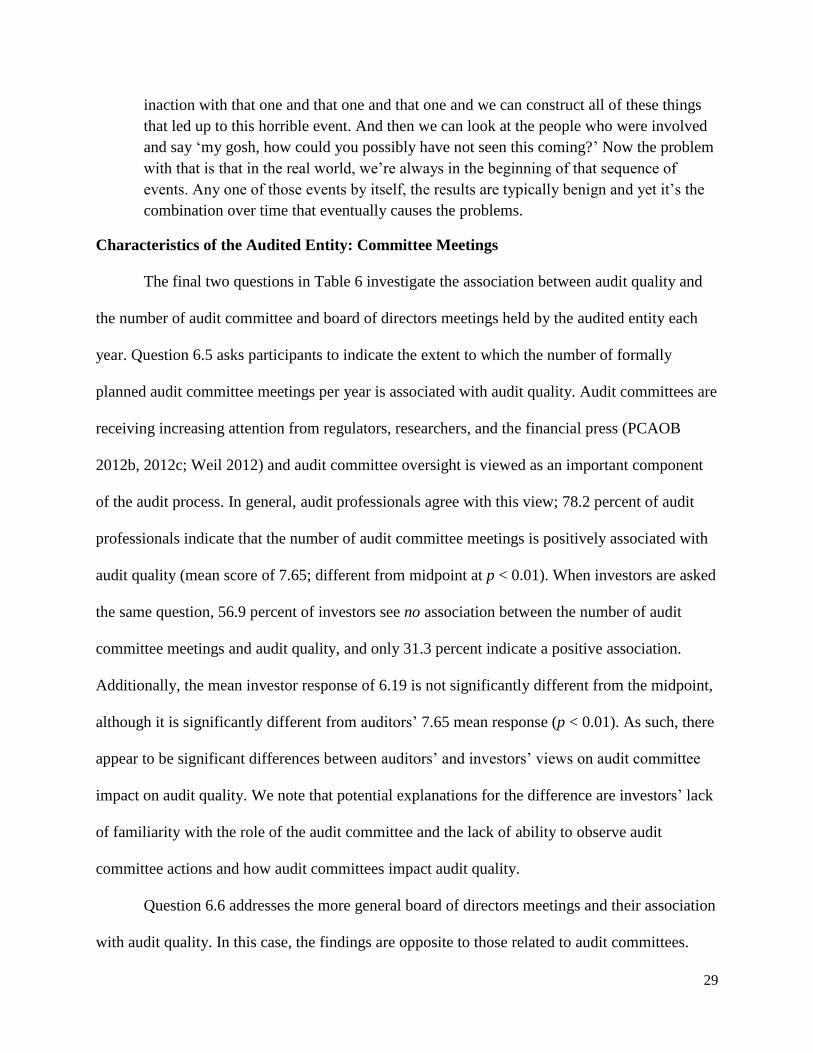
Characteristics of the Audited Entity: Committee Meetings
The final two questions in Table 6 investigate the association between audit quality and
the number of audit committee and board of directors meetings held by the audited entity each
year. Question 6.5 asks participants to indicate the extent to which the number of formally
planned audit committee meetings per year is associated with audit quality. Audit committees are
receiving increasing attention from regulators, researchers, and the financial press (PCAOB
2012b, 2012c; Weil 2012) and audit committee oversight is viewed as an important component
of the audit process. In general, audit professionals agree with this view; 78.2 percent of audit
professionals indicate that the number of audit committee meetings is positively associated with
audit quality (mean score of 7.65; different from midpoint at p < 0.01). When investors are asked
the same question, 56.9 percent of investors see no association between the number of audit
committee meetings and audit quality, and only 31.3 percent indicate a positive association.
Additionally, the mean investor response of 6.19 is not significantly different from the midpoint,
although it is significantly different from auditors’ 7.65 mean response (p < 0.01). As such, there
appear to be significant differences between auditors’ and investors’ views on audit committee
impact on audit quality. We note that potential explanations for the difference are investors’ lack
of familiarity with the role of the audit committee and the lack of ability to observe audit
committee actions and how audit committees impact audit quality.
Question 6.6 addresses the more general board of directors meetings and their association
with audit quality. In this case, the findings are opposite to those related to audit committees.

30
Whereas the majority of audit professionals view the number of board of directors meetings as
having no association with audit quality (53.8 percent), the majority of investors (57.8 percent)
view these meetings as having a positive impact on audit quality; the mean responses of the two
groups are significantly different (p < 0.05). Responses to 6.5 and 6.6 indicate important
differences (or perhaps a knowledge gap) in how audit professionals and investors view the
impact that audit committee and board meetings have on audit quality: while auditors view audit
committee meetings as more important to audit quality, investors view board of directors
meetings as more important.
In summary, results documented in Table 6 indicate that financial statement outcomes are
relevant in evaluating audit quality. Specifically, the lack of future restatements, lack of SEC
enforcement actions, and the number of planned audit committee meetings are among the
outcomes that audit professionals associate with high audit quality. Investors likewise perceive a
positive association between the lack of future restatements, fraud or SEC enforcement actions
and audit quality, although to a lesser extent than auditors. Additionally, investors associate the
number of board of directors meetings with high audit quality, whereas auditors do not.
VI. PCAOB INSPECTIONS AND ESTIMATION UNCERTAINTY
PCAOB Inspections and Audit Firm Quality
The results from Tables 4, 5 and 6 relate to the quality of an individual audit engagement.
Financial statement users, audit committees, and academics are also interested in the quality of
audit firms as a whole. This is difficult to assess because a proper assessment would require
access to the audit firm’s tone at the top, policies, methodologies, training, human resource
management, reward structure, internal inspections, quality control practices, etc. After SOX, the
PCAOB’s board and inspection staff does have access to such information. Perceptions of
31
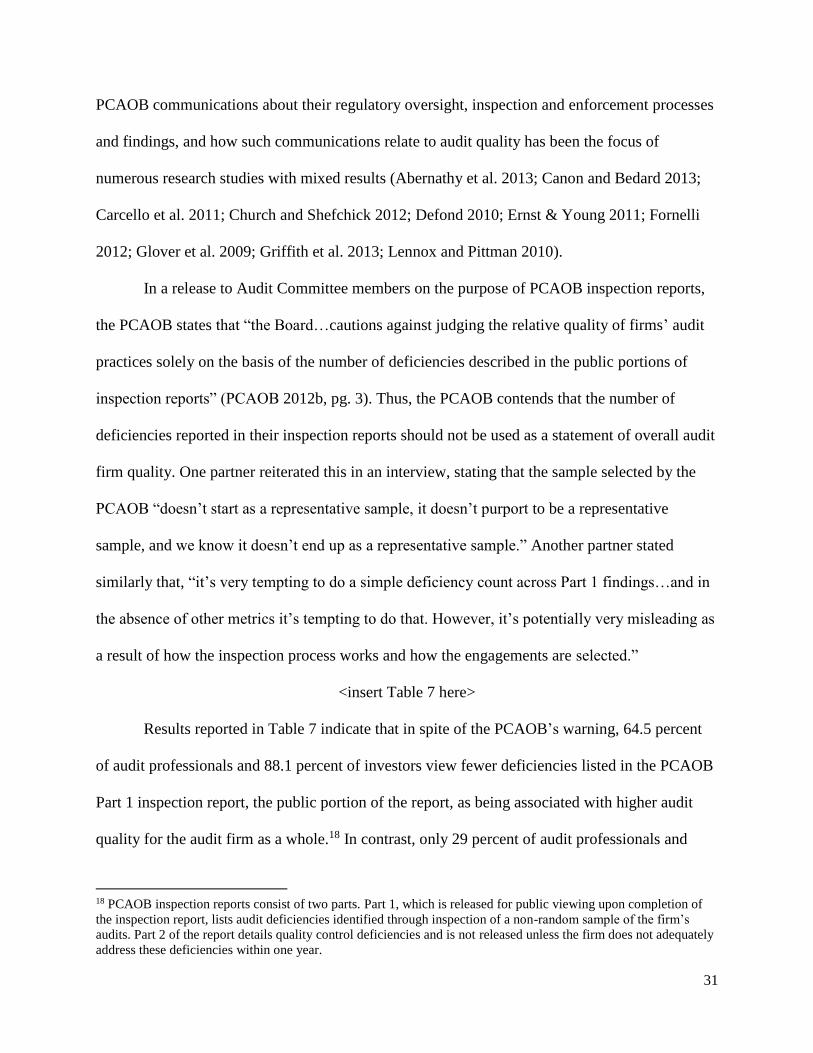
PCAOB communications about their regulatory oversight, inspection and enforcement processes
and findings, and how such communications relate to audit quality has been the focus of
numerous research studies with mixed results (Abernathy et al. 2013; Canon and Bedard 2013;
Carcello et al. 2011; Church and Shefchick 2012; Defond 2010; Ernst & Young 2011; Fornelli
2012; Glover et al. 2009; Griffith et al. 2013; Lennox and Pittman 2010).
In a release to Audit Committee members on the purpose of PCAOB inspection reports,
the PCAOB states that “the Board…cautions against judging the relative quality of firms’ audit
practices solely on the basis of the number of deficiencies described in the public portions of
inspection reports” (PCAOB 2012b, pg. 3). Thus, the PCAOB contends that the number of
deficiencies reported in their inspection reports should not be used as a statement of overall audit
firm quality. One partner reiterated this in an interview, stating that the sample selected by the
PCAOB “doesn’t start as a representative sample, it doesn’t purport to be a representative
sample, and we know it doesn’t end up as a representative sample.” Another partner stated
similarly that, “it’s very tempting to do a simple deficiency count across Part 1 findings…and in
the absence of other metrics it’s tempting to do that. However, it’s potentially very misleading as
a result of how the inspection process works and how the engagements are selected.”
<insert Table 7 here>
Results reported in Table 7 indicate that in spite of the PCAOB’s warning, 64.5 percent
of audit professionals and 88.1 percent of investors view fewer deficiencies listed in the PCAOB
Part 1 inspection report, the public portion of the report, as being associated with higher audit
quality for the audit firm as a whole.18 In contrast, only 29 percent of audit professionals and
18 PCAOB inspection reports consist of two parts. Part 1, which is released for public viewing upon completion of
the inspection report, lists audit deficiencies identified through inspection of a non-random sample of the firm’s
audits. Part 2 of the report details quality control deficiencies and is not released unless the firm does not adequately
address these deficiencies within one year.

32
10.9 percent of investors indicate that the number of deficiencies has no bearing on firm-wide
audit quality. The mean response for investors (7.90) was significantly higher (p < 0.01) than the
mean response for auditors (6.99), indicating that investors may use a count of deficiencies in
these reports for a purpose not intended by the PCAOB.
Reacting to the difference in perceptions between investors and auditors, one partner
suggested that “partners [responses] are lower [than investors] … because [partners] are delving
into the nature of the deficiencies, whereas investors are just looking at the number [of
deficiencies]. … Sometimes if you get multiple findings in a given area, it’s because the PCAOB
was taking that area and ripping it to shreds. While the [number of deficiencies] may look high,
it’s not as bad as it looks on the surface.” Several other partners expressed concern regarding the
degree to which investors associate the number of PCAOB deficiencies with firm quality. One
partner stated that, “I don’t believe that fewer deficiencies are necessarily indicative of higher
firm quality. … I think it’s a problem for our profession that investors over-rely on something
that might not be a great measure.” Another partner agreed, stating that “it’s an educational
process trying to help users understand what the reports actually mean. The reports try to caveat
that, but at the end of the day the investors take those numbers and look at them and have a
different view regardless of what the PCAOB might say.”
Regarding the 64.5 percent of partners who associate higher firm quality with fewer
PCAOB deficiencies, one partner stated “there’s now a direct connection between personal
inspection results and performance evaluations.” This partner stated that some partners “perceive
Part 1 as being representative of firm quality because everybody else does. They perceive that
academics, analysts, industry specialists and audit committees, for example, perceive it as
important so the partners perceive it as important as well.”

33
Estimation Uncertainty and its Impact on Audit Quality
The length and complexity of financial statement footnotes, the complexity of business
transactions and the general move toward fair-value measurements in financial statements are
just a few of the factors leading to increased financial statement uncertainty. U.S. regulators’
awareness of this trend is evidenced by a 2011 roundtable discussion initiated by the SEC
focusing on uncertainty in financial reporting (SEC 2011). This roundtable acknowledged
“uncertainty exists in financial statements where measurements to a large extent … are based on
estimates, judgments, and models rather than exact depictions” (SEC 2011). Unfortunately,
auditors are required to provide a high level of assurance that the financial statements are
materially correct, regardless of the level of estimation uncertainty (Christensen et al. 2012). This
topic is also receiving attention from researchers (e.g., Cannon and Bedard 2013; Christensen et
al. 2013a; Peecher et al. 2013; White 2013). Thus, we investigate auditors’ and investors’
perceptions of how significant estimation uncertainty affects auditors’ ability to perform their
job. Specifically, participants were asked to evaluate the extent to which the size of the
reasonable range and the number of estimates with significant estimation uncertainty affect the
auditor’s ability to achieve the desired level of assurance for those estimates and the related
financial statements.
<insert Table 8 here>
In Table 8, both audit professionals (75.0 percent) and investors (80.6 percent) indicate
that high levels of estimation uncertainty significantly affect auditors’ ability to provide the
requisite level of assurance. The mean response from both groups is significantly different from
the midpoint (p < 0.01) although not significantly different from each other (p > 0.10). In
conversations with some high-ranking audit regulators, they seem to suggest that regardless of

34
the apparent extreme uncertainty, “better” or “more” auditing will allow auditors to reduce the
reasonable range of uncertainty to within tolerable error. PCAOB inspection reports have cited
firms’ failures to appropriately address uncertainty, despite the existence of substantial
underlying uncertainty (see a discussion of such PCAOB comments in Griffith et al. 2013).
The responses in Table 8 indicate that audit professionals and investors acknowledge the
difficulty of auditing an account whose reasonable range of values exceeds audit materiality. One
partner we interviewed agreed with the findings in Table 8, stating that “these big estimates are
going to be the most difficult areas to audit because of their subjective nature; they’re the most
difficult area to obtain objective evidential matter to support the conclusions.” Another partner
responded that “there are multiple instances where [reducing the reasonable range to within audit
materiality] literally cannot be done. You can have minimal changes in the inputs that result in a
substantial difference.” Finally, one partner reacted to the findings in Table 8 by stating that
these results “prove what I’ve been telling my partners all along: we shouldn’t be held to the
same standard with estimates that we are with verifiable amounts.” Responses suggest that it is
problematic for auditors to provide high assurance associated for a reported point estimate when
the estimate is associated with an irreducible reasonable range of uncertainty that is beyond the
bounds of quantitative audit materiality (Bell and Griffin 2012; Christensen et al. 2012;
Christensen et al. 2013a; Griffith et al. 2013). On the other hand, partners also recognize the
practical realities they face. Until and unless auditing standards change, auditors are prepared to
continue doing their best to provide the desired level of assurance. One partner stated that “in
regard to impacting the provision of assurance, there’s always a way to get there. If there isn’t,
you shouldn’t be issuing an opinion.”

35
VII. PUBLICLY AVAILABLE SIGNALS OF LOW AUDIT QUALITY
Due to audit engagement team and audit process data limitations, researchers and
investors are frequently left to rely on other publicly available sources of information to
determine whether an audit was of high or low quality. When participants were asked to provide
up to four publicly available signals of low audit quality, we received 377 individual responses.
After reviewing the responses, the author team created 60 categories for signals of low audit
quality into which two PhD students acting as independent raters categorized all responses. The
Cohen’s Kappa measure was 0.86, an agreement level that is significantly different from zero (p
< 0.001) and that indicates a significant amount of inter-rater agreement. The raters later resolved
all coding differences; the results reported in Table 9 represent the consensus of the two
independent raters. In Table 9, we present the top ten responses from auditors and investors in
Panels A and B, respectively.
<insert Table 9 here>
In Table 9, Panel A, audit professionals overwhelmingly mention financial statement
restatements as the number one publicly available signal of low audit quality. This is consistent
with responses to Question 6.2. In response to restatements as an indicator of low audit quality,
one partner agreed with the survey findings, saying “…even if it’s not the most frequent signal, a
subsequent restatement would be a strong signal of low audit quality.” In explaining his stance,
the partner referenced the concept of materiality. “I look at a restatement, it’s obviously material;
if it weren’t material, it wouldn’t be restated. For us, a restatement is referred to as the “R”
word—we just don’t want them unless it’s absolutely necessary.” Another partner responded to
the findings by stating that the results regarding restatements as an indicator of low audit quality
“are dead on point and it gets back to what the purpose of an audit is—to avoid having to restate

36
something. The statements need to be right.” While partners acknowledged that not all
restatements are created equal or are due to low audit quality, there was a general consensus that,
as one partner stated, “if there’s a restatement, it’s probably indicative that something could have
been improved in the audit process that could have identified the error.”
We note that research has shown a decreasing market reaction to restatements over time
(Scholz 2008), suggesting perhaps that restatements are not a meaningful indicator of low audit
quality. However, it is important to distinguish between financial reporting quality as perceived
by the market and the quality of the audit of those financial statements, as these are distinct
constructs. Considering that auditors are tasked with opining as to the material fairness of the
financial statements, a subsequent restatement would indicate that to some extent the audit was
of lower quality irrespective of the market’s reaction, which may be tempered due to reliance on
other sources of information such as analyst forecasts (Hail 2013). Taken together, auditor
responses from Question 6.2, open-ended responses in Table 9, and comments from interview
participants provide support for the use of restatements (or lack thereof) as a proxy for low (high)
audit quality.
The second and third most frequently mentioned publicly available signals of low audit
quality by auditors were SEC comment letters and enforcement actions (ranking #2) and PCAOB
reports of deficiencies (ranking #3). Other auditor-identified signals of low audit quality include
frequent changes in auditor (ranking #4); unusually low audit fees (ranking #7); and small and/or
inexperienced audit firms (ranking #10). While these three signals may appear to be self-serving
when emphasized by audit professionals from large audit firms, they also reflect the documented
finding that frequent auditor changes can reduce audit quality (Ghosh and Moon 2005; Myers et
al. 2003); that fee pressure may reduce audit quality (Christensen et al. 2013b; Ettredge et al.

37
2012); and that smaller firms may not have the capacity to audit large companies. Commenting
on frequent audit firm turnover, one partner explained that “too frequent turnover could be an
indication that you’ve got somebody that’s difficult to deal with and is pushing the envelope, and
a good quality firm is not willing to go along with that.” Another partner agreed, stating that
frequent audit firm turnover “raises a red flag not about the preceding auditors, but about the
client.” One partner provided a perspective on the risks associated with dismissal and long audit
tenure:
I think the auditor tenure question is probably the wrong question, or at least a lesser
important question, than whether the auditor was dismissed for doing his or her
job. Where is the concern about auditors being dismissed for standing up to
management? Where is the concern over compromised skepticism and independence
because management holds over the audit team the threat of dismissal and audit
committees rarely stop management from dismissing the auditor? If the auditor has the
backing of the audit committee to do the right thing and [can] survive in the relationship,
then how much does it really matter how long the audit firm has been doing the audit?
Finally, we note that audit professionals frequently mention negative analyst reports (ranking
#10) as a signal of lower audit quality but investors rarely mention analyst reports (ranking #32).
The result supports recent research investigating the use of analyst reports by auditors (Newton
2013).
We present investor responses in Table 9, Panel B. Similar to auditors’ responses, the
number one publicly available signal of low audit quality is financial statement restatements.
While the majority of the signals identified by investors are consistent with those identified by
audit professionals, several differences are worth noting. First, investors mention small audit
firms as an indicator of lower audit quality (ranking #5) and do so more frequently than do
auditors (ranking #10). This result stems primarily from concerns that if an audit firm is too
small, it can be ‘tricked’ by an unscrupulous client’s complex accounting; in fact, several of the
survey responses mentioned the Bernie Madoff fraud by name, a situation involving a very small

38
accounting firm. Second, Panel B indicates that not only do investors view frequent auditor
turnover as an indicator of low audit quality (ranking #3), they also view excessively infrequent
turnover as a problem (ranking #7); we note that while audit professionals share the concern
about frequent turnover, they do not view infrequent turnover as an indicator of low audit
quality. Therefore, investors are wary of auditors changing too frequently, but also too
infrequently. Collectively, our results could be interpreted as being supportive of recent changes
proposed in the U.K. that do not call for mandatory rotation but rather regular retendering
(Reuters 2013).
VIII. SUPPLEMENTAL ANALYSIS
Factor Analysis
We utilize factor analysis to provide support for our grouping of the survey questions
posed in Tables 4, 5, and 6 as well as to identify the underlying dimensions of audit quality
examined in the survey. Due to the differences identified between auditors and investors, as well
as the fact that not all questions were posed to both groups, we run the factor analysis separately
by participant group. We perform the analysis using a principal component extraction method
with varimax rotation to identify orthogonal constructs with eigenvalues greater than 1.19 Results
are reported in Table 10.
<insert Table 10>
As reported in Table 10, Panel A, responses from 25 questions posed to auditors from
Tables 4, 5, and 6 reduce to 9 distinct factors of audit quality.20 Results generally support our
assigned groups; Factors 1, 2, 4, 7 and 8 are composed of questions grouped together in our
19 For a robustness check, we also perform the analysis using maximum likelihood extraction. This method also
identified 9 factors for auditors and 6 for investors. 20 These 9 factors explain 71 percent of the variance; only 4 of 25 questions had cross-loading greater than .35, in
which case we assigned the question based on its strongest factor loading.
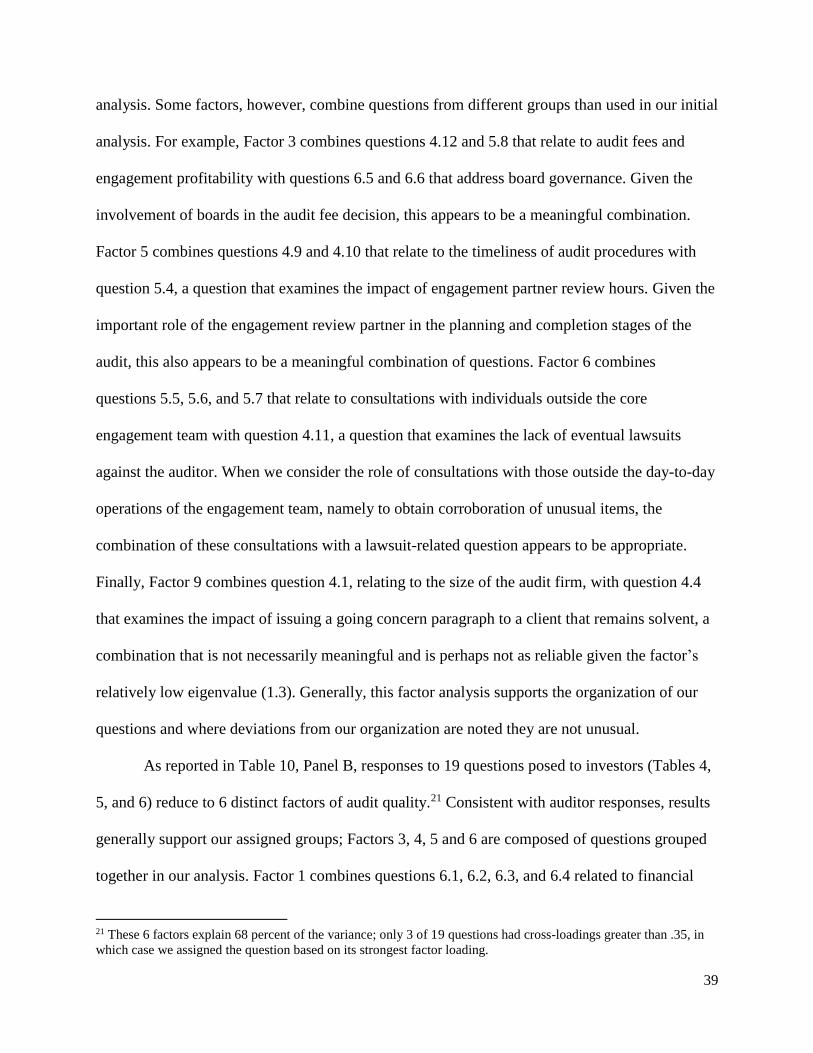
39
analysis. Some factors, however, combine questions from different groups than used in our initial
analysis. For example, Factor 3 combines questions 4.12 and 5.8 that relate to audit fees and
engagement profitability with questions 6.5 and 6.6 that address board governance. Given the
involvement of boards in the audit fee decision, this appears to be a meaningful combination.
Factor 5 combines questions 4.9 and 4.10 that relate to the timeliness of audit procedures with
question 5.4, a question that examines the impact of engagement partner review hours. Given the
important role of the engagement review partner in the planning and completion stages of the
audit, this also appears to be a meaningful combination of questions. Factor 6 combines
questions 5.5, 5.6, and 5.7 that relate to consultations with individuals outside the core
engagement team with question 4.11, a question that examines the lack of eventual lawsuits
against the auditor. When we consider the role of consultations with those outside the day-to-day
operations of the engagement team, namely to obtain corroboration of unusual items, the
combination of these consultations with a lawsuit-related question appears to be appropriate.
Finally, Factor 9 combines question 4.1, relating to the size of the audit firm, with question 4.4
that examines the impact of issuing a going concern paragraph to a client that remains solvent, a
combination that is not necessarily meaningful and is perhaps not as reliable given the factor’s
relatively low eigenvalue (1.3). Generally, this factor analysis supports the organization of our
questions and where deviations from our organization are noted they are not unusual.
As reported in Table 10, Panel B, responses to 19 questions posed to investors (Tables 4,
5, and 6) reduce to 6 distinct factors of audit quality.21 Consistent with auditor responses, results
generally support our assigned groups; Factors 3, 4, 5 and 6 are composed of questions grouped
together in our analysis. Factor 1 combines questions 6.1, 6.2, 6.3, and 6.4 related to financial
21 These 6 factors explain 68 percent of the variance; only 3 of 19 questions had cross-loadings greater than .35, in
which case we assigned the question based on its strongest factor loading.

40
statement outcomes with question 4.11 relating to a lack of litigation against the auditor. This
combination of questions appears logical considering all questions relate to ex-post outcomes.
Identical to Factor 3 in Panel A, Factor 2 in Panel B combines questions 4.12 and 5.8, which
relate to fees and profitability, with questions 6.5 and 6.6, which address board governance.
Taken together, the nine auditor-identified and six investor-identified factors provide a
concise summary of our analysis and provide a framework for a potential ‘balanced scorecard’
approach to evaluating audit quality (Franzel 2013). While the factors identified in our analysis
do not represent all facets of audit quality, they provide regulators, researchers and practitioners
with a starting point.
Investors with Accounting Backgrounds
According to Table 2, approximately 60 percent of our investor participants received an
undergraduate degree in accounting. As such, it is possible that these investor participants are
fundamentally similar to the auditor participants. In untabulated analysis, we examine responses
from only those investor participants with an undergraduate degree in accounting and compare
these responses to those of the participating auditors. In all cases but two, statistical inferences
are identical to those reported earlier using the full investor pool of participants.22 Based on this
analysis, investors with an undergraduate degree in accounting do not appear to respond like
auditors.
22 Specifically, the difference in responses between auditors and the accounting undergraduates to Question 6.3
change from insignificant (p = 0.16) to significant (p < 0.05), whereas responses to Question 6.6 change from
significant (p = 0.02) to marginally significant (p = 0.07). Further, using MANOVA we compare all responses
between investors with and without an undergraduate degree in accounting; results are not significantly different (F-
statistic 1.39, p = 0.16).

41
Family of Tests Concern
By necessity, each question is analyzed individually as each question is a different
dependent variable. However, the number of tests used possibly raises concerns about spurious
results. In an untabulated analysis, we use MANOVA on all 18 questions from Tables 4, 5, and 6
in which auditors’ and investors’ responses are compared. This analysis reports an F-statistic of
13.92 (p < 0.01), indicating that fundamental differences exist in responses between auditors and
investors, providing evidence that differences identified in individual questions are not spurious.
IX. CONCLUSION
Since the regulatory changes brought about by SOX and the creation of the PCAOB, the
definition, measurement, and composition of audit quality has been a subject of continuing
interest and debate. Due to its role as regulator of the audit market, a large portion of this debate
has focused around the PCAOB and its inspection reports. However, in order to create a well-
rounded view of audit quality, it is critical to obtain input from auditors and investors who are
involved in the audit process or who rely on financial statements affected by the audit process.
In this study we obtain and analyze responses from audit professionals and investors on
their views, definitions, and measures of audit quality. These participants have extensive
experience in their respective roles and their responses provide important insights into the
construct of audit quality. We find that audit professionals define audit quality primarily in terms
of compliance with professional standards, whereas investors rely more on the individual
attributes of the auditors and audit teams who perform the audit. Other definitions of audit
quality include an audit that results in financial statements consisting of accurate, reliable
information as evidenced by hindsight; a well-planned engagement that addresses the significant
risks of the company; and an engagement performed by independent, skeptical auditors.

42
In terms of engagement-specific characteristics of audit quality, we find that participants
perceive characteristics of the audit opinion, outcomes from the review process and the payment
of reasonable audit fees as pertinent factors in determining audit quality. When examining
characteristics that reside at the engagement team level, we find almost unanimous agreement
that individual auditor characteristics impact audit quality. Additionally, we find evidence that
input from outside the core audit team from parties such as the national office and engagement
review partners and subject matter experts is an important component of audit quality. We also
find evidence that entity-specific characteristics such as restatements, SEC enforcement actions,
and the frequency of committee meetings are significant attributes of audit quality. We further
find evidence of a negative impact of both estimation uncertainty and the misinterpretation of
PCAOB inspection reports on audit quality. Finally, we present evidence that professional
auditors and investors view the presence of a financial statement restatement as one of the
strongest publicly available indicators of low audit quality.
When evaluated together, our results present a comprehensive overview of auditors’ and
investors’ perceptions of audit quality. These results can inform the ongoing debate regarding the
definition, measurement, and composition of audit quality. Supplemental factor analysis
identifies distinct constructs related to audit quality, potentially laying the groundwork for a
balanced scorecard approach to evaluating audit quality. Additionally, survey results present
evidence supporting various archival proxies for audit quality including firm size, restatements
and, to a lesser extent, accruals. Our findings also add to the discussion of the value of PCAOB
reports and highlight a significant gap between the Board’s intent for Inspection Reports and
how they are viewed by audit professionals and the investing public. Finally, we add to recent
research examining point estimates with very large reasonable ranges by obtaining evidence that

43
auditors acknowledge the difficult situation in which they find themselves when an audit
encounters significant accounts with large and irreducible estimation uncertainty. These findings
represent a significant step forward in our understanding of the construct of audit quality in the
current regulatory environment.

44
REFERENCES
Abernathy, J.L., M. Barnes and C.M. Stefaniak. 2013. A Summary of 10 Years of PCAOB Research:
What Have We Learned? Working paper, Oklahoma State University.
Agoglia, C. P., J. F. Brazel, R. C. Hatfield and S. B. Jackson. 2010. How Do Audit Workpaper Reviewers
Cope with the Conflicting Pressures of Detecting Misstatements and Balancing Client Workloads?
Auditing: A Journal of Practice and Theory, 29(2): 27-43.
Balsam, S., J. Krishnan and J. S. Yang. 2003. Auditor Industry Specialization and Earnings Quality.
Auditing: A Journal of Practice and Theory, 22(2): 71-97.
Bedard, J. 1989. Expertise in Auditing: Myth or Reality. Accounting, Organizations and Society, 14(1/2):
113–132.
Bell, T. B. and J.B. Griffin. 2012. Commentary On Auditing High-Uncertainty Fair Value Estimates.
Auditing: A Journal of Practice and Theory, 31(1): 147-155.
Bonner, S.E. 1990. Experience Effects in Auditing: The Role of Task-Specific Knowledge. The
Accounting Review, 65(January): 72-92.
Brown, L.D., A.C. Call, M.B. Clement and N.Y. Sharp. 2013. Inside the “Black Box” of Sell-Side
Analysts. Working paper, Temple University, University of Georgia, University of Texas at Austin, and
Texas A&M University.
Cannon, N.H. and J.C. Bedard. 2013. Evidence from Auditors about Auditing Fair Value Measurements.
Working paper, Texas State University and Bentley University.
Carcello, J.V., R. H. Hermanson and N. T. McGrath. 1992. Audit Quality Attributes: The Perceptions of
Audit Partners, Preparers, and Financial Statement Users. Auditing: A Journal of Practice and Theory,
11(1): 1-15.
Carcello, J.V. and A.L. Nagy. 2004. Audit Firm Tenure and Fraudulent Financial Reporting. Auditing: A
Journal of Practice and Theory, 23(2): 55-69.
Carcello, J.V., C. Hollingsworth and S. A. Mastrolia. 2011. The Effect of PCAOB Inspections on Big 4
Audit Quality. Research in Accounting Regulation, 23: 85-96.
Christensen, B. E., S. M. Glover and D. A. Wood. 2012. Extreme Estimation Uncertainty in Fair Value
Estimates: Implications for Audit Assurance. Auditing: A Journal of Practice and Theory, 31(1): 127-146.
Christensen, B. E., S. M. Glover, T. C. Omer and M. K. Shelley. 2013a. Does Estimation Uncertainty
Affect Investors’ Preference For The Form Of Financial Statement Presentation? Working paper, Texas
A&M University, Brigham Young University and University of Nebraska-Lincoln.
Christensen, B. E., T.C. Omer, N.Y. Sharp and M.K. Shelley. 2013b. Pork Bellies and Public Company
Audits: Have Audits Once Again Become Just Another Commodity? Working paper, Texas A&M
University and University of Nebraska-Lincoln.

45
Church, B., S. Davis and S. McCracken. 2008. The Auditor’s Reporting Model: A Literature Overview
and Research Synthesis. Accounting Horizons, 22 (1): 69-90.
Church, B. K. and L. B. Shefchik. 2012. PCAOB Inspections and Large Accounting Firms. Accounting
Horizons, 26(March): 43-63.
Coram, P., J. Ng and D. Woodliff. 2003. A Survey of Time Budget Pressure and Reduced Audit Quality
Among Australian Auditors. Australian Accounting Review, 13: 38–44.
Davis, L. R., B.S. Soo and G.M. Trompeter. 2009. Auditor Tenure and the Ability to Meet or Beat
Earnings Forecasts. Contemporary Accounting Research, 26: 517–548
Dechow, P., W. Ge and C. Schrand. 2010. Understanding Earnings Quality: A Review of the Proxies,
Their Determinants and Their Consequences. Journal of Accounting and Economics, 50: 344-401.
Dechow, P., R.G. Sloan and A.P. Sweeney. 1996. Causes and Consequences of Earnings Manipulation:
An Analysis of Firms subject To Enforcement Actions by the SEC. Contemporary Accounting Research,
13(1): 1-36.
Defond, M.L. 2010. How Should the Auditors Be Audited? Comparing the PCAOB Inspections with the
AICPA Peer Reviews. Journal of Accounting and Economics, 49:104-108.
Dichev, I., J. Graham, C. R. Harvey and S. Rajgopal. 2013. Earnings Quality: Evidence from the Field.
Journal of Accounting and Economics, in press.
Duff, A. 2004. Auditqual: Dimensions of Audit Quality. The Institute of Chartered Accountants of
Scotland. Available at www.icas.org.uk/site/cms/download/res_duff_auditqual_Report.pdf.
Ernst & Young LLP. 2011. Summary of Ernst & Young LLP Views on PCAOB Concept Release on
Auditor Independence and Mandatory Firm Rotation. November, 2011.
Ettredge, M., C. Li and E. Emeigh. 2012. Fee Pressure and Audit Quality. Working Paper, University of
Kansas and University of Pittsburgh.
Fornelli, C. 2012. Speech Delivered At The PCAOB Public Meeting On Auditor Independence And
Audit Firm Rotation. The Center for Audit Quality. March 22, 2012.
Francis, J.R. 2011. A Framework for Understanding and Researching Audit Quality. Auditing: A Journal
of Practice and Theory, 30(2): 125-152.
Francis, J.R., E. Maydew and C. Sparks. 1999. The Role Of Big 6 Auditors In The Credible Reporting Of
Accruals. Auditing: Journal of Practice and Theory, 18(2): 17-34.
Francis, J.R. and M. Yu. 2009. Big 4 Office Size and Audit Quality. The Accounting Review, 84 (1):
1521-1552.
Francis, J. R., and P.N. Michas. 2012. The Contagion Effect of Low-Quality Audits. The Accounting
Review, 88(2): 521-552.

46
Franzel, J.M. 2013. Protecting Investors by Seizing the Opportunity to Strengthen Audit Quality. Speech
given to the American Accounting Association Midyear Conference and Doctoral Consortium. January
18, 2013.
Franzel, J.M. 2012. Driving Change to Achieve Independent and High Quality Audits. Keynote
address to the Baruch College Financial Reporting Conference, given May 3, 2012. Available at:
http://pcaobus.org/News/Speech/Pages/05032012_Baruch.aspx
Ghosh, A. and D. Moon. 2005. Auditor Tenure and Perceptions of Audit Quality. The Accounting
Review, 80(2): 585-612.
Glover, S. M, D. F. Prawitt and M. H. Taylor. 2009. Audit Standard Setting and Inspection For U.S.
Public Companies: A Critical Assessment and Recommendations for Fundamental Change. Accounting
Horizons, 23(2): 221-237.
Graham, L. and J. C. Bedard. 2003. Fraud Risk and Audit Planning. International Journal of Auditing, 7:
55–70.
Griffin, J.B. and D.N. Ricchiute. 2011. Concurrent Processing of Accounting Issues and Auditors’
Evidence-Evaluation Decisions. Working paper, University of Notre Dame.
Griffith, E., J. Hammersley and K. Kadous. 2013. Auditing Complex Estimates: Understanding the
Process Used and Problems Encountered. Working paper, University of Georgia and Emory University.
Hail, L. 2013. Financial Reporting and Firm Valuation: Relevance Lost or Relevance Regained?
Accounting and Business Research, 43(4): 329-358.
Hammersley, J. S. 2006. Pattern Identification and Industry-Specialist Auditors. The Accounting Review
(March): 309-336.
Hanson, J.D. 2013. Keynote Address to the Baruch College 12th Annual Financial Reporting Conference.
May 2, 2013.
Herrbach, H. 2001. Audit Quality, Auditor Behaviour and the Psychological Contract. European
Accounting Review, 10(4).
Hogan, C. E., Z. Rezaee, R.A. Riley Jr. and U.K. Velury. 2008. Financial Statement Fraud: Insights from
the Academic Literature. Auditing: A Journal of Practice and Theory, 27(2): 231-252.
Houston, R. 1999. The Effects of Fee Pressure and Client Risk on Audit Seniors' Time Budget Decisions.
Auditing: A Journal of Practice and Theory, 18(2): 70-86.
International Auditing and Assurance Standards Board. 2013. A Framework for Audit Quality. The
International Federation of Accountants.
Kim, J., R. Chung and M. Firth. 2003. Auditor Conservatism, Asymmetric Monitoring, and Earnings
Management. Contemporary Accounting Research, 20(2): 353-359.
47
Knechel, W. R., G.V. Krishnan, M.B Pevzner, L. Shefchik and U. Velury. 2013. Audit Quality: Insights
from the Academic Literature. Auditing: A Journal of Practice and Theory, 32(1): 385-421.
KPMG. 2011. Audit Quality Framework: Example Slides for Audit Committee Communications and
Discussions. October 2011.
Lambert, T.A., K.L. Jones and J.F. Brazel. 2011.Unintended Consequences of Accelerated Filings: Are
Mandatory Reductions in Audit Delay Associated with Reductions in Earnings Quality? Working paper,
University of Massachusetts-Amherst, George Mason University, and North Carolina State University.
Lennox, C. 1999. Are Large Auditors More Accurate Than Small Auditors? Accounting and Business
Research, 29(3): 217-227.
Lennox, C. and J. Pittman. 2010. Auditing the Auditors: Evidence on the Recent Reforms to the External
Monitoring Of Audit Firms. Journal of Accounting and Economics, 49:84-103.
López, D. M. and G.F. Peters. 2012. The Effect of Workload Compression on Audit Quality. Auditing: A
Journal of Practice and Theory, 31(4): 139-165.
Low, K. 2004. The Effects of Auditor Industry Specializations on Audit Risk Assessments and Audit
Planning Decisions. The Accounting Review, 79(1): 201-219.
Maijoor, S., A. Vanstraelen, T. J. Mock, H. T. Tan, M. Hasan, P. Roebuck, R. Simnett and H. Kirsch.
2002. The Determination and Communication of Levels of Assurance Other than High, International
Federation of Accountants, New York.
Menon, K. and D. Williams. 2010. Investor Reaction to Going Concern Audit Reports. The Accounting
Review, 85 (6): 2075-2105.
McDaniel, L. S. 1990. The Effects of Time Pressure and Audit Program Structure on Audit Performance.
Journal of Accounting Research, 267-285.
McEnroe, J. E. and S.C. Martens. 2001. Auditors' and Investors' Perceptions of the “Expectation Gap”.
Accounting Horizons, 15(4): 345-358.
Messier, W. Jr., S.M. Glover and D. Prawitt. 2010. Auditing & Assurance Services: A Systematic
Approach. 7th edition. New York, NY. McGraw-Hill Irwin.
Mock, T.J., J. Bedard, P. Coram, S. Davis, R. Espahbodi and R.C. Warne. 2012. The Auditor Reporting
Model: Current Research Synthesis and Implications. Auditing: A Journal of Practice and Theory, 32:
323-351.
Myers, J., L. Myers and T. Omer. 2003. Exploring the Term of the Auditor-Client Relationship and
Quality of Earnings: A Case for Mandatory Auditor Rotation? The Accounting Review, 78(3): 779-799.
Nelson, M. W., J. A. Elliott and R. L. Tarpley. 2002. Evidence from Auditors about Managers' and
Auditors' Earnings Management Decisions. The Accounting Review, Vol. 77(Supplement): 175-202.
48
Newton, N. J. 2013. Earnings Management Pressure on Audit Clients: Auditor Response to Analyst
Forecast Signals. Working Paper, University of Missouri.
Owhoso, V., W. Messier and J. Lynch. 2002. Error Detection by Industry-Specialized Teams during
Sequential Audit Review. Journal of Accounting Research, 40(3): 883-900.
Palmrose, Z. 1998. Audit Litigation Research: Do the Merits Matter? An Assessment and Directions for
future Research. Journal of Accounting and Public Policy, 16(4): 355-378.
Peecher, M. E., I. Solomon and K.T. Trotman. 2013. An Accountability Framework for Financial
Statement Auditors and Related Research Questions. Accounting, Organizations and Society, in press.
Pincus, K., W. H. Holder and T.J. Mock. 1988. Reducing the Incidence of Fraudulent Financial
Reporting: The Role of the Securities and Exchange Commission. Los Angeles: SEC and Financial
Reporting Institute of the University of Southern California.
PwC. 2013. Response to Provisional Findings and Remedies Notice from U.K. Statutory Audit Services
Market Investigation.
Public Company Accounting Oversight Board (PCAOB). 2004a. Auditing Standard No 2, An Audit of
Internal Control over Financial Reporting Performed in Conjunction with an Audit of Financial
Statements.
Public Company Accounting Oversight Board (PCAOB). 2004b. Auditing Standard No. 3, Audit
Documentation. PCAOB Release no. 2004-006.
Public Company Accounting Oversight Board (PCAOB). 2009. Auditing Standard No. 7, Engagement
Quality Review. PCAOB Release no. 2009-004.
Public Company Accounting Oversight Board (PCAOB). 2010a. Auditing Standard No 8, Audit Risk.
PCAOB Release no. 2010-004.
Public Company Accounting Oversight Board (PCAOB). 2010b. Auditing Standard No. 9, Audit
Planning. PCAOB Release no. 2010-004.
Public Company Accounting Oversight Board (PCAOB). 2012a. Strategic Plan: Improving Relevance
and Quality of the Audit for the Protection and Benefit of Investors, 2012-2016. November 30, 2012.
Public Company Accounting Oversight Board (PCAOB). 2012b. Information for Audit Committees about
the PCAOB Inspection Process. PCAOB Release no. 2012-003.
Public Company Accounting Oversight Board (PCAOB). 2012c. Auditing Standard No 16,
Communications with Audit Committees. PCAOB Release no. 2012-004.
Public Company Accounting Oversight Board (PCAOB). 2013. Standing Advisory Group Meeting
briefing paper, Audit Quality Indicators. May 15-16, 2013. Available at:
http://pcaobus.org/News/Events/Documents/05152013_SAGMeeting/Audit_Quality_Indicators.pdf.

49
Reuters. 2013. EU Lawmakers Seek Lighter Accounting Shake Up. March 12, 2013. Available at:
http://www.reuters.com/article/2013/03/12/eu-accounting-idUSL6N0C4CGY20130312.
Scholz, S. 2008. The Changing Nature and Consequences of Public Company Financial Restatements.
The US Department of the Treasury. Available at http://www.treasury.gov/press-center/press-
releases/Documents/FinancialRestatements_1997_2006.pdf.
Schroeder, M. S., I. Solomon and D. Vickery. 1986. Audit Quality: The Perceptions of Audit Committee
Chairperson and Audit Partners. Auditing: A Journal of Practice and Theory, 5(1): 86-94.
Securities and Exchange Commission (SEC). 2013. Financial Reporting Manual. Division of Corporation
Finance. Available at: http://www.sec.gov/divisions/corpfin/cffinancialreportingmanual.pdf.
Securities and Exchange Commission (SEC). 2011. Briefing Document on Measurement Uncertainty in
Financial Reporting: How Much to Recognize and How Best to Communicate It. Securities and Exchange
Commission’s Financial Reporting Series Roundtable Discussion. November 8, 2011. Available at:
http://www.sec.gov/about/offices/oca/ocafrseries-briefing-measurement.htm
Simunic, D. A. 1980. The Pricing of Audit Services: Theory and Evidence. Journal of Accounting
Research, 18:161-190.
Stanley, J. and F. DeZoort. 2007. Audit Firm Tenure And Financial Restatements: An Analysis Of
Industry Specialization And Fee Effects. Journal of Accounting and Public Policy, 26(2): 131-159.
Taylor, M. 2000. The Effects of Industry Specialization on Auditors' Inherent Risk Assessments and
Confidence Judgments. Contemporary Accounting Research, 17(4): 693-712.
The Center for Audit Quality. 2012. Audit Practice Meets Audit Research: CAQ Research Symposium.
The Center for Audit Quality. 2013. Audit Quality Reporting. August 2013. Available at:
http://www.thecaq.org/resources/pdfs/CAQResourceonAuditQualityReporting.pdf.
U.S. Department of the Treasury’s Advisory Committee on the Auditing Profession. 2008. Final Report
of the Advisory Committee on the Auditing Profession to the U.S. Department of the Treasury.
Van Linden, C. and M. Willekens. 2013. The Relationship between Human Resource Practices and Audit
Quality. Working paper, Katholieke Universiteit Leuven.
Weil, J. 2012. Other House Of Morgan Spawns A Web Of Scandals. Bloomberg, December 13, 2012.
Available at http://mobile.bloomberg.com/news/2012-12-13/other-house-of-morgan-spawns-a-web-of-
scandals.html.
White, Brian J. 2013. Do Investors Use Fair Value Disclosures? The Role of Investment Horizon.
Working paper, University of Texas at Austin.
Wright, S. and A. M. Wright. 1997. The Effect of Industry Experience on Hypothesis Generation and
Audit Planning Decisions. Behavioral Research in Accounting, 9: 273–294.

50
Table 1
Demographics—Audit Professionalsa
Title and Tenure
Partner: 73
Senior Manager: 17
Years in current position:
Partners: 11.1 years
Senior Managers: 3.3 years
Years in public accounting:
Partners: 23.4 years
Senior Managers: 11.3 years
Client Portfolio
Percent Publicly Traded: 67%
Industry Expertise
Retail/Wholesale: 22.2%
Mining/Construction: 5.5%
Manufacturing: 32.2%
Transportation/Energy: 17.7%
Communications/Media: 8.8%
Tech (Software/Biotech): 22.2%
Banking/Finance/Insurance: 32.2%
Service/Consulting: 11.1%
Healthcare/Pharmaceutical: 5.5%
Other: 8.8%
Education
Highest degree obtained
Bachelor’s degree: 80.0%
M.B.A: 13.8%
Non-M.B.A. Master’s degree: 6.2%
a Some percentages add to more than 100% because participants could select more than one option. Percentages are
based on the participants who completed the entire survey.

51
Table 2
Demographics—Investorsa
General
Age
<30 years old: 0%
31-40 years old: 15.2%
41-50 years old: 36.7%
51-60 years old: 40.5%
61-70 years old: 6.3%
>70 years old: 1.3%
Gender
Male: 65.4%
Female: 34.6%
Education
Bachelor’s in Accounting: 59.7%
Bachelor’s in Finance: 21.9%
Bachelor’s in Management: 2.4%
Master’s in Accounting: 13.4%
Master’s in Finance: 10.9%
Master’s in Other: 4.8%
MBA Finance: 6.1%
MBA Other: 8.5%
PhD: 4.8%
Employment
Work Experience: 23.8 years
Years at Current Job: 9.98 years
Industry
Retail/Wholesale: 2.4%
Mining/Construction: 7.3%
Manufacturing: 4.8%
Transportation/Energy: 12.2%
Communications/Media: 1.2%
Tech (Software/Biotech): 1.2%
Banking/Finance/Insurance: 10.9%
Service/Consulting: 13.4%
Public Accounting: 12.2%
Healthcare/Pharmaceutical: 2.4%
Education: 9.7%
Retired: 6.5%
Unemployed: 0%
Other: 15.8%
Investment Patterns
Read Business Press: mean response: 7.01
(from scale of 1-Never
to 11-Daily)
Reference to the audit report when making investment
decisions:
Always: 18.5%
Most of the time: 22.2%
Sometimes: 24.7%
Rarely: 22.2%
Never: 12.4%
Current/Future Investment Activity
Current Retirement Account: 93.9%
Current Mutual Funds: 86.6%
Current Stock: 84.1%
Current Bonds: 23.2%
Primary Investment Vehicles
Mutual funds: 85.4%
Individual stocks: 52.4%
Corporate bonds: 20.7%
Cash deposits: 29.2%
Money market funds: 41.5%
Derivatives: 12.2%
U.S. Treasury bonds: 10.9%
Other: 20.7%
Financial Statement Evaluation
The number of companies evaluated using financial
information in the past five years
0 companies evaluated: 11.1%
1-5 companies evaluated: 33.3%
6+ companies evaluated: 55.6%
Portfolio Value
Value less than $50,000: 6.7%
Value greater than $50,000: 93.3%
a Some percentages add to more than 100% because participants could select more than one option. Percentages are based on
the participants who completed the entire survey.

52
Table 3
Definitions and Measures of Audit Quality
Panel A: Audit Professional Responses
Auditor
Rank
Number of
References Auditor Top 5 Definitions Measures
Investor
Rank
1 31
Audit performed in accordance with
professional standard (GAAS), including
rigorous documentation, that obtains
reasonable assurance that financial
statements are not materially misstated
Results of
internal/external
inspection; lack of
restatements; auditor
expertise 4
2 25
An audit that results in financial statements
consisting of accurate, reliable information
that the investing public can rely upon as
evidenced by hindsight
Restatements, SEC
action in subsequent
years; auditor’s correct
identification of risks 4
3 15
A well-planned engagement that addresses
the significant risks of the company
Results of
internal/external
inspections; properly
supervised audit 2
4 14
The lack of errors identified in subsequent
review
Number of Part 1
PCAOB comments;
results from other
inspections 13
5 13
Having well-trained, competent auditors
(including specialists, where necessary)
perform at a high-level
Auditor experience;
inspection results;
number of audit hours
spent 1
Panel B: Investor Responses
Investor
Rank
Number of
References Investor Top 5 Definitions Measures
Auditor
Rank
1 18
Having well-trained, competent auditors
(including specialists, where necessary)
perform at a high-level
Auditor experience;
inspection results; size
of audit firm 5
2 8
A well-planned engagement that addresses the
significant risks of the company
Complexity of client’s
industry; all material
balances in scope 3
3 6 Performed by independent, skeptical auditors
Non-audit fees;
auditor rotation 6
T4 4
Audit performed in accordance with
professional standard (GAAS), including
rigorous documentation, that obtains
reasonable assurance that financial statements
are not materially misstated
Auditor expertise;
staff training; results
from external
inspections 1
T4 4
An audit that results in financial statements
consisting of accurate, reliable information
that the investing public can rely upon as
evidenced by hindsight
Subsequent SEC
actions and
restatements 2

53
Table 4
Examining the Attributes of Audit Quality: Characteristics of the Audit Engagement
For each statement below, how is the quality of a specific audit engagement impacted by…:
Auditors Investors ANOVA
Question Attribute
…higher
audit
quality
(7-11)
…no
association
with audit
quality (6)
…lower
audit
quality
(1-5)
Average
scorea
…higher
audit
quality
(7-11)
…no
association
with audit
quality (6)
…lower
audit
quality
(1-5)
Average
scorea
Auditor
mean vs.
Investor
meanb
Category: Audit Firm Size
4.1
…the entity being audited by a U.S.
audit firm with a strong global
network?
94.6% 5.4% 0% 9.40***
N=92 67.6% 22.5% 9.8%
7.47***
N=102
p < 0.01
F = 64.46
Category: The Audit Report
4.2
…the audited entity receiving an
unqualified opinion? 30.1% 69.9% 0%
6.82***
N=93 50.0% 43.2% 6.8%
7.28***
N=102
p = 0.06
F = 3.56
4.3
…issuing a clean audit opinion if the
audited entity files for bankruptcy
within the subsequent 12 months?
12.2% 43.3% 44.4% 5.43***
N=92 6.9% 23.5% 69.6%
4.00***
N=102
p < 0.01
F = 24.84
4.4
…adding a going concern paragraph
to the audit opinion when the audited
entity does not file for bankruptcy
within the subsequent 12 months?
39.8% 59.1% 1.1% 6.94***
N=93 53.0% 34.3% 12.7%
7.08***
N= 102
p = 0.60
F = 0.27
Category: Review and Inspection Results
4.5
…fewer audit deficiencies identified
during real-time internal quality
review?
79.5% 19.4% 1.1% 8.33***
N=93
4.6
…the internal quality reviewers
identifying fewer deficiencies for the
engagement?
70.9% 26.9% 2.2% 7.97***
N=93 70.7% 16.6% 12.7%
7.48***
N=102
p = 0.06
F = 3.55
4.7
…the peer-review firm identifying
fewer deficiencies for the
engagement?
75.3% 21.5% 3.2% 8.12***
N=93 78.2% 12.9% 8.9%
8.05***
N=101
p = 0.79
F = 0.07
4.8
…the PCAOB inspectors generating
fewer matter sheets (deficiencies) for
the engagement?
75.3% 24.7% 0.0% 8.15***
N=93 65.4% 21.8% 12.8%
7.52***
N=101
p = 0.02
F = 5.15

54
Table 4 <Continued>
Category: Timeliness of Procedures
Auditors Investors ANOVA
4.9
…the timeliness of completing audit
planning procedures?
94.6% 5.4% 0.0% 8.74***
N=92
4.10
…the timeliness of completing audit
fieldwork?
89.3% 7.5% 3.2%
8.85***
N=93
Category: Other
4.11
…the lack of eventual lawsuits filed
due to the work performed to support
an audit opinion?
30.2% 63.4% 6.4% 6.60***
N=93 49.0% 39.0% 12.0%
6.86***
N=100
p = 0.33
F = 0.93
4.12
…the payment of reasonable audit
fees to the auditor? 72.0% 22.6% 5.4%
7.78***
N=93 52.9% 36.3% 10.8%
7.17***
N=102
p = 0.04
F = 4.26
a Mean values are tested against the scale’s midpoint of 6. ***, ** and * indicate the mean is statistically different from the midpoint at p < 0.01, p < 0.05 and p <
0.10 respectively. b Results from a one-way ANOVA comparing the mean values of each question across Auditors and Investors. In situations where the question was not asked to
both groups, the appropriate boxes are blacked out.

55
Table 5
Examining the Attributes of Audit Quality: Resources Available for the Audit Team
For each statement below, how is the quality of a specific audit engagement impacted by…:
Auditors Investors ANOVA
Question Attribute
…higher
audit
quality (7-
11)
…no
association
with audit
quality (6)
…lower
audit
quality
(1-5)
Average
scorea
…higher
audit
quality
(7-11)
…no
association
with audit
quality (6)
…lower
audit
quality
(1-5)
Average
scorea
Auditor
mean vs.
Investor
meanb
Category: Engagement Team Qualifications
5.1
. . . the sufficiency of
engagement team staffing?
100.0% 0.0% 0.0% 10.02***
N=93 91.2% 6.9% 1.9%
8.80***
N=102
p < 0.01
F =
38.03
5.2
…having well-trained
auditors on the engagement
team?
100.0% 0.0% 0.0% 10.14***
N=93 100.0% 0.0% 0.0%
9.66***
N=102
p < 0.01
F =
10.72
5.3
…having auditors on the
engagement team with the
appropriate expertise (e.g.,
industry expertise, experience
in specific transactions,
forensics, etc.)?
100.0% 0.0% 0.0% 9.82***
N=93 100.0% 0.0% 0.0%
9.88***
N=102
p = 0.67
F = 0.18
Category: Consultations and Other
5.4
…the number of hours billed
by engagement review
partners?
78.4% 19.4% 2.2% 7.63***
N=93
5.5
…the number of consultations
with the national office? 69.9% 25.8% 4.3%
7.14***
N=93
5.6
…the number of consultations
with external experts? 59.1% 35.5% 5.4%
6.77***
N=93
5.7
…the number of consultations
with internal specialists? 82.9% 16.1% 1.0%
7.68***
N=93
5.8
…achieving expected levels
of engagement profitability? 25.0% 65.2% 9.8%
6.23
N=92 20.6% 53.9% 25.5%
5.88
N=102
p = 0.12
F = 2.40
a Mean values are tested against the scale’s midpoint of 6. ***, ** and * indicate the mean is statistically different from the midpoint at p < 0.01, p < 0.05 and p <
0.10 respectively. b Results from a one-way ANOVA comparing the mean values of each question across Auditors and Investors. In situations where the question was not asked to
both groups, the appropriate boxes are blacked out.

56
Table 6
Examining the Attributes of Audit Quality: Characteristics of the Audited Entity
For each statement below, how is the quality of a specific audit engagement impacted by…:
Auditors Investors ANOVA
Question Attribute
…higher
audit
quality
(7-11)
…no
association
with audit
quality (6)
…lower
audit
quality
(1-5)
Average
scorea
…higher
audit
quality
(7-11)
…no
association
with audit
quality (6)
…lower
audit
quality
(1-5)
Average
scorea
Auditor
mean vs.
Investor
meanb
Category: Accruals
6.1
…the audited entity’s historical
conservatism reflected in
recording reserves (compared to
industry peers)?
54.8% 37.6% 7.5% 6.89***
N=93 39.6% 51.5% 8.9%
6.62***
N=101
p = 0.19
F = 1.69
Category: Subsequent Outcomes
6.2
…the lack of financial statement
restatements by the audited entity
related to the period in question?
75.3% 23.7% 1.0% 7.87***
N=93 62.8% 29.4% 7.8%
7.32***
N=102
p = 0.03
F = 5.00
6.3
…the lack of SEC enforcement
actions against the audited entity
for reporting or disclosure
deficiencies related to the period
in question?
70.9% 26.9% 2.2% 7.66***
N=93 62.7% 26.5% 10.8%
7.26***
N=102
p = 0.16
F = 2.00
6.4
…the lack of subsequent
discovery of significant
accounting fraud and/or
misrepresentation in the audited
financial statements
62.8% 25.5% 11.7%
7.30***
N=102
Category: Committee Meetings
6.5
…the number of formally
planned audit committee
meetings per year?
78.2% 18.5% 3.3% 7.65***
N=92 31.3% 56.9% 11.8%
6.19
N=102
p < 0.01
F = 40.60
6.6
…the number of formally
planned board of directors
meetings per year?
40.8% 53.8% 5.4% 6.58***
N=93 57.8% 35.3% 6.9%
7.11***
N=102
p = 0.02
F = 5.50
a Mean values are tested against the scale’s midpoint of 6. ***, ** and * indicate the mean is statistically different from the midpoint at p < 0.01, p < 0.05 and p <
0.10 respectively. b Results from a one-way ANOVA comparing the mean values of each question across Auditors and Investors. In situations where the question was not asked to
both groups, the appropriate boxes are blacked out.

57
Table 7
Examining the Association between PCAOB Reports and Firm-Wide Audit Quality
To what extent is the quality of an audit firm as a whole related to…
Auditors Investors ANOVA
…higher
audit
quality
(7-11)
…no
association
with audit
quality (6)
…lower
audit
quality
(1-5)
Average
scorea
…higher
audit
quality
(7-11)
…no
association
with audit
quality (6)
…lower
audit
quality
(1-5)
Average
scorea
Auditor
mean vs.
Investor
meanb
...having fewer total audit
deficiencies noted in PCAOB
publicly-released inspection reports
related to the audit firm’s audit work?
64.5%
29.0%
6.5%
6.99***
N=93
88.1%
10.9%
1.0%
7.90***
N=101
p < 0.01
F = 19.22
a Mean values are tested against the scale’s midpoint of 6. ***, ** and * indicate the mean is statistically different from the midpoint at p < 0.01, p < 0.05 and p <
0.10 respectively. b Results from a one-way ANOVA comparing the mean values of each question across Auditors and Investors. In situations where the question was not asked to
both groups, the appropriate boxes are blacked out.

58
Table 8
Examining the Impact of Estimation Uncertainty on Audit Quality
To what extent does the size of the reasonable range and the number of estimates with significant estimation
uncertainty affect the auditor’s ability to achieve the desired level of assurance for those estimates and the related
financial statements?
Auditors Investors ANOVA
Significantly
(7-11)
Moderately
(6)
Not
at All
(1-5)
Average
scorea
Significantly
(7-11)
Moderately
(6)
Not
at
All
(1-
5)
Average
scorea
Auditor
mean
vs.
Investor
meanb
75.0% 13.0% 12.0% 7.73***N=92 80.6% 13.3% 6.1% 8.15***
N=98
p = 0.14
F = 2.14
a Mean values are tested against the scale’s midpoint of 6. ***, ** and * indicate the mean is statistically different
from the midpoint at p < 0.01, p < 0.05 and p < 0.10 respectively. b Results from a one-way ANOVA comparing the mean values of each question across Auditors and Investors.
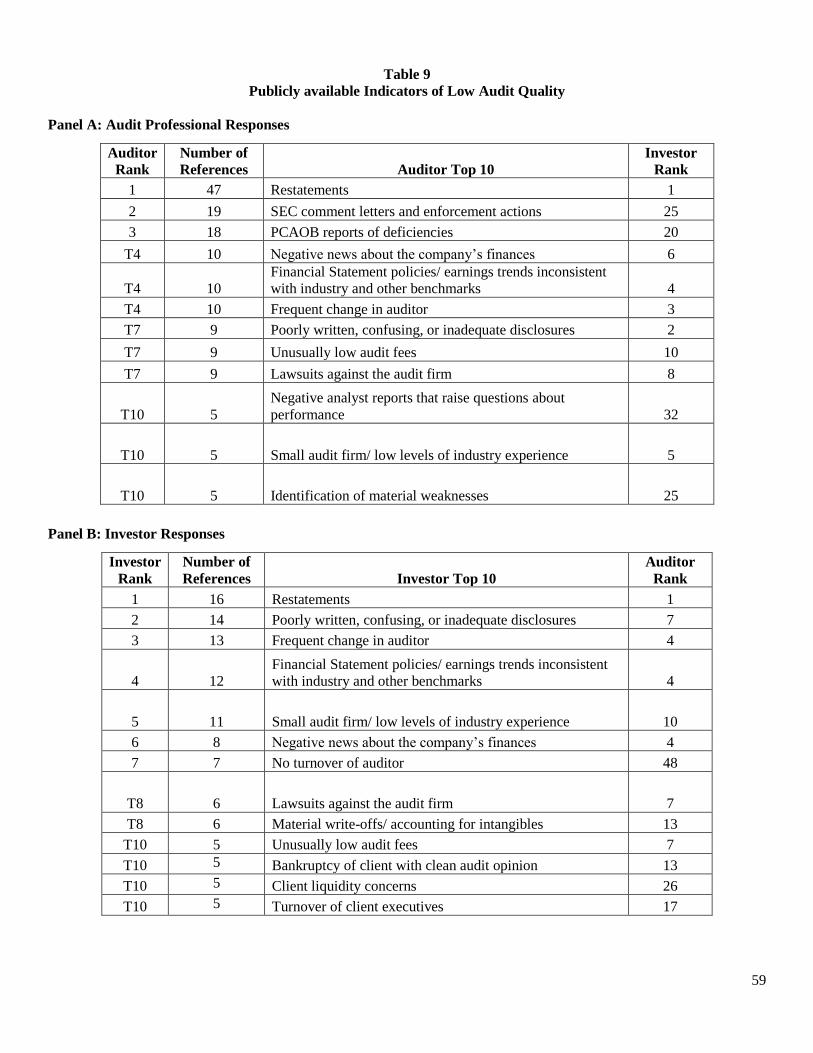
59
Table 9
Publicly available Indicators of Low Audit Quality
Panel A: Audit Professional Responses
Auditor
Rank
Number of
References Auditor Top 10
Investor
Rank
1 47 Restatements 1
2 19 SEC comment letters and enforcement actions 25
3 18 PCAOB reports of deficiencies 20
T4 10 Negative news about the company’s finances 6
T4 10
Financial Statement policies/ earnings trends inconsistent
with industry and other benchmarks 4
T4 10 Frequent change in auditor 3
T7 9 Poorly written, confusing, or inadequate disclosures 2
T7 9 Unusually low audit fees 10
T7 9 Lawsuits against the audit firm 8
T10 5
Negative analyst reports that raise questions about
performance 32
T10 5 Small audit firm/ low levels of industry experience 5
T10 5 Identification of material weaknesses 25
Panel B: Investor Responses
Investor
Rank
Number of
References Investor Top 10
Auditor
Rank
1 16 Restatements 1
2 14 Poorly written, confusing, or inadequate disclosures 7
3 13 Frequent change in auditor 4
4 12
Financial Statement policies/ earnings trends inconsistent
with industry and other benchmarks 4
5 11 Small audit firm/ low levels of industry experience 10
6 8 Negative news about the company’s finances 4
7 7 No turnover of auditor 48
T8 6 Lawsuits against the audit firm 7
T8 6 Material write-offs/ accounting for intangibles 13
T10 5 Unusually low audit fees 7
T10 5 Bankruptcy of client with clean audit opinion 13
T10 5 Client liquidity concerns 26
T10 5 Turnover of client executives 17
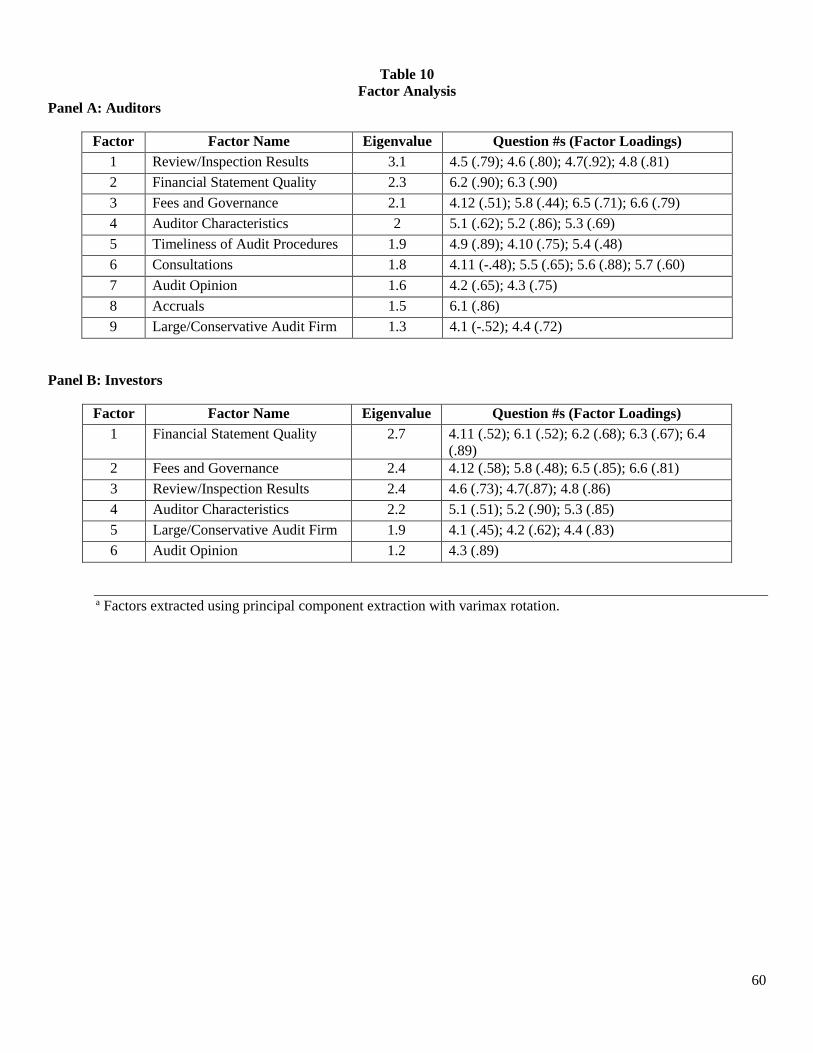
60
Table 10
Factor Analysis
Panel A: Auditors
Factor Factor Name Eigenvalue Question #s (Factor Loadings)
1 Review/Inspection Results 3.1 4.5 (.79); 4.6 (.80); 4.7(.92); 4.8 (.81)
2 Financial Statement Quality 2.3 6.2 (.90); 6.3 (.90)
3 Fees and Governance 2.1 4.12 (.51); 5.8 (.44); 6.5 (.71); 6.6 (.79)
4 Auditor Characteristics 2 5.1 (.62); 5.2 (.86); 5.3 (.69)
5 Timeliness of Audit Procedures 1.9 4.9 (.89); 4.10 (.75); 5.4 (.48)
6 Consultations 1.8 4.11 (-.48); 5.5 (.65); 5.6 (.88); 5.7 (.60)
7 Audit Opinion 1.6 4.2 (.65); 4.3 (.75)
8 Accruals 1.5 6.1 (.86)
9 Large/Conservative Audit Firm 1.3 4.1 (-.52); 4.4 (.72)
Panel B: Investors
Factor Factor Name Eigenvalue Question #s (Factor Loadings)
1 Financial Statement Quality 2.7 4.11 (.52); 6.1 (.52); 6.2 (.68); 6.3 (.67); 6.4
(.89)
2 Fees and Governance 2.4 4.12 (.58); 5.8 (.48); 6.5 (.85); 6.6 (.81)
3 Review/Inspection Results 2.4 4.6 (.73); 4.7(.87); 4.8 (.86)
4 Auditor Characteristics 2.2 5.1 (.51); 5.2 (.90); 5.3 (.85)
5 Large/Conservative Audit Firm 1.9 4.1 (.45); 4.2 (.62); 4.4 (.83)
6 Audit Opinion 1.2 4.3 (.89)
a Factors extracted using principal component extraction with varimax rotation.