school report - toronto catholic district school board · pdf fileschool report stella maris...
TRANSCRIPT

I am pleased to provide you with this report on the Assessments of Reading, Writing and Mathematics, Primary Division (Grades 1–3) and Junior Division (Grades 4–6), 2007–2008. Included are student results for the current and previous years. To put these results in context, this report also provides information about the assessed student populations.
Across the province, EQAO data have helped inform teaching practices and continue to serve as a catalyst for improving student achievement. This report is intended to help you foster constructive conversations about improving student achievement and assist you in the planning of educational strategies.
Every student deserves the best outcome from the public education system. That is why, with the guidance of Ontario educators, EQAO continues to design assessments that are directly based on curriculum expectations. These assessments not only ensure that Ontario students’ achievement is measured at key stages in their education, they also assure people that all students are assessed against a common benchmark.
Large-scale testing results are just one of the many tools that support student learning. These results are a snapshot of achievement and should be considered alongside school-based information. Regular assessments conducted in the classroom remain the fundamental method of assessing and supporting students throughout their education.
I trust that this report will help parents, educators and all who are committed to a strong public education system work together so that all students achieve to the best of their abilities.
Sincerely,
Marguerite JacksonChief Executive OfficerEducation Quality and Accountability Office
PERCENTAGE OF ALL STUDENTS AT OR ABOVE THEPROVINCIAL STANDARD (LEVELS 3 AND 4), 2007–2008
WHERE TO FIND . . . PAGEGrade 3 Grade 6
Percentages of all students at or above the provincial standard: · 2007–2008 .................................................................. 1 1· Over time .................................................................... 2 3
Tips for using this report ................................................................ 4 4
Contextual information: 2007–2008 ............................................... 5 9
Results for groups of students: 2007–2008· All students ............................................................... 6 10· Participating students .............................................. 7 11· Students by gender................................................... 8 12
Contextual information: Over time ............................................... 13 17
Results for all students: Over time ............................................... 14–16 18–20
Results for all students: Over time by gender.............................. 21 22
Student questionnaire results ....................................................... 23–26 27–30
Explanation of terms ...................................................................... 31 31
School: Stella Maris Sep S (859591)
Board: Toronto Catholic District School Board (67059)
Assessments of Reading, Writing and MathematicsPrimary Division (Grades 1–3) and Junior Division (Grades 4–6), 2007–2008
School Report
ProvinceBoardSchoolProvinceBoardSchoolProvinceBoardSchool
38
62 6151
70 6659
68 68
Reading Writing Mathematics
Grade 3
ProvinceBoardSchoolProvinceBoardSchoolProvinceBoardSchool
30
64 66
42
69 67
18
59 61
Reading Writing Mathematics
Grade 6
Stella Maris Sep S (859591)School Report
1 of 31September 17, 2008

Stella Maris Sep S (859591)School Report
RESULTS FOR ALL STUDENTS AT OR ABOVE THE PROVINCIAL STANDARD (LEVELS 3 AND 4) OVER TIME
Percentage of Students: Grade 3
2003–2004 2004–2005 2005–2006 2006–2007
Reading Writing Mathematics
SCHOOL
BOARD
PROVINCE
2007–2008
128 6606 305
39
2007–2008
131 0126 243
50
2006–2007
132 7826 501
45
2005–2006
135 7406 581
55
2004–2005
141 2457 059
63
2003–2004
ProvinceBoardSchool
Total Number of Grade 3 Students
3327
3340 38
44 40
6958
5143
27
58
40
59
63 6166 68 68
62 6370 69 70
53 5562 60 62
58 61 64 64 6654
59 62 62 61 64 66 68 69 68
2 of 31September 17, 2008

Stella Maris Sep S (859591)School Report
RESULTS FOR ALL STUDENTS AT OR ABOVE THE PROVINCIAL STANDARD (LEVELS 3 AND 4) OVER TIME
Percentage of Students: Grade 6
2003–2004 2004–2005 2005–2006 2006-2007
Reading Writing Mathematics
SCHOOL
BOARD
PROVINCE
2007-2008
140 4206 702
57
2007–2008
145 9017 061
55
2006–2007
146 7117 029
62
2005–2006
143 4216 858
60
2004–2005
146 1696 806
73
2003–2004
ProvinceBoardSchool
Total Number of Grade 6 Students
18
4231
44
30 29
45 4247
42
1527 29 31
18
57 54 58 58 5957 5865 64
6958 58 61 63 64
5459 61 61
6758
63 64 64 6657 60 61 59 61
3 of 31September 17, 2008

Stella Maris Sep S (859591)School Report
ABOUT THIS SCHOOL OR BOARD REPORTTIPS
Each school or board is unique. To appreciate the distinctive character of a school or board, look at the contextual information to understand the features and characteristics of the community it serves.
�
Every assessment captures the performance of students at one point in time each year. Consider the results along with other information about students’ achievement in reading, writing and mathematics.
�
Exercise caution when interpreting results for small schools or boards. Results may vary considerably from year to year, and differences may look exaggerated. For example, in a school of 20 students, a difference of 10% represents only two students.
�
Trends may be difficult to identify or to interpret. This is especially true in small schools or boards, or in schools where there is a high turnover in the student population.
�
EQAO values students’ privacy. Results are not reported publicly for schools where fewer than 15 students participated, because it might be possible to identify individual students.
This report shows how well students have met curriculum expectations to the end of the Primary Division and the end of the Junior Division. Students complete a set of test booklets that allow them to show what they have learned in reading, writing and mathematics. The assessments are based on The Ontario Curriculum.
This report includes¨ results for this year
¨ a comparison of results over the past four years to aid in monitoring improvement
¨ information about the characteristics of the students who participated
¨ summary graphs showing the percentage of students achieving the provincial standard in reading, writing and mathematics
¨ detailed tables and graphs showing results for all levels of achievement, results for gender and participation information
¨ student questionnaire results
¨ an explanation of all terms used in this report.
HOW TO USE THIS REPORT
¨ Examine the contextual information to understand the similarities and differences between the school, the board and the province; the board and the province. Consider the challenges that any differences might present.
¨ Examine the results for reading, writing and mathematics.
· Are these results consistent with what you would expect? · How do the school results compare to the board and the province; the board
results compare to the province?· How do these results compare over time?
· What influence might students’ attitudes have on student performance (refer
to the questionnaire results)?
¨ Speak to school or board staff about the goals for school improvement related to reading, writing and mathematics.
The Education Quality and Accountability Office is an independent agency that gathers information about student achievement through province-wide assessments. Each year, all Grade 3 and Grade 6 students across Ontario take part in these assessments of reading, writing and mathematics. Individual results are reported to students and to parents and guardians. School, board and provincial results are released publicly.
Learn more about us at www.eqao.com.
4 of 31September 17, 2008
Stella Maris Sep S (859591)School Report
Place of Birth
Assessments of Reading, Writing and Mathematics, Primary and Junior Divisions, 2007–2008
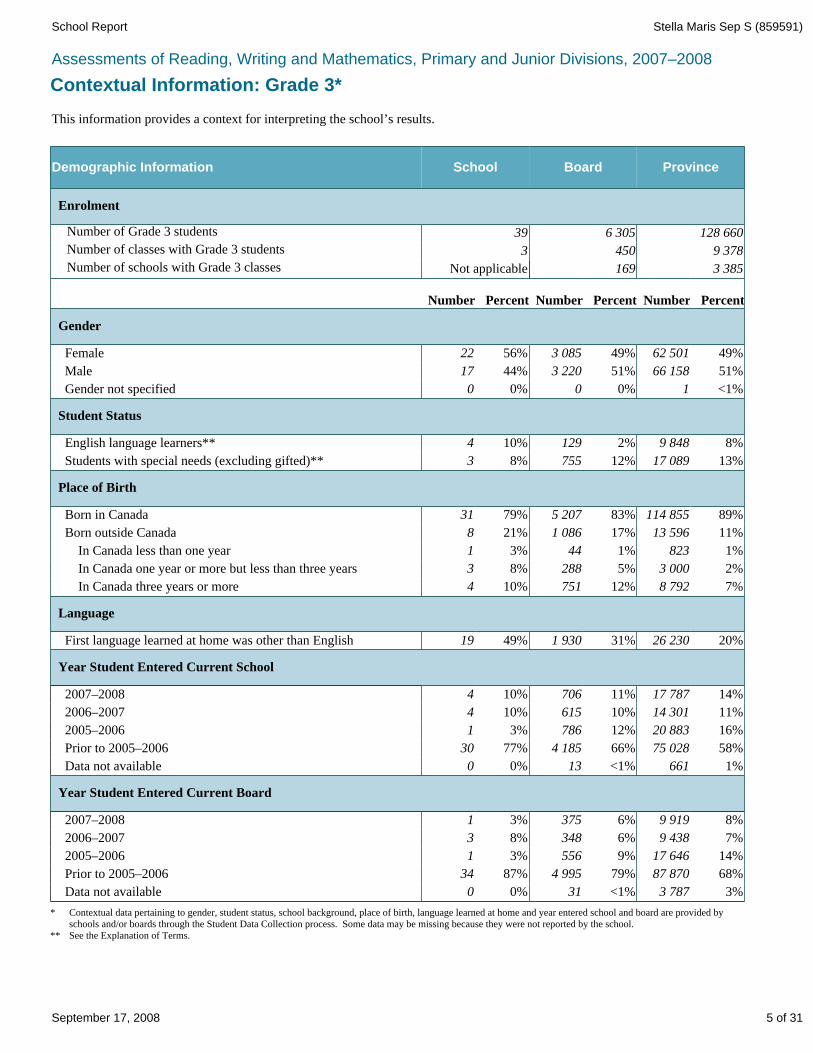
Contextual Information: Grade 3*
This information provides a context for interpreting the school’s results.
* Contextual data pertaining to gender, student status, school background, place of birth, language learned at home and year entered school and board are provided by schools and/or boards through the Student Data Collection process. Some data may be missing because they were not reported by the school.
** See the Explanation of Terms.
Demographic Information School Board Province
Enrolment
Number of Grade 3 students 39 6 305 128 660 Number of classes with Grade 3 students 3 450 9 378 Number of schools with Grade 3 classes Not applicable 169 3 385
Number Percent Number Percent Number Percent
Gender
Female 22 56% 3 085 49% 62 501 49%
Male 17 44% 3 220 51% 66 158 51%
Gender not specified 0 0% 0 0% 1 <1%
Student Status
English language learners** 4 10% 129 2% 9 848 8%
Students with special needs (excluding gifted)** 3 8% 755 12% 17 089 13%
Born outside Canada 8 21% 1 086 17% 13 596 11%
In Canada less than one year 1 3% 44 1% 823 1%
In Canada one year or more but less than three years 3 8% 288 5% 3 000 2%
In Canada three years or more 4 10% 751 12% 8 792 7%
Language
First language learned at home was other than English 19 49% 1 930 31% 26 230 20%
Born in Canada 31 79% 5 207 83% 114 855 89%
79% 87 870 68%87% Prior to 2005–2006 34 4 995
8% 348 6% 9 438 7%
3% 556 9% 17 646 14%
2006–2007 3
2005–2006 1
2005–2006 1
2006–2007
16%12%3%
11%10%10%
Prior to 2005–2006 77% 58%66%
14 3016154
20 883786
75 0284 18530
Year Student Entered Current School
14%10% 2007–2008 11% 17 7877064
Data not available 0% 1%<1% 661130
<1% 3 787 3%0% Data not available 0 31
Year Student Entered Current Board
8%6% 9 9193% 375 2007–2008 1
5 of 31September 17, 2008
Stella Maris Sep S (859591)School Report
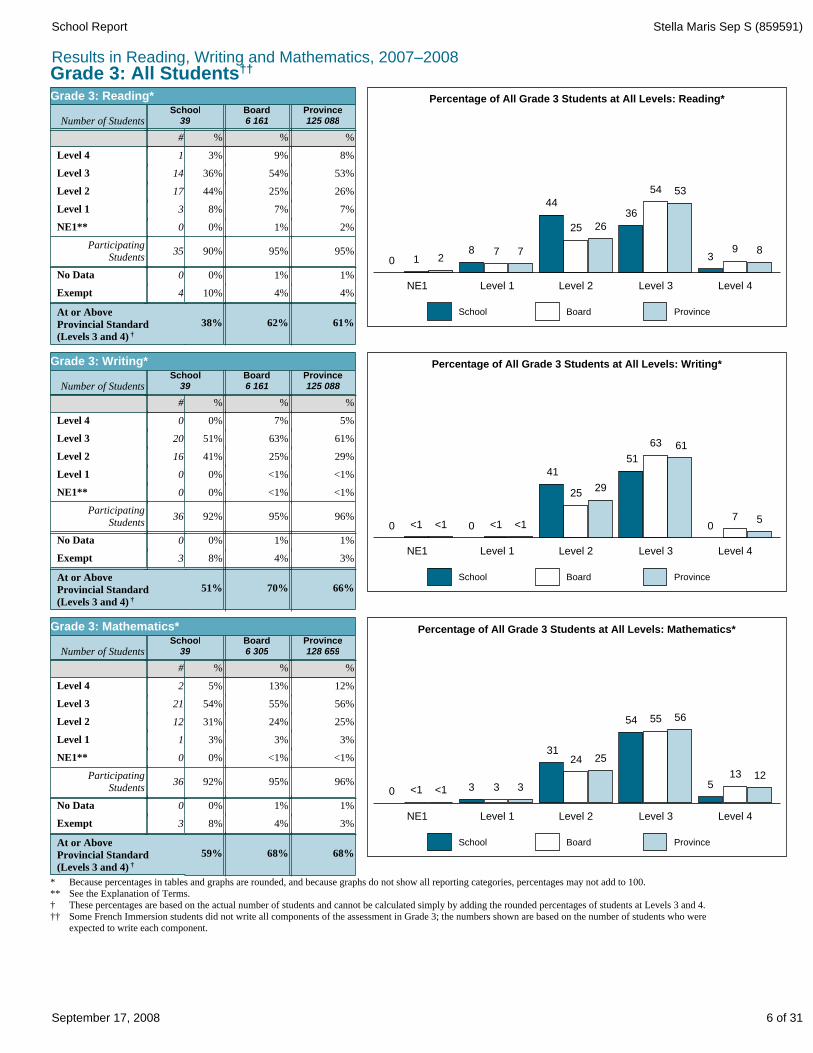
Results in Reading, Writing and Mathematics, 2007–2008Grade 3: All Students††
ProvinceBoardSchool
893
5354
362625
44
778210
Percentage of All Grade 3 Students at All Levels: Reading*
NE1 Level 1 Level 2 Level 3 Level 4
%%%#
Province125 088
Board6 161
School39Number of Students
61%
4%
1%
95%
2%
7%
26%
53%
8%
62%
4%
1%
95%
1%
7%
25%
54%
9%
38%
10%
0%
90%
0%
8%
44%
36%
3%
0
35
0
3
17
14
1
4 Exempt
No Data
ParticipatingStudents
NE1**
Level 1
Level 2
Level 3
Level 4
At or AboveProvincial Standard(Levels 3 and 4) †
Grade 3: Reading*
ProvinceBoardSchool
570
6163
51
2925
41
<1<10<1<10
Percentage of All Grade 3 Students at All Levels: Writing*
NE1 Level 1 Level 2 Level 3 Level 4
%%%#
Province125 088
Board6 161
School39Number of Students
66%
3%
1%
96%
<1%
<1%
29%
61%
5%
70%
4%
1%
95%
<1%
<1%
25%
63%
7%
51%
8%
0%
92%
0%
0%
41%
51%
0%
0
36
0
0
16
20
0
3 Exempt
No Data
ParticipatingStudents
NE1**
Level 1
Level 2
Level 3
Level 4
At or AboveProvincial Standard(Levels 3 and 4) †
Grade 3: Writing*
ProvinceBoardSchool
12135
565554
252431
333<1<10
Percentage of All Grade 3 Students at All Levels: Mathematics*
NE1 Level 1 Level 2 Level 3 Level 4
%%%#
Province128 659
Board6 305
School39Number of Students
68%
3%
1%
96%
<1%
3%
25%
56%
12%
68%
4%
1%
95%
<1%
3%
24%
55%
13%
59%
8%
0%
92%
0%
3%
31%
54%
5%
0
36
0
1
12
21
2
3 Exempt
No Data
ParticipatingStudents
NE1**
Level 1
Level 2
Level 3
Level 4
At or AboveProvincial Standard(Levels 3 and 4) †
Grade 3: Mathematics*
* Because percentages in tables and graphs are rounded, and because graphs do not show all reporting categories, percentages may not add to 100.** See the Explanation of Terms.† These percentages are based on the actual number of students and cannot be calculated simply by adding the rounded percentages of students at Levels 3 and 4.†† Some French Immersion students did not write all components of the assessment in Grade 3; the numbers shown are based on the number of students who were
expected to write each component.
6 of 31September 17, 2008

Stella Maris Sep S (859591)School Report
Results in Reading, Writing and Mathematics, 2007–2008
Grade 3: Participating Students (excludes “no data” and “exempt” categories)
ProvinceBoardSchool
893
5656
40
2727
49
779210
Percentage of Participating Grade 3 Students at All Levels: Reading*
NE1 Level 1 Level 2 Level 3 Level 4
%%%#
7%
27%
56%
8%
7%
27%
56%
9%
49%
40%
3
17
14
Level 1
Level 2
Level 3
64%65%43%
2%1%0%0 NE1**
At or AboveProvincial Standard(Levels 3 and 4) †
Province119 075
Board5 869
School35Number of Students
Grade 3: Reading*
9%3%1 Level 4
ProvinceBoardSchool
570
646656
3127
44
<1<10<1<10
Percentage of Participating Grade 3 Students at All Levels: Writing*
NE1 Level 1 Level 2 Level 3 Level 4
%%%#
<1%
31%
64%
5%
<1%
27%
66%
0%
44%
56%
0
16
20
Level 1
Level 2
Level 3
69%73%56%
<1%<1%0%0 NE1**
At or AboveProvincial Standard(Levels 3 and 4) †
Province119 623
Board5 872
School36Number of Students
Grade 3: Writing*
7%0%0 Level 4
ProvinceBoardSchool
12146
595758
262533
333<1<10
Percentage of Participating Grade 3 Students at All Levels: Mathematics*
NE1 Level 1 Level 2 Level 3 Level 4
%%%#
3%
26%
59%
12%
3%
25%
57%
3%
33%
58%
1
12
21
Level 1
Level 2
Level 3
71%72%64%
<1%<1%0%0 NE1**
At or AboveProvincial Standard(Levels 3 and 4) †
Province123 291
Board6 021
School36Number of Students
Grade 3: Mathematics*
14%6%2 Level 4
* Because percentages in tables and graphs are rounded, percentages may not add to 100.** See the Explanation of Terms.† These percentages are based on the actual number of students and cannot be calculated simply by adding the rounded percentages of students at Levels 3 and 4.
7 of 31September 17, 2008

Stella Maris Sep S (859591)School Report
Results in Reading, Writing and Mathematics, 2007–2008
Grade 3: Gender††
Percentage of All Grade 3 Studentsat or Above Provincial Standard: School†
Reading Writing Mathematics
32
47 45
59 5565
Female Male65%55%59%45%47%32%
53%
29%
0%14%0%14%0%18% Exempt
0%0%0%0%0%0% No Data
100%86%100%86%100%82%Participating
Students
0%0%0%0%0%0% NE1**
6%0%0%0%6%9% Level 1
32%41%41%47%41% Level 2
55%59%45%47%27% Level 3
12%0%0%0%0%5% Level 4
At or AboveProvincial Standard(Levels 3 and 4)†
Male17
Female22
Male17
Female22
Male17
Female22Number of Students
MathematicsWritingReading
Grade 3: School*
Percentage of All Grade 3 Studentsat or Above Provincial Standard: Board†
Reading Writing Mathematics
6857
77
6270 67
Female Male67%70%62%77%57%68%
53%
24%
5%3%5%3%5%3% Exempt
1%1%1%1%1%1% No Data
95%96%94%97%94%97%Participating
Students
<1%<1%<1%<1%2%1% NE1**
3%3%<1%<1%8%5% Level 1
24%31%19%28%23% Level 2
56%58%68%51%56% Level 3
14%13%4%9%6%12% Level 4
At or AboveProvincial Standard(Levels 3 and 4)†
Male3 220
Female3 085
Male3 163
Female2 998
Male3 163
Female2 998Number of Students
MathematicsWritingReading
Grade 3: Board*
Percentage of All Grade 3 Studentsat or Above Provincial Standard: Province†
Reading Writing Mathematics
68
55
74
5969 67
Female Male67%69%59%74%55%68%
55%
25%
4%2%4%2%5%3% Exempt
1%1%1%1%1%1% No Data
95%97%95%97%94%96%Participating
Students
<1%<1%<1%<1%2%1% NE1**
3%2%<1%<1%8%5% Level 1
25%35%23%29%22% Level 2
57%56%67%50%57% Level 3
12%11%3%7%5%11% Level 4
At or AboveProvincial Standard(Levels 3 and 4)†
Male66 157
Female62 501
Male64 642
Female60 445
Male64 642
Female60 445Number of Students
MathematicsWritingReading
Grade 3: Province*
* Because percentages in tables are rounded, percentages may not add to 100.** See the Explanation of Terms.† These percentages are based on the actual number of students and cannot be calculated simply by adding the rounded percentages of students at Levels 3 and 4.†† Results include only students for whom gender data were available.
8 of 31September 17, 2008

Stella Maris Sep S (859591)School Report
Place of Birth
Assessments of Reading, Writing and Mathematics, Primary and Junior Divisions, 2007–2008
Contextual Information: Grade 6*
This information provides a context for interpreting the school’s results.
* Contextual data pertaining to gender, student status, school background, place of birth, language learned at home and year entered school and board are provided by schools and/or boards through the Student Data Collection process. Some data may be missing because they were not reported by the school.
** See the Explanation of Terms.
Demographic Information School Board Province
Enrolment
Number of Grade 6 students 57 6 702 140 420 Number of classes with Grade 6 students 2 399 8 400 Number of schools with Grade 6 classes Not applicable 169 3 199
Number Percent Number Percent Number Percent
Gender
Female 21 37% 3 233 48% 68 266 49%
Male 36 63% 3 469 52% 72 154 51%
Gender not specified 0 0% 0 0% 0 0%
Student Status
English language learners** 6 11% 186 3% 6 639 5%
Students with special needs (excluding gifted)** 12 21% 1 161 17% 24 146 17%
Born outside Canada 10 18% 1 329 20% 17 139 12%
In Canada less than one year 3 5% 45 1% 781 1%
In Canada one year or more but less than three years 3 5% 289 4% 3 068 2%
In Canada three years or more 4 7% 992 15% 12 314 9%
Language
First language learned at home was other than English 40 70% 2 234 33% 27 589 20%
Born in Canada 47 82% 5 364 80% 123 090 88%
85% 96 018 68%86% Prior to 2005–2006 49 5 667
2% 284 4% 8 361 6%
4% 319 5% 12 632 9%
2006–2007 1
2005–2006 2
2005–2006 5
2006–2007
12%8%9%
10%8%2%
Prior to 2005–2006 75% 55%72%
13 7575601
16 422544
77 7514 82443
Year Student Entered Current School
23%14% 2007–2008 11% 31 8427628
Data not available 0% <1%<1% 648120
1% 6 014 4%0% Data not available 0 34
Year Student Entered Current Board
12%6% 17 3959% 398 2007–2008 5
9 of 31September 17, 2008
Stella Maris Sep S (859591)School Report
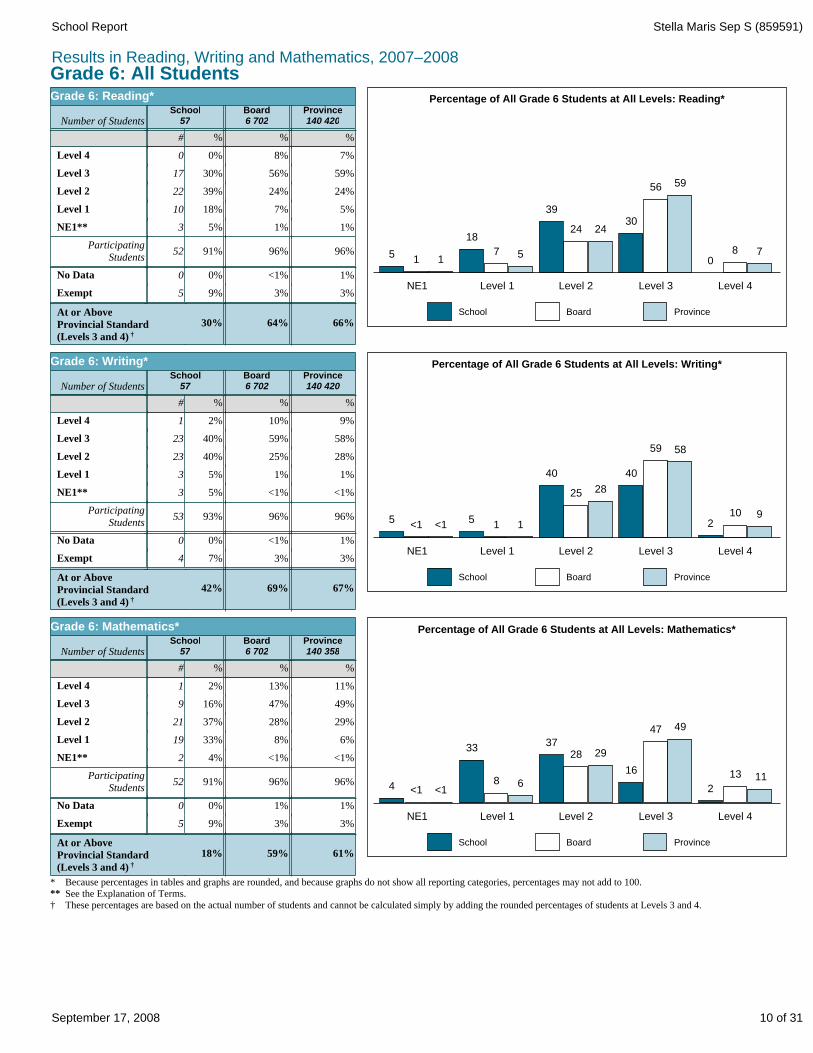
Results in Reading, Writing and Mathematics, 2007–2008Grade 6: All Students
ProvinceBoardSchool
780
5956
302424
39
57
18
115
Percentage of All Grade 6 Students at All Levels: Reading*
NE1 Level 1 Level 2 Level 3 Level 4
%%%#
Province140 420
Board6 702
School57Number of Students
66%
3%
1%
96%
1%
5%
24%
59%
7%
64%
3%
<1%
96%
1%
7%
24%
56%
8%
30%
9%
0%
91%
5%
18%
39%
30%
0%
0
52
3
10
22
17
0
5 Exempt
No Data
ParticipatingStudents
NE1**
Level 1
Level 2
Level 3
Level 4
At or AboveProvincial Standard(Levels 3 and 4) †
Grade 6: Reading*
ProvinceBoardSchool
9102
5859
40
2825
40
115<1<15
Percentage of All Grade 6 Students at All Levels: Writing*
NE1 Level 1 Level 2 Level 3 Level 4
%%%#
Province140 420
Board6 702
School57Number of Students
67%
3%
1%
96%
<1%
1%
28%
58%
9%
69%
3%
<1%
96%
<1%
1%
25%
59%
10%
42%
7%
0%
93%
5%
5%
40%
40%
2%
0
53
3
3
23
23
1
4 Exempt
No Data
ParticipatingStudents
NE1**
Level 1
Level 2
Level 3
Level 4
At or AboveProvincial Standard(Levels 3 and 4) †
Grade 6: Writing*
ProvinceBoardSchool
1113
2
4947
16
292837
68
33
<1<14
Percentage of All Grade 6 Students at All Levels: Mathematics*
NE1 Level 1 Level 2 Level 3 Level 4
%%%#
Province140 358
Board6 702
School57Number of Students
61%
3%
1%
96%
<1%
6%
29%
49%
11%
59%
3%
1%
96%
<1%
8%
28%
47%
13%
18%
9%
0%
91%
4%
33%
37%
16%
2%
0
52
2
19
21
9
1
5 Exempt
No Data
ParticipatingStudents
NE1**
Level 1
Level 2
Level 3
Level 4
At or AboveProvincial Standard(Levels 3 and 4) †
Grade 6: Mathematics*
* Because percentages in tables and graphs are rounded, and because graphs do not show all reporting categories, percentages may not add to 100.** See the Explanation of Terms.† These percentages are based on the actual number of students and cannot be calculated simply by adding the rounded percentages of students at Levels 3 and 4.
10 of 31September 17, 2008
Stella Maris Sep S (859591)School Report
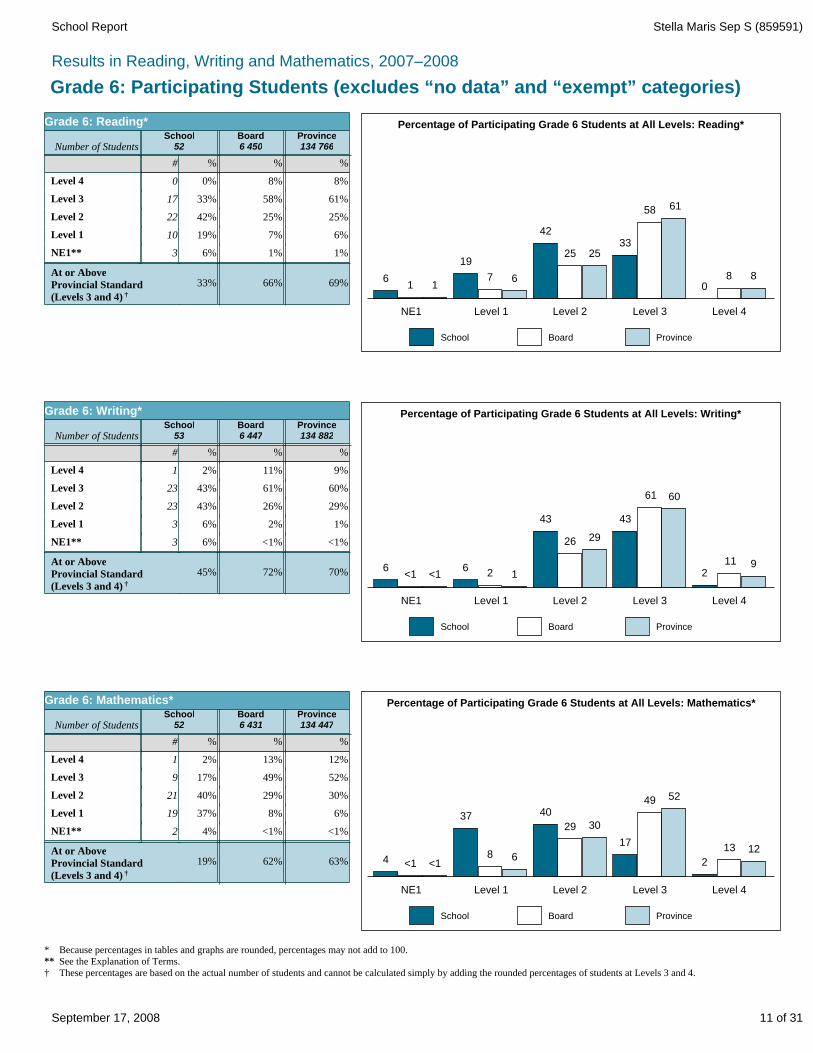
Results in Reading, Writing and Mathematics, 2007–2008
Grade 6: Participating Students (excludes “no data” and “exempt” categories)
ProvinceBoardSchool
880
6158
332525
42
67
19
116
Percentage of Participating Grade 6 Students at All Levels: Reading*
NE1 Level 1 Level 2 Level 3 Level 4
%%%#
6%
25%
61%
8%
7%
25%
58%
19%
42%
33%
10
22
17
Level 1
Level 2
Level 3
69%66%33%
1%1%6%3 NE1**
At or AboveProvincial Standard(Levels 3 and 4) †
Province134 766
Board6 450
School52Number of Students
Grade 6: Reading*
8%0%0 Level 4
ProvinceBoardSchool
9112
6061
43
2926
43
126<1<1
6
Percentage of Participating Grade 6 Students at All Levels: Writing*
NE1 Level 1 Level 2 Level 3 Level 4
%%%#
1%
29%
60%
9%
2%
26%
61%
6%
43%
43%
3
23
23
Level 1
Level 2
Level 3
70%72%45%
<1%<1%6%3 NE1**
At or AboveProvincial Standard(Levels 3 and 4) †
Province134 882
Board6 447
School53Number of Students
Grade 6: Writing*
11%2%1 Level 4
ProvinceBoardSchool
1213
2
5249
17
3029
40
68
37
<1<14
Percentage of Participating Grade 6 Students at All Levels: Mathematics*
NE1 Level 1 Level 2 Level 3 Level 4
%%%#
6%
30%
52%
12%
8%
29%
49%
37%
40%
17%
19
21
9
Level 1
Level 2
Level 3
63%62%19%
<1%<1%4%2 NE1**
At or AboveProvincial Standard(Levels 3 and 4) †
Province134 447
Board6 431
School52Number of Students
Grade 6: Mathematics*
13%2%1 Level 4
* Because percentages in tables and graphs are rounded, percentages may not add to 100.** See the Explanation of Terms.† These percentages are based on the actual number of students and cannot be calculated simply by adding the rounded percentages of students at Levels 3 and 4.
11 of 31September 17, 2008
Stella Maris Sep S (859591)School Report
Results in Reading, Writing and Mathematics, 2007–2008
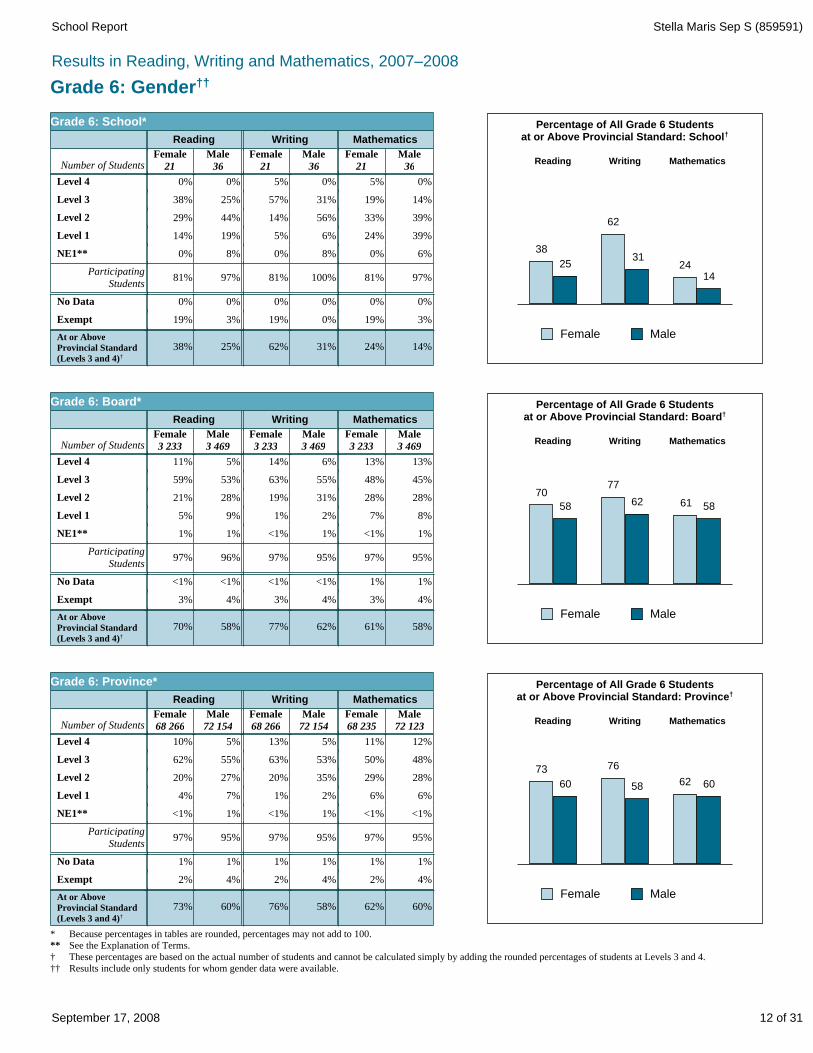
Grade 6: Gender††
Percentage of All Grade 6 Studentsat or Above Provincial Standard: School†
Reading Writing Mathematics
38
25
62
3124
14
Female Male14%24%31%62%25%38%
14%
39%
3%19%0%19%3%19% Exempt
0%0%0%0%0%0% No Data
97%81%100%81%97%81%Participating
Students
6%0%8%0%8%0% NE1**
39%24%6%5%19%14% Level 1
33%56%14%44%29% Level 2
19%31%57%25%38% Level 3
0%5%0%5%0%0% Level 4
At or AboveProvincial Standard(Levels 3 and 4)†
Male36
Female21
Male36
Female21
Male36
Female21Number of Students
MathematicsWritingReading
Grade 6: School*
Percentage of All Grade 6 Studentsat or Above Provincial Standard: Board†
Reading Writing Mathematics
70
58
77
62 61 58
Female Male58%61%62%77%58%70%
45%
28%
4%3%4%3%4%3% Exempt
1%1%<1%<1%<1%<1% No Data
95%97%95%97%96%97%Participating
Students
1%<1%1%<1%1%1% NE1**
8%7%2%1%9%5% Level 1
28%31%19%28%21% Level 2
48%55%63%53%59% Level 3
13%13%6%14%5%11% Level 4
At or AboveProvincial Standard(Levels 3 and 4)†
Male3 469
Female3 233
Male3 469
Female3 233
Male3 469
Female3 233Number of Students
MathematicsWritingReading
Grade 6: Board*
Percentage of All Grade 6 Studentsat or Above Provincial Standard: Province†
Reading Writing Mathematics
73
60
76
58 62 60
Female Male60%62%58%76%60%73%
48%
28%
4%2%4%2%4%2% Exempt
1%1%1%1%1%1% No Data
95%97%95%97%95%97%Participating
Students
<1%<1%1%<1%1%<1% NE1**
6%6%2%1%7%4% Level 1
29%35%20%27%20% Level 2
50%53%63%55%62% Level 3
12%11%5%13%5%10% Level 4
At or AboveProvincial Standard(Levels 3 and 4)†
Male72 123
Female68 235
Male72 154
Female68 266
Male72 154
Female68 266Number of Students
MathematicsWritingReading
Grade 6: Province*
* Because percentages in tables are rounded, percentages may not add to 100.** See the Explanation of Terms.† These percentages are based on the actual number of students and cannot be calculated simply by adding the rounded percentages of students at Levels 3 and 4.†† Results include only students for whom gender data were available.
12 of 31September 17, 2008

Stella Maris Sep S (859591)School Report
Data not collected††
2007–20082006–20072005–20062004–20052003–2004
This information provides a context for interpreting the school’s results over the past five years.
Contextual Information over Time: Grade 3*
Assessments of Reading, Writing and Mathematics, Primary and Junior Divisions, 2007–2008
* Contextual data pertaining to gender, student status, school background, place of birth and language learned at home are provided by schools and/or boards through the Student Data Collection process.
† Some French Immersion students did not write all components of the assessment in Grade 3; the numbers shown are based on the number of students who were expected to write each component.
** See the Explanation of Terms.†† The question related to student mobility changed in 2005–2006.
Male
3 or more years prior to the assessment
Year prior to the assessment
2 years prior to the assessment
In Canada less than one year
Born outside Canada
In Canada one year or more but less than three years
In Canada three years or more
Data not available
Writing†
Mathematics†
Enrolment
Number of students 63 55 45 50 39
Participation in the Assessment
87% 96% 98% 98% 92%
87% 96% 98% 98% 92%
Gender
Reading† 87% 96% 93% 98% 90%
52% 67% 47% 52% 44%
Female 48% 33% 53% 48% 56%
Student Status
English language learners** 13% 5% 2% 2% 10%
19% 9% 4% 14% 21%
2% 0% 0% 2% 3%
10% 5% 2% 4% 8%
8% 4% 2% 8% 10%
Language
First language learned at home was other than English 67% 62% 58% 64% 49%
Year Student Entered Current School
Year of the assessment
Grade 3
Students with special needs (excluding gifted)** 22% 16% 29% 12% 8%
Place of Birth
Born in Canada 81% 91% 96% 86% 79%
4%
4%
13%
78%
0%
4% 10%
6% 10%
6% 3%
84% 77%
0% 0%
13 of 31September 17, 2008
Stella Maris Sep S (859591)School Report
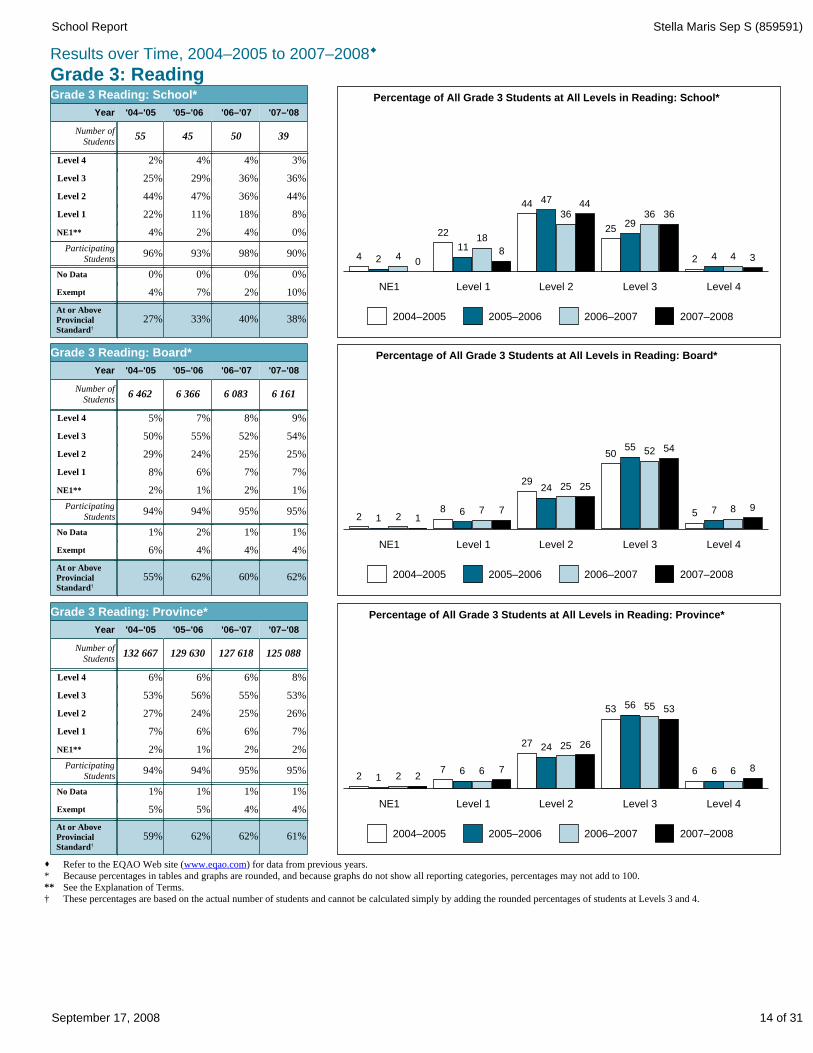
Grade 3: ReadingResults over Time, 2004–2005 to 2007–2008®
· Refer to the EQAO Web site (www.eqao.com) for data from previous years.* Because percentages in tables and graphs are rounded, and because graphs do not show all reporting categories, percentages may not add to 100.** See the Explanation of Terms.† These percentages are based on the actual number of students and cannot be calculated simply by adding the rounded percentages of students at Levels 3 and 4.
Percentage of All Grade 3 Students at All Levels in Reading: School*
NE1 Level 1 Level 2 Level 3 Level 4
4
2004–2005 2005–2006 2006–2007 2007–2008
2 40
22
1118
8
44 47
3644
2529
36 36
2 4 4 3
38%40%33%27%
10%2%7%4% Exempt
0%0%0%0% No Data
90%98%93%96%Participating X
StudentsX
0%4%2%4% NE1**
8%18%11%22% Level 1
44%36%47%44% Level 2
36%36%29%25% Level 3
3%4%4%2% Level 4
39504555Number of
Students
'07–'08'06–'07'05–'06'04–'05Year
Grade 3 Reading: School*
At or AboveProvincial Standard†
Percentage of All Grade 3 Students at All Levels in Reading: Board*
NE1 Level 1 Level 2 Level 3 Level 4
2
2004–2005 2005–2006 2006–2007 2007–2008
1 2 18 6 7 7
2924 25 25
5055 52 54
5 7 8 9
62%60%62%55%
4%4%4%6% Exempt
1%1%2%1% No Data
95%95%94%94%Participating X
StudentsX
1%2%1%2% NE1**
7%7%6%8% Level 1
25%25%24%29% Level 2
54%52%55%50% Level 3
9%8%7%5% Level 4
6 1616 0836 3666 462Number of
Students
'07–'08'06–'07'05–'06'04–'05Year
Grade 3 Reading: Board*
At or AboveProvincial Standard†
Percentage of All Grade 3 Students at All Levels in Reading: Province*
NE1 Level 1 Level 2 Level 3 Level 4
2
2004–2005 2005–2006 2006–2007 2007–2008
1 2 27 6 6 7
27 24 25 26
53 56 55 53
6 6 6 8
61%62%62%59%
4%4%5%5% Exempt
1%1%1%1% No Data
95%95%94%94%Participating X
StudentsX
2%2%1%2% NE1**
7%6%6%7% Level 1
26%25%24%27% Level 2
53%55%56%53% Level 3
8%6%6%6% Level 4
125 088127 618129 630132 667Number of
Students
'07–'08'06–'07'05–'06'04–'05Year
Grade 3 Reading: Province*
At or AboveProvincial Standard†
14 of 31September 17, 2008
Stella Maris Sep S (859591)School Report
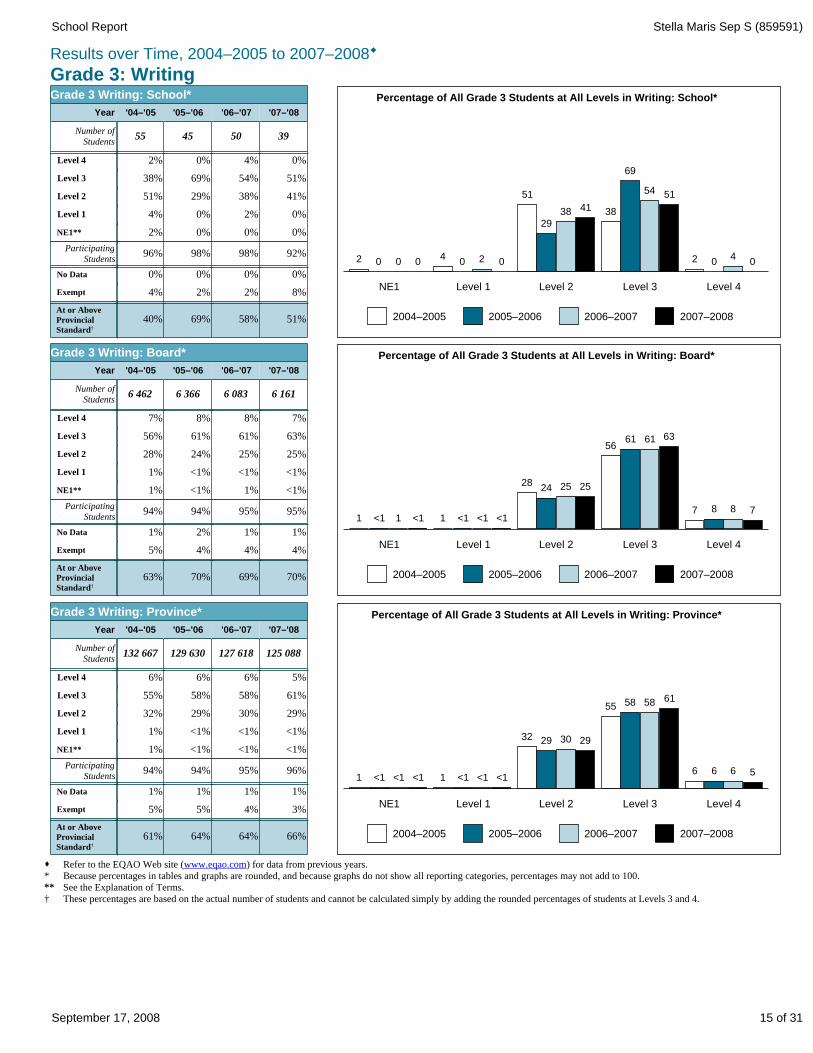
Grade 3: WritingResults over Time, 2004–2005 to 2007–2008®
· Refer to the EQAO Web site (www.eqao.com) for data from previous years.* Because percentages in tables and graphs are rounded, and because graphs do not show all reporting categories, percentages may not add to 100.** See the Explanation of Terms.† These percentages are based on the actual number of students and cannot be calculated simply by adding the rounded percentages of students at Levels 3 and 4.
Percentage of All Grade 3 Students at All Levels in Writing: School*
NE1 Level 1 Level 2 Level 3 Level 4
2
2004–2005 2005–2006 2006–2007 2007–2008
0 0 04
0 2 0
51
2938 41 38
69
54 51
2 04
0
51%58%69%40%
8%2%2%4% Exempt
0%0%0%0% No Data
92%98%98%96%Participating X
StudentsX
0%0%0%2% NE1**
0%2%0%4% Level 1
41%38%29%51% Level 2
51%54%69%38% Level 3
0%4%0%2% Level 4
39504555Number of
Students
'07–'08'06–'07'05–'06'04–'05Year
Grade 3 Writing: School*
At or AboveProvincial Standard†
Percentage of All Grade 3 Students at All Levels in Writing: Board*
NE1 Level 1 Level 2 Level 3 Level 4
1
2004–2005 2005–2006 2006–2007 2007–2008
<1 1 <1 1 <1 <1 <1
2824 25 25
5661 61 63
7 8 8 7
70%69%70%63%
4%4%4%5% Exempt
1%1%2%1% No Data
95%95%94%94%Participating X
StudentsX
<1%1%<1%1% NE1**
<1%<1%<1%1% Level 1
25%25%24%28% Level 2
63%61%61%56% Level 3
7%8%8%7% Level 4
6 1616 0836 3666 462Number of
Students
'07–'08'06–'07'05–'06'04–'05Year
Grade 3 Writing: Board*
At or AboveProvincial Standard†
Percentage of All Grade 3 Students at All Levels in Writing: Province*
NE1 Level 1 Level 2 Level 3 Level 4
1
2004–2005 2005–2006 2006–2007 2007–2008
<1 <1 <1 1 <1 <1 <1
32 29 30 29
55 58 58 61
6 6 6 5
66%64%64%61%
3%4%5%5% Exempt
1%1%1%1% No Data
96%95%94%94%Participating X
StudentsX
<1%<1%<1%1% NE1**
<1%<1%<1%1% Level 1
29%30%29%32% Level 2
61%58%58%55% Level 3
5%6%6%6% Level 4
125 088127 618129 630132 667Number of
Students
'07–'08'06–'07'05–'06'04–'05Year
Grade 3 Writing: Province*
At or AboveProvincial Standard†
15 of 31September 17, 2008
Stella Maris Sep S (859591)School Report
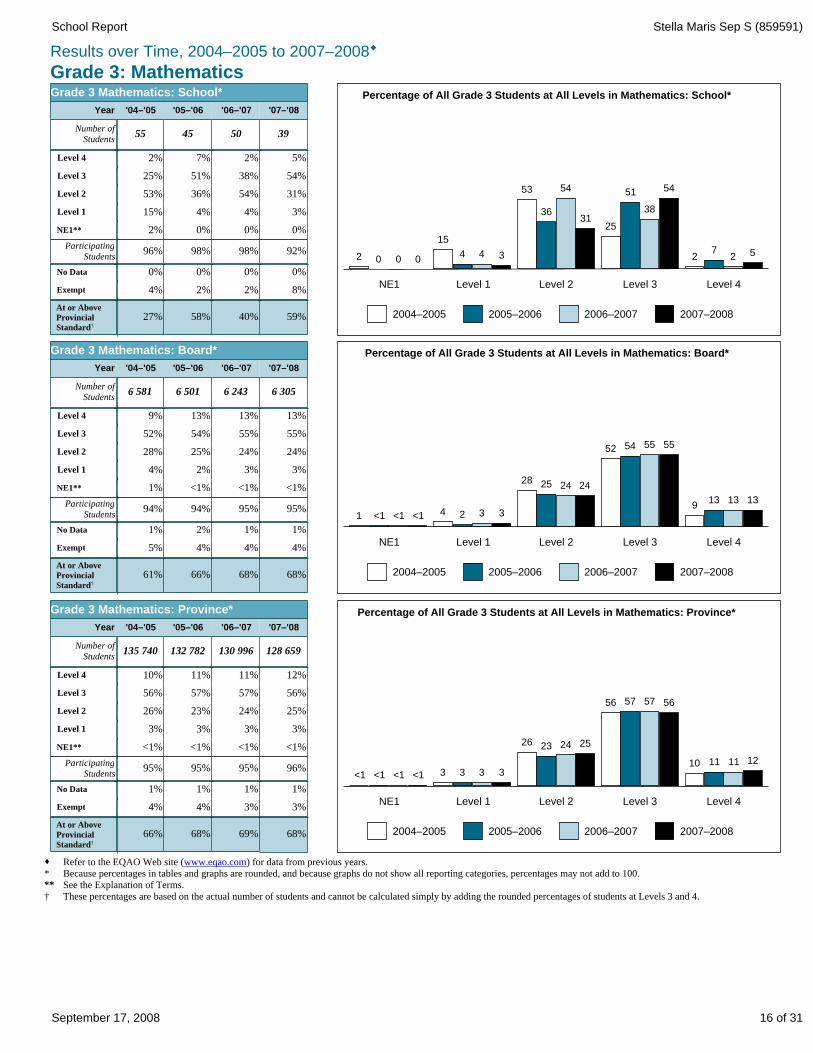
Grade 3: MathematicsResults over Time, 2004–2005 to 2007–2008®
· Refer to the EQAO Web site (www.eqao.com) for data from previous years.* Because percentages in tables and graphs are rounded, and because graphs do not show all reporting categories, percentages may not add to 100.** See the Explanation of Terms.† These percentages are based on the actual number of students and cannot be calculated simply by adding the rounded percentages of students at Levels 3 and 4.
Percentage of All Grade 3 Students at All Levels in Mathematics: School*
NE1 Level 1 Level 2 Level 3 Level 4
2
2004–2005 2005–2006 2006–2007 2007–2008
0 0 0
15
4 4 3
53
36
54
3125
51
38
54
27
2 5
59%40%58%27%
8%2%2%4% Exempt
0%0%0%0% No Data
92%98%98%96%Participating X
StudentsX
0%0%0%2% NE1**
3%4%4%15% Level 1
31%54%36%53% Level 2
54%38%51%25% Level 3
5%2%7%2% Level 4
39504555Number of
Students
'07–'08'06–'07'05–'06'04–'05Year
Grade 3 Mathematics: School*
At or AboveProvincial Standard†
Percentage of All Grade 3 Students at All Levels in Mathematics: Board*
NE1 Level 1 Level 2 Level 3 Level 4
1
2004–2005 2005–2006 2006–2007 2007–2008
<1 <1 <1 4 2 3 3
28 25 24 24
52 54 55 55
913 13 13
68%68%66%61%
4%4%4%5% Exempt
1%1%2%1% No Data
95%95%94%94%Participating X
StudentsX
<1%<1%<1%1% NE1**
3%3%2%4% Level 1
24%24%25%28% Level 2
55%55%54%52% Level 3
13%13%13%9% Level 4
6 3056 2436 5016 581Number of
Students
'07–'08'06–'07'05–'06'04–'05Year
Grade 3 Mathematics: Board*
At or AboveProvincial Standard†
Percentage of All Grade 3 Students at All Levels in Mathematics: Province*
NE1 Level 1 Level 2 Level 3 Level 4
<1
2004–2005 2005–2006 2006–2007 2007–2008
<1 <1 <1 3 3 3 3
26 23 24 25
56 57 57 56
10 11 11 12
68%69%68%66%
3%3%4%4% Exempt
1%1%1%1% No Data
96%95%95%95%Participating X
StudentsX
<1%<1%<1%<1% NE1**
3%3%3%3% Level 1
25%24%23%26% Level 2
56%57%57%56% Level 3
12%11%11%10% Level 4
128 659130 996132 782135 740Number of
Students
'07–'08'06–'07'05–'06'04–'05Year
Grade 3 Mathematics: Province*
At or AboveProvincial Standard†
16 of 31September 17, 2008
Stella Maris Sep S (859591)School Report
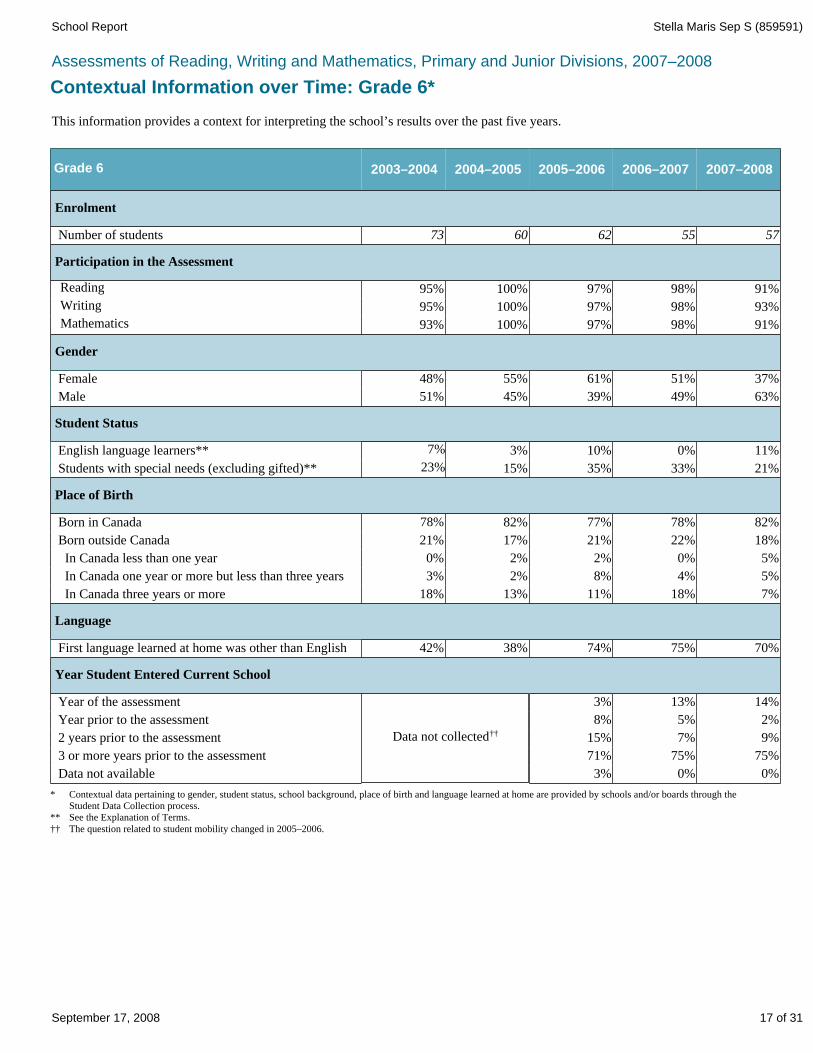
Data not collected††
2007–20082006–20072005–20062004–20052003–2004
This information provides a context for interpreting the school’s results over the past five years.
Contextual Information over Time: Grade 6*
Assessments of Reading, Writing and Mathematics, Primary and Junior Divisions, 2007–2008
* Contextual data pertaining to gender, student status, school background, place of birth and language learned at home are provided by schools and/or boards through the Student Data Collection process.
** See the Explanation of Terms.†† The question related to student mobility changed in 2005–2006.
Male
3 or more years prior to the assessment
Year prior to the assessment
2 years prior to the assessment
In Canada less than one year
Born outside Canada
In Canada one year or more but less than three years
In Canada three years or more
Data not available
Writing
Mathematics
Enrolment
Number of students 73 60 62 55 57
Participation in the Assessment
95% 100% 97% 98% 93%
93% 100% 97% 98% 91%
Gender
Reading 95% 100% 97% 98% 91%
51% 45% 39% 49% 63%
Female 48% 55% 61% 51% 37%
Student Status
English language learners** 7% 3% 10% 0% 11%
21% 17% 21% 22% 18%
0% 2% 2% 0% 5%
3% 2% 8% 4% 5%
18% 13% 11% 18% 7%
Language
First language learned at home was other than English 42% 38% 74% 75% 70%
Year Student Entered Current School
Year of the assessment
Grade 6
Students with special needs (excluding gifted)** 23% 15% 35% 33% 21%
Place of Birth
Born in Canada 78% 82% 77% 78% 82%
3%
8%
15%
71%
3%
13% 14%
5% 2%
7% 9%
75% 75%
0% 0%
17 of 31September 17, 2008
Stella Maris Sep S (859591)School Report
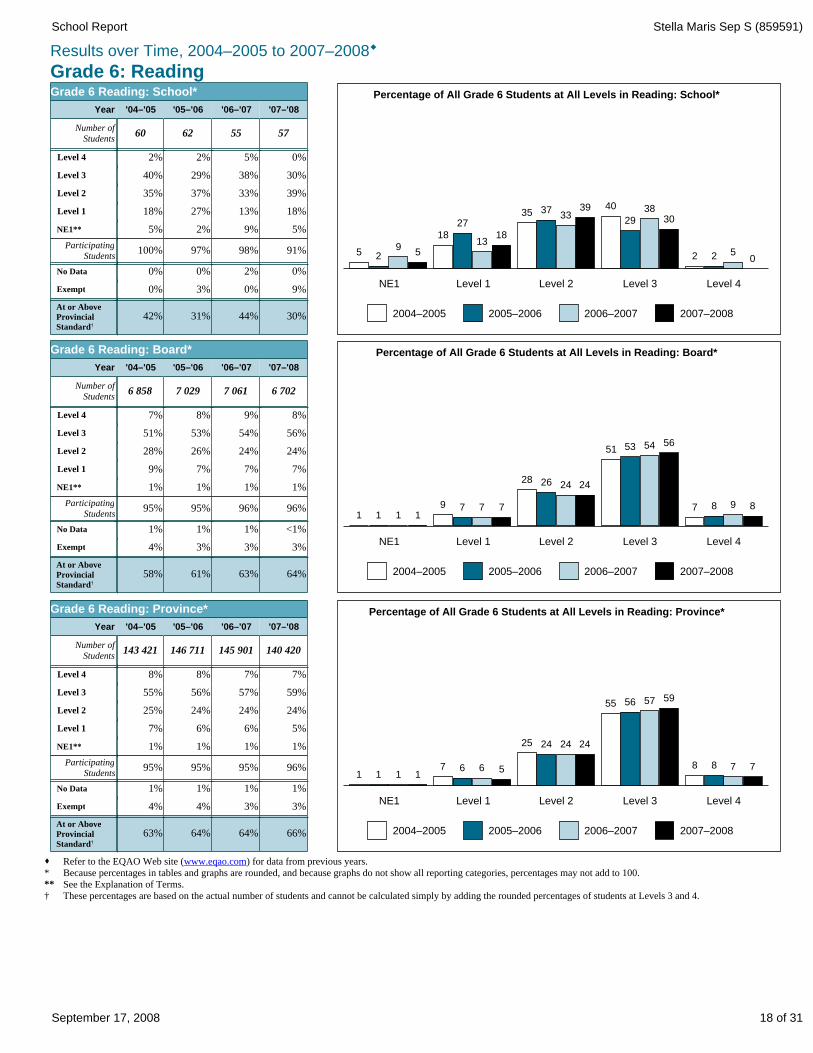
Grade 6: ReadingResults over Time, 2004–2005 to 2007–2008®
· Refer to the EQAO Web site (www.eqao.com) for data from previous years.* Because percentages in tables and graphs are rounded, and because graphs do not show all reporting categories, percentages may not add to 100.** See the Explanation of Terms.† These percentages are based on the actual number of students and cannot be calculated simply by adding the rounded percentages of students at Levels 3 and 4.
Percentage of All Grade 6 Students at All Levels in Reading: School*
NE1 Level 1 Level 2 Level 3 Level 4
5
2004–2005 2005–2006 2006–2007 2007–2008
29
5
1827
1318
35 3733
39 40
2938
30
2 2 50
30%44%31%42%
9%0%3%0% Exempt
0%2%0%0% No Data
91%98%97%100%Participating X
StudentsX
5%9%2%5% NE1**
18%13%27%18% Level 1
39%33%37%35% Level 2
30%38%29%40% Level 3
0%5%2%2% Level 4
57556260Number of
Students
'07–'08'06–'07'05–'06'04–'05Year
Grade 6 Reading: School*
At or AboveProvincial Standard†
Percentage of All Grade 6 Students at All Levels in Reading: Board*
NE1 Level 1 Level 2 Level 3 Level 4
1
2004–2005 2005–2006 2006–2007 2007–2008
1 1 19 7 7 7
28 26 24 24
51 53 54 56
7 8 9 8
64%63%61%58%
3%3%3%4% Exempt
<1%1%1%1% No Data
96%96%95%95%Participating X
StudentsX
1%1%1%1% NE1**
7%7%7%9% Level 1
24%24%26%28% Level 2
56%54%53%51% Level 3
8%9%8%7% Level 4
6 7027 0617 0296 858Number of
Students
'07–'08'06–'07'05–'06'04–'05Year
Grade 6 Reading: Board*
At or AboveProvincial Standard†
Percentage of All Grade 6 Students at All Levels in Reading: Province*
NE1 Level 1 Level 2 Level 3 Level 4
1
2004–2005 2005–2006 2006–2007 2007–2008
1 1 17 6 6 5
25 24 24 24
55 56 57 59
8 8 7 7
66%64%64%63%
3%3%4%4% Exempt
1%1%1%1% No Data
96%95%95%95%Participating X
StudentsX
1%1%1%1% NE1**
5%6%6%7% Level 1
24%24%24%25% Level 2
59%57%56%55% Level 3
7%7%8%8% Level 4
140 420145 901146 711143 421Number of
Students
'07–'08'06–'07'05–'06'04–'05Year
Grade 6 Reading: Province*
At or AboveProvincial Standard†
18 of 31September 17, 2008
Stella Maris Sep S (859591)School Report
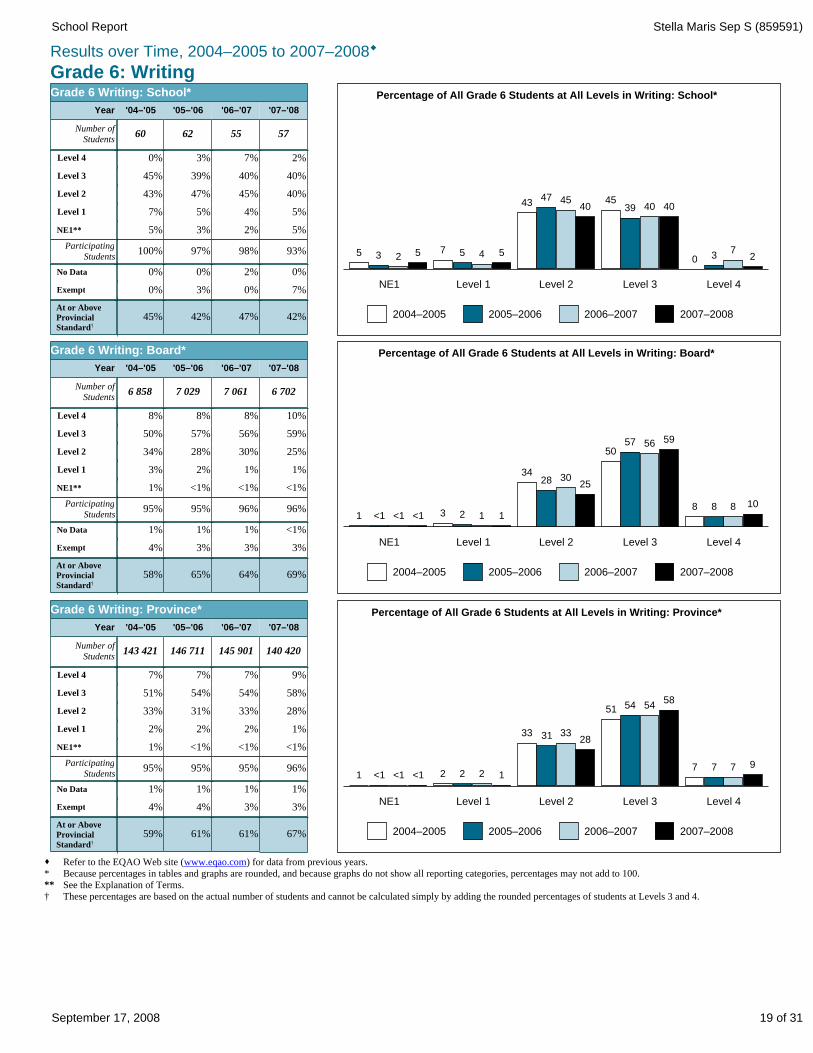
Grade 6: WritingResults over Time, 2004–2005 to 2007–2008®
· Refer to the EQAO Web site (www.eqao.com) for data from previous years.* Because percentages in tables and graphs are rounded, and because graphs do not show all reporting categories, percentages may not add to 100.** See the Explanation of Terms.† These percentages are based on the actual number of students and cannot be calculated simply by adding the rounded percentages of students at Levels 3 and 4.
Percentage of All Grade 6 Students at All Levels in Writing: School*
NE1 Level 1 Level 2 Level 3 Level 4
5
2004–2005 2005–2006 2006–2007 2007–2008
3 2 5 7 5 4 5
4347 45
4045
39 40 40
0 37
2
42%47%42%45%
7%0%3%0% Exempt
0%2%0%0% No Data
93%98%97%100%Participating X
StudentsX
5%2%3%5% NE1**
5%4%5%7% Level 1
40%45%47%43% Level 2
40%40%39%45% Level 3
2%7%3%0% Level 4
57556260Number of
Students
'07–'08'06–'07'05–'06'04–'05Year
Grade 6 Writing: School*
At or AboveProvincial Standard†
Percentage of All Grade 6 Students at All Levels in Writing: Board*
NE1 Level 1 Level 2 Level 3 Level 4
1
2004–2005 2005–2006 2006–2007 2007–2008
<1 <1 <1 3 2 1 1
3428 30
25
5057 56 59
8 8 8 10
69%64%65%58%
3%3%3%4% Exempt
<1%1%1%1% No Data
96%96%95%95%Participating X
StudentsX
<1%<1%<1%1% NE1**
1%1%2%3% Level 1
25%30%28%34% Level 2
59%56%57%50% Level 3
10%8%8%8% Level 4
6 7027 0617 0296 858Number of
Students
'07–'08'06–'07'05–'06'04–'05Year
Grade 6 Writing: Board*
At or AboveProvincial Standard†
Percentage of All Grade 6 Students at All Levels in Writing: Province*
NE1 Level 1 Level 2 Level 3 Level 4
1
2004–2005 2005–2006 2006–2007 2007–2008
<1 <1 <1 2 2 2 1
33 31 3328
51 54 5458
7 7 7 9
67%61%61%59%
3%3%4%4% Exempt
1%1%1%1% No Data
96%95%95%95%Participating X
StudentsX
<1%<1%<1%1% NE1**
1%2%2%2% Level 1
28%33%31%33% Level 2
58%54%54%51% Level 3
9%7%7%7% Level 4
140 420145 901146 711143 421Number of
Students
'07–'08'06–'07'05–'06'04–'05Year
Grade 6 Writing: Province*
At or AboveProvincial Standard†
19 of 31September 17, 2008
Stella Maris Sep S (859591)School Report
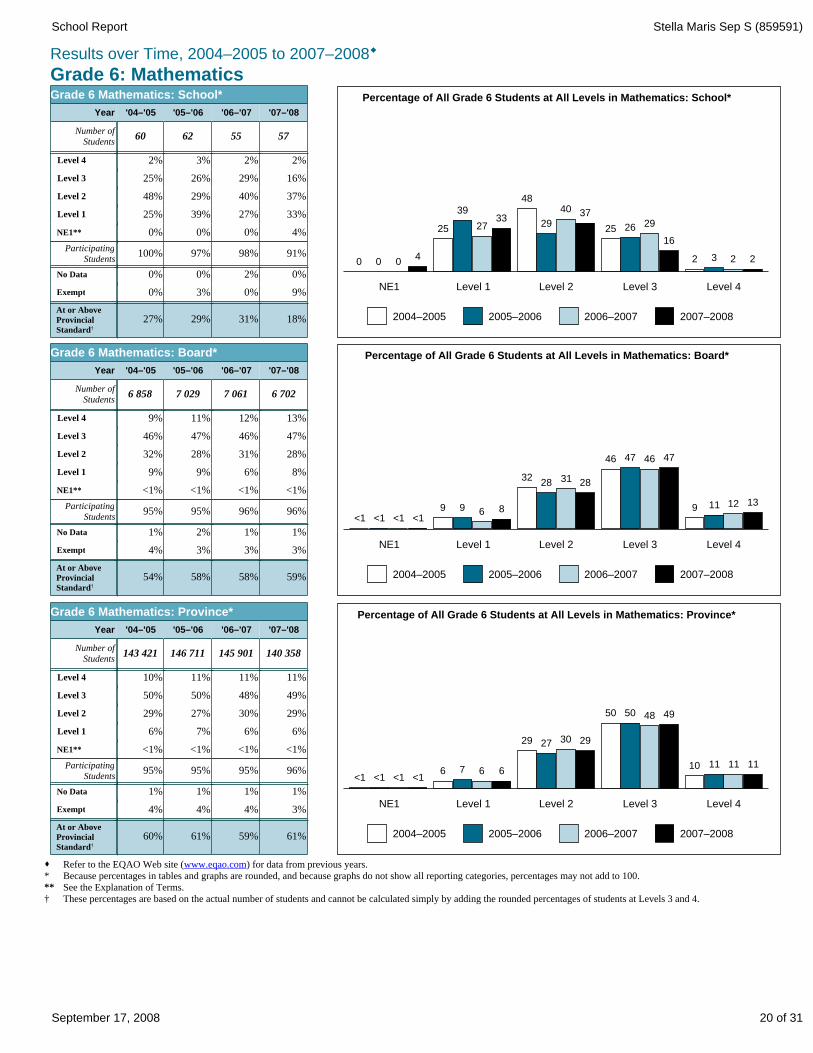
Grade 6: MathematicsResults over Time, 2004–2005 to 2007–2008®
· Refer to the EQAO Web site (www.eqao.com) for data from previous years.* Because percentages in tables and graphs are rounded, and because graphs do not show all reporting categories, percentages may not add to 100.** See the Explanation of Terms.† These percentages are based on the actual number of students and cannot be calculated simply by adding the rounded percentages of students at Levels 3 and 4.
Percentage of All Grade 6 Students at All Levels in Mathematics: School*
NE1 Level 1 Level 2 Level 3 Level 4
0
2004–2005 2005–2006 2006–2007 2007–2008
0 04
25
39
2733
48
29
40 37
25 26 29
16
2 3 2 2
18%31%29%27%
9%0%3%0% Exempt
0%2%0%0% No Data
91%98%97%100%Participating X
StudentsX
4%0%0%0% NE1**
33%27%39%25% Level 1
37%40%29%48% Level 2
16%29%26%25% Level 3
2%2%3%2% Level 4
57556260Number of
Students
'07–'08'06–'07'05–'06'04–'05Year
Grade 6 Mathematics: School*
At or AboveProvincial Standard†
Percentage of All Grade 6 Students at All Levels in Mathematics: Board*
NE1 Level 1 Level 2 Level 3 Level 4
<1
2004–2005 2005–2006 2006–2007 2007–2008
<1 <1 <19 9 6 8
3228 31 28
46 47 46 47
9 11 12 13
59%58%58%54%
3%3%3%4% Exempt
1%1%2%1% No Data
96%96%95%95%Participating X
StudentsX
<1%<1%<1%<1% NE1**
8%6%9%9% Level 1
28%31%28%32% Level 2
47%46%47%46% Level 3
13%12%11%9% Level 4
6 7027 0617 0296 858Number of
Students
'07–'08'06–'07'05–'06'04–'05Year
Grade 6 Mathematics: Board*
At or AboveProvincial Standard†
Percentage of All Grade 6 Students at All Levels in Mathematics: Province*
NE1 Level 1 Level 2 Level 3 Level 4
<1
2004–2005 2005–2006 2006–2007 2007–2008
<1 <1 <16 7 6 6
29 27 30 29
50 50 48 49
10 11 11 11
61%59%61%60%
3%4%4%4% Exempt
1%1%1%1% No Data
96%95%95%95%Participating X
StudentsX
<1%<1%<1%<1% NE1**
6%6%7%6% Level 1
29%30%27%29% Level 2
49%48%50%50% Level 3
11%11%11%10% Level 4
140 358145 901146 711143 421Number of
Students
'07–'08'06–'07'05–'06'04–'05Year
Grade 6 Mathematics: Province*
At or AboveProvincial Standard†
20 of 31September 17, 2008
Stella Maris Sep S (859591)School Report
READING
WRITING
MATHEMATICS
Female Male
2003–2004
Female Male
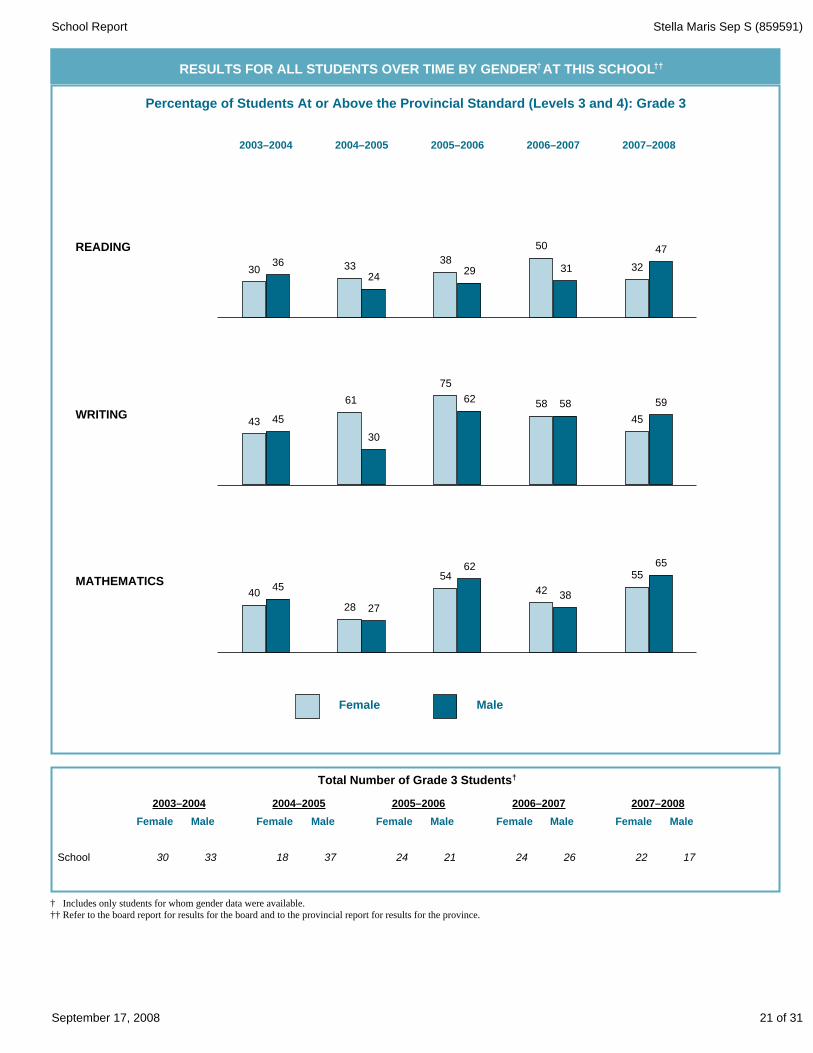
30 33 3718
MaleFemale
2004–2005
24 21
Female Male
2005–2006
24 26
Female Male
2006–2007
22 17
Female Male
2007–2008
School
† Includes only students for whom gender data were available.†† Refer to the board report for results for the board and to the provincial report for results for the province.
2003–2004 2004–2005 2005–2006 2006–2007 2007–2008
RESULTS FOR ALL STUDENTS OVER TIME BY GENDER†AT THIS SCHOOL††
Total Number of Grade 3 Students†
Percentage of Students At or Above the Provincial Standard (Levels 3 and 4): Grade 3
3036 33
24
3829
50
31 32
47
43 45
61
30
75
62 58 58
45
59
4045
28 27
5462
42 38
5565
21 of 31September 17, 2008

Stella Maris Sep S (859591)School Report
READING
WRITING
MATHEMATICS
Female Male
2003–2004
Female Male
35 37 2733
MaleFemale
2004–2005
38 24
Female Male
2005–2006
28 27
Female Male
2006–2007
21 36
Female Male
2007–2008
School
† Includes only students for whom gender data were available.†† Refer to the board report for results for the board and to the provincial report for results for the province.
2003–2004 2004–2005 2005–2006 2006–2007 2007–2008
RESULTS FOR ALL STUDENTS OVER TIME BY GENDER†AT THIS SCHOOL††
Total Number of Grade 6 Students†
Percentage of Students At or Above the Provincial Standard (Levels 3 and 4): Grade 6
2314
42 41 39
17
4641 38
25
40
19
55
33
53
25
54
41
62
31
2011
21
33 29 2918
44
2414
22 of 31September 17, 2008
Stella Maris Sep S (859591)School Report
At home, there is a computer for me to use for school work.
Number ofStudents Who
Answered“Yes”
I use a computer for reading activities at school.
I like to read.
I am a good reader.
Assessments of Reading, Writing and Mathematics, Primary and Junior Divisions, 2007–2008
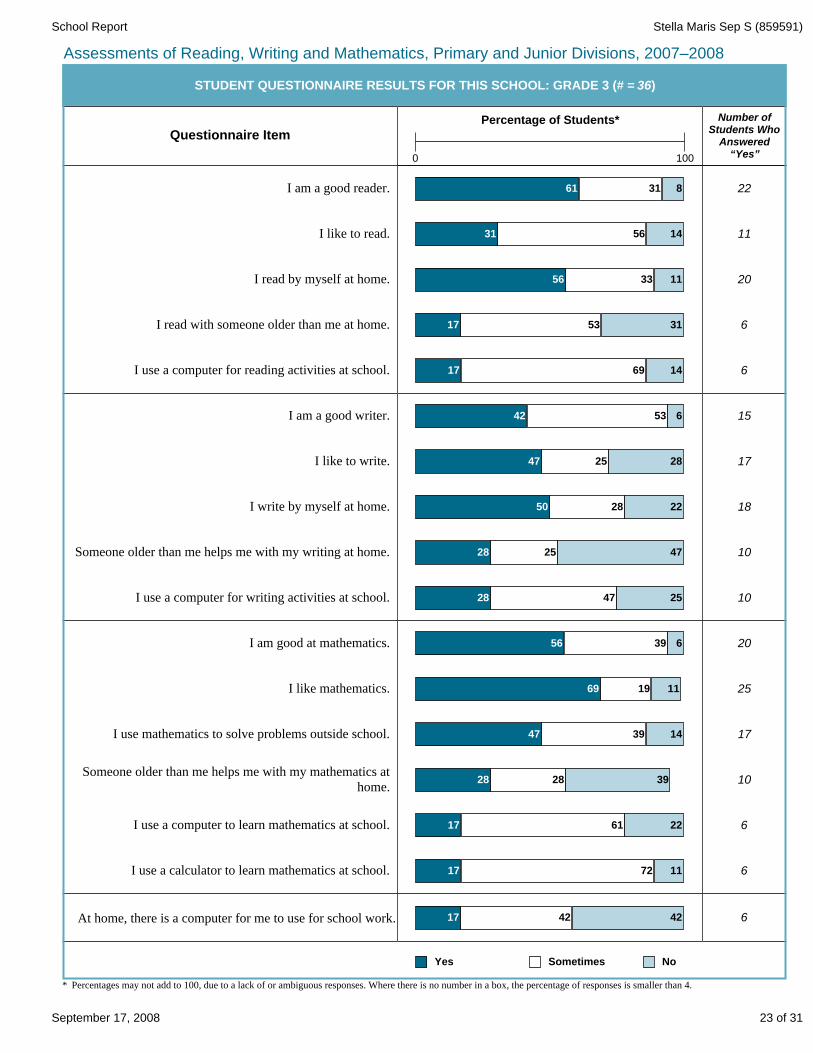
STUDENT QUESTIONNAIRE RESULTS FOR THIS SCHOOL: GRADE 3 (# = 36)
Questionnaire ItemPercentage of Students*
0 100
I read by myself at home.
I read with someone older than me at home.
22
11
20
6
6
I am a good writer.
I like to write.
I write by myself at home.
Someone older than me helps me with my writing at home.
I use a computer for writing activities at school.
15
17
18
10
10
I am good at mathematics.
I like mathematics.
I use mathematics to solve problems outside school.
Someone older than me helps me with my mathematics athome.
I use a computer to learn mathematics at school.
I use a calculator to learn mathematics at school.
20
25
17
10
6
6
6
Yes Sometimes No
* Percentages may not add to 100, due to a lack of or ambiguous responses. Where there is no number in a box, the percentage of responses is smaller than 4.
61 31 8
31 56 14
56 33 11
17 53 31
17 69 14
42 53 6
47 25 28
50 28 22
28 25 47
28 47 25
56 39 6
69 19 11
47 39 14
28 28 39
17 61 22
17 72 11
17 42 42
23 of 31September 17, 2008
Stella Maris Sep S (859591)School Report
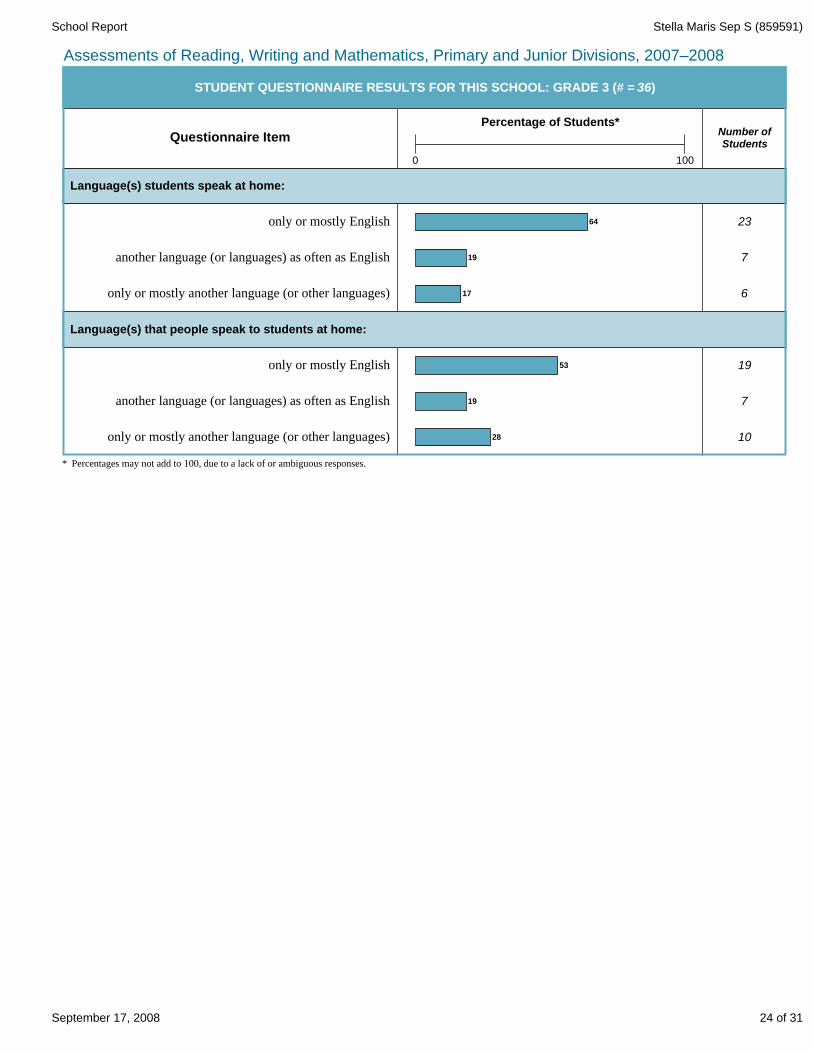
* Percentages may not add to 100, due to a lack of or ambiguous responses.
Number ofStudents
only or mostly English
another language (or languages) as often as English
only or mostly another language (or other languages)
Assessments of Reading, Writing and Mathematics, Primary and Junior Divisions, 2007–2008
STUDENT QUESTIONNAIRE RESULTS FOR THIS SCHOOL: GRADE 3 (# = 36)
Questionnaire ItemPercentage of Students*
0 100
only or mostly English
another language (or languages) as often as English
only or mostly another language (or other languages)
23
7
6
19
7
10
Language(s) students speak at home:
Language(s) that people speak to students at home:
64
19
17
53
19
28
24 of 31September 17, 2008

Stella Maris Sep S (859591)School Report
Assessments of Reading, Writing and Mathematics, Primary and Junior Divisions, 2007–2008
There is a computer for me to use for school work.
I use a calculator to learn mathematics at school.
I use a computer to learn mathematics at school.
Someone older than me helps me with my mathematics athome.
I use mathematics to solve problems outside school.
I like mathematics.
I am good at mathematics.
I use a computer for writing activities at school.
Someone older than me helps me with my writing athome.
I write by myself at home.
I like to write.
I am a good writer.
I use a computer for reading activities at school.
I read with someone older than me at home.
I read by myself at home.
I like to read.
I am a good reader.
Ma
le*
(# =
17
)
School
Fe
ma
le*
(# =
19
)
All S
tud
en
ts(#
= 3
6)
Ma
le*
(# =
3 0
17
)
Board
Fe
ma
le*
(# =
2 9
59
)
All S
tud
en
ts(#
= 5
97
6)
Ma
le*
(# =
62
46
0)
Province
Fe
ma
le*
(# =
60
16
8)
All S
tud
en
ts(#
= 1
22
62
8)
Percentage of Students Who Answered “Yes” to the Statements Below
47%51%49%45%47%46%18%16%17%
Computer at home
* Includes only students for whom gender data were available.
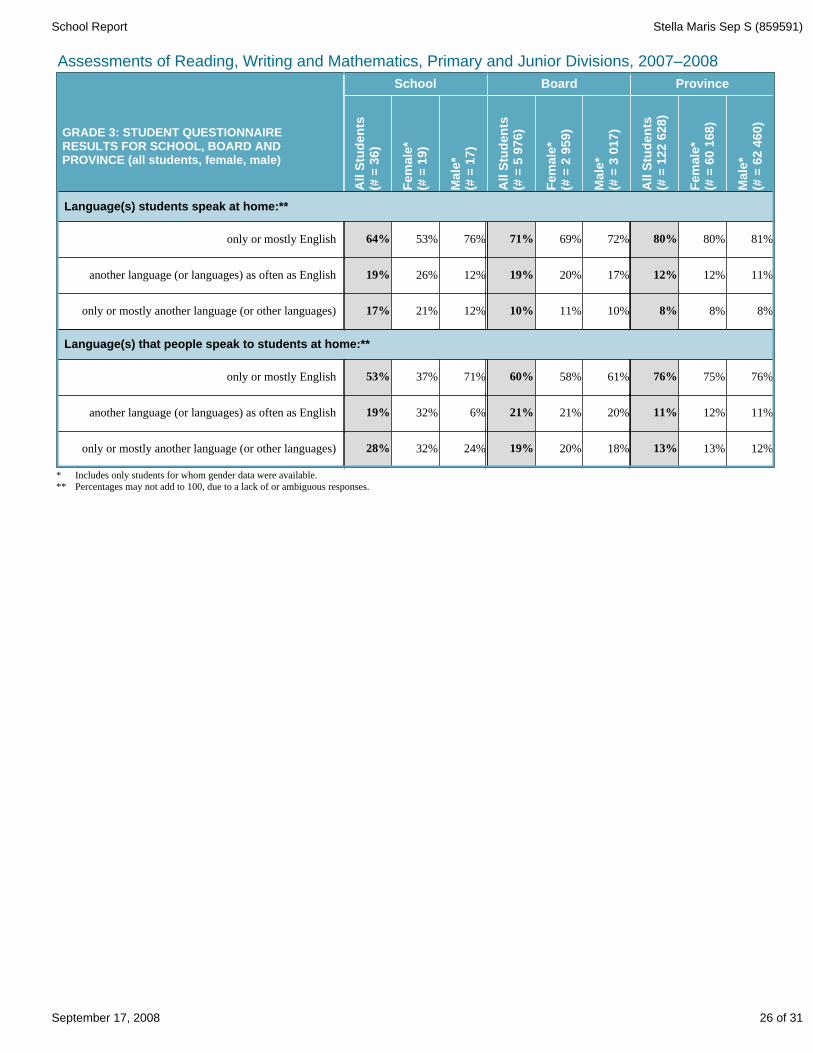
GRADE 3: STUDENT QUESTIONNAIRE RESULTS FOR SCHOOL, BOARD AND PROVINCE (all students, female, male)
13%12%13%16%14%15%18%16%17%
27% 27%27%24%23%24%18%16%17%
25%30%27%26%32%29%6%47%28%
32%32%32%32%30%31%53%42%47%
61%55%58%62%54%58%82%58%69%
60%45%53%57%39%48%76%37%56%
Mathematics
28%27%28%22%20%21%29%26%28%
19%15%17%21%16%18%41%16%28%
51%59%55%56%63%59%41%58%50%
43%59%51%46%57%51%41%53%47%
43%56%50%41%50%45%29%53%42%
Writing
23%23%23%23%21%22%18%16%17%
17%15%16%16%13%14%12%21%17%
56%60%58%60%64%62%47%63%56%
51%68%59%49%66%57%29%32%31%
65%69%67%63%66%64%65%58%61%
Reading
25 of 31September 17, 2008
Stella Maris Sep S (859591)School Report
only or mostly English
another language (or languages) as often as English
only or mostly another language (or other languages)
Assessments of Reading, Writing and Mathematics, Primary and Junior Divisions, 2007–2008
only or mostly another language (or other languages)
another language (or languages) as often as English
only or mostly English
Ma
le*
(# =
17
)
School
Fe
ma
le*
(# =
19
)
All S
tud
en
ts(#
= 3
6)
Ma
le*
(# =
3 0
17
)
Board
Fe
ma
le*
(# =
2 9
59
)
All S
tud
en
ts(#
= 5
97
6)
Ma
le*
(# =
62
46
0)
Province
Fe
ma
le*
(# =
60
16
8)
All S
tud
en
ts(#
= 1
22
62
8)
GRADE 3: STUDENT QUESTIONNAIRE RESULTS FOR SCHOOL, BOARD AND PROVINCE (all students, female, male)
* Includes only students for whom gender data were available.** Percentages may not add to 100, due to a lack of or ambiguous responses.
12%13%13%18%20%19%24%32%28%
11%12%11%20%21%21%6%32%19%
76%75%76%61%58%60%71%37%53%
Language(s) that people speak to students at home:**
8%8%8%10%11%10%12%21%17%
11%12%12%17%20%19%12%26%19%
81%80%80%72%69%71%76%53%64%
Language(s) students speak at home:**
26 of 31September 17, 2008
Stella Maris Sep S (859591)School Report
At home, there is a computer for me to use for school work.
Number ofStudents Who
Answered“Yes”
I use a computer for reading activities at school.
I like to read.
I am a good reader.
Assessments of Reading, Writing and Mathematics, Primary and Junior Divisions, 2007–2008
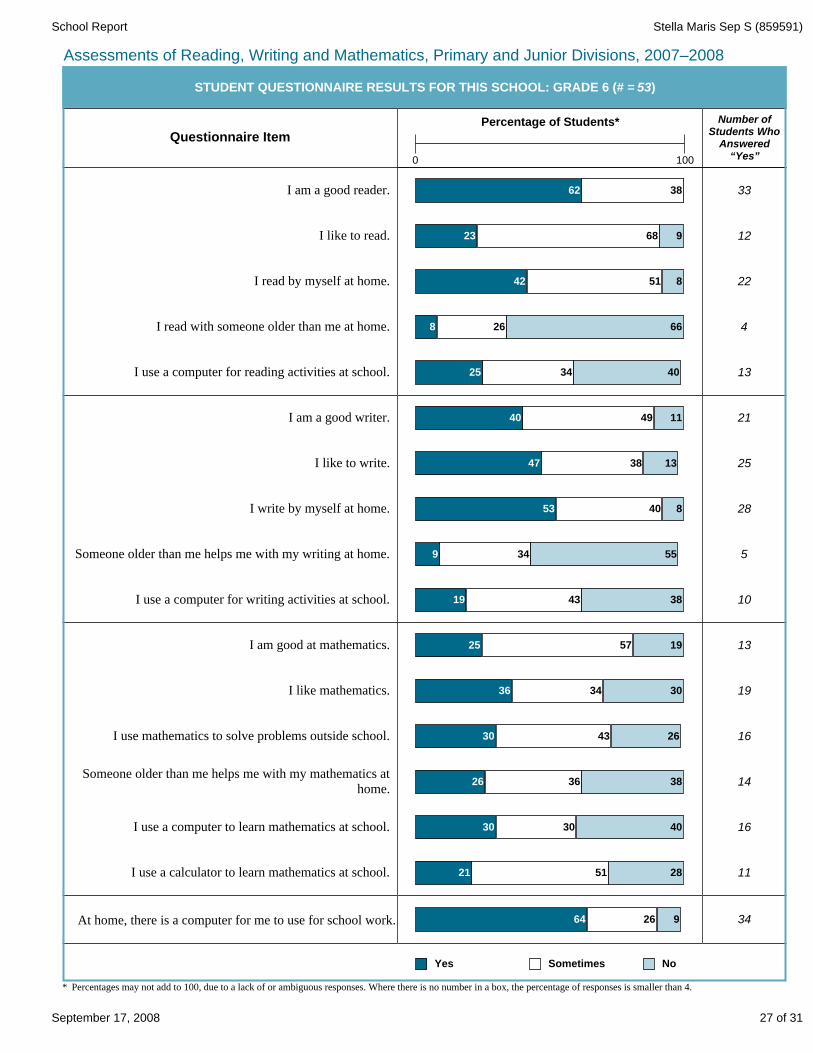
STUDENT QUESTIONNAIRE RESULTS FOR THIS SCHOOL: GRADE 6 (# = 53)
Questionnaire ItemPercentage of Students*
0 100
I read by myself at home.
I read with someone older than me at home.
33
12
22
4
13
I am a good writer.
I like to write.
I write by myself at home.
Someone older than me helps me with my writing at home.
I use a computer for writing activities at school.
21
25
28
5
10
I am good at mathematics.
I like mathematics.
I use mathematics to solve problems outside school.
Someone older than me helps me with my mathematics athome.
I use a computer to learn mathematics at school.
I use a calculator to learn mathematics at school.
13
19
16
14
16
11
34
Yes Sometimes No
* Percentages may not add to 100, due to a lack of or ambiguous responses. Where there is no number in a box, the percentage of responses is smaller than 4.
62 38
23 68 9
42 51 8
8 26 66
25 34 40
40 49 11
47 38 13
53 40 8
9 34 55
19 43 38
25 57 19
36 34 30
30 43 26
26 36 38
30 30 40
21 51 28
64 26 9
27 of 31September 17, 2008

Stella Maris Sep S (859591)School Report
* Percentages may not add to 100, due to a lack of or ambiguous responses.
Number ofStudents
only or mostly English
another language (or languages) as often as English
only or mostly another language (or other languages)
Assessments of Reading, Writing and Mathematics, Primary and Junior Divisions, 2007–2008
STUDENT QUESTIONNAIRE RESULTS FOR THIS SCHOOL: GRADE 6 (# = 53)
Questionnaire ItemPercentage of Students*
0 100
only or mostly English
another language (or languages) as often as English
only or mostly another language (or other languages)
25
19
9
22
13
18
Language(s) students speak at home:
Language(s) that people speak to students at home:
47
36
17
42
25
34
28 of 31September 17, 2008
Stella Maris Sep S (859591)School Report
Assessments of Reading, Writing and Mathematics, Primary and Junior Divisions, 2007–2008
There is a computer for me to use for school work.
I use a calculator to learn mathematics at school.
I use a computer to learn mathematics at school.
Someone older than me helps me with my mathematics athome.
I use mathematics to solve problems outside school.
I like mathematics.
I am good at mathematics.
I use a computer for writing activities at school.
Someone older than me helps me with my writing athome.
I write by myself at home.
I like to write.
I am a good writer.
I use a computer for reading activities at school.
I read with someone older than me at home.
I read by myself at home.
I like to read.
I am a good reader.
Ma
le*
(# =
36
)
School
Fe
ma
le*
(# =
17
)
All S
tud
en
ts(#
= 5
3)
Ma
le*
(# =
3 2
98
)
Board
Fe
ma
le*
(# =
3 1
25
)
All S
tud
en
ts(#
= 6
42
3)
Ma
le*
(# =
68
28
4)
Province
Fe
ma
le*
(# =
65
92
5)
All S
tud
en
ts(#
= 1
34
20
9)
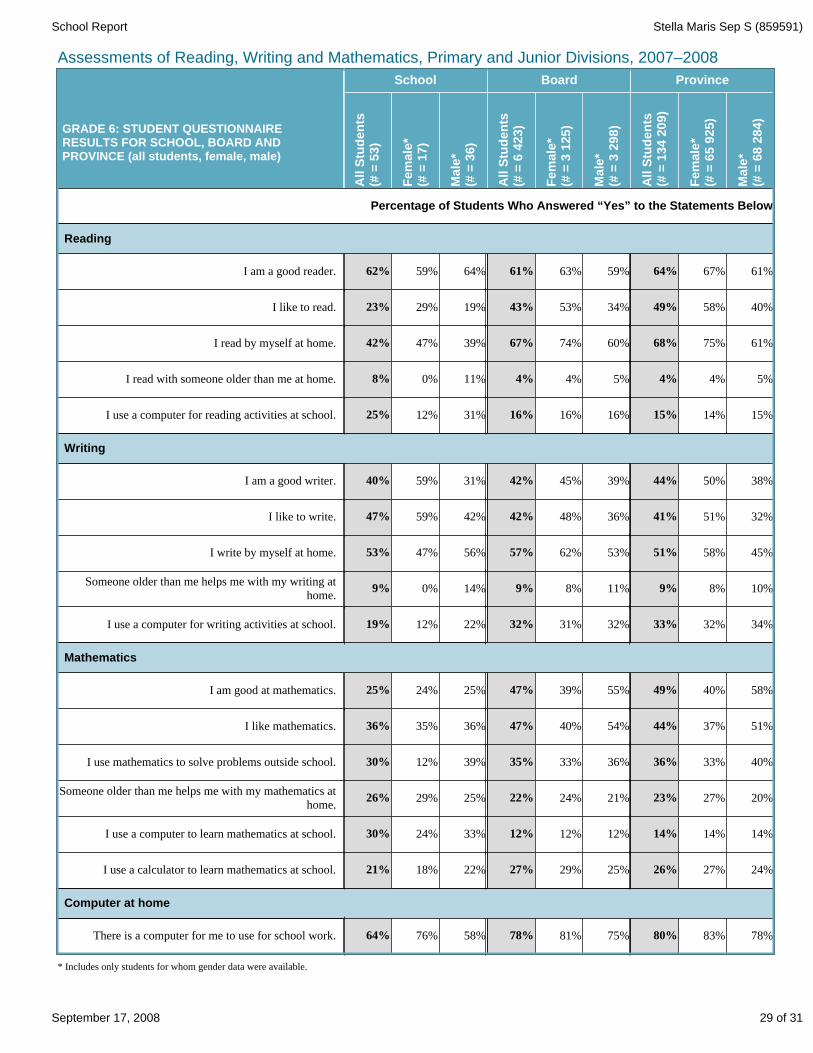
Percentage of Students Who Answered “Yes” to the Statements Below
78%83%80%75%81%78%58%76%64%
Computer at home
* Includes only students for whom gender data were available.
GRADE 6: STUDENT QUESTIONNAIRE RESULTS FOR SCHOOL, BOARD AND PROVINCE (all students, female, male)
24%27%26%25%29%27%22%18%21%
14% 14%14%12%12%12%33%24%30%
20%27%23%21%24%22%25%29%26%
40%33%36%36%33%35%39%12%30%
51%37%44%54%40%47%36%35%36%
58%40%49%55%39%47%25%24%25%
Mathematics
34%32%33%32%31%32%22%12%19%
10%8%9%11%8%9%14%0%9%
45%58%51%53%62%57%56%47%53%
32%51%41%36%48%42%42%59%47%
38%50%44%39%45%42%31%59%40%
Writing
15%14%15%16%16%16%31%12%25%
5%4%4%5%4%4%11%0%8%
61%75%68%60%74%67%39%47%42%
40%58%49%34%53%43%19%29%23%
61%67%64%59%63%61%64%59%62%
Reading
29 of 31September 17, 2008

Stella Maris Sep S (859591)School Report
only or mostly English
another language (or languages) as often as English
only or mostly another language (or other languages)
Assessments of Reading, Writing and Mathematics, Primary and Junior Divisions, 2007–2008
only or mostly another language (or other languages)
another language (or languages) as often as English
only or mostly English
Ma
le*
(# =
36
)
School
Fe
ma
le*
(# =
17
)
All S
tud
en
ts(#
= 5
3)
Ma
le*
(# =
3 2
98
)
Board
Fe
ma
le*
(# =
3 1
25
)
All S
tud
en
ts(#
= 6
42
3)
Ma
le*
(# =
68
28
4)
Province
Fe
ma
le*
(# =
65
92
5)
All S
tud
en
ts(#
= 1
34
20
9)
GRADE 6: STUDENT QUESTIONNAIRE RESULTS FOR SCHOOL, BOARD AND PROVINCE (all students, female, male)
* Includes only students for whom gender data were available.** Percentages may not add to 100, due to a lack of or ambiguous responses.
12%11%12%18%21%20%36%29%34%
12%13%12%22%23%22%28%18%25%
76%76%76%60%55%58%36%53%42%
Language(s) that people speak to students at home:**
7%6%6%10%10%10%17%18%17%
11%12%12%18%20%19%36%35%36%
82%82%82%71%70%71%47%47%47%
Language(s) students speak at home:**
30 of 31September 17, 2008

Stella Maris Sep S (859591)School Report
EXPLANATION OF TERMS
All Students Results are reported for all students in the grade.
Results are reported only for those students who took part in the assessment (excludes "no data" and "exempt" categories).
ParticipatingStudents
The Ministry of Education has set Level 3 as the provincial standard.ProvincialStandard
The student has demonstrated the required knowledge and skills.Achievement surpasses the provincial standard.
Level 4
The student has demonstrated most of the required knowledge and skills.Achievement is at the provincial standard.
Level 3
The student has demonstrated some of the required knowledge and skills.Achievement approaches the provincial standard.
Level 2
The student has demonstrated some of the required knowledge and skills in limited ways.Achievement falls much below the provincial standard.
Level 1
EQAO did not receive completed assessment booklets for this student.No Data
NE1 "Not enough evidence for Level 1." The student has not demonstrated enough evidence of knowledge and understanding to be assigned Level 1.
The student was formally exempted in one or more components of the assessment.Exempt
These are students who have been identified by the school in accordance with English Language Learners: ESL and ELD Programs and Services: Policies and Procedures for Ontario Elementary and Secondary Schools, Kindergarten to Grade 12 (2007). English language learners were formerly called English as a second language (ESL)/English literacy development (ELD) learners.
EnglishLanguageLearners
Results for some or all students are being withheld by EQAO. For further information, please contact the school principal.
W
N/D "No data available" is used to indicate that there were no students in the grade or subject for the group or year specified.
“Not reported” indicates that the number of students participating (fewer than 15 in a group) or responding to the Student Questionnaire (fewer than six in a group) is so small that identification of individual student results might be possible; therefore, results are not reported.
N/R
Students withSpecial Needs
These are students who have been formally identified by an Identification, Placement and Review Committee (IPRC), as well as students who have an Individual Education Plan (IEP). Students identified as gifted are not included.
31 of 31September 17, 2008