scientific output: labor or capital intensive? an analysis
TRANSCRIPT
Department of Economics Working Paper Series
Scientific Output: Labor or Capital Intensive? An Analysis for Selected Countries Elham Erfanian
Amir B. Ferreira Neto
Working Paper No. 17-04
This paper can be found at the College of Business and Economics Working Paper Series homepage: http://business.wvu.edu/graduate-degrees/phd-economics/working-papers

Scienti�c output: labor or capital intensive? An
analysis for selected countries.∗
Elham Erfanian†1 and Amir B. Ferreira Neto‡1
1West Virginia University
Abstract
Scienti�c research contributes to sustainable economic growth environments.
Hence, policy-makers should understand how the di�erent inputs � namely labor
and capital � are related to a country's scienti�c output. This paper addresses
this issue by estimating output elasticities for labor and capital using a panel
of 31 countries in nine years. Due to the nature of scienti�c output, we also
use spatial econometric models to take into account the spillover e�ects from
knowledge produced as well as labor and capital. The results show that capital
elasticity is closer to the labor elasticity. The results suggest a decreasing return
to scale production of scienti�c output. The spatial model points to negative
spillovers from capital expenditure and no spillovers from labor or the scienti�c
output.
Keywords: Scienti�c output; capital; labor; spillover e�ects
JEL Classi�cation: O32, F01, O15
∗This paper was the co-recipient of the Best Paper by Graduate Student in Economics Award atthe 54th Annual Conference of the Academy of Economics and Finance - Charleston SC, 2017.†Regional Research Institute, School of Natural Resources. e-mail: [email protected]‡W. Marston and Katharine B. Becker Fellow. Department of Economics, Regional Research
Institute. e-mail: [email protected]
1

1 Introduction
Research performance is a powerful indicator to assess the economic e�ciency of anation. For instance, nations with high productivity and economic output are alsothe leaders in patent and research output (Adams et al., 2013) Increasing scienti�coutcomes is necessary for technological changes, which may further develop the pro-ductivity and economic performance. Ultimately, it ends up increasing the nationalwealth and long-run sustainable economy growth.
In a globalization context, competitiveness is a common way to be an economicpioneer. Therefore, countries are striving to improve their scienti�c capacity (Adamset al., 2013). The authors emphasize that more than two-thirds of research publishedin 1973 occurred in well- established economies, whereas the trend has changed inrecent years. Nowadays, only half of the journal publications have an author fromG7 countries (Adams et al., 2013), indicating that developing countries are improvingtheir scienti�c standing.
The aim of this study is to investigate the nature of research outcomes by answer-ing the question of how the structure of scienti�c publication di�ers among nations.By answering this question, we are able to understand how countries use their avail-able capital and labor to produce scienti�c outcome, and which of the inputs is moreimportant in production. In turn, policymakers can use this information when decid-ing where to allocate resources; for example, investing in more education to developresearchers or investing in machinery for labs.
In general, there are two ways to increase the output of the economy: increase thevolume of inputs entering the production cycle, or a more wisely alternative, increaseproductivity and e�ciency of the production process (Rosenberg, 2014). Due toscarcity of resources, nations have focused on improving productivity. Investment onresearch and development is an important component of long-term economic growthas it is responsible for changes in productivity.
Research and development are mostly discussed in literature in three broaderareas: the e�ectiveness of research and development (R&D) on economic growth,how R&D in�uences productivity, and the relative importance of the R&D investmenton research outcomes. In section 2 we expand this discussion, concentrating on thee�ectiveness of research and development on research outcomes, which is the mainfocus of this paper.
To address the question of how nations produce their research outcome, we assumea simple production function and estimate the output elasticities for each input � laborand capital. We use a balanced panel of 31 countries from 2003 to 2011. Our resultssuggest that investing in researchers contributes more to the research outcomes thaninvesting in research capital, especially because the number of researchers in highereducation is the largest contributor to research outcomes. These results are not novel,but they are important because they corroborate previous studies. Also, the resultshelp policymakers choose the appropriate pathway to enhance e�ciency in resourceallocation.
The remainder of the paper is as follows: section 2 discusses the R&D literatureand how it is related to growth, productivity and spillovers; section 3 describes our
2
econometric approach; section 4 presents the data used; section 5 discusses the results;and section 6 concludes.
2 Research and Development (R&D) and Economy
Growth
Schumpeter (1942) and Solow (1957) are pioneers in the study of �innovation� and�technical changes� as engines to production and economic growth. King (2004) arguesthat �the ability to judge a nation's scienti�c standing is vital for both governmentsand society�, as the result of scienti�c e�orts may be seen in higher economic growthrates and more economic outputs. These eventually re�ect the increase in socialwelfare.
Long-term economic growth needs a sustainable fuel, which could be provided byinnovations. In long run, the ability of a nation to improve the standard of livingpasses through increasing the output-to-input ratio. A broad overview in productivitytriggers is presented in the literature, most of them emphasizing technology andresearch. For instance, Guellec and van Pottelsberghe De La Potterie. (2001) analyzes16 OECD countries and �nds that R&D is an important factor for productivity andeconomic growth. Rouvinen (2002) studies four issues in R&D and productivity.His results suggest that R&D investment in�uences productivity � not vice versa.Bravo-Ortega and Marin (2010) provide evidence that corroborates Rouvinen (2002)'sresults.
More recently, Eid (2012), using country-level data for 17 high-income OECDcountries, measures the correlation between R&D and productivity growth and �ndsthere is a lag between them. In the tradition of the knowledge-capital model ofGriliches, Doraszelski and Jaumandreu (2013) develop a model to investigate thecorrelation between R&D and productivity. The authors �nd R&D expenditure hasa key role in productivity across �rms.
For scientometrics, scienti�c publication is the engine of economic growth. There-fore, the knowledge spillover discussion becomes relatively more important. This dis-cussion started Alfred Marshall (Carlino et. al, 2001), and it still gets the attentionof many economists. Some of the researches on knowledge spillovers are summarizedbelow.
Griliches (1986) �nds that after controlling for industry-speci�c �xed e�ects, thee�ects of research on productivity growth is cut by about �fty percent. The authorexplains this is because of spillovers within the industry. Ja�e (1989) and Ja�e et al.(1993) show that spillovers are industry and geographically localized. Varga (2000)applies the Griliches-Ja�e knowledge production function and expands it to a hierar-chical version to test the knowledge spillovers in U.S. metropolitan areas, �nding thatresearch universities can increase the regional production. More recently, Elhorst andZigova (2014) �nd no evidence of cross-fertilization e�ects across nearby universities,which corroborates the Bonaccorsi and Daraio's (2005) results. However, the authorsargue that collaboration has a positive e�ect on research productivity.
3
2.1 R&D and Research Outcomes
In an oversimpli�cation scenario, research and development (R&D) has two majorinputs and two major outputs, capital and labor for the former, and patents andpublications for the latter. In this work, we focus only on the publication output.McAllister and Wagner (1981) examine the relationship between R&D expenditureand the number of papers published in a sample of 500 universities and colleges inthe United States. For each of 11 �elds of science that the authors consider, thereis a strong positive relationship between R&D expenditure and the number of pub-lications. Focusing only on late industrial countries, Amsden and Mourshed. (1997)examine the scienti�c publication, patent and technological capabilities. While theauthors expect a high growth rate of GDP and scienti�c publications to be posi-tively correlated, they �nd the high correlation in countries like South Korea, Chinaand Singapore rather than in countries such as Turkey, Argentina, Brazil, Chile andMexico.
Shelton (2008) compares American and European publications and �nds that thee�ectiveness of research investment is more signi�cant than the number of scientistsfor scienti�c outcomes. Sharma and Thomas. (2008) �nds that the number of e�-cient countries in the R&D sector varies based on the assumption the authors made.Crespi and Geuna. (2008) �nd a strongly positive long-run relationship between R&Dexpenditure and the number of publications with an optimum lag of 6 years. Adamset al. (2013) look at Brazil, Russia, India, China and South Korea, known together asthe BRICK nations. They �nd Brazil stands out as di�erent from the others. Whilea natural knowledge economy is a leading area in Brazil, research policy, physics,chemistry, engineering and materials are the leading areas in Russia, India, China,and South Korea.
Akhmat (2014) the relationship between educational indicators and research out-comes in the top twenty countries. The results indicate that education expendituresand the number of publications have a one-to-one relationship. In a series of papers,Meo and Usmani (2014) and Meo et al. (2013b, 2013a found among Asian countries,Middle East, and European countries a positive correlation between spending on R&Dand the number of research publications, while in all the sub-samples the results showno correlation between GDP per capita and the total number of publications. Theyalso conclude that the research outcome depends on the ratio of R&D expenditure tothe total GDP� not the absolute R&D expenditure.
3 Model and Econometric Approach
Assume countries produce scienti�c research following a Cobb-Douglas productionfunction in which there are two main inputs: capital and labor.
Y = KαLβ (1)
By assuming a Cobb-Douglas, we implicitly assume that there is no heterogeneitybetween countries. At �rst this may seem unreasonable; however, given the easy
4

access to internationally produced research through the Internet, and globalization,which allows more trade and movement between countries of both goods and people,it is possible to assume that scienti�c research is a homogenous produced good.
In order to estimate the model, we can transform equation 1 by taking the naturallogarithm on both sides. After some manipulation we have
ln(Y ) = αln(K) + βln(L) (2)
We do not make any assumptions on the parameters such that, the productionfunction can be constant, increasing, or decreasing returns to scale. Parameters αand β are the share of each input used in the production of one unit of output; hence,the bigger the parameter, the more it is used in the production. Thus, the estimatedmodel is
ln(SO) = β0 + β1ln(CO) + β2ln(Res) + µc + δt + ε (3)
where SO is the scienti�c output measured as the number of scienti�c and technicaljournal articles, CO is capital outlay, Res is the number of researchers in R&D, µcis the country �xed e�ect and δt is year �xed e�ect. Notice that introducing country�xed e�ect we are able to control for institutional di�erences among countries.
One important feature of the labor input, which is even more important in thecase of scienti�c output, is the knowledge from the worker. As argued by Griliches(1986), knowledge spillovers are expected to exist. Therefore, we incorporate thisfeature into our model by using a spatial model that follows the general formulation:
Y = ρW1Y +Xβ +W1Xτ + ξ (4)
ξ = λW2ξ + ε (5)
such that ε ∼ (0, σ2I).In order to capture the knowledge spillover, we will focus on four models: the
Spatial Durbin model (SDM) in which we include and on the right-hand side; theSpatial Durbin error model (SDEM) that expands the SDM model by introducing inthe right-hand side; the Spatial Autoregressive Lag model (SAR) in which we includeonly ; and, the Spatial Lag of X model (SLX) in which we include only .
4 Data
Data for constructing the model come from two di�erent sources: The World Bank(WB) dataset1 and the Organization for Economic Cooperation and Development(OECD) dataset2. The list of countries in each set of analysis is provided in AppendixI. Because the number of countries in each dataset di�ers, we estimate two di�erentsets of models, one for each source.
1Available at: http://data.worldbank.org/indicator2Available at: http://stats.oecd.org/
5
The World Bank provides the number of scienti�c and technical journal articles forall the countries around the world. The dependent variable for all the speci�cationsis based on the World Bank. Explanatory variables for scienti�c inputs in the WorldBank model includes the number of researchers in R&D and gross capital formation.This dataset includes 31 countries in a panel of nine years from 2003 to 2011.
The OECD explanatory variables include the full-time equivalent researchers intotal, and we further break it down to business enterprise, government, and highereducation sectors. The total labor cost and the total capital expenditure in researchare the capital related input in OECD countries analysis This dataset contains 22countries from 2003 to 2011.
The scienti�c output information is available for 46 countries from 1996 to 2011 inan unbalanced set up. Because we believe the use of spatial econometrics techniquesare very important in this study, we created a balanced panel of countries that max-imized the number of observations. Moreover, we chose to use of both World Bankand OECD datasets because one may argue that gross formation of capital is notthe best measure for R&D capital investment and the measure for researchers shouldbe disaggregated. Therefore, we attempt to deal with these possible concerns, butto have a balanced panel, we have to drop 9 other countries that were in the WorldBank sample. Table 1 provides the summary statistics for the data.
<INSERT TABLE 1 >
5 Results
The results are divided into two parts. First we present the results without any spatialspillovers and then we introduce such results. As explained in the previous sections,we believe that the spatial spillovers are important both theoretically and empirically.Tables 2 to 5 present the results with no spatial dependence. The analysis will focuson model (4), our preferred speci�cation.
Table 2 presents the results using the number of researchers provided by the WorldBank (WB) and the gross capital formation, also provided by the World Bank. Theresults show no in�uence of capital on the scienti�c output, while the elasticity of laboris positive and statistically signi�cant. To further investigate3 this relationship, welook at another data source. Tables 3 presents results using labor cost as a proxy forthe number of researchers in R&D and capital cost, Table 4 uses the total number ofresearchers, and Table 5 disaggregates the researchers into three categories: businessenterprise, government and higher education. The dependent variable remains thenumber of articles produced reported by the World Bank.
The results for the preferred model (4) from tables 3 to 5 show a positive andstatistically signi�cant result for both capital and labor. According to the elasticityvalues, there is decreasing returns to scale relation, as the sum of both elasticities
3Another robustness check performed was the analysis for unbalanced panels in all scenariosdiscussed. The results remain similar in terms of sign and signi�cance of the estimated coe�cients.These results are available upon request.
6
are less than one in every case. It is interesting to note when using the number ofresearchers instead of the labor cost (tables 4 and 5) the results suggest the capitaland labor elasticities have similar magnitude.
<INSERT TABLES 2 TO 5>
5.1 Spatial Models
As discussed in the previous sections, it is important to consider the spillover e�ectsof knowledge both theoretically and empirically. Therefore, we present in tables 6 to9 the spatial results for the regressions presented in tables 2 to 5. We present fourspatial models: SAR, SDM, SDEM and SLX; however, we will focus the analysis onthe SDM model as we believe it is the best model because it considers spillovers fromthe dependent variables (articles) and the explanatory variables (inputs). In terms ofthe weight matrix, we used the k-nearest neighbors weight matrix with k equals to 1.This was the weight matrix that captured the most spatial dependence.
For the World Bank sample (table 6) we observe that the results remain similar tothose of table 2, but there is an extra weight on the labor elasticity. Also, there is noevidence of articles or input spillover, which suggests countries have access to the sameinformation regardless if they are neighbors. As for the OECD sample (tables 7 to9), there is statistically signi�cant negative spillover of capital expenditure on R&D.This suggests that investing in R&D has a negative e�ect on knowledge output inclose-by countries. There is no spillover of labor inputs nor of scienti�c outputs. Also,the countries own labor and capital inputs have positive and statistically signi�cantresults.
One possible concern is the use of the geographical matrix to do the spatial anal-ysis. We would argue that this matrix is good for several reasons. Firstly, we needthe weight matrix to be exogenous to our estimation, and the geographic matrix �tsthis requirement. Secondly, it is well established in the literature that distance has aninverse relation to economic outcomes. Lastly, several authors (Ja�e, 1989; Ja�e elal., 1993; Varga, 2000) show that geographical proximity is important for spillovers.
<INSERT TABLES 6 TO 9>
6 Conclusions and Implications
The objective of this paper is to understand the production of scienti�c output forseveral countries. More speci�cally, we wanted to investigate the relation of capitaland labor employed in research to its output. We used a balanced panel of 31 countriesand 9 years to estimate the capital and labor elasticities and then employed spatialmodels in order to capture possible spillovers. The main results can be divided intotwo: �rstly, capital and labor seems to have similar importance in terms of producingscienti�c output; and when disaggregated, researchers in the business enterprise havezero output elasticity. Secondly, in terms of spillovers, there seems to be a negative
7

spillover in R&D capital expenditure. Also, there is no spillovers of scienti�c output(articles) in all spatial speci�cations.
In terms of policy implication, governments should not choose between labor andcapital because the results point to similar importance in the production of scien-ti�c outputs. Moreover, the results suggest that research should be conducted bygovernment agencies and workers in higher education. This is important, especiallyin developing countries, as government o�ers better careers in terms of stability andincome even though it o�ers little incentive in the production of new scienti�c output.
Future research should focus on improving the data availability in order to incorpo-rate di�erent countries in the analysis. Other possible extensions are: the estimationof the elasticities assuming heterogeneous production functions for each country andthe use of �economic� weight matrix, which would capture the closest economic rela-tions between the countries. As discussed previously, the challenge in this last partis to guarantee the weight matrix is exogenous to the estimations.
References
Adams, J., Pendlebury, D., and Stembridge, B. (2013). Building bricks: Exploringthe global research and innovation impact of brazil, russia, india, china and southkorea. Technical report, Thomson Reuters.
Akhmat, Ghulam, K. Z. T. S. Y. J. M. M. K. (2014). Relationship between educationalindicators and research outcomes in a panel of top twenty nations: Windows ofopportunity. Journal of Informetrics, 8(2):349�361.
Amsden, A. H. and Mourshed., M. (1997). Scienti�c publications, patents and techno-logical capabilities in late industrializing countries. Technology Analysis & Strategic
Management, 9(3):343�360.
Bonaccorsi, A. and Daraio., C. (2005). Exploring size and agglomeration e�ects onpublic research productivity. Scientometrics, 63(1):87�120.
Carlino, G., Chatterjee, S., and Hunt., R. (2001). Knowledge spillovers and the neweconomy of cities,. Working Paper No 01-14, Federal Reserve Bank of Philadelphia.
Crespi, G. A. and Geuna., A. (2008). An empirical study of scienti�c production: Across country analysis, 1981?2002. Research Policy, 37(4):565�579.
Doraszelski, U. and Jaumandreu, J. (2013). R&d and productivity: Estimating en-dogenous productivity. The Review of Economic Studies, 4(4):1338�1383.
Eid, A. (2012). Higher education r&d and productivity growth: an empirical studyon high income oecd countries. Education Economics, 20(1):53�68.
Elhorst, J. P. and Zigova, K. (2014). Competition in research activity among economicdepartments: Evidence by negative spatial autocorrelation. Geographical Analysis,46(2):104�125.
8

Griliches, Z. (1986). Productivity, r&d, and basic research at the �rm level in the1970s. American Economic Review, 76(1):141�154.
Guellec, D. and van Pottelsberghe De La Potterie., B. (2001). R&d and productivitygrowth: panel data analysis of 16 oecd countries. Technical report, OECD.
Ja�e, A. B. (1989). Real e�ects of academic research. American Economic Review,79(5):957�970.
Ja�e, A. B., Trajtenberg, M., and Henderson., R. (1993). Geographic localizationof knowledge spillovers as evidenced by patent citations. The Quarterly journal of
Economics, 108(3):577�589.
King, D. A. (2004). The scienti�c impact of nations. Nature, 430(7):311�316.
McAllister, P. R. and Wagner, D. (1981). Relationship between r&d expenditures andpublication output for us colleges and universities. Research in Higher Education,15(1):3�30.
Meo, S., MAsri, A. A., Usmani, A., Memon, A., and Zaidi, S. (2013a). Impact ofgdp, spending on r&d, number of universities and scienti�c journals on researchpublications among asian countries. PLOS One, 8(6):1�8.
Meo, S. and Usmani, A. (2014). Impact of r&d expenditures on research publications,patents and high-tech exports among european countries. European Review for
Medical and Pharmacological Sciences, 18(1):1�9.
Meo, S., Usmani, A., Vohra, M., and Bukhari, I. (2013b). Impact of gdp, spendingon r&d, number of universities and scienti�c journals on research publications inpharmacological sciences in middle east. European Review for Medical and Phar-
macological Sciences, 17(20):2697�2705.
Rosenberg, N. (2014). Innovation and economic growth. Technical report, OECD.
Rouvinen, P. (2002). R&d-productivity dynamics: Causality, lags, and ?dry holes?.Journal of Applied Economics, 5(1):23�156.
Schumpeter, J. A. (1942). ICapitalism, socialism and democracy. London: UnwinPaperbacks.
Sharma, S. and Thomas., V. (2008). Inter-country r&d e�ciency analysis: An appli-cation of data envelopment analysis. Scientometrics, 76(3):483�501.
Shelton, R. D. (2008). Relations between national research investment and publicationoutput: Application to an american paradox. Scientometrics, 74(2):191�205.
Solow, R. M. (1957). Technical change and the aggregate production function. TheReview of Economics and Statistics, 39(3):312�320.
Varga, A. (2000). Local academic knowledge spillovers and the concentration ofeconomic activity. Journal of Regional Science, 4(2):289�309.
9

Tables
10

Table1:
Descriptive
Statistics
Statistic
Source
NMean
St.Dev.
Min
Max
World
BankSam
ple
#of
Articles
World
Bank
279
20,521.3
37,990.1
354.6
212,883.0
Total
#of
ResearchersWB
World
Bank
279
3,126.4
1,812.8
301.5
8,003.5
GrossCapitalFormation
World
Bank
279
23.1
5.8
11.2
47.6
OECDSam
ple
#of
Articles
World
Bank
198
12,465.8
16,306.8
874.9
89,894.4
Total
#of
ResearchersOECD
OECD
198
152,079.0
283,872.4
3,775.0
1,592,420.0
Researchersin
BusinessEnterprises
OECD
198
89,770.3
186,084.8
1,516.0
1,092,213.0
Researchersin
Government
OECD
198
24,570.3
52,255.5
1,044.0
250,250.0
Researchersin
Higher
Education
OECD
198
36,604.6
53,214.3
1,178.0
261,237.0
Labor
coston
R&D
OECD
198
8,915.4
14,101.0
190.5
64,252.0
CapitalExpenditure
onR&D
OECD
198
2,632.6
5,979.1
44.6
34,867.9
11
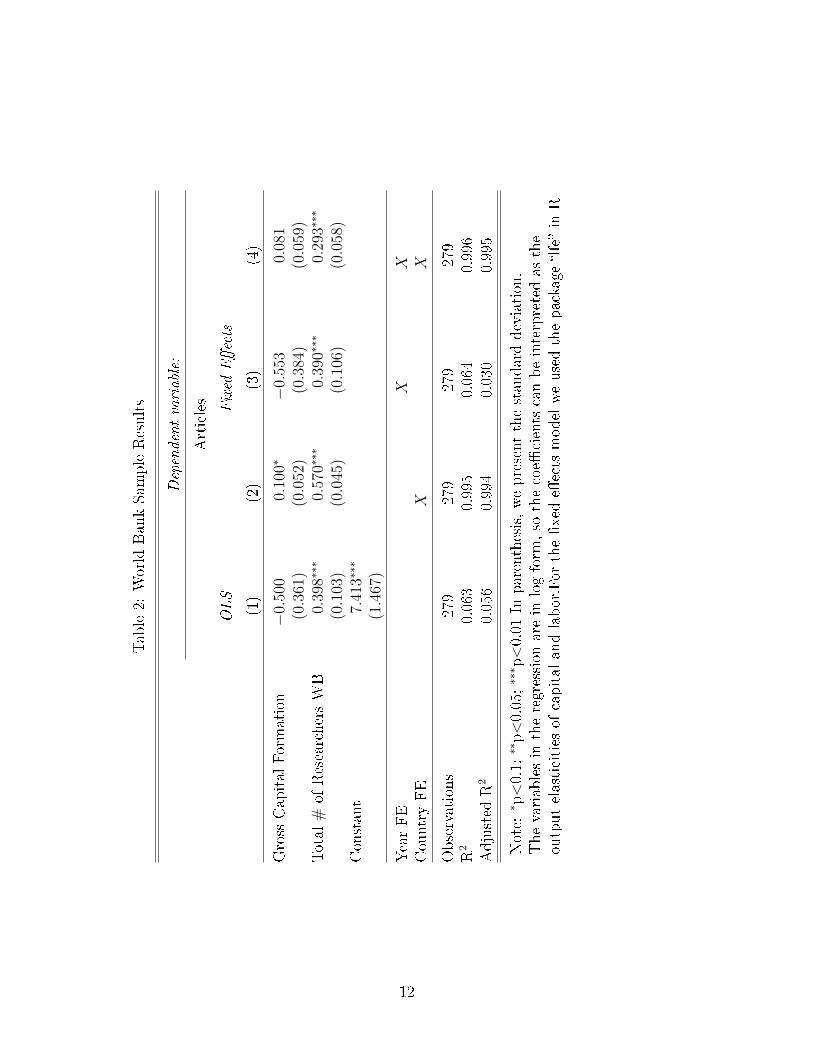
Table2:
World
BankSam
pleResults
Dependentvariable:
Articles
OLS
Fixed
E�ects
(1)
(2)
(3)
(4)
GrossCapitalFormation
−0.500
0.100∗
−0.553
0.081
(0.361)
(0.052)
(0.384)
(0.059)
Total
#of
ResearchersWB
0.398∗
∗∗0.570∗
∗∗0.390∗
∗∗0.293∗
∗∗
(0.103)
(0.045)
(0.106)
(0.058)
Constant
7.413∗
∗∗
(1.467)
YearFE
XX
CountryFE
XX
Observations
279
279
279
279
R2
0.063
0.995
0.064
0.996
Adjusted
R2
0.056
0.994
0.030
0.995
Note:
∗ p<0.1;
∗∗p<0.05;∗∗
∗ p<0.01
Inparenthesis,wepresentthestandarddeviation.
Thevariablesin
theregression
arein
logform
,so
thecoe�
cientscanbeinterpretedas
the
outputelasticities
ofcapitalandlabor.For
the�xed
e�ectsmodelweusedthepackage
�lfe�in
R
12

Table3:
OECDSam
pleResults
Dependentvariable:
Articles
OLS
Fixed
E�ects
(1)
(2)
(3)
(4)
CapitalExpenditure
onR&D
0.305∗
∗∗0.224∗
∗∗0.307∗
∗∗0.129∗
∗∗
(0.031)
(0.032)
(0.031)
(0.034)
Labor
coston
R&D
0.475∗
∗∗0.102∗
∗∗0.477∗
∗∗0.047∗
(0.032)
(0.027)
(0.033)
(0.027)
Constant
2.918∗
∗∗
(0.122)
YearFE
XX
CountryFE
XX
Observations
198
198
198
198
R2
0.936
0.992
0.938
0.993
Adjusted
R2
0.936
0.990
0.934
0.992
Note:
∗ p<0.1;
∗∗p<0.05;∗∗
∗ p<0.01
Inparenthesis,wepresentthestandarddeviation.
Thevariablesin
theregression
arein
logform
,so
thecoe�
cientscanbeinterpretedas
the
outputelasticities
ofcapitalandlabor.For
the�xed
e�ectsmodelweusedthepackage
�lfe�in
R
13

Table4:
OECDSam
pleResults,Researchers
Dependentvariable:
Articles
OLS
Fixed
E�ects
(1)
(2)
(3)
(4)
CapitalExpenditure
onR&D
0.439∗
∗∗0.161∗
∗∗0.444∗
∗∗0.124∗
∗∗
(0.040)
(0.032)
(0.041)
(0.034)
Total
#of
ResearchersOECD
0.348∗
∗∗0.351∗
∗∗0.345∗
∗∗0.178∗
∗
(0.045)
(0.055)
(0.046)
(0.069)
Constant
2.100∗
∗∗
(0.284)
YearFE
XX
CountryFE
XX
Observations
198
198
198
198
R2
0.896
0.993
0.897
0.993
Adjusted
R2
0.895
0.992
0.891
0.992
Note:
∗ p<0.1;
∗∗p<0.05;∗∗
∗ p<0.01
Inparenthesis,wepresentthestandarddeviation.
Thevariablesin
theregression
arein
logform
,so
thecoe�
cientscanbeinterpretedas
the
outputelasticities
ofcapitalandlabor.For
the�xed
e�ectsmodelweusedthepackage
�lfe�in
R
14

Table5:
OECDResults,disaggregateresearchers
Dependentvariable:
l.articles
OLS
Fixed
E�ects
(1)
(2)
(3)
(4)
CapitalExpenditure
onR&D
0.311∗
∗∗0.143∗
∗∗0.314∗
∗∗0.114∗
∗∗
(0.045)
(0.031)
(0.046)
(0.033)
Researchersin
BusinessEnterprises
0.201∗
∗∗−0.034
0.200∗
∗∗−0.061
(0.039)
(0.038)
(0.040)
(0.038)
Researchersin
Government
−0.083∗
∗0.148∗
∗∗−0.087∗
∗0.116∗
∗
(0.037)
(0.054)
(0.038)
(0.054)
Researchersin
Higher
Education
0.393∗
∗∗0.371∗
∗∗0.398∗
∗∗0.281∗
∗∗
(0.060)
(0.054)
(0.062)
(0.062)
Constant
1.609∗
∗∗
(0.286)
YearFE
XX
CountryFE
XX
Observations
198
198
198
198
R2
0.910
0.994
0.911
0.994
Adjusted
R2
0.908
0.993
0.905
0.993
Note:
∗ p<0.1;
∗∗p<0.05;∗∗
∗ p<0.01
Inparenthesis,wepresentthestandarddeviation.
Thevariablesin
theregression
arein
logform
,so
thecoe�
cientscanbeinterpretedas
the
outputelasticities
ofcapitalandlabor.For
the�xed
e�ectsmodelweusedthepackage
�lfe�in
R
15
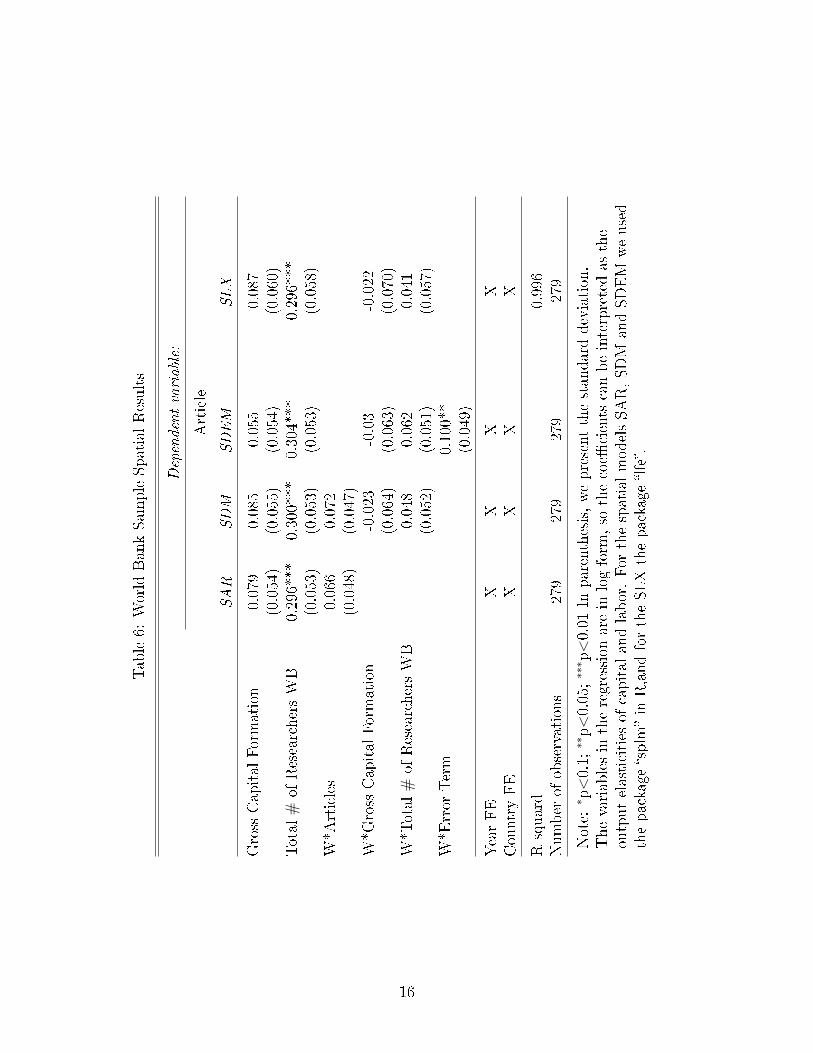
Table6:
World
BankSam
pleSpatialResults
Dependentvariable:
Article
SAR
SDM
SDEM
SLX
GrossCapitalFormation
0.079
0.085
0.055
0.087
(0.054)
(0.055)
(0.054)
(0.060)
Total
#of
ResearchersWB
0.296***
0.300***
0.304***
0.296***
(0.053)
(0.053)
(0.053)
(0.058)
W*A
rticles
0.066
0.072
(0.048)
(0.047)
W*G
rossCapitalFormation
-0.023
-0.03
-0.022
(0.064)
(0.063)
(0.070)
W*T
otal
#of
ResearchersWB
0.048
0.062
0.041
(0.052)
(0.051)
(0.057)
W*E
rror
Term
0.100**
(0.049)
YearFE
XX
XX
CountryFE
XX
XX
Rsquard
0.996
Number
ofobservations
279
279
279
279
Note:
∗ p<0.1;
∗∗p<0.05;∗∗
∗ p<0.01
Inparenthesis,wepresentthestandarddeviation.
Thevariablesin
theregression
arein
logform
,so
thecoe�
cientscanbeinterpretedas
the
outputelasticities
ofcapitalandlabor.For
thespatialmodelsSAR,SDM
andSDEM
weused
thepackage
�splm�in
R,andfortheSLXthepackage
�lfe�.
16

Table7:
OECDSam
pleSpatialResults
Dependentvariable:
Articles
SAR
SDM
SDEM
SLX
CapitalExpenditure
onR&D
0.129***
0.139***
0.138***
0.140***
(0.031)
(0.030)
(0.031)
(0.033)
Labor
coston
R&D
0.048*
0.051**
0.051**
0.051*
(0.024)
(0.024)
(0.024)
(0.026)
W*A
rticles
-0.023
-0.023
(0.059)
(0.059)
W*CapitalExpenditure
onR&D
-0.109***
-0.110***
-0.109***
(0.034)
(0.033)
(0.037)
W*Labor
coston
R&D
0.011
0.001
0.011
(0.019)
(0.019)
(0.021)
W*E
rror
Term
-0.030
(0.063)
YearFE
XX
XX
CountryFE
XX
XX
Rsquard
0.993
Number
ofobservations
198
198
198
198
Note:
∗ p<0.1;
∗∗p<0.05;∗∗
∗ p<0.01
Inparenthesis,wepresentthestandarddeviation.
Thevariablesin
theregression
arein
logform
,so
thecoe�
cientscanbeinterpretedas
the
outputelasticities
ofcapitalandlabor.For
thespatialmodelsSAR,SDM
andSDEM
weused
thepackage
�splm�in
R,andfortheSLXthepackage
�lfe�.
17
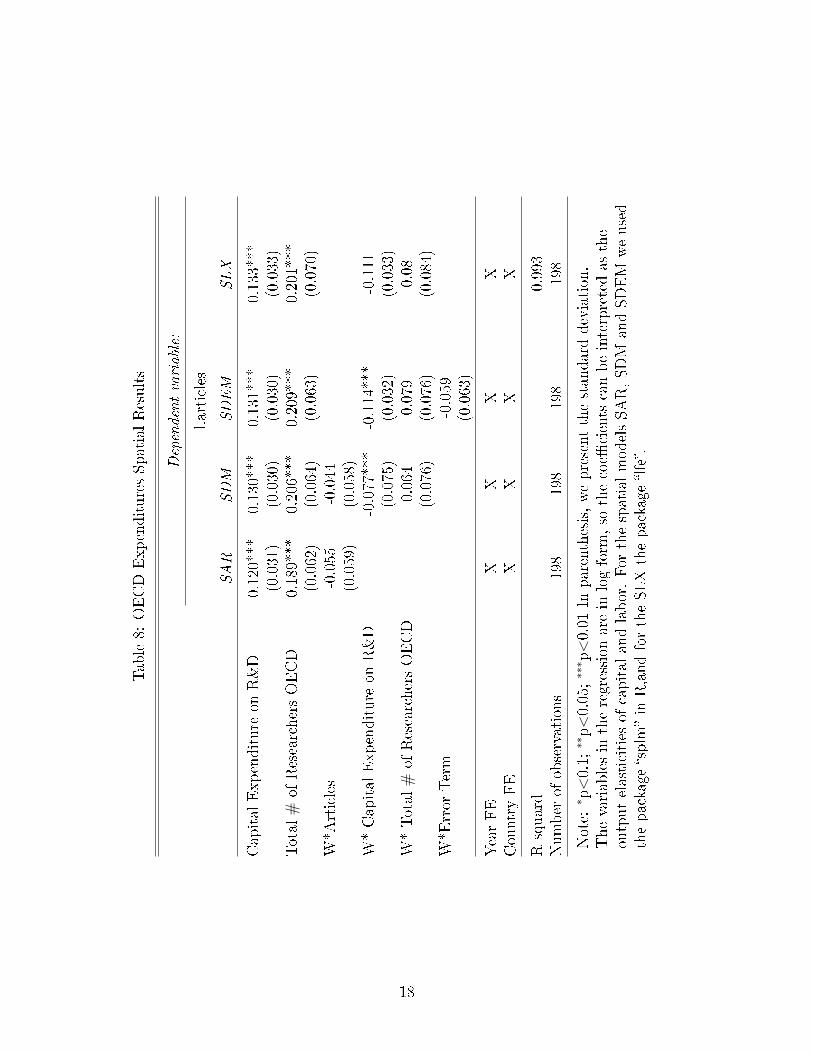
Table8:
OECDExpendituresSpatialResults
Dependentvariable:
l.articles
SAR
SDM
SDEM
SLX
CapitalExpenditure
onR&D
0.120***
0.130***
0.131***
0.133***
(0.031)
(0.030)
(0.030)
(0.033)
Total
#of
ResearchersOECD
0.189***
0.206***
0.209***
0.201***
(0.062)
(0.064)
(0.063)
(0.070)
W*A
rticles
-0.055
-0.044
(0.059)
(0.058)
W*CapitalExpenditure
onR&D
-0.077***
-0.114***
-0.111
(0.075)
(0.032)
(0.033)
W*Total
#of
ResearchersOECD
0.064
0.079
0.08
(0.076)
(0.076)
(0.084)
W*E
rror
Term
-0.059
(0.063)
YearFE
XX
XX
CountryFE
XX
XX
Rsquard
0.993
Number
ofobservations
198
198
198
198
Note:
∗ p<0.1;
∗∗p<0.05;∗∗
∗ p<0.01
Inparenthesis,wepresentthestandarddeviation.
Thevariablesin
theregression
arein
logform
,so
thecoe�
cientscanbeinterpretedas
the
outputelasticities
ofcapitalandlabor.For
thespatialmodelsSAR,SDM
andSDEM
weused
thepackage
�splm�in
R,andfortheSLXthepackage
�lfe�.
18

Table9:
OECDSam
pleSpatialResults,Disaggregated
Researchers
Dependentvariable:
l.articles
SAR
SDM
SDEM
SLX
CapitalExpenditure
onR&D
0.111***
0.107***
0.107***
0.112***
(0.030)
(0.029)
(0.030)
(0.033)
Researchersin
BusinessEnterprises
-0.056
0.001
0.003
-0.006
(0.034)
(0.039)
(0.040)
(0.044)
Researchersin
Government
0.118**
0.115**
0.111**
0.111**
(0.049)
(0.047)
(0.048)
(0.053)
Researchersin
Higher
Education
0.282***
0.212***
0.205***
0.217***
(0.056)
-0.059
(0.060)
(0.066)
W*A
rticles
-0.036
-0.063
(0.056)
(0.055)
W*C
apitalExpenditure
onR&D
-0.069**
-0.075**
-0.070*
(0.034)
(0.034)
(0.038)
W*Researchersin
BusinessEnterprises
0.053
0.062*
0.057
(0.036)
(0.037)
(0.040)
W*Researchersin
Government
-0.025
-0.020
-0.020
(0.054)
(0.054)
(0.060)
W*Researchersin
Higher
Education
-0.12
-0.120
-0.098
(0.075)
(0.075)
(0.083)
W*E
rror
Term
-0.069
(0.063)
YearFE
XX
XX
CountryFE
XX
XX
Rsquard
0.994
Number
ofobservations
198
198
198
198
Note:
∗ p<0.1;
∗∗p<0.05;∗∗
∗ p<0.01
Inparenthesis,wepresentthestandarddeviation.
Thevariablesin
theregression
arein
logform
,so
thecoe�
cientscanbeinterpretedas
the
outputelasticities
ofcapitalandlabor.For
thespatialmodelsSAR,SDM
andSDEM
weused
thepackage
�splm�in
R,andfortheSLXthepackage
�lfe�.
19

Table 10: *Appendix 1 - Counties in World Bank and OECD Samples
Countries World Bank OECD
Argentina X XBelgium X XCanada XChina X XCzech Republic X XDenmark X XEstonia XFinland X XFrance X XGermany XHungary X XIreland XItaly X XJapan X XKorea X XMexico XNetherland X XNorway X XPoland X XPortugal X XRomania X XRussia X XSingapore X XSlovak Republic X XSlovenia X XSouth Africa X XSpain XSweden XTurkey X XUnited Kingdom XUnited States X.
20