scientific presentation on effects of climate on cod
TRANSCRIPT
Geir Ottersen
Centre for Ecological and Evolutionary Synthesis
Norway
Retrospective studies on cod
and climate
3rd GLOBEC Open Science Meeting Victoria, BC, Canada 22-26 June 2009
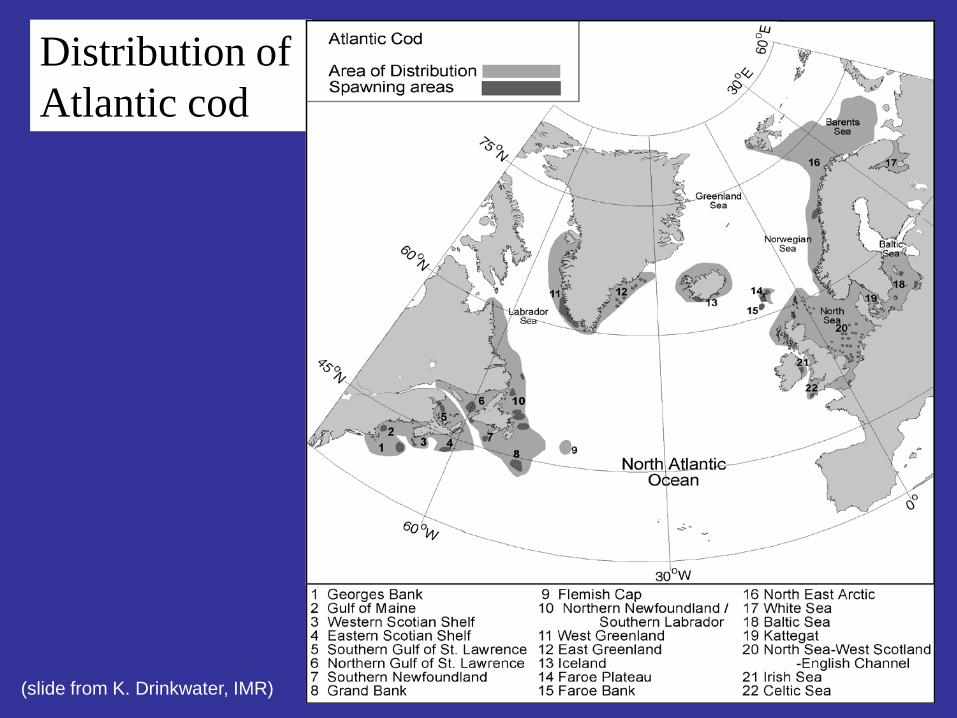
Distribution of Atlantic cod
(slide from K. Drinkwater, IMR)

Mean Annual Bottom Temperature
High Temperature decreases Recruitment
High Temperature increases Recruitment
Log
(Rec
ruitm
ent a
nom
aly)
Planque and Fredou (1999)
Temperature affects cod recruitment

Temperature accounts for most of the differences in growth rates between stocks (Brander 1994, 1995).
Temperature affects growth rates

7
7
7
6 3.5
2 6
Temperature affects age of maturity
0
1
2
3
4
5
6
7
8
0 2 4 6 8 10 12Mean Annual Bottom Temperature (°C)
Age
(yrs
)
R2=0.65
Age of maturity: Hutchings and Myers (1993) Bottom temperatures: Brander (1994)
(slide from K. Drinkwater, IMR)
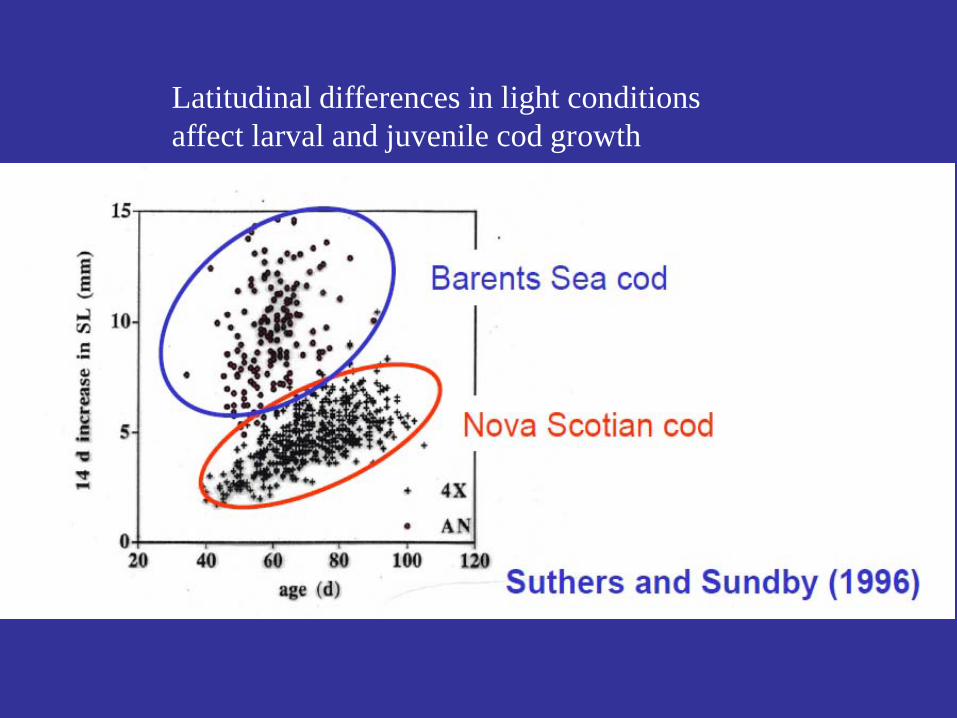
Latitudinal differences in light conditions affect larval and juvenile cod growth

NE Atlantic 11 Iceland (iceg) 12 Faroe Plateau (farp) 13 NE Arctic (arct) 14 Norwegian coast (coas) 15 W Baltic (2224) 16 E Baltic (2532) 17 Kattegat (kat) 18 North Sea (347d) 19 Irish Sea (viia) 20 Celtic Sea (7e-k) 21 W Scotland (via)
Cool - Hot- Intermediate Cod stocks based on spring T at 0-100m
Cool stocks T>4.5 °C Hot stocks T>6.5 °C
NW Atlantic 1 Georges Bank (gb) 2 Gulf of Maine (gom) 3 W Scotian Shelf (4x) 4 E Scotian Shelf (4vsw) 5 S Gulf of St. Lawrence (4tvn) 6 N Gulf of St. Lawrence (3pn4rs) 7 S Newfoundland (3ps) 8 Grand bank (3no) 9 Flemish Cap (3m) 10 N Newfoundland (2j3kl)
Irene Mantzouni DTU-Aqua, Denmark

Substantial difference between warm and cold years in survival?
Mean log(R/S) at high T Mean log(R/S) at low T
Log( )
Non parametric Wilcoxon signed-rank test
Null hypothesis: mean log(R/S) does not differ between high and low T
Ratio=1 log(Ratio)=0
Cold years/Low T: below the 25th %ile
Warms years/ High T: above the 75th %ile
Irene Mantzouni DTU-Aqua, Denmark
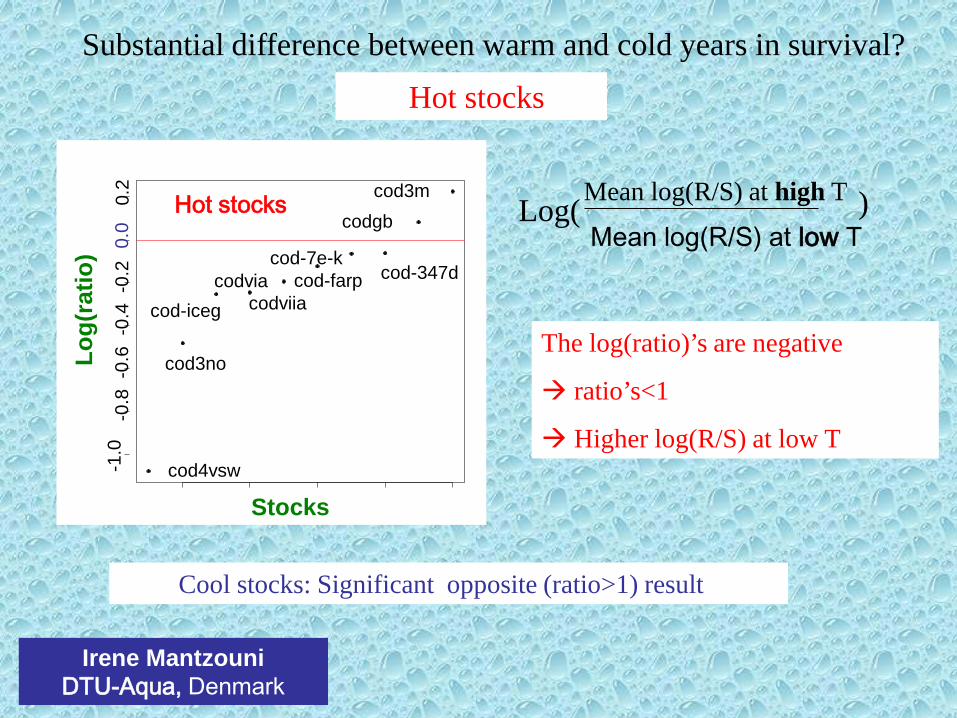
Cool stocks: Significant opposite (ratio>1) result
-1.0
-0
.8 -
0.6
-0.4
-0.
2 0.
0 0.
2
cod4vsw
cod3no
cod-iceg codviia codvia cod-farp
cod-7e-k cod-347d
codgb cod3m Hot stocks Mean log(R/S) at high T
Mean log(R/S) at low T Log( )
The log(ratio)’s are negative
ratio’s<1
Higher log(R/S) at low T
Log(
ratio
)
Stocks
Substantial difference between warm and cold years in survival?
Hot stocks
Irene Mantzouni DTU-Aqua, Denmark

Spatial and temporal differences in climate effects on recruitment to NA cod stocks
Spatial variation 1: correlations between the NAO and SST
Stige, Ottersen, Brander, Chan, Stenseth 2006. Cod and climate: effect of the North Atlantic Oscillation on recruitment in the North Atlantic. MEPS 325:227-241
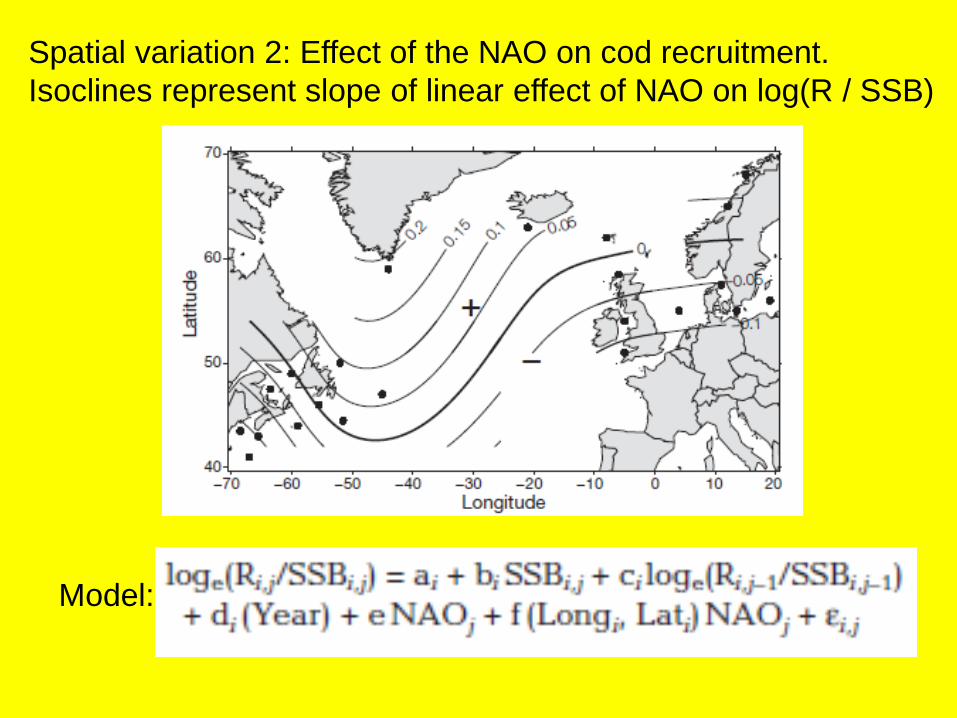
Spatial variation 2: Effect of the NAO on cod recruitment. Isoclines represent slope of linear effect of NAO on log(R / SSB)
Model:

Temporal change in the impact of the NAO on log[R/SSB]
Model:
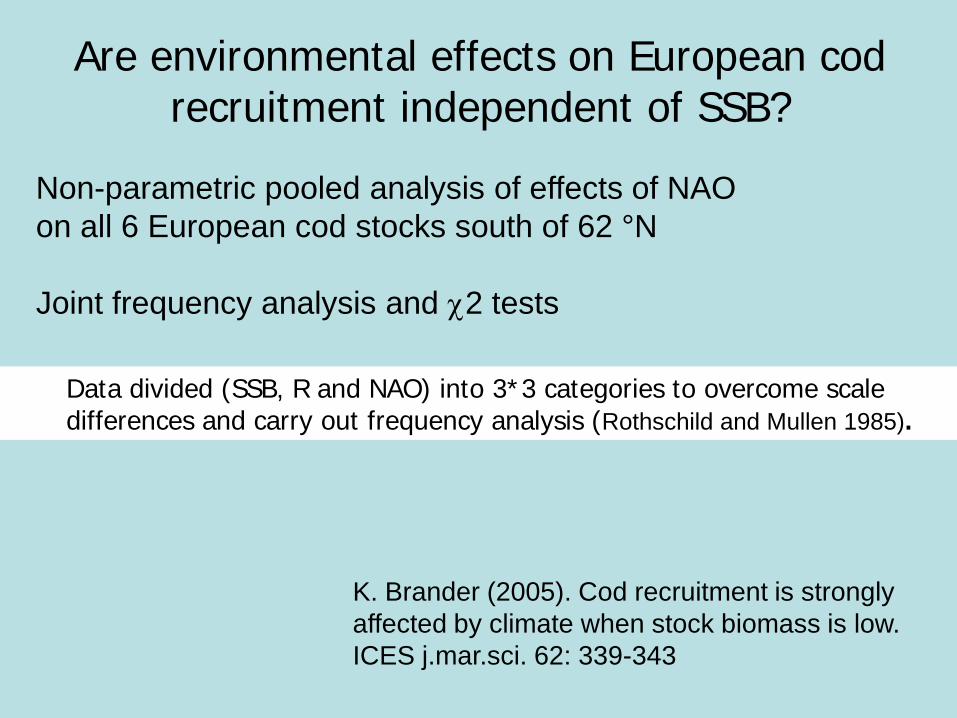
Are environmental effects on European cod recruitment independent of SSB?
Non-parametric pooled analysis of effects of NAO on all 6 European cod stocks south of 62 °N Joint frequency analysis and χ2 tests
Data divided (SSB, R and NAO) into 3*3 categories to overcome scale differences and carry out frequency analysis (Rothschild and Mullen 1985).
K. Brander (2005). Cod recruitment is strongly affected by climate when stock biomass is low. ICES j.mar.sci. 62: 339-343

The six stocks provide 200 years of data
χ2 p that R is independent of NAO <0.001 at low SSB <0.1 at med SSB >0.5 at high SSB NAO has a strong effect on recruitment when SSB is low Environmental effect is not independent of SSB

• Fewer age classes and fewer old fish at low SSB • Spawning distribution may be reduced at low SSB Begg and Marteinsdottir (2002)
Marteinsdottir and Thorarinsson (1998)
Why should environmental effects on cod recruitment be stronger at low SSB?
What are the management implications?
• Even stronger reason to avoid low SSB
• If low SBB occurs then recovery is very dependent on favourable environmental conditions
• New non-linear models are needed to explore medium and long-term consequences
We are already witnessing strong environmental effects on stocks with low SSB
Brander (2005)
Model possible cod habitat during the last glacial maximum based upon
present-day ecophysiological requirements
Verify by using two ecological-niche-models and multi-locus gene sequence data
Based upon Bigg, G.R., Cunningham, C. W., Ottersen, G. Pogson, G.H., Wadley, M.R., and Williamson, P. 2008. Ice-age survival of Atlantic cod: agreement between palaeoecology models and genetics Proc Roy Soc B (2008) 275, 163-72
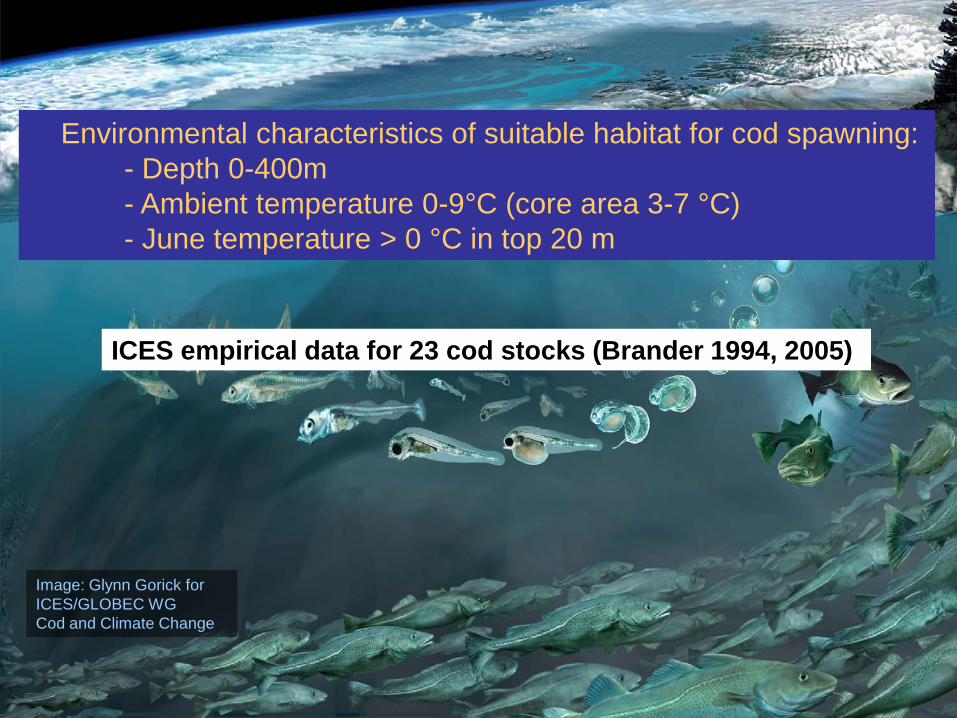
ICES empirical data for 23 cod stocks (Brander 1994, 2005)
Image: Glynn Gorick for ICES/GLOBEC WG Cod and Climate Change
Environmental characteristics of suitable habitat for cod spawning: - Depth 0-400m
- Ambient temperature 0-9°C (core area 3-7 °C) - June temperature > 0 °C in top 20 m
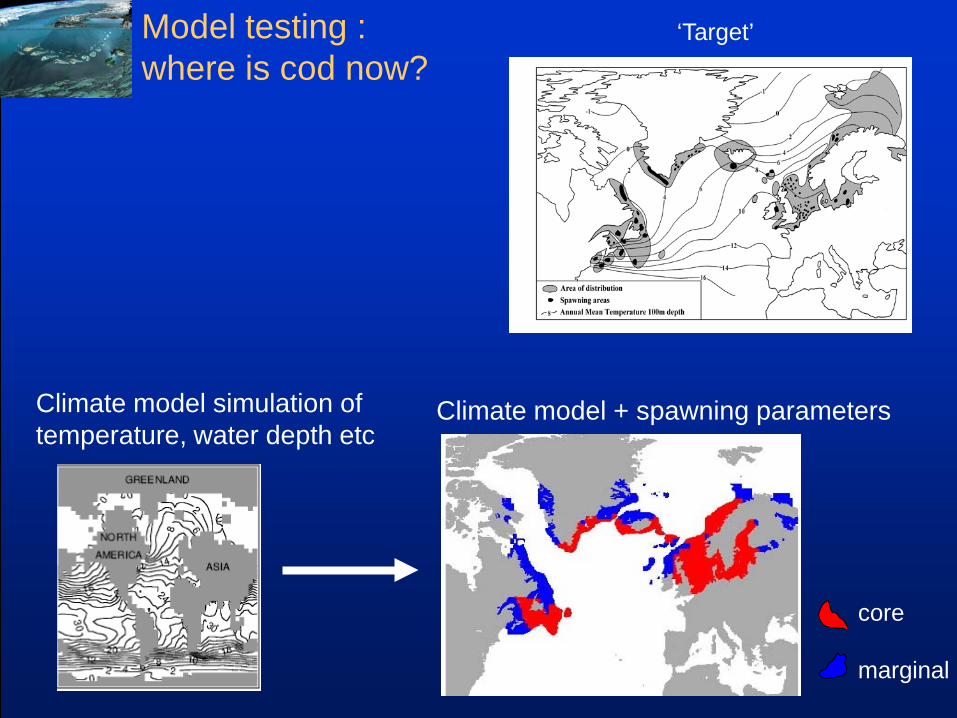
Model testing : where is cod now?
‘Target’
Climate model + spawning parameters Climate model simulation of temperature, water depth etc
core marginal
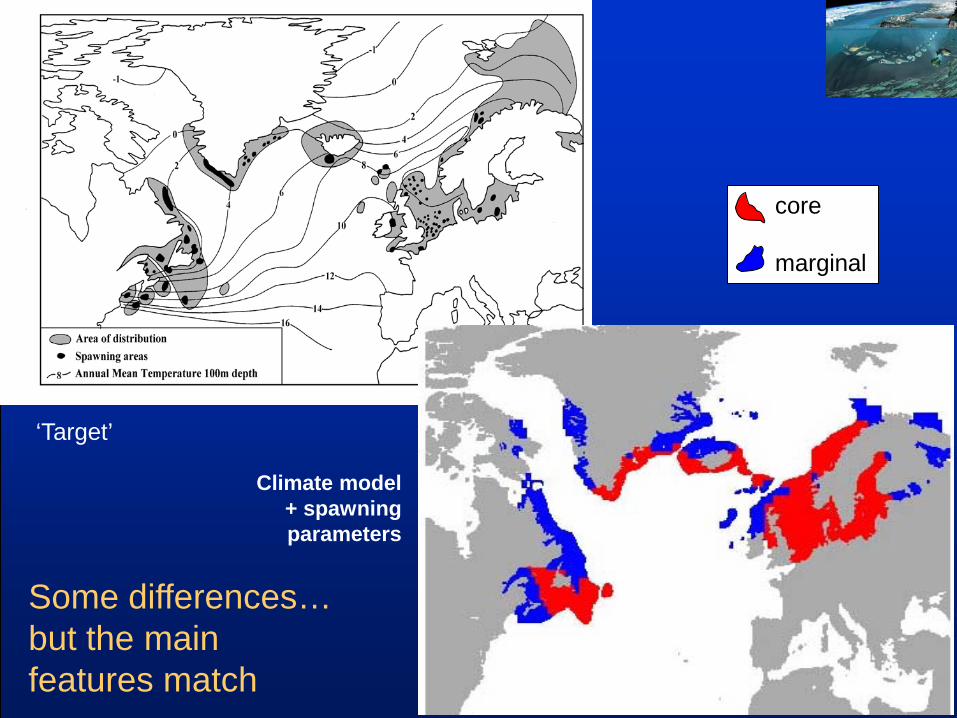
Some differences… but the main features match
‘Target’
Climate model + spawning parameters
core marginal

Result of model run for 21,000 years ago, indicating habitat suitable for cod spawning at the last glacial maximum
core marginal

Estimated time (thousand yr) since population sub-division
50-85 pre LGM
20-30 post LGM? 10-50
post LGM?
75-150 pre LGM
80-200 pre LGM
Validation by an Atlantic-wide genetic synthesis (by Cliff Cunningham & Grant Pogson)

CONCLUSION: Cod survived the last ice-age on both sides of the Atlantic, but was probably limited to European waters in the penultimate ice age, around 150k yr ago
Cod populations seem able to survive even large changes in climate
Bigg et al (2008)

Monthly values of the first PC (33.78% of the total variability).
Main variables by order of importance: 1. mean abundance of C. finmarchicus 2. mean abundance of euphausiids 3. mean size of calanoid copepod 4. mean abundance of C.
helgolandicus 5. calanoid copepod biomass 6. mean abundance of Pseudocalanus
spp.
Change in food/plankton affects North Sea cod biomass
60 65 70 75 80 85 90 95 1 2 3 4 5 6 7 8 9
10 11 12
-3
-2
-1
0
1
2
3
Gadoid outburst
Months
Beaugrand et al. 2003 Nature 426, 661-664 (Slide from K. Brander)
North Sea cod total biomass
0.0
0.5
1.0
1.5
55 60 65 70 75 80 85 90 95 100Year
Mill
ion
tons

Beaugrand et al. (2003)
Change in food/ plankton affects North Sea cod biomass
5.35.5
5.75.96.1
1958
1961
1964
1967
1970
1973
1976
1979
1982
1985
1988
1991
1994
1997
-8-6-4-202468
Pla
nkto
n ch
ange
(in b
lack
)
Total cod biomass
one-year lag(logarithm
ic scale)
Regime shift

Møre
Lofoten
Troms
Finnmark
Main spawning areas Secondary spawning areas Irregular spawning areas
Spatial change in spawning habitat of Arcto-Norwegian cod induced by climate change
Spawning areas of Arcto-Norwegian cod
Sundby and Nakken (2007)

0
50
100
150
200
1900 1910 1920 1930 1940 1950 1960 1970 1980 1990 2000
Year
Roe
inde
x, F
n
1900 1910 1920 1930 1940 1950 1960 1970 1980 1990 20002.5
3
3.5
4
4.5
5
Tem
pe
ratu
re [
C]
o
Finnmark
Troms
Møre

What can we learn from this?
• Interannual climate variation strongly influence recruitment and growth in marine populations, i.e. processes linked to population ecology.
• Interdecadal climate variations, although much smaller in amplitude, influence the ”behaviour” of marine populations, i.e. processes linked to system ecology.
• We can learn something about the influence of future climate change on marine ecosystems by the study of the interdecadal climate variability of the 20th century
Sundby and Nakken (2007)
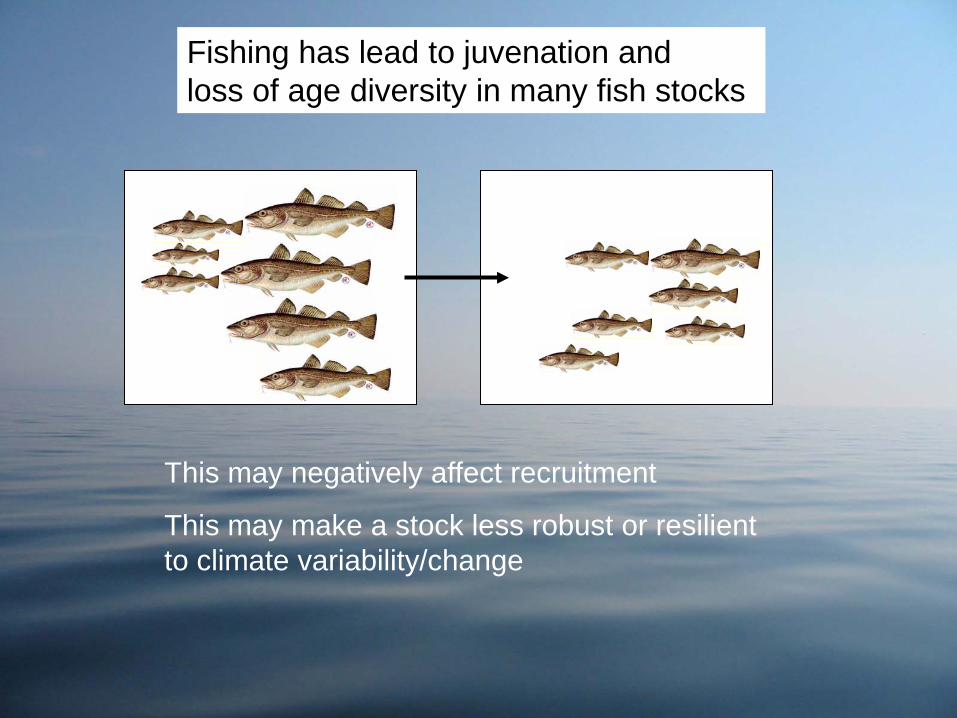
Fishing has lead to juvenation and loss of age diversity in many fish stocks
This may negatively affect recruitment
This may make a stock less robust or resilient to climate variability/change
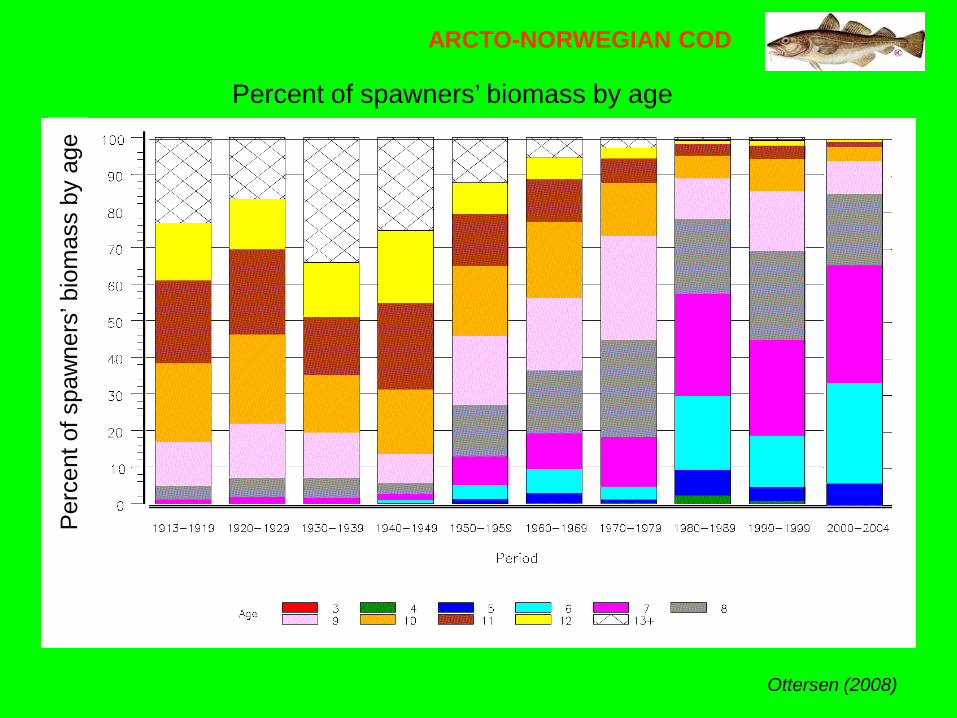
ARCTO-NORWEGIAN COD
Ottersen (2008)
Percent of spawners’ biomass by age P
erce
nt o
f spa
wne
rs’ b
iom
ass
by a
ge
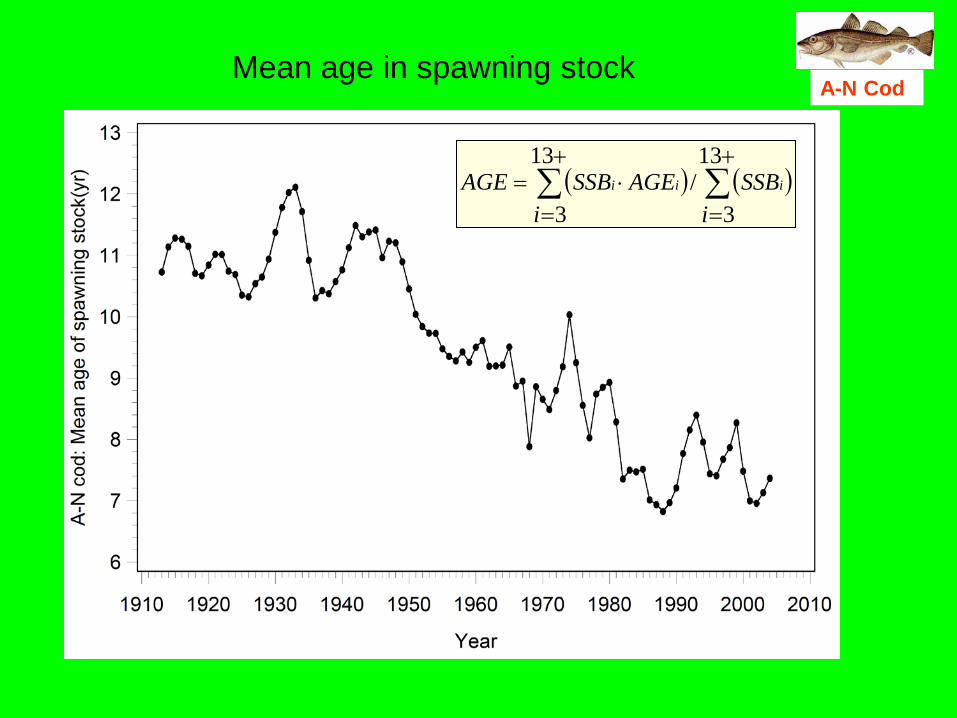
( ) ( )∑∑+
=
+
=⋅=
13
3/
13
3 iSSB
iAGESSBAGE iii
A-N Cod Mean age in spawning stock
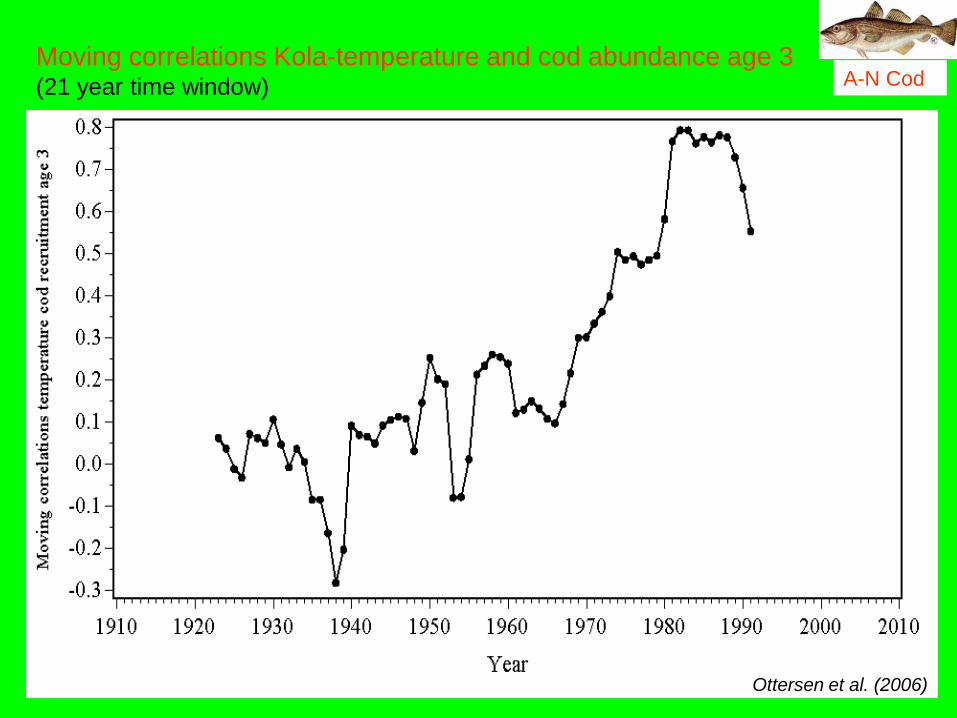
Moving correlations Kola-temperature and cod abundance age 3 (21 year time window) A-N Cod
Ottersen et al. (2006)
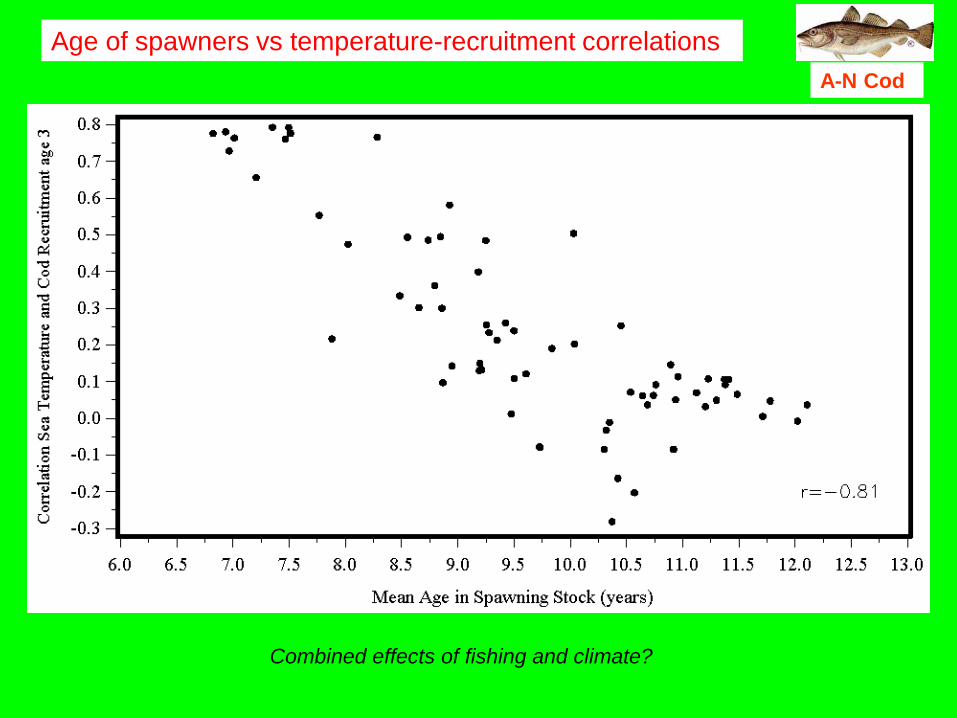
Age of spawners vs temperature-recruitment correlations
Combined effects of fishing and climate?
A-N Cod
Geir Ottersen
Centre for Ecological and Evolutionary Synthesis
Norway
Thanks, that’s all!
3rd GLOBEC Open Science Meeting Victoria, BC, Canada 22-26 June 2009