scm 1.3 information hilti guideline quality capability ... · pdf file confidential scm...
TRANSCRIPT
1 www.hilti.com Confidential SCM 1.3_Information Hilti Guideline Quality Capability Statistics | 07/2012
SCM 1.3
Information about the HILTI Guidelines for the
determination of quality capability statistics
SCM 1.3 Guideline for short-term capability study
SCM 1.3 Guideline for process capability study
Thorsten Ebert
July 2012

2 www.hilti.com Confidential SCM 1.3_Information Hilti Guideline Quality Capability Statistics | 07/2012
Agenda
• Why do we need (statistical) guidelines?
• How do you describe technical processes?
• What are process capability studies?
• What are HILTI guidelines offering?
• NOT: Any details of statistical distributions and analysis

3 www.hilti.com Confidential SCM 1.3_Information Hilti Guideline Quality Capability Statistics | 07/2012
The prerequisite for an efficient quality control and
assurance is the understanding of technical processes,
i.e. answers to the following questions:
● Is the process meeting customer specifications?
How much quality provides a process?
How much non-conforming parts can be kept to a minimum?
● Process improvements possible or achieved?
Are improvements needed in the process?
Have you sustained these improvements, or has the process regressed to its
previous unimproved state?
● How will the process perform in the future?
How capable is a process over a longer period of time?
What conclusions can we make about the process?
How can a process be as economically as possible?
What statements can we trust

4 www.hilti.com Confidential SCM 1.3_Information Hilti Guideline Quality Capability Statistics | 07/2012
The ISO / TR 10 017 defined statistical methods that may
be suitable for development, maintaining and improving a
quality management system:
Method by ISO / TR 10017 Content
Control charts Graph of data derived from samples that are periodically drawn from a process and plotted in sequence.
Descriptive statistics Descriptive statistics refers to procedures for summarizing and presenting quantitative data in a
manner that reveals the characteristics of the distribution of data.
Design of experiments (DoE) Investigations carried out in a planned manner, and which rely on a statistical assessment of results to
reach conclusions at a stated level of confidence.
Hypothesis testing Hypothesis testing is a statistical procedure to determine, with a prescribed level of risk, if a set of data
(typically from a sample) is compatible with a given hypothesis.
Measurement analysis Evaluation of uncertainties of meas. systems under the range of conditions in which the system operates.
Process capability study /
analysis
Examination of the inherent variability and distribution of a process, in order to estimate its ability to produce
output that conforms to the range of variation permitted by specifications.
Regression analysis Behaviour of a characteristic of interest (usually called the “response variable”) with potentially causal
factors (usually called “explanatory variables”).
Reliability analysis Application of engineering and analytical methods to the assessment, prediction and assurance of problem-
free performance over time of a product or system.
Sampling Sampling is a systematic statistical methodology for obtaining information about some characteristic of a
population by studying a representative fraction (i.e. sample) of the population.
Simulation Simulation is a collective term for procedures by which a (theoretical or empirical) system is represented
mathematically by a computer program for the solution of a problem.
Statistical tolerancing Procedure based on certain statistical principles, used for establishing tolerances.
Time series analysis Time series analysis is a family of methods for studying observations made sequentially over time.

5 www.hilti.com Confidential SCM 1.3_Information Hilti Guideline Quality Capability Statistics | 07/2012
Overview of statistical characteristics
● Data size
● Minimum and maximum value
● Arithmetic mean
● Median
● Mode value
● Variance s2, Standard deviation s
● Range
● Quartile, Percentile
● Kurtosis
● Skewness
● Capability indicators Cm, Cmk, Pp, Ppk, Cp, Cpk
● Excess proportion
● Confidence interval for mean, variances, capability indicators and excess
proportions

6 www.hilti.com Confidential SCM 1.3_Information Hilti Guideline Quality Capability Statistics | 07/2012
Why do we need guidelines, if we can apply
statistical methods?
● Definition of limits
● Description of a complex study
● Clear and complete definition of terms
● Integration of international statistical standards
● Description for handling of time-dependent distribution models
● Appropriate qualification linked to the various stages of qualification
● Handling of discrete features
● Indication of confidence intervals of the capability indices depending on
sample sizes
● Clarification on the use of statistical software
Various statistical procedures must be regulated so that these methods lead to
standardized and consistent decisions on the basis of data.

7 www.hilti.com Confidential SCM 1.3_Information Hilti Guideline Quality Capability Statistics | 07/2012
Analytical statistics
investigation of a sample out of a
population
• Confidence intervals
• Hypothesis testing
• Correlation analysis
Descriptive statistics
often analyses of population
• Organizing data / features
• Plots of data / features
Which sub-areas of statistics are important for a
process capability analysis?
Calculation of population characteristics Design of a mathematical model out of samples

8 www.hilti.com Confidential SCM 1.3_Information Hilti Guideline Quality Capability Statistics | 07/2012
During a process capability study different
distribution models must be considerd
unimodal
non-
symmetrical
symmetrical
polymodal

9 www.hilti.com Confidential SCM 1.3_Information Hilti Guideline Quality Capability Statistics | 07/2012
The Quantile method is universally applicable
for the calculation of capability indices
U = upper specification limit
L = lower specification limit
a = specified tolerance U - L
= process location
= process spread
= XU - XL
= L + U
(= 99.73% of the distribution)
L = lower process variation
U = upper process variation
XL = lower variation range limit X0,135%
XU = upper variation range limit X99,655%
Lower Upper
Process capability index Prozessfähigkeitsindex Minimum process capability index

10 www.hilti.com Confidential SCM 1.3_Information Hilti Guideline Quality Capability Statistics | 07/2012
The consideration of the process location μ
leads to minimum (critical) capability indices
The capability indices Pp / Cp describe
the potential capacity of a process to
produce a specific characteristic within
the prescribed limits. For this purpose,
the process spread is compared with the
tolerance T = U - L for the characteristic
U = upper specification limit
L = lower specification limit
a = specified tolerance U - L
= process location
= process spread
= XU - XL
= L + U
(= 99.73% of the distribution)
L = lower process variation
U = upper process variation
XL = lower variation range limit
= X0,135%
XU = upper variation range limit
= X99,655%
The minimum (critical) capability indices
Ppk / Cpk assess the quality capability of a
process based on a comparison of the
process spread with the tolerance range
at the same time as taking the process
location into account
Lower Upper
Process capability index Prozessfähigkeitsindex Minimum process capability index

11 www.hilti.com Confidential SCM 1.3_Information Hilti Guideline Quality Capability Statistics | 07/2012
Process indicators are linked by the statistical
model with excess proportion
Cmk
Ppk
Cpk
1-sided upper excess
proportion
2-sided upper excess
proportion
Prozess
spread
(%) ppm (%) ppm (%)
1,00 0,1350000 1350 0,2700000 2700 99,7300000
1,33 0,0031686 31,686 0,0063372 63,372 99,9936628
1,67 0,0000287 0,287 0,0000574 0,574 99,9999426
2,00 0,0000001 0,001 0,0000002 0,002 99,9999998
In general, the larger the value of each process indicator, the better the
performance to meet the requirements of the process is classified.
12 www.hilti.com Confidential SCM 1.3_Information Hilti Guideline Quality Capability Statistics | 07/2012
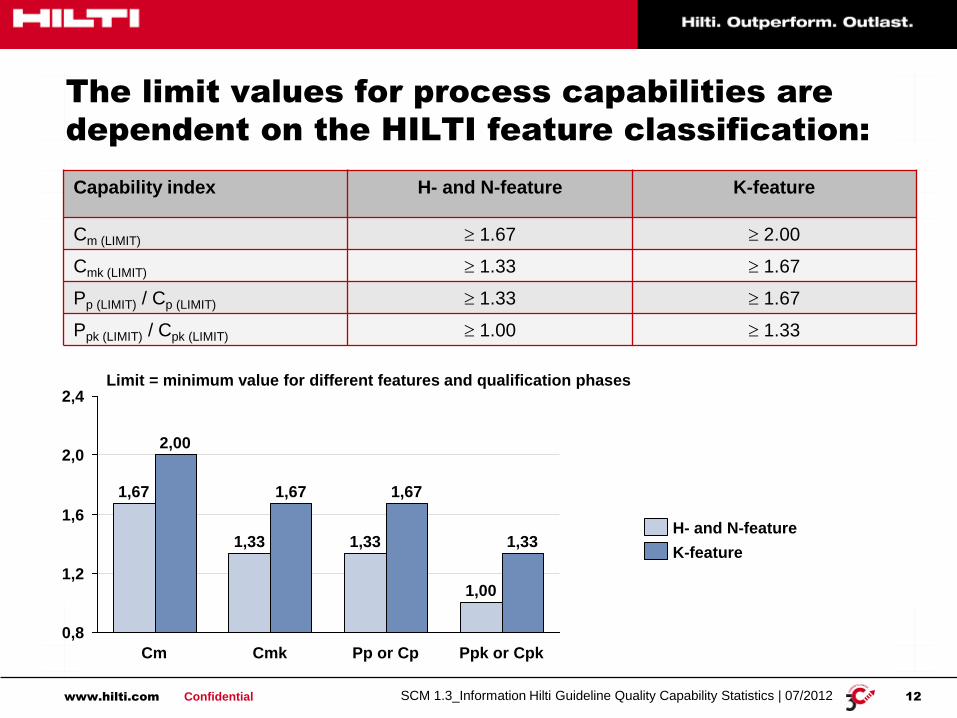
The limit values for process capabilities are
dependent on the HILTI feature classification:
Capability index H- and N-feature K-feature
Cm (LIMIT) 1.67 2.00
Cmk (LIMIT) 1.33 1.67
Pp (LIMIT) / Cp (LIMIT) 1.33 1.67
Ppk (LIMIT) / Cpk (LIMIT) 1.00 1.33
1,6
2,4
2,0
1,2
0,8
Ppk or Cpk
1,33 1,33
1,00
Pp or Cp
1,67
Cmk
1,67
1,33
Cm
2,00
1,67
K-feature
H- and N-feature
Limit = minimum value for different features and qualification phases

13 www.hilti.com Confidential SCM 1.3_Information Hilti Guideline Quality Capability Statistics | 07/2012
The guideline process capabilities considers 8
different time-dependent distribution models
Location is constant Location is not constant
Variation is constant A C
Variation is not constant B D
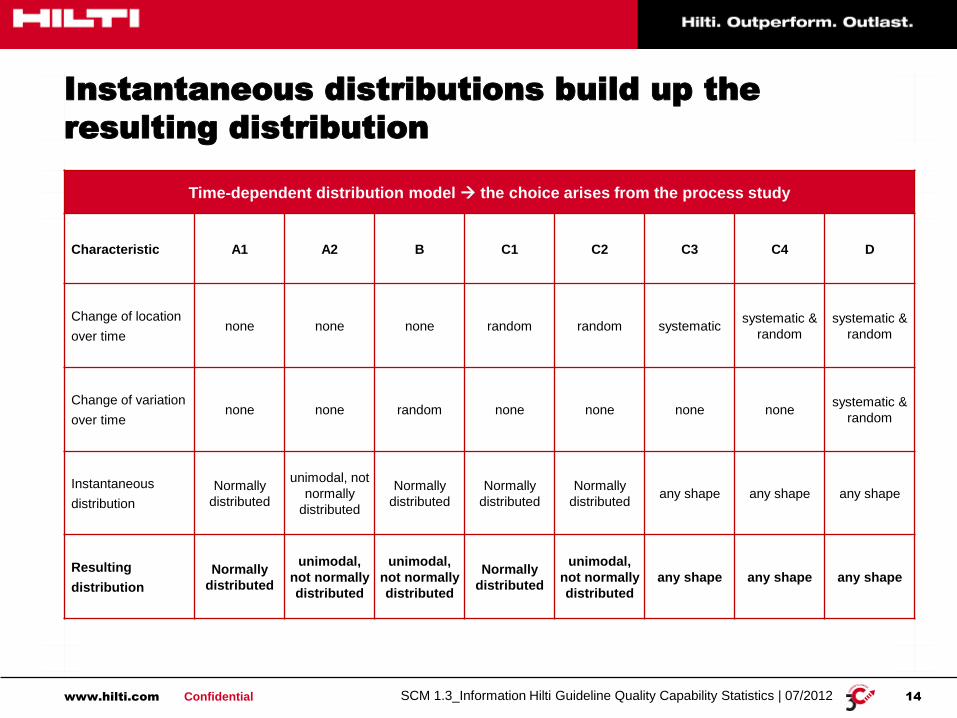
14 www.hilti.com Confidential SCM 1.3_Information Hilti Guideline Quality Capability Statistics | 07/2012
Instantaneous distributions build up the
resulting distribution
Time-dependent distribution model the choice arises from the process study
Characteristic A1 A2 B C1 C2 C3 C4 D
Change of location
over time none none none random random systematic
systematic &
random
systematic &
random
Change of variation
over time none none random none none none none
systematic &
random
Instantaneous
distribution
Normally
distributed
unimodal, not
normally
distributed
Normally
distributed
Normally
distributed
Normally
distributed any shape any shape any shape
Resulting
distribution
Normally
distributed
unimodal,
not normally
distributed
unimodal,
not normally
distributed
Normally
distributed
unimodal,
not normally
distributed
any shape any shape any shape

15 www.hilti.com Confidential SCM 1.3_Information Hilti Guideline Quality Capability Statistics | 07/2012
Different qualification phases require different
measures
Process study before series production Start of series product.
Process study during series production
Measuring system analysis
↓
Gage R&R study
Short-term
process analysis
↓
Short-term
capability study
Preliminary process analysis
↓
Process performance study
Long-term process analysis
↓
Process capability study
Minimum quantity 50 pieces
or as appropriate to the
process
Minimum
quantity 50
pieces or as
appropriate to
the process
Minimum quantity 100 pieces
or as appropriate to the
process. To keep the requisite
control chart, a minimum of
20 individual random samples
are necessary
An appropriate period under normal series
conditions, during which it can be assured that
all influential factors can take effect. (standard
value: 20 production days); total random sample
size ≥ 125
Cg / Cgk,
Gage R&R Cm / Cmk Pp / Ppk Cp / Cpk
Indicator for the
measurement quality before
commencement of data
acquisition
Indicator of a
process under
short-term, ideal
conditions
Indicator of a process under
real-life conditions (influence
of 5M factors), which has not
yet been proven to be in a
state of statistical control
Indicator of a process under series production
conditions (full influence of 5M factors), which
has previously been proven to be in a state of
statistical control

16 www.hilti.com Confidential SCM 1.3_Information Hilti Guideline Quality Capability Statistics | 07/2012
PPM-3.2 TTM
Capability studies need to be aligned with PPM
and SCM tasks
G1 G2 G3 G4 G5 G6
SCM-1.3 Qualifizierung von Herstellprozessen
Planning Execution & Doc. Testing & Release Proof of Sustainibility
QN
Quality of 0-series
production and
product confirmed
QA
Plan for quality of
series product. test
PQA
Product
quality
assessment
Quality
assurance
plan
QEST
Quality of
development in
complete system
QN
Plan for quality of
0-series test
Planning of
qualification
steps
Prototype/Sample parts Pre-series parts Series parts
QA
Quality of series
production
Sample Inspection
(acc. SI overview)
(Cmk proven)
Sample Inspection
close to series
production.
Plant and SC
statements
(Cmk / Ppk prov.)
Sample Inspection
series production
(Cpk proven)
QEST
Quality of
development in
complete system
QE
Plan for quality of
system test

17 www.hilti.com Confidential SCM 1.3_Information Hilti Guideline Quality Capability Statistics | 07/2012
SCM 1.3 „Sample Inspection Guideline“ is
setting limits for the qualification
* Production allowed with Inspection waiver / deviation approval (ABE)
The SI-Level target refers to the SI sample inspection summary and the rating roles in the SI policy
TTM Gate
SI-Level G4 G5 G6
P
Process conforming 100%
A
Quality conforming 60% 80% 100%
B
Partly quality conforming
*
40% 20% 0%
C
Not quality conforming 0% 0%
Open
Not rated yet 0% 0%
18 www.hilti.com Confidential SCM 1.3_Information Hilti Guideline Quality Capability Statistics | 07/2012
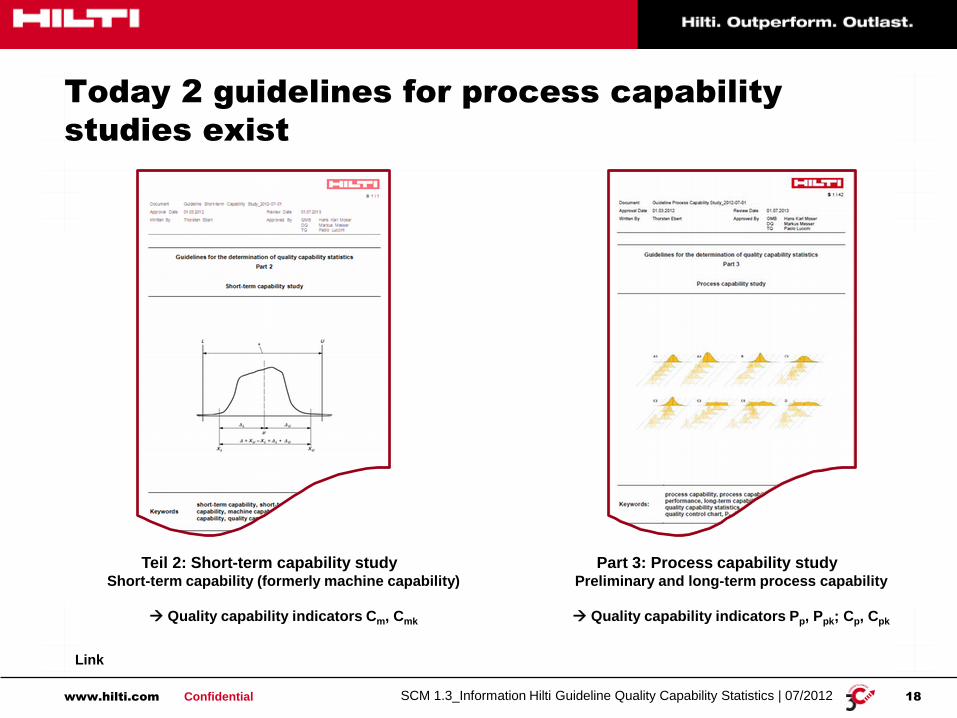
Today 2 guidelines for process capability
studies exist
Teil 2: Short-term capability study Short-term capability (formerly machine capability)
Quality capability indicators Cm, Cmk
Part 3: Process capability study Preliminary and long-term process capability
Quality capability indicators Pp, Ppk; Cp, Cpk
Link

19 www.hilti.com Confidential SCM 1.3_Information Hilti Guideline Quality Capability Statistics | 07/2012
What are the key messages out of the new
guidelines?
● Description of a complex study
This policy does not replace basic statistical skills that are absolutely
necessary in order to fully understand or even interpret results.
● By integrating international, statistical formulas and standards terms and
definitions are clearly set.
● Different qualification phases require different measures.
● Through distribution and process models, the time dependencies of technical
processes are recorded over time.
● The handling of discrete features is explained.
● Emphasizes the dependence on sample sizes.
● For a complete capability study the use of an appropriate statistical software for
process qualification (HILTI: qs-STAT) is mandatory.
● Defining of limit values for process capability indices.