score annual conference 2010 - score-education.org · science education in hong kong and ......
TRANSCRIPT

Wai-Leung KWONGThe Chinese University of Hong Kong
26–2-2010
HKPISA CentreHKPISA CentreHKPISA CentreHKPISA Centre
SCORE Annual Conference 2010
Science Education in Hong Kong and
Some Underlying Factors

2
Science Performance in PISA
• Cognitive competencies: high in general
• Affective: Low self-concept
• Equality standards – no significant gender difference
– comparatively low SES impact
PISA

3
Science in the School Curriculum
• Science-related subjects ~ grade levels
• Instructional time
• Resources.
Curriculum

4
Major Factors contributing to Science Performance
• Socio-cultural - the fundamental factor– Education highly valued
• cultural heritage• the community in post-war Hong Kong: refugees
• Institutional – Comparable resources among schools –
achieving equality
• The UK connection– Curriculum reform in the 70’s– People
Resources

5
Some negative factors
• Change in mode of economy or career prospect: industrial – financial service
• Guided discovery approach (coupled with language barrier – English instruction)– Prescriptive procedures– Guided observation & conclusion
• Textbook publishing practice– Closely follow official curriculum guide– Translate from English to Chinese
• The diminishing role of teacher organisations

6
Performance in PISA 2006
Science Mathematics Reading Countries Mean S.E. Countries Mean S.E. Countries Mean S.E.
Finland 563 (2.0) Chinese Taipei 549 (4.1) Korea 556 (3.8)
Hong Kong 542 (2.5) Finland 548 (2.3) Finland 547 (2.1)
Canada 534 (2.0) Hong Kong 547 (2.7) Hong Kong 536 (2.4)
Chinese Taipei 532 (3.6) Korea 547 (3.8) Canada 527 (2.4)
Estonia 531 (2.5) Netherlands 531 (2.6) New Zealand 521 (3.0)
Japan 531 (3.4) Switzerland 530 (3.2) Ireland 517 (3.5)
New Zealand 530 (2.7) Canada 527 (2.0) Australia 513 (2.1)
Australia 527 (2.3) Macao-China 525 (1.3) Liechtenstein 510 (3.9)
Netherlands 525 (2.7) Liechtenstein 525 (4.2) Poland 508 (2.8)
Liechtenstein 522 (4.1) Japan 523 (3.3) Sweden 507 (3.4)
OECD average 500 (0.5) OECD average 498 (0.5) OECD average 492 (0.6)
Change in Scores across Cycles
Cycle Mean S.E.
2000 (541) 3.0
2003 (539) 4.3
2006 542 2.5
(Figures) in bracket may not be fairly compared -
scale not fully established.
Performance: consistently high across cycles

7
Performance in Different Competencies
Comparison of Percentage of Correct Answer in Different Competencies of Scientific
Literacy between Hong Kong and the OECD Countries
58.5
60.1
64.7
50.2
55.1
55.5
0 10 20 30 40 50 60 70
3. Using Scientific Evidence
2. Identifying Scientific Issues
1. Explaining Phenomena Scientifically
Percentage Correct
Hong Kong OECD Countries
Relatively weak
8
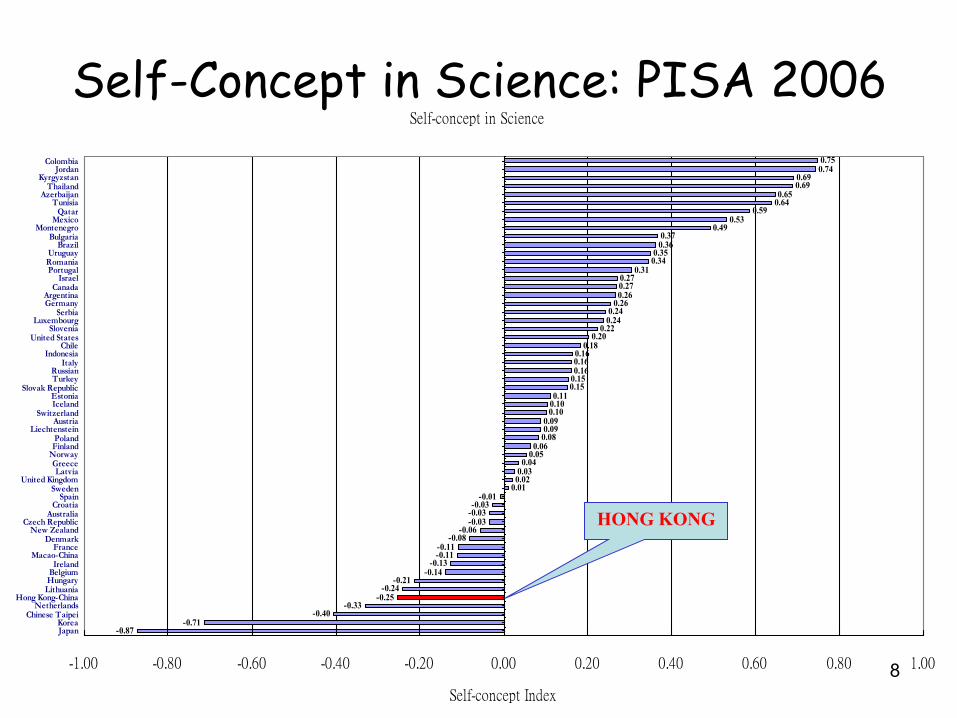
Self-Concept in Science: PISA 2006Self-concept in Science
-0.87-0.71
-0.40-0.33
-0.25-0.24
-0.21-0.14
-0.13-0.11-0.11
-0.08-0.06
-0.03-0.03-0.03
-0.010.010.020.03
0.040.050.06
0.080.090.09
0.100.100.11
0.150.150.160.160.16
0.180.20
0.220.240.24
0.260.260.270.27
0.310.340.35
0.360.37
0.490.53
0.590.640.65
0.690.69
0.740.75
-1.00 -0.80 -0.60 -0.40 -0.20 0.00 0.20 0.40 0.60 0.80 1.00
JapanKorea
Chinese TaipeiNetherlands
Hong Kong-ChinaLithuaniaHungaryBelgiumIreland
Macao-ChinaFrance
DenmarkNew Zealand
Czech RepublicAustralia
CroatiaSpain
SwedenUnited Kingdom
LatviaGreece
NorwayFinlandPoland
LiechtensteinAustria
SwitzerlandIcelandEstonia
Slovak RepublicTurkeyRussian
ItalyIndonesia
ChileUnited States
SloveniaLuxembourg
SerbiaGermanyArgentina
CanadaIsrael
PortugalRomaniaUruguay
BrazilBulgaria
MontenegroMexico
QatarTunisia
AzerbaijanThailand
KyrgyzstanJordan
Colombia
Self-concept Index
HONG KONG

9
Comparison of Performance by Gender
Gender Differences in Scientific, Reading and Mathematical Literacy in HKPISA
2000+, HKPISA 2003 and HKPISA 2006
7
4
-3
9
16*
-31*
-32*
18*
-16*
-40 -30 -20 -10 0 10 20 30
Mathematics
Reading
Science
HKPISA2000+
HKPISA2003
HKPISA2006
Insignificant difference
Girls perform better Boys perform better
Note: Statistically significant differences are indicated by an asterisk*
Comparison of Mean Scores in Scientific Literacy between Hong Kong Girls and
Boys at Different Percentiles
300
350
400
450
500
550
600
650
700
0 20 40 60 80 100
Percentile
Sci
ence
Sco
re
Boys
Girls

10
300
400
500
600
700
-2.5 -2 -1.5 -1 -0.5 0 0.5 1 1.5 2 2.5
Index of Economic, Social and Cultural Status (ESCS)
Performance
Below
Level 1
Level 1
Level 2
Level 3
Level 4
Level 5
Level 6
Finlan
d
Germany Japan Kore
a
Sweden UK Taipei Hong Kong
The Equality Dimension of PerformanceSelected Socio-Economic Gradients in PISA 2006
Chinese Taipei Hong Kong
Finland
26:1
31:1
42:1
UK - 48:1
Gradient = Score point difference per unit change on the ESCS

11
How schools are organisedStage vs Age
Stage No. of years Age
Kindergarten 3 (K1-3) 3 - 6
Primary 6 (P1-6) 6 – 12
Junior Secondary 3 (S1-3) 12 – 15
Senior Secondary 2(S4-5) 15 – 17
Matriculation 2(S6-7) 17 – 19
Tertiary 3 (university)

12
How Science Instruction is organised
General Studies
Science (S1-3)
Phy/Chem/Bio
Phy/Chem/Bio
Human Bio/S&T
Liberal Studies
Science Stream Arts streamTechnical
stream
S4 – 5
S6 – 7
S1 – 3
P1 – 6
12 – 14
15 – 16
17 – 18
6 – 11
Age
Basic
Education
A-Level
O-Level Engg.
Sci
Engg.
Sci

13
How Science Instruction is organised: Instructional Time
• P1- 6: General Studies (A compulsory subject)– Covers elements of Science, Technology and Humanities
– 20% of total curriculum time
– i.e. curriculum of Science ~ 6-7%
• S1-3: Science (A compulsory subject)– Integrated approach
– 10-15% of total curriculum time
• S4-7: Science/Arts stream– S4-5: Bio, Chem, Phy (8-10 % of total curriculum time each)
– S6-7: Bio, Chem, Phy (16-20% of total curriculum time each)

14
Stage (Years) Subject Remark
Primary
(6)General Studies
No lab provision
Projects, visits and field trips
Teachrs not subject specialist
Junior Sec
(3)
Senior Sec
(2)
Matriculation
(2)
Tertiary (3)
How Science Instruction is organised: ResourcesStage (Years) Subject Remark
Primary
(6)General Studies
No lab provision
Projects, visits and field trips
Teachrs not subject specialist
Junior Sec
(3)Int. Science
Standardised provision of lab,
material & apparatus;
Teachers mostly subj specialist
Senior Sec
(2)
Matriculation
(2)
Tertiary (3)
Stage (Years) Subject Remark
Primary
(6)General Studies
No lab provision
Projects, visits and field trips
Teachrs not subject specialist
Junior Sec
(3)Int. Science
Standardised provision of lab,
material & apparatus;
Teachers mostly subj specialist
Senior Sec
(2)Science stream
3 specialised labs;
Trs - Subject specialists;
Matriculation
(2)
Tertiary (3)
Stage (Years) Subject Remark
Primary
(6)General Studies
No lab provision
Projects, visits and field trips
Teachrs not subject specialist
Junior Sec
(3)Int. Science
Standardised provision of lab,
material & apparatus;
Teachers mostly subj specialist
Senior Sec
(2)
Science stream
Phy, Chem, Bio
3 specialised labs;
Trs - Subject specialists;
Matriculation
(2)
A-L & AS-Level
Phy, Chem, Bio
Practical assessment
(now school-based)
Tertiary (3)

15
School Categories School Categories by Funding & by Funding & GovernanceGovernance (2006-07)
School category Number (%)
Government 36 (7)
Aided 380 (78)
Direct Subsidy Scheme 43 (9)
Private 27 (6)
Total 486 (100)
Public funding

16
Standardised Provision: Laboratory & Equipment

What happens to the colour of the indicator?
Exhaled air contains ______ (less/more) carbon
dioxide than fresh air.
Example: guided discovery in textbooks

Which splint burns more [less] brightly?
Exhaled air contains ______ (less/more) oxygen
than fresh air.
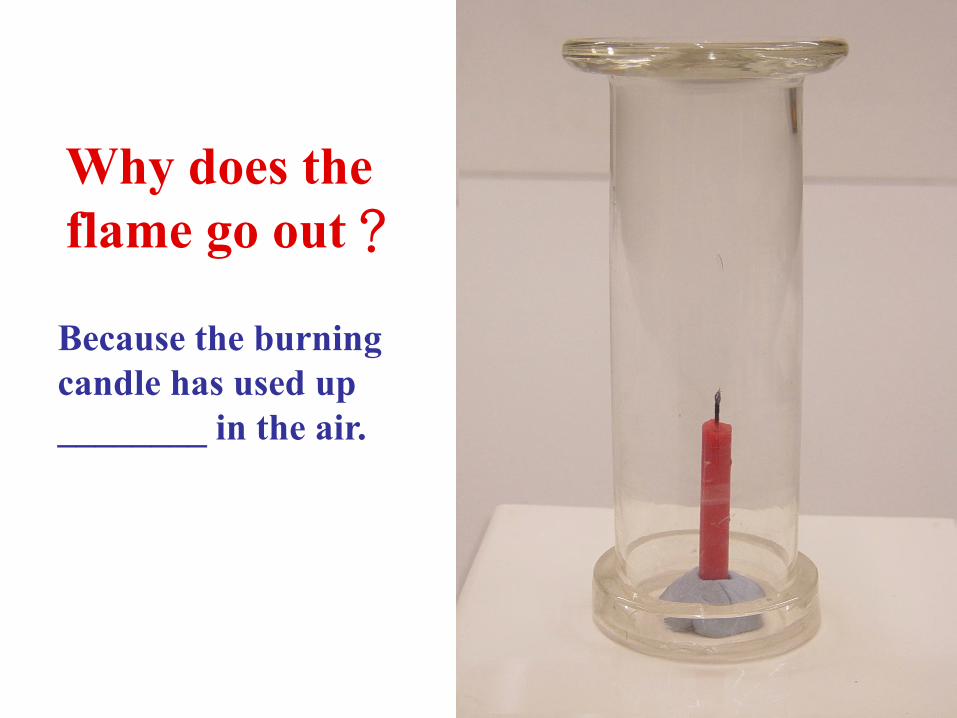
Why does the
flame go out?
Because the burning
candle has used up
________ in the air.

20
What can students learn ?What can students learn ?•• manipulative skillsmanipulative skills•• observation observation •• fragmented reasoningfragmented reasoning
What can students learn ?What can students learn ?•• manipulative skillsmanipulative skills•• observation observation •• fragmented reasoningfragmented reasoning
but little opportunity to:but little opportunity to:•• identify problems for investigation identify problems for investigation •• formulate hypothesisformulate hypothesis•• design experimentsdesign experiments
but little opportunity to:but little opportunity to:•• identify problems for investigation identify problems for investigation •• formulate hypothesisformulate hypothesis•• design experimentsdesign experiments
Problems of Problems of Guided DiscoveryGuided DiscoveryCoupled w language barrierCoupled w language barrier

21
Influential Science Educators
John Willett
Terry Allsop
Jack Holbrook
22
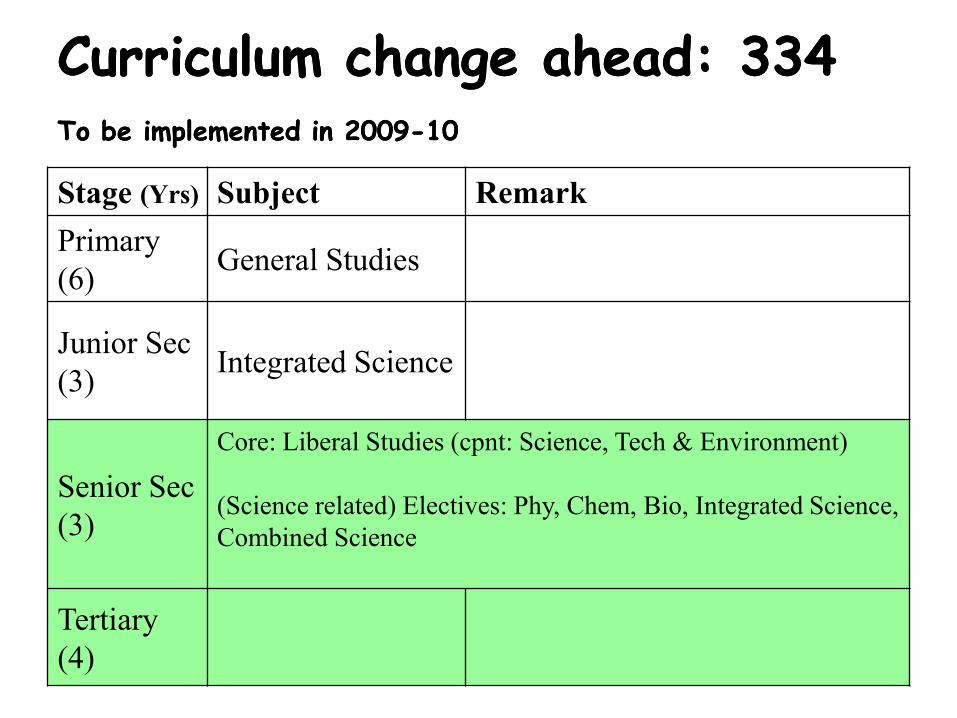
Curriculum change ahead: 334Curriculum change ahead: 334To be implemented in 2009To be implemented in 2009--1010
Stage (Yrs) Subject Remark
Primary
(6)General Studies
Junior Sec
(3)Integrated Science
Senior Sec
(3)
Core: Liberal Studies (cpnt: Science, Tech & Environment)
(Science related) Electives: Phy, Chem, Bio, Integrated Science,
Combined Science
Tertiary
(4)

23
Additional Support to schools with more ALAS
(Academically Less Able Students)
Remedial Classes for major subjects (i.e. smaller class,
additional teachers)
Schools with „bottom 10%‟ low achievers (additional teachers)
Expert Support (from EDB, universities) for School-Based
Curriculum Development
Misc. schemes involving additional resources (e.g. language
teachers, library funds, counselling professionals)
Institutional Factor contributing to Performance
Positive Discrimination Policy

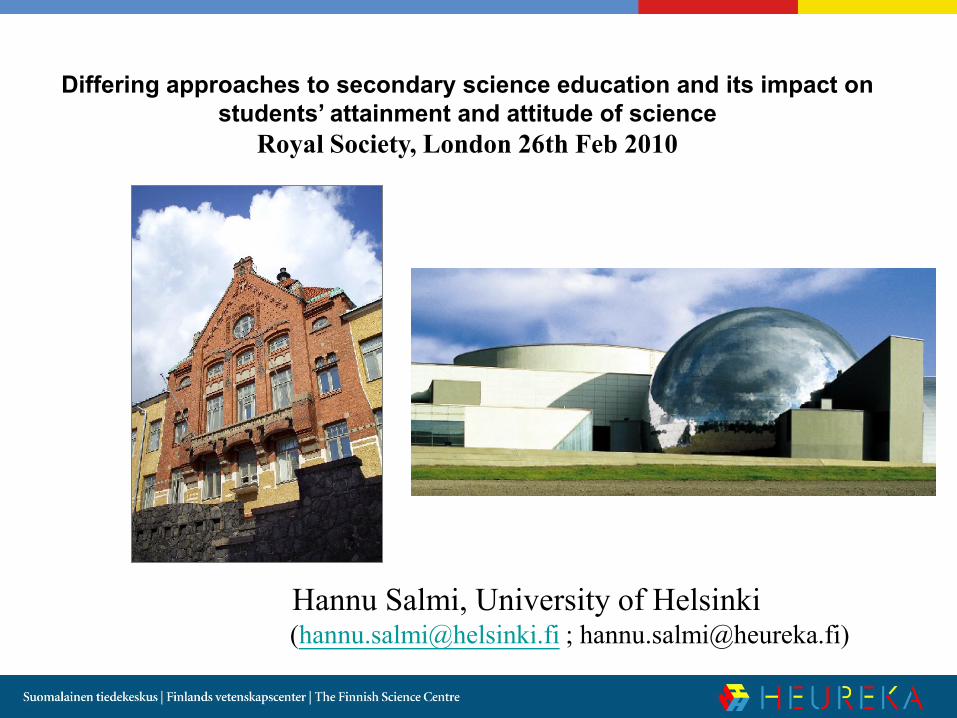
Differing approaches to secondary science education and its impact on
students’ attainment and attitude of science
Royal Society, London 26th Feb 2010
Hannu Salmi, University of Helsinki([email protected] ; [email protected])

Formal education / Informal learning (Salmi 1993, 2003 )
LEARNING BY CHANCE
INFORMAL LEARNING
Family Museum
Peer groups Library
Organisations Science centre
Mass media
www
FORMAL EDUCATION
School system Special Education
pre-school
primary school
secondary Vocational schools
higher
university
Adult education

Science, technology and education
Towards public understanding of science
(Salmi 1993, 2001)

R & D: percentange of GNI 1991-2006 (OECD)
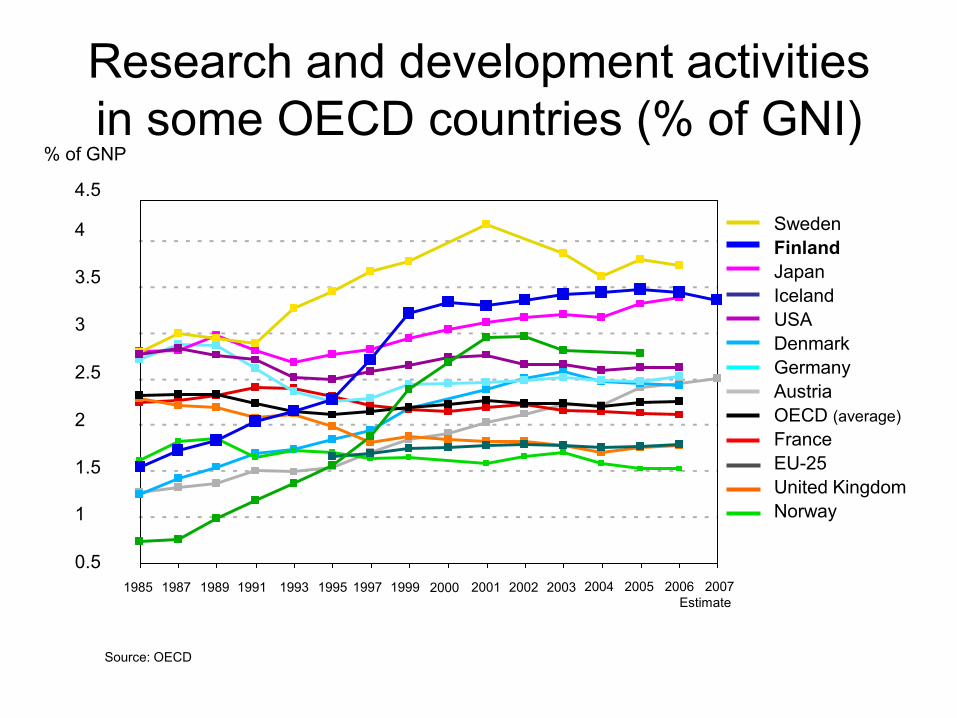
Research and development activities
in some OECD countries (% of GNI)
Source: OECD
1
1.5
2
2.5
3
3.5
4 Sweden
Finland
Japan
Iceland
USA
Denmark
Germany
Austria
OECD (average)
France
EU-25
United Kingdom
Norway
4.5
1991 198919871985 1999199719951993 20022000 2001 2003 2004 2005 2006 2007
Estimate
0.5
% of GNP


PISA06:
Analysis, Reflections, Explanations
http://www.minedu.fi/export/sites/default/OP
M/Julkaisut/2008/liitteet/opm44.pdf?lang=e
n


Students‟ attitudes in science
(PISA06: item analysis I)
1. ”Support for scientific enquiry.”
- indicates and aims students value life
situations related to science
2. ”Self-belief as science learners.”
- assesses students‟ appraisals of their
own abilities in science
[Hautamaki & al. 2009, 181-205]

Students‟ attitudes in science
(PISA06: item analysis II)
3. ”Interest in science.”
Predictor for later engagement in science related careers.
4. ”Responsibility towards resources and environments.”
Included due to the growing global concern for environmental issues and the need for sustainable development.
[Hautamaki & al. 2009]

Attitudes&Motivation: case Finland I
- Strong performance in all cognitive tests
(reading, mathematics, sceince, etc.)
- The attitudes: just about average…
…like in many developed hightech countries

Attitudes&Motivation: case Finland II
• Conclusion: some concerns related to readiness to follow a career in advanced science
• Cognitive outcomes cannot be simply explained by students‟ attitudes (OECD)
• In Finland: students‟ attitudes and beliefs do have explantory power…
• ….which accordingly must be paid attention to in thre educational discourse

Study / Career choices
• ”choose - chosen” –dilemma [!]
• Tradition:
- social presure
- career orientated
- content orientated
- career advisory and campaigns
-----------------------
- vs. informal learning sources [!]

Study / Career choices
• informal learning sources as a factor of study career choices has nearly been neglected in the literature (Woolnough 1994)
• hobbies; entertainment; web; etc. seem to have strong correlation on study / career choices (Salmi 2003)
• extra-curricular activities essential ”accelator”
• personal encouragement by teacher – tutor helps to brake the traditional ”predestination” choices (gender, talent, social habit, etc.)
Situation motivation
• Situation motivation:
motivation grows from a new situation.
Temporary, external factors are important.
Social relations are often an affecting factor.
Entertainment.
• Typical features:
• * short-lasting
• * learning is easily disturbed
• * learning is orientated to irrelevant subjects

Instrumental motivation
• Instrumental motivation: the basis is to get a reward and/or to avoid punishment. The main stimulus is „to get things done‟ rather than being interested in the deeper meaning of the subject.
• Typical features:
• * the goal is often to pass an examination
• * the learning of isolated facts, but not common principles
• * connections or the theoretical background are less important for the learner
• * facts are very quickly forgotten after an examination

Instrumental Motivation [T0]: gender
• Boys had higher
instrumental
motivation level
• the difference was
statistically significant
• Boys tend to have
instrumental goals
38,5
39
39,5
40
40,5
41
41,5
42
42,5
43
Cell
Mean
1 2
Interaction Line Plot for InstrumentalMotivation
Effect: Gender
Error Bars: 95% Confidence Interval
Intrinsic motivation
• Intrinsic motivation: The basis of this motivation is a real interest in the topic studied. No other person persuades. Curiosity, exploring and problem solving are key elements of this motivation.
• Typical features:
• * a critical and open-minded attitude to learning
• * seeing the connection between isolated facts and the topic area as a whole
• * connection between theory and practice
•

Intrinsic Motivation [T0]: gender
• Girls had higher level
of intrinsic motivation
than boys
• The difference was
statitically significant
• According the
literature, this is
typical phenomenon
at this age
25
25,5
26
26,5
27
27,5
28
28,5
Cell
Mean
1 2
Interaction Line Plot for IntrinsicMotivation
Effect: Gender
Error Bars: 95% Confidence Interval

Towards open learning environments
“The aim is not solely to produce more
scientists and technologists; it is also to
produce a new generation of citizens who
are scientifically and technologically
literate and are thus better prepared to
function in a world that is increasingly
being influenced by science and
technology (Coombs 1985).”

References:
Salmi, H. & Sotiriou, S. & Bogner, F. 2009. Visualising the Invisible in Science
Centres and Science Museums: Augmented Reality (AR) In Karacapilidis,
N. (ed.): Web-Based Learning Soultions for Communities of Practice.
Hershey, New York.
Hautamäki, J. & al. 2008. PISA06. Analysis, Reflections, Explanations.
University of Helsinki. Min. of Education. 2008: 44.
Salmi, H. 2005. Open Learning Environments: combining web-based virtual
and hands-on science centre learning In E-LEARNING AND VIRTUAL
SCIENCE CENTERS by Wee, L. & Subramaniam, R.Idea Group, Hershey,
USA
Salmi, H. 2003.Science centres as learning laboratories. Int. Jour. Of
Technology Management, vol.25, no 5, 460-476.
Salmi, H. 1993. Science centre education. Research Report 119. University of
Helsinki.

SCIENCE EDUCATION IN SECONDARY SCHOOLS:
A UNITED STATES PERSPECTIVE
A Presentation for theSCORE
(Science Community Representing Education)First Annual Conference
Rodger W. BybeeExecutive Director (Emeritus)
Biological Sciences Curriculum Study (BSCS)
The Royal SocietyLondon, England
26 February 2010

INTRODUCTION AND OVERVIEW
Current Approaches to Science Teaching in SecondaryEducation
Improving Student Learning of Science
Reforming National Policies, Science Programs, andTeaching Practices
Teaching Science As Inquiry and Developing a DeepTechnical Workforce
Achieving Scientific Literacy for All

CURRENT APPROACHES TO SECONDARY SCIENCE EDUCATION
Current approaches represent a mixture of national policies,
state requirements, curriculum materials, instructionalstrategies, cultural influences, and teachers’ knowledge andskills.
_____THE RESULTS_____
Incoherence among Components of the Science EducationSystem
Low Student Achievement
Poor Student Attitudes
Inadequate Abilities and Skills
THE NEED TO ATTAIN HIGHER LEVELS OF STUDENT ACHIEVEMENT
FOR ALL STUDENTS
Results on National Assessments
Results on International Assessments
The low student achievement has stimulated discussions
of reform and improvement of science education

IMPROVING SCIENCE TEACHING—AT A SCALE THAT MAKES A
DIFFERENCE
Adapted from: Richard Elmore. “Improving the Instructional Core.” In City, E., Elmore, R.,
Fiarman, S., & Teite, L. (2009). Instructional Rounds in Education: A Network Approach to
Improving Teaching and Learning. Cambridge, MA: Harvard Education Press.
Increase Students’
Active Learning of
STEM Content
(Curriculum-Instruction-
Assessment)
Increase the Level and
Emphasis on STEM
Content
(Common Core Standards)
Increase the Skills and
Knowledge that Teachers
Bring to Teaching STEM
Content
(Professional Development)
Development)
_____THE CHALLENGE_____

REFORMING NATIONAL POLICIES
New “Common Core” Standards for Science Education
Agreement by 48 States to Use the New Standards

IMPLEMENTING COMMON STANDARDS IN PROGRAMS AND
PRACTICES
Accepting New Standards by States
Supporting New Science Curricula and Assessment
Providing Teacher Education and Professional Development Programs

TEACHING SCIENCE AS INQUIRY AND DEVELOPING A 21ST CENTURY
WORKFORCE
Teaching Science as Inquiry
Developing 21st Century Skills in Science Programs
ACHIEVING SCIENTIFIC LITERACY FOR ALL
Teaching Science in Personal and Social Context
Emphasizing Scientific Competencies
CONCLUSION
An extraordinary set of challenges, but
they are essential and achievable.