screening of hazardous substances in kaliningrad · in the balthazar project that ran from 2009 to...
TRANSCRIPT

Screening of hazardous substances in Kaliningrad
BASE Project - Implementation of the Baltic Sea Action Plan in Russia
Baltic Marine Environment Protection Commission
Shutterstock

1
Pilot Activity Screening of HELCOM hazardous substances
in water and sediment in Kaliningrad
Main Consultant ECOGLOBUS Ltd.
Screening implemented by Balttechmordirectsiya, Kaliningrad department
Support provided by (EU Expert) Pöyry Finland Oy
Authors of the report Risto Valo, Esa Salminen, Jaakko Saukkoriipi
Report compiled by Risto Valo, Esa Salminen, Jaakko Saukkoriipi, Natalia Oblomkova
For bibliographic purposes this document should be cited as
HELCOM 2014, BASE project 2012-2014: Screening of HELCOM hazardous substances in water and sediment in Kaliningrad
Design and layout HELCOM Secretariat
Cover photo Shutterstock Implemented in the framework of:
Project Implementation of the Baltic Sea Action Plan in Russia (BASE)
Funded by EU
Implemented by HELCOM Secretariat and St. Petersburg Public Organisation ‘Ecology and Business’
This report does not necessarily represent the views of HELCOM. HELCOM does not assume responsibility for the content of the report. Information included in this publication or extracts thereof are free for citation on the condition that the complete reference of the publication is given as stated above. Copyright 2014 Baltic Marine Environment Protection Commission HELCOM

2
SCREENING OF HELCOM HAZARDOUS SUBSTANCES IN WATER AND SEDIMENT IN KALININGRAD
Summary This report is part of the HELCOM BASE monitoring project. In this project, water and sediment were sampled at seven locations along the main river of Kaliningrad, the Pregolya, and its tributaries that flow into the Curonian Lagoon before discharging into the main basin of the Baltic Sea. This was the first major HELCOM monitoring project on the occurrence of hazardous compounds to be carried out in Kaliningrad. In two other projects a local inventory of hazardous compounds was carried out. In the 2009 Balthazar project, five Kaliningrad landfills were monitored for the HELCOM priority hazardous substances and in 2013, the HELCOM BASE project of the Kaliningrad Port Oil Terminal investigated oil pollution in the water and sediment of the river Pregolya.
In this investigation, surface water and surface sediment was sampled at seven selected points in the main river Pregolya. The samples were taken in June 2014. Sediment samples were analysed in Obninsk, Kaluga Region laboratory “Taifun” for the following compounds: PCBs, PCDD/PCDF compounds, BDEs, oil hydrocarbons, endosulfan, heavy metals (Hg, Cd, Cu, Pb, Zn). Water samples were analysed in the laboratories of SGS Inspection Services in Finland, Germany and Netherlands. Analytics comprised the following compounds: BDEs, octyl- and nonylphenols, oil hydrocarbons, endosulfans, PFOA and PFOS, C10-C13 chloroalcanes, organic tin compounds and heavy metals (Hg, Cd, Cu, Pb, Zn).
Sampling of water and sediment was carried out by the Federal Baltic Technical Marine Directorate, Kaliningrad Department. The EU expert did not participate in sampling.
Results of monitoring were compared to the relevant monitoring results available from Kaliningrad, St. Petersburg’s River Neva as well as other Baltic Sea monitoring data. The following is a summary of the conclusions:
• The concentration of nonylphenols in water of Kaliningrad landfill brook and Kaliningrad waste canal were high, 12 and 18 µg/l and octylphenols 0.4 and 0.9 µg/l in the same points, compared to their AA-EQS of 0,3 and 0,1 µg/l respectively. Similar high concentrations of nonylphenols were analysed in untreated waste water and landfill leachate in some Baltic Sea countries (HELCOM, 2009)
• Concentrations of several compounds in the water were below the detection limit in all points: BDEs, Bisphenol-A, endosulfans, PFOA and PFOS, C10-C13 chloroalcanes and organic tin compounds. Detection limits of several compounds were higher than the environmental standard concentrations, AA-EQS
• Several sediment compounds were not analysed in this investigation: octyl- and nonylphenols, PFOA and PFOS, C10-C13 chloroalcanes and organic tin compounds
• Dioxins were low in Pregolya sediment, 0.2-6 ng I-TEQ/kg. Sediment in major landfills (Sovetsk, Kruglovo) leachate ditches (Ref 6) contained 100 – 1000 times higher levels of dioxins, 250-940 ng I-TEQ/kg. Dioxins in Neva sediment were higher than in Pregolya sediment. Dioxin toxicity coming from planar PCB- compounds was 2-20 % in all except Kaliningrad waste canal sediment where it was 50 %.
3
• Concentrations of organotin compounds in water were low, below the DL of 2 ng/l. In other parts of the BS typical levels of 1 to 10 ng/l have been found and in impacted sites, such as harbours, levels of 1000 ng/l are typical. In the preliminary analysis of Neva sediment, 4000 – 8500 ng/l, as a sum of tributyl and triphenyl tins, were analysed
• Brominated diphenyl ethers (tri – nona compounds) were present in six samples and deca-BDE in all Pregolya sediment points at total concentrations of 0.04-0. 18 µg/kg The maximum concentration was in Kaliningrad Oil Harbour sediment. In Neva sediment, tenfold higher BDEs were monitored.
• Concentration of HBCDD in sediment was below the DL of 0.01 µg/kg
• PFOS and PFOA compounds in water were below the DL of 2.5 ng/l. In BS water concentrations of 0.4 – 20 ng/l of PFOS/PFOA have been found. Based on this background data, concentrations in Pregolya water cannot be exceptionally high
• Chlorinated paraffins (C10-C13) in water were low, at a level of 0.15 µg/l in one point
• Endosulfans were below the DL in water (10 ng/l) and sediment (20 ng/kg)
• Mercury was found in sediment at 0.01-0.14 mg/kg which is a typical concentration for rivers in industrial areas
• Cadmium was present in water (0.2-0.7 µg/l) and sediment (0.04-0.89 mg/kg)
4
Contents
1 Introduction ........................................................................................................................................................... 5
2 Priority hazardous substances ................................................................................................................................ 5
2.1 Short description of the HELCOM priority hazardous substances ......................................................................... 5 2.2 Balthazar project in 2009....................................................................................................................................... 8 2.3 HELCOM BASE project Kaliningrad Port Oil Terminal ......................................................................................... 10
3 Materials and methods of investigations in Kaliningrad in 2014 ........................................................................... 11
3.1 Water sampling ................................................................................................................................................... 11 3.2 Sediment sampling .............................................................................................................................................. 12 3.3 Analytics .............................................................................................................................................................. 13
4 Results of investigations in Kaliningrad in 2014 .................................................................................................... 15
4.1 Field observations................................................................................................................................................ 15 4.2 Analytical results of water screening ................................................................................................................... 15 4.3 Hazardous substances in sediment ..................................................................................................................... 16
5 Discussion of investigation results ........................................................................................................................ 17
6 Reference list ....................................................................................................................................................... 21
Annexes Annex 1 Annex 2 Annex 3 Annex 4 Annex 5
Location of sampling points 2014 Location of sampling points. Oil Terminal 2013 Original sampling documentation Translated sampling data Laboratory results sediment Laboratory results water

5
1 Introduction This project, “Screening of Helcom Hazardous Substances in water and sediment in Kaliningrad” is part of the HELCOM BASE monitoring project. In this project, water and sediment was sampled from seven locations along the main river of Kaliningrad, the Pregolya, and its tributaries that flow into the Curonian Lagoon before discharging into the main basin of the Baltic Sea. The samples were taken in June 2014. This was the first project to monitor the occurrence of hazardous compounds in the main river of Kaliningrad. In the 2009 Balthazar project some landfills of Kaliningrad were monitored for HELCOM priority hazardous substances. In the 2013 Base pilot project to minimize oil pollution of Pregolya River by from Kaliningrad Port Oil Terminal investigated oil contamination in Pregolya river water and sediment.
This project was implemented by Ecoglobus Ltd
Baltechic Institute for Ecology of Hydrosphere (BIEH)
Support provided by EU Expert Pöyry Finland Oy
2 Priority hazardous substances The priority hazardous substances defined by HELCOM are based on their adverse effects: persistence, bio-accumulation and toxicity (PBT-substances). The substances of specific concern to the Baltic Sea are:
• Dioxins (PCDD) and furans (PCDF) and dioxin-like polychlorinated biphenyls • Tributyltin (TBT) and triphenyltin (TPhT) compounds • Penta-, octa- and decabromodiphenyl ethers (pentaBDE, octaBDE, decaBDE) • Perfluorooctane sulfonate (PFOS) and perfluorooctanoic acid (PFOA) • Hexabromocyclododecane (HBCDD) • Nonylphenols (NP) and octylphenols (OP) • Nonylphenol ethoxylates (NPE) and octylphenol ethoxylates (OPE) • Short-chain chlorinated paraffins (SCCP, C10-13 ) • Medium-chain chlorinated paraffins (MCCP, C14-17) • Endosulfan • Mercury (Hg) • Cadmium (Cd)
2.1 Short description of the HELCOM priority hazardous substances In the BALTHAZAR project that ran from 2009 to 2012 (ref 6), hazardous waste management in Russia (St. Petersburg, Leningrad and Kaliningrad Oblasts) was inventoriedand the priority landfills identified. In this inventory, sampling and analysis of landfill leachate and sediment at five selected sites in Kaliningrad was included. In Phase II of the BALTHAZAR project, “identification of sources for hazardous substances in St Petersburg area” (ref 2), the Laboratory for Scientific Research Centre for Ecological Safety of the Russian Academy of Sciences (SCRES RAS) developed analytical methods and analysed hazardous substances from sediments and water in the Neva region. In the HELCOM BASE project on Kaliningrad Port Oil Terminal pollution reduction in 2013 (ref 1), analysis of oil from water and sediment was included. Helcom Priority Hazardous Substances were inventoried in different parts of the Baltic Sea in the COHIBA (Control of Hazardous Substances in the Baltic Sea Region) project from 2009 to 2012 (ref 5) coordinated by the Finnish Environment Institute SYKE and in the HELCOM HAZARDOUS project where information on eight HELCOM Priority compounds was gathered and analysed from nine Baltic Sea countries (ref 7). The following information on the compounds is mainly based on the summary report of the HELCOM Priority Hazardous Substances (ref 3).

6
Dioxins are not produced industrially but are unintentionally produced substances. They are formed in most combustion processes and are impurities in several chlorinated chemicals. Atmospheric deposition and long range atmospheric transport are important sources of dioxins in the Baltic Sea. Emission treatment has considerably decreased the loading of dioxins in the Baltic Sea in the last two decades. Discharges of dioxins from local sources (chemical industry, wood treatment sites) have generally decreased but release from old sedimentation deposits continue. Dioxins are not typically found in water phases. In aquifers, dioxins tend to adsorb on solid material and accumulate in sediments. Dioxins bioaccumulate in fish: in the Baltic Sea this happens particularly in herring. Concentrations in surface sediments have in recent years decreased, the highest levels of dioxins are found in historical sediments dating back to the 1960´s and the 1970´s.
Organotin compounds
Organotin compounds are mainly used in antifouling paints of ships. The main source of organotin emission is leaching from ship hulls and release from contaminated harbour sediments. In the aquatic environment, TBT strongly adsorb to solid materials and finally sink to the bottom. TBT is highly toxic to benthic organisms and the imposex and intersex properties of gastropods are connected even to very low ng/l concentrations of TBT.
Polybrominated diphenyl ethers
Polybrominated diphenyl ethers (PBDE) is a group of 209 different aromatic brominated compounds that contain one to ten bromine atoms. Three PBDE compounds have been used commercially as flame retardants: pentabromodiphenyl ether (PeBDE); octabromodiphenyl ether (octaBDE) and decabromodiphenyl ether (decaBDE). Commercial PBDEs are a mixture of varying degrees of bromination, and their presence in the environment is based on analyses of the individual components (congeners). PBDEs are additive types that attach physically to products, not through chemical reaction. A typical amount of flame retardant in products is 5 to 30 %.
Production and use of PentaBDE and OctaBDE was banned in the EU in 2004 and listed in the Stockholm Convention for a global ban in 2009. Nevertheless, decaBDE remains one of the most used brominated flame retardants. Products in service and waste products are sources of PBDE emissions. The emissions of PBDEs originate from waste and industrial points sources in production and compounding. Atmospheric deposition is an important source of PBDEs. PentaBDE is the most volatile PBDE compound and it can be released from furniture textiles and foams. PBDEs have low water solubilities and for this reason emissions by leaching appear to be small. Historical pollution (landfills) and accumulation to sediments are sources of PBDEs because they are very stable in the environment.
Hexabromocyclododecane
Technical HBCDD is a brominated cycloalkane. HBCDD is used as a flame retardant additive, with the intent of delaying ignition and slowing subsequent fire growth during the service life of vehicles, buildings or articles, as well as while materials are stored. The main uses of HBCDD are in flame-retarded expanded (EPS) and extruded (XPS) polystyrene foam insulation, with other uses in textile applications and electric and electronic appliances (high impact polystyrene/HIPS). In textiles, HBCDD is used in back-coatings for upholstery and other interior textiles, including automotive applications. No analysis results are available concerning the concentrations of HBCDD in seawater. However, as water solubility of HBCD is low and it has high partitioning to organic carbon, it is not expected to be found in water in significant amounts. In sediments, concentrations of HBCDDs are often elevated by at least one order of magnitude in the vicinity of plants either producing or using HBCDDs.
Perfluorinated compounds
Perfluorinated alkyl substances (PFAS) comprise a large group of industrial chemicals that contain a hydrophobic alkyl chain (4 to 18 carbon atoms) that is either partly or fully fluorinated, and a hydrophilic functional group. Perfluorooctane sulphonate (PFOS) is the major compound of this

7
group. PFAS compounds are used in the chemical industry (e.g. production of fluoropolymers), and in commercial products such as in water- and stain proofing products: textiles, paper, carpet and leather, impregnation of paper and cardboard, surfactant, hydraulic fluids etc. It is also used, for example, in fire-fighting foams. PFOS and related compounds were added to the Stockholm Convention on POPs in 2009 due their persistent organic pollutant properties. PFOS and related substances are very stable and are not known to degrade in the natural environment. Releases of PFAS and its related substances are likely to occur during their whole life cycle, for example, from landfills and sewage treatment plants after the use of the products. WWTP or landfill is the main sink of PFOS of industrial and household use. Concentrations are highest close to industrial and urban areas. PFAS- compounds can degrade in the environment to PFOS, the stable final degradation product.
Nonylphenols, octylphenols and their ethoxylates
Nonylphenols (NP) are a group of compounds that have an alkyl chain attached to a phenolic molecule. NPs have a multitude of uses in industry, for example as stabilizers and emulsifying agents, in manufacture of plastics paints, solvents, production of washing agents and nonylphenolethoxylates (NPE) etc. Three main applications of NPs are the production of nonylphenylethoxylates (NPE); the manufacture of resins, plastics and stabilizers; and in the manufacture of phenolic oximes. The primary compound in the environment is NPE. NPE is used in many applications, including households and waste management. The primary source of NP in the environment is NPE which can break down to NP. NP is released into surface waters through wastewater and WW treatment plants, and when NPE containing sludge is spread on land. Also, air emission can be significant. Main discharges into the environment occur in industrial and municipal wastewater, the air and the soil where sewage sludge is spread. In certain applications, such as the cleaning and textile industries, pulp and paper, photography and de-icing, the NPE used is nearly totally emitted into waste water. In agricultural use, 10 % is estimated to end up in surface waters and 85 % to remain in the soil.
Octylphenols (OP) contain a number of isomers that have the octyl group located attached to the benzene ring. One compound, 4-tert-octylphenol is a high-production chemical with a consumption in the EU of 23 000 tons in 2001. Over 98 % of OP is used for making OP-resins for the rubber industry. OP and OPE (octylphenolethoxylate) are emitted by certain industries and in waste disposal, and in all likelihood by households too. Information on these emissions is scarce. OP is likely to reach the Baltic Sea mainly in industrial waste waters, through the breakdown of OPE, and as impurities in nonylphenols. OPE has moderate water solubility and is persistent in the environment: not readily biodegradable, moderately bioaccumulating, with negligible hydrolysis and photolysis. After release into the environment, OPE tends to accumulate in sediment.
Chlorinated Paraffins
Chlorinated paraffins are used in the rubber industry, PVC-plastic, paints, metal cutting fluids, flame retardant etc. Chlorinated paraffins (CP) are mixtures of polychlorinated n- alkanes. Compounds C10-13 are called short chain chlorinated paraffins (SSCP), C14-17 as medium chain chlorinated paraffins (MCCP), and C>18 as long chain chlorinated paraffins (LCCP). Technical mixtures may contain thousands of isomers, enantiomers and stereoisomers. Recently, MCCPS have partly replaced the more toxic and accumulating SCCPs. SCCPs are lipophilic, persistent and bioaccumulative in aquatic organisms. MCCPs are released from products (paints, PVC etc.) by volatilization during their lifetime. The released chemicals end up in soil and, in an aquatic environment it is partitioned from water to sediment.
SCCPs or MCCPs are not degraded or changed during the lifetime of the products. After their lifetime the products are typically either disposed of into landfills or incinerated. When disposed of in landfills, the MCCPs of PVC will stay stable for a long time with likely partial erosion and leaching of the material taking place over time. SCCPs and MCCPs have also been found in foodstuffs and human milk, as well as in the air, water and sediment. CPs in arctic areas indicates atmospheric long-range transport.

8
Endosulfan
Endosulfan is a broad spectrum insecticide that is applied as an emulsified concentrate or powder on fruits, vegetables, maize and rice. Endosulfan is banned within the EU as a pesticide and biocide since 2005 and it is classified as a priority substance under the EU- WFD. In the aquatic environment, endosulfan adsorbs on suspended solids and deposits to sediment. Part of the endosulfan is expected to remain in the water phase based on relatively high water solubility. The most significant source of endosulfan is leaching from agricultural soil and atmospheric deposition due to its agricultural use outside Europe. Aerial long range transport has been estimated to be the major source of endosulfan in Sweden, along with foodstuffs containing endosulfan.
Mercury
Mercury and some its compounds have specific properties that are different from all heavy metals. Mercury is volatile and has a global cycle in the atmosphere from where it can settle everywhere on the globe finally ending up in sediment. Mercury is capable of forming organic compounds by methylation in the environment. Discharges of mercury into the environment come mainly from point sources (chlor-alcali production, dental amalgam). A main anthropogenic source of mercury is the combustion of fossil fuels. Direct atmospheric deposition accounts for 25 % of the total load. In 2006, the total atmospheric emission was estimated to be 3.4 tons and the waterborne load 10.8 tons. In the years 1990 to 2007, atmospheric deposition of mercury has decreased by 23 % and waterborne load by 16.
Cadmium
About 2,600 tons of cadmium was used in the EU in 1996, mainly in NiCd batteries (75 %), pigments (15 %), coatings, stabilizers, alloys and in plating. Discharges come from point sources. Direct atmospheric deposition is estimated to be 15 % of total cadmium load. Atmospheric load in 2006 was estimated to be 7.2 tons and waterborne load to 47.5 tons. In the years 1990 to 2007, the atmospheric load of cadmium has decreased by 46 % and waterborne load by 91 %.
2.2 Balthazar project in 2009 In HELCOMs BALTHAZAR project in November 2009, landfill leachate and sediment was monitored in around five landfills in Kaliningrad Oblast. Results of monitoring are presented in: HELCOM 2010, BALTHAZAR project 2009- 2010: Reducing risks of hazardous wastes in Russia.
The following landfills were screened: Kruglovo, Kosmodemiansky, Sovetsk, Chernyahovsk and Gusev.
In the investigation, the following inorganic and organic substances were monitored: mercury, cadmium, PBDE, endosulfan PCB, PCDD/F, PAH, oil hydrocarbons.
Monitoring locations are presented in Figure 1 and summary of results in text.
9
Figure 1. Priority landfills in Kaliningrad (HELCOM 2009) and location of sampling points in 2009 (Kruglovo, Kosmodemiansky, Sovetsk, Chernyahovsk and Gusev).
Landfill leachate contained slightly elevated concentrations of heavy metals, but only nickel (0.021 mg/l) was at the level of the Russian norm, Threshold Limit Value (0.02 mg/l) outside one site, the Sovetsk landfill.
Organic contaminants, PBDEs, PCBs, PCDD/Fs and PAHS were found in leachates of all landfills monitored. The following concentrations were analysed:
• PAHs 0.4 … 1.7 µg/l (found at all landfills) • PBDE 0.44 ng/l (monitored at Kosmodemiansky) • PCDD/F 0.055 … 0.26 ng/l (Kruglovo, Kosmodemiansky, Sovetsk) • Oil hydrocarbons 0.14 ... 0.40 mg/l
Sediment. Concentrations of
• Mercury, at all five landfills 0.08 …0.48 mg/kg. • Cadmium at four landfills, 0.1 … 2.0 mg/kg. • PBDEs at Kosmodemiansky 95 ng/kg • Endosulfan as below the detection limit (<0.02 µg/kg) at one monitored site • PCDD/F compounds 120 …940 ng/kg (3 landfills) • PCBs were detected at all monitored landfills in 0.4 … 68 µg/kg • PAHs 0.08 mg/kg and 17.1 mg/kg, found at all landfills • Oil hydrocarbons 11 … 346 mg/kg
10
2.3 HELCOM BASE project Kaliningrad Port Oil Terminal Helcom BASE pilot project on Kaliningrad Port Oil Terminal contamination and remediation planning was conducted in 2013. The local consultant was TechnoTerra. The oil terminal is located downstream of the Pregolya river close to the estuary of the River. One part of the project was the analysis of oil in water (surface and bottom) and sediment of the Pregolya River outside the terminal. Results of the project are presented in the HELCOM report, to minimize oil pollution of Pregolya River from Kaliningrad Port Oil Terminal Kaliningrad, St. Petersburg, Helsinki 2014.
Point 6 of 2014 screening (see Annex 1, point 6) was within the area of Kaliningrad Port Oil Terminal where the oil content of the river was monitored in the 2013 Base pilot project.
Oil was monitored in the Pregolya River in 18 points from the surface and bottom water (at 5.0 – 16 metres depth). Monitoring points were located adjacent to the oil terminal and extending 300 m upstream of the terminal.
The average concentration of oil in the surface water of the Terminal (n=18) was 0.20 mg/l and at the bottom (n=15) 0.19 mg/l. In the surface water, the maximum concentration was 0.72 mg/l and the minimum 0.11 mg/l. In the bottom water, the maximum concentration was 0.35 mg/l and the minimum 0.12 mg/l.
The concentration of oil in the sediment of the oil terminal was monitored in 10 points that were located approximately 10 metres off shore in different parts of the terminal. Sediment was at 1.9 … 9.4 metres depth from the surface. The average concentration of oil in sediment was 3,500 mg/kg, minimum 150 mg/kg and maximum 22,000 mg/kg.

11
3 Materials and methods of investigations in Kaliningrad in 2014
3.1 Water sampling Sampling was carried out on 9 and 10 June 2014 in seven locations along the Pregolya River and its tributaries flowing through the main part of the Kaliningrad Region and emptying into the Curonian Lagoon that is connected to the Baltic Sea. The location of the sampling points is shown in Figure 2. Detailed information including sampling point coordinates are shown in Annex 1. Samples arrived in the analytical laboratory in Finland on 4 July 2014.
Description of the sampling points:
• Point 1: Bridge over Pregolya River close to the mouth of the river, tripledecker • Point 2: Gvardeysk, road bridge • Point 3: Brook coming from Kosmodemiansky landfill • Point 4: Mouth of the Kaliningrad waste canal close to the Curonian Lagoon • Point 5: Medvezhiy brook in Sokolniki, road bridge • Point 6: Kaliningrad oil harbour, downstream the pulp mill • Point 7: Kaliningrad Marine Canal, outside Svetly industrial area
Water was sampled from the upper water layer of the river/brook, at 0.1 to 0.4 metres depth.
Figure 2. Sampling points (Image © 2012 Bluesky).
The organization responsible for sampling was the Kaliningrad Branch of the Federal Baltic Technical Marine Directorate ([email protected]). EU- consultants did not get permission to participate in the sampling. Water samples were delivered to the laboratory 4 July 2014, 25 days after sampling.
Sampling documentation is in Annex 3.
12
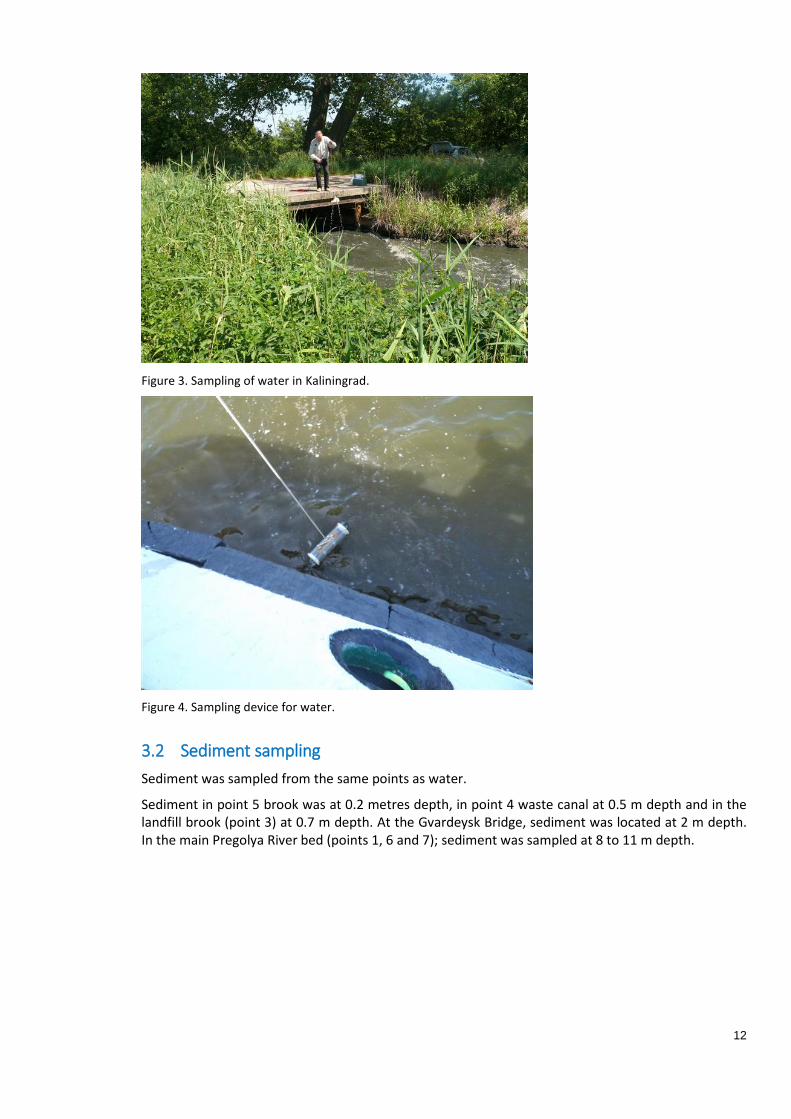
Figure 3. Sampling of water in Kaliningrad.
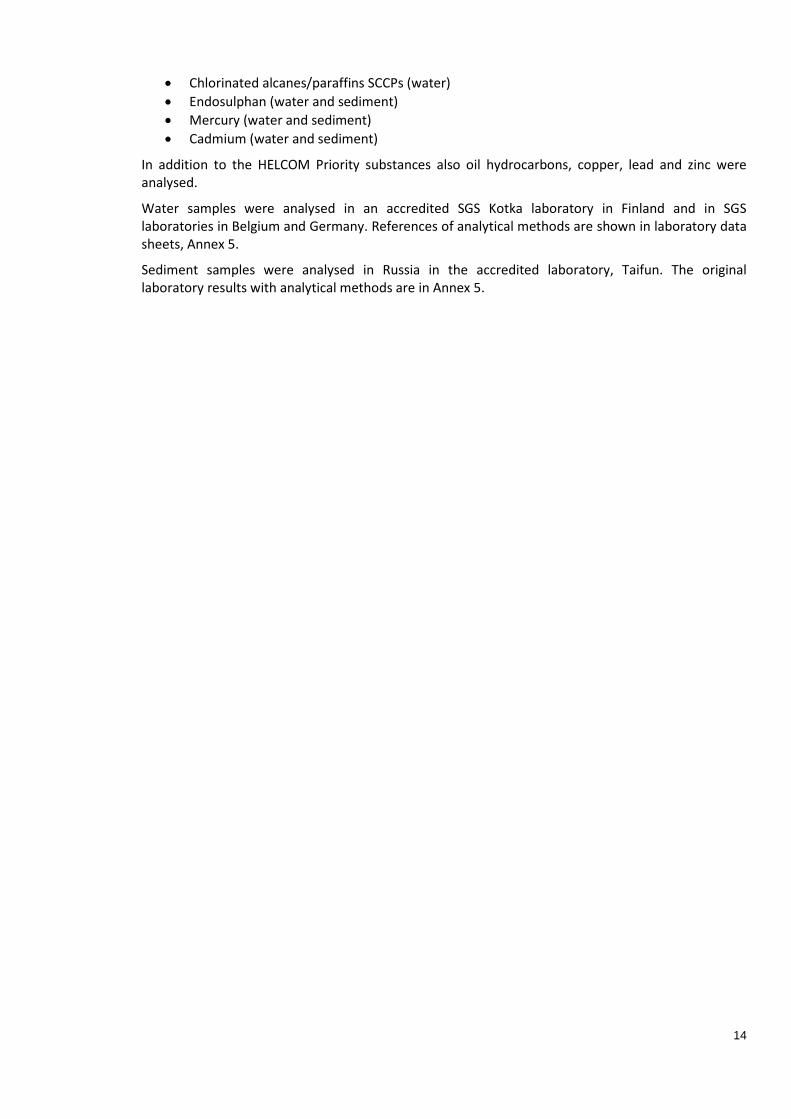
Figure 4. Sampling device for water.
3.2 Sediment sampling Sediment was sampled from the same points as water.
Sediment in point 5 brook was at 0.2 metres depth, in point 4 waste canal at 0.5 m depth and in the landfill brook (point 3) at 0.7 m depth. At the Gvardeysk Bridge, sediment was located at 2 m depth. In the main Pregolya River bed (points 1, 6 and 7); sediment was sampled at 8 to 11 m depth.

13
Figure 5. Sediment sampler containing sediment.
Figure 6. Sediment material for screening analysis.
3.3 Analytics The following HELCOM Priority Substances were analysed from water and/or sediment:
• Dioxins, PCDD/F, (sediment) • Dioxin-like (DL) PCBs including the following IUPAC compounds: 77, 126, 169, 105, 114, 118,
123, 156, 157, 167, 189, 170, 180. • Organic tin compounds, TBT, TPhT, (water) • Brominated diphenyl ethers, PBDEs, (water and sediment) • Perfluorinated compounds PFOS, PFOA (water) • Hexabromocyclododecane, HBDD (sediment) • Nonylphenols and Octylphenols (water)
14
• Chlorinated alcanes/paraffins SCCPs (water) • Endosulphan (water and sediment) • Mercury (water and sediment) • Cadmium (water and sediment)
In addition to the HELCOM Priority substances also oil hydrocarbons, copper, lead and zinc were analysed.
Water samples were analysed in an accredited SGS Kotka laboratory in Finland and in SGS laboratories in Belgium and Germany. References of analytical methods are shown in laboratory data sheets, Annex 5.
Sediment samples were analysed in Russia in the accredited laboratory, Taifun. The original laboratory results with analytical methods are in Annex 5.

15
4 Results of investigations in Kaliningrad in 2014
4.1 Field observations The appearance of water in the landfill brook (point 3) and waste canal (point 4) was strongly impaired by faecal and domestic waste pollution. Water was turbid, had a strong smell and the sediment was black indicating anaerobic conditions. Also in point 6 (Pregolya in oil harbour), water was described as having the smell of domestic waste. In other sampling points there was no indication or smell of waste water.
4.2 Analytical results of water screening Analytical results of water screening are shown in the Table 1. Table 1. Analytical results of water screening.
Compound unit dl Point 1 Point 2 Point 3 Point 4 Point 5 Point 6 Point 7
Kalin
ingr
ad, t
riple
deck
er
Gvar
deys
k, ro
ad b
ridge
Broo
k co
min
g fr
om th
e la
ndfil
l of
Kalin
ingr
ad
Kalin
ingr
ad w
aste
can
al (o
utfa
ll)
Med
vezh
iy b
rook
Preg
olya
Riv
er in
oil
harb
our a
nd
dow
nstr
eam
the
pulp
mill
and
in
the
vici
nity
of t
he h
arbo
ur
Kalin
ingr
ad M
arin
e Ca
nal
(Indu
stria
l are
a of
Sve
tly)
PBDEs
Tri- hepta -BDE ng/l 2 <2,3 <2,3 <2,3 <2,3 <8,1 <7,4 <2,3
Deca-BDE ng/l 39 <46 <46 <45 <160 <150 <150 <46
Octyl phenols µg/l 0,3 <0,3 <0,3 <0,3 0,9 0,5 0,4 <0,3
Nonyl phenols µg/l 0,3 <0,3 <0,3 12 18 <0,3 <0,3 <0,3
Bisphenol-A µg/l 10 <10 <10 <10 <10 <10 <10 <10
Oil hydrocarbons
C10-C21 mg/l 0,03 <0,03 <0,03 <0,03 <0,03 <0,03 <0,03 <0,03
C22-C40 mg/l 0,03 <0,03 <0,03 <0,03 <0,03 <0,03 <0,03 <0,03
Endosulfans µg/l 0,01 <0,01 <0,01 <0,01 <0,01 NA NA NA
PFOA ng/l 2,5 <2,5 <2,5 <2,5 <2,5 <2,5 <2,5 <2,5
PFOS ng/l 2,5 <2,5 <2,5 <2,5 <2,5 <2,5 <2,5 <2,5
C10-C13 chloroalcanes µg/l 0,1 <0,1 <0,4 <0,4 <0,1 <0,1 <0,1 0,15
Tributyltin ng/l 2 <2 <2 <2 <2 <2 <2 <2
Triphenyltin ng/l 2 <2 <2 <2 <2 <2 <2 <2
Hg µg/l 0,2 <0,2 <0,2 <0,2 <0,2 <0,2 <0,2 <0,2
Cd µg/l 0,1 0,3 <0,1 0,7 0,2 0,3 0,7 0,2
Cu µg/l 1 1,9 3,8 11 20 5,8 3,5 2,5
Pb µg/l 0,6 5 1 18 5,7 9,2 8.3 2,4
Zn µg/l 15 <15 <15 42 63 20 <15 <15
NA Not analyzed
dl Detection limit

16
4.3 Hazardous substances in sediment Analytical results of water screening are shown in the Table 1. Table 2. Analytical results of sediment screening.
Compound unit dl Point 1 Point 2 Point 3 Point 4 Point 5 Point 6 Point 7
Kalin
ingr
ad, t
riple
deck
er
Gvar
deys
k, ro
ad b
ridge
Broo
k co
min
g fr
om th
e la
ndfil
l of
Kalin
ingr
ad
Kalin
ingr
ad w
aste
can
al (o
utfa
ll)
Med
vezh
iy b
rook
Preg
olya
Riv
er in
oil
harb
our a
nd
dow
nstr
eam
the
pulp
mill
and
in th
e vi
cini
ty o
f the
har
bour
Kalin
ingr
ad M
arin
e Ca
nal (
Indu
stria
l ar
ea o
f Sve
tly)
PCBs (planar) in TEQ ng/kg 0.44 0.04 0.10 0.24 0.045 1.01 0.34
PCDP/PCDF in TEQ ng/kg 5.98 0.763 0.406 0.201 1.96 5.567 3.557
Tri- nona -BDE ng/kg 5/10 21,1 <10 26,5 55,1 <5 136,1 45,1
Deca-BDE ng/kg 10 18 <10 26,9 19,2 12 45,5 32,5
HBCDs ng/kg 10 <10 <10 <10 <10 <10 <10 <10
Octyl phenols NA NA NA NA NA NA NA
Nonyl phenols NA NA NA NA NA NA NA
Bisphenol-A NA NA NA NA NA NA NA
Oil hydrocarbons mg/kg 0.5 153.0 11.3 1.0 8.4 <0.5 420.0 1.4
Endosulfans ng/kg 20 <20 <20 <20 <20 <20 <20 <20
PFOA NA NA NA NA NA NA NA
PFOS NA NA NA NA NA NA NA
C10-C13 chloroalcanes NA NA NA NA NA NA NA
Tributyltin NA NA NA NA NA NA NA
Triphenyltin NA NA NA NA NA NA NA
Hg mg/kg 0,14 0,01 0,03 0,04 0,01 0,08 0,07
Cd mg/kg 0,49 0,08 0,18 0,04 0,06 0,89 0,30
Cu mg/kg 58,3 11,3 10,6 6,79 19,2 61,3 18,0
Pb mg/kg 56,2 37,5 11,0 17,0 5,59 41,9 15,5
Zn mg/kg 167 61,5 53,8 22,9 79,0 164,0 69,8
Dry matter g/kg 454.8 890.0 830.0 900.0 532.0 491.0 483.5
NA Not analyzed
dl Detection limit

17
5 Discussion of investigation results The results of the Kaliningrad HELCOM Hazardous Substances screening are compared below to the relevant European and local environmental quality standards and HELCOM monitoring results of water and sediment in different Baltic Sea countries.
Table 3. Water quality standards of HELCOM Hazardous Substances, µg/l.
Name of substance CAS number
AA-EQS Inland surface water
AA-EQS Other surface water
MAC-EQS Inland surface water
AA-EQS Other surface water
Brominated diphenylether* 32534-81-9 0,0005 0,0002 not applicable not applicable
Cadmium and its compounds (depending on water hardness classes**)
7440-43-9 ≤0,08 (Class 1)
0,08 (Class 2)
0,09 (Class 3)
0,15 (Class 4)
0,25 (Class 5)
0,2 ≤0,45 (Class 1)
0,45 (Class 2)
0,6 (Class 3)
0,9 (Class 4)
1,5 (Class 5)
≤0,45 (Class 1)
0,45 (Class 2)
0,6 (Class 3)
0,9 (Class 4)
1,5 (Class 5)
C10-13 Chloroalkanes 85535-84-8 0,4 0,4 1,4 1,4
Endosulfan 206-44-0 0,005 0,0005 0,01 0,004
Mercury and its compounds 7439-92-1 0,05 0,05 0,07 0,07
Nonylphenol (4-Nonylphenol)
104-66-9 0,3 0,3 2,0 2,0
Octylphenol
((4-1,1’,3,3-tetramethylbutyl)-phenol)
140-66-9 0,1 0,01 not applicable not applicable
Tributyltin compounds (Tributhyltin cation)
36643-28-4 0,0002 0,0002 0,0015 0,0015
CAS = Chemical Abstract Service, a division of American Chemical Society providing chemical information. AA-EQS = EC quality standard for water; separate standards can be issued for inland water and sea water (=other surface water)
Dioxins and dioxin-like PCBs. Concentrations of Dioxins in Kaliningrad Pregolya sediments were 0.2 – 5.98 ng I-TEQ/kg. The maximum concentration under the tripledecker bridge in the City of Kaliningrad was 5.98 ng I-TEQ / kg. Also, closer to the Pregolya delta (at KPOT and Svetly industrial area) the concentration of dioxins was at 5.6 and 3.6 ng I-TEQ/kg. Also, at Medvezhiy bridge (1.96 ng I-TEQ/kg) the level of 1 ng I-TEQ was exceeded. In the other sediment points, the level of dioxins was 0.20 … 0.76 ng I-TEQ / kg. The results indicated that the concentration of dioxins is relatively stable in sediments of the Pregolya, with only about tenfold higher concentrations in the Pregolya delta compared to upstream sediment.
In 2009, monitoring in Kaliningrad found the highest concentration (940 ng I-TEQ/kg) in sediment in the outskirts of Sovetsk landfill where the direct impact of landfill leachate was obvious. The concentration of dioxins in sediment around the Kosmodemiansky landfill in 2009 was 120 ng I-TEQ/kg while in 2014 a much lower concentration of 0.41 ng I-TEQ/kg was observed at another screening point. At Kruglovo landfill, 250 ng I-TEQ/kg of dioxins were found in the sediment of the landfill leachate ditch. Based on these results, dioxins are leached from large landfills but are largely retained by adsorption in sediments close to the landfills. Surface water outside three landfills (Kruglovo, Kosmodemiansky, Sovetsk) contained 0.06 – 0.26 ng I-TEQ/l.

18
In the St. Petersburg area screening carried out in 2012, dioxins were analysed from seven sediment samples of Neva and its tributaries. Maximum concentrations of dioxins were 250 ng I-TEQ/kg and minimum 2 ng I-TEQ/kg. The rest of the sediments contained 10 – 20 ng I-TEQ/kg.
20 ng I-TEQ/kg is a typical level of dioxins in estuaries of rivers flowing into the Baltic Sea. In a few hot spots, sediment concentrations of 200-300 ng I-TEQ/kg have been detected. Concentrations of dioxins in Neva sediments (average 78 ng I-TEQ/kg) were higher than in Pregolya sediment in Kaliningrad (average 2,6 ng I-TEQ/kg).
The Curonian Lagoon is a sedimentation basin from where water flows out to the main basin of the Baltic Sea. Dioxins bind in sediment material and, in spite of high concentrations in river delta sediment, loading of dioxins to the Baltic Sea is not significant.
Dioxin –like PCBs. The concentration of each DL-PCB compound and the calculation of toxic equivalents are shown in Annex 4. Table 2 shows the summary of DL-PCBs in each sediment sample. The concentration of DL-PCBs ranged from 0.04 to 1.10 ng I-TEQ/kg.
Total dioxin toxicity in Pregolya river sediment was 0.44 – 6.58 ng I-TEQ/kg.
The percentage of total dioxin toxicity coming from PCB- compounds was between 2 and 20 % in six samples and in one sample (Kaliningrad waste canal) it was clearly higher, 55 %.
Organotin compounds. The concentration of organotin compounds in Pregolya water was below the detection limit of 2 ng/l. These compounds were not monitored from the sediment. The environmental quality standard (EU-AA-EQS) for tributyltin compounds is 0.2 ng/l. The detection limit for the TBT- compounds is typically too high, 1 to 2 ng/l, as compared to the environmental quality standard.
Concentrations of tributyltin in Baltic Sea water vary greatly depending on the presence of local sources. The main source is antifouling paints of ships (shipyards, harbours etc.) with several minor industrial sources. Typical concentrations detected in different parts of the Baltic Sea water are from below 1 ng/l to10 ng/l, while at impacted sites such as shipyards levels of µg/l have been monitored.
In coastal and open sea sediments of the Baltic Sea, < 1 to 200 µg/kg of organotins have been detected and in the vicinity of point sources even thousands of micrograms/kg can be typical.
PBDEs. Concentrations of all PBDE congeners in water were below the detection limit of 2 − 160 ng/l. The AA-EQS of brominated diphenyl ethers (sum of compounds no 28, 47, 99, 199, 153, 154) is 0.2 ng/l.
In sediments of the Pregolya, the sum of PCDEs was < 0.010 – 0.18 µg/kg. The highest concentration was in oil harbour sediment. In the Kaliningrad landfill brook, Kaliningrad waste canal and sediment near Svetly industrial area, the concentration of PBDEs was at 0.053-0.077 µg/kg. The lowest level was upstream the Pregolya in Gvardeysk, below the detection limit. The average concentration of PBDEs in Pregolya sediment was 0.064 µg/kg.
In five Neva river water samples in 2012, total PBDE concentrations of 0.05 to 0.3 ng/l were detected. In the sediment of the Neva, total concentrations were 0.09 – 1.80 µg/kg (average 0.8 µg/kg). Average concentrations of PBDEs in sediment of Neva were about 12- fold compared to the Pregolya river.
In the 2009 investigation, PBDEs were found in Kosmodemianky landfill leachate at 0.44 ng/l and in sediment of the leachate ditch at 0.095 µg/kg.
PBDE compounds typically attach to solid material and concentrate in sediments. They have only recently been found in the water phase because of analytical development and lower detection limits. Previously the higher detection limits (2 – 100 ng/l) were not exceeded.
There are no reliable investigations on the concentrations of BDEs in Baltic Sea water. Concentrations are mostly below detection. In sediments concentration of BDE47 in Baltic Sea sediment is typically below 1 µg/kg and concentration of the highly brominated BDE209 from below 1 to 22 ng/kg d.w.

19
HBCDD. Concentration of HBCDD in Pregolya sediment was below the detection limit of 0.01 µg/kg. In Neva monitoring, the detection limit of 0.4 µg/kg was exceeded in two of eight samples, with concentrations of 2.8 − 5.1 µg/kg. In a Swedish investigation in 2002, the concentration of HBCDD in coastal sediment was below 1.7 µg/kg. There are only a few sediment monitoring results of the occurrence of PBCDDs in the Baltic Sea.
PFOS, PFAS. In Pregolya water, no PFOS or PFOA compounds were detected. The level of detection was 2.5 ng/l. These compounds were not found in Pregolya sediment.
In Neva water, concentrations of <0.04 – 0.53 ng/l of PFOA and <0.5 – 2.4 ng/l of PFOS were detected. In the sediment of the Neva, the DL was exceeded in two of nine points with concentrations of 0.5 and 5.5 µg/kg.
In the Baltic Sea water, concentrations 0.35 −22 ng/l of PFOS and 0.5 − 7.7 ng/l of PFOA have been monitored. In sediment, PFOS of 0.03 − 1 µg/kg and 0.06-0.68 µg/kg of PFOA have been detected in surface sediments in Germany and Finland. Results of monitoring of PFOs/PFOA compounds in water and sediment of the Baltic Sea are few.
Nonylphenols and octylphenols. Octylphenols were detected in three water samples (Kaliningrad waste canal, Medvezhiy brook and the oil harbour) at 0.4 to 0.9 µg/l and nonylphenols in two points (Kaliningrad landfill brook, Kaliningrad waste canal) at 12 to 18 µg/l. These concentrations are at the same level as found in monitoring of untreated waste water and landfill leachate in Sweden and Germany (Helcom, 2009). Sediment was not analysed for these compounds.
The AA-EQS for nonylphenol in surface water is 0.3 µg/l and for octylphenol 0.01 µg/l.
There is little data on monitoring of nonyl- and octylpehols in Baltic Sea water and sediment. Concentrations of nonylphenols in water have been below the detection limit of 0.2 µg/l in Finnish and Lithuanian monitoring. In sediment, concentrations of nonylphenols have been detected at <20 – 560 µg/kg.
Octylphenols were not found in water in some of the monitoring carried out in the Baltic Sea when the limit of detection has been 0.01 – 0.2 µg/l.
In the screening of water in 2008 in eastern parts of the Baltic Sea, nonylphenols (NP) were found at <0.013 - 0.066 µg/l. In about half of the samples, concentrations were below the LOQ (0.01 µg/l). In Swedish monitoring carried out between 2007 and 2008 at 7 coastal sites, NPs were present at 0.1 − 1.5 µg/l, the median value being 0.18 µg/l.
In monitoring of coastal sediment of the Baltic Sea in the period 2003−2008, NPs were detected at 60 − 560 µg/kg and in offshore sediments <3 to 65 µg/kg d.w.
Chlorinated paraffins were detected in Pregolya water in one point, in Kaliningrad marine Canal at Svetly. Concentration was low, 0.15 µg/l. C10-C13 chlorinated alkanes have an AA-EQS of 0.4 µg/l.
These compounds were not analysed from sediment. After release into the aquatic environment, SCCPs typically end up in sediment. In Baltic Sea sediment, SCCP levels of 20−100 µg/kg have been detected.
Endosulfans were not detected in Pregolya river at 10 ng/l level. Also, in sediment the concentration was below the detection limit of 20 ng/kg.
The AA-EQS of endosulfan is 0.5 ng/l.
In Neva river water concentration of endosulfan was below the DL of 4 ng/l.
Endosulfan was not detected in 2009 monitoring in Kosmodemiansky landfill brook sediment.
Mercury. In all points of Pregolya the level of Hg in water was below the DL of 0.2 µg/l. Concentrations of mercury in sediment were 0.01 – 0.14 mg/kg. The highest concentrations were in Kaliningrad harbour and the marine Canal in Svetly (0.07 – 0.08 mg/kg).
20
In Neva monitoring in 2012, concentrations of mercury in the water were below the DL of 0.01 µg/l. In eight monitored sediment points, the concentration of mercury was detected at 0.025 – 0.44 mg/kg.
In Kaliningrad landfill monitoring in 2009, the concentration of Hg in landfill leachate was 0.089 µg/l at Sovetsk landfill and below the DL at other four sites. Sediments of the landfill leachate ditches contained 0.08 – 0.48 mg/kg of Hg.
In the water phase, the concentration of mercury is typically below the DL (< 0.2 …0.01 µg/l). Mercury is found in the sediment of the Baltic Sea locally in some areas, in the main parts of the Baltic Sea, the concentration of Hg in previous monitoring has been at the level of 0.04 mg/kg. Higher levels of mercury (0.3 mg/kg) have been detected in sediment of some BS estuaries, in western Bothnia Bay, eastern Gulf of Finland, off southeast Sweden and in the Sound. This is the same level as found in a few Neva sediment points in 2012 and in two landfill ditch sediments in Kaliningrad in 2009. Concentrations of Hg in Pregolya sediment in 2014 were somewhat lower than in Neva sediment; the average concentration in Pregolya monitoring was 0,054 mg/kg and in Neva sediment 0.22 mg/kg. AA-EQS for surface water is 0.05 µg/l. This level was exceeded only at one landfill leachate in Kaliningrad in 2009.
Cadmium. The concentration of Cd in Pregolya water exceeded the DL of 0.1 µg/l in six of seven samples. Concentrations of cadmium in the monitoring were 0.2 – 0.7 µg/l. Cadmium was found in all sediment samples at 0.04 – 0.89 mg/kg. The highest concentration was in Kaliningrad oil harbour sediment. The average concentration in Pregolya sediment was 0.29 mg/kg.
In the Neva region sediment monitoring in 2012, concentrations of cadmium were at 0.18 – 4.5 mg/kg, the average being 1.5 mg/kg. Concentrations of cadmium were somewhat higher in Neva sediment compared to Pregolya sediment. The concentration of cadmium in water (2 samples) was below the DL of 0.1 µg/l.
Landfill leachate in Kaliningrad monitoring in 2009 contained 0.1 µg/l of cadmium at two sites and at three sites the level was below the DL. In Kaliningrad landfill ditch sediments, cadmium was detected at four landfills (0.1 – 2.0 mg/kg).
The surface water AA-EQS of cadmium is 0.2 µg/l. This level was exceeded in four samples in Kaliningrad.
Oil hydrocarbons. In all sampling locations, the concentration of oil hydrocarbons in water was below the detection level of 0.03 mg/l both in middle fraction (C10-C21) and in heavy oil (C22-C40). In sediments, concentrations of oil ranged from non-detect level (< 0.5 mg/kg) in Medvezhiy brook to 420 mg/kg in Kaliningrad oil harbour sediment. In other locations, the concentration of oil varied greatly, between 1 mg/kg and 153 mg/kg, depending on the presence of local sources.
In Kaliningrad Port Oil Terminal HELCOM BASE Project in 2014, considerably higher levels of oil were detected in Pregolya surface water (0.11-0.72 mg/l, average 0.20 mg/l) and in the sediment the average concentration of oil was 3,500 mg/l, maximum 22,000 mg/kg and minimum 150 mg/kg. These levels of hydrocarbons indicated heavy pollution of the river water and sediment around the Oil Terminal.
In Balthazar landfill monitoring in 2009, oil products were analysed from five landfill leachate water samples and from sediment of the landfill water discharge ditches. In leachate, a concentration of 0.14 – 0.40 mg/l was found, and in the sediments 29 – 346 mg/kg. Leachate of the landfills contained oil at the same elevated level as was found in Pregolya outside the Kaliningrad Oil Port.
21
6 Reference list (1) HELCOM 2014, Pilot activity to minimization of the Pregolya river pollution with oil products from
Kaliningrad port oil terminal.
(2) HELCOM 2012, Final Report from SRCES RAS to HELCOM Secretariat on the project “identification of sources of hazardous substances in St Petersburg area.
(3) HELCOM 2012, BALTHAZAR Project Summary Report: Potential sources of HELCOM Priority Hazardous Substances in Russia and their role in Baltic Sea load- Findings of the BALTHAZAR Project.
(4) COHIBA (2012) Final summary report of the COHIBA project
(5) HELCOM 2010, Hazardous substances in the Baltic Sea. An integrated thematic assessment of hazardous substances in the Baltic Sea. Baltic Sea Environment proceedings No. 120B.
(6) HELCOM 2010, BALTHAZAR project 2009- 2010: Reducing risks of hazardous wastes in Russia.
(7) HELCOM 2009, Hazardous substances of specific concern to the Baltic Sea. Final report of the HAZARDOUS project, Baltic Sea Environment Proceedings No. 119.

www.helcom.fi