scri-minds year 1 report - smart farms · 1 22001122 johhnn olleeaa-ccoxx geoorrggee k aannttoorr w...
TRANSCRIPT

1
22001122
JJOOHHNN LLEEAA--CCOOXX
GGEEOORRGGEE KKAANNTTOORR
WWIILLLLIIAAMM BBAAUUEERRLLEE
MMAARRCC VVAANN IIEERRSSEELL
TTAARRYYNN BBAAUUEERRLLEE
EERRIIKK LLIICCHHTTEENNBBEERRGG
DDEENNNNIISS KKIINNGG
RRIICCHHAARRDD BBAAUUEERR
CCOOLLIINN CCAAMMPPBBEELLLL
LLAAUURREENN BBIISSSSEEYY
TTOODDDD MMAARRTTIINN
2266TTHH NNOOVVEEMMBBEERR ,, 22001122
LLAAUURREENN BBIISSSSEEYY
SSCCRRII--MMIINNDDSS –– YYEEAARR 33 RREEPPOORRTT
PPRREECCIISSIIOONN IIRRRRIIGGAATTIIOONN AANNDD NNUUTTRRIIEENNTT MMAANNAAGGEEMMEENNTT FFOORR
NNUURRSSEERRYY,, GGRREEEENNHHOOUUSSEE AANNDD GGRREEEENN RROOOOFF SSYYSSTTEEMMSS:: WWIIRREELLEESSSS SSEENNSSOORR NNEETTWWOORRKKSS FFOORR FFEEEEDDBBAACCKK AANNDD FFEEEEDD--FFOORRWWAARRDD CCOONNTTRROOLL

2
TABLE OF CONTENTS
TABLE OF CONTENTS .................................................................................................................................................... 2
EXECUTIVE SUMMARY .................................................................................................................................................. 4
GLOBAL PROJECT GOALS AND OBJECTIVES ....................................................................................................... 6
2012 PROJECT IMPACT STATEMENTS ............................................................................................................... 6
A. ENGINEERING – HARDWARE AND SOFTWARE (CARNEGIE MELLON ROBOTICS INSTITUTE AND DECAGON DEVICES). ......... 10
1. Hardware (nR5) Development ................................................................................................................ 10 2. Base Station and Sensorweb Software (User Interface) ......................................................................... 11 3. Irrigation Scheduling ............................................................................................................................... 11 4. New Software Features .......................................................................................................................... 14 5. Field Testing and Support ....................................................................................................................... 12
B. SCIENTIFIC RESEARCH AND DEVELOPMENT (COLORADO STATE UNIVERSITY) ................................................... 16 C. SCIENTIFIC RESEARCH AND DEVELOPMENT (CORNELL UNIVERSITY) .................................................................. 21 D. SCIENTIFIC RESEARCH AND DEVELOPMENT (UNIVERSITY OF GEORGIA) ............................................................ 27
1. Using Controlled Drought for Regulating Plant Height of Poinsettia...................................................... 27 2. Effect of substrate water content on growth, quality and disease susceptibility of Gardenia .............. 28 3. Water uptake of Hydrangea macrophylla and Gardenia jasminoides .................................................... 30 4. Comparative daily water use of hydrangea and gardenia ...................................................................... 33 5. Leaching under different irrigation regimes and fertilizer rates in the greenhouse .............................. 35 6. Can More Efficient Irrigation Reduce the Fertilizer Needs of Lantana? ................................................. 35 7. Ongoing Studies ...................................................................................................................................... 37 8. Collaborating Georgia Growers .............................................................................................................. 39 9. People Involved ...................................................................................................................................... 41 10. Off-shoot Research Projects ................................................................................................................... 41
E. SCIENTIFIC RESEARCH AND DEVELOPMENT (UNIVERSITY OF MARYLAND) ........................................................ 42
1. Snapdragon Research – Bauers Greenhouse – Jarrettsville, MD ............................................................ 42 2. Hale and Hines Nursery – McMinnville, TN ............................................................................................ 47 3. Green Roof Research .............................................................................................................................. 53 4. Raemelton Farm – Adamstown, MD ...................................................................................................... 56 5. Waverley Farm – Admastonw, MD ......................................................................................................... 58 6. People Involved at University of Maryland ............................................................................................ 58 7. Other Supported Collaborations ............................................................................................................. 37
F. ECONOMIC AND ENVIRONMENTAL BENEFITS (UNIVERSITY OF MARYLAND) ..................................................... 60
1. Economic Methodology Development ................................................................................................... 60 2. Survey Development .............................................................................................................................. 60
G. OUTREACH - WEBSITE AND KNOWLEDGE CENTER DEVELOPMENT .................................................................... 61
1. Website ................................................................................................................................................... 61 2. Knowledge Center Development ............................................................................................................ 62 3. Significant Outreach Activities ................................................................................................................ 62

3
H. PROJECT MANAGEMENT, COORDINATION AND COMMUNICATION .................................................................. 64 I. PUBLICATIONS, PRESENTATIONS AND OUTREACH ................................................................................................ 65
1. Book Chapters ......................................................................................................................................... 65 2. Peer‐Reviewed Journal Articles .............................................................................................................. 65 3. Non‐Refereed Conference Proceedings ................................................................................................. 66 4. Trade Articles, Reports ........................................................................................................................... 67 5. Conference Abstracts; Associated Presentations ................................................................................... 67 6. Invited Presentations .............................................................................................................................. 67 6. Other Presentations................................................................................................................................ 69 6. Websites, Impact Statements ................................................................................................................. 71
APPENDIX A: FEDERAL FINANCIAL REPORT ............................................................................................................... 74
APPENDIX B: PROJECT RESEARCH AND DEVELOPMENT OBJECTIVES ....................................................................... 75

4
Executive Summary
Year three was pivotal for the SCRI-MINDS project. The significant engineering effort put into the development of the advanced monitoring and control (nR5) node and supporting software (Sensorweb) in Year 2, was implemented in a number of research situations and commercial operations during 2012. We are now actively monitoring and controlling irrigation in 12 different locations, including 6 commercial greenhouses and nurseries. This is a major milestone for the project, since this is perhaps the most critical deliverable of this project. Many of the exciting results reported by the scientific teams this year are based on this implementation.
The relatively flawless deployment of this advanced irrigation monitoring and control system has allowed us to achieve significant reductions in water use that are impossible to achieve without this technology. We have also seen that in some cases the cropping cycle can be drastically shortened, while plant/flower quality is improved. This can have a major economic impact on greenhouses and nurseries. This is possible because the system combines precision irrigation strategies with decision-support provided by a range of moisture sensors and models for various species. For example, the micro-pulse routine in Sensorweb allows for very short duration irrigation events within an irrigation scheduling “window” that has achieved demonstrated water savings when combined with sensor-based setpoint control. This “embedded intelligence” is just one example of the tools and irrigation strategies we are developing as part of this project. Significant results reported by the various teams in Year 3 include:
1. Engineering Hardware and Software Development: Deployed the new nR5-DC irrigation control nodes with latching solenoid valves in addition to the
non-latching (nR5) control node in 12 farm and research environments. Latching valves allow for irrigation control on sites that do not have an extensive irrigation wiring infrastructure (remote sites) and makes implementation of irrigation control much easier for many growers.
Enhanced the sophisticated software interface (Sensorweb) that allow growers to implement both schedule-based, set-point, and model-based irrigation control strategies, with the ability to update nR5 nodes in the field in real-time, over the internet.
The Sensorweb software has many new features including graphical views, real-time alerts as text messages or e-mails, bad sensor and error detection, and advanced irrigation methods as part of the user interface.
2. Scientific Research and Development: Sensor-controlled irrigation has been implemented in six commercial operations, where local set-
point or model-based control has been used to continuously schedule daily irrigations throughout 2012 with little human intervention.
Sensor-based irrigation at McCorkle’s nursery in GA eliminated up to 30% of plant death in Gardenia, typically attributed to disease. Just as importantly, the production cycle was reduced from 14 to 8 months, reducing production inputs. This resulted in an additional net return on this crop of $1.06 / ft2; the return on investment for this sensor network was less than 3 months.
The University of Maryland (UM) has documented reductions in water use from 37 to 69% of current precision irrigation water applications in TN, with no reduction in plant growth or quality. Preliminary results from sensor-controlled irrigation studies with red maple in MD have indicated increased growth rates of transplants during summer, compared to current irrigation practices.
Colorado State University (CSU) used the MAESTRA model integrated with Sensorweb, to directly control solenoids and actively control irrigation at Willoway Nurseries throughout 2012.
Cornell University (CU) developed non-destructive techniques to quantify root structure through 2-dimensional slices of X-ray computed tomography scans. Cornell and CSU are working to integrate

5
root system response to soil moisture and spatial distribution in containerized systems, to provide us with direct tools to model plant water use.
Cornell is further exploring best practices for placing soil moisture sensors in trees with coarse root systems by graphing areas of high fine root concentration within “coarse root” trees
Research at the University of Georgia (UGA) determined that water deficit techniques using soil moisture sensors can control poinsettia height without compromising quality, providing an alternative to chemical height control methods.
UGA has developed a new, plant-based method to determine plant available water in soilless substrates. It was shown that plants can extract water from substrates at much lower moisture contents (12% for in G. jasminoides and 16% VWC for H. macrophylla) than what was previously reported based on substrate water release curves.
Ongoing research at UGA is defining optimal substrate moisture levels, to ensure optimal plant growth and quality of indicator crops, and yet minimize excessive leaching and nutrient loss.
UM has critically evaluated sensor variability and performance associated with spatial variability in greenhouse and container production. We are confident that sensor-to-sensor variability is low for bothEC-5 and 10-HS sensors, but understanding variability die to placement and irrigation emitter requires an understanding of substrate properties and root densities.
Through sensor-base irrigation control comparisons, UM has identified three major ways the technology is saving water and reducing leaching: 1) via reduction of irrigation duration with the micropulse routine; 2) by reducing unnecessary irrigations (especially in spring and fall) and 3) reducing the absolute wetness of the substrate required for good root growth
3. Model Development: Three models predicting plant water use have been integrated into Sensorweb: 1) UGA Petunia
model, 2) CSU MAESTRA model (tree water use), and 3) UMD Green Roof storm water model.
CSU has calibrated and validated the performance of the predictive tree water use (MAESTRA) model, using empirical water balance measurements. They have also limited uncertainty for various physiological inputs for the model.
The green roof stormwater model has been parametized by UM, and is undergoing verification and validation using empirical data from rainfall events in 2011 and 2102.
UM is currently parametizing the Snapdragon daily water use model, based on measuring plant growth, daily intercepted light integral and vapor pressure deficit.
4. Economic Research: We have conducted a large national irrigation and water use survey. We are gathering further
industry-specific information on irrigation/disease management, economic importance of reductions in water cost/disease losses and willingness to pay for sensors. This will be integrated into the estimation of societal benefits from the technology
The development of specific farm cost-benefit analyses and case-studies are on-going.
5. Communication and Outreach: During Year 3, two book chapters, 8 peer-reviewed papers, 14 conference papers, 5 trade articles /
reports and 18 conference abstracts were published about the SCRI-MINDS project. In addition, members gave 5 invited presentations and contributed 30 additional presentations.
The team organized a two-day Green Roof symposium and a day-long Sensor workshop at the American Society for Horticultural Science meeting in Miami, FL.
The website and knowledge center (http://www.smart-farms.net) was completely redesigned and deployed to communicate our progress to our stakeholders and the general public.
Two additional project Impact statements (see below) were published in the American Society for Horticultural Science: Center for Horticultural Impact Statements at http://ashsmedia.org

6
Global Project Goals and Objectives
As a Coordinated Agricultural Specialty Crops Research Initiative Project, we are focused on delivering a commercial wireless sensor network (WSN) capable of supporting the intensive production system requirements of field nurseries, container nurseries, greenhouse operations and green roof systems. The global goals of this project are (1) to provide a more integrative and mechanistic understanding of plant water requirements, spanning from micro-scale (e.g. plant level) to macro-scale (e.g. whole production site) for irrigation and nutrient management and (2) to quantify private (farm) and public (societal) economic benefits of this technology. The project is integrated across various scales of production by using small and large commercial test sites that allows us to take a systems approach to identify micro- to macro-scale answers underlying nursery, greenhouse, and green roof irrigation management. An economic, environmental and social analysis will identify cost and benefits to the green industry and society as well as barriers to adoption of this new technology. The project structure allows us to engage green industry collaborators on a day-to-day basis to ensure satisfaction and quickly resolve problems, with new hardware and software products developed by our teams and our commercial partners.
Further details of the entire project, teams and management can be found on the SCRI-MINDS Project Website at http://www.smart-farms.net and Knowledge Center at http://www.smart-farms.org
2012 Project Impact Statements
1. Increasing the Efficiency of Irrigation Water Applications with Smart Sensor Technology
http://ashsmedia.org/?p=62
More than 56.6 million acres of land were irrigated in the United States in 2007, of which 56% was irrigated by sprinkler and microirrigation systems.1 We are developing advanced sensor technology to precisely monitor plant water use, thereby affording better control of irrigation water applications and increasing the efficiency of water and nutrient use in nursery and greenhouse operations. By using cost-effective networks of soil and environmental sensors, we are providing growers with real-time remote information about soil moisture and plant water use on their computers and smart phones.
Through collaborations between plant scientists, engineers, and economists at five universities and two commercial companies, we have developed new sensor technology and software to automatically control irrigation based on plants’ needs in commercial nursery and greenhouse operations in MD, GA, TN and OH. Close cooperation among researchers and commercial growers is taking advantage of everyone’s expertise, to ensure rapid progress towards implementation of the science into practice.

7
During the first two years of this project, commercially-available sensor technology was deployed on these farms, which growers are using to make daily irrigation decisions. We have already reduced water applications by more than 50%, by making more informed irrigation scheduling decisions. Improving water management not only reduces nutrient leaching but also improves plant quality and reduces losses from plant diseases. In the case of one nursery, improving their irrigation practices resulted in a $1 per square foot economic benefit for a specific crop. These savings from just one small area of this nursery operation would have paid for the sensor network in less than two months. Given that most nurseries have 10’s to 100’s of acres in production, the economic benefit for individual nurseries is likely to be many thousands of dollars each year. However, better irrigation not only benefits growers, it helps conserve the nation’s fresh water resources. By improving ornamental irrigation efficiency by 50%, we can save more than 42 gallons of water per person for each of the 310 million people in the US each year 2. More detailed results from the project can be found at http://www.smart-farms.net
1 Kenny et al., 2009. Estimated use of water in the United States in 2005: U.S. Geological Survey Circ. 1344, 52 p.
2 U.S. Dept. Agric, 2009. 2008 Farm and Ranch Irrigation Survey: Horticultural Operations Data. Nat. Agric. Stat.
Serv., Washington, D.C.
2. Enabling Smart Decision-Irrigation for Nurseries and Greenhouses
http://ashsmedia.org/?p=???
Specialty crop growers must have access to tools that make scheduling irrigations easy, but also are based on smart information systems. Through collaborations between plant scientists, engineers, and economists at five universities and two commercial companies, our project has developed new sensor technology and software to automatically control irrigation based on daily plant water requirements, and field tested these products in commercial nursery and greenhouse operations in MD, GA, TN and OH during 2012. Our project has developed a smart wireless sensor (nR5) node that is capable of integrating outputs from a range of soil moisture and environmental sensors, and uses that information to determine when irrigations should be applied. This enables growers to implement irrigation set-point or model-based protocols, which are then executed by the nodes, enhancing human decision-making. The nR5-DC version of the node can independently power a latching solenoid, allowing irrigation control in remote field situations. These nodes are low maintenance, have a reliable communications protocol, and a long battery life ― greater than 6-months with five AA batteries during testing in 2012. Equally important is the computer user interface (software) which enables two-way communication and control of these wireless sensor networks in the field. The software fulfills three primary functions: (1) Efficient management of nodes (configuration of sensors, set-points etc.); (2) Organization of data transmitted from the sensor nodes in the field and (3) Display of that data in graphical form for quick decision-making by the grower
Fig.1. The nR5-DC sensor node installed in a pot-in-pot nursery in Tennessee

8
Fig. 2. The Sensorweb software homepage for a greenhouse operation
The Sensorweb software developed by this project has a sophisticated set of monitoring and control functions. Each network has a dedicated website showing the unique farm layout and locations of the nodes in the network, allowing users to quickly view data ‘at a glance’, while also giving the ability to further analyze sensor data using easy-to-use charting functions.
The software also has a wide variety of irrigation control functions based either on sensor ‘set-points’ or more advanced model-based tools based on environmental sensors.
During 2012, we reduced water use by 37% to 69% of current best management (multiple small cyclic) irrigation practices in a number of commercial operations. In one nursery where water is drawn from a river, halving water application rates would have saved over 43 million gallons water in 2012, and $6,500 in pumping costs. In the central valley of California, where water costs are typically $750 / acre foot, the net cost of that saved water would have been at least $100,000, without accounting for any pumping, plant growth or any other economic benefits. Simply put, the return on investment for the entire farm network (<$25,000) in this case would have been less than 3 months. Additional results from the project can be found at http://www.smart-farms.net 3. Better Irrigation in Nurseries and Greenhouses Saves both Water and Money
http://ashsmedia.org/?p=410
The US greenhouse and nursery industry supplies consumers with ornamental plants, vegetable seedlings, and fruit trees for use in gardens throughout North America. Irrigation in greenhouses and nurseries can be difficult to manage, because many of the plants are grown in fairly small pots that may need to be watered several times per day. Most greenhouse and nurseries grow a wide variety of crops; Adjusting irrigation of this variety of crops based on actual watering needs is too time-consuming for growers.
To address this challenge, we have developed wireless sensor networks to help growers automate irrigation based on the actual water needs of their crops. The principle is simple: soil moisture sensors are inserted into the pots and they measure how much water is present in real-time. The sensors are connected to a ‘node’, which radios the data to a computer, where the data is presented in charts. Growers can see whether the various crops have adequate water. More importantly, they can use this computer to instruct each node when and for how long to turn on the irrigation. This way, plants get watered only when needed and only with the amount of water that is required.

9
We are testing this system in a commercial nursery in Georgia. For testing, we chose Gardenia jasminoides ‘August Beauty’, one of the most challenging crops produced by this nursery. Typically, this nursery loses about 20 – 30% of the plants during the production, and most of these losses are due to watering too much and associated disease pressure.
Irrigating this crop using a smart wireless sensor network eliminated these losses. Just as importantly, we found that we could actually grow the crop much faster; the normal production cycle for these plants is 14 months, but with decision irrigation we grew it in only eight months.
Fig. 3. A Gardenia crop grown using precision irrigation.
This precision irrigation had various benefits to the nursery: since none of the plants died because of overwatering, the nursery could sell 2,000 more plants than they anticipated. And shortening the production cycle from 14 to 8 months reduced the production inputs (labor, fertilizer, fungicides etc.).
Combined, the additional plants that were sold and the reduced production costs resulted in an economic gain of $20,700 or approximately $1/sq. ft. The required hardware and software only costs about $6,000, so in this case, the return on investment was just a few months.
This research not only benefited this nursery, but also society at large. By irrigating more precisely, the nursery withdraws less ground water, leaving more water for other uses.
Fig. 4. Forecast and actual sale dates of the gardenias in this study. The nursery anticipated selling the plants from early 2011 through spring 2012. Because the plants grew better than expected, all plants were sold during winter/spring 2011.
After seeing the benefits of better irrigation practices, the nursery has adjusted their irrigation practices throughout the entire nursery. We conservatively estimate that this has reduced their water use by 100,000,000 gallons per year, enough water to supply about 800 households or about 2,000 people. More detailed results from the project can be found at http://www.smart-farms.net

10
A. Engineering - Hardware and Software: Carnegie Mellon Robotics Institute and Decagon Devices
During the third year the engineering teams at Carnegie Mellon University and Decagon Devices, Inc. continued developing the irrigation advanced control system (hardware and the sensorweb software program) to add new features, make it more reliable, and work out of the box. Some of the major engineering accomplishments include: Deployed the new nR5 irrigation control nodes with latching control solenoids (nR5-DC) in addition
to the non-latching (nR5) control node in a number of farm and research environments.
Over one dozen locations are now using the nR5 node / sensorweb software. All sites are configured using a dedicated website (IP address) for each network.
The Sensorweb basestation and software system now works out of the box and does not require direct engineering support for the installation, apart from telephone / network configuration.
The Sensorweb software has many new features including graphical views, real-time alerts as text messages or e-mails, error detection, and advanced irrigation methods as part of the user interface.
Bad sensor detection is embedded in the node firmware to avoid using bad sensor data for irrigation and in the user interface to alert users to potential problems.
Sensor-controlled (set-point) irrigation has been implemented in five commercial operations (McCorkle, Evergreen, Bauers, Raemelton and Hale and Hines) where irrigation schedules have been continuously used to schedule daily irrigations throughout 2012. Reductions in water use have ranged from 37 to 69% of current grower-scheduled irrigation water applications.
Three plant models have been implemented using the Sensorweb software: 1) UGA Petunia model, 2) CSU MAESTRA model, and the 3) UMD Green Roof storm water model.
Model-based irrigation has been used throughout 2012 to actively control crop irrigation without requiring human intervention.
1. Hardware (nR5 Node) Development
During year 3, the team at Decagon completed work on the nR5-DC measurement and control node (Fig. 5). This new node supports the latching DC solenoids available for many of the standard irrigation valves on the market. This type of solenoid supports a low-power, energy-efficient system by requiring power only when the solenoid is turned on or turned off. The nR5-DC generates the necessary switching voltage from the on-board five AA alkaline battery power supply.
Decagon developed the nR5-DC node in response to requests from the project scientist and partner growers. They expressed the desire to avoid the expense and labor of providing 24VAC power to each irrigation solenoid used in a site’s irrigation system. The nR5-DC node type has proven popular — there are now more nR5-DC nodes deployed than the original monitoring and control node (nR5 used with 24V AC irritation solenoid valves).
Fig. 5. The Decagon nR5-DC Node

11
Both types of nR5 nodes run the same firmware code. This means all other node features and settings are the same. Each node type had the same firmware improvements released this year. These improvements include better radio module driver, improvements to the control routines, and numerous bug fixes. The latest firmware update also supports new Decagon sensors.
The node firmware released this year also contains an important new feature that helps prevent erroneous irrigation decisions based on bad sensor values. The node firmware maintains a range of acceptable values for each sensor type. If a sensor’s output falls outside of this expected range, the sensor’s output is not included in the average used to make irrigation decisions. This new feature is in addition to other fail-safe modes and settings that should protect crop health.
Decagon is committed to improving the node hardware. At the end of year 3, Decagon is preparing a new version of the nR5 node with an improved AC voltage detection circuit (used to help troubleshoot control decisions). The nR5 and nR5-DC nodes now share a common circuit board helping to make the manufacturing of the node more efficient. These new nodes will be put into use during year four. Table 1. Summary Deployment of nR5 and EM50R nodes deployed in various projects. All nR5 (control)
irrigation nodes supported entirely using the Sensorweb software program (Carnegie Mellon)
Site Name Number of Monitoring Nodes
Number of Irrigation Control Nodes
Number of Growing Tools Used
Bauers Greenhouse 19 8 6
Hale and Hines Nursery 11 2 0
McCorkle Nurseries 1 9 9
Raemelton Farm 18 3 0
Willoway Nurseries 22 6 21
University of Maryland Greenhouse
26 24* 3
* Currently being used for monitoring purposes only; Model integration and irrigation control planned for 2013.
2. Base Station & Sensorweb Software (User Interface)
The base station with user interface has continued to be a pivotal part of the system allowing growers and researchers to understand and act on the data being reported from the nodes in the field. During year 3, the emphasis has been on developing reliability and ease of use, in addition to adding new software and user requested features.
3. Irrigation Scheduling
During year 2, a base software system with spatial data views (Fig. 6), irrigation scheduling tools (Figs. 4 and 5) and a sophisticated graphical user interface was developed to display the sensor data (Figs. 7, 8 and 9). In Year 3, these tools were deployed in numerous sites during 2012 and the results from those networks and experimentation are reported on throughout this document.

12
Fig. 6. Bauers network homepage with spatial view of sensor data. The mouse-over box (Node MC 7) shows the latest recorded data from each sensor; arrows indicate short term data trends.
Fig. 7. Macro-irrigation schedule tool at Hale and Hines. This “open” schedule was used in tandem with the micro-pulse tool (See Fig. 8) to achieve significant savings in water use (see Hale and Hines report in the University of Maryland section (below).

13
Fig. 8. Irrigation “micro-pulse” irrigation schedule tool configuration used in tandem with the set point control (Fig. 7) in Dogwood and Maple control blocks at Hale and Hines during 2012.
Fig. 9. Graphical display of data showing blue vertical bars (irrigation events) and horizontal data lines for two soil moisture sensors. The set-point average for control was maintained at 46% substrate volumetric water content during 2012. The light blue horizontal line shows real-time water use from the flow meters integrated into the system. The horizontal blue band is a user defined region that quickly indicates optimal moisture levels to the grower.

14
4. New Software Features:
a) Text Alerts: Some of the new features include: alerts, bad sensor detection, and new irrigation control methods. The parameters that can be monitored include any sensor attached to the node, amount of irrigation, or the output from any growing tool (growing tools are further discussed below).
The alert tool allows email or text message (Fig. 10) based alerts to be sent out when a monitored parameter goes above or below a set value. Alerts are also displayed on the home page so that users will see it in the case that the email or text message was not delivered.
Fig. 10. Sample text message alert
b) Bad sensor detection: The system now checks all sensor values to alert the user that something is
wrong. In order to make it easy to see all bad sensor values, displayed in red on the interface.
Advanced irrigation control methods were also added to the system. Utilizing the ‘growing tools’,
irrigation can be implemented based on plant science models, computed data products, or data
from any node in the system (next section).
c) Grower Tools: Different growers and researchers have different metrics and values that are
important to them. Growing tools allow this system to be flexible and meet those different needs.
There are two categories of tools available to the user:
1. The first type allows users to use predefined tools to compute things such as averages, vapor
pressure deficit, pore EC, and dew point. These ‘grower’ tools produce outputs that can then be
viewed in real time, plotted, or used to control irrigation with a user defined setpoint.
2. The second category of ‘grower’ tools are model-based. Model-based tools run advanced plant
science models that are then available from the interface where the output can be viewed,
plotted, or used to control irrigation. Model based tools can directly control and command
irrigation events to occur. So far three model-based tools have been implemented; the UGA
Petunia model, the CSU MAESTRA model, and the UMD Green Roof storm water model. The
framework for adding model based tools allows just about any model to be easily integrated
into the sensorweb system.
d) In-line Help: was added throughout the entire site so that users can get usage information and tips
without navigating away from what they are doing. A further help page was created that goes into
more detail about system usage. The system has demonstrated its reliability by running
continuously at over a dozen sites throughout this past year.

15
5. Field Testing and Support
In year three a large emphasis was placed on reliability and ease of use. This has led to the system working out of the box without direct installation (on-site) support being required of the Carnegie-Mellon team. While the number of support calls to the engineering team has decreased, the engineering team remains active in tracking current systems in order to flush out any remaining bugs, determine what should be improved, and what new features are desired. The system is deployed at over a dozen sites; the sites can be seen in Fig. 11 or online at http://www.frc.ri.cmu.edu/sensorweb/sensorwebSites.html
Fig. 11. Map showing location of current Sensorweb enabled sites (Image of the USA is from Wikipedia).

16
Red maple
0.3
0.4
0.5
0.6
Th
eta
pro
be
VW
C (
m3 m
-3)
0.2
0.3
0.4
0.5
0.6
0.2 0.3 0.4 0.5 0.6
0.2
0.3
0.4
0.5
5TM VWC (m3 m
-3)
0.2 0.3 0.4 0.5 0.6
River birch Hornbeam
Redbud Thuja
B. Scientific Research and Development - Colorado State University 1) We installed and deployed two additional remote sensor web systems (one at Fort Collins, CO and
one at Avon, OH) that may be accessed remotely through the Sensorweb environment designed by Carnegie Mellon University. Network available at http://64.91.37.82:3000/user/login
2) We compared soil moisture sensor types and calibration accuracy between three commercially available capacitance based soil moisture sensors (Decagon 5TM, 10HS, and Dynamax Theta-probe); see Fig. 12.
Fig. 12. Comparison of Decagon 5 TM sensor with Theta probe sensor among five study species. A linear relationship exists but the volumetric water content value is offset from the 1:1 line. A similar phenomena exists when we compare the Decagon 5TM to the Decagon 10 HS (data not shown). We are currently still investigating the cause of this phenomenon.
3) We investigated the physiological parameter effect and the impact of uncertainty in parameter
input values for common forms of the Ball, Woodrow, and Berry (1987) stomatal conductance model coupled to the Farquhar et al. photosynthesis model. Hence, we determined interactions between gradients in environment and physiological responses that can change the parameter input effect on water use estimates (output). We can now effectively limit overall uncertainty in model physiological input and model transpiration output error.

17
Fig. 13. The change in the parameter effect percentage (%) of minimal stomatal conductance (g0) on transpiration estimates across a range of photosynthetically active radiation (PAR) levels and air temperatures. The % represents the transpiration output sensitivity to g0 input for (a) the intra-specific Acer rubrum L. range and (b) the temperate hardwood C3 parameter range. Bauerle et al., In review Global Change Biology.
Fig. 14. The difference in the parameter effect percentage (%) of (a) minimal stomatal conductance (g0) and (b) stomatal sensitivity to the marginal water cost of carbon gain (g1) on transpiration estimates relative to a C3 literature mean base case for temperate hardwood species (g0; 0.0755 ± 0.0755 mol m-2 s-1) and (g1; 8.05 ± 5.05 unitless) across a range of photosynthetically active radiation (PAR) levels. The dashed line in each panel represents the base case and the solid line illustrates a commonly used value to illustrate when error or uncertainty in the estimate may occur. Bauerle et al., In review Global Change Biology. It is important to note that these two parameters (g0 & g1) are the most important parameters when using a physiological basis to estimate plant transpiration in C3 species.

18
Betula nigra
0 1 2 3 4
Pre
dic
ted t
ransp
irat
ion (
kg t
ree-1
day
-1)
0
1
2
3
4Acer rubrum
0.0 0.5 1.0 1.5 2.0
0.0
0.5
1.0
1.5
2.0
Carpinus betula
0.0 0.5 1.0 1.5 2.0 2.5
0.0
0.5
1.0
1.5
2.0
2.5
Cercis canadensis
Measured transpiration (kg tree-1
day-1
)
0.0 0.5 1.0 1.5 2.0 2.5
0.0
0.5
1.0
1.5
2.0
2.5
MBE = 0.07RMSE = 0.09
MBE = 0.08RMSE = 0.03
MBE = 0.05RMSE = 0.05
MBE = 0.07RMSE = 0.05
4) We used water balance measurements, provided by logged irrigation output and tipping bucket leachate, to calibrate and validate the performance of a predictive canopy water use model (i.e. MAESTRA).
Fig. 15. Measured versus modeled values of whole tree transpiration in four broadleaved tree species. MBE is mean bias error; RMSE is root mean square error.
Each point represents the mean values of 14 individual days of measured or modeled transpiration values. Bars represent one standard error (n = 14).
Barnard & Bauerle: Submitted to Journal of Biogeosciences October 15, 2012.
Fig. 16. The canopy parameter effect (%) of minimum stomatal conductance on transpiration estimates relative to canopy depth and width at an LAI of 2, 5 and 10.

19
The parameter effect (Fig. 16) was calculated as the difference in transpiration at the upper (71.36 mmol m-2 sec-1) and lower range (13.67 mmol m-2 sec-1) of measured g0 normalized by the mean (42.57 mmol m-2 sec-1). Contours show changes in parameter effect (%). The simulated stand consisted of 250 trees of uniform height, spacing, canopy height and canopy diameter.
These results clearly indicate when we need to concern ourselves with accurate parameterization and when it might not matter as much. In other words, densely packed foliage requires more care in model parameterization and accuracy of parameters within the model because their values have a larger effect on the transpiration estimate output.
5) Developed seasonal relationships that give us the ability to scale important transpiration and carbon prediction parameters across the season from the collection/measurement at only one time point. For example, the equation below allows us to scale the maximum Rubisco carboxylation rate (Vcmax) across the season based on the change in day length relative to the summer solstice.
The equation was developed from the analysis illustrated in Fig. 17a. The results were published this year in Bauerle WL, Oren R, Way DA et al. (2012) Photoperiodic regulation of the seasonal pattern of photosynthetic capacity and the implications for carbon cycling. Proceedings of the National Academy of Sciences, 109: 8612-8617.
Fig. 17. Seasonal responses of photosynthetic physiology in 23 tree species. Binned averages (means ± SE) of measured changes in: (a) maximum Rubisco carboxylation rate (Vcmax), (b) maximum electron transport rate (Jmax) normalized by maximum calculated values for each species-year curve versus DOY and set at 1.0 for the maximum value of the bin means.
Sample size in bins indicated by bubble diameter (n = 21–98 for Vcmax and 5–39 for Jmax). Leaf shedding dates are indicated by the gray bars. Mean modeled peak DOY for day length (cyan lines), air temperature (orange lines), and (a) Vcmax (blue line) or (b) Jmax (red line) from a mixed effect quadratic model, whose explicit purpose was to test relative locations of the peaks of photoperiod, temperature, and biological responses.
Day of Year

20
S
tem
dia
met
er (
%)
0
20
40
60
80
100
120
140
160
180
T
ree
hei
gh
t (%
)
0
20
40
60
80
100
120
140
160
180
A. rubrum
B. nigra
C. betula
C. canadensis
L
eaf
area
(%
)
0
500
1000
1500
2000
2500
6) Currently comparing tree growth properties and water use performance (i.e. irrigation use efficiency) of the soil moisture threshold based irrigation scheme versus MAESTRA model controlled (Fig. 18). Fig. 18. Seasonal accumulation of stem diameter (top panel), tree height (center panel), and canopy leaf area (lower panel) in four study species. We compared threshold to model based irrigation scheduling. Hashed bars represent substrate moisture threshold irrigation scheme, while the solid bars represent the model based irrigation scheme. Note that Betula nigra accumulated more tree height under soil moisture irrigation scheme than under the model based irrigation scheme
7) We are currently using the validated MAESTRA species specific parameter set to apply daily
irrigations based on predictive estimates of water use on a 15-minute time step at Willoway Nursery. The model is so far performing very well, maintaining substrate volumetric water content within +/- 3% VWC except during precipitation events (see Fig. 19 below). Note that this model is actively implemented using the Sensorweb software modeling function, which allows for direct control of irrigations via the nR5 node, connected to a 24V or 12V-DC solenoids.

21
Fig. 19. Model based irrigation control. The flat trajectory of the average soil moisture readings per species (individual lines in figure) indicates that the model was holding the water content steady regardless of environmental fluctuation. Other aspects are noted on the chart.
C. Scientific Research and Development - Cornell University It is becoming increasingly well-known that not all tree root systems are built the same, let alone distributed equally throughout the soil profile. Countless studies examine root architecture or morphological factors in response to the soil environment such as nutrient or water availability. Rightly so, root system morphology and distribution in the soil profile can have serious consequences for a tree’s ability to forage for resources including water and nutrient uptake, stability, and survivability after transplanting, Root growth is clearly influenced by its soil environment but intrinsic variables constrain root growth variability (Malamy 2005).
Understanding root growth and developmental patterns will have clear implications on how we water, fertilize and manage ornamental trees. Moreover, root morphology and distribution may influence transplant ability and field performance. Studies on root system morphology traits have investigated various root measurements including root volume (Rv), the number of 1st order roots (≥1mm) that arise from the tap root (FOLR), root length, and root area index as a means of predicting root soil exploration and tree survival (Ritchie and Dunlap 1980; Jacobs, Salifu and Seifert 2005).

22
Our Year 3 Objectives were to: 1. Quantify tree root system growth in containers over time 2. Relate tree root growth and distribution to sensor variability
Deliverables: 1. Data derived from computed tomography (CT) scanner stacks of 3 species over time 2. Fine to coarse root ratios for 7 tree species 3. Data on seasonal root growth and exploration among species
Success Criteria 1. Quantitative information on root exploration in containers 2. Quantitative information to inform sensor placement
We used a medical CT scanner (Toshiba Aquilon, Tokyo, Japan) to acquire one full scan per tree replicate during each scanning session. Containers were placed horizontally on the scanning bench and aligned with pre-placed markings to ensure container positioning. The field of view was filled with sample to eliminate differences in beam intensity. Raw 2D tomographic projection images were loaded into Carestream solutions (Kodak) software to normalize viewing areas. Three concentric rings resulting in four areas 4.5 cm, 9cm , 13.5 cm , 18 cm distance from the center were superimposed onto the projection images to provide user standardization of measurement areas (Fig. 20).
Fig. 20. Examples of identical cross slices through two dimensional computed tomography scans in May (a) and September (b). Yellow concentric rings were used to mark distance from the center of the container.
All 25 images from the stack of CT scans (approximately 2.5 cm depth increments) were used to measure root number and average root diameter. Root material was visually resolved from the soil matrix by two means: 1) Root tissues resulted in a lower attenuation (i.e. lighter grey) pixel classification compared to soil or
air; 2) The area of interest “root” was continuous through several image slices, unlike pine bark material
which was determinate, for example).
a b

23
Fig. 21 .Number of roots per diameter class (mm) in May, June, and September at depth 1 (0-10cm), depth 2 (11-20 cm), and depth 3 (21-30) cm for 1-year-old Gleditsia (a), Quercus(b) and Acer (c) grown
a
c
b

24
in 15 gallon containers. Results were aquired non-destructively through 2 dimensional slices of X-ray computed tomography scans. The root system of perennial plants is heterogeneous and studies on the ecology of the fine root system benefit from a functional classification of fine roots (Fig. 21). The classification of root segments based on branching hierarchy captures functional differences and is closely linked to anatomical and chemical characteristics of the roots. This classification can provide a framework for investigation of available sites for water and nutrient uptake. In effort to employ a functional classification of fine roots, roots are described by hierarchical branching order (see Pregitzer et al., 2002). This classification recognizes a shift in function from absorbance and uptake to transport and anchorage that occurs with increasing root order. Increasing stele: root ratio, initiation of secondary xylem and cork cambium formation and the sloughing of the cortical tissues have all been linked with increasing root order (Guo et al., 2008). Corresponding chemical and physiological shifts include increased carbon to nitrogen ratio, increased lignin content and decreased respiration (Hishi, 2007). Species were very different in their architecture, as expected. Currently stele to cortex ratios are being analyzed to determine water transport capacity (Fig. 22).
Fig. 22. Example root architecture and anatomical sections of a root module (Acer rubrum) displaying root anatomy by root order.
25
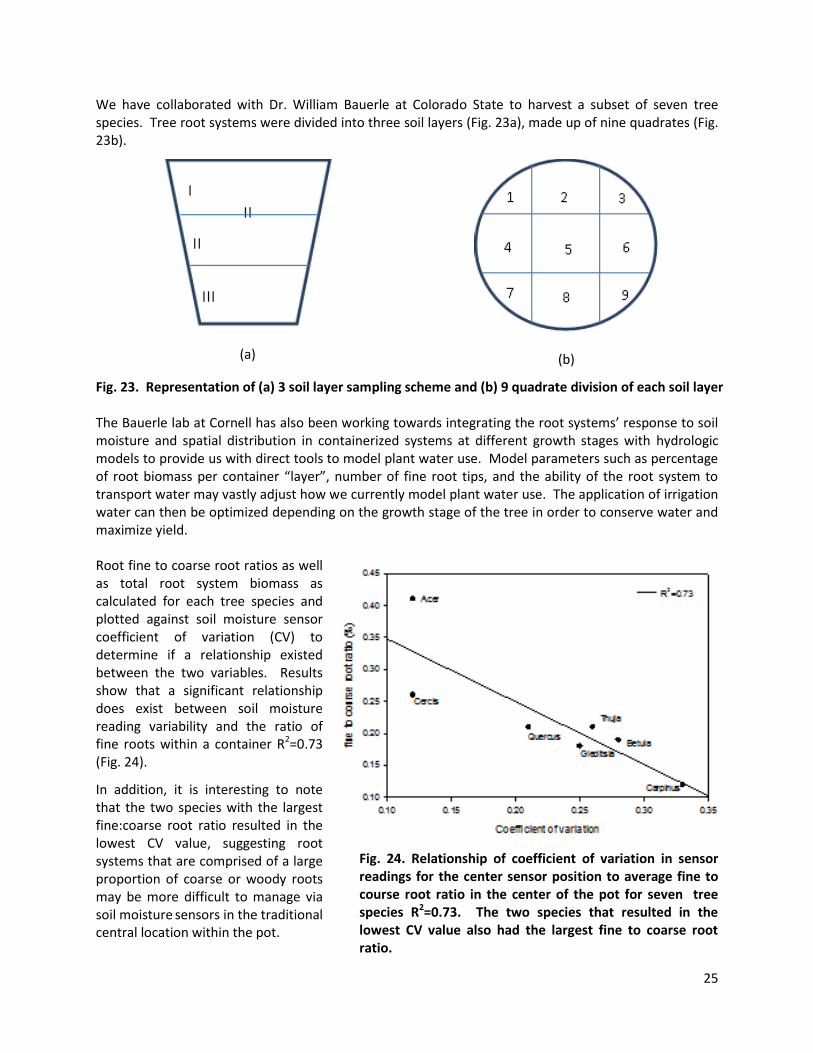
We have collaborated with Dr. William Bauerle at Colorado State to harvest a subset of seven tree species. Tree root systems were divided into three soil layers (Fig. 23a), made up of nine quadrates (Fig. 23b).
(a)
(b)
Fig. 23. Representation of (a) 3 soil layer sampling scheme and (b) 9 quadrate division of each soil layer The Bauerle lab at Cornell has also been working towards integrating the root systems’ response to soil moisture and spatial distribution in containerized systems at different growth stages with hydrologic models to provide us with direct tools to model plant water use. Model parameters such as percentage of root biomass per container “layer”, number of fine root tips, and the ability of the root system to transport water may vastly adjust how we currently model plant water use. The application of irrigation water can then be optimized depending on the growth stage of the tree in order to conserve water and maximize yield.
Root fine to coarse root ratios as well as total root system biomass as calculated for each tree species and plotted against soil moisture sensor coefficient of variation (CV) to determine if a relationship existed between the two variables. Results show that a significant relationship does exist between soil moisture reading variability and the ratio of fine roots within a container R2=0.73 (Fig. 24).
In addition, it is interesting to note that the two species with the largest fine:coarse root ratio resulted in the lowest CV value, suggesting root systems that are comprised of a large proportion of coarse or woody roots may be more difficult to manage via soil moisture sensors in the traditional central location within the pot.
Fig. 24. Relationship of coefficient of variation in sensor readings for the center sensor position to average fine to course root ratio in the center of the pot for seven tree species R2=0.73. The two species that resulted in the lowest CV value also had the largest fine to coarse root ratio.

26
We are currently further exploring best practices for using soil moisture sensors in trees with course root systems by graphing areas of high fine root concentration within “coarse root” trees (Fig. 25).
Fig. 25. Fine to coarse root ratio for Quercus (b) and Gleditsia (c) root systems relative to Acer (a)
Impact Statement:
Little is known about individual tree species’ relative investment in root growth and distribution in containerized systems. Because fine roots are responsible for resource foraging and acquisition understanding their spatial distribution can help up better manage this system. The goal of this project is to understand plant performance including growth and biomass production to inform research on soil moisture variability. This is important in light of increasing water limitations and costs in agricultural and horticultural systems. We evaluated ten tree species growth patterns both non-destructively (CT scans) and destructively (harvests) to relate tree root growth to soil moisture sensor readings. We are able to draw a strong relationship to soil moisture variability in containers that allow for more informed precision irrigation.
Acer Gleditsia Quercus

27
D. Scientific Research and Development - University of Georgia
Objective 1: Determine whether soil moisture sensor-controlled irrigation can be used to control stem elongation and improve plant quality (greenhouse) 1. Using controlled drought for regulating plant height of poinsettia. We have decided to use poinsettia as the model crop to look specifically at height control, since poinsettia height control is crucial for plant quality and shipping, yet can be difficult to achieve. There are also published standards for acceptable poinsettia height and established protocols for tracking height over the course of a production cycle. This allows for objective decision making on the need for height control.
The commercial production of poinsettias involves intensive use of plant growth regulators (PGRs) to control height. Height control is necessary for visual appeal and post-harvest handling. Growth regulators are expensive and do not always provide consistent results. Since turgor potential drives cell elongation, and thus stem elongation, drought stress has potential for effectively regulating plant height. Using soil moisture sensors, the severity of drought stress can be monitored and controlled. The objective of our study was to compare poinsettia height control using PGRs (spray, mixture of B-Nine and Cycocel at 1000 ppm and drench, 0.25 ppm Bonzi) to the use of controlled water deficit (Fig. 26).
Fig. 26. Overview of the poinsettia study at the start(left) and end (right) of the crop cycle.
Graphical tracking of plant height was used to determine when to apply PGRs or controlled water deficit. In the water deficit treatment, substrate water content was reduced from 0.4 to 0.2 m3/m3 when height exceeded the target height at a given date. Plant growth regulator applications (spray or drench) reduced poinsettia height below the final target level of 43.5 cm. Water deficit resulted in an average height of 44.5 cm, closest to the target height. As expected, control plants were significantly taller, averaging 49.4 cm (Fig. 27).
Most stem elongation occurred between 14 and 30 days after pinching. There was no effect of PGR drenching or water deficit on bract size, while spraying PGRs reduced bract size. Bract color was not affected by water deficit or PGRs. There was no difference in shoot dry mass between PGR- and water

28
deficit-treated plants. Lateral growth was reduced by PGRs while water deficit had no effect on lateral growth. These results indicate that water deficit can control poinsettia height without compromising quality and that soil moisture sensors can be used to effectively control this water deficit.
Fig. 27. Final plant height of poinsettias. Three methods of height control were used: controlled water deficit, plant growth regulator (PGR) sprays and PGR drenches. Control (untreated) plants were too tall, while PGR reduced plant height too much. Only plants exposed to controlled water deficit had plant heights within the target range (red line: target height, dashed lines, acceptable range). Objective 2 and 3: Nursery and greenhouse research to develop best management practices for irrigation using soil moisture sensors. Determine effects of substrate water content on physiology, growth, and quality of different crops 2. Effect of substrate water content on growth, quality and disease susceptibility of Gardenia jasminoides. We conducted a study using Gardenia jasminoides ‘Radicans’ and ‘August Beauty’ grown in Watkinsville and Tifton, GA from summer to fall 2011. In this study, we compared the water use, growth, and morphology of these two cultivars grown at four different substrate water content thresholds. Plants were irrigated with 60 mL of water over a 2 minute interval when substrate water content dropped below the thresholds of 0.20, 0.30, 0.40, or 0.50 m3·m-3.
Water use increased with increasing threshold for both cultivars; however, leaching was observed at the 0.50 m3·m-3 threshold for both cultivars (Fig. 28). Plant height and shoot and root dry weight also increased with increasing threshold, with growth at the 0.40 and 0.50 m3·m-3 being much greater than that at the 0.20 and 0.30 m3·m-3 thresholds (Figs. 29, 31). Bud development was also affected by irrigation volume. Development of buds was delayed for the 0.30 m3·m-3 threshold and negatively impacted for the 0.50 m3·m-3 threshold for ‘Radicans’. Irrigation volume at the 0.20 m3·m-3 threshold was insufficient for bud development (Fig. 30). Bud development for the 30% threshold was delayed until October for both cultivars. For ‘Radicans’ bud development was greater at the 40% threshold vs. the 50% threshold suggesting that the excessive irrigation applied to the 50% threshold was detrimental to bud development.

29
August Beauty
Substrate volumetric water content (%)
20 30 40 50
Cu
mu
lative
irr
iga
tio
n v
olu
me
(L
/pla
nt)
0
20
40
60
80
100
120
140
Watkinsville
Tifton
Radicans
20 30 40 50
0
20
40
60
80
100
120
140
Watkinsville
Tifton
Fig. 28. Cumulative irrigation volume (L/plant) increased with increasing substrate water content threshold for both cultivars and locations. Leaching was observed at the 50% threshold at both locations.
August Beauty
Substrate volumetric water content (%)
20 30 40 50
Shoot dry
mass (
g)
0
20
40
60
80
Watkinsville
Tifton
Radicans
20 30 40 50
0
10
20
30
40
Watkinsville
Tifton
Fig. 29. Shoot dry mass (g/plant) increased with increasing substrate water content threshold for both cultivars and at both locations.
August Beauty
Date
Sep Oct Nov
Ave
rage n
um
ber
of
buds p
er
pla
nt
0
2
4
6
8
10
20%
30%
40%
50%
Radicans
Sep Oct Nov
0
2
4
6
8
10
Fig. 30. Average number of buds per plant from the Watkinsville experiment from mid-August to the beginning of November.

30
Plants at both the 0.40 and 0.50 m3·m-3 threshold were considered salable (Fig. 31); however, there was an average difference of 37.5 L/plant for’ August Beauty’ and 106.5 L/plant for ‘Radicans’ between the 0.40 and 0.50 m3·m-3 thresholds with only a 13 g/plant shoot dry weight difference for August Beauty and a 10 g/plant difference for ‘Radicans’.
Fig. 31. Visual appearance of shoot and root growth from 20% (left) to 50% (right). Note that growth is very similar for the 40 and 50% thresholds.
3. Water uptake of Hydrangea macrophylla and Gardenia jasminoides in response to a gradually drying substrate. There is a lack of quantitative data regarding how much of the water in soilless substrates is actually available for plant uptake. Substrate moisture release curves have been used to predict the amount of plant-available water in soilless substrates, yet there is little information about whether there are differences among species in their ability to extract water from soilless substrates.
We studied how water uptake in Hydrangea macrophylla and Gardenia jasminoides was affected by decreasing substrate volumetric water content (VWC). Growth chambers were used to provide stable environmental conditions that included continuous lighting to prevent diurnal fluctuations in water use.
Plant water use was monitored using load cells (weight measurements), while substrate water content was monitored with Decagon 10HS soil moisture sensors (Fig. 32).
Fig. 32. Hydrangea and gardenia inside of the growth chamber.
August Beauty Radicans
August Beauty Radicans

31
Whole plant conductance was calculated from water use and vapor pressure deficit. Conductance of H. macrophylla ‘Fasan’ started to decrease at a higher VWC (0.28 m3∙m‐3) than G. jasminoides ‘Radicans’ (0.20 m3∙m‐3; Fig. 33). Plant water uptake stopped completely at a VWC of 0.16 m3∙m‐3 in H. macrophylla and 0.12 m3∙m‐3 in G. jasminoides. The results show that H. macrophylla is less adept at extracting water from a drying substrate than G. jasminoides. Traditionally, plant available water in soilless substrates has been studied using substrate moisture release curves, but our data show that there are important differences among species that cannot be detected from moisture release curves.
Fig. 33. Whole plant conductance of a representative hydrangea and gardenia plant as a function of substrate water content.
4. Comparative daily water use of hydrangea and gardenia. Relatively little is known about how much water nursery crops require to maintain optimal growth rates.
We determined daily water use (DWU) of Hydrangea macrophylla and Gardenia jasminoides, quantified how this was affected by environmental conditions, developed a quantitative model describing DWU, and evaluated this model with an independent data set. We combined 2011 data with a data set collected in 2010. In 2010, we quantified the DWU of two Hydrangea macrophylla cultivars, ‘Fasan’ and ‘Pia’. There was little difference in DWU of the two cultivars, which ranged from 50-300 mL/plant, depending on plant age and weather conditions.
The 2010 data were used to develop a model to describe plant water use based on the combined effects of plant age, final leaf area, DLI, and their interactions. Daily light integral (DLI) was the most important environmental factor affecting DWU, with DWU increasing with increasing DLI. In July 2011, a follow up study was conducted using Hydrangea macrophylla ‘Fasan’ and Gardenia jasminoides ‘Radicans’ (Fig. 34).

32
Fig. 34. An overview of the gardenias and hydrangeas in the hoop house at the Center for Applied Nursery Research. Some of the plants are on load cells to monitor water use.
Daily water use of ‘Fasan’ ranged from 50-200 mL/plant and DWU of ‘Radicans’ ranged from 50-560 mL/plant (Fig. 35) The lower DWU of ‘Fasan’ in 2011 compared to 2010 was likely due to stunted growth of the hydrangeas, probably from excessive heat after transplanting. Interestingly, vapor pressure deficit (VPD) explained more of the daily fluctuations in DWU in 2011, than in 2010. These results suggest there is a complex relationship between DLI and VPD effects on DWU and this will require further analysis to better understand their effect on DWU.
Fig. 35. Daily water use of hydrangea ‘Fasan’ and gardenia ‘Radicans’. Water use fluctuated in accordance with the daily light integral (DLI).

33
Predicting DWU of the 2011 ‘Fasan’ crop using 2011 environmental conditions and a regression model developed using the 2010 data resulted in DWU estimates that were 33-98% too high, except for five days with the lowest DLI and VPD, that resulted in the model underestimating DWU by 1.2 to 3.3% (Fig. 36).
Time (days)
0 10 20 30 40 50 60 70 80 90 100 110 120 130 140 150
DW
U (
mL. d
-1)
0
100
200
300
400
Avg. Fasan DWU
Estimated DWU
Fig. 36. Daily water use of hydrangea ‘Fasan’ and estimated daily water based on a model developed using data from 2010. The model generally overestimates daily water use, because the 2010 plants grew better, were larger, and thus used more water.
This discrepancy is likely due to the differences in ‘Fasan’ growth in 2010 and 2011: there was more vegetative growth early in the growing season in 2010 than in 2011, resulting in differences in canopy size between the two years. Likewise, the higher water use of ‘Radicans’ as compared to ’Fasan’ in 2011 was at least partly due to differences in canopy size. Despite difference in growth patterns during the growing season, day-to-day fluctuations in water use were similar in the two species, suggesting that short-term responses to environmental conditions are similar among species. We hypothesize that including a measure of plant size, rather than age, into predictive DWU models will improve performance and may help account for growth differences among growing seasons. Including percent canopy closure or light interception may be a simple nondestructive method to do so. 5. Leaching under different irrigation regimes and fertilizer rates in the greenhouse. Fertilization and irrigation are important practices that influence crop quality in greenhouse production. Many greenhouse growers apply water soluble fertilizer during irrigation (fertigation). Applied fertilizer can therefore be lost by leaching and result in both economic losses and a potential environmental problem (runoff of nutrient-rich water). The objective of this study was to find out if growers can use less fertilizer and reduce production costs if they irrigate more efficiently and leach less.
Petunia seedlings were grown to maturity using two concentrations of water-soluble fertilizer (100 and 200 ppm nitrogen) and four irrigation treatments that resulted in different amounts of leaching (Fig. 37).

34
Fig. 37. Petunia seedlings transplanted into six inch pots and placed in larger containers lined with a plastic bag to collect leachate.
Plants were irrigated when the substrate water content dropped below 0.45m3/m3. The different emitter rates resulted in different amounts of irrigation and leaching volumes. As expected, the higher emitter rates resulted in more leaching of both water and nutrients. Irrespective of irrigation treatment, plants grew better when fertilized with 200 ppm N as compared to 100 ppm N, thus providing no indication thus far that nitrogen concentrations can be reduced when leaching is minimized (Fig. 38).
Fig. 38. The appearance of the plants at harvest. All plants were of good quality, but plants grew better with 200 ppm N than 100 ppm N.

35
6. Can More Efficient Irrigation Reduce the Fertilizer Needs of Lantana? Controlled release fertilizers (CRF) are essential to nursery crop production and provide a steady supply of nutrients to the plants.
However, excessive irrigation, common in nursery production, can leach nutrients from the substrate, resulting in surface water eutrophication. Leached nutrients can also be a significant economic loss to growers. We determined the effects of irrigation efficiency and fertilizer rate on the amount of nutrients leached and on the amount of nutrients remaining in the substrate mix (substrate EC) over an entire production cycle. Lantana ‘Sunny Side Up’ was grown in 3.6 L containers filled with a soilless substrate. Irrigation was triggered when the VWC of control plants fell below 0.45 m3.m-3 (Figs. 39, 40).
Fig. 39. The wired irrigation control system, with soil moisture sensors connected to a Campbell Scientific multiplexer and 32 solenoids connected to two relay drivers. A CR10 datalogger collects all data and decides when to irrigate the various plots.
Control plants were watered for 15 seconds, while other plants were irrigated 20, 25, or 30 sec, thus resulting in different irrigation volumes. We also compared 6 fertilizer rates ranging from 25 to 150% of standard industry “high” rate (Harrell’s 16-6-11, 5-6 month CRF). As leachate volume increased, leachate EC decreased, but the amount of leached fertilizer increased (Fig. 41). Substrate EC increased with increasing fertilizer concentrations, but decreased over time (Fig. 42). The decreasing leachate EC with increasing leachate volume could be interpreted as a positive outcome, but was simply due to the leached fertilizer being diluted as the leachate volume increased. The amount of leached fertilizer also increased as the fertilizer rate increased, regardless of the irrigation treatment. A 25% fertilizer rate was too low to produce high quality plants, but did not result in mortality. A 50% fertilizer rate produced salable plants and would be an initial recommendation. Using 50% of the standard fertilizer rate would prevent 12.1 lbs/acre of fertilizer from being leached from the pots per month. This fertilizer rate, combined with a near zero leaching irrigation treatment, would save growers $10,453/acre/yr on their fertilizer costs.

36
Fig. 40. All pots were placed in larger, lined containers to collect leachate volumes and for EC measurements.
Fig. 41. The combined effects of different irrigation treatments and different fertilizer rates on the amount of nutrient leached from the containers. Fertilizer was applied at 25 to 150% of the label rate and plants were irrigated at the same time, but for different durations (15 to 30 s), resulting in different amounts of leaching. Higher fertilizer rates and longer irrigation resulted in more leaching.

37
Fig. 42. Electrical conductivity of the substrate for plants irrigated with minimal leaching. Blue data points and regression line indicate the lowest fertilizer treatment (25% of label rate), red is 100% of label rate, and green 150%. As expected, higher fertilizer rates resulted in higher EC. EC decreased over time in all treatments.
Ongoing studies 1. Nutrient leaching and nitrogen uptake in response to different irrigation volumes
During summer 2012, we began a study using Gardenia jasminoides ‘Heaven Scent’ to determine how growth is affected by fertilizer and irrigation rate. Irrigation is applied when control plots reach substrate volumetric water content below 0.35 m3.m-3. Control plants are irrigated for 2 min, while plants in the other three irrigation treatments are irrigated for 3, 4, or 5 minutes at the same time. Fertilizer has been applied at 100%, 50%, and 25% of label rate. Plant height and width are measured every 2 weeks. Leachate volume and EC are measured every 2 weeks and leachate samples are collected for later analysis. The substrate of 24 plants is monitored using Decagon GS-3 sensors to determine dynamics in substrate EC in response to irrigation treatments and fertility levels. For these 24 plants, root growth is traced in an acetate-covered window cut in the side of the pot. Root nitrogen uptake rates will be measured on some of these plants to look at how nitrogen uptake may differ according to fertilizer level and irrigation treatment. Ceptometer measurements have also been taken in order to look at leaf area index and light interception. The experiment will be concluded in fall 2012 when destructive measurements will be taken. 2. Height control of poinsettias with deficit irrigation
In a follow up to the 2011 poinsettia height control study, we are now conducting a second study, with the goal to determine how much we can reduce/control plant height. Rather than comparing deficit irrigation with plant growth regulators, we have different target heights for plants in the different treatments. The study was started in early August and will run until early December.

38
3. Spatial and temporal uniformity of substrate water content
The required number and spacing of soil moisture sensors to attain reliable data is still a difficult question to answer. We are collecting detailed spatial and temporal data on variability in substrate water content using 223 6” pots with Rudbeckia fulgida ‘Goldsturm’. Irrigation of this crop is controlled using a Decagon nR5 node with 5 Decagon EC-5 soil moisture sensors (Fig. 43). An additional 45 EC-5 sensors are connected to a Campbell Scientific datalogger, allowing us to collect detailed data on substrate water content dynamics and spatial gradients. In addition, substrate water content of all pots is collected weekly using a handheld sensor. At the end of the study, we will analyze these data for spatial and temporal patterns and determine whether differences in substrate water content among pots are related to differences in plant size (based on the idea that a larger plant will likely use more water).
Fig. 43. Irrigation grid used for uniformity testing. Irrigation is
controlled using the nR5 node in the foreground. Objective 4: Quantify water savings that can be obtained with soil moisture sensor-controlled irrigation. There has been little progress here. We were hoping to conduct some of this research at Evergreen and McCorkle’s. However, the growers have been more interested in scaling up in irrigation control quickly than in doing comparative studies. In addition, our ongoing work at McCorkle’s has resulted in changes in irrigation throughout the nursery. Replicating how they used to irrigate their crops may not be possible anymore. This is perhaps disappointing from a research perspective, but very positive from an ‘impact’ perspective, since our work has clearly resulted in a change of practices. Objective 5: Detailed environmental data will be collected for use in plant water needs model development. We continue to collect large sets of environmental data (light, temperature, humidity, and at Evergreen only, rainfall) from all of our research sites. Modeling: We have continued to work with CMU on implementing the petunia model in Sensorweb. We identified some problems with the GUI that made it impossible to enter the required user information needed to run the irrigation based on the model. These issues have since been fixed, and we need to move forward with additional model testing and greenhouse trials.

39
Collaborating Georgia Growers 1. McCorkle Nurseries
The wireless sensor network at McCorkle Nurseries has been upgraded to nR5 nodes with fully automated irrigation control. The upgrade was made in March and April 2012, and during the process some hardware issues in the nR5 nodes were identified (relay in the nodes was not sized to facilitate control of more than 3-4 valves with a single node; there was an issue with current ‘leakage’ in the 24 VAC detection circuit). After many trials and errors, the system became fully functional in late April, and we have been controlling irrigation in a 2-acre greenhouse since then. We initially used eight nR5 nodes to operate the 54 valves in the 2 acre greenhouse. Each valve controls water flow to multiple overhead, stationary sprinkler heads. We have since scaled this back to seven nR5 nodes, based on the crops that are currently grown in this greenhouse.
Having such a large number of valves in the greenhouse created significant challenges in setting up the network, but now that it is in place, also provides McCorkle Nurseries with much flexibility in how they can configure the system. They can easily change what valves are controlled by what node, and are thus able to reconfigure the irrigation setup based on their production needs. Uniformity testing in this greenhouse indicated poor uniformity, and we believe that the irrigation can be greatly improved by replacing all heads. In late summer, we finally succeeded in getting port forwarding set up on the basestation computer, so that the McCorkle Sensorweb is now finally available on-line.
Initial results of the irrigation control at this nursery have been stunning: the first crop that was grown completely using the sensor network was a gardenia ‘Heaven Scent’ crop that was placed in the greenhouse on June 18, with an anticipated finish data of July 2013 (Fig. 44). The growth rate of the plants was much faster than anticipated and some of the plants were ready for sale in September 2012, and all plants will be salable in fall, 2012. McCorkle Nurseries may not sell all plants in fall 2012, but that is due to market limitations, and not the salability of the plants themselves.
Following the very positive results seen in this 2-acre greenhouse, we have now installed nR5 nodes (with EC-5 sensors) in a 2nd, 4-acre greenhouse. The configuration of the irrigation system in very different from that in the greenhouse were we installed the first part of the network: the 2nd greenhouse has only two valves, each controlling approximately two acres of irrigation using overhead impact sprinklers. This greenhouse is currently used for hydrangea production.
Fig. 44. The first gardenia crop irrigated entirely using nR5 nodes and sensor control. Note that the anticipated finish date on the label (right) was May 2013. Plants were all ready for sale in Fall 2012.
Irrigation
duration

40
2. Evergreen Nursery – Chatham, GA The wireless sensor network at Evergreen was upgraded from DataTrac to Sensorweb and several Decagon nR5 nodes were added over the summer of 2012. Will Ross, the grower at Evergreen (Fig. 45) had been using the sensor data to help him make better irrigation decisions (including switching from once daily to twice daily, cyclic irrigation to reduce leaching in 2011).
Crops grown in these sections include heuchera, euphorbia, echinacea, lavender, and hellebores. The automated irrigation was started in early August and it is still too early to determine if it has any clear effects on crop health or production cycle speed. However, the system has worked well and all crops appear to be doing well.
Fig. 45. Will Ross, grower at Evergreen, in a cold frame at
the nursery. Note the wireless node above his head, and the
rain gauge among the plants used to monitor irrigation. Four
pots have sensors to measure substrate water content.
The Evergreen nursery network consists of eight nodes, five of which are controlling irrigation, two are monitoring crops, and one is configured as a weather station
Fig. 46. Evergreen’s SensorWeb homepage. The current network configuration consists of three EM50 and five nR5 nodes (Fig. 46). All nodes are using EC-5 sensors and the nR5 modes have been configured for irrigation control. The nR5 nodes are controlling irrigation in five hoop houses and two small greenhouse sections (one of which currently is uncovered).

41
People involved In addition to four faculty members at UGA (Drs. Marc van Iersel, Matthew Chappell, John Ruter, and Paul Thomas), one technician has assisted with this research (Sue Dove).
There currently are two PhD students (Mandy Bayer and Alem Peter) and two undergraduate students (Kengelle Chukwurah, Faustine Sonon) working on this project. Lucas O’Meara finished his MS work that was part of this project and received his MS in horticulture in August 2012.
Kevin Whitaker, a former UGA undergraduate horticulture student, worked on this project in spring 2012 and studied the relationship between fertilizer rates, irrigation volume and leaching. This was his formal horticulture internship.
Off-shoot research projects
The MINDS project has resulted in several collaborative projects in related areas:
JoHannah Biang, an MS student is using the sensor-controlled irrigation in her work on green, edible walls.
Rhuanito Soranz Ferrarezi, a PhD student at UniCamp in Campinas, Brazil (and former visiting scientist at UGA) is using our irrigation approach in his research on automating subirrigation of citrus rootstock in Brazil.
Francesco Montesano, a researcher at the University of Bari, Italy (and former visiting scientist at UGA) is using our irrigation approach in his research on automating irrigation of greenhouse tomatoes.
The University of Georgia has provided funds from student technology fees to install a wireless sensor network, capable of irrigation control, at the student-run UGArden (http://ugarden.uga.edu/). This network will be installed by students during the 2012-13 academic year.
We currently are trying to get funds for a wireless sensor network at the UGA organic farm (http://organic.uga.edu/farm.html), which is the center piece of UGA’s organic certificate program. Both the UGArden and the organic farm are used heavily in various teaching programs, and installation of wireless sensor networks at these sites will allow us to incorporate the sensor and irrigation technology into various graduate and undergraduate courses.

42
E. Scientific Research and Development - University of Maryland We have concentrated our research and on-farm implementation of sensor networks for four projects during year 3 that we report (below):
1. Intensive snapdragon plant growth (model development) studies, sensor deployment and network integration at Bauers Greenhouse, Jarrettsville, MD
2. Monitoring and control irrigation scheduling studies of Dogwood and Red Maple at Hale and Hine Nursery in Tennessee, which is a large pot-in-pot tree operation
3. Green Roof Stormwater research , model development and validation at the University of Maryland, College Park and University of Maryland, Baltimore County
4. Raemelton Farm, a field tree nursery in Frederick, MD
Sensor networks were maintained at Waverly Farm during 2012. However, no major research activity was done in year 3, due to limited time and resources. Mr. Jerry Faulring nevertheless continues to use the sensor network for monitoring and manual scheduling of irrigations. We anticipate installing new nR5-DC control nodes at Waverly in early spring 2013, with studies on Viburnum and other shrub species.
1. Snapdragon Research Bauers Greenhouse – Jarrettsville, MD
The objectives of the research at Bauer’s Greenhouse are: (1) to quantify and model the water use of snapdragons, (2) to monitor and control irrigation scheduling based on real-time environmental and substrate moisture sensor data, and (3) to investigate optimal sensor placement by studying spatial and temporal sensor variability in a hydroponic production environment. The greenhouse is a closed hydroponic system, with the ability to fertigate as frequently as necessary, without compromising efficiency or creating environmental runoff issues. The ultimate goals of this project are to optimize plant growth, increase the percentage of #1 (highest quality) cut-flower snapdragons, maximize production, and minimizing plant water and nutrient stress on the crop. Bauers Sensor Network Description
The Bauers Greenhouse network consists of seven first generation Carnegie Mellon (CMU) nodes (in use since 2009), which are used for the monitoring substrate water content of production benches.
There are also seven Decagon EM50R nodes (installed in 2010) and nine Decagon nR5 nodes (installed in 2012) for research, including monitoring microclimate, water use estimation, and controlling irrigations (Fig. 47).
Fig 47. Map of the wireless sensor network at Bauers Greenehouse
The Bauers operation has used CMU nodes with Decagon EC-5 sensors for monitoring water status of the perlite bags since 2009. During this time, they developed their own “good” range of sensor readings

43
from empirical analysis. These values are very informative to Charles Bauer for daily irrigation scheduling decisions, but translating these values into VWC content data would be more useful for a general audience. Currently, his “good” range of substrate water contents is very narrow, from 0.25 – 0.27 m3∙m-3. All CMU, Em50R, and NR5 nodes transmit the data to the CMU basestation in the Bauer’s greenhouse office, and which is available from their dedicated sensorweb site at http://sensorweb.frc.ri.cmu.edu:3101 Snapdragon Experimental Site
To develop a water use model for snapdragon, we monitored the evapotranspiration of three seasonal snapdragon cultivars, ‘Opus Fresh White’ for summer (June – August 2011, July – September 2012), ‘Overture White’ for fall/winter (September 2011 – January 2012), and ‘Potomac Early White’ for spring (March – May 2012). Six Decagon Em50R dataloggers were installed to monitor substrate water contents and quantify water use (per bag) in a series of replicated studies. To investigate the effect of environmental factors on water use, we continuously measured temperature, and relative humidity (from which vapor pressure deficit (VPD) was derived), and light intensity above and below the plant canopy (from which light intercepted by the plant canopy was derived; Fig. 48).
We used twelve load cells, six EC-5 soil moisture sensors, one flow meter, six rain gauges, two temperature-relative humidity sensors, four PAR sensors, and twelve custom line quantum sensors to monitor the evapotranspiration and environments for six replicate perlite bags, with 48 plants per bag. Each bag was placed on two load cells and a CR10X Campbell datalogger measured the bag weight every 5 seconds, and recorded the average every 5 minutes. From these instantaneous changes in bag weight, we calculated water use (evapotranspiration) by the plants.
Fig. 48. Diagram of the intensive sensor system for daily water use measurements
To determine the light intercepted by the plants, light levels above and below the canopy were measured with PAR sensor (SQ-110; Apogee Instrument, Logan, UT)and custom line quantum sensors (SQ-319; Apogee Instrument). For comparison, separate measurements were obtained with an Accupar LP-80 ceptometer (Decagon Devices, Inc.) Snapdragon Daily Water Use Model Development
The development of the daily water use model for snapdragon was conducted through multiple regression modeling. We found that water use of snapdragon was affected by plant age, daily light interception and vapor pressure deficit (VPD), similar to other greenhouse crops being modeled (e.g. petunia). Intercepted daily light integral (DLI) was positively correlated to daily water use of all three

44
snapdragon cultivars (P < 0.0001, 0.44 < r < 0.58). Multiple regression models for each cultivar were developed, but ‘Overture White’ crop (fall/winter crop) did not yield a high r2, likely due to long growing period with less fluctuation in daily water use amount. The daily water use of snapdragons varies depending on the season and the cultivar. Production time from transplanting to harvest took 49, 120, and 78 days for ‘Opus Fresh White’, ‘Overture White’, and ‘Potomac Early White’, respectively. Summer season snapdragon ‘Opus Fresh White’ had much higher water use than crops grown during other seasons (Fig. 49), likely due to the higher light environment.
Da
ily M
AX
&m
in E
T (
g/p
lan
t)
0
20
40
60
80
100
Cu
mu
lative
wa
ter
use
(L
/pla
nt)
0.0
0.5
1.0
1.5
2.0
2.5
Cu
mu
lative
In
tDL
I (t
ho
usa
nd
mo
l)
0.0
0.2
0.4
0.6
0.8
1.0
1.2
1.4
Summer F/W Spring
Dry
we
igh
t (g
/pla
nt)
0
1
2
3
4
5
6
7
Summer F/W Spring
Wa
ter
use
eff
icie
ncy (
g/L
)
0
1
2
3
4
Summer F/W Spring
Le
af
are
a (
cm
2)
0
200
400
600
800
Fig. 49. Daily water use and growth parameters of three snapdragon cultivars.
However, the cumulative water use was relatively similar at 2 L/plant regardless of cultivars. Although ‘Overture White’ had the lowest daily water use, while dry weight and leaf area were the largest, likely due to the longer production time.
Intercepted DLI (by measuring both light intensity above and below the canopy) provided a good indication of leaf area index. The AccuPAR LP-80 ceptometer also gave reliable leaf area index measurements (Fig. 50).
Date
4/2 4/9 4/16 4/23 4/30 5/7 5/14 5/21
Lea
f a
rea
(c
m2)
0
50
100
150
200
250
300
Lea
f a
rea
in
de
x
0.0
0.5
1.0
1.5
2.0
2.5
Leaf area
Leaf area index (Ceptometer)
Leaf area index (Campbell)
Fig. 50. Leaf Area Index comparisons among the measurements
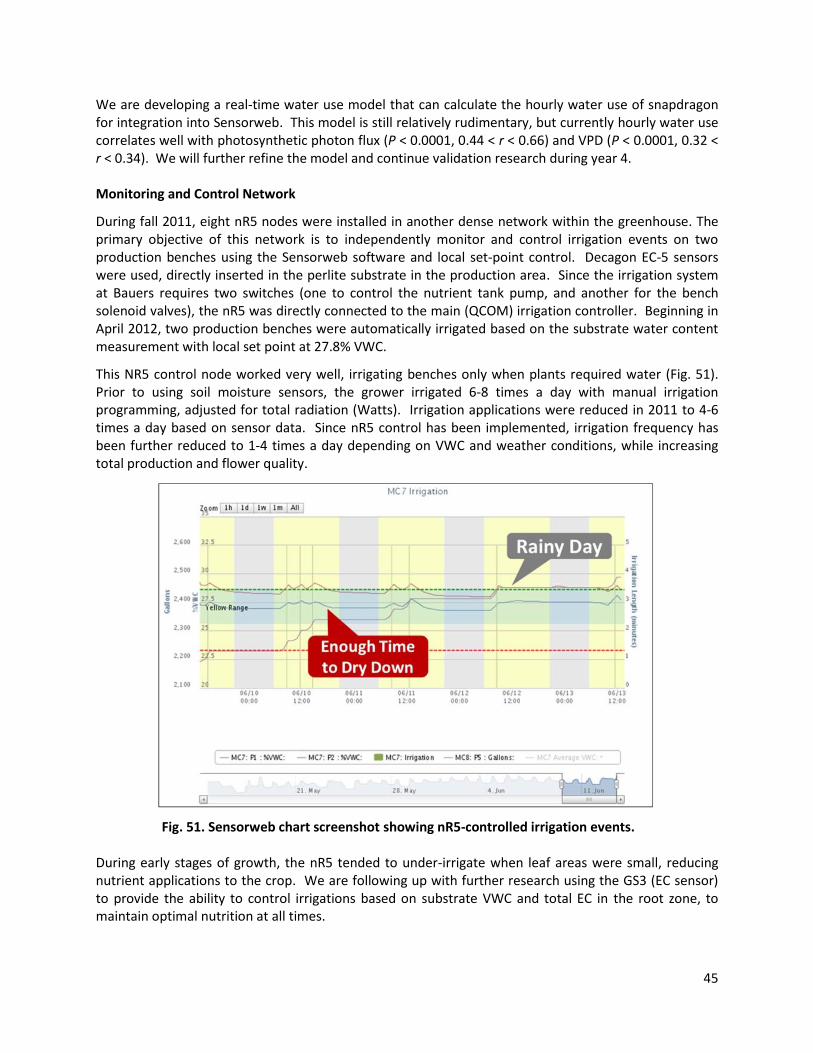
45
We are developing a real-time water use model that can calculate the hourly water use of snapdragon for integration into Sensorweb. This model is still relatively rudimentary, but currently hourly water use correlates well with photosynthetic photon flux (P < 0.0001, 0.44 < r < 0.66) and VPD (P < 0.0001, 0.32 < r < 0.34). We will further refine the model and continue validation research during year 4. Monitoring and Control Network
During fall 2011, eight nR5 nodes were installed in another dense network within the greenhouse. The primary objective of this network is to independently monitor and control irrigation events on two production benches using the Sensorweb software and local set-point control. Decagon EC-5 sensors were used, directly inserted in the perlite substrate in the production area. Since the irrigation system at Bauers requires two switches (one to control the nutrient tank pump, and another for the bench solenoid valves), the nR5 was directly connected to the main (QCOM) irrigation controller. Beginning in April 2012, two production benches were automatically irrigated based on the substrate water content measurement with local set point at 27.8% VWC.
This NR5 control node worked very well, irrigating benches only when plants required water (Fig. 51). Prior to using soil moisture sensors, the grower irrigated 6-8 times a day with manual irrigation programming, adjusted for total radiation (Watts). Irrigation applications were reduced in 2011 to 4-6 times a day based on sensor data. Since nR5 control has been implemented, irrigation frequency has been further reduced to 1-4 times a day depending on VWC and weather conditions, while increasing total production and flower quality.
Fig. 51. Sensorweb chart screenshot showing nR5-controlled irrigation events. During early stages of growth, the nR5 tended to under-irrigate when leaf areas were small, reducing nutrient applications to the crop. We are following up with further research using the GS3 (EC sensor) to provide the ability to control irrigations based on substrate VWC and total EC in the root zone, to maintain optimal nutrition at all times.

46
Sensor variability in placement
Understanding VWC and/or sensor variability in production area is critical for providing reliable sensor data to the grower. Bauers Greenhouse uses a NFT (Nutrient Film Technique) hydroponic system, with 100 ft production beds having a 3% slope. We installed eight nodes with 28 soil moisture sensors at four locations (Top-Top, Top-Bottom, Bottom-Top, and Bottom-Bottom; Fig. 52) to understand the variability inherent in this production area, due to slope and irrigation supply. To remove temporal variation due to irrigation event, we only used VWC data from 4-6 AM, and weekly average were used in the analysis.
Fig. 52. Intensive sensor network for investigating sensor variability in hydroponics production. We first compared two different soil moisture sensors (EC-5 and 10HS), to investigate sensor variability in the hydroponics production area, and to identify the most reliable sensor for use in the perlite bags. The 10HS sensor readings had a much higher variability in VWC (Fig. 53) likely due to a larger sensing volume of 10HS sensor, since the perlite bags were shallow and retained water in the lower half of the root zone. This had nothing to do with the reliability of this sensor that we have shown to be the best sensor for other substrates in larger containers filled with soilless substrate. However, based on these results, we have decided to standardize our sensors at Bauers to use the EC-5 and similar sensors (e.g. 5TM and GS3 sensors).
0 4 8 12
Su
bstr
ate
wa
ter
co
nte
nt (m
3/m
3)
0.2
0.3
0.4
0.5
0.6
Top-Top
Top-Bottom
Bottom-Top
Bottom-Bottom
0 4 8 12
Weeks
EC-5 Sensors (n=4) 10HS Sensors (n=3)
Fig. 53. Changes in VWC measurements from EC-5 and 10HS sensors of perlite bags for 14 weeks.

47
We further extended the variability research only using EC-5 sensors, and analyzed VWC dynamics using repeated measures analysis. Before plants were transplanted in a perlite bag, VWC was maintained at approximately 0.31 m3∙m-3 and there was no significant difference across sensor locations. However, as plants increased in size and daily water use, the VWC in the raised location (top of production area) gradually decreased to 0.27 m3∙m-3, whereas VWC in the lower location (bottom of production area) increased up to 0.32 m3∙m-3 (Fig. 54). There was no significant difference across the irrigation tubes, and the sensor readings were reliable with a standard error of 0.01 m3∙m-3. We concluded that the EC-5 sensor was very reliable in perlite hydroponics system for monitoring substrate VWC. But when it is used in a hydroponics system with a slope, the sensor placement should be considered when using set-point control, at a target VWC. This can be easily achieved by averaging sensor readings in Sensorweb, from sensors in various locations (elevations).
Weeks
0 5 10 15 20
Substr
ate
wate
r conte
nt
(m3/m
3)
0.00
0.25
0.30
0.35
Top Top
Top Bottom
Bottom Top
Bottom Bottom
NS
Fig. 54. Substrate water content dynamics in the perlite bag at four bed locations during the 22-week crop production cycle.
The Snapdragon team Year 4 Objectives are to:
Continue validation of the snapdragon water use model with further crop cycles and cultivars.
Integrate the snapdragon water use model into Sensorweb.
Investigate the best substrate moisture set point, for optimum yield and quality.
Run a comparative analysis of set-point control vs. model-based control, using the nR5 node capabilities.
2. Hale and Hines Nursery, McMinnville, TN
We previously reported on the sensor networks installed at Hale and Hines in the year one report. Hale and Hines Nursery is located in McMinnville, TN – a nursery production area that is traditionally regarded as the “heart” of the nursery industry in the Eastern United States. This large (180-acre plus) nursery produces a wide range of trees and shrubs in 10, 15, 30 and 45-gallon containers, and is a major producer of Dogwood (Cornus florida). Since container rooting volumes are relatively limited, and pine

48
bark substrates have a low water-holding capacity, irrigation scheduling needs to be much more frequent than with similar species in field soils. Leaching of nutrients from containers is also likely without careful irrigation scheduling. By using the information from the sensor networks located in three indicator species, the owner, Mr. Hines has been able to simultaneously monitor irrigation water applications and leaching from various sized containers in the field during years 1 and 2 of the project.
Reconfigured Networks (2012)
We deployed nR5-DC nodes at Hale and Hines in March 2012, using a CMU basestation and Sensorweb software, which provides a custom website associated with the wireless sensor network at
http://69.8.161.220:3000/user/login. The spatial view (homepage; Fig 55.) is the first page that users see when they access the Sensorweb interface, which allows users to see the state of various node locations with a quick glance. The images can be set to display different settings (and colors) by using the list at the bottom right of the page. By simply moving the mouse over an image the user can see more detailed information as well as the current trend for that measurement.
Fig. 55. The Sensorweb homepage for a wireless sensor (on-farm) network in the project. Sensor-Controlled Irrigation Study
Two separate monitoring and control blocks were installed in March, 2012 – one in a block of Red Maple (high water-use) trees, the other in a block of Dogwood (low water-use) trees (Fig.56a). This was done to compare ‘normal’ (i.e. manually-configured irrigation) vs. set-point irrigation control (determined by substrate soil moisture availability).
The global study objectives were to: 1. Monitor substrate moisture in 15 and 30-gallon containers at 2 depths (6” and 12”) 2. Measure irrigation water applications and leachate volumes over the season. 3. Determine set-point control strategies; control irrigations and measure differences in efficiency
between current best irrigation practices (timed, cyclic irrigations) and sensor-controlled irrigation 4. Measure growth differences between tree s in the timed, cyclic rows and trees irrigated by the
sensor-controlled regime.

49
10-HS sensors were installed in each treatment (five replicate trees per treatment) within the red maple and Dogwood blocks. There were 133 trees in both the controlled and monitored rows for Dogwood whereas the number of Red Maple trees in the controlled and monitored rows was 59 and 61, respectively. The control row in each block was plumbed directly from the mainline to provide independent control by the nR5 node, as shown in Fig. 56b.
Fig. 56a. The Dogwood production block, showing monitoring row (daily cyclic irrigation scheduled by grower) compared to the row controlled by local setpoint control.
Fig. 56b. The nR5 monitoring and control node, which provides local setpoint (sensor-based) control, in tandem with the 12V-DC latching solenoid (see Fig.4).
A 12V-DC latching solenoid was installed on the control block, connected to the nR5 node, such that set-point control was enabled (Fig 57). Flow meters (Badger Meter, Milwaukee, WI) were installed on both control and monitoring rows, to provide real-time, cumulative flow data (Fig. 57). Terry Hines scheduled all cyclic irrigation events from March through November, 2012. An example of this is shown during June (Fig. 58). Typically Mr. Hines scheduled 2-4 timed (6-minute) irrigation events every three to four hours during the day during summer. This irrigation frequency decreased to 1-2 irrigations per day during early spring and fall, and irrigations were interrupted for 1-2 days when rainfall occurred. In contrast, the control blocks were only irrigated when an average setpoint of <46.0% volumetric substrate moisture content was sensed by four 10HS sensors (Decagon Devices, Inc.) inserted at a 6-inch depth from the surface of the substrate in four replicate trees. Sensors were inserted horizontally in all trees at this depth, to minimize the variation due to gravitational drainage effects.

50
Fig. 57. The 12V-DC latching solenoid installed on the control blocks. The latching solenoid was wired to the nR5 node, which then initiated irrigations when the average substrate volumetric water content reached a setpoint of <46.0% VWC. The real-time flow meter installation is also shown.
Fig. 58. A graph of substrate VWC from the10HS sensors in four individual trees (left axis) plotted by the Sensorweb software during June, 2012 for the monitored block. The red line indicates cumulative water applied per row of 133 trees (gallons; right axis)
A custom calibration for these sensors in this specific substrate was done prior to the study, to provide precise volumetric water content readings. The micropulse irrigation utility of the sensorweb software was used, such that irrigation events in the control block were pulsed for 2 minutes, with a 3 minute interruption periods between pulse events. In this way, the relatively large amount of water applied by

51
the microsprinkler on each tree (150 mL per minute) could be sensed more effectively by the sensors, such that when the VWC was restored above an average of 46.0%, the irrigation cycle was interrupted.
This resulted in much lower leaching from each plant container (data not shown) while minimizing the irrigation cycle times. Monitoring and remote control was achieved by the team at the University of Maryland throughout the year, entirely via the website linked to the basestation and the on-farm computer in Tennessee. There were very few times that outside interventions by the grower were necessary, and in those cases, it was merely to make some minor adjustments to sensors.
As can be seen from early summer data shown in Fig. 59, that the control row trees were irrigated far less frequently than the trees irrigated with a normal cyclic irrigation regime (as shown in Fig. 58). This is significant, since Terry Hines -- as an experienced irrigation manager -- was not only using his years of experience to supply the trees with adequate irrigation water, but was also following recommended best management practices for minimizing nutrient leaching, and interrupting cycles for rainfall.
Fig. 59. A graph of substrate VWC from the10HS sensors in four individual trees (left axis) plotted by the Sensorweb software during June, 2012 for the controlled block. The red line indicates cumulative water applied per row of 133 trees (gallons; right axis)
For the 33-week period (March 24 – November 10, 2012), the average daily irrigation water applied by Mr. Hines totaled 0.922 gals/tree, compared to 0.342 gals/tree applied by the sensor-controlled irrigation for Dogwood (Table 1). Weekly average irrigation applications to sensor-controlled trees varied from 1.4 to 6.5 times less than weekly applications to the grower-irrigated trees (variation not shown). However, there were no significant differences in Dogwood trunk diameter or height between either treatment (Fig. 60).
The sensor controlled irrigation therefore resulted in nearly a three-fold increase in efficiency of water used to irrigate Dogwood trees (Table 2), without reducing growth or quality of the trees. Similar growth results were seen for Red Maple between treatments, although water savings for the controlled irrigation treatments was lower (at 1.45 times). This indicates how precise Mr. Hines is at scheduling irrigations for his high water-use species, such as Maple.

52
Table 2. Cumulative water use from the monitored vs. sensor-controlled irrigated Dogwood (Cornus florida) and Red Maple (Acer rubrum) trees, from 24 March through 10 November 2012.
Irrigation Method Total Water Use
(Gals / Row)
Average Water Application
(Gals/ Tree /Day)
Av. Efficiency (Timed vs. Control)
Water Savings (Control vs.
Timed)
Dogwood Timed, Cyclic
28,334 0.922
0.371 2.69 Dogwood Setpoint Control
10,521 0.342
Red Maple Timed, Cyclic
24,184 1.637
0.692 1.45 Red Maple Setpoint Control
15,441 1.133
Fig. 60. Comparative increase in stem diameter for Dogwood trees grown with cyclic, timed irrigation (monitoring) vs. sensor-controlled irrigation (control) from March through November, 2012 (n=10 trees / treatment).
Conclusions: It is apparent from these results that we can consistently achieve autonomous set-point irrigation scheduling within a commercial nursery operation, using the battery-operated nR5 wireless sensor node. In addition, this autonomous control was achieved remotely through the internet during the six-plus months of the study. Most importantly, we achieved significant water savings with this control in comparison to a very experienced, hands-on irrigation manager, and without affecting the growth of the trees with these reduced irrigation water applications.

53
3. Green Roof Research
The major function of green roofs, i.e. to retain stormwater, is finally being recognized by US planners and managers. Nevertheless the magnitude of this benefit for various climates has yet to be accurately assessed. The importance of specific stormwater design elements for green roofs (e.g. substrate characteristics, plant [species] water use, canopy and root growth) needs to be determined. Even less well understood is the effect of varying storm characteristics on green roof performance. Most studies break storm events down by size, but less is known about the influences of storm frequency, duration or intensity on green roof stormwater runoff performance.
Because storm characteristics are important drivers of green roof runoff efficiency, we are developing a mechanistic green roof model (Fig. 61) to incorporate real-time environmental and substrate moisture content (to compare to calculated evapotranspiration, ET) that can predict green roof substrate water-holding capacity (aka stormwater mitigation capacity) at any one time. This will enable us to retrofit green roofs with affordable sensor networks that can be used to predict green roof water use and efficiency, without having to resort to expensive runoff measuring devices.
Fig. 61. A Green Roof water balance model (Starry et al., 2011) We previously reported on this research in year 1 and 2, available from http://smart-farms/impacts. To briefly recap, sixteen green roof platforms were constructed and instrumented at the University of Maryland, College Park during summer, 2010 and have provided 2 years of continuous data for model development and verification (Fig. 62).
Three species of Sedum, namely S.kamtschaticum, S. album, or S. sexangulare are being studied (n=4). Four replicate platforms were left unplanted, with all platforms arranged in a randomized complete block design. Large rain gauges with a 40mL tip (Hydrologic services) are used to collect stormwater runoff from each platform. A Decagon weather station monitors temperature, relative humidity, rainfall, total radiation and photosynthetically-active radiation to inform the model on a 5-minute time step.

54
Fig. 62. Green Roof Research Site University of Maryland, Spring 2012
During the past year, we were able further explain previous year’s results indicating a plant treatment effect on the greenroof water cycle.
Fig. 63. Differences in green roof field capacity; S. sexangulare had the highest capacity, which could be attributed its fine root structure (at left).
Ongoing analyses target the mechanisms responsible for this effect. For example, platforms planted in S. sexangulare had the highest field capacity, and this may explain how these plants contribute to increased stormwater retention (Fig. 63).
Fig. 64. Relationship between storm size and runoff for different planting treatments.
Previous studies have focused mainly on transpiration as the major mechanism via which plants contributed to stormwater retention, but even small differences in field capacity can have substantial effects on runoff from greenroofs over a large surface area.
Nevertheless, green roof platforms planted in S. kamtschaticum were the only ones that consistently showed less runoff compared to unplanted platforms throughout 2011, for storms of different sizes (Fig. 64, ANCOVA, p<0.10).

55
Fig. 65. Sedum in UGA growth chambers, enabling continuous gas exchange measurements of plants in each chamber.
Ongoing efforts are investigating the physiological mechanisms that might explain differential plant effects on the greenroof water cycle. We returned to the University of Georgia to repeat plant chamber experiments (Fig. 65.) investigating differences in photosynthetic response to drought by S. kamtschaticum and S. album.
Figs. 66a and 66b show how S. album (Fig. 66b in red) exhibited the textbook response that one might expect from a facultative CAM plant. As daytime CO2 exchange decreased nighttime exchange increased.
S. kamtschaticum had a similar response to drought stress during the day, but nighttime exchange never reached the magnitude of that for S. album. Future analysis of these datasets will explore correcting for substrate moisture content as well as for plant dry mass. Analysis of plant tissue malic acid content is underway.
Fig. 66. Changes in CO2 exchange with increasing drought stress for experimental chambers planted in S. kamtschaticum in green (a) and Sedum album in red (b). Grey bars indicate nighttime hours.

56
The research described above is helping to refine our greenroof water balance model (Fig. 67). By monitoring moisture content in the substrate with both moisture sensors and load cells as the chamber experiments dried down, we were able to parameterize standard evapotranspiration equations (FAO 56 1998) for green roofs.
Fig. 67. Measured moisture content on experimental greenroof platforms planted in S. album, compared to that predicted using the FAO 56 equation for evapotranspiration (ET).
We have gained a better understanding of total available water, the root depletion zone and readily available water from these experiments, since these are all parameters necessary to estimate ET under drought conditions using the Penman-Monteith equation. By doing this, we have been able to improve our model fit to moisture content from our experimental green roof platforms. Work to be completed during Year 4 will compare these model fits for platforms planted in different plant species and use the model to predict stormwater runoff from green roofs.
4. Raemelton Farm – Adamstown, MD
Raemelton Farm is a commercial tree nursery near Adamstown, MD. Currently, there are 70 acres of field-grown trees under production. The entire farm is drip irrigated with each block controlled by solenoids, and irrigations scheduled (by time) with a central programmable controller.
Since the farm production area is currently limited by water supply (72 gal per minute from two wells), it is imperative that irrigation usage (volume) is provided on a daily basis. The maximum daily water supply equals 2034 gal water / acre for the farm if pumps run 24 hours per day. At an average of 500 trees per acre, this water supply equates to a little more than 4 gals water /day / tree. The ultimate objectives of this research are to determine if sensor-based management systems are cost-effective in reducing input costs (including labor), improving water and nutrient application efficiency and minimizing the environmental effects of production practices.

57
Existing Sensor Networks:
We reconfigured three of the four existing sensor networks at Raemelton Farm in early spring 2012 to nR5-DC control. Similar to that reported for Hale and Hines Nursery, we established these new nR5-controlled networks as “monitoring vs. control” blocks, with side by side comparisons of trees irrigated with current (timed) irrigation events vs. those controlled via local set-point control.
We established networks in a 1-year-old Maple transplant block, a 3-year-old Maple block and a 3-year old Dogwood block (Fig. 68).
Fig. 68. Three-year old monitoring vs. control Dogwood block The global study objectives were to: 1. Monitor soil moisture at 2 depths (6” and 12”) with 10-HS sensors 2. Quantify irrigation water applications for years 2012 and 2013 3. Determine set-point control strategies; control irrigations and measure differences in efficiency
between current best irrigation practices (timed, cyclic irrigations) and sensor-controlled irrigation 4. Quantify growth differences between tree s in the control (timed irrigation) rows vs. trees irrigated
by the sensor-controlled regime.
Mr. Black is very interested not only in application efficiency but also whether sensor-controlled irrigation (determined with an optimal soil moisture setpoint of 25% VWC) can in fact improve growth rates, especially of young trees. This would have significant impacts on production costs over the 4-5 year production cycle of these trees.
Early results are tantalizing, especially for fast growing species such as Red Maple (Fig. 69). Sensor-controlled irrigation appeared to increase growth rates in late summer and fall.
Fig. 69. Stem Diameter increase of 1-year old Maple trees during 2012
compared to timed irrigation events (Monitoring curve, Fig. 69). This was seen despite there being no observable wilt or lack of moisture in the soil. No real differences were noticed in the 3-year old trees, which may be due to those root systems already being established (i.e. the effect of irrigation is reduced, due to better exploitation of rainfall and irrigation events).

58
Based upon these results, we plan to establish at least two more monitoring and control networks in transplant blocks with different species in March 2013. Rootbox Study: (2009-2012)
This very dense (12 nodes; 60 sensor) network on three Acer rubrum ‘Franksred’ Red Sunset® trees was installed in May, 2009 to monitor soil moisture at 3 depths in two dimensions (in-row and across row) over time (Fig. 70). The network has provided replicated temporal and spatial information on water movement from the two drip emitters either side of each tree, on a 15-minute basis.
This study was concluded in October 2012, with the three trees being air-spaded out of the ground. Root densities (per square foot) are being quantified; anatomical and morphological differences between irrigated and non-irrigated roots are being documented by Taryn Bauerle at Cornell.
Fig. 70. Decagon EM50R network on one of three Acer rubrum ‘Franksred’ Red Sunset® trees with 18 x10HS soil moisture sensors at three depths (6”, 12” and 18”) at 6 positions around each tree.
Our lab is conducting an analysis of soil moisture content and relating that to root densities and proximity, together with an analysis of the water use of the three trees using environmental data (using MAESTRA) with Bill Bauerle at Colorado State. We plan to publish the results of this study in 2013.
People involved at University of Maryland
In addition to four faculty members at UMD (Drs. Lea-Cox, Ristvey, Cohan and Lichtenberg), we have been ably assisted by Mr. Bruk Belayneh (Research Technician) and Ms. Ruth Miller (Administrative / Financial Assistant).
There currently two Postdoctoral Research Associates (Dr. John Majsztrik and Dr. Jongyun Kim), one PhD student (Ms. Olyssa Starry) and two undergraduate students (Roy Crihfield and Liam Monahan) working on this project. Dr. Lea-Cox and Bruk Belayneh support all research at Bauers greenhouse, Hale and Hines nursery, Raemelton and Waverly farms together with assistance from Drs. Kim and Majsztrik. Jongyun Kim is the lead for the Snapdragon project at Bauers. John Majsztrik has led the national survey effort with the Economic team of Drs. Erik Lichtenburg and Dennis King. Drs. Cohan, Ristvey and Lea-Cox are the leads on the green roof research with Olyssa Starry. Roy Crihfield (an undergraduate Computer Science research assistant) has helped develop a python-based desktop application for doing parameter sensitivity analysis for the green roof model and Liam Monahan (also a computer science research assistant) has helped Dr. Lea-Cox with the Drupal website migration and Knowledge Center development. Mr. Patrick Beach (IT guru in the Plant Science Department) has provided continuous support on Connect webconferencing, Traction and server maintenance for the project.

59
Other Supported Collaborations
The MINDS project has resulted in several collaborative sensor network research and educational
projects:
Clark de Long (MS student, PSLA Department) is studying the tolerance of native plant species to drought in green roof substrates, and is using a sensor network to quantify water use from each species.
Whitney Gaches (PhD student, PSLA Department) is studying alternative (low-carbon footprint) substrates for use in green roofs. She is quantifying plant water use, root density and water-holding characteristics using a Decagon network and working to add those components to the UM green roof stormwater model.
Elizabeth Barton (MS student, PSLA Department) is studying the fate of organic matter in green roof substrates, again using a sensor network to quantify changing water-holding characteristics over time
Scott Tjaden, (MS Student, Dept. Environmental Science and Technology) is using Decagon sensors to quantify thermal benefits from green roof systems on photovoltaic installations, thermal benefits of green walls and is working on instrumenting the winning 2012 Solar Decagon “Watershed House” to quantify water and thermal benefits over time. Dr. Lea-Cox is a member of Scott’s committee.
We are supporting the Taproots Environmental Education program founded by Anthony Dimeglio and Jennifer Himmelstein at the University of Maryland
TapRoots is an environmental educational program supported by the Chesapeake Education Art Research Society (CHEARS), Prince George’s County 4-H, University of Maryland Extension, and the United States Department of Agriculture.
TapRoots’s mission is to “tap” into university resources to stimulate the growth of community “roots” and propagate ecological stewardship in youth ages 12-18.
TapRoots enhances Prince George’s County Science Technology Engineering and Mathematics (STEM) initiatives by integrating agricultural education programs focused on topics of ecological stewardship, soil health, nutrition, and food safety.
60
F. Economic and Environmental Benefits - University of Maryland The overall goal of the SCRI-MINDS project is to quantify the private and public economic benefits of a wireless sensor network supporting production requirements in field nurseries, container nurseries, greenhouse operations, and green roof systems. That sensor network provides real-time information on production conditions, and can be used for a number of short and long-term decisions at an operation or site. The information that is provided by these networks is valuable when (1) it allows people to make better decisions and (2) the increase in value from better decision making exceeds the cost of acquiring and processing the information.
Economic Methodology Development
During year 3 of this project, the economics team developed two conceptual models of optimal investment in precision equipment, focusing on sensor networks:
1. A continuous time model suited to operations where growth is relatively rapid and where adjustments are made day-to-day or week-to-week (e.g. greenhouse and smaller container crops)
2. A discrete time model featuring age cohorts derived from forestry models suited for operations where growth and thus management occur on a month-to-month or annual basis. (e.g. field-grown trees and larger container trees).
The models identify several ways that the use of sensor networks might increase profitability, including reductions in the use of inputs including water, energy, and labor (resulting in lower costs of production); accelerating growth and thus reducing time to harvest and/or increasing plant size at harvest; improving plant health, reducing disease and irrigation losses and enhancing plant uniformity and appearance. Adoption of sensor networks is profitable whenever these benefits outweigh the costs of installing and running the network.
The continuous time model was used to estimate the gains from using sensor networks in gardenia production in Georgia. Data on production practices and costs with and without sensors were obtained from experiments conducted at McCorkle Nurseries. Results of an analysis based on preliminary data suggest that the use of sensors more than doubled annual profit. The bulk of the increase in profit was due to an acceleration of production time, i.e., reduction in the time elapsed from planting to sale, which accounted for about two-thirds of the increase in annual profit. Reductions in disease mortality and disease treatment costs were also substantial sources of increased profitability, accounting for an additional 10 percent of the increase. Reductions in the use of fertilizer and labor due to shortened production time accounted for the remainder of the increase in annual profit. An analysis based on preliminary data was presented at the annual Southern Nursery Association conference in June 2012 (Chappell et al. 2012). Refinement of this analysis to accommodate new, more accurate cost and production data is ongoing. Preparation of a manuscript to be submitted for journal publication is expected soon.
The discrete time model was applied to hypothetical information based on operations at Raemelton Farm. Results of this analysis suggested that reductions in production time due to accelerated growth, made possible by the use of sensors to fine tune water application, increased profitability substantially, albeit less so than in the gardenia case.
The economics team is in the process of collecting production and economic information from the remainder of the project’s grower partners. Once collected, these data will be used in conjunction with the two conceptual frameworks listed above to estimate the profitability of sensor networks and to identify sources of changes in profitability due to sensor network use.
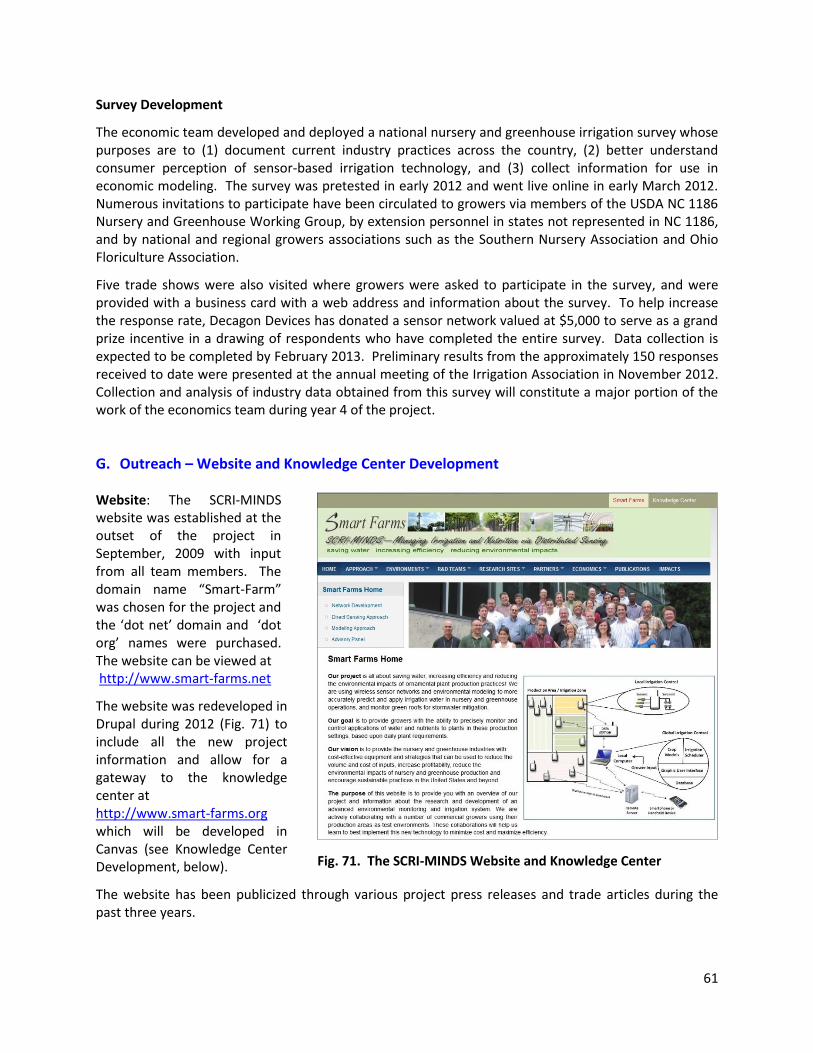
61
Survey Development
The economic team developed and deployed a national nursery and greenhouse irrigation survey whose purposes are to (1) document current industry practices across the country, (2) better understand consumer perception of sensor-based irrigation technology, and (3) collect information for use in economic modeling. The survey was pretested in early 2012 and went live online in early March 2012. Numerous invitations to participate have been circulated to growers via members of the USDA NC 1186 Nursery and Greenhouse Working Group, by extension personnel in states not represented in NC 1186, and by national and regional growers associations such as the Southern Nursery Association and Ohio Floriculture Association.
Five trade shows were also visited where growers were asked to participate in the survey, and were provided with a business card with a web address and information about the survey. To help increase the response rate, Decagon Devices has donated a sensor network valued at $5,000 to serve as a grand prize incentive in a drawing of respondents who have completed the entire survey. Data collection is expected to be completed by February 2013. Preliminary results from the approximately 150 responses received to date were presented at the annual meeting of the Irrigation Association in November 2012. Collection and analysis of industry data obtained from this survey will constitute a major portion of the work of the economics team during year 4 of the project.
G. Outreach – Website and Knowledge Center Development Website: The SCRI-MINDS website was established at the outset of the project in September, 2009 with input from all team members. The domain name “Smart-Farm” was chosen for the project and the ‘dot net’ domain and ‘dot org’ names were purchased. The website can be viewed at http://www.smart-farms.net
The website was redeveloped in Drupal during 2012 (Fig. 71) to include all the new project information and allow for a gateway to the knowledge center at http://www.smart-farms.org which will be developed in Canvas (see Knowledge Center Development, below).
Fig. 71. The SCRI-MINDS Website and Knowledge Center
The website has been publicized through various project press releases and trade articles during the past three years.

62
Knowledge Center Development
Extension and outreach goals during Year 3 focused on planning and starting to develop a number of learning modules, which can be found by clicking the “Knowledge Center” tab at the top of the smart-farms website. A core team of outreach project members and graduate students met on August 28-31, 2012 in College Park, MD to outline Knowledge Center modules.
The result of this meeting was the outline of 18 learning modules (Table 3) covering 128 specific topics. These modules will serve as self-guided tutorials on a wide range of topics related to system design, troubleshooting, economics, maintenance, etc. Modules are designed to target specific audiences including business owners and decision makers, commercial growers, and researchers/students. Additionally, a number of modules featuring specific case studies will highlight implementation of precision irrigation monitoring and control systems at partner grower locations. Modules are currently under development and at least 12 will be complete by the end of year 4. Table 3: Knowledge Center module outline
Decision-Makers Growers Optimizing
Systems Research &
Development Case Studies
Basic Concepts
What is a Network?
Sensor Placement and Variability
Network, Sensor Configuration
The Advantage of Control
Greenhouse Operations
Cost/Benefit Analysis
Network Installation
Software Use (DataTrac)
Data Management
Container Operations
Return on Investment
Sensor Calibration
Analysis and Interpreting Data
SensorWeb Software
Field Operations
System Maintenance
Simple Modeling
Green Roof Urban Systems
Advanced Modeling
Advanced Concepts
All online outreach modules will be developed using the Canvas©
online learning management system.
Canvas©
will enable outreach team members to test the knowledge gained by users via integrating quiz
capabilities into modules. This will provide information on the ability of modules to successfully educate users and provide feedback on module development required to maximize the learning experience for users.
Significant Outreach Activities (2011-12)
1. Sensor Workshop – American Society for Horticultural Science, Miami, FL
The MINDS team organized a Sensor Workshop entitled “The Use, Application and Analysis of Experimental and Field Sensor Data for Horticultural Applications” at the 2012 meeting of the American Society for Horticultural Science in Miami, FL. This day-long workshop demonstrated equipment both from Decagon Devices and Campbell Scientific, and emphasized best practices in using sensors in various situations. The workshop was designed for Faculty, research scientists, and graduate students interested in using sensors for soil, plant and environmental research measurements both in the lab and the field. Presenters included Doug Cobos, Jongyun Kim, Bruk Belayneh, John Lea-Cox, and Marc van Iersel

63
During the workshop, proper use of a variety of sensors was discussed. Evaluations after the workshop indicated that participants were very satisfied and would like to attend future workshops held by this group.
2. Mid-Atlantic Green Roof Symposium – University of Maryland Drs. Steve Cohan, John Lea-Cox and the Green Roof graduate students hosted the first Mid-Atlantic Green Roof Science and Technology Symposium on August 16 and 17, 2012. Speakers included Dr. Manfred Kohler with the University of Applied Science in Neubrandenburg, Germany, Dr. Elizabeth Fassman from the University of Auckland, Mr. Edward Snodgrass, an internationally-recognized author and green roof expert and Mr. Charlie Miller, P.E., a leading landscape architect from Philadelphia.
The focus of the symposium was the identification of parameters for monitoring the performance of green roof systems. Speakers provided perspectives on monitoring protocols, substrates, hydrology, plant palettes, environmental regulations and green roof management. Over 100 attendees included representatives from GSA, DOE, EPA, MDE, Anacostia Watershed Society, graduate students and faculty from Drexel University, University of Pennsylvania, Penn State University, Michigan State University, Northwestern University, Southern Illinois University, Columbia University, University of Maryland and the University of Auckland.
Manufacturer representatives from the U.S., Canada and New Zealand were present along with landscape architects, and green roof installation companies.
Fig. 72. Olyssa Starry discussing her research during the Green Roof symposium tour at the University of Maryland
3. ASHS Graduate Student Workshop
Marc van Iersel and John Lea-Cox participated in a Graduate Student Grantmanship Workshop, organized by the graduate student working group of the American Society for Horticultural Science at the annual meeting in Miami, FL. Marc van Iersel discussed the proposal review process and how a thorough understanding of this process can help in the preparation of more competitive proposals. John Lea-Cox discussed grant administration and how successful management of a grant will help ensure the intended results and impacts of the project. And if you are really reading this report, and have made it this far, Marc and I will buy you a beer.

64
H. Project Management, Coordination and Communication - University of Maryland
Fiscal Accounting and Matching Documentation
Advanced systems for tracking and monitoring SCRI expenditures are now in place. This allows us to monitor SCRI spending in accordance with the grant requirements and monitor subcontract’s cost sharing activities to ensure that they are fulfilling their obligations as matching partners.
All subcontracts report invoices and matching totals on a quarterly basis, which ensures timely payments and monitoring of expenditures. Total spending during Years 1 through 3 totaled $2,360,483 whereas total match amounted to $3,793,202. As of the end of Year 3, the cumulative match exceeded the projected matching totals by $235,697. All subcontracting leads and business offices do an excellent job, and we are grateful for their assistance to ensure accurate accounting and transparency for the project. The Year 3 Federal Financial report is attached as Appendix A. Internal Communication
The Internal and team communication methods established using year one (refer to the 2010 report) are working well. The traction virtual workspace provides a mechanism to track notable project interactions and progress updates, and allows for more efficient tracking of documentation for the entire team than email. It also automatically sends out an automatic weekly digest to all project participants, including Advisory panel members and USDA project managers.
In addition to the traction workspace, bi-monthly SCRI webconferences are held to ensure communication and knowledge-sharing amongst project participants. Every second webconference includes advisory panel member and program manager involvement, if they are available. These webconferences are recorded and the archived link placed on Traction, so that people who could not make the teleconference can access the information at a convenient time.
Fig. 73. The SCRI-MINDS team participants at the 3rd Annual project meeting, held in Pullman, WA.

65
Third Annual Project Meeting
The third annual project meeting was held from 19 – 21 June, 2012 in Pullman, WA – home of Decagon Devices, Inc. We are grateful for all the assistance that the Decagon team gave us in organizing the conference, and for the tours of the Decagon manufacturing facility. Having the conference in Pullman allowed many Decagon employees to interact with the researchers and graduate students on the project, and participate in the two days of presentations and discussions.
In addition to the engineering and research faculty from the five Universities and companies, we were joined by seven of our advisory panel members, two postdoctoral researchers and five graduate students involved in various aspects of the project (Fig. 73).
During the first (reporting) day, we shared progress by the various working groups, starting with graduate student presentations. Additional posters were displayed during breaks on many of the studies. The second morning was devoted to in-depth discussions on monitoring and control, the new sensorweb software development, integrating new sensors and model development and integration. The last afternoon was devoted to defining economic information requirements, the user survey and quantifying the value of information. Lastly we revisited year 3 goals and objectives (see Appendix B), in anticipation of tighter integration of the engineering and scientific objectives during the third year.

66
I. Publications, Presentations and Outreach (All Teams) Book Chapters 1. Chappell, M., J. Owen, S. White and J. Lea-Cox. 2012. Irrigation Management Practices. IN T. Yeager,
T. Bilderback, D. Fare, C. Gilliam, J. Lea-Cox, A. Niemiera, J. Ruter, K. Tilt, S. Warren, T. Whitwell and R. Wright (eds.) Best Management Practices: Guide for Producing Nursery Crops. 3rd edition Southern Nursery Association, Atlanta, GA (in press)
2. Lea-Cox, J. D. 2012. Using Wireless Sensor Networks for Precision Irrigation Scheduling. Chapter 12. In: Problems, Perspectives and Challenges of Agricultural Water Management. M. Kumar (Ed.) InTech Press. Rijeka, Croatia. pp. 233-258.
Peer-Reviewed Journal Articles 1. Bauerle, W.L., R. Oren, D.A. Way, S.S. Qian, P.C. Stoy, P.E. Thornton, J.D. Bowden, F.M. Hoffman, and
R.F. Reynolds. 2012. Photoperiodic regulation of the seasonal pattern of photosynthetic capacity and the implications for carbon cycling. Proceedings of the National Academy of Sciences of the United States of America, 109:8612-8617.
2. Campoe, O., Stape, J.L., Nouvellon, Y., Laclau, J-P., W.L. Bauerle, D. Binkley, and G. Le Maire. 2012. Stem production, light absorption and light use efficiency between dominant and non dominant trees of Eucalyptus grandis across a productivity gradient in Brazil. Forest Ecology and Management, In Press.
3. Daniels, A.B., D.M. Barnard, P.L. Chapman, and W.L. Bauerle. 2012. Optimizing substrate moisture measurements in containerized nurseries. HortScience. 47(1):98-104.
4. Garland, K.F., S.E. Burnett, M.E. Day, and M.W. van Iersel. 2012. Influence of substrate water content and daily light integral on photosynthesis, water use efficiency, and morphology of Heuchera americana. J. Amer. Soc. Hortic. Sci. 137:57-62.
5. Gspaltl, M. W. Bauerle, D. Binkley, and H. Sterba. 2012. Leaf area and light use efficiency patterns of Norway spruce under different thinning regimes and age classes. Forest Ecology and Management, doi:10.1016/j.foreco.2011.11.044.
6. Kim, J., A. Malladi, and M.W. van Iersel. 2012. Abscisic acid related gene expression and physiological responses of petunia at different substrate water contents. Journal of
Experimental Botany. doi: 10.1093/jxb/ers285 7. Mattson, N.S. and M.W. van Iersel. 2011. Application of the 4R nutrient stewardship concept to
horticultural crops: Applying nutrients at the “right time”. HortTechnology 21:667-673. 8. Solano, L., A. G. Ristvey, J. D. Lea-Cox and S. M. Cohan. 2012. Sequestering zinc from recycled crumb
rubber in extensive green roof media. Ecol. Engineering 47: 284– 290.
Non-Refereed Conference Proceedings 1. Bayer, A., M. Chappell, J. Ruter, and M. van Iersel. 2011. Managing growth of Hibiscus acetosella by
controlling substrate moisture with sensor controlled irrigation. Proceedings of the 2011 meeting of the IPPS Southern Region meeting. http://ipps-srna.org/pdf/2011Papers/21-Bayer-student.pdf
2. Chappell, M., M. van Iersel, E. Lichtenberg, J. Majsztrik, P. Thomas, J. Ruter and S. Wells. (2012). Benefits of Precision Irrigation of Gardenia augusta ‘Heaven Scent’™: Reducing Shrinkage, Shortening the Cropping Cycle, and Economic Impact. Proc. Southern Nursery Assoc. Res. Conf. 57:321-323.

67
3. Chappell, M., M. van Iersel, S. Dove, J. Ruter, P. Thomas, A. Bayer, L. O’Meara, P. Alem, R. Ferrarezi, J. Kim. 2011. Monitoring Environmental Conditions and Substrate Water Content to Increase Efficiency of Irrigation in Nurseries. 2011 Irrigation Assoc. Innovations in Irrigation Conf. 19p.
4. Ferrarezi, R. S., M.W. van Iersel, and R. Testezlaf. 2012. Fotossíntese e crescimento de plantas de sálvia cultivadas por subirrigação em sistema semi-contínuo para medição de CO2. Proceedings of the X Congreso Latinoamericano y del Caribe de Ingeniería Agrícola - CLIA e XLI Congresso Brasileiro de Engenharia Agrícola - CONBEA Londrina - Paraná, Brazil.
5. Ferrarezi, R.S., M.W. van Iersel, and R. Testezlaf. 2012. Sensores capacitivos no monitoramento e controle da subirrigação na produção de salvia. Proceedings of the X Congreso Latinoamericano y del Caribe de Ingeniería Agrícola - CLIA e XLI Congresso Brasileiro de Engenharia Agrícola - CONBEA Londrina - Paraná, Brazil.
6. Kim, J., B. Belayneh and J. D. Lea-Cox. 2012. Estimating daily water use of snapdragon in a hydroponic production system. Proc. Southern Nursery Assoc. Res. Conf. 57:336-340.
7. Kohanbash D., Valada, A. & Kantor, G.A. 2012a. Base Station Design and Architecture for Wireless Sensor Networks. Commission of Agricultural and Biosystems Engineering (CIGR). 8-12th July, 2012. Valencia Spain.
8. Kohanbash, D., A Valada and G. Kantor. 2012. Irrigation Control Methods for Wireless Sensor Networks. Amer. Soc. Agric. Biol. Eng. 29th July-1th August, 2012. Dallas, TX. Paper #121337112. 8p.
9. Lea-Cox, J. D, B. Belayneh, J. Kim and J. C. Majsztrik. 2012. The Value of Weather Data for Daily Nursery Management Decisions. Proc. Southern Nursery Assoc. Res. Conf. 57:87-93.
10. Majsztrik, J. C., A. G. Ristvey and J. D Lea-Cox. 2012. An In-Depth look at Fertilizer and Irrigation Practices in Maryland’s Ornamental Nursery Industry. Proc. Southern Nursery Assoc. Res. Conf. 57:35-42.
11. Starry, O., J. D. Lea-Cox, A. G. Ristvey and S. Cohan. 2011. Utilizing Sensor Networks to Assess Stormwater Retention by Greenroofs. ASABE Annual International Meeting. Louisville, KY. Paper #1111202. 7p.
12. Starry, O., J. D. Lea-Cox, A. G. Ristvey and S. Cohan. 2012. Controlling for storm size when evaluating treatment effects in green roof runoff data. Proc. Mid-Atlantic Green Roof Symposium. 16-17th August, 2012. College Park, MD. 7p.
13. van Iersel, M.W. , M.R. Chappell, P.A. Thomas, J.M. Ruter and S. Wells. 2012. Wireless sensor networks for monitoring and controlling irrigation in greenhouses and nurseries. Proceedings of the X Congreso Latinoamericano y del Caribe de Ingeniería Agrícola - CLIA e XLI Congresso Brasileiro de Engenharia Agrícola - CONBEA Londrina – Paraná.
14. Wells. S., M. Chappell, J. Ruter, P. Thomas, and M. van Iersel. 2011. Monitoring substrate water content in nurseries: More efficient irrigation and reducing leaching and runoff. ASABE Paper No. : 1111254. ASABE, St. Joseph, MI, p. 183-190.
Trade Articles, Reports
1. Burnett. S., M. van Iersel, and J. Kim. 2012. Predicting plant water uptake. Greenhouse Grower 29(3): 44, 46.
2. Burnett, S.E., S. Zhen, and M. van Iersel. 2012. Water requirements of herbaceous perennial plants. American Floral Endowment Special Research Report #533.
3. Chappell, M., M. van Iersel, J. Ruter, E. Lichtenberg, J. Majsztrik and P. Thomas. 2012. Drop by Drop: Precision Irrigation Saves Significant Costs. Nursery Management. 37(6):47-48.
4. Peter, A., P. Thomas, M. van Iersel, and S. Burnett. 2012. Using soil moisture sensors for poinsettia height control. American Floral Endowment Special Research Report #532.

68
5. Peter A., P. Thomas, M. van Iersel, and S. Burnett. 2012. Growth of petunia as affected by substrate moisture content and fertilizer rate. American Floral Endowment Special Research Report #531.
Conference Abstracts; Associated Presentations
1. Alem, P., P.A. Thomas, and M.W. van Iersel. 2012. Use of Controlled Water Deficit to Control Height of Poinsettias (Euphorbia pulcherrima ‘Classic Red'). 2012 Annual conference of the American Society for Horticultural Science. http://ashs.confex.com/ashs/2012/webprogram/Paper10408.html
2. Banks D. and W.L. Bauerle 2012. Investigating the influence of artificially extended photoperiod on seasonal variation in the maximum rate of Rubisco-mediated carboxylation. 125th Annual Association of Public and Land-grant Universities Conference. November 12, Denver, CO.
3. Barnard, D.M. and W.L. Bauerle. 2012. Residual stomatal conductance: an underestimated parameter of global significance. Ecological Society of America, August 5-10, Portland OR.
4. Bauerle, W.L., R. Oren, D.A. Way, S.S. Qian, P.C. Stoy, P.E. Thornton, J.D. Bowden, F.M. Hoffman, and R.F. Reynolds. 2012. Photoperiodic regulation of the seasonal pattern of photosynthetic capacity and the implications for carbon cycling. Ecological Society of America, August 5-10, Portland OR.
5. Bauerle, W.L., R. Oren, D.A. Way, S.S. Qian, P.C. Stoy, P.E. Thornton, J.D. Bowden, F.M. Hoffman, and R.F. Reynolds. 2012. Photoperiodic regulation of the seasonal pattern of photosynthetic capacity and the implications for carbon cycling. American Geophysical Union Fall Meeting, December 3-7, San Francisco, CA.
6. Bayer, A., J. Ruter, and M. van Iersel. 2012. Growth and water use of two Gardenia cultirvars in response to substrate water content-based irrigation. 2012 Annual Meeting of the Southern Region, American Society of Horticultural Science.
7. Bayer, A., J.M. Ruter, and M.W. van Iersel. 2012. Maintenance of substrate water content to control growth of Gardenia jasminoides. 2012 Annual Conference of the American Society for Horticultural Science. http://ashs.confex.com/ashs/2012/webprogram/Paper10283.html
8. Belayneh, B. E, J. Kim and J. D. Lea-Cox. 2012. Quantifying Root Zone Sensor and Substrate Volumetric Water Content Variability in Pot-In-Pot Tree Production. 2012 Annual conference of the American Society for Horticultural Science. http://ashs.confex.com/ashs/2012/webprogram/Paper10405.html
9. Kim, J., B. E. Belayneh and J.D. Lea-Cox. 2012. Daily Water Use of Antirrhinum majus in Hydroponic Greenhouse Production 2012 Annual conference of the American Society for Horticultural Science. http://ashs.confex.com/ashs/2012/webprogram/Paper9933.html
10. Kim, J., B. E. Belayneh and J.D. Lea-Cox. 2012. Considering the Variability of Capacitance Sensors Due to Placement in a Greenhouse Production Area . 2012 Annual conference of the American Society for Horticultural Science. http://ashs.confex.com/ashs/2012/webprogram/Paper9948.html
11. Lea-Cox, J. D. 2012. Pathogen risk mitigation with good system design and best management practices 7th International IPM Symposium, "IPM on the World Stage-Solutions for Global Pest Challenges," Memphis, TN. March 27-29, 2012 http://www.ipmcenters.org/ipmsymposium12/27-2_LeaCox.pdf
12. Lea-Cox, J. D. and B. E. Belayneh. 2012 Environmental Sensors for Measuring Weather and Intra-canopy Conditions In: Symposium: The Use, Application and Analysis of Experimental and Field Sensor Data for Horticultural Applications. 2012 Annual conference of the American Society for Horticultural Science. http://ashs.confex.com/ashs/2012/webprogram/Paper11334.html
13. Lloyd, G.S. and W.L. Bauerle. 2012. Physiologically dynamic alternatives to crop coefficients for use under deficit irrigation regimes. ASA, CSSA, SSSA, October 21-24, Cincinnati, OH.

69
14. Majsztrik, J. M, E. Lichtenberg and J. D. Lea-Cox. 2012. A National Irrigation Management Survey for Greenhouse and Nursery Operations. 2012 Annual conference of the American Society for Horticultural Science. http://ashs.confex.com/ashs/2012/webprogram/Paper10380.html
15. O’Meara, L., M.Chappell, and M. van Iersel. 2012. Water uptake of Hydrangea macrophylla and Gardenia jasminoides in response to a gradually drying substrate. 2012 Annual conference of the American Society for Horticultural Science. http://ashs.confex.com/ashs/2012/webprogram/Paper11686.html
16. van Iersel, M.W. 2012. Proposal Reviews: What Happens After Submission? 2012 Annual Conference of the American Society for Horticultural Science. http://ashs.confex.com/ashs/2012/webprogram/Paper9375.html
17. van Iersel, M.W. 2012. Using dataloggers for measurement and control of environmental conditions. 2012 Annual conference of the American Society for Horticultural Science. http://ashs.confex.com/ashs/2012/webprogram/Paper11336.html
18. van Iersel, M.W. 2011. Sustainable Greenhouse production in a changing world. Sixth JKUAT scientific, technological and industrialization conference. Book of Abstracts, p. 5.
Invited Presentations
1. Majsztrik, J. M and J. D. Lea-Cox. 2012. Researchers Working with Regulators & Growers to Calculate Accurate Loading Rates. In: Symposium 1: Regulating Water Quality: Current Legislation, Future Impacts. 2012 Annual conference of the American Society for Horticultural Science. http://ashs.confex.com/ashs/2012/webprogram/Paper9746.html
2. Lea-Cox, J. D. 2012. Administering Grants—The Good, the Bad, and the Beauty of Having Funding In: Graduate Student Workshop: Grant Writing and Beyond: How to Write a Grant and What to Do Once You Get It. 2012 Annual conference of the American Society for Horticultural Science. http://ashs.confex.com/ashs/2012/webprogram/Paper9376.html
3. Lea-Cox, J. D. 2012. Green Industry Research Focused on the Chesapeake Bay. College of Agriculture and Natural Resources Convocation. University of Maryland. 3 May, 2012
4. Lea-Cox, J. D. 2012. Water and Nutrient Management Issues in the Nursery Industry. LEAD Maryland Fellows Class VII Angelica Nurseries, Kennedyville MD. 17 May, 2012.
5. Van Iersel, M. 2012. Proposal Reviews: What Happens After Submission? In: Graduate Student Workshop: Grant Writing and Beyond: How to Write a Grant and What to Do Once You Get It. 2012 Annual conference of the American Society for Horticultural Science. http://ashs.confex.com/ashs/2012/webprogram/Paper9376.html
Other Presentations
1. Banks D. and W.L. Bauerle 2012. Investigating the influence of artificially extended photoperiod on seasonal variation in the maximum rate of Rubisco-mediated carboxylation. Celebrate Undergraduate Research and Creativity Showcase. April 17, Fort Collins, CO.
2. Bauerle, W.L. 2012. Plant gas exchange: principles and application. Plant Breeding for Drought Tolerance Short Course, June 12, Fort Collins, CO.
3. Bauerle, W.L. 2012. Photoperiodic regulation of the seasonal pattern of photosynthetic capacity and the implications for carbon cycling. Science and Math Teachers Workshop. June 15, Greeley, CO.
4. Barnard, D.M. and W.L. Bauerle. 2012. Determining changes in stomatal conductance parameters. Specialty Crops Research Initiative Grant 3rd Annual Meeting, June 18-21, Pullman, WA.

70
5. Bauerle, W.L. 2012. Models and integration: Scaling key parameters & knowing when parameters are important and why. Specialty Crops Research Initiative Grant 3rd Annual Meeting, June 18-21, Pullman, WA.
6. Bauerle T. L. and Paya A. 2012. Utilizing CT technology to answer unsolved question in root research. International Society of Root Research (ISRR) conference, June 26-29, Dundee Scotland.
7. Bauerle, W.L. 2012 Linked photosynthesis and stomatal conductance parameters: There is a lot left to know! National Center for Atmospheric Research July 5, Boulder, CO.
8. Bauerle T. L. 2012. Utilizing CT technology to answer unsolved questions in ornamental tree root research. American Society of Horticultural Science, July31-August 3, Miami, FL.
9. Bauerle, W.L. 2012. Demonstration of irrigation scheduling in the future. Colorado Nursery and Greenhouse Association Fall conference. October 24th, 2012.
10. Lloyd, G.S. and W.L. Bauerle. 2012. Reconciling stomatal conductance model responses to soil drying. GRAD592 Water Seminar Series. October 29, Fort Collins, CO.
11. Lea-Cox, J. D., O. Starry, A. G. Ristvey and S. Cohan. 2012. Establishing Monitoring Protocols –
Challenges in Data Collection and Reporting. Mid-Atlantic Green Roof Science and Technology
Symposium. August 16, 2012. College Park, MD.
12. Starry, O. , J. D. Lea-Cox, A. G. Ristvey and S. Cohan. 2012. Controlling for storm size when evaluating treatment effects in green roof runoff data. Mid-Atlantic Green Roof Science and Technology Symposium. August 16, 2012. College Park, MD.
13. Bayer, M., J. Ruter and M. van Iersel Growth and water use of two gardenia species in response to substrate water content-based irrigation. 2012 Conference of the Southern region of the American Society for Horticultural Science. Birmingham, AL.
14. Bayer, A., J. Ruter, and M. van Iersel. Controlling irrigation of gardenia with soil moisture sensors. UGA Horticulture Farm Open House 2011.
15. Chappell, M., M. van Iersel, A. Bayer, L. O’Meara, S. Dove, P. Thomas, P. Alem, and R. Ferrarezi. 2011. Monitoring Environmental Conditions and Substrate Water Content to Increase Efficiency of Irrigation in Nurseries. Irrigation Association- Innovations in Irrigation Conference. San Diego, CA. November 2011.
16. Chappell, M., M. van Iersel, A. Bayer, L. O’Meara, S. Dove, P. Thomas, J. Ruter, P. Alem, J. Kim,and R. Ferrarezi. Precision Irrigation in Ornamental Horticulture Production. Georgia Farm Bureau State Convention Dec. 6, 2011.
17. Chappell, M. Irrigation Efficiency & Uniformity in Ornamental Production: Calculating Both and Understanding the Difference. UGA Cooperative Extension In-service training July 13, 2012.
18. van Iersel, M.W., L. O’Meara, and M. Chappell. 2012. Environmental effects on water use of gardenia and hydrangea. 2012 Center for Applied Nursery Research Open House. Duluth, GA.
19. Lea-Cox, J.D. 2011. What is the Big Picture with Water and its Availability? How Can You Cope with the Future Water Needs? 2011 Pest Management Conference. Carroll community College, Westminster, MD. 1 Dec. 2011.
20. Lea-Cox, J. D. 2012. Today's Water Management - Issues and Updates. Chesapeake Green Conference. Maritime Institute, Baltimore MD. 10 Feb. 2012.
21. Majsztrik, J. 2012. Advanced Nutrient Management: Fertilizer and Irrigation Practices in Ornamental Operations in Maryland. Chesapeake Green Conference. Maritime Institute, Baltimore MD. 10 Feb. 2012.
22. Majsztrik, J., J. D. Lea-Cox, D. S. Ross and A. G. Ristvey. 2011. Sustainable Nursery Production: Choosing the Management Practices that Fit Your Nursery. Advanced Nutrient Management Twilight Session. Wye Research and Education Center. Queenstown MD. 7 and 14 Sept., 2011.

71
23. O’Meara, L., M. Chappell, J. Ruter and M van Iersel. 2012. Water consumption of Gardenia jasminoides and Hydrangea macrophylla as affected by environmental factors. 2012 Conference of the Southern region of the American Society for Horticultural Science. Birmingham, AL.
24. Peter, A., P. Thomas and M. van Iersel. 2012. Use of controlled water deficit to control height of poinsettias. 2012 Conference of the Southern Region of the American Society for Horticultural Science. Birmingham, AL.
25. Ristvey, A. G. and J. D. Lea-Cox. 2012. Advanced Applicator Training. 7 March, 2012. University of Maryland Greenhouse Complex, College Park MD. (6 Applicators re-certified).
26. Ristvey, A. G. and J. D. Lea-Cox. 2012. Grower Certification Training – Presentations, plan-writing sessions and certification exam. University of Maryland Extension and Maryland Department of Agriculture. June 7, 2012 and July 15, 2010. Wye REC, Queenstown, MD; MDA Headquarters, Annapolis, MD. (7 Growers certified; 4 Consultants trained).
27. van Iersel, M., M. Bayer, L. O’Meara, A. Peter, P. Thomas, M. Chappell, J. Ruter and S. Wells. 2012. Wireless sensor networks for automated irrigation control in greenhouses and nurseries. 2012 Conference of the Southern region of the American Society for Horticultural Science. Birmingham, AL.
28. van Iersel, M.W. Wireless sensor networks for irrigation control in greenhouse and nurseries. UGA Horticulture Farm Open House 2011.
29. van Iersel, M.W. 2011. Sustainable Greenhouse production in a changing world. Sixth JKUAT scientific, technological and industrialization conference. Jomo Kenyatta University of Agriculture and Technology, Juja, Kenya.
30. van Iersel, M.W. Wireless Sensor Networks for Monitoring and Controlling Irrigation in Greenhouses and Nurseries. X Congreso Latinoamericano y del Caribe de Ingeniería Agrícola - CLIA e XLI Congresso Brasileiro de Engenharia Agrícola - CONBEA Londrina - Paraná, Brazil.
Websites, Impact Statements
1. Lea-Cox, J. D., T. Rhodus, L. Brewer and M. Neff, 2011. American Society for Horticultural Science:
Center for Horticultural Impact Statements. http://ashsmedia.org
2. Lea-Cox, J.D. and L. Monahan, 2012. Smart-farms Website and Knowledge Center Redesign:
http://www.smart-farms.net and http://www.smart-farms.net
3. Lea-Cox, J. D., G.A. Kantor, Bauerle, W.L., M. van Iersel, C. Campbell, T. Bauerle, D.S. Ross, A.
Ristvey, D. Parker, D. King, R. Bauer, S. Cohan, P.A. Thomas, J.M. Ruter, M. Chappell, S. Kampf,
M.A. Lefsky, L. Bissey, and T. Martin. 2011. Increasing the Efficiency of Irrigation Water
Applications with Smart Sensor Technology. American Society for Horticultural Science: Center
for Horticultural Impact Statements. http://ashsmedia.org/?p=62
4. Van Iersel, M.W. , M. Chappell, J.M. Ruter and P.A. Thomas. 2012. Better Irrigation in Nurseries and
Greenhouses Saves both Water and Money. American Society for Horticultural Science: Center
for Horticultural Impact Statements. http://ashsmedia.org/?p=410

72
Appendix A:
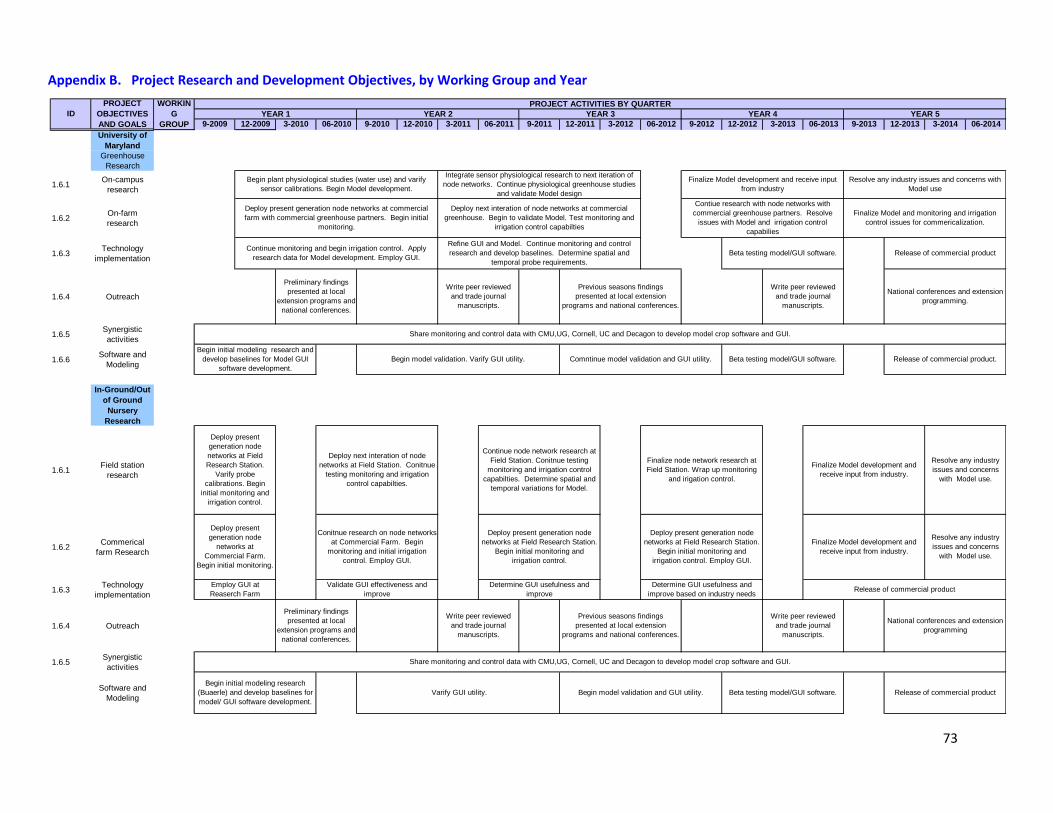
73
Appendix B. Project Research and Development Objectives, by Working Group and Year
9-2009 12-2009 3-2010 06-2010 9-2010 12-2010 3-2011 06-2011 9-2011 12-2011 3-2012 06-2012 9-2012 12-2012 3-2013 06-2013 9-2013 12-2013 3-2014 06-2014
University of
Maryland
Greenhouse
Research
1.6.1On-campus
research
1.6.2On-farm
research
1.6.3Technology
implementation
1.6.4 Outreach
1.6.5Synergistic
activities
1.6.6Software and
Modeling
In-Ground/Out
of Ground
Nursery
Research
1.6.1Field station
research
1.6.2Commerical
farm Research
1.6.3Technology
implementation
1.6.4 Outreach
1.6.5Synergistic
activities
Software and
Modeling
Share monitoring and control data with CMU,UG, Cornell, UC and Decagon to develop model crop software and GUI.
Begin initial modeling research
(Buaerle) and develop baselines for
model/ GUI software development.
Varify GUI utility. Begin model validation and GUI utility. Beta testing model/GUI software. Release of commercial product
Release of commercial product
Preliminary findings
presented at local
extension programs and
national conferences.
Write peer reviewed
and trade journal
manuscripts.
Previous seasons findings
presented at local extension
programs and national conferences.
Write peer reviewed
and trade journal
manuscripts.
National conferences and extension
programming
Employ GUI at
Reaserch Farm
Validate GUI effectiveness and
improve
Determine GUI usefulness and
improve
Determine GUI usefulness and
improve based on industry needs
Finalize Model development and
receive input from industry.
Resolve any industry
issues and concerns
with Model use.
Deploy present
generation node
networks at
Commercial Farm.
Begin initial monitoring.
Conitnue research on node networks
at Commercial Farm. Begin
monitoring and initial irrigation
control. Employ GUI.
Deploy present generation node
networks at Field Research Station.
Begin initial monitoring and
irrigation control.
Deploy present generation node
networks at Field Research Station.
Begin initial monitoring and
irrigation control. Employ GUI.
Finalize Model development and
receive input from industry.
Resolve any industry
issues and concerns
with Model use.
Deploy present
generation node
networks at Field
Research Station.
Varify probe
calibrations. Begin
initial monitoring and
irrigation control.
Deploy next interation of node
networks at Field Station. Conitnue
testing monitoring and irrigation
control capabilties.
Continue node network research at
Field Station. Conitnue testing
monitoring and irrigation control
capabilties. Determine spatial and
temporal variations for Model.
Finalize node network research at
Field Station. Wrap up monitoring
and irigation control.
Write peer reviewed
and trade journal
manuscripts.
National conferences and extension
programming.
Share monitoring and control data with CMU,UG, Cornell, UC and Decagon to develop model crop software and GUI.
Begin initial modeling research and
develop baselines for Model GUI
software development.
Begin model validation. Varify GUI utility. Comntinue model validation and GUI utility. Beta testing model/GUI software. Release of commercial product.
Preliminary findings
presented at local
extension programs and
national conferences.
Write peer reviewed
and trade journal
manuscripts.
Previous seasons findings
presented at local extension
programs and national conferences.
Continue monitoring and begin irrigation control. Apply
research data for Model development. Employ GUI.
Refine GUI and Model. Continue monitoring and control
research and develop baselines. Determine spatial and
temporal probe requirements.
Beta testing model/GUI software. Release of commercial product
Deploy present generation node networks at commercial
farm with commercial greenhouse partners. Begin initial
monitoring.
Deploy next interation of node networks at commercial
greenhouse. Begin to validate Model. Test monitoring and
irrigation control capabilties
Contiue research with node networks with
commercial greenhouse partners. Resolve
issues with Model and irrigation control
capabilies
Finalize Model and monitoring and irrigation
control issues for commericalization.
Begin plant physiological studies (water use) and varify
sensor calibrations. Begin Model development.
Integrate sensor physiological research to next iteration of
node networks. Continue physiological greenhouse studies
and validate Model design
Finalize Model development and receive input
from industry
Resolve any industry issues and concerns with
Model use
ID
PROJECT
OBJECTIVES
AND GOALS
WORKIN
G
GROUP
PROJECT ACTIVITIES BY QUARTER
YEAR 1 YEAR 2 YEAR 3 YEAR 4 YEAR 5

74
9-2009 12-2009 3-2010 06-2010 9-2010 12-2010 3-2011 06-2011 9-2011 12-2011 3-2012 06-2012 9-2012 12-2012 3-2013 06-2013 9-2013 12-2013 3-2014 06-2014
Green Roof
Systems
Research
1.6.1
On-
campus/Field
station research
1.6.2On-location
research
1.6.3Technology
implementation
1.6.4 Outreach
1.6.5Synergistic
activities
1.6.6Software and
Modeling
ID
PROJECT
OBJECTIVES
AND GOALS
WORKIN
G
GROUP
PROJECT ACTIVITIES BY QUARTER
YEAR 1 YEAR 2 YEAR 3 YEAR 4 YEAR 5
Begin probe calibrations to green roof media and
use node system in macroscale research
Resolve issues with calibrations to green roof
media
Deploy node network on greenroof systemConintue research on node network on greenroof
system
Conintue research on node network on greenroof
system
Employ GUI and begin water budget modeling. Continue water budget modeling. Validate GUI. Continue water budget modeling. Validate GUI.
Preliminary findings
presented at local
extension programs and
national conferences.
Write peer reviewed
and trade journal
manuscripts.
Previous seasons findings
presented at local extension
programs and national conferences.
Write peer reviewed
and trade journal
manuscripts.
National conferences and extension
programming.
Share monitoring and control data with CMU,UG, Cornell, UC and Decagon to develop model crop software and GUI.
Begin initial modeling
research and develop
baselines for Model GUI
software development.
Varify GUI utility. Begin model validation and GUI utility. Beta testing model/GUI software. Release of commercial product.
9-2009 12-2009 3-2010 06-2010 9-2010 12-2010 3-2011 06-2011 9-2011 12-2011 3-2012 06-2012 9-2012 12-2012 3-2013 06-2013 9-2013 12-2013 3-2014 06-2014
Carnegie Mellon
University
Hardware Development
Design Decagon, CMUteam tech
review
iterate
design
iterate
design
Manufacture Decagon
build 50
field
prototypes
EvaluateDecagon, CMU
Deployments Decagon, CMU
GUI Development
DevelopmentCMU, Decagon,
Antir
team tech
reviewrough GUI dababase
EvaluateCMU, Decagon,
Antir
Deployments CMU, Decagon
Crop-Specific Plug-Ins
PetuniaCMU, Georgia,
Antir
Red MapleCMU, CSU, Antir
Green RoofCMU, UMD, Antir
Snapdragon Antir, UMD, CMU
implement evaluate at green root test site
implement evaluate at Bauers Greenhouse beta test
implement evaluate at CSU beta test market
implement evaluate at U. Georgia beta test market
collect user feedback, evaluate
rough GUI to existing field sites GUI prototype to field sites (alpha test) GUI beta test market GUI as part of sensor network system
design GUI, refine databasefinal GUI design/development, develop
supporting documentationrefine GUI
evaluate database and GUI collect user feedback, evaluate collect user feedback, evaluate
existing system to Bauers, UMD Greenhouse, Wye (others?) field prototypes to test sites preproduction prototypes to test sites production units to test sites
produce/market sensor network system
test/evaluate prototypes collect engineering data from test sites collect engineering data from preproduction test sites collect engineering data on production units
new node design iterate design
engineering prototypebuild preproduction
prototypes
ID
PROJECT
OBJECTIVES AND
GOALS
WORKING
GROUP
PROJECT ACTIVITIES BY QUARTER
YEAR 1 YEAR 2 YEAR 3 YEAR 4 YEAR 5

75
9-2009 12-2009 3-2010 06-2010 9-2010 12-2010 3-2011 06-2011 9-2011 12-2011 3-2012 06-2012 9-2012 12-2012 3-2013 06-2013 9-2013 12-2013 3-2014 06-2014
University of Georgia
Greenhouse/nursery
research
1.6.1 On-campus research
1.6.2 On-farm research
1.6.3Technology
implementation
1.6.4 Outreach
1.6.5 Synergistic activities
Share water use and environmental data with
UM, CSU, and Cornell; collaborate with UM on
model development; Collect data needed for
social and economic analyses
Share water use and environmental data with
UM, CSU, and Cornell; collaborate with UM on
model development; Collect data needed for
social and economic analyses
Collaborate with UM/Antir on incirporating water
use model into software; Collect data needed for
social and economic analyses
Collect data needed for social and economic
analyses
Maintain and provide support for wireless network at
EverGreen (already in place) and install wireless network at
McCorkle
Upgrade on-farm wireless networks to
incorporate control capabilityUpgrade wirelees networks with latest GUI
Present preliminary findings at trade shows, present data at
scientifi meeting
Publish first manuscript, write trade
magazine articles
Publish manuscripts, write trade
magazine articles
Publish manuscripts; Organize field day at
industry partners for county faculty and growers;
Develop outreach materials Web-based,
PowerPoints, extension publications, trade
magazine articles
Publish manuscripts; Organize field day at
industry partners for county faculty and growers;
Develop outreach materials Web-based,
PowerPoints, extension publications, trade
magazine articles
Wrap up nursery research, address unresolved
issues raised by industry partners
Quantify water use and plant water needsImplement soil moisture sensor based irrigation,
quantify water savings, effects on plant quality
Implement altered fertilization practices, quantify
reductions in fertilizer use and nutrient leaching
Determine effects of substrate water content on
physiology, growth, and quality of different
greenhouse crops, quantify water needs, start
model development
Determine whether soil moisture sensor-
controlled irrigation can be used to control stem
elongation and improve plant quality, effects of
substrate water content on physiology, growth,
and quality of different nursery crops, continue
model development
Validate petunia water use model, incoprorate
model into software, determine how optimal
fertilization practices should be altered with soil
moisture sensor-controlled irrigation, continue
work on stem elongation and plant quality.
Wrap up greenhouse research, address isues
raised by industry partners, continue nursery
research on plant morphology and quality
ID
PROJECT
OBJECTIVES AND
GOALS
WORKING
GROUP
PROJECT ACTIVITIES BY QUARTER
YEAR 1 YEAR 2 YEAR 3 YEAR 4 YEAR 5

76
9-2009 12-2009 3-2010 06-2010 9-2010 12-2010 3-2011 06-2011 9-2011 12-2011 3-2012 06-2012 9-2012 12-2012 3-2013 06-2013 9-2013 12-2013 3-2014 06-2014
Colorado State
University
Nursery research
1.6.1On-campus
research
1.6.2 On-farm research
1.6.3Technology
implementation
1.6.4 Outreach
1.6.5Synergistic
activities
Hold national association short course to present
to industry at Willoway site and Publish
manuscripts
Share water use and environmental data with
UM, UG, and Cornell; collaborate with UM on
model development; Collect data needed for
social and economic analyses
Share water use and environmental data with
UM, UG, and Cornell; collaborate with UM, UG,
and Cornell on model development; Collect data
needed for social and economic analyses
Collaborate with UM/Antir on incirporating water
use model into software; Collect data needed for
social and economic analyses
Collect data needed for social and economic
analyses
Present preliminary findings to Willoway employees, present
data at scientific meeting
Submit first manuscript, write trade
magazine articles
Present initial findings to national
industry audience at Willoway site,
publish manuscripts, write trade
magazine articles
Publish manuscripts; hold field day at ARDEC;
Develop outreach materials - Web-based,
PowerPoints, extension publications, trade
magazine articles
Install wireless network at ARDEC and WillowayUpgrade on-farm wireless networks to
incorporate control capabilityIncorporate latest GUI
Continue upgrade wirelees networks with latest
GUI
Address any unresolved issues
Deploy CMU node network with sensors at Willoway, quantify
water use and plant water needs, deploy lidar, quantify
physiological variables and calculate model parameters
Determine initial optimization of macro-scale
distributed environmental sensing network,
deploy lidar, scale species estimates from whole
trees to nursery beds and sections and compare
to different nursery crop measured values,
continue model development
Deploy lidar, determine spatial node and sensor
placement and derive optimal system
component placement and quantity per unit
area, continue physiological measures, model
development and scaling validation.
Wrap upWilloway site research but address any
unresolved issues and demonstrate system to
national audience
Deploy CMU node network with sensors at
ARDEC, continue model parameterization and
validation (from prior research), deploy lidar, and
determine species specific water use and needs
Determine initial optimization of a macro-scale
distributed environmental sensing network, scale
species estimates from whole trees to stand and
compare to measured values, continue model
development
Detailed spatial analysis and validatation of
nursery water use model, deploy lidar, begin
incoproratation of model into software, schedule
irrigation treatments for prescribed irrigation
evaluation
Wrap up ARDEC site research but yet address
any unresolved issues
ID
PROJECT
OBJECTIVES
AND GOALS
WORKING
GROUP
PROJECT ACTIVITIES BY QUARTER
YEAR 1 YEAR 2 YEAR 3 YEAR 4 YEAR 5