sd talk 2012 v35 - uweburghaus.us · historic reference: this is a very old idea, see h.s. taylor,...
TRANSCRIPT
North Dakota State UniversityFargo, North Dakota
Active sites in heterogeneous catalysis – the case of copper and gold catalystsUwe BurghausDepartment of Chemistry, North Dakota State Universityhttp://www.ndsu.edu/chemistry/people/faculty/burghaus.html
The concept of active sites in heterogeneous catalysis dates back to Langmuir’s days, and it was explicitly introduced as early on as 1925. Clear identification of the catalytically active sites on a solid catalyst surface, however, remains scientifically challenging. We tackeled this problem by using electron beam lithography, in order to fabricate silica supported Cu cluster samples. It turned out that the reactivity towards CO2 adsorption scales with the rim length of the clusters rather than their surface area. Molecular beam scattering, kinetics, and spectroscopic techniques were combined to characterize the active sites. The second system discussed is nanogold, supported on silica. Adsorption probabilities of CO depend distinctly on the Au cluster size, with a reactivity maximum at ~3 nm. This cluster size is consistent with the legendary reactivity enhancement seen for the CO-oxidation reaction. Again, that effect is related to active sites which here depend on cluster size.
North Dakota State UniversityFargo, North Dakota
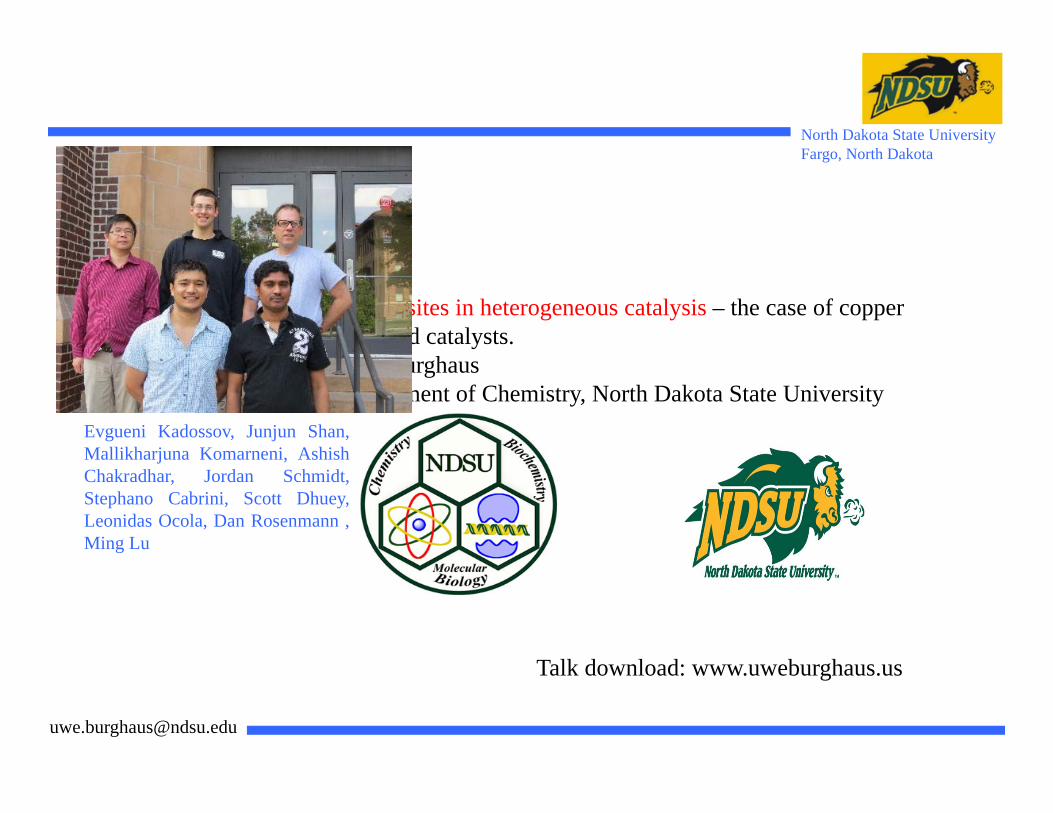
Active sites in heterogeneous catalysis – the case of copper and gold catalysts.Uwe BurghausDepartment of Chemistry, North Dakota State University
Evgueni Kadossov, Junjun Shan,Mallikharjuna Komarneni, AshishChakradhar, Jordan Schmidt,Stephano Cabrini, Scott Dhuey,Leonidas Ocola, Dan Rosenmann ,Ming Lu
Talk download: www.uweburghaus.us
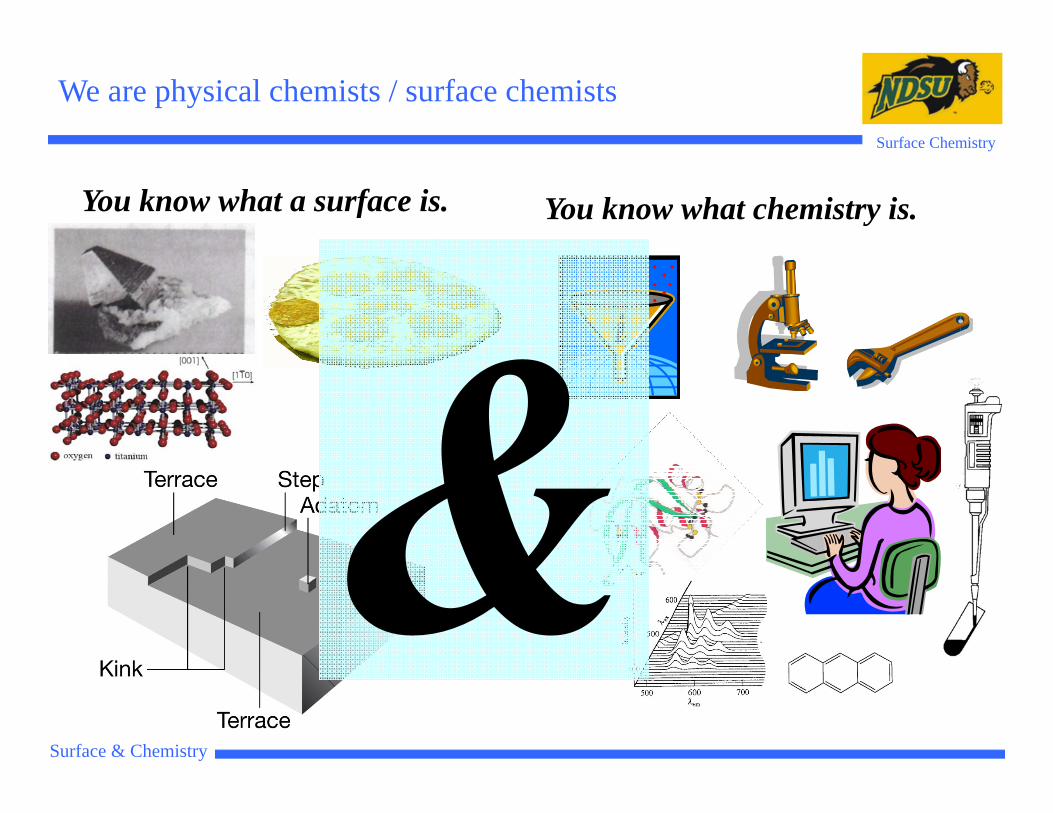
You know what a surface is. You know what chemistry is.
Surface Chemistry
We are physical chemists / surface chemists
Surface & Chemistry
North Dakota State UniversityFargo, North Dakota
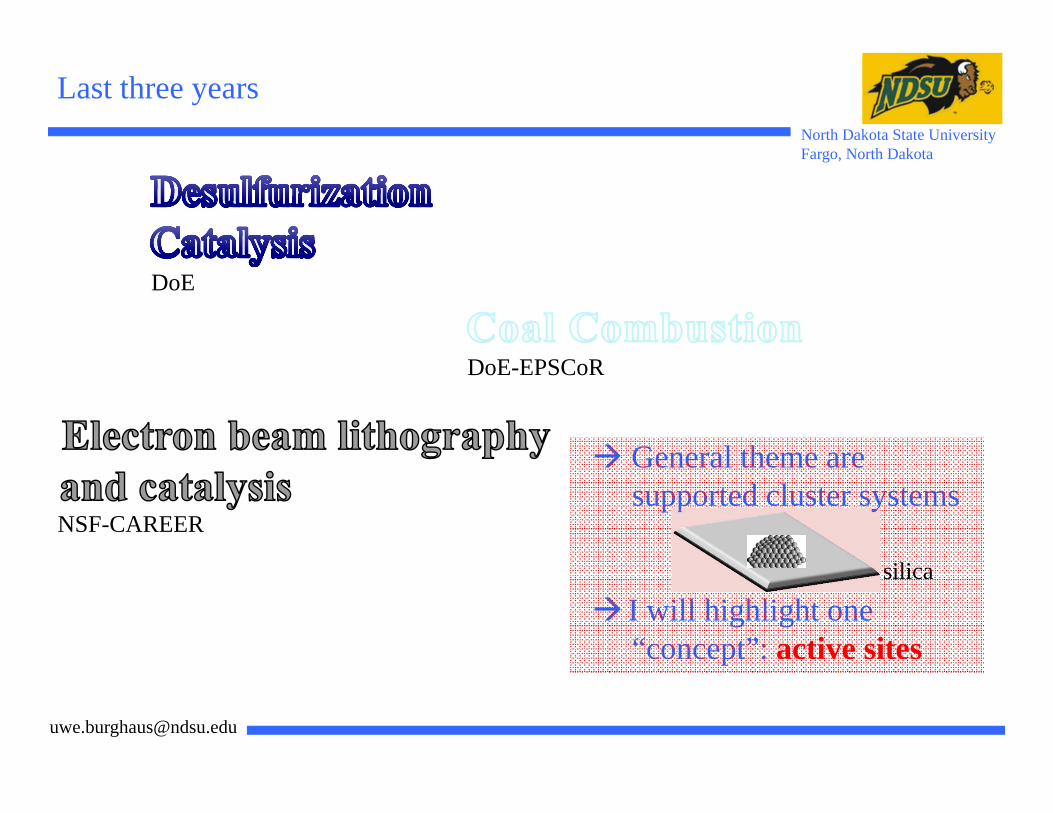
Last three years
DoE
DoE-EPSCoR
NSF-CAREER
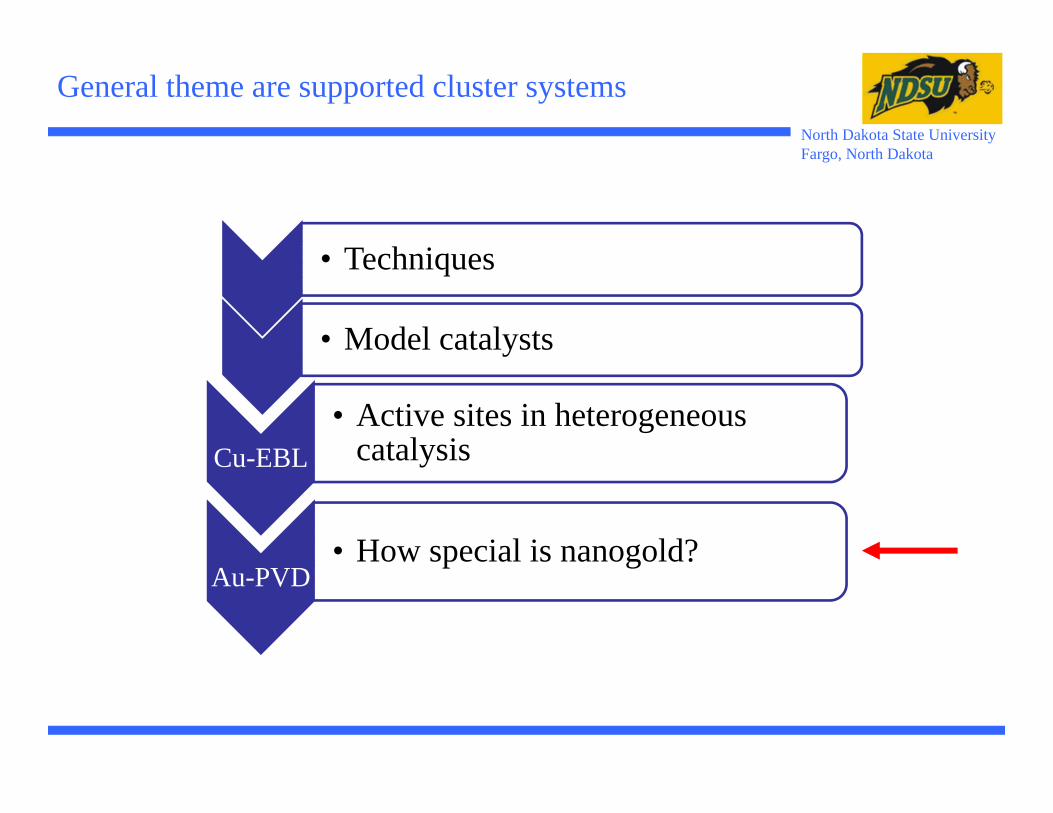
General theme are supported cluster systems
I will highlight one “concept”: active sites
silica

North Dakota State UniversityFargo, North Dakota
Cu-EBL• Active sites in heterogeneous
catalysis
Au-PVD• How special is nanogold?
• Techniques
• Model catalysts
General theme are supported cluster systems
EBL: Electron beam LithographyPVD: Physical vapor Deposition
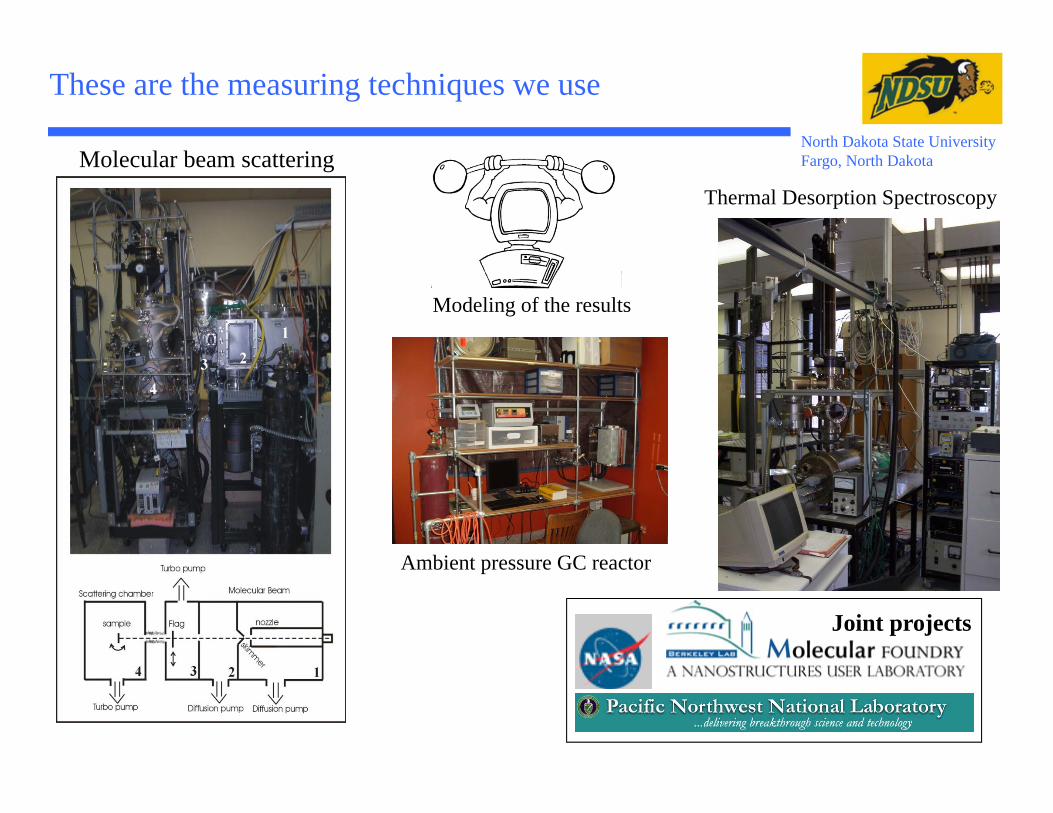
These are the measuring techniques we use
Thermal Desorption Spectroscopy
Molecular beam scattering
Modeling of the results
Joint projects
Ambient pressure GC reactor
North Dakota State UniversityFargo, North Dakota

We use kinetics techniques: thermal desorption spectroscopy
Polanyi Wigner equation-dN/dT = ν/β exp[-Ed/RTs]Binding energies
temperature
pres
sure
North Dakota State UniversityFargo, North Dakota
tem
pera
ture
time
pumps
mass spec.sample

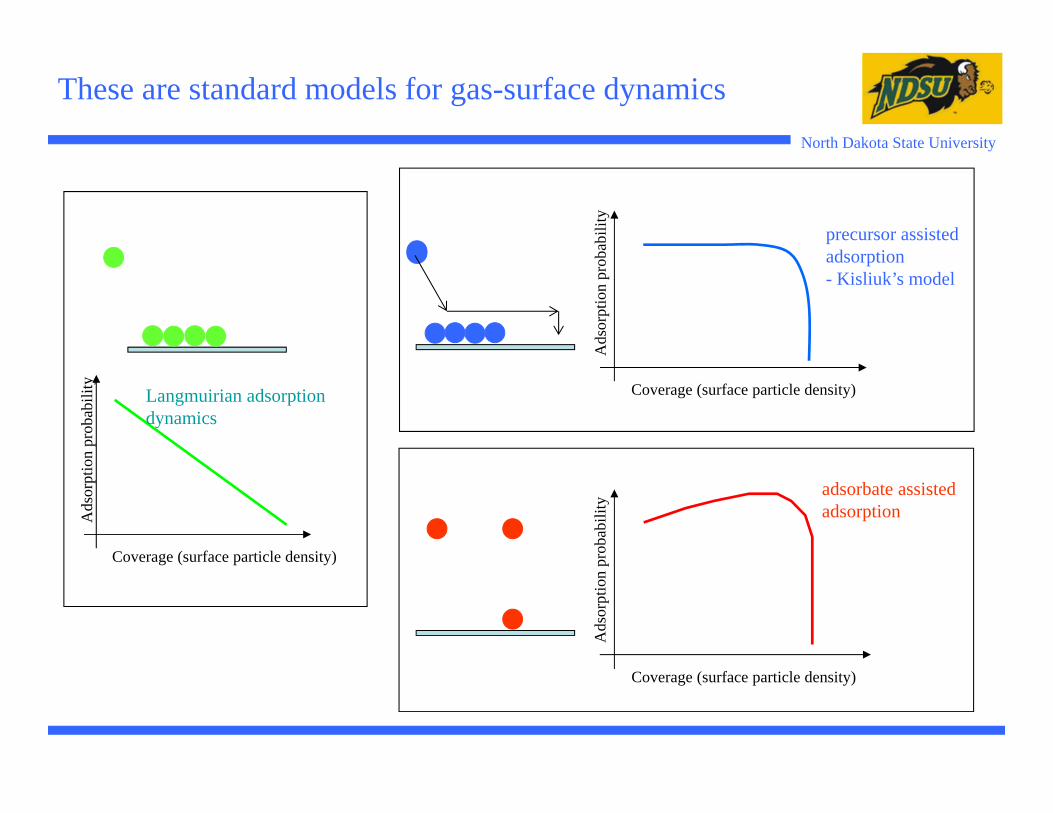
We study gas-surface dynamics – adsorption probabilitiesNorth Dakota State UniversityFargo, North Dakota
θsat
Ads
orpt
ion
prob
abili
ty
Coverage (surface particle density)
Langmuirian adsorption dynamics
North Dakota State University
These are standard models for gas-surface dynamics
Ads
orpt
ion
prob
abili
ty
Coverage (surface particle density)
precursor assisted adsorption- Kisliuk’s model
Ads
orpt
ion
prob
abili
ty
Coverage (surface particle density)
adsorbate assisted adsorption
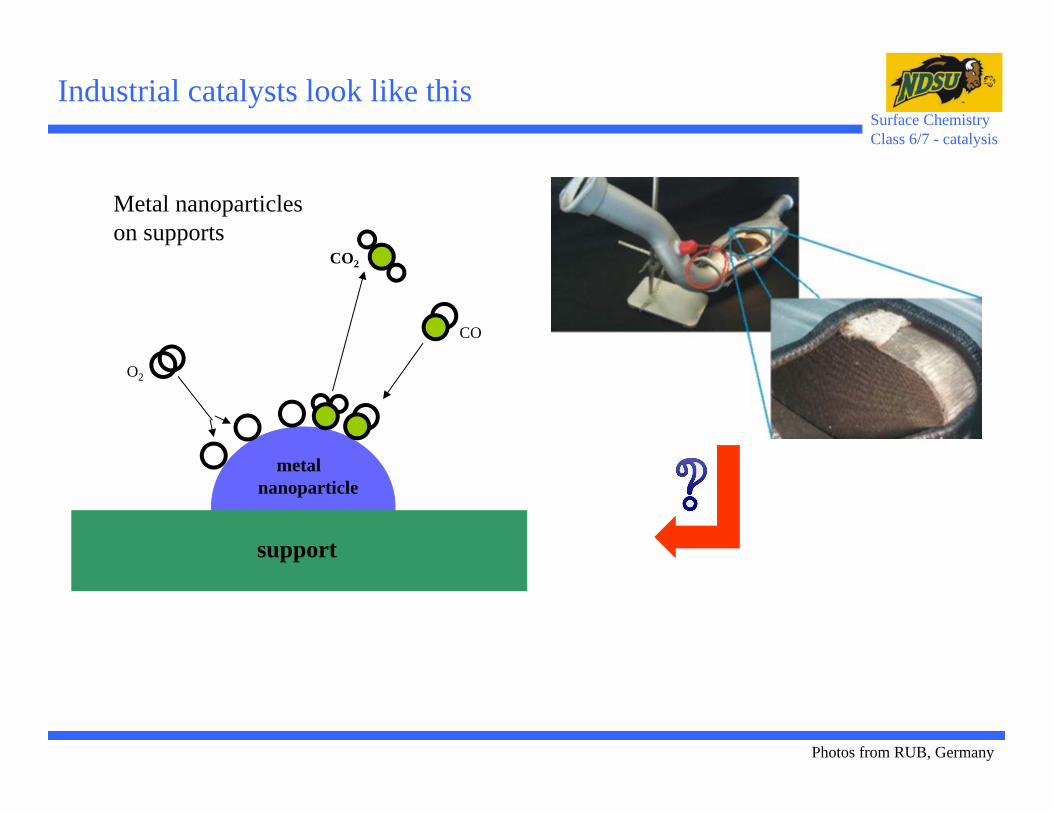
Industrial catalysts look like this
Metal nanoparticleson supports
CO
O2
CO2
metal nanoparticle
support
Photos from RUB, Germany
Surface ChemistryClass 6/7 - catalysis
North Dakota State UniversityFargo, North Dakota
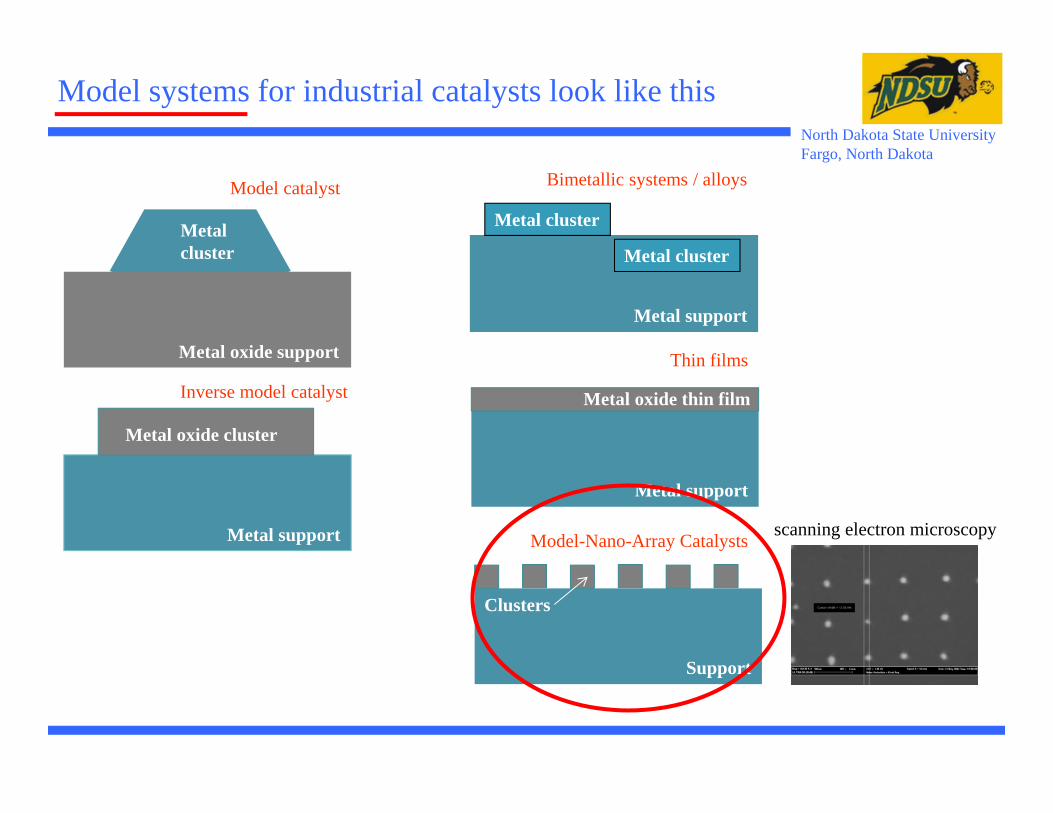
Model catalyst
Metalcluster
Metal oxide support
Inverse model catalyst
Metal support
Metal oxide cluster
Bimetallic systems / alloys
Metal cluster
Metal cluster
Metal support
Metal oxide thin film
Thin films
Metal support
Support
Clusters
Model-Nano-Array Catalysts
Model systems for industrial catalysts look like this
scanning electron microscopy
I focus on one topic in this talk ...
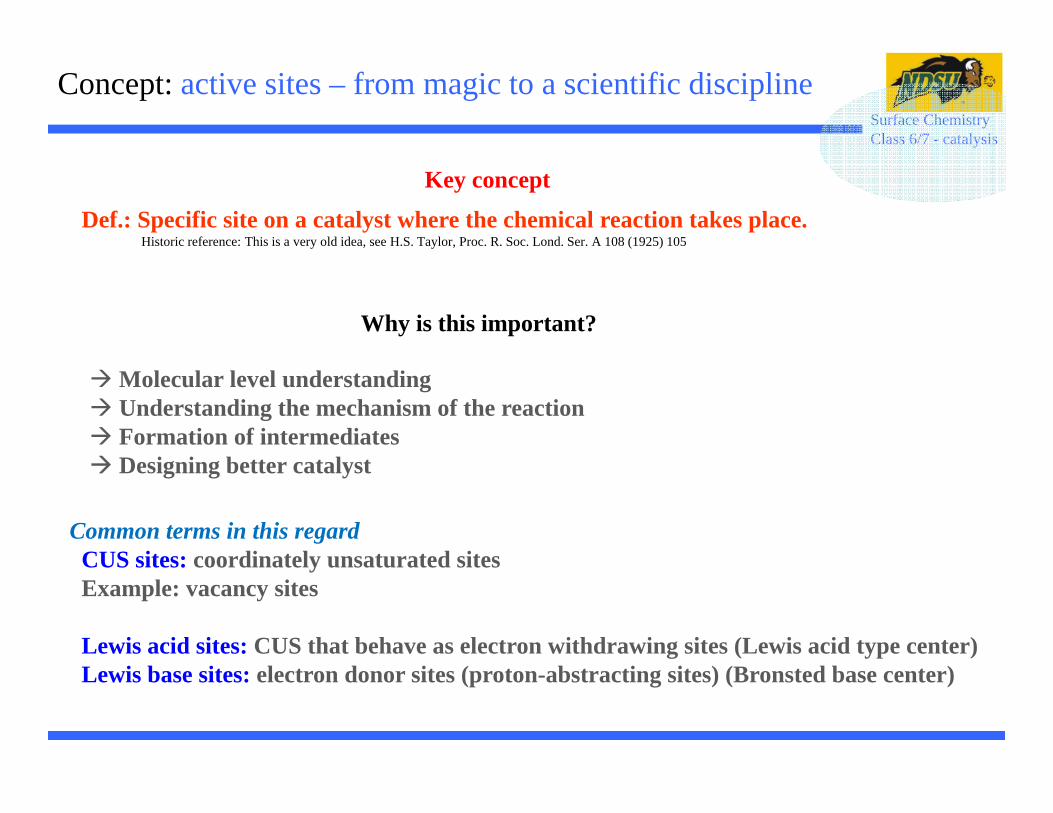
Def.: Specific site on a catalyst where the chemical reaction takes place.Historic reference: This is a very old idea, see H.S. Taylor, Proc. R. Soc. Lond. Ser. A 108 (1925) 105
Key concept
Why is this important?
Molecular level understandingUnderstanding the mechanism of the reactionFormation of intermediatesDesigning better catalyst
Concept: active sites – from magic to a scientific disciplineSurface ChemistryClass 6/7 - catalysis
Common terms in this regardCUS sites: coordinately unsaturated sitesExample: vacancy sites
Lewis acid sites: CUS that behave as electron withdrawing sites (Lewis acid type center)Lewis base sites: electron donor sites (proton-abstracting sites) (Bronsted base center)
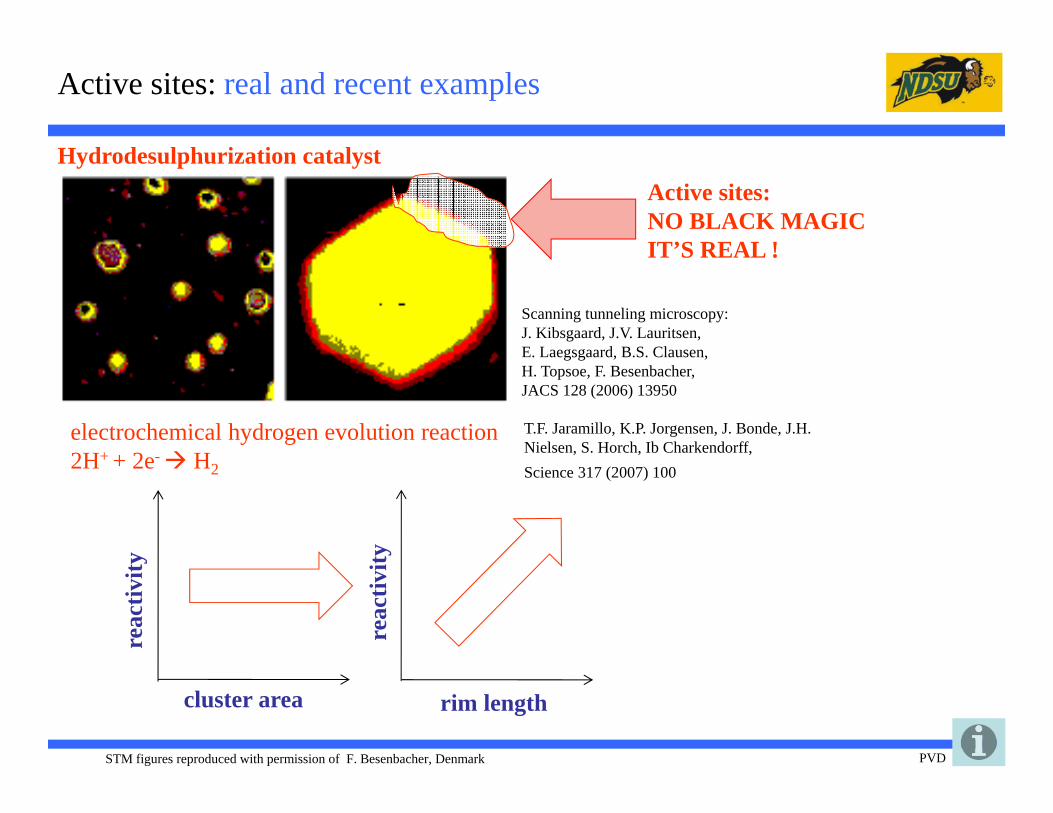
Active sites: real and recent examples
Scanning tunneling microscopy: J. Kibsgaard, J.V. Lauritsen, E. Laegsgaard, B.S. Clausen, H. Topsoe, F. Besenbacher, JACS 128 (2006) 13950
STM figures reproduced with permission of F. Besenbacher, Denmark
Hydrodesulphurization catalystre
activ
ity
cluster area rim length
reac
tivity
Active sites:NO BLACK MAGICIT’S REAL !
electrochemical hydrogen evolution reaction2H+ + 2e- H2
T.F. Jaramillo, K.P. Jorgensen, J. Bonde, J.H. Nielsen, S. Horch, Ib Charkendorff, Science 317 (2007) 100
PVD
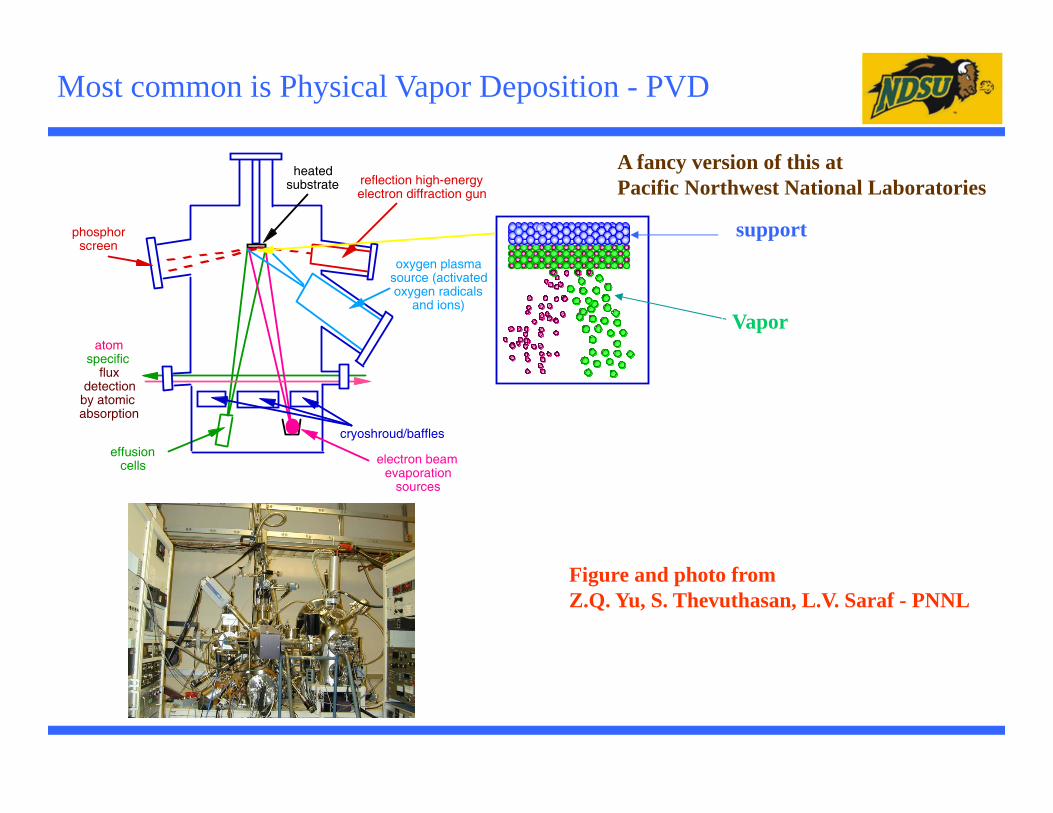
Oxygen-Plasma-Assisted Molecular Beam Epitaxy
reflection high-energy electron diffraction gun
heated substrate
oxygen plasma source (activated oxygen radicals
and ions)
phosphor screen
effusion cells electron beam
evaporation sources
cryoshroud/baffles
atom specific
flux detection
by atomic absorption
Most common is Physical Vapor Deposition - PVD
Figure and photo fromZ.Q. Yu, S. Thevuthasan, L.V. Saraf - PNNL
support
Vapor
A fancy version of this atPacific Northwest National Laboratories
North Dakota State UniversityFargo, North Dakota
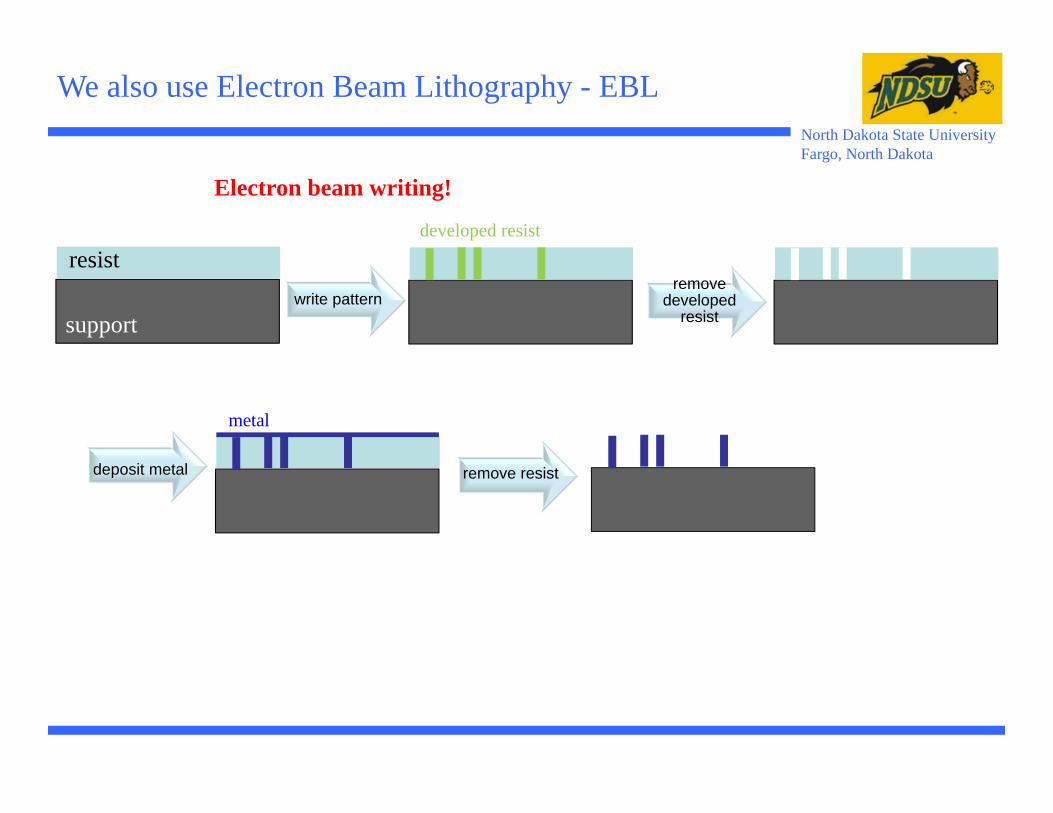
We also use Electron Beam Lithography - EBL
support
resistdeveloped resist
metal
write patternremove
developed resist
deposit metal remove resist
Electron beam writing!
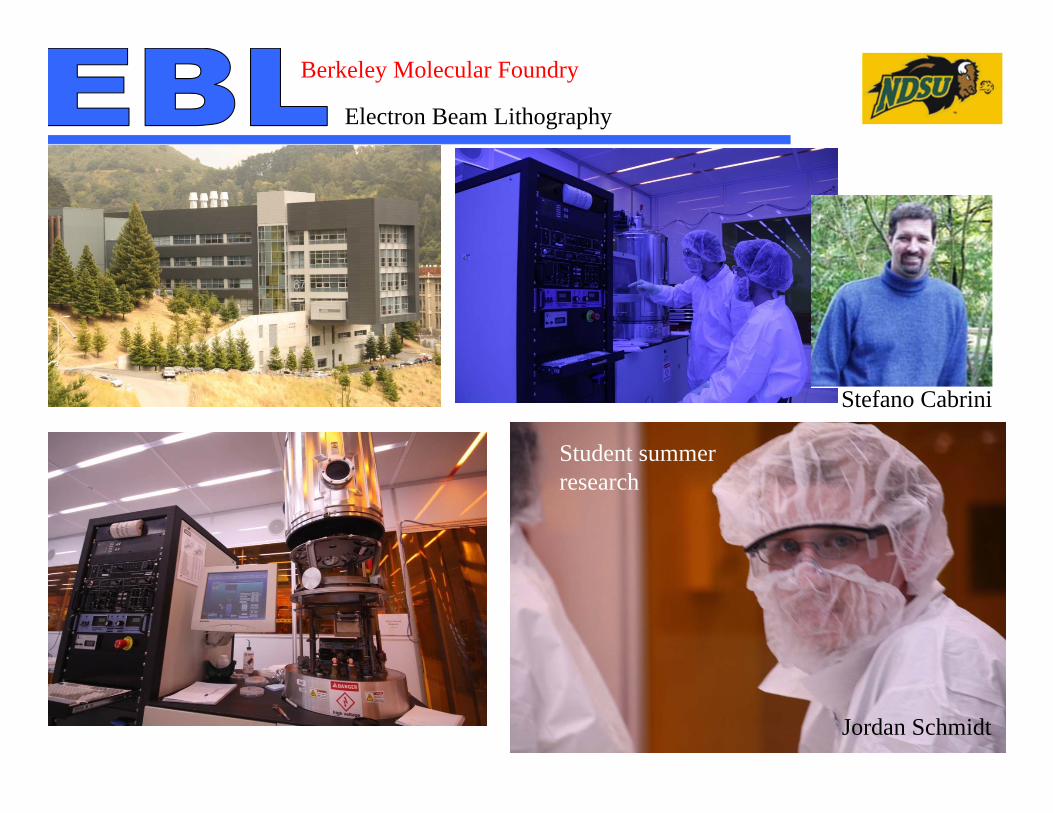
Electron Beam Lithography
Berkeley Molecular Foundry
Stefano Cabrini
Jordan Schmidt
Student summer research

NDSU /Berkeley Molecular FoundryArgonne
Electron Beam Lithography
We looked atAuCuMoCuOxMoOx
scanning electron microscopy
We used these EBL samples to determine the active sites
North Dakota State UniversityFargo, North Dakota
• Nanocopper clusters on silica• EBL
Let’s start with copper
North Dakota State UniversityFargo, North Dakota
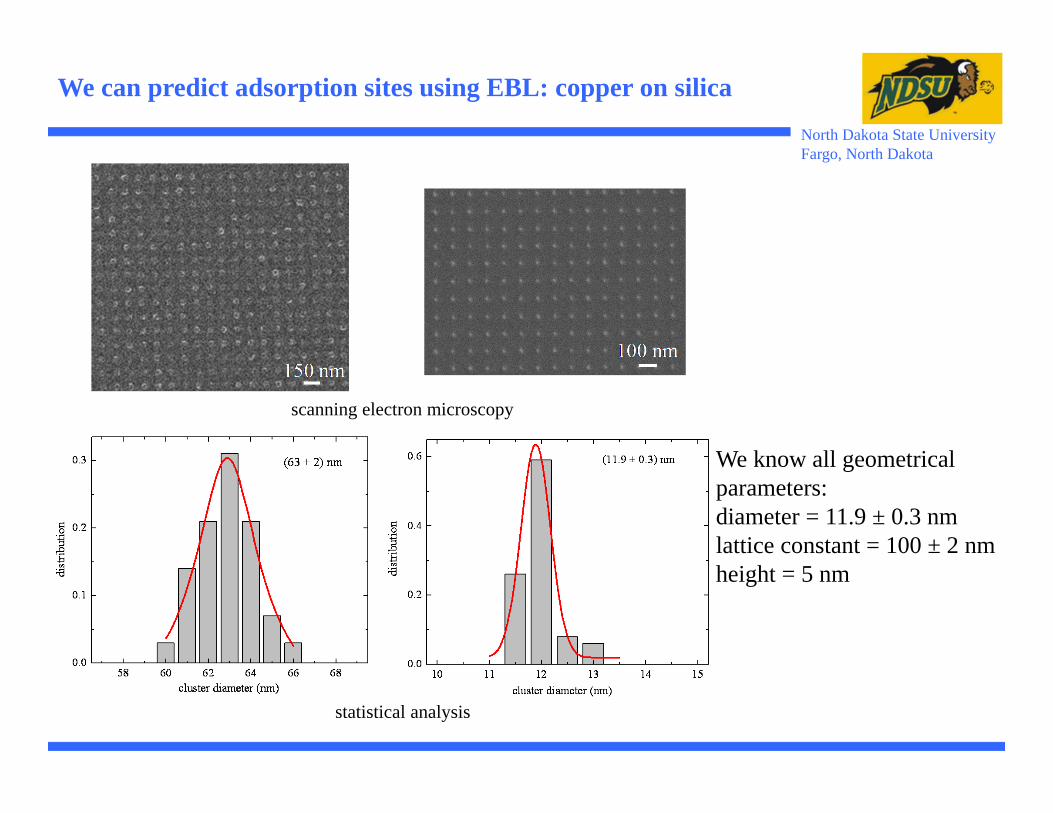
We can predict adsorption sites using EBL: copper on silica
We know all geometrical parameters:diameter = 11.9 ± 0.3 nmlattice constant = 100 ± 2 nmheight = 5 nm
scanning electron microscopy
statistical analysis

North Dakota State UniversityFargo, North Dakota
EBL allows for a priori knowledge of active sites
Scanning electron microscopy
970 960 950 940 930 920
0
3000
6000
9000
12000
15000
Cu 2p3/2
XPS
inte
nsity
(a.u
.)
binding energy (eV)
Cu 2p1/2
Cu
CuO
We know the chemical composition:Cu vs. Cu2O / CuO
X-ray photoelectron spectroscopy
We know all geometrical parameters:diameter = 11.9 ± 0.3 nmlattice constant = 100 ± 2 nmheight = 5 nm
rim lengthsurface area
= active sitescandidates
North Dakota State UniversityFargo, North Dakota
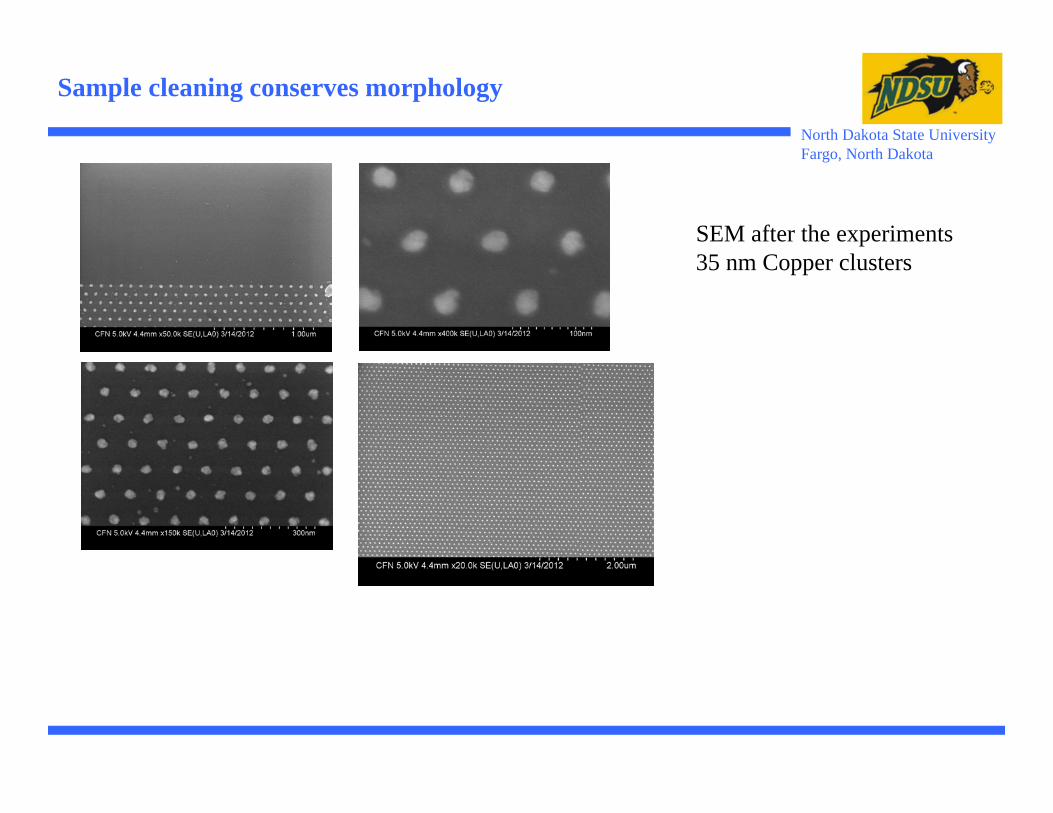
Sample cleaning conserves morphology
SEM after the experiments35 nm Copper clusters
North Dakota State UniversityFargo, North Dakota
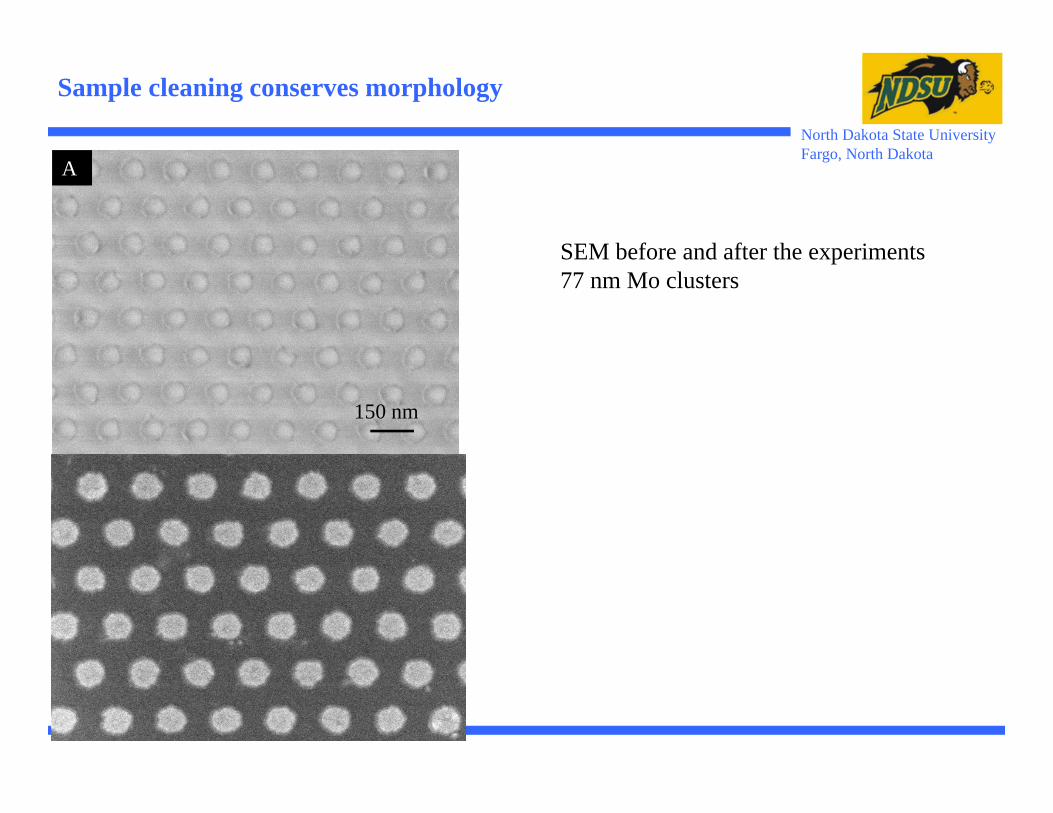
Sample cleaning conserves morphology
SEM before and after the experiments77 nm Mo clusters
A
150 nm
North Dakota State UniversityFargo, North Dakota
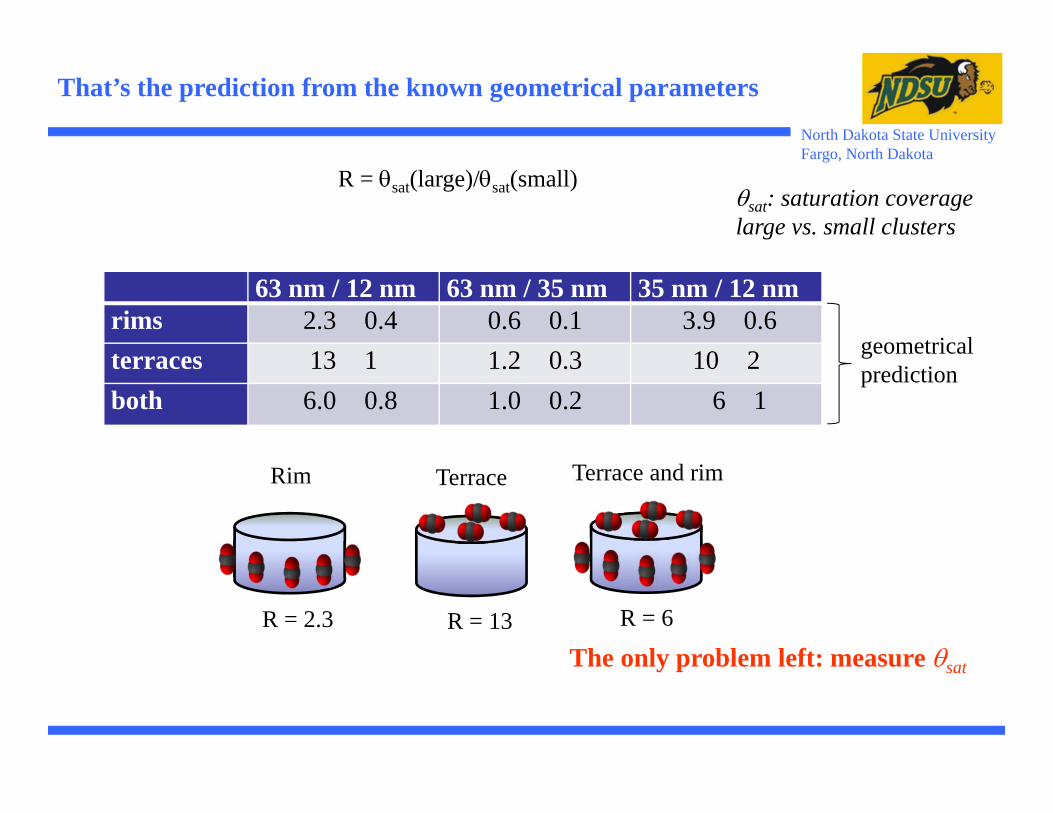
That’s the prediction from the known geometrical parameters
63 nm / 12 nm 63 nm / 35 nm 35 nm / 12 nmrims 2.3 0.4 0.6 0.1 3.9 0.6terraces 13 1 1.2 0.3 10 2both 6.0 0.8 1.0 0.2 6 1
R = θsat(large)/θsat(small)
Terrace and rim
R = 6
Terrace
R = 13
Rim
R = 2.3
θsat: saturation coveragelarge vs. small clusters
geometrical prediction
The only problem left: measure θsat

We study gas-surface dynamics – adsorption probabilitiesNorth Dakota State UniversityFargo, North Dakota
θsat
North Dakota State UniversityFargo, North Dakota
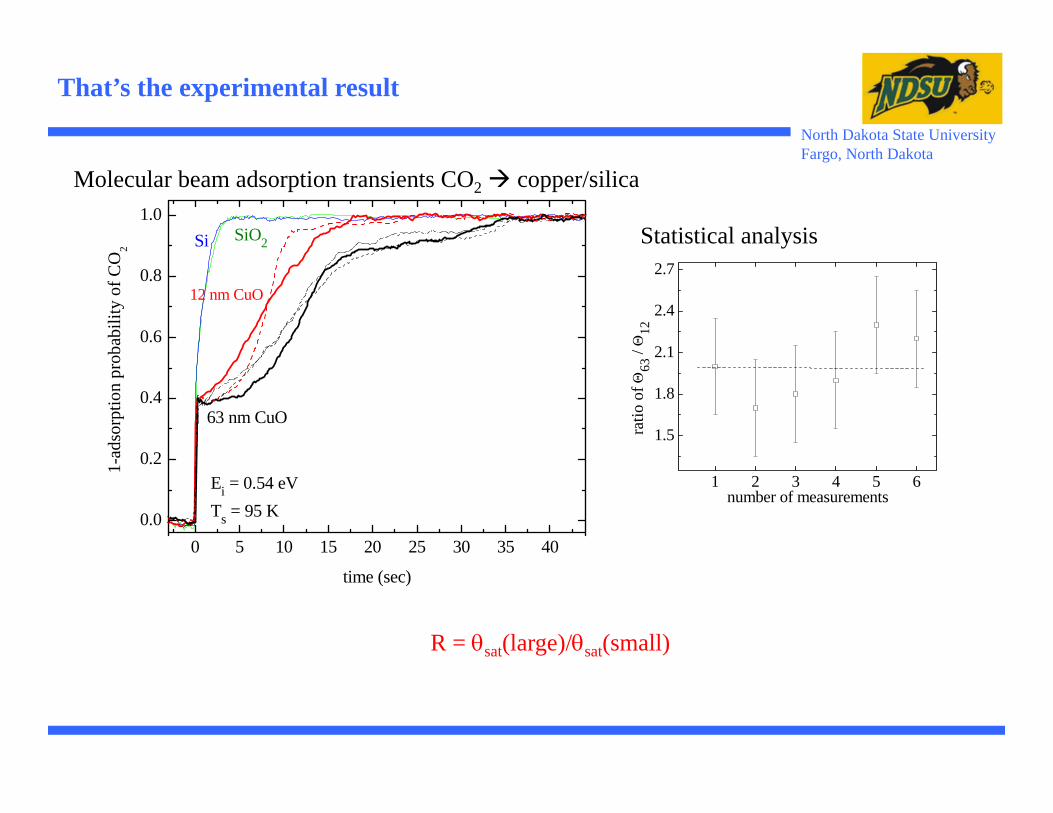
That’s the experimental result
0 5 10 15 20 25 30 35 400.0
0.2
0.4
0.6
0.8
1.0
63 nm CuO
SiO2Si
1-ad
sorp
tion
prob
abili
ty o
f CO
2
time (sec)
Ei = 0.54 eVTs = 95 K
12 nm CuO
Molecular beam adsorption transients CO2 copper/silica
1 2 3 4 5 6
1.5
1.8
2.1
2.4
2.7
ratio
of Θ
63 /
Θ12
number of measurements
Statistical analysis
R = θsat(large)/θsat(small)

North Dakota State UniversityFargo, North Dakota
Experimental results ...
63 nm / 12 nm 63 nm / 35 nm 35 nm / 12 nmrims 2.3 0.4
2.0 0.30.6 0.10.8 0.2
3.9 0.62.7 0.3
terraces 13 1 1.2 0.3 10 2both 6.0 0.8
4.5 0.71.0 0.21.2 0.3
6 14.0 0.6 Experimental CO/CuO
Experimental CO2/CuOTheory
TheoryTheory
RimCO2/CuO
Terrace and rimCO/CuO

North Dakota State UniversityFargo, North Dakota
One more hint ... thermal desorption spectroscopy ...
100 150 200 250 300
β
CO
(m/e
= 2
8) T
DS
yiel
d (a
.u.)
temperature (K)
200100
520
1
60
χ (s)
0
αCO
100 120 140
CO
2 (m/e
= 4
4) T
DS
yiel
d (a
.u.)
temperature (K)
χ (s)
10030
41
10
0
CO2
Terrace and rimCO/CuO
RimCO2/CuO
Theory literature

Def.: Specific site on a catalyst where the chemical reaction takes place.
Key concept
Concept: active sites – from magic to a scientific discipline
Perhaps not that new, but ...STM vs. kineticsPVD vs. EBL
North Dakota State UniversityFargo, North Dakota
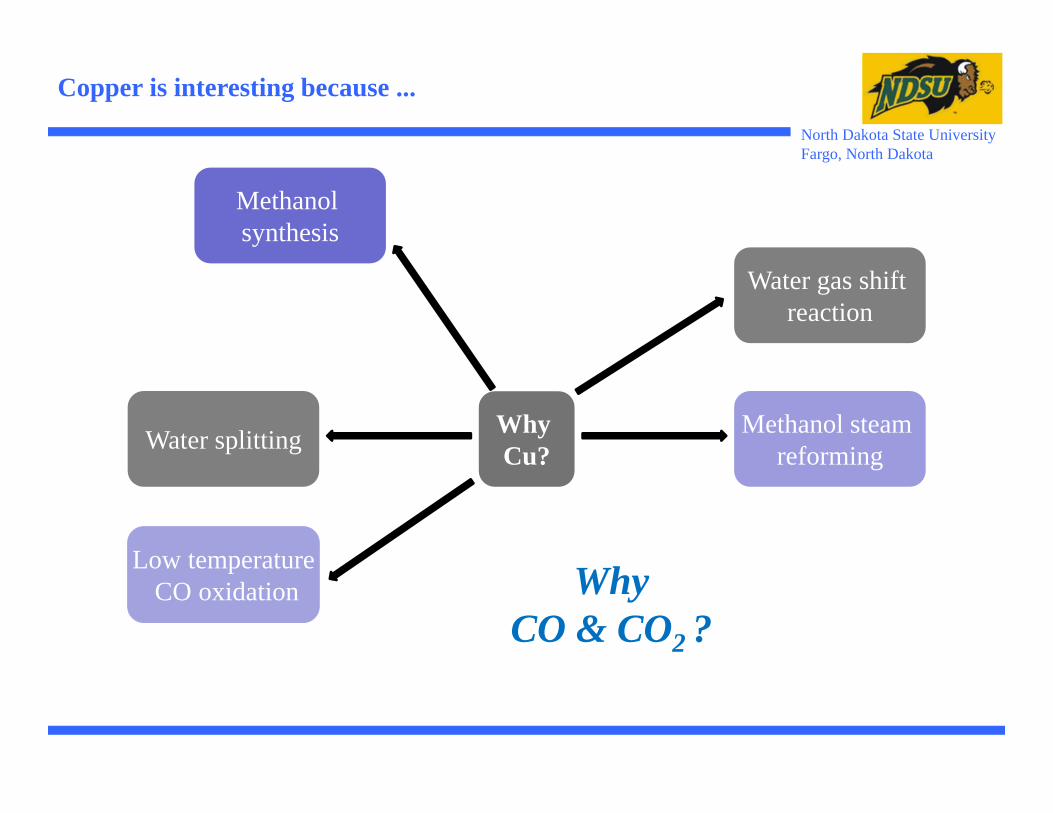
Copper is interesting because ...
Why Cu?
Methanol synthesis
Water splitting
Low temperatureCO oxidation
Methanol steam reforming
Water gas shift reaction
WhyCO & CO2 ?
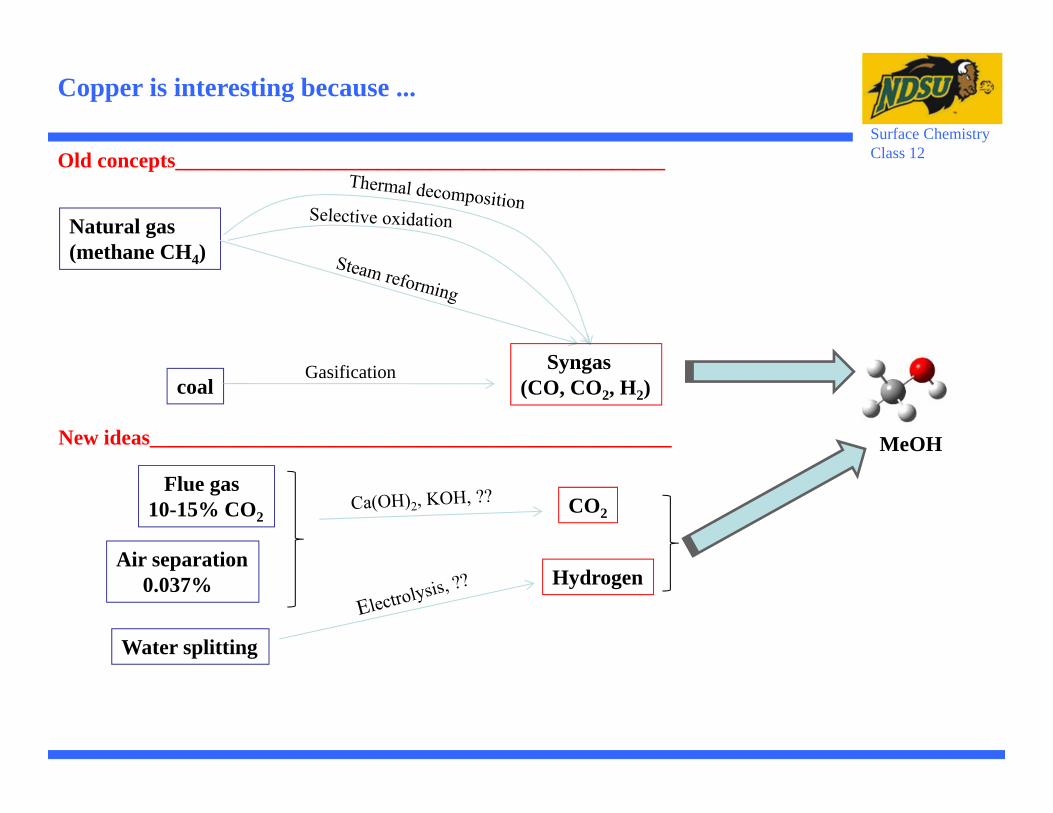
Old concepts______________________________________________
Flue gas10-15% CO2
Air separation0.037%
MeOH
Natural gas(methane CH4)
coalGasification Syngas
(CO, CO2, H2)
CO2
Hydrogen
Water splitting
Surface ChemistryClass 12
New ideas_________________________________________________
Copper is interesting because ...
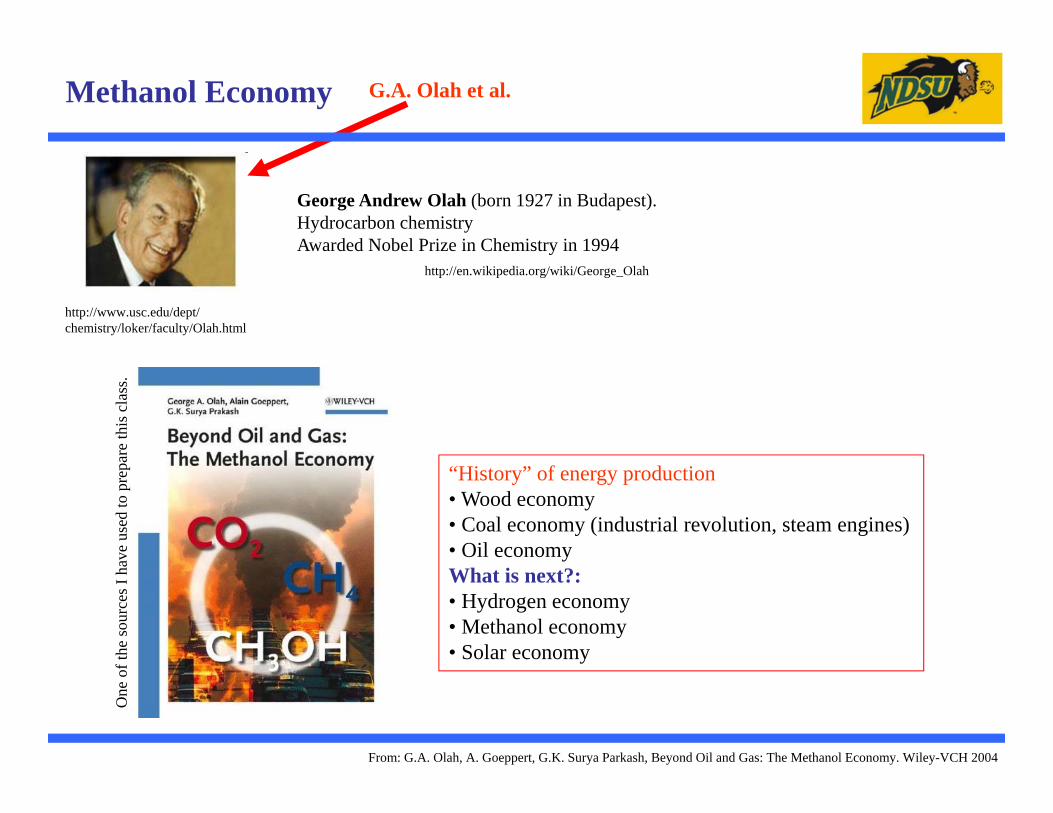
Methanol Economy
George Andrew Olah (born 1927 in Budapest). Hydrocarbon chemistryAwarded Nobel Prize in Chemistry in 1994
http://en.wikipedia.org/wiki/George_Olah
http://www.usc.edu/dept/chemistry/loker/faculty/Olah.html
From: G.A. Olah, A. Goeppert, G.K. Surya Parkash, Beyond Oil and Gas: The Methanol Economy. Wiley-VCH 2004
G.A. Olah et al.
“History” of energy production• Wood economy• Coal economy (industrial revolution, steam engines)• Oil economyWhat is next?:• Hydrogen economy• Methanol economy• Solar economy
One
of t
he so
urce
s I h
ave
used
to p
repa
re th
is c
lass
.
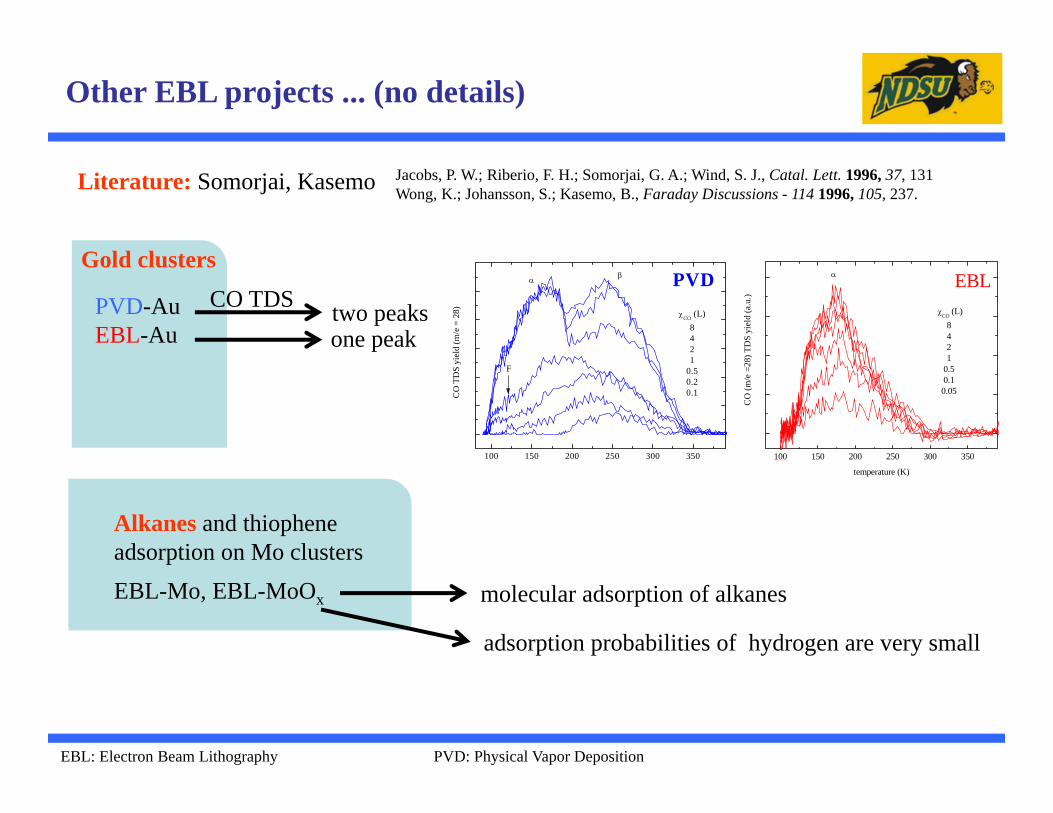
Other EBL projects ... (no details)
Alkanes and thiophene adsorption on Mo clustersEBL-Mo, EBL-MoOx
Gold clusters
PVD-Au EBL-Au
100 150 200 250 300 350
CO
TD
S yi
eld
(m/e
= 2
8) χCO (L)8421
0.50.20.1
αβ PVD
F
two peaksCO TDS
one peak
100 150 200 250 300 350
χCO (L)8421
0.50.10.05
CO
(m/e
=28
) TD
S yi
eld
(a.u
.)
temperature (K)
EBLα
Literature: Somorjai, Kasemo Jacobs, P. W.; Riberio, F. H.; Somorjai, G. A.; Wind, S. J., Catal. Lett. 1996, 37, 131Wong, K.; Johansson, S.; Kasemo, B., Faraday Discussions - 114 1996, 105, 237.
molecular adsorption of alkanes
EBL: Electron Beam Lithography PVD: Physical Vapor Deposition
adsorption probabilities of hydrogen are very small
North Dakota State UniversityFargo, North Dakota
Cu-EBL• Active sites in heterogeneous
catalysis
Au-PVD• How special is nanogold?
• Techniques
• Model catalysts
General theme are supported cluster systems
North Dakota State UniversityFargo, North Dakota
Here we just used physical vapor deposition (PVD)
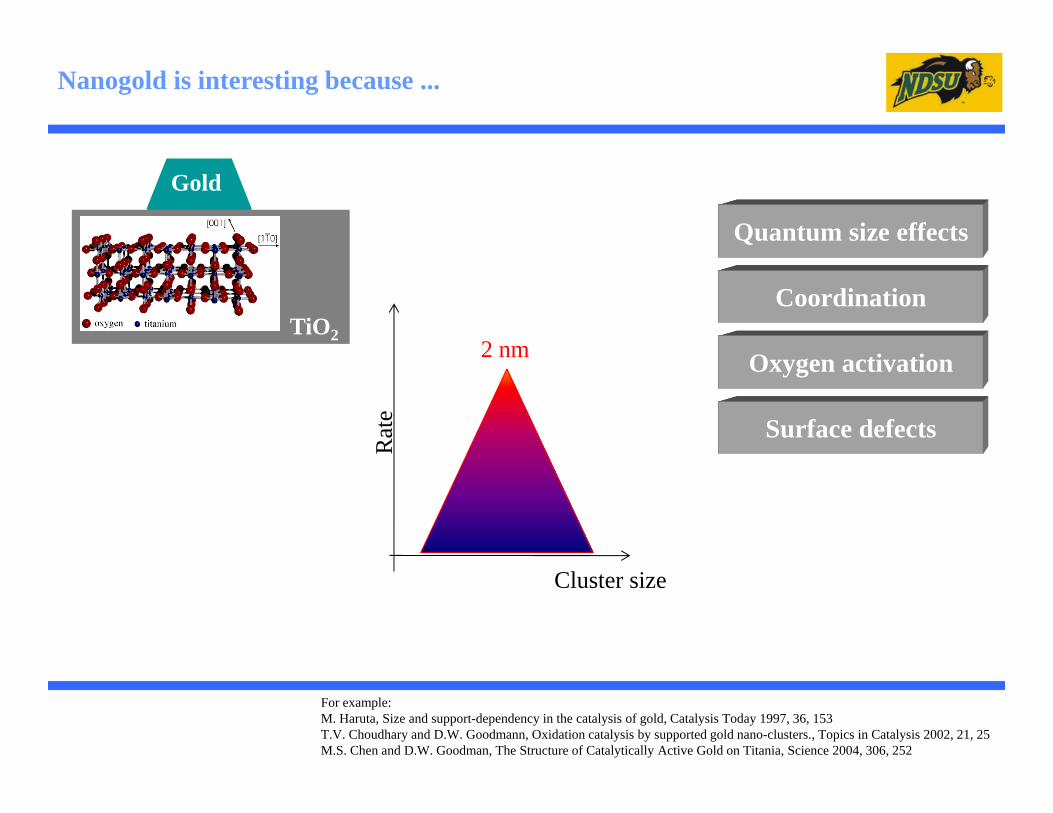
Quantum size effects
Coordination
Oxygen activation
Surface defects
Quantum size effects
Coordination
Oxygen activation
Surface defects
For example:M. Haruta, Size and support-dependency in the catalysis of gold, Catalysis Today 1997, 36, 153 T.V. Choudhary and D.W. Goodmann, Oxidation catalysis by supported gold nano-clusters., Topics in Catalysis 2002, 21, 25 M.S. Chen and D.W. Goodman, The Structure of Catalytically Active Gold on Titania, Science 2004, 306, 252
Nanogold is interesting because ...
Gold
TiO2
Cluster size
Rat
e2 nm
North Dakota State UniversityFargo, North Dakota
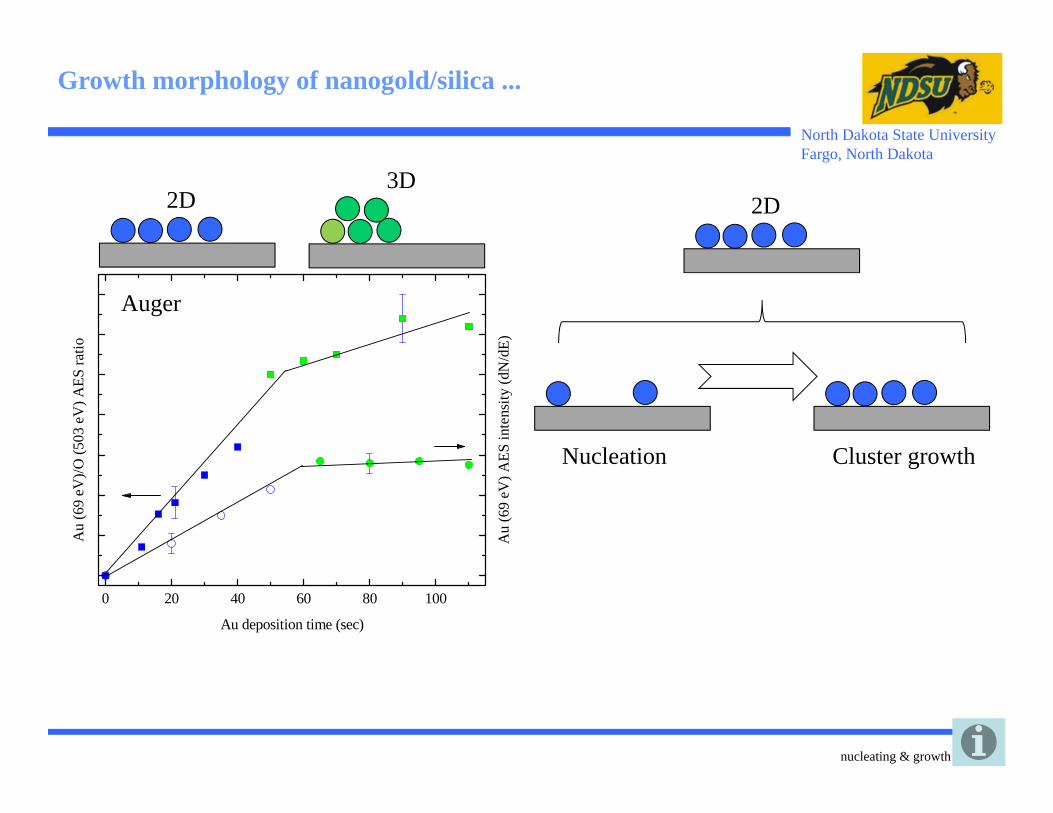
Growth morphology of nanogold/silica ...
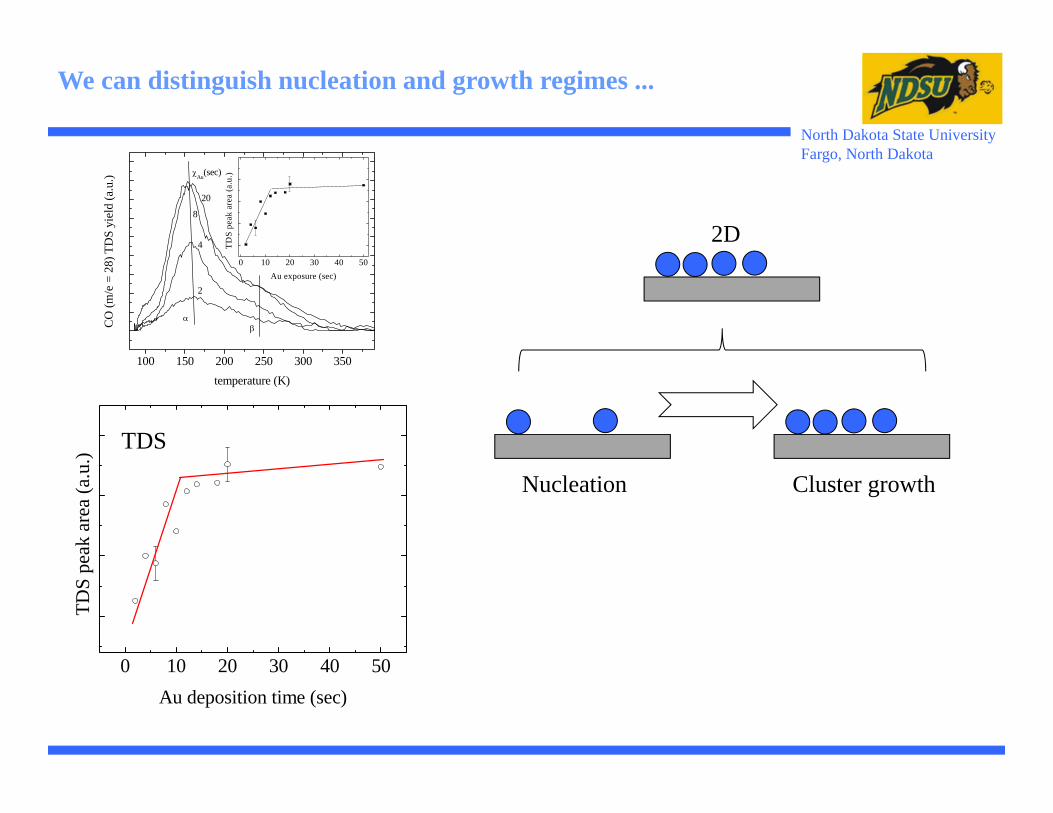
3D2D 2D
Nucleation Cluster growth
nucleating & growth
0 20 40 60 80 100
Au
(69
eV) A
ES in
tens
ity (d
N/d
E)
Au
(69
eV)/O
(503
eV
) AES
ratio
Au deposition time (sec)
Auger
North Dakota State UniversityFargo, North Dakota
2D
Nucleation Cluster growth
We can distinguish nucleation and growth regimes ...
100 150 200 250 300 350
0 10 20 30 40 50
TDS
peak
are
a (a
.u.)
Au exposure (sec)
CO
(m/e
= 2
8) T
DS
yiel
d (a
.u.)
temperature (K)
2
4
8
20
αβ
χAu(sec)
0 10 20 30 40 50
TD
S pe
ak a
rea
(a.u
.)
Au deposition time (sec)
TDS

North Dakota State UniversityFargo, North Dakota
0 10 20 30 400
20
40
60
80
100
Au particle size (nm)
Num
ber o
f clu
ster
s
Cluster size of nanogold ...
scanning electron microscopy (SEM)
3.5 nm
10 sec Au exposure
AESTDSSEM
PVD-Au morphology EBL-Cu morphology
We know what the samples look like.
Most SEM images are from Ming Lu, Brookhaven National labs.
North Dakota State UniversityFargo, North Dakota
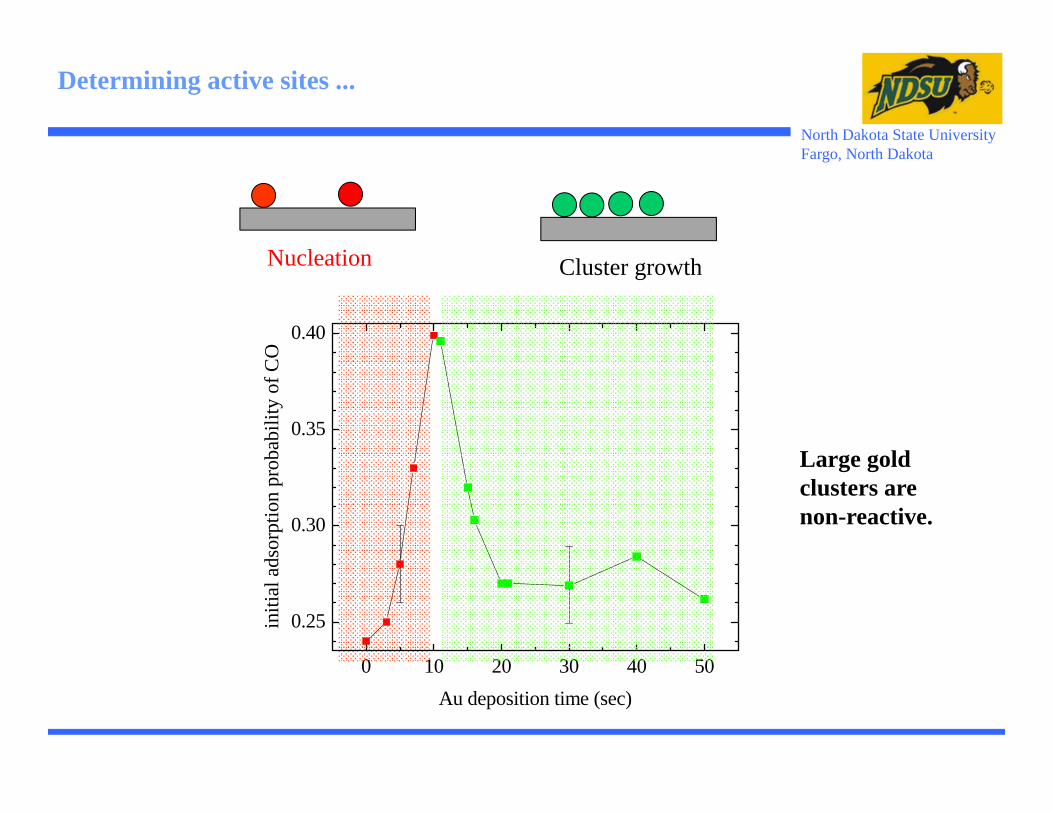
0 10 20 30 40 50
0.25
0.30
0.35
0.40
initi
al a
dsor
ptio
n pr
obab
ility
of C
O
Au deposition time (sec)
Determining active sites ...
Nucleation Cluster growth
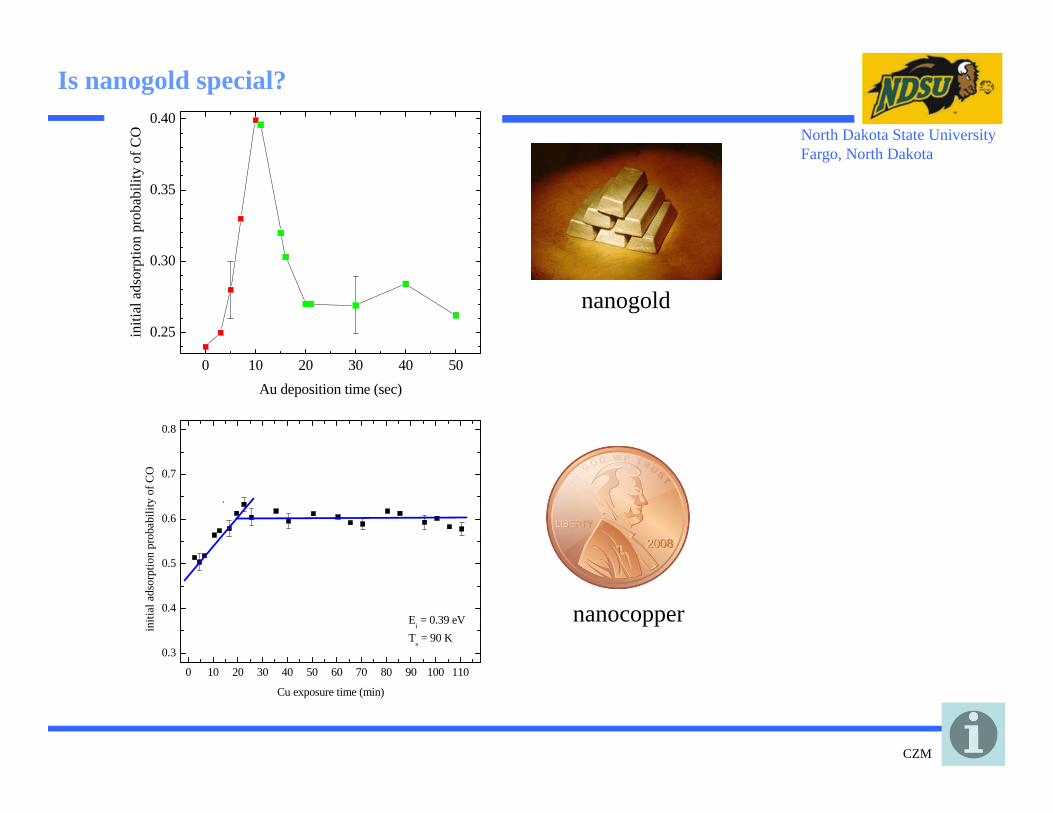
Large gold clusters are non-reactive.

North Dakota State UniversityFargo, North Dakota
Consistency with theory ...
Catalysis Today 72 (2002) 63–78
Sabine Schimpf, Martin Lucas, Christian Mohr, Uwe Rodemerck, Angelika Brückner, Jörg Radnik, Herbert Hofmeister, Peter ClausResult and image from
North Dakota State UniversityFargo, North Dakota
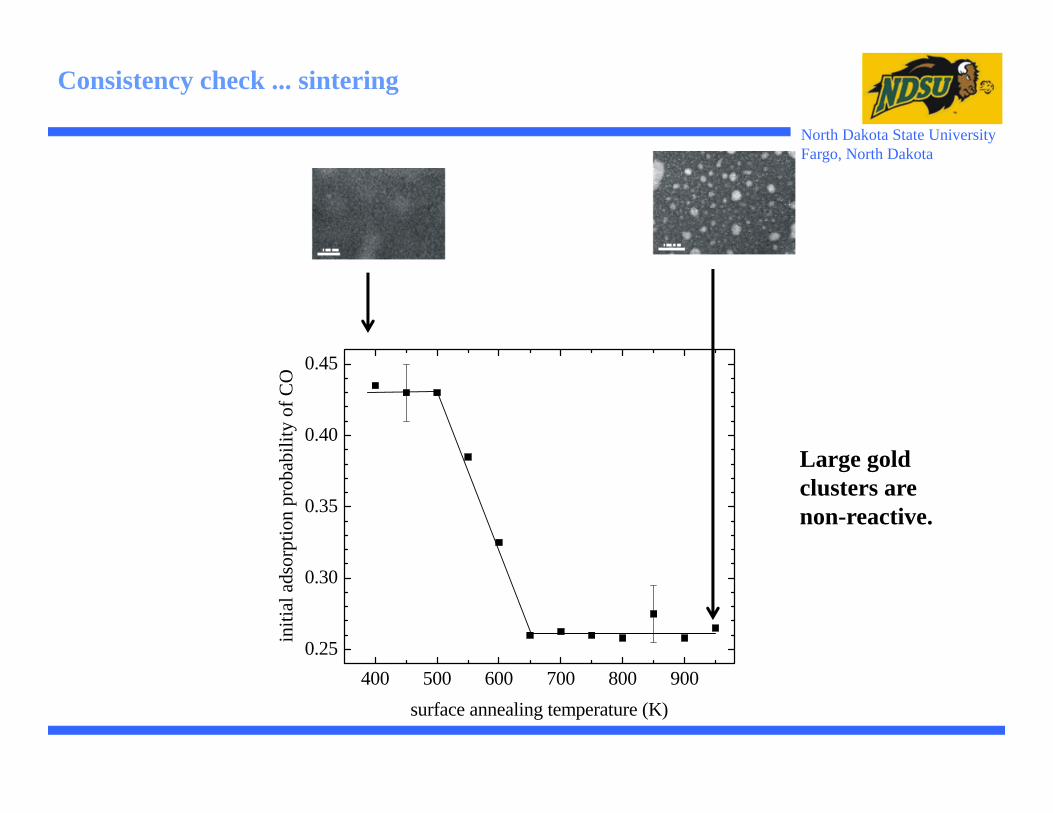
400 500 600 700 800 9000.25
0.30
0.35
0.40
0.45
initi
al a
dsor
ptio
n pr
obab
ility
of C
O
surface annealing temperature (K)
Consistency check ... sintering
Large gold clusters are non-reactive.
North Dakota State UniversityFargo, North Dakota
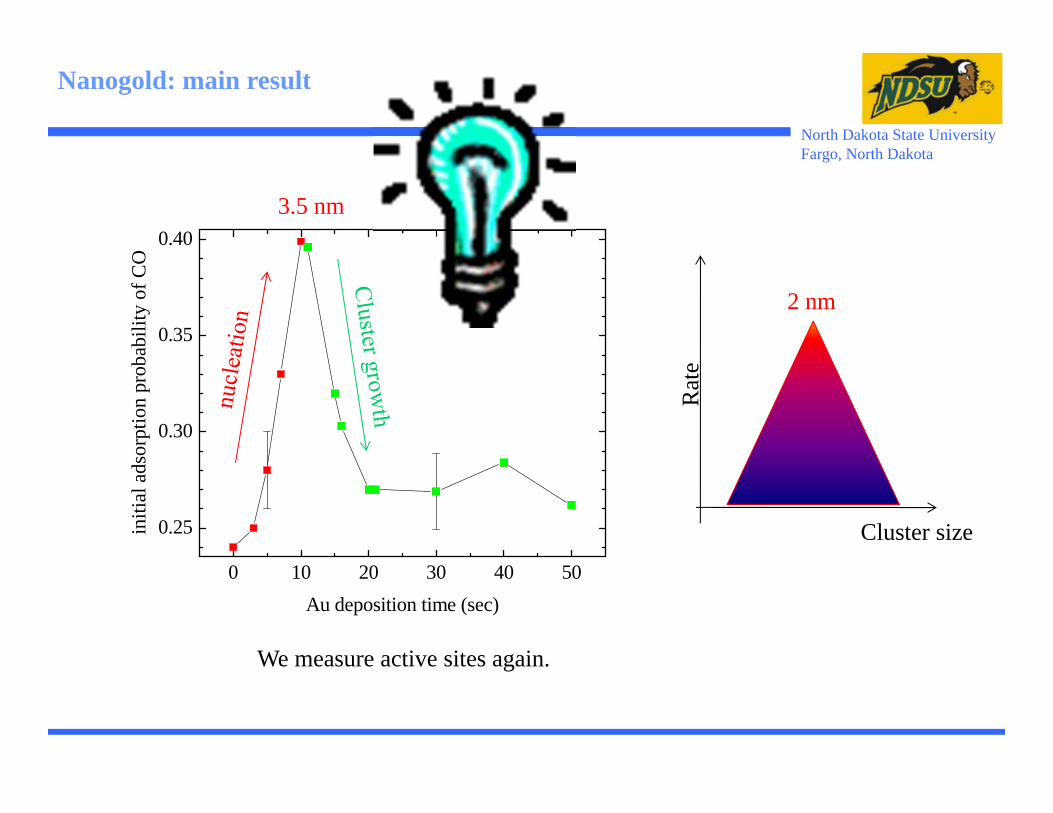
Nanogold: main result
0 10 20 30 40 50
0.25
0.30
0.35
0.40
initi
al a
dsor
ptio
n pr
obab
ility
of C
O
Au deposition time (sec)
3.5 nm
Cluster size
Rat
e
2 nm
We measure active sites again.
North Dakota State UniversityFargo, North Dakota
?
North Dakota State UniversityFargo, North Dakota
nanogold
0 10 20 30 40 50 60 70 80 90 100 110
0.3
0.4
0.5
0.6
0.7
0.8
initi
al a
dsor
ptio
n pr
obab
ility
of C
O
Cu exposure time (min)
Ei = 0.39 eVTs = 90 K
nanocopper
Is nanogold special?
0 10 20 30 40 50
0.25
0.30
0.35
0.40
initi
al a
dsor
ptio
n pr
obab
ility
of C
O
Au deposition time (sec)
CZM
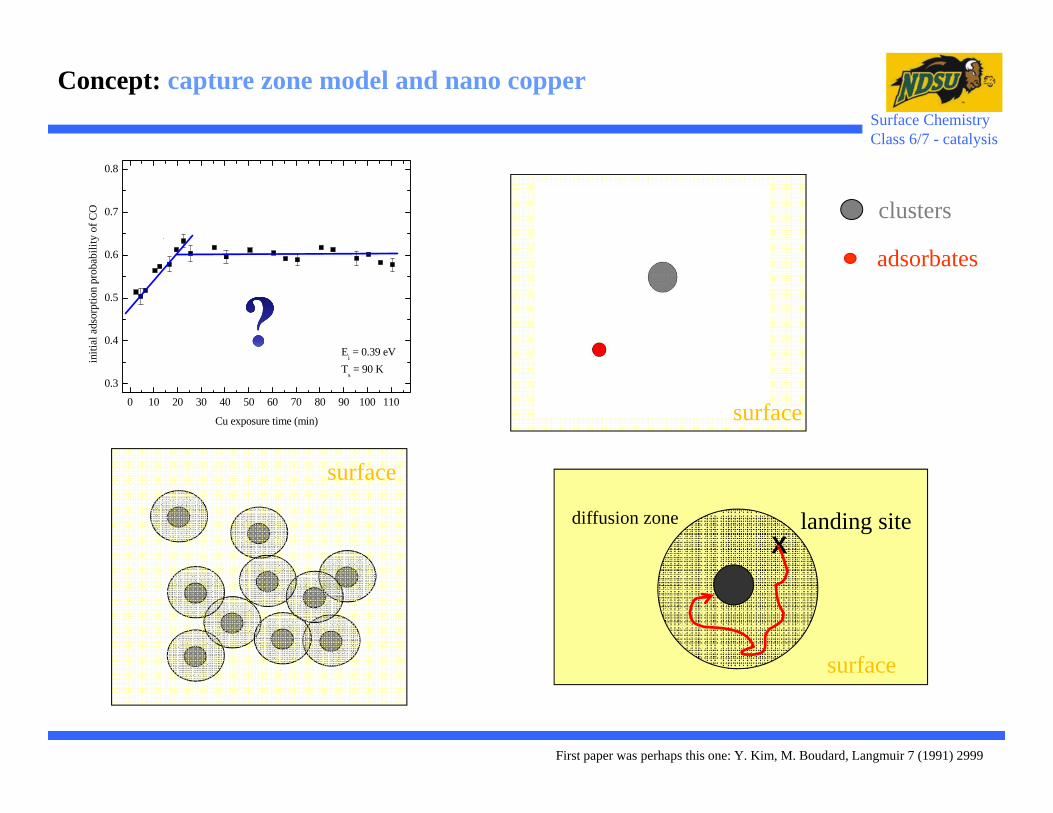
First paper was perhaps this one: Y. Kim, M. Boudard, Langmuir 7 (1991) 2999
landing siteX
surface
diffusion zone
Concept: capture zone model and nano copperSurface ChemistryClass 6/7 - catalysis
0 10 20 30 40 50 60 70 80 90 100 110
0.3
0.4
0.5
0.6
0.7
0.8
initi
al a
dsor
ptio
n pr
obab
ility
of C
O
Cu exposure time (min)
Ei = 0.39 eV
Ts = 90 K
surface
clusters
adsorbates
surface
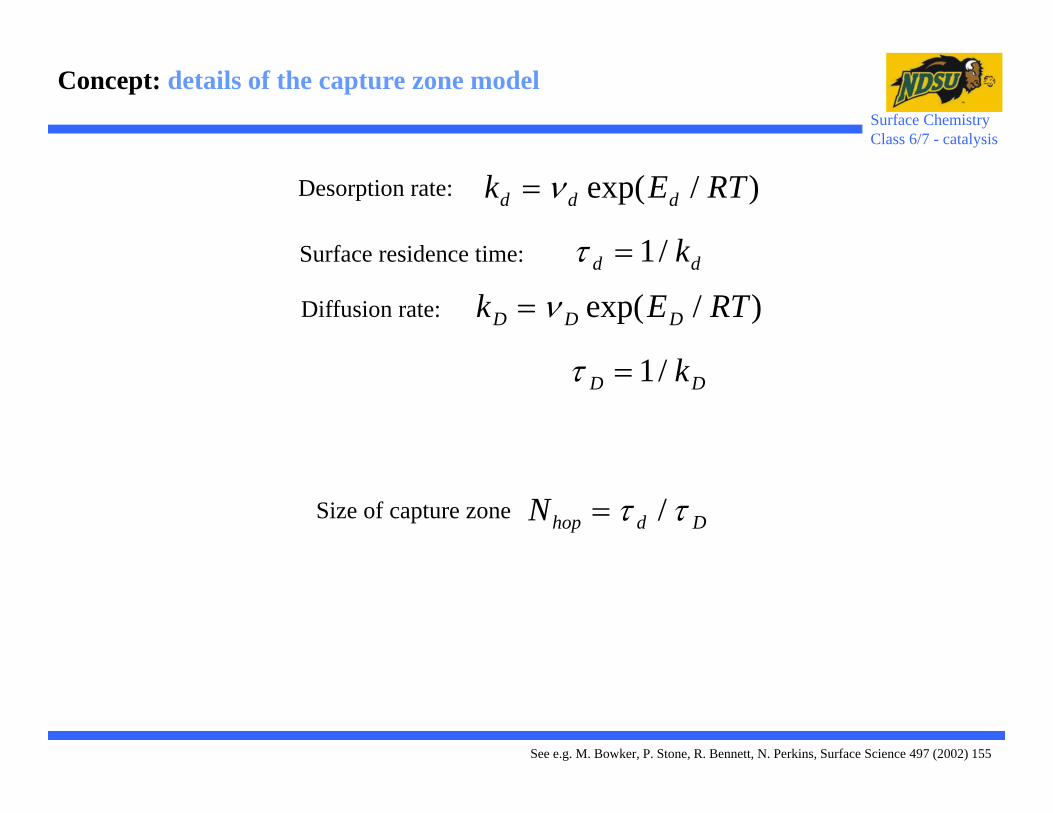
Diffusion rate: k E RTD D D= ν exp( / )
τ D Dk= 1/
Desorption rate:
Surface residence time:
k E RTd d d= ν exp( / )
τ d dk= 1/
See e.g. M. Bowker, P. Stone, R. Bennett, N. Perkins, Surface Science 497 (2002) 155
Size of capture zone Nhop d D= τ τ/
Concept: details of the capture zone modelSurface ChemistryClass 6/7 - catalysis
North Dakota State UniversityFargo, North Dakota
D.W. Goodman(1945-2012)
Θ

North Dakota State UniversityFargo, North Dakota
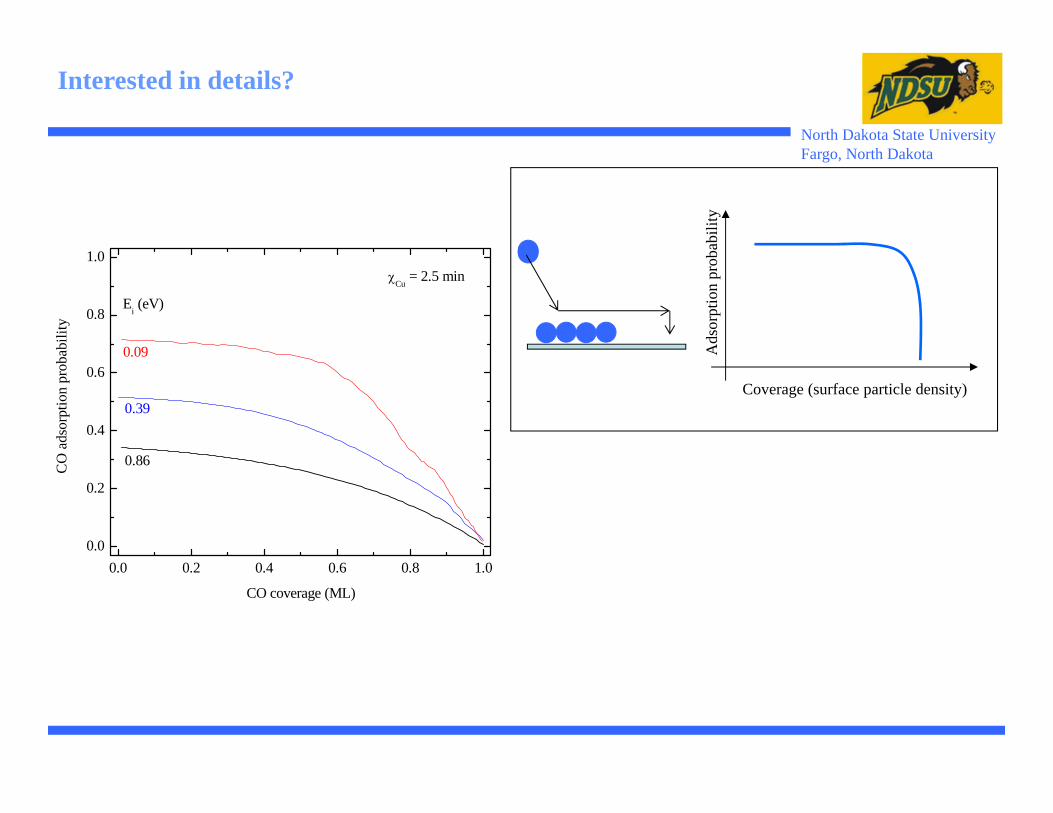
Interested in details?
0.0 0.2 0.4 0.6 0.8 1.00.0
0.2
0.4
0.6
0.8
1.0
CO
ads
orpt
ion
prob
abili
ty
CO coverage (ML)
0.09
0.39
0.86
χCu = 2.5 min
Ei (eV)
North Dakota State UniversityFargo, North Dakota
Interested in details?
0.0 0.2 0.4 0.6 0.8 1.00.0
0.2
0.4
0.6
0.8
1.0
CO
ads
orpt
ion
prob
abili
ty
CO coverage (ML)
0.09
0.39
0.86
χCu = 2.5 min
Ei (eV)
Ads
orpt
ion
prob
abili
ty
Coverage (surface particle density)
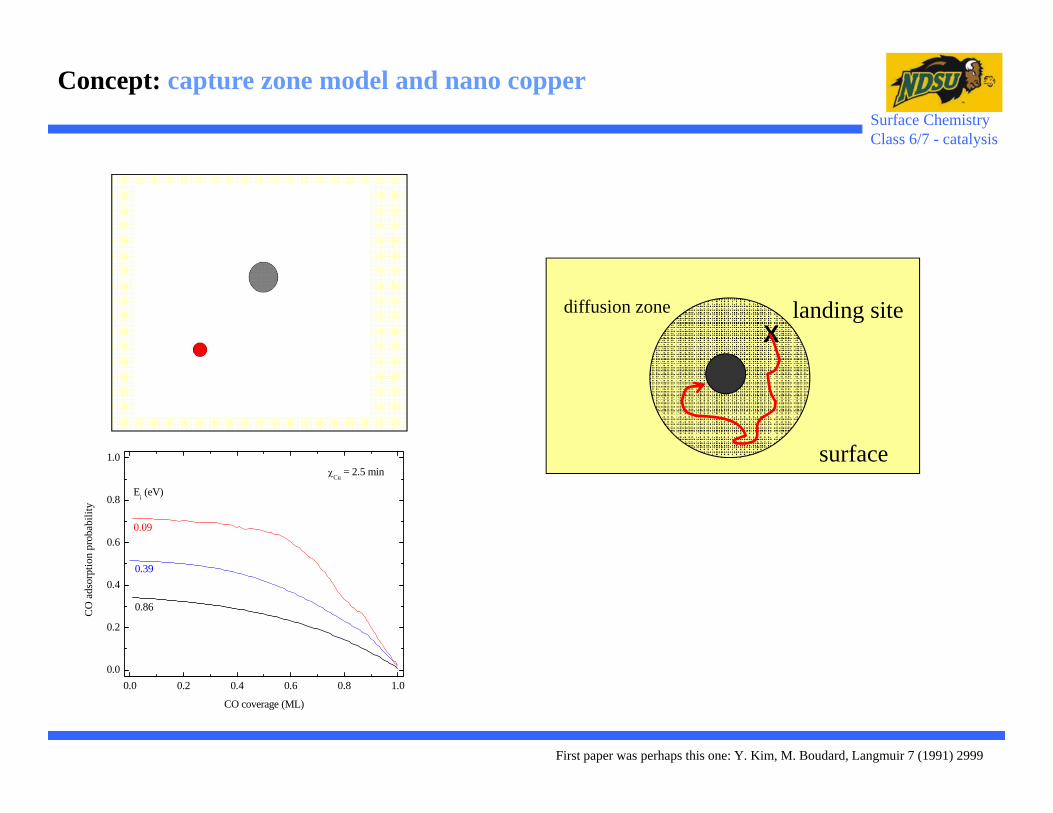
First paper was perhaps this one: Y. Kim, M. Boudard, Langmuir 7 (1991) 2999
landing siteX
surface
diffusion zone
Concept: capture zone model and nano copperSurface ChemistryClass 6/7 - catalysis
0.0 0.2 0.4 0.6 0.8 1.00.0
0.2
0.4
0.6
0.8
1.0
CO
ads
orpt
ion
prob
abili
ty
CO coverage (ML)
0.09
0.39
0.86
χCu = 2.5 min
Ei (eV)
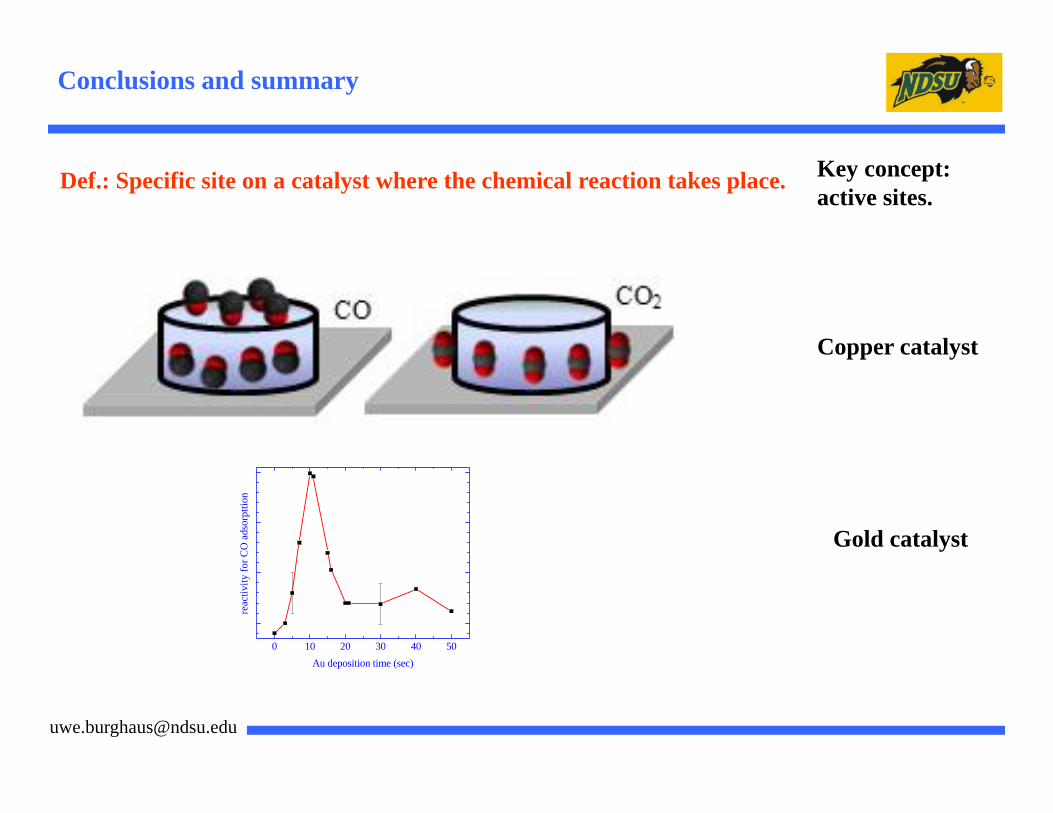
Def.: Specific site on a catalyst where the chemical reaction takes place. Key concept:active sites.
Conclusions and summary
Copper catalyst
0 10 20 30 40 50
reac
tivity
for C
O a
dsor
pttio
n
Au deposition time (sec)
Gold catalyst

So what?
BRIM™ - discovering the edge
http://www.topsoe.com/Research/BRIM_story.aspx
Outlook
Images and text from Haldor Topsoe.

The team
Cu and Au projects - NDSUEvgueni KadossovJunjun ShanMallikharjuna KomarneniAshish ChakradharJordan Schmidt
Berkeley - samplesStephano CabriniScott Dhuey
Chicago - samplesLeonidas OcolaDan Rosenmann
Brookhaven - SEMMing Lu
Perhaps useful for student homework assignments:
http://www.uweburghaus.us/publications/publications.html
Identifying rims along nano-sized clusters as catalytically active sites – the case of CuOx/silica model catalysts nanofabricated by electron beam lithography,Chemical Physics Letters, 544 (2012) 70-72,by A. Chakradhar, J. Shan, M.R. Komarneni, M. Lu, U. Burghaus
Rim effects in the adsorption of CO2 on silica supported copper oxide clusters - utilizing electron beam lithography,Journal of Physical Chemistry C, in pressby J. Shan, A. Chakradhar, M. Komarneni, U. Burghaus
Adsorption dynamics of CO on copper and gold clusters supported on silica - how special is nanogold?,Chem. Phys. Lett., 517 (2011) 59-61,by J. Shan, K. Komarneni, U. Burghaus
Adsorption kinetics and dynamics of CO on silica supported Au nanoclusters-utilizing physical vapor-deposition and electron beam lithography Journal of Molecular Catalysis A: Chemical 321 (2010) 101-109by E. Kadossov, S. Cabrini, U. Burghaus
Short summaries
More details
http://www.uweburghaus.us/publications/NSFCAREERPapers.pdf Complete list of our EBL papers
Complete publication list

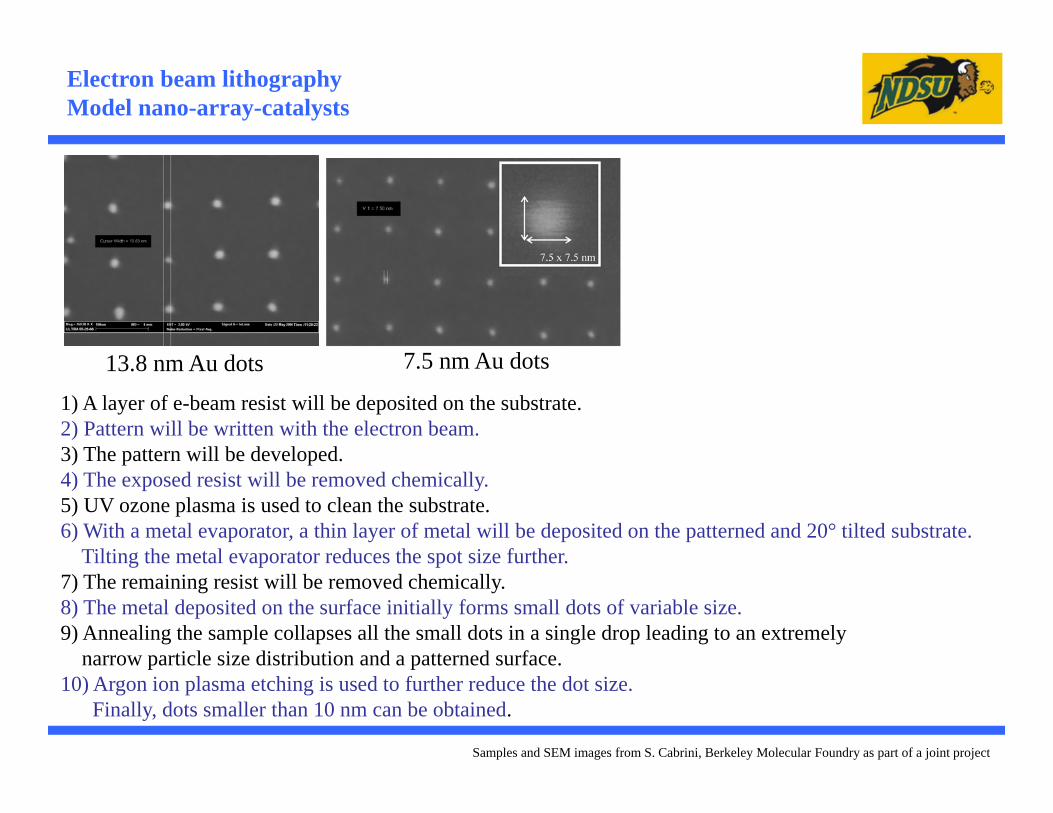
Electron beam lithographyModel nano-array-catalysts
13.8 nm Au dots 1) A layer of e-beam resist will be deposited on the substrate.2) Pattern will be written with the electron beam. 3) The pattern will be developed. 4) The exposed resist will be removed chemically.5) UV ozone plasma is used to clean the substrate. 6) With a metal evaporator, a thin layer of metal will be deposited on the patterned and 20° tilted substrate.
Tilting the metal evaporator reduces the spot size further. 7) The remaining resist will be removed chemically.8) The metal deposited on the surface initially forms small dots of variable size. 9) Annealing the sample collapses all the small dots in a single drop leading to an extremely
narrow particle size distribution and a patterned surface. 10) Argon ion plasma etching is used to further reduce the dot size.
Finally, dots smaller than 10 nm can be obtained.
7.5 nm Au dots
Samples and SEM images from S. Cabrini, Berkeley Molecular Foundry as part of a joint project