sd team 22: design of the formula sae race car suspension
TRANSCRIPT

EML 4905 Senior Design Project
A B.S. THESIS
PREPARED IN PARTIAL FULFILLMENT OF THE
REQUIREMENT FOR THE DEGREE OF
BACHELOR OF SCIENCE
IN
MECHANICAL ENGINEERING
Design of a FSAE Race Suspension
Final Report
Luis Rojas
Daniel Pelaez
Marco Diaz
Advisor: Dr. Andres Tremante
April 18, 2016
This B.S. thesis is written in partial fulfillment of the requirements in EML 4905.
The contents represent the opinion of the authors and not the Department of
Mechanical and Materials Engineering.

ii
Ethics Statement and Signatures
The work submitted in this document is solely prepared by a team consisting of Luis Rojas, Daniel
Pelaez, and Marco Diaz and it is original. Excerpts from others’ work have been clearly identified,
their work acknowledged within the text and listed in the list of references. All of the engineering
drawings, computer programs, formulations, design work, prototype development and testing
reported in this document are also original and prepared by the same team of students.
Luis Rojas
Team Leader
Marco Diaz
Team Member
Daniel Pelaez
Team Member
Dr. Andres Tremante
Faculty Advisor
iii
Table of Contents
Cover Page ....................................................................................................................................... i
Ethics Statement and Signatures ..................................................................................................... ii
Table of Contents ........................................................................................................................... iii
List of Figures ................................................................................................................................ vi
List of Tables ............................................................................................................................... viii
Abstract ........................................................................................................................................... 1
1. Introduction ................................................................................................................................. 2
1.1 Problem Statement ................................................................................................................ 2
1.2 Motivation ............................................................................................................................. 2
1.3 Literature Survey .................................................................................................................. 3
1.4 Survey of Related Standards ................................................................................................. 7
1.5 Discussion ............................................................................................................................. 8
2. Project Formulation .................................................................................................................... 8
2.1 Overview ............................................................................................................................... 8
2.2 Project Objectives ................................................................................................................. 8
2.3 Design Specifications............................................................................................................ 9
2.4 Addressing Global Design .................................................................................................. 10
3. Design Alternatives ................................................................................................................... 10
3.1 Overview of Conceptual Designs Developed ..................................................................... 10
3.2 Design Alternative 1 ........................................................................................................... 11
3.3 Design Alternative 2 ........................................................................................................... 12
4. Project Management ................................................................................................................. 14
4.1 Overview ............................................................................................................................. 14
4.2 Breakdown of Work into Specific Tasks and Responsibilities ........................................... 14
4.3 Gantt Chart for the Organization of Work and Timeline .................................................... 15
4.4 Patent/Copyright Application ............................................................................................. 15
4.5 Commercialization of the Final Product ............................................................................. 15
4.6 Discussion ........................................................................................................................... 16
iv
5. Engineering Design Analysis .................................................................................................... 16
5.1 Overview ............................................................................................................................. 16
5.2 Kinematic and Force Analysis ............................................................................................ 19
5.3 Dynamic/Vibration Analysis of the System ....................................................................... 27
5.4 Structural Design ................................................................................................................ 32
5.5 Stress Analysis .................................................................................................................... 33
5.5.1 Uprights........................................................................................................................ 33
5.5.2 Hubs ............................................................................................................................. 37
5.5.3 A-Arms ........................................................................................................................ 39
5.5.4 Bell Cranks................................................................................................................... 39
5.5.6 Stress Analysis Conclusion .......................................................................................... 42
5.6 Material Selection ............................................................................................................... 42
6. Prototype Construction ............................................................................................................. 44
6.1 Overview ............................................................................................................................. 44
6.2 Description of Prototype ..................................................................................................... 44
6.3 Prototype Design ................................................................................................................. 45
6.3.1 Overview ...................................................................................................................... 45
6.3.2 Rim and Tire ................................................................................................................ 46
6.3.3 Wheel Hub ................................................................................................................... 47
6.3.4 Upright ......................................................................................................................... 49
6.4 Construction ........................................................................................................................ 49
6.5 Prototype Cost Analysis ...................................................................................................... 51
7. Testing and Evaluation ............................................................................................................. 54
7.1 Overview ............................................................................................................................. 54
7.2 Design of Experiments - Description of Experiments ........................................................ 54
7.3 Evaluation of Experimental Results.................................................................................... 56
8. Design Considerations .............................................................................................................. 57
8.1 Health and Safety ................................................................................................................ 57
8.2 Assembly and Disassembly ................................................................................................ 57
v
8.3 Manufacturability ................................................................................................................ 57
8.4 Maintenance of the System ................................................................................................. 58
8.5 Environmental Impact ......................................................................................................... 58
9. Design Experience .................................................................................................................... 58
9.1 Overview ............................................................................................................................. 58
9.2 Standards Used in the Project ............................................................................................. 59
9.3 Impact of Design in a Global and Societal Context ............................................................ 59
9.4 Professional and Ethical Responsibility .............................................................................. 60
9.5 Life-Long Learning Experience .......................................................................................... 60
10. Conclusion .............................................................................................................................. 60
10.1 Conclusion and Discussion ............................................................................................... 60
10.2 Evaluation of Integrated Global Design Aspects .............................................................. 61
10.3 Evaluation of Intangible Experiences ............................................................................... 62
10.4 Patent/Copyright Application ........................................................................................... 63
10.5 Commercialization Prospects of the Product .................................................................... 63
10.6 Future Work ...................................................................................................................... 63
References ..................................................................................................................................... 64
Appendices .................................................................................................................................... 65
Appendix A: 2015-2016 Formula SAE Rules .......................................................................... 65
Appendix B: Milliken and Milliken Race Car Vehicle Dynamics ........................................... 75
Appendix C: Calspan TTC Data ............................................................................................... 81

vi
List of Figures
Figure 1. FIU FSAE Overhead cad model of car ............................................................................ 3
Figure 2. King-pin inclination angle ............................................................................................... 5
Figure 3. Caster angle ..................................................................................................................... 5
Figure 4. Toe-in settings ................................................................................................................. 6
Figure 5. Camber angle ................................................................................................................... 6
Figure 6. Aluminum mount for carbon fiber tubing rev1 ............................................................. 11
Figure 7. Vehicle upright rev 1 ..................................................................................................... 12
Figure 8 Aluminum mount for carbon fiber tubing rev 2 ............................................................. 13
Figure 9. Vehicle uprights rev 2 ................................................................................................... 13
Figure 10. Layout for skid pad testing course............................................................................... 17
Figure 11. Acceleration track for SAE competition ..................................................................... 18
Figure 12. Tire test apparatus........................................................................................................ 19
Figure 13. Lateral force vs. slip angle........................................................................................... 20
Figure 14. Internal Forces on A-arms form external forces .......................................................... 21
Figure 15. Front a-arm geometry with internal and external forces ............................................ 22
Figure 16. Rear A-Arm geometry with external and internal forces. .......................................... 23
Figure 17. A-arm suspension link geometry with internal and external forces ............................ 24
Figure 18. Free body diagram of suspension assembly ................................................................ 27
Figure 19. Vibrational dynamic schematic ................................................................................... 28
Figure 20. Damped system displacements .................................................................................... 29
Figure 21. Manufacturer’s tire data .............................................................................................. 30
Figure 22. Upright deflection simulation ...................................................................................... 34
Figure 23. Upright life-cycle calculation ...................................................................................... 35
Figure 24. Upright Hyperworks simulation .................................................................................. 36
Figure 25. Manufactured Uprights ................................................................................................ 36
Figure 26. Modified hub ............................................................................................................... 37
Figure 27. Original hub ................................................................................................................. 38
Figure 28. Manufactured hubs ...................................................................................................... 38
Figure 29. Final revision rear lower A-arm .................................................................................. 39
Figure 30. Original bellcrank ........................................................................................................ 40

vii
Figure 31. Newest bellcrank ......................................................................................................... 41
Figure 32. Manufactured bellcranks ............................................................................................. 41
Figure 33. Un-sprung weight concept ........................................................................................... 43
Figure 34. Formula SAE car front suspension schematic ............................................................. 46
Figure 35. Live spindle setup schematic (Jeepz.com) .................................................................. 47
Figure 36. Dead-spindle setup schematic (S10forum.com) .......................................................... 48
Figure 37. Upright mounting points.............................................................................................. 50
Figure 38. Strain gauge on A-arm................................................................................................. 55
Figure 39. Upper and lower A-arms with strain gauges ............................................................... 55

viii
List of Tables
Table 1. FIU FSAE suspension team Gantt chart ......................................................................... 15
Table 2. Target vs. previous performance outputs for skid pad testing ........................................ 16
Table 3. Vibrational dynamic nomenclature ................................................................................. 28
Table 4. Vehicle spring and damping constants calculator........................................................... 31
Table 5. Ride Frequency Calculation............................................................................................ 32
Table 6. Weight reduction in uprights and hubs ........................................................................... 48
Table 7. Cost Analysis without discounts ..................................................................................... 52
Table 8. Cost analysis with discounts and savings ....................................................................... 53
Table 9. Scoring Calculation......................................................................................................... 56

1
Abstract
The team will be redesigning the 2016 suspension package for the FIU Formula SAE
prototype vehicle. Throughout the development of the suspension package, factors taken into
account will include vehicle dynamics, packaging, reliability, ease of manufacturing and
maintenance, and performance. The project will be divided into 4 phases: testing and validation of
the 2015 suspension package, analysis of 2015 data and upcoming design requirements,
manufacturing of new and improved components, and testing and validation of the 2016
suspension package. All design iterations stem from the experience of previous team members,
judge panel criticism and recommendations, and the results from previous FIU Formula SAE
testing sessions and competitions.

2
1. Introduction
1.1 Problem Statement
In order to compete with a continuously improving car, the Formula SAE team must
resolve existing problems, as well as design and modify new components. For the suspension, the
entire hub assembly is going to be redesigned as well as the geometry of the suspension. This
encompasses everything from the uprights and coil overs, down to the wheels and tires. In order
to achieve such a task, existing problems must be addressed.
These problems present themselves as the wheel bearings. In the previous design, two
wheel bearings were used in order to support the loads of the car. However, bearing and load
placements proved to be problematic, leading to the majority of the forces from driving being
placed on only one bearing. This in turn, has led the group to modify the entire hub assembly and
bearing selection.
In the Formula SAE competition held in Michigan, judges critique all cars and provide
scores. These scores indicate how well a team is doing on design and engineering logic. In the
past, FIU’s Formula SAE team has been made aware of the need for more advanced and innovative
designs through the judges’ scoring. This group plans on innovating an advanced suspension
through new materials, such as carbon fiber, and weight saving techniques.
1.2 Motivation
Formula SAE provides undergraduate engineering students with a unique experience. The
competition gives students the chance to be in an industry-like environment where they are met
with real world engineering challenges, design decisions and a competitive atmosphere. With this
environment, students develop and practice their engineering skills, which later prove valuable to
the automotive industry. The competition consists of a static portion that tests the teams
engineering decisions, and their designs are judged by an industry board. A dynamic portion of
testing is also conducted where the vehicle performance is tested against competing teams and
then judged on various factors. Top scoring teams acquire global recognition and many industry
sponsors. This recognition allows the team to develop their team using the resources gained
through monetary donations, services, and or mentorship provided by sponsors.

3
Scoring within the top 50 teams not only requires the help of sponsors, but more
importantly, a vehicle designed using sound engineering logic that performs accordingly to the
team’s standards. Having a reliable suspension package is essential to scoring high in the static
and dynamic portions of the event, as the competition favors acceleration and cornering rather than
top speed. A light-weight suspension package that produces repeatable results, while utilizing
maximum tire performance, is essential to fine tuning a vehicle in order to acquire a top 50 spot.
1.3 Literature Survey
The design of the Formula SAE suspension and brake system is regulated by the rules of the
annual SAE competition. The improved designs are governed by these rules which require them
to be cost effective and beneficial to the overall performance of the car.
A) Suspension
Most FSAE teams use a double A-arm suspension with a push rod or a pull rod to transfer the
loads to the rocker shock absorber system. Pull rods are better for lowering the center of gravity
because the strut assembly sits closer to the ground. A lower center of gravity leads to better
handling. The push rod suspension type places the strut assembly higher, but it allows for a higher
chassis distance from the ground. This means that the choice of push rod or pull rod is dependent
on the design of the chassis, which already requires a push rod in the front and a pull rod in the
rear.
Figure 1. FIU FSAE Overhead cad model of car

4
B) Brakes
The brakes are mechanical components of the car that convert mechanical energy into heat
energy. In addition to this energy conversion, brakes inherently impose forces on the car’s
suspension. These forces greatly affect how the car behaves in addition to the calculations required
in determining what components are appropriate.
Brakes must be designed and calibrated in a fashion that functions well for the car, and for
the driver as well. Brake smoothness is paramount to the driver’s feel for the car and road and
comes from well aligned brake pad and rotor faces. Issues with surface finish can often time be
resolved via rotor facing.
C) Uprights
The uprights are what connect the tire, wheel, hub assembly, and brakes to the A-arms of the car.
These components are very important because they affect the king-pin inclination, caster, wheel
and tire toe settings, and camber.
In order to fully understand the importance of the uprights, it is necessary to understand
the following
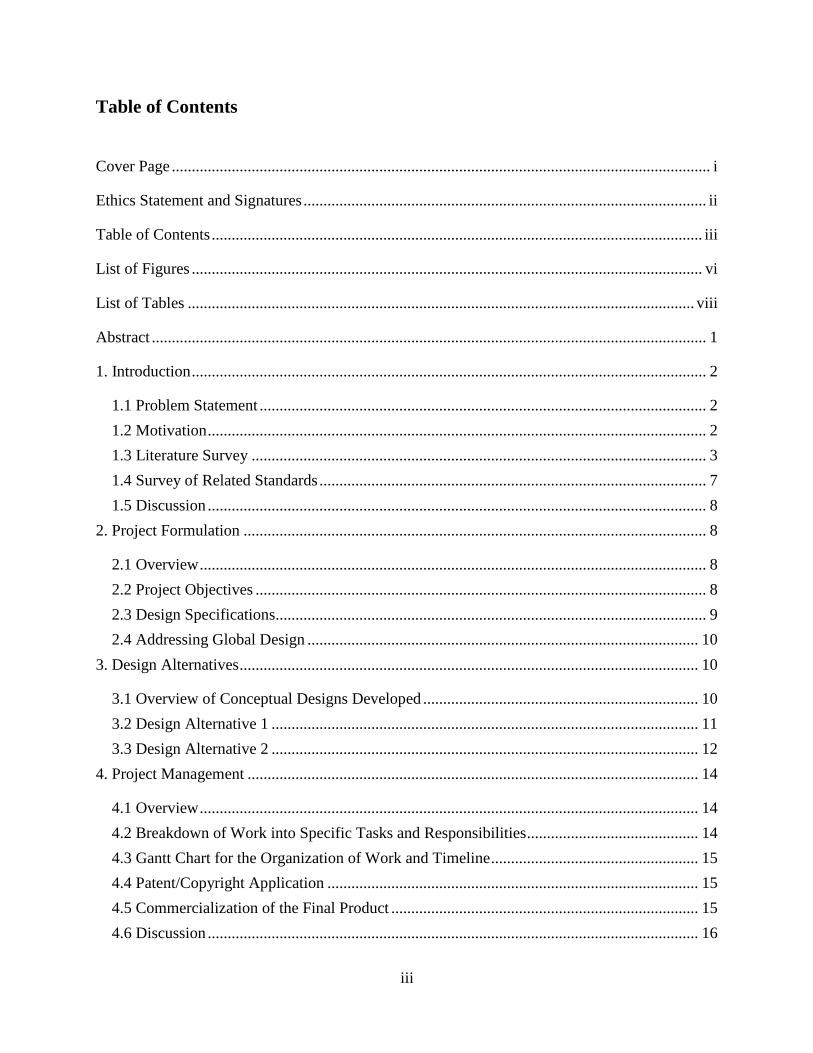
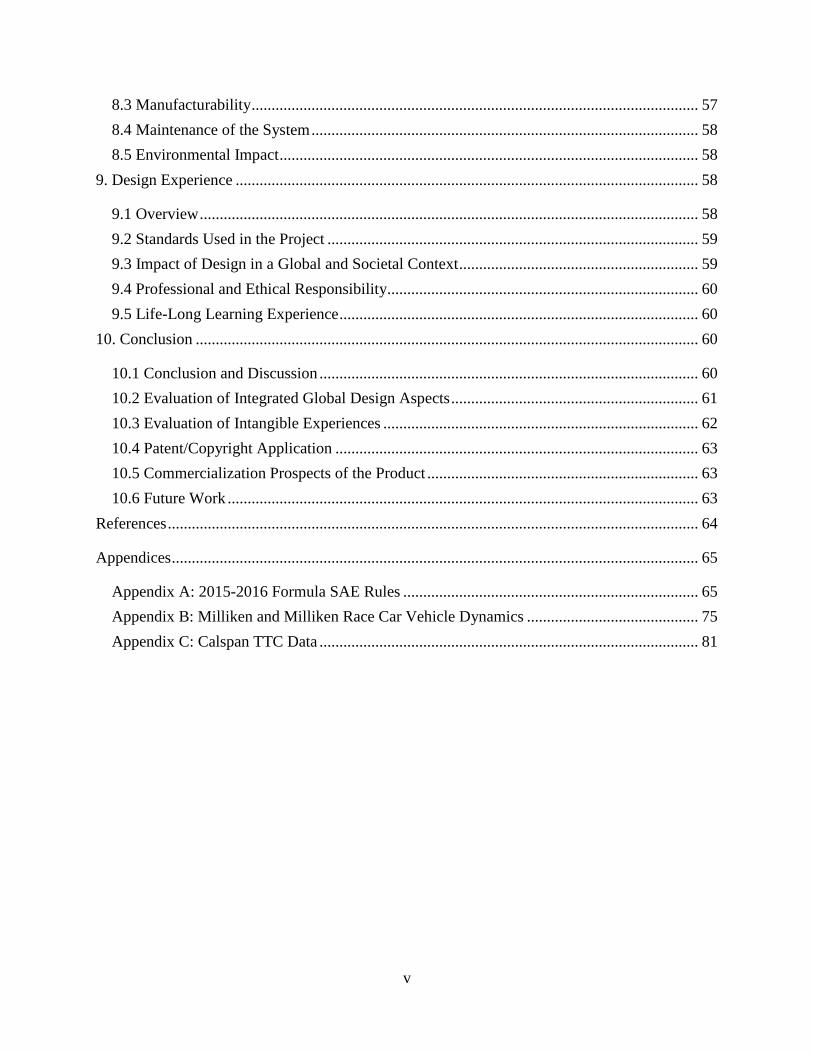
1) Kin-pin inclination: The angle between the centerline, perpendicular to the road, of the
wheel and tire and the centerline of the upright. This angle is relatively small and
determines the vehicle’s ability to return to center, or in other words, straight motion.
5
Figure 2. King-pin inclination angle
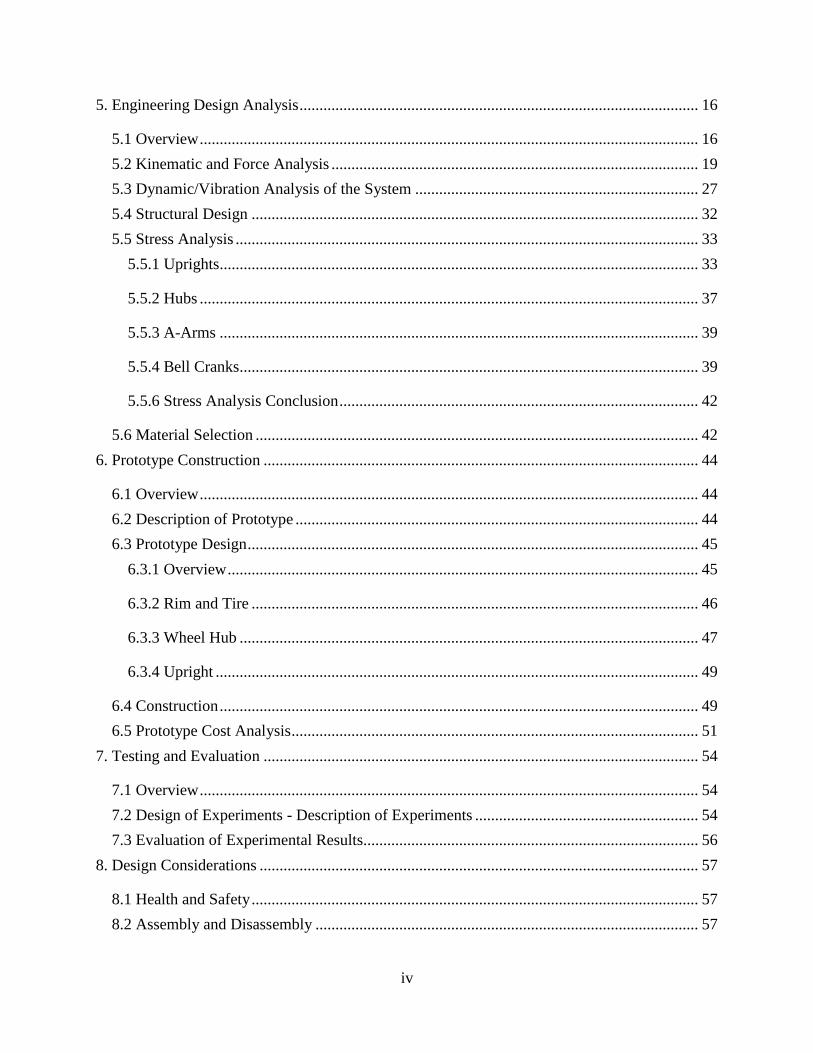
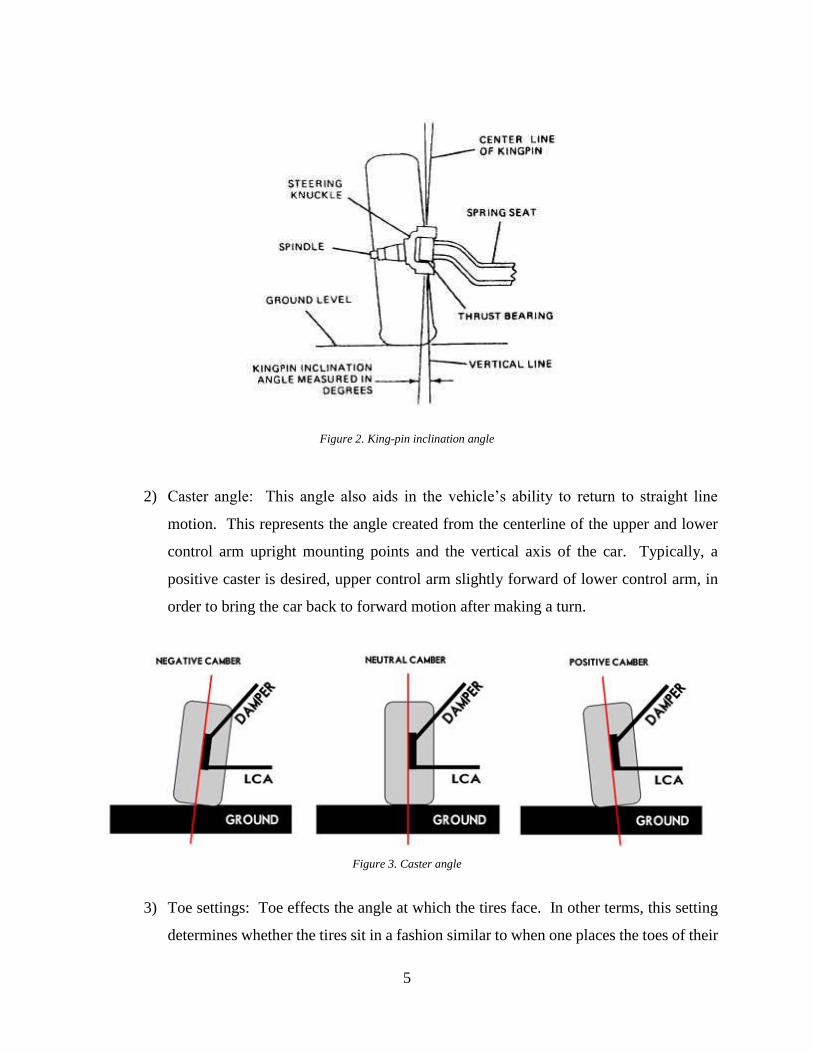
2) Caster angle: This angle also aids in the vehicle’s ability to return to straight line
motion. This represents the angle created from the centerline of the upper and lower
control arm upright mounting points and the vertical axis of the car. Typically, a
positive caster is desired, upper control arm slightly forward of lower control arm, in
order to bring the car back to forward motion after making a turn.
Figure 3. Caster angle
3) Toe settings: Toe effects the angle at which the tires face. In other terms, this setting
determines whether the tires sit in a fashion similar to when one places the toes of their

6
feet inward or outward. An inward toe angle is ideal for rear-wheel drive vehicles,
such as the FIU Formula SAE car, because it enables the tires to straighten in cornering.
This straightening effect is also determined by kingpin inclination.
Figure 4. Toe-in settings
4) Camber: The angle created from the top of the tire and bottom of the tire relative to
the vertical axis represents camber. In racing applications, it is ideal to have a slightly
negative camber in order to accommodate for body roll when performing high speed
turns. This enables the tire to maintain a larger surface contact with the road versus a
positive camber angle, in which less contact would be made with the road.
Figure 5. Camber angle
Aluminum uprights are favored by Formula SAE teams due to the ease of manufacturing
and relatively low cost to weight ratio. However, many teams lack the proper development and
manufacturing capabilities to utilize the low ratio. It should be noted that 7075 aluminum can be
seen as an alternative to 6061 aluminum, as it provides a drastic increase in strength when
7
compared to 6061. However, the cost of the material outweighs the benefits in some cases. For
this reason, many new teams use 6061 because of the cost and availability of it.
Steel uprights are an alternative to aluminum, they produce a stronger, more rigid upright
than aluminum. However, it should be noted that the weight and manufacturing processes
outweigh these benefits. The requirement of welding the steel sheets to construct the upright may
or may not result in an asymmetrical upright, depending on the skill level of the welder and the jig
used. If manufactured correctly, it is a competitive alternative to 6061 aluminum. However, 7075
aluminum outperforms both and if it is available and within budget, is recommended to be used
with the proper design.
1.4 Survey of Related Standards
In order to compete in the international SAE competition held in Michigan for Spring 2016,
the FIU formula team must adhere to all standards set by the Society of Automotive Engineers
(SAE). These standards enable all universities and institutes to compete on a fair playing field.
By setting various parameters constant for all race cars, judges are more capable of determining
which team performed the best in terms of engineering design, manufacturing, and optimization
of their respective formula race cars. The following suspension related restrictions that are held
constant for all teams are as follows:
1) Wheel Base: Must be at least 60 inches.
2) Vehicle Track: Smallest track must be no smaller than 75% of the larger track
3) Suspension Displacements: Must be two inches total wheel travel, one inch jounce, one
inch rebound.
4) Mounting points: All mounting points must be visible to judges, whether in plain sight or
by removing body covers.
5) Wheel Diameter: Wheels of the car must be at least 8 inches in diameter.
These rules come out of Article T, Section 3 of the 2015-16 FSAE rulebook. Additional standards
applied to the project are the ABMA bearing standards. These are particularly useful for
determining the proper bearings for the hub assembly. ASTM standards are the standards of choice
for all materials used on the FSAE car.

8
1.5 Discussion
By reading Section 1 of the report, the reader should attain a general idea of what is being
done for the senior design project. The team will be attending a competition held by the Society
of Automotive Engineers in Detroit, Michigan to showcase their skills in engineering,
manufacturing, and project management. They are doing so by displaying knowledge in all topics
listed in the literature survey as well as topics listed in the survey of standards. Not only are the
members of the suspension team required to display a rich knowledge of the subject matter, but
the entire FIU SAE chapter, as a whole, is to display a great understanding of the racecar and all
of its subsystems.
2. Project Formulation
2.1 Overview
For every mechanical engineering program, it is required to take a class for Senior Design.
Normally, this class is taken shortly before an engineering student’s graduation date. This is done
to ensure the student withholds a certain level of engineering competency necessary to participate
in a highly intensive engineering group project. In order to successfully complete the senior design
class, a specific project must be chosen by a small group of students. There are typically three
categories for senior designs. These three types consist of sponsor driven projects, individually
driven projects, and competition driven projects. This project falls under the category of a
competition driven project, namely the international SAE competition held in Detroit, Michigan.
This section will discuss in detail how the project was formed, its global effect, objectives, and
constraints.
2.2 Project Objectives
The primary goal of the FIU FSAE team is to place within the Top 50 of all participants of
the international SAE competition held in Detroit, Michigan. In order to do so, all members of the
team must be producing continuous results. Thus, leading to a cohesive team dynamic that aids in
the design and manufacturing of the formula car in a timely fashion that permits the testing and
validation of the car to be completed before the competition.
9
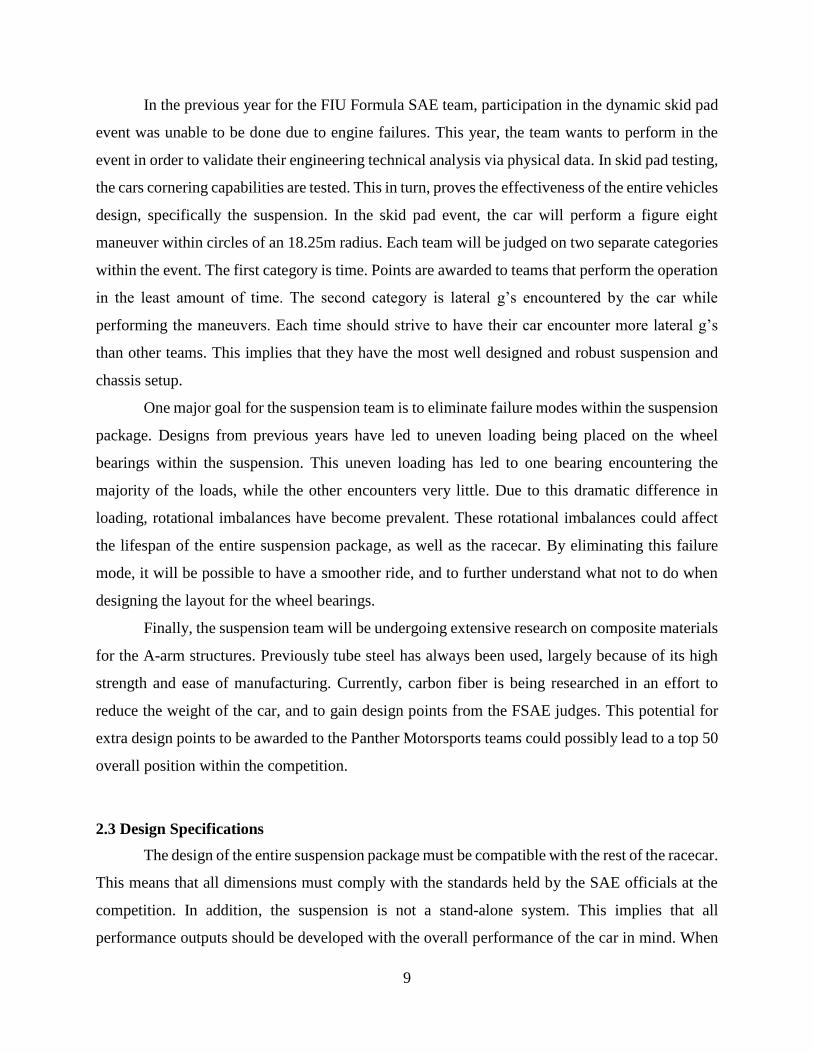
In the previous year for the FIU Formula SAE team, participation in the dynamic skid pad
event was unable to be done due to engine failures. This year, the team wants to perform in the
event in order to validate their engineering technical analysis via physical data. In skid pad testing,
the cars cornering capabilities are tested. This in turn, proves the effectiveness of the entire vehicles
design, specifically the suspension. In the skid pad event, the car will perform a figure eight
maneuver within circles of an 18.25m radius. Each team will be judged on two separate categories
within the event. The first category is time. Points are awarded to teams that perform the operation
in the least amount of time. The second category is lateral g’s encountered by the car while
performing the maneuvers. Each time should strive to have their car encounter more lateral g’s
than other teams. This implies that they have the most well designed and robust suspension and
chassis setup.
One major goal for the suspension team is to eliminate failure modes within the suspension
package. Designs from previous years have led to uneven loading being placed on the wheel
bearings within the suspension. This uneven loading has led to one bearing encountering the
majority of the loads, while the other encounters very little. Due to this dramatic difference in
loading, rotational imbalances have become prevalent. These rotational imbalances could affect
the lifespan of the entire suspension package, as well as the racecar. By eliminating this failure
mode, it will be possible to have a smoother ride, and to further understand what not to do when
designing the layout for the wheel bearings.
Finally, the suspension team will be undergoing extensive research on composite materials
for the A-arm structures. Previously tube steel has always been used, largely because of its high
strength and ease of manufacturing. Currently, carbon fiber is being researched in an effort to
reduce the weight of the car, and to gain design points from the FSAE judges. This potential for
extra design points to be awarded to the Panther Motorsports teams could possibly lead to a top 50
overall position within the competition.
2.3 Design Specifications
The design of the entire suspension package must be compatible with the rest of the racecar.
This means that all dimensions must comply with the standards held by the SAE officials at the
competition. In addition, the suspension is not a stand-alone system. This implies that all
performance outputs should be developed with the overall performance of the car in mind. When

10
designing the suspension, the concept should not only be from the ground up, but also from the
chassis down. This means that no matter what components go into suspension, whether they be A-
arms, shock absorbers, or uprights, they must be able to fit directly on to the chassis. This direct
and secure fit to the chassis will enable the car to perform well in the competition, but to also pass
any inspection.
2.4 Addressing Global Design
Global awareness is addressed with the design of the FSAE suspension package via the
research in advanced materials and methods of reducing weight. As carbon emissions have been
threatening the global environment, the need for more fuel efficient vehicles continues to grow.
One significant way in which fuel consumption and carbon emissions can be reduced, is through
the weight reduction of vehicles. By achieving a lower weight, the engine need not perform at such
high capacity as it would with a high weight vehicle. Therefore, through significant weight savings,
it could be possible to choose a lower displacement engine. Lower displacement engines are
becoming commonplace in the automotive industry, and can be better utilized when powering a
lightweight vehicle. Although the weight savings in a suspension via the use of carbon fiber may
seem marginal, the research done on the carbon fiber could enable the use of it on many other
structural components of an automobile. With these incremental changes, comes a drastic
reduction in weight.
This is applicable across the world because the use of automobiles is greatly increasing in
emerging countries with large populations. Specifically, India and China are continuously trying
to find ways to reduce pollution as much of their population is starting to acquire enough wealth
to enable them to purchase automobiles. The material research performed on the suspension could
be applied to all vehicles in the future, thus leading to more fuel efficient and environmentally
friendly vehicles.
3. Design Alternatives
3.1 Overview of Conceptual Designs Developed
Currently, the main components to be focused on within the suspension package are the
uprights, A-arms, and hubs. With all components mentioned, weight reduction is the target

11
objective. By achieving weight reduction in the components, the Panther Motorsports team will
achieve a significant increase in design competition, as well as a reduction in unsprung weight of
the car. This reduction in unsprung weight of the car will increase the handling capabilities, which
will be displayed in the skid pad event at the competition. All designs made on the suspension will
lead to incremental changes in performance, thus achieving an overall better performance of the
car.
3.2 Design Alternative 1
Much of the engineering work done thus far has been on the A-arms. Currently carbon
fiber is the ideal material of choice. In choosing carbon fiber, aluminum mounts must be used,
which join the carbon fiber tubing to the upright and chassis.
SolidWorks simulations are being performed on the aluminum A-arm mounts in order to
determine the proper design. The main items of concern for the aluminum mounts are structural
resilience, manufacturability, and proper transmission of loading.For the upright, the original
design consisted of an aluminum structure, which joins the wheel hub assembly to the A-arms.
Figure 6. Aluminum mount for carbon fiber tubing rev1

12
The first iteration proved to be unnecessarily heavy and robust. Further iterations have been created
and are undergoing testing.
3.3 Design Alternative 2
After doing testing on the aluminum mounts for the A-arms in SolidWorks, it was
determined that the designed needed to be revised. Specifically, the design called for a change in
geometry for the shock absorber mounts, as well as a greater thickness in order to accommodate
for the extreme loadings encountered when cornering at high rates of speed.
For the aluminum uprights, it was discovered that weight could be greatly reduced by simply
removing material from the aluminum structure. The material was reduced in such a way that it
could still withstand the forces encountered when performing high speed maneuvers. Again,
SolidWorks simulations were performed in order to determine the feasibility of weight and
material reduction.
Figure 7. Vehicle upright rev 1

13
Figure 9. Vehicle uprights rev 2
Figure 8 Aluminum mount for carbon fiber tubing rev 2

14
4. Project Management
4.1 Overview
Designing and manufacturing a Formula SAE car requires a very synchronized project
plan. Not only is the project planning of the suspension components to be a streamlined process,
but the entire design, manufacturing, and testing of the whole car is to be done in a fashion that
promotes efficient and effective time management skills. Being that the Formula SAE competition
is to be held in May, all teams within the FIU SAE chapter are to complete their portions far ahead
the date of the competition in order to perform testing and validation of the fully assembled car.
4.2 Breakdown of Work into Specific Tasks and Responsibilities
All the work put into the redesign and optimization of the suspension package has been
evenly split between all three team members. Although each member has been partially involved
in every component of the project, the specific portions of the project can be broken down in the
following ways. Research and engineering analysis of future designs and materials to be used has
been evenly split between all members. However, the components on which research has been
performed varies between each member. Daniel Pelaez has been the primary researcher and
analysist of all A-arm related components and materials. Luis Rojas and Marco Diaz have been
the primary researchers of forces encountered by the suspension uprights. The group, as a whole,
will be determining the optimum design for the wheel hub and the proper bearing locations. This
is said because previously, the forces on the bearings proved to be unevenly distributed, causing
wear and rotational imbalances.
For sponsor communications, Luis Rojas has been the primary consultant. With his
previous experience as a member of FSAE, he has established relationships with previously
existing sponsors, thus enabling him to acquire additional funds for future manufacturing to be
performed on the suspension components. Additional information required to perform analysis on
the suspension stems from the previous members of FIU’s FSAE team. The participation of all
other Formula SAE members will be required in order to perform testing and validation of the
suspension components. This is because testing and validation of the suspension components can
only be performed if the entire car is assembled and running at a competition-ready state.

15
4.3 Gantt Chart for the Organization of Work and Timeline
Table 1. FIU FSAE suspension team Gantt chart
Currently, all aspects of the project are up to date. The month of December will be critical,
being that it is the period of transition from research and design into manufacturing. As of now,
one of the only obstacles that could possibly slow down operations, would be material vendor lead
time. Materials have not yet been ordered, but soon will be as analysis and design begins to come
to an end.
4.4 Patent/Copyright Application
Being that the FIU Formula SAE chapter is an organization of FIU, there will be no
submission for any patents or applications. All work done by the chapter is property of Florida
International University. However, all knowledge acquired from the experiences encountered
through SAE will be carried forward through each member. This will aid in advancing the careers
of former members, as well as the companies in which they find employment.
4.5 Commercialization of the Final Product
The entire premise of the Formula SAE competition held in Michigan is for engineering
students to build a racecar capable of being used as a vehicle for recreational weekend racers.
Therefore, all drawings and instructions created by much university must be very accurate,
concise, and efficient in order for any potential weekend racer to build a similar car. Although the
SAE Formula cars will not be sold commercially, the skills acquired from the experiences had in
SAE will enable all members, to perform in an industrial environment, possibly designing and
manufacturing commercial vehicles.
Aug. 14 Sep. 14 Oct. 14 Nov. 14 Dec. 14 Jan. 15 Feb. 15 Mar. 15 Apr. 15 15-May
Completed In Progress To Be Completed
FSAE Competition
Project Timeline
Manufacturing
Testing & Validation
Research
Preliminary Model
Project Analysis
Component Integration
Problem Statement

16
4.6 Discussion
All work has been evenly distributed between all three members of the senior design group.
As design and analysis begin to come to an end, the team begins to transition into the
manufacturing phase. Again, the work needed to be done will be evenly distributed between all
three members. It is likely that all aspects in which each member has been specializing in for
research and analysis will be their area of focus for manufacturing as well. However, depending
on time constraints and available time for team members, it is possible that each member will have
a hand in every portion of manufacturing in order to maintain a streamlined flow of productivity.
5. Engineering Design Analysis
5.1 Overview
In order to being the design of a Formula SAE Vehicle and its components realistic goals
are set by the team based on the budget available and the time the team has to design and
manufacture the vehicle. As a younger team Panther Motorsports looked towards teams that have
placed in the top 50 that have a similar engine to the 2015 vehicle, with information collected on
similar teams a benchmark is created to design around, those benchmarks being as follows:
Table 2. Target vs. previous performance outputs for skid pad testing
Top 45 (target) Panther Motorsports 2015
Skid Pad (G’s) 0.92 0.81
Acceleration (G’s) 0.63 0.45
With these performance goals in mind, tire choice is then considered. It was decided to
remain with the same tires that were used on the previous vehicle because the chassis was
optimized with these tires in mind and the performance goals that have been set take the tire
performance into account for the current season and the following seasons. With this in mind the
current vehicles characteristics such as the weight of the vehicle, with the driver inside, and the
weight distribution is recorded for future use in analysis and is used to validate the theoretical
values from the previous design (prototype 1) and validate them using very basic methods.

17
During the Formula SAE Design phase the car was tested in in the two criterion specified
in the performance goals. To accomplish this a simple accelerometer was attached to the vehicle
and was connected to an on board data acquisition system. After the installation of the system the
vehicle was put through the same tests that are performed in the Formula SAE competition. The
competitions track layout stays the same for both the skid pad, acceleration shown below, although
there is not a braking test used for testing the performance of the brakes rather than for safety for
the purpose of this report the acceleration track will be used for braking tests.
Figure 10. Layout for skid pad testing course

18
After performing the skid pad and braking tests it was observed that the maximum lateral
acceleration achieved by prototype 1 is 0.81 G’s on the skid pad (accelerating and cornering), 0.45
G’s accelerating in a straight line and 0.65 G’s while braking. In comparison to other teams in the
competition the values obtained are significantly lower than their own however the level of
performance is normal for teams such as Panther Motorsports.
During the design phase the performance goals that are set for the team in the following
years were taking into account considering how significantly higher they are in respect to the
current performance numbers that were recorded in the tests. In order to have a reliable set of
uprights and hubs the safety factor was increased in order to safeguard against any critical failure
the system may be subjected to. The increased safety factor will increase the weight of the system
slightly but this was a small trade off to obtain a package that will not have to be replaced for the
next Formula SAE vehicle, allowing the efforts of the team and the resources to be used towards
other parts of the vehicle.
For the A-arms, the design is constrained to the attachment locations on the chassis. In
addition, various specifications of the suspension are governed by the rules and regulations of the
Formula SAE competition standards. Two important parameters that must remain fixed are the
wheelbase and the track distance. In order to successfully determine how the car performs under
racing conditions, parameters based on these constraints are placed in to the design of the car. In
addition, parameters such as lateral acceleration, skid pad, braking performance, and cornering
data from top ranking teams will be placed into the design of the FIU FSAE car in order to
determine the required materials and design in order to achieve such goals. For this reason a static
and kinematic analysis is done first in order to determine the output forces developed from the
parameters and constraints of the car racing in various conditions. Specifically, the condition of
interest will be the car either accelerating or decelerating while traveling in a corner.
Figure 11. Acceleration track for SAE competition

19
5.2 Kinematic and Force Analysis
In order for most Formula SAE to determine these forces there are three methods used, the
most inaccurate is to use assumptions based on data gathered by other teams although this method
cost no money it also does not have any quantitative data to back it up. The second option and the
most expensive is to test tire compounds in house, this data can be used with confidence however
for new teams that wish to explore different tires without having to build a test setup and multiple
tires it is simply not a solution. The third option and the method Panther Motorsports chose is to
use test data provided by the Tire Test Consortium, TTC a private facility, that offers a copy of its
data a small cost to SAE teams. This TTC data is provided by the Calspan Tire Research Center,
their testing procedures consist of running a tire on a flat belt test setup at a velocity of 25 mph
and a surface roughness of 120 grit. Test data is then collected in sets with varying camber angle,
slip angle and different forces that are to be experienced by the tire.
With the data purchased through the TTC, teams such as Panther Motorsports are tasked
with solely creating a Mat lab program in order to transform the data into graphs that can easily be
used for the task at hand. In this case we take a look at the specific tire compound from the previous
season, Hoosier LCO, and the height and width of the tire. The data provided can then be
Figure 12. Tire test apparatus

20
manipulated in the program to display a graph with tire characteristics that are needed by the team.
The graph below shows various loading conditions for an inclination angle of four degrees, being
as the normal force on one of the tires is calculated to be approximately 230.854 pounds, the way
the tire behaves can be observed as the slip angle varies.
Figure 13. Lateral force vs. slip angle
When designing components for the suspension, one should have a very thorough
understanding of how forces are transmitted throughout the system. The three primary modes of
force transmission are through static, dynamic, and shock loading. To begin the analysis, it is best
to begin with the static forces and then move forward to dynamic and shock loading.
By using the component of weight of the car distributed to each tire, one can calculate the
normal forces that each wheel encounters. After calculating the normal force on the wheel, one
can then move forward by moving from the wheel hub, upright, A-arms, and finally to the chassis.
For the A-arms, lateral forces placed on the A-arms come from the lateral friction force
present during a turn and the normal force on the wheel. When encountering a curve, the force
due to friction prevents the car from slipping sideways, applying a significant load on the upper
and lower A-arms. One can determine the resultant internal forces with the summation of
moments.

21
Lateral friction force is a function of the instantaneous velocity, the radius of curvature, and the
mass of the car. Only one-fourth of the friction force acts on each wheel.
𝐹𝐹𝑟𝑖𝑐𝑡𝑖𝑜𝑛 = 𝑚𝑎 = 𝑚𝑉2
𝜌
Summation of moments,
𝑀𝑜 =1
4𝐹𝐹𝑟𝑖𝑐𝑡𝑖𝑜𝑛(ℎ − 𝑦1) + 𝐹𝑈𝑝𝑝𝑒𝑟(𝑦1 + 𝑦2) − 𝑁(𝑥1) = 0
𝑀𝐴 =1
4𝐹𝐹𝑟𝑖𝑐𝑡𝑖𝑜𝑛(ℎ + 𝑦2) − 𝐹𝐿𝑜𝑤𝑒𝑟(𝑦1 + 𝑦2) − 𝑁(𝑥1) = 0
Resultant internal forces at a-arms,
𝐹𝑈𝑝𝑝𝑒𝑟 =𝑁(𝑥1) − (0.25)𝐹𝐹𝑟𝑖𝑐𝑡𝑖𝑜𝑛(ℎ − 𝑦1)
𝑦1 + 𝑦2
𝐹𝐿𝑜𝑤𝑒𝑟 =−𝑁(𝑥1) + (0.25)𝐹𝐹𝑟𝑖𝑐𝑡𝑖𝑜𝑛(ℎ + 𝑦2)
𝑦1 + 𝑦2
It should be noted that if the resultant forces are negative, then the force is in tension.
Otherwise, the resultant force is in compression. When determining the outputs for the component
force equations, 𝐹𝑈𝑝𝑝𝑒𝑟 and 𝐹𝐿𝑜𝑤𝑒𝑟 should be considered the same as 𝐹𝐹𝑟𝑜𝑛𝑡 𝑜𝑟 𝐹𝑅𝑒𝑎𝑟 depending
if one is solving for the upper or lower A-arm forces.
Figure 14. Internal Forces on A-arms form external forces

22
One can see the front A-arms set at an angle 𝜃 in the following figure. The braking force
is theoretically applied evenly between all four wheels. These forces are then evenly split between
the upper and lower A-arms of the front and rear. According to this assumption, only one eight of
the braking force is felt by each upper and lower A-arm.
Front A-arm forces:
∑ 𝐹𝑥 = 𝐹𝐹𝑟𝑜𝑛𝑡 − 𝐹1 cos (𝜃
2) − 𝐹2 cos (
𝜃
2) = 0
∑ 𝐹𝑦 =1
8𝐹𝐵𝑟𝑎𝑘𝑒 + 𝐹1 sin (
𝜃
2) − F2 sin (
𝜃
2) = 0
Resultant forces after solving:
𝐹1 =𝐹𝐹𝑟𝑜𝑛𝑡
2cos(0.5𝜃)−
𝐹𝐵𝑟𝑎𝑘𝑒
16 sin(0.5𝜃)
𝐹2 =𝐹𝐹𝑟𝑜𝑛𝑡
2 cos(0.5𝜃) +
𝐹𝐵𝑟𝑎𝑘𝑒
16 sin(0.5𝜃)
It should be noted that rolling resistance on the front wheels is considered to be negligible,
but breaking forces are not. When undergoing heavy braking, while still maintaining traction and
not slipping brake and traction forces are equal in magnitude but opposite in direction. They are a
function of the mass of the car and the acceleration or deceleration. For the front a-arms enter a
positive brake force and for the rear a-arms enter a negative brake force instead of the traction
force.
Y2
Y1
FFront
1/8
FB
rake
Y1 =Y2
Figure 15. Front a-arm geometry with internal and external
forces

23
𝐹𝑇𝑟𝑎𝑐𝑡𝑖𝑜𝑛 = −𝐹𝐵𝑟𝑎𝑘𝑒 = 𝑚𝑎
Also, front or rear forces are not oriented in such a fashion that they are acting from outside of the
car toward the inside, then the force should be considered negative when performing calculations.
This is based on the sign convention stating that forces acting towards the centerline of the car are
considered positive.
The rear A-arms are set with angles 𝜃 and 𝜙 defining the position of the bars which make
up the arms. The traction force is generated by the rear wheels only, being that the car is rear-while
drive. This force is assumed to be evenly distributed between the four rear A-arms.
Summation of Forces into components for rear a-arms forces,
∑ 𝐹𝑥 = 𝐹𝑅𝑒𝑎𝑟 − 𝐹1 cos(𝜙 + 𝜃) − 𝐹2 cos(𝜙) = 0
∑ 𝐹𝑦 =1
4𝐹𝑇𝑟𝑎𝑐𝑖𝑡𝑜𝑛 − 𝐹1 sin(𝜙 + 𝜃) − F2 sin(𝜙) = 0
𝐹𝑅𝑒𝑎𝑟 is the force applied from the upright joint to the tip of the lower or upper A-arms due to the
force created from centripetal acceleration when encountering a curve. 𝐹𝑇𝑟𝑎𝑐𝑡𝑖𝑜𝑛 is the traction
force created from acceleration or deceleration. For calculating the resultant forces during
breaking, a negative braking force with a factor of 1/2 should be plugged in to adjust for the
direction and magnitude of the actual braking force felt by each a-arm.
Ɵ
Φ
¼ F
Trac
tio
n
FRear
Figure 16. Rear A-Arm geometry with external and internal forces.

24
Resultant forces after solving for the braking situations, the equations are adjusted as follows:
𝐹2 =𝐹𝑅𝑒𝑎𝑟 −
𝐹𝑇𝑟𝑎𝑐𝑡𝑖𝑜𝑛 cos(𝜙 + 𝜃)4 sin(𝜙 + 𝜃)
cos(𝜃) −sin(𝜙)cos(𝜙 + 𝜃)
sin(𝜙 + 𝜃)
𝐹1 =0.25𝐹𝑇𝑟𝑎𝑐𝑡𝑖𝑜𝑛 − 𝐹2 sin(𝜙)
sin(𝜙 + 𝜃)
𝐹2 =𝐹𝑅𝑒𝑎𝑟 +
𝐹𝐵𝑟𝑎𝑘𝑒 cos(𝜙 + 𝜃)8 sin(𝜙 + 𝜃)
cos(𝜃) −sin(𝜙)cos(𝜙 + 𝜃)
sin(𝜙 + 𝜃)
𝐹1 =−
18 𝐹𝐵𝑟𝑎𝑘𝑒 − 𝐹2 sin(𝜙)
sin(𝜙 + 𝜃)
Again, it should be noted that if resultant forces are negative, then the forces are considered to be
acting in tension. Otherwise resultant forces are in compression.
The arm of the shock absorber will create additional tension on the lower A-arms in the
front, as well as the upper A-arms in the rear due to the angle 𝛽 in between. The smaller this angle,
the larger the internal force in this member and more tension would be added to the a-arms. Normal
force is X1 distance from the tip of the a-arm.
Figure 17. A-arm suspension link geometry with internal and external
forces
25
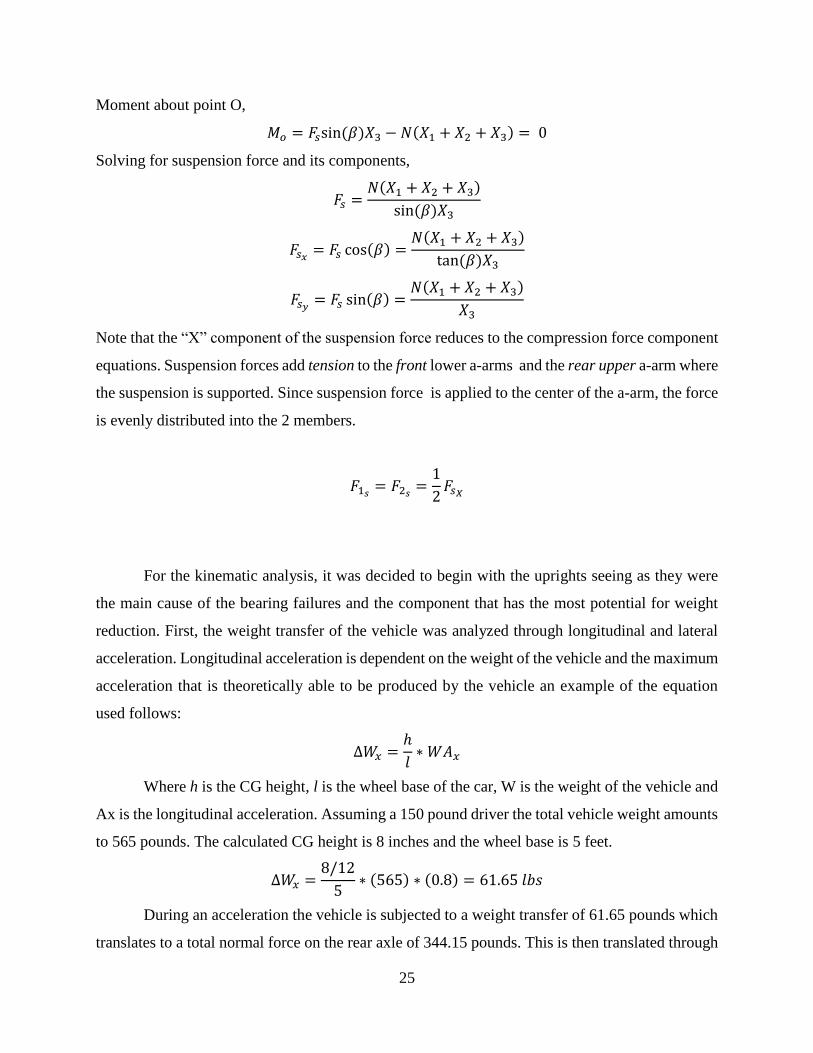
Moment about point O,
𝑀𝑜 = 𝐹𝑠sin (𝛽)𝑋3 − 𝑁(𝑋1 + 𝑋2 + 𝑋3) = 0
Solving for suspension force and its components,
𝐹𝑠 =𝑁(𝑋1 + 𝑋2 + 𝑋3)
sin (𝛽)𝑋3
𝐹𝑠𝑥= 𝐹𝑠 cos(𝛽) =
𝑁(𝑋1 + 𝑋2 + 𝑋3)
tan (𝛽)𝑋3
𝐹𝑠𝑦= 𝐹𝑠 sin(𝛽) =
𝑁(𝑋1 + 𝑋2 + 𝑋3)
𝑋3
Note that the “X” component of the suspension force reduces to the compression force component
equations. Suspension forces add tension to the front lower a-arms and the rear upper a-arm where
the suspension is supported. Since suspension force is applied to the center of the a-arm, the force
is evenly distributed into the 2 members.
𝐹1𝑠= 𝐹2𝑠
=1
2𝐹𝑠𝑋
For the kinematic analysis, it was decided to begin with the uprights seeing as they were
the main cause of the bearing failures and the component that has the most potential for weight
reduction. First, the weight transfer of the vehicle was analyzed through longitudinal and lateral
acceleration. Longitudinal acceleration is dependent on the weight of the vehicle and the maximum
acceleration that is theoretically able to be produced by the vehicle an example of the equation
used follows:
∆𝑊𝑥 =ℎ
𝑙∗ 𝑊𝐴𝑥
Where h is the CG height, l is the wheel base of the car, W is the weight of the vehicle and
Ax is the longitudinal acceleration. Assuming a 150 pound driver the total vehicle weight amounts
to 565 pounds. The calculated CG height is 8 inches and the wheel base is 5 feet.
∆𝑊𝑥 =8/12
5∗ (565) ∗ (0.8) = 61.65 𝑙𝑏𝑠
During an acceleration the vehicle is subjected to a weight transfer of 61.65 pounds which
translates to a total normal force on the rear axle of 344.15 pounds. This is then translated through

26
the tires and can be used to calculate the frictional force generated. This same process is used to
theoretically calculate the frictional forces produced by the vehicle during the highest loading
condition observed, cornering and braking, as tested in the skid pad test. The loads attained from
this skid pad simulation are not associated with the forces attained during critical failure of a part.
To attain the frictional loads attained while accelerating through the crest of a turn lateral
load transfer that the car is being subjected to must be calculated. To calculate the LLT a similar
equation to the one used for longitudinal weight transfer is used. That equation is shown below:
𝐿𝐿𝑇 =𝐴𝑦 ∗ ℎ
𝑡
Unlike the previous equation the result given by the lateral load transfer equation is in the
form of a percentage depending the on what direction the turn is. As with the previous equation
Ay is lateral acceleration, h is the CG height and t is the track width of the vehicle. Although track
width is maintained the same front and rear for commercial vehicles, for the purpose of the FSAE
race car it was decided that the rear track width to be shorter. The shorter track width in the rear
allows the vehicle to turn into a corner earlier while still allowing the rear tires to clear the cone
which would otherwise induce a time penalty resulting in a lower score. The difference in track
width means that lateral load transfer would be greater in the rear than in the front, considering the
vehicles 50/50 longitudinal weight balance. This is shown in the following calculation:
𝐿𝐿𝑇 =1.14 ∗ 8/12
3.916= .203
The resultant load transfer percentage is added to the initial normal force on the right rear tire,
considering a left hand turn, and is used in the calculation of the forces exerted by the tire. The
load on the tires is now 204.295 pounds in the middle of a corner while accelerating and assuming
no slipping. From tire data and benchmarking it can be assumed the coefficient of friction to be
1.13, this figure is then to be used to calculate the force of friction created that will be translated
through the suspension assembly, this friction coefficient can later be validated through testing.
𝐹𝑓𝑟𝑖𝑐𝑡𝑖𝑜𝑛 = 𝑁 ∗ 𝜇 = 204.295 ∗ 1.13 = 230.854 𝑙𝑏𝑓

27
By studying the suspension through static analysis the forces acting on the upright, hub and
A-arms can be found. However, it is important to remember that these forces are derived from
dynamic loading conditions and must be treated so when designing parts.
5.3 Dynamic/Vibration Analysis of the System
When designing a suspension system for a performance vehicle, a fast response system is
preferable. To accomplish this, it is necessary for a damper and spring to absorb impacts but at the
same time allow for reaction in a way that the vehicle would not lose contact with the ground. On
the other hand, a performance suspension system should also return the body of the car to a rest in
the vertical direction as soon as possible to improve the handling of the vehicle.
To fulfill these requirements system dynamics is employed to analyze the mechanical
system with simple elements. The suspension system can be represented with simple dampers and
springs. The tire acts as spring, the shock absorber acts as a damper and the spring as itself.
The system is simplified into elemental components in order to simplify the analysis. The
elements taken into consideration are the following:
Figure 18. Free body diagram of suspension assembly

28
Sprung mass: Mass that is supported by the suspension of the car.
Un-sprung mass: Mass of the suspension and wheel assembly
Damper: Energy diffuser. Measured in force per time over distance.
Spring: Energy storage. Measured in force over distance.
The suspension system can be modeled as the sprung mass attached to a spring and a
damper which represents the suspension system. The suspension is connected to the un-sprung
mass with a spring to the ground representing the tire which acts as a spring. See figure below.
Table 3. Vibrational dynamic nomenclature
Sprung mass Ms
Un-sprung mass Mus
Suspension Stiffness Ks
Suspension damping coefficient Cs
Tire stiffness Kt
Sprung mass displacement Ys
Un-sprung mass displacement Yus
Figure 19. Vibrational dynamic schematic
29
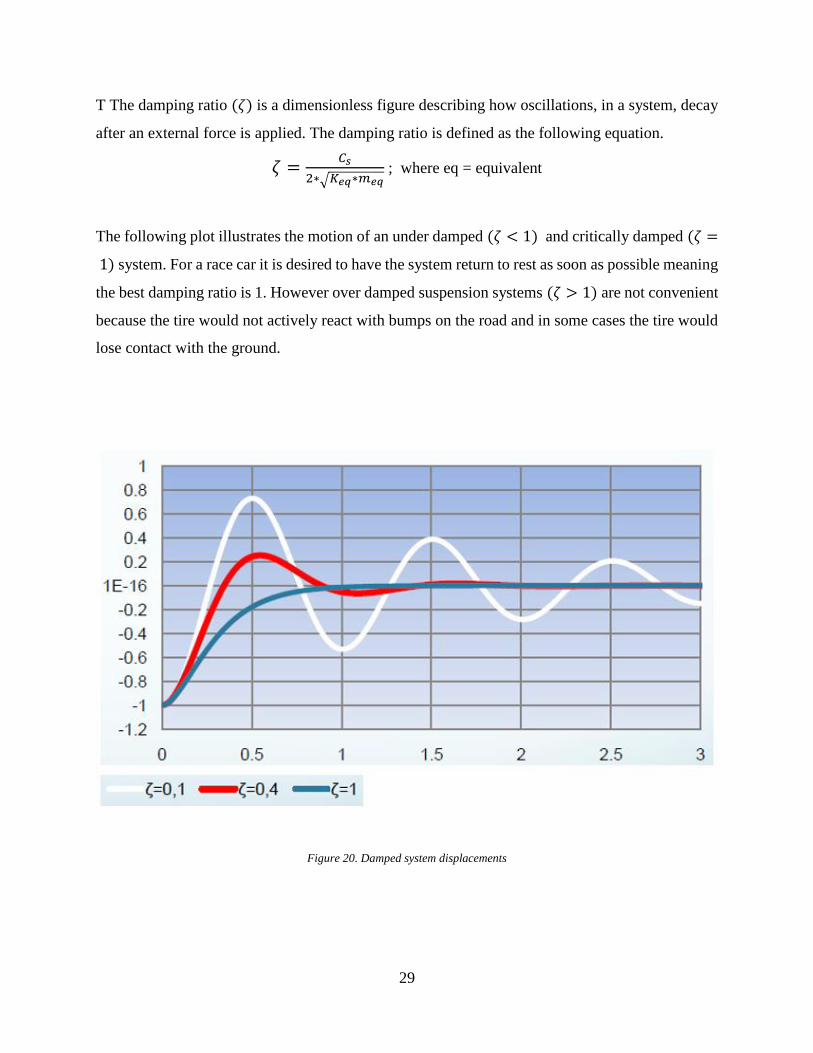
T The damping ratio (𝜁) is a dimensionless figure describing how oscillations, in a system, decay
after an external force is applied. The damping ratio is defined as the following equation.
𝜁 =𝐶𝑠
2∗√𝐾𝑒𝑞∗𝑚𝑒𝑞 ; where eq = equivalent
The following plot illustrates the motion of an under damped (𝜁 < 1) and critically damped (𝜁 =
1) system. For a race car it is desired to have the system return to rest as soon as possible meaning
the best damping ratio is 1. However over damped suspension systems (𝜁 > 1) are not convenient
because the tire would not actively react with bumps on the road and in some cases the tire would
lose contact with the ground.
Figure 20. Damped system displacements
30
In order to find the equivalent spring constant for the system, notice that the tire and suspension
spring are in series and they can be added accordingly.
1
𝑘𝑒𝑞=
1
𝑘𝑠+
1
𝑘𝑡
𝑘𝑒𝑞 =𝑘𝑠. 𝑘𝑡
𝑘𝑠 + 𝑘𝑡
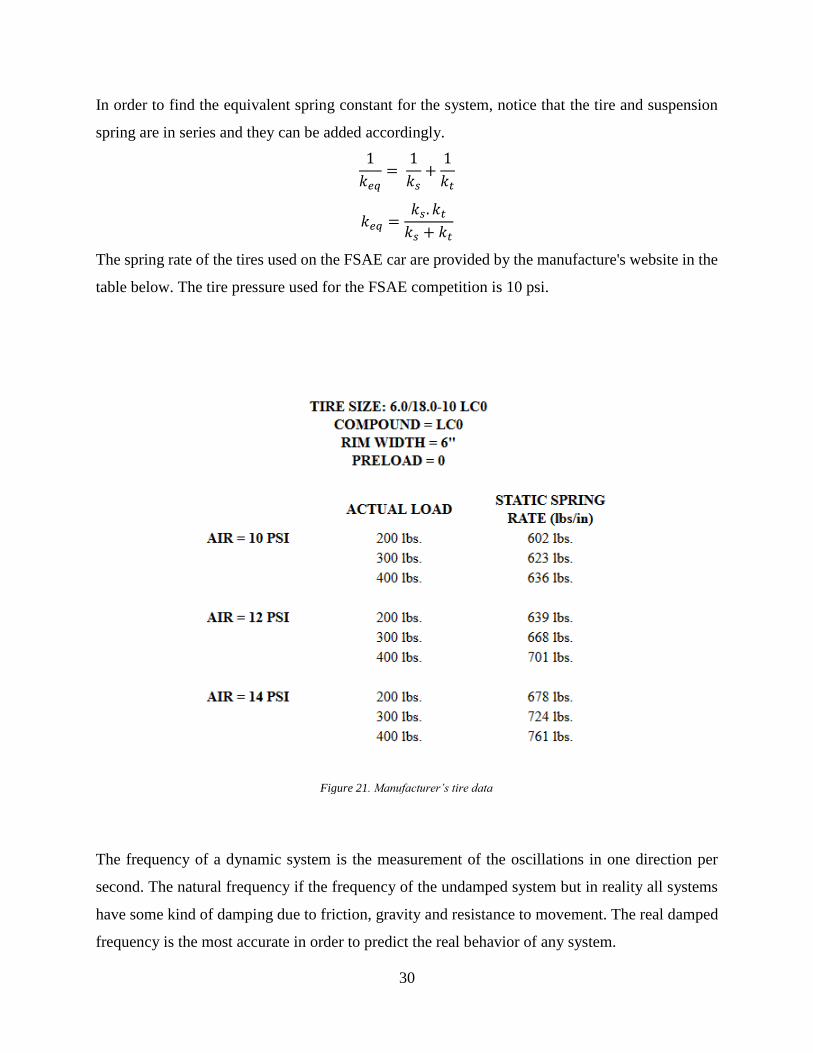
The spring rate of the tires used on the FSAE car are provided by the manufacture's website in the
table below. The tire pressure used for the FSAE competition is 10 psi.
The frequency of a dynamic system is the measurement of the oscillations in one direction per
second. The natural frequency if the frequency of the undamped system but in reality all systems
have some kind of damping due to friction, gravity and resistance to movement. The real damped
frequency is the most accurate in order to predict the real behavior of any system.
Figure 21. Manufacturer’s tire data
31
𝑓𝑛𝑎𝑡𝑢𝑟𝑎𝑙 =1
2𝜋√
𝑘
𝑚 (Hz = cycles/sec)
𝑓𝑑𝑎𝑚𝑝𝑒𝑑 =𝜔𝑛
2𝜋√1 − 𝜁2 (Hz. = cycles/sec)
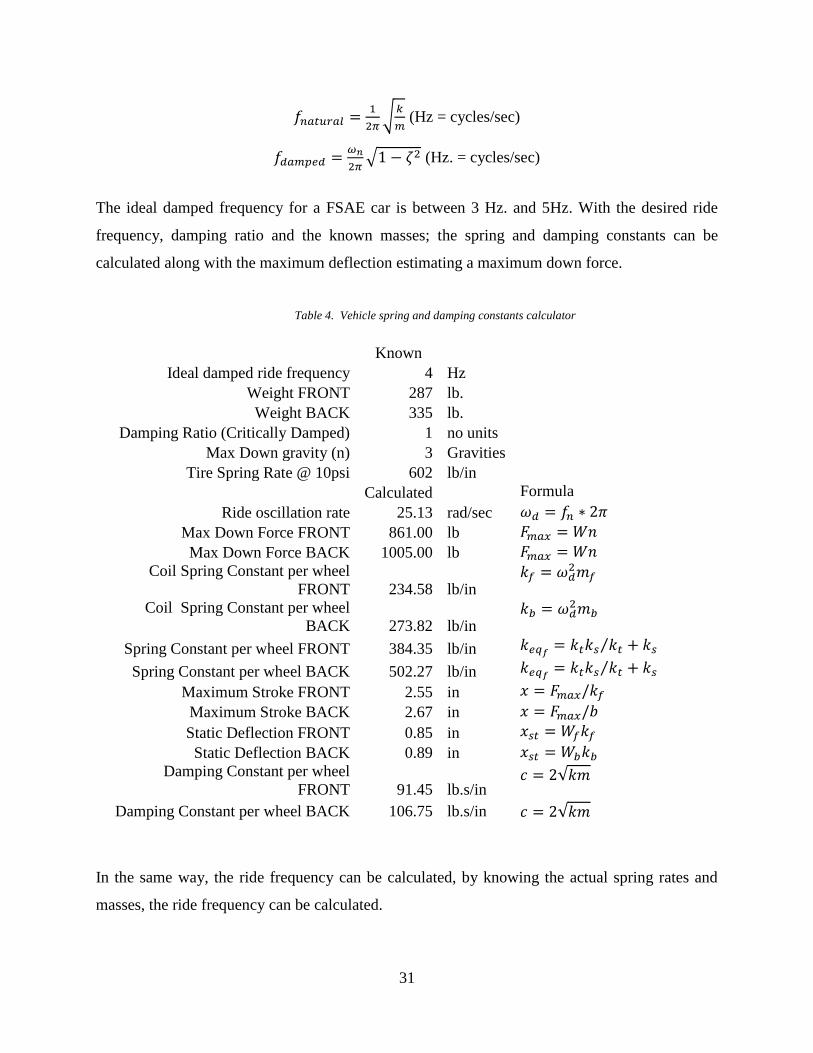
The ideal damped frequency for a FSAE car is between 3 Hz. and 5Hz. With the desired ride
frequency, damping ratio and the known masses; the spring and damping constants can be
calculated along with the maximum deflection estimating a maximum down force.
Table 4. Vehicle spring and damping constants calculator
Known
Ideal damped ride frequency 4 Hz
Weight FRONT 287 lb.
Weight BACK 335 lb.
Damping Ratio (Critically Damped) 1 no units
Max Down gravity (n) 3 Gravities
Tire Spring Rate @ 10psi 602 lb/in
Calculated Formula
Ride oscillation rate 25.13 rad/sec 𝜔𝑑 = 𝑓𝑛 ∗ 2𝜋
Max Down Force FRONT 861.00 lb 𝐹𝑚𝑎𝑥 = 𝑊𝑛
Max Down Force BACK 1005.00 lb 𝐹𝑚𝑎𝑥 = 𝑊𝑛
Coil Spring Constant per wheel
FRONT 234.58 lb/in 𝑘𝑓 = 𝜔𝑑
2𝑚𝑓
Coil Spring Constant per wheel
BACK 273.82 lb/in 𝑘𝑏 = 𝜔𝑑
2𝑚𝑏
Spring Constant per wheel FRONT 384.35 lb/in 𝑘𝑒𝑞𝑓= 𝑘𝑡𝑘𝑠 𝑘𝑡 + 𝑘𝑠⁄
Spring Constant per wheel BACK 502.27 lb/in 𝑘𝑒𝑞𝑓= 𝑘𝑡𝑘𝑠 𝑘𝑡 + 𝑘𝑠⁄
Maximum Stroke FRONT 2.55 in 𝑥 = 𝐹𝑚𝑎𝑥/𝑘𝑓
Maximum Stroke BACK 2.67 in 𝑥 = 𝐹𝑚𝑎𝑥/𝑏
Static Deflection FRONT 0.85 in 𝑥𝑠𝑡 = 𝑊𝑓𝑘𝑓
Static Deflection BACK 0.89 in 𝑥𝑠𝑡 = 𝑊𝑏𝑘𝑏
Damping Constant per wheel
FRONT 91.45 lb.s/in 𝑐 = 2√𝑘𝑚
Damping Constant per wheel BACK 106.75 lb.s/in 𝑐 = 2√𝑘𝑚
In the same way, the ride frequency can be calculated, by knowing the actual spring rates and
masses, the ride frequency can be calculated.

32
Table 5. Ride Frequency Calculation
Ride frequency calculation Known
Max Down gravity 3 Gravities
Weight FRONT 287 lb
Weight BACK 335 lb.
Damping Ratio (Critically
Damped) 1 no units
Actual Spring constant FRONT 300 lb/in
Actual Spring constant BACK 400 lb/in
Tire Spring Rate @10 psi 602 lb/in
Calculated Formulas
Spring Constant per wheel
FRONT 200.22 lb/in 𝑘𝑒𝑞𝑓= 𝑘𝑡𝑘𝑠 𝑘𝑡 + 𝑘𝑠⁄
Spring Constant per wheel
BACK 240.32 lb/in 𝑘𝑒𝑞𝑏= 𝑘𝑡𝑘𝑠 𝑘𝑡 + 𝑘𝑠⁄
Damping Constant FRONT 84.49 lb.s/in 𝑐 = 2√𝑘𝑚
Damping Constant BACK 100.00 lb.s/in 𝑐 = 2√𝑘𝑚
Ride Omega FRONT 23.22 rad/sec 𝜔𝑑 = √𝑘𝑒𝑞𝑓
𝑚⁄
Ride Omega BACK 23.55 rad/sec 𝜔 = √𝑘𝑒𝑞𝑏
𝑚⁄
Ride Frequency FRONT 3.70 Hz 𝑓𝑛 = 𝜔𝑑/2𝜋
Ride Frequency BACK 3.75 Hz 𝑓𝑛 = 𝜔𝑑/2𝜋
Maximum Stroke FRONT 1.44 in 𝑥 = 𝐹𝑚𝑎𝑥𝑓/𝑘𝑓
Maximum Stroke BACK 1.26 in 𝑥 = 𝐹𝑚𝑎𝑥 /𝑘𝑏
Static Deflection FRONT 0.48 in 𝑥𝑠𝑡 = 𝑊𝑓𝑘𝑓
Static Deflection BACK 0.42 in 𝑥𝑠𝑡 = 𝑊𝑏𝑘𝑏
Physical testing of the spring and dampers will be performed in order to accurately calculate the
actual ride frequency to verify if it’s in the ideal range.
5.4 Structural Design
One of the main areas of focus throughout the project was the upright. These uprights are
essential for both the front and rear of the racecar. In order to guarantee the proper function of the
upright during any racing application, while still sporting a design featuring notable weight
reduction, the software Hyperworks proved very useful. When using this software, the user has
33
the ability to reduce the size and weight of any originally proposed part in order to create a finalized
design that will meet the structural standards.
The uprights were manufactured at the Engineering Manufacturing Center. Manufacturing
came to a total cost of $2750 in material and labor and combined. Funding came from the Toyota
Technical Center. As was originally planned, the uprights were made of aluminum, as the material
is easy to machine and offers the potential necessary for weight savings. Although sporting a much
more trimmed appearance, SolidWorks simulations and competition benchmarking prove the
design to be sufficient for any structural needs of the car.
5.5 Stress Analysis
With the primary assumption that the weight of the car will remain relatively the same and
a 150 pound driver it is possible to accurately simulate the loads placed on the entire upright
assembly. The loads are derived from tire friction and lateral loads applied during a cornering and
braking situation.
5.5.1 Uprights
To simulate the static and dynamics loading on the uprights a fixture was applied to restrict
movement at the upper and lower attachment points of the upright, otherwise known as the upper
and lower ball joints. As shown in Fig. 22 the restrictions are set and the forces and moments are
applied on to the surface where the bearings will be placed and on to the brake caliper brackets.

34
Throughout the iterative process of designing a key component of the suspension, the
upright, it was imperative that the amount of compliance sustained by this part is kept to a
minimum in order to not have any clearance issues with the brake caliper and rotor, as well as to
reassure that the bearings will not be damaged or seize during operation. In the figure the final
revision of the upright is observed with forces applied that were calculated in the previous sections.
It is noted that these forces are partially unrealistic as they are only obtained thru a situation outside
of the Formula SAE competition. However, as per the premise of the competition it was decided
that this situation must be considered in order to satisfy that loading condition. The figure above
shows the deflections obtained by applying these loads where blue represents the lowest amount
of deflection and red represents the highest amount in milli-meters.
Meanwhile maintaining the rigidity high, the strength and the weight must not be
compromised, these were key points to keep in mind throughout the iterative process of designing
Figure 22. Upright deflection simulation

35
the uprights. To simulate these forces applied onto the upright, a fatigue study was performed, for
eighty million cycles, with a normal loading the upright maintained little to no damage and
maintained a high life. The picture below displays the part with varying colors to illustrate where
the part has a lower life, the color blue being the highest, and red being the lowest.
Figure 23. Upright life-cycle calculation
As shown in the figure, the area around the upper and lower ball joints and the area in the
rib for the brake caliper mounts show lower life in a minimal portion. However this was expected
because of the nature of the uprights function and the characteristic of the material.
With the final revision of the uprights modeled and tested in Solidworks it was re-meshed
in Altairs Hyperworks software. This software has and FEA engine and meshing process that was
deemed more sophisticated and aided us in finalizing the model. The figure below illustrates the
upright within the Hyperworks software.

36
Figure 24. Upright Hyperworks simulation
Figure 25. Manufactured Uprights

37
5.5.2 Hubs
The wheel hubs were also simulated using relatively the same forces of the uprights, the
forces sustained by the upright are actually a reaction to those sustained by the hub. After finding
the frictional forces it was possible to treat the hubs as a static problem to obtain the moment, axial
force and lateral force that the hub receives. In order to make this into a dynamic simulation we
must understand how a wheel hub works and how its constant rotation affects the loading of the
hub face. Knowing this instead of placing loads on the hub as a direct reaction of a moment, the
actual moment and bearing loads were applied. The only constant force on the hub is the axial load
sustained. The following figure depicts how the hub was loaded and the stresses correlated to those
loadings.
Figure 26. Modified hub
Once again the highest stresses and lowest stresses are red and blue. The figure depicts revision 3
of the hub. After observing the performance and design of prototype one of the hub, that is
currently in use, it was very obvious that the design choices made previously was a result of the
stress concentrations on the the fillets and those on the actual surface the hub makes contact on.
Using this as a guideline, the forces were refined from prototype one and then used in optimizing
the design to fit the function of the new suspension assembly while reducing weight.

38
Figure 27. Original hub
Some major changes to reduce rotating mass and cost was the change of bolt pattern that
can be observed by the difference in size. Another main difference is the addition of a spindle on
the rear of the hub, this was incorporated into the new design in order to facilitate the new live
spindle design opposed to the previous dead spindle design.
Figure 28. Manufactured hubs

39
5.5.3 A-Arms
A-Arms connect the upright to the chassis and react the forces through the upper and lower
ball links onto the suspension mounts, they also support the sprung weight of the vehicle. The
nature of A-arms make them a fairly simple design, simply treating them as mere links and
distributing the forces correctly it can be seen that thin bars are able to be used to withstand loads
in pure axial loadings. However as the A-arms also react the braking forces and the forces exerted
by the un-sprung weight through the shock and spring of the vehicle onto the A-arm an additional
bending force is applied. Compliance within the a-arm assembly is not favored as it can result in
suspension geometry changes and possible failure. In order to mitigate the amount of compliance
it was decided that larger outside diameter hollow tubes would be used in order to reduce the
amount of deflection sustained and still retain a relatively light weight. The figure below shows
the final revision of the real lower A-arms.
5.5.4 Bell Cranks
Bell cranks serving as merely a pivot point between the A-Arm assemblies and the coil
over assembly it was a fairly simple loading situation where it will only transmit loads that the
spring and shock are able to react. As a result the rating of the spring and shock assembly was used
Figure 29. Final revision rear lower A-arm

40
as the input in the simulations. To fixture the bell cranks during simulations it was allowed to
rotate around its center point and one of the attachment points for either the coil overs or the
push/pull rods are fixed. This set up creates a situation where the maximum force exerted by the
selected spring is exerted onto the bell crank, although this situation is not realistic in the event of
a catastrophic failure it was decided that the suspension should not be allowed to fail.
The picture above shows prototype 1, currently on the vehicle, the shape and design were
used in order to keep functionality while keeping costs low. For the new design a set of revisions
were created focused on optimizing the bell cranks based on knowledge of its function and the
current manufacturing capabilities.
Figure 30. Original bellcrank

41
The previous figure shows the final revision of the newly designed bell cranks, which are
designed to the slightly greater loads then prototype one, based off of new loading calculations
and worst case scenarios. Weight was reduced by 40 percent while maintaining the same strength.
Figure 32. Manufactured bellcranks
Figure 31. Newest bellcrank

42
5.5.6 Stress Analysis Conclusion
In moving forward with the suspension of the car, it was decided to use steel for the A-arms.
Although it was determined through software simulation that carbon fiber tubing would be more
than sufficient to bear the brunt of static, dynamic, and shock loading, the cost of machining the
intricate aluminum end pieces would have adversely affected the FIU FSAE organization as a
whole. All geometry for the A-arms will remain the same, but as said before, steel will be the
material of choice for the A-arms.
While performing root-cause analysis on various suspension related issues, it was
determined that the bell cranks had significant potential of catastrophic failure. After investigating
the previous design of the bell cranks, it was noted that the bolt used to mount the bell cranks to
the chassis was structurally insufficient. With the primary failure mode of the bell cranks found, a
new design was implemented.
5.6 Material Selection
After performing all necessary analyses on the suspension components, final decisions
have been made for material selection. When choosing the material for any component in
engineering design, it is necessary to consider specific factors that will aid one in choosing the
optimum material for the product application. The factors that are most important in determining
the proper material for the suspension components are as follows:
1. Strength
2. Weight
3. Manufacturability
4. Weldability
5. Cost
Because the suspension is the primary mode for handling loads that come from static and
dynamic conditions, all material used must be strong enough to withstand the forces encountered.
With this being said, strength was the factor of most importance in determining the suspension
component material.

43
After determining whether the material was capable of withstanding all loads, material
weight was then considered. There are two reasons as to why weight is so highly regarded when
determining the correct material for suspension application. First, the overall weight of the car
should be as light as possible in order to produce the highest power to weight ratio. Secondly, the
suspension components must be especially light because the weight of the suspension components
greatly affect the overall handling of the car. This concept is known as un-sprung weight. One can
understand this concept by imagining a suspension with a weight of roughly 30 pounds. If the car
were to experience a 2G bump, then the force experienced by the whole car would be roughly 60
pounds. With that, one can understand why a racing team would strive to make all suspension
components as light as possible.
One key factor that many inexperienced product developers may forget is the
manufacturability of materials. This factor had to be very seriously considered for the Formula
SAE car because the financial and machining resources are very limited. Therefore, one must
determine whether they have the time to perform machining on a tougher material such as steel.
In order to mate all subsystems within the racecar, a team cannot solely rely on bolt on
applications. Many of the components within the car require welding. A reoccurring theme while
manufacturing and assembling the suspension involves the mating of steel and aluminum. This is
a very sensitive procedure in which the heat necessary to begin the welding process is different for
each material. Also, one should take note of the fact that aluminum takes much more time to weld
and could possibly be detrimental to a team who has not allotted the proper amount of time for
welding.
Figure 33. Un-sprung weight concept

44
Financial cost is always an important question that a project manager must consider when
carrying out a very time and labor intensive project. Cost can be one of the driving factors that
could change the material of choice. For example, carbon fiber was the original material of choice
for the A-arms until it was determined that the complex machining required to manufacture the
aluminum end mounts would not benefit the team.
6. Prototype Construction
6.1 Overview
In this section, one can gain a more macroscopic understanding of how the Formula SAE
car suspension is designed, constructed, and assembled. Other subsystems of the car will be
mentioned in order to aid one in understanding just how the suspension performs in conjunction
with other subsystems.
6.2 Description of Prototype
Although the Formula SAE suspension is considered to be a prototype for this particular
Senior Design, it will be considered a finished product for the 2016 Formula SAE season.
However, upon finishing the competition in Michigan, it will be considered a prototype for the
next season and will continue to be improved upon.
This suspension features a series of significant design improvements. The improvements
made required extensive research in materials and geometry optimization because the mounting
points on the chassis remained the same, which limited some of the potential changes to the
previous suspension setup.
After performing research on materials and the manufacturing required to design and
construct the suspension, the following improvements were made to the Formula SAE Suspension
Package.
45
1. Reduced gusset sizing on A-Arms for added weight reduction
2. Modified Upright geometry for weight reduction and bearing fit
3. Change in Upright bearing selection to eliminate previous failure mode
4. Transition from dead to live spindle setup for the redesigned hubs
5. Optimization for Bellcranks of car
By introducing the aforementioned improvements, the Panther Motorsports car will become much
more reliable and welcomed by judges at the competition in Michigan.
6.3 Prototype Design
6.3.1 Overview
The design of the suspension package is most easily understood when incorporating a
ground-up approach, starting with the rim and tire and progressing to the chassis. All components
within the design are as follows.
1. Rim & Tire
2. Hub
3. Spindle
4. Brake Assembly
5. Upright
6. A-arms (with Ackermann Arm in Front)
7. Push/Pull Rods (Front/Rear)
8. Bellcranks (Located at top for front and bottom for rear)
9. Shock Absorbers (located on chassis side of bellcrank- not in picture below)
10. Suspension Mounts

46
6.3.2 Rim and Tire
Tires are the first portion of the suspension package. Although one may think of tires
mainly as a mode of support and traction, they also introduce spring and damper like characteristics
which must be accounted for. Next, the rim is chosen. The rim also has various characteristics that
are considered by automotive engineers when designing a vehicle. The most ideal rim should be
light in weight and should have a geometry that is well suited for the upstream suspension
components.
Figure 34. Formula SAE car front suspension schematic

47
6.3.3 Wheel Hub
The next component of the suspension package is the wheel hub. This component
encounters all forces transmitted from the tire and rim and then transmits those forces to the upright
and spindle. As was previously mentioned, the wheel hub was modified in its geometry to
accommodate for the live-spindle setup. There are several reasons as to why a live spindle setup
was chosen.
Simply put, a live spindle setup is where a drive shaft is placed inside of a wheel hub. The
two are mated via the splines on the outer portion of the drive shaft to the splines of the inner
diameter of the wheel hub. Note, that this is not a press fit, as the wheel hub is to be able to be
removed from the drive shaft for maintenance. Being that the wheel hub is directly mounted to the
drive shaft and rotates with it at the same rate, no bearing is required.
Next, the wheel hub is press fit into the bearings within the upright, or as many refer to it
in the automotive industry, the knuckle. The specifics of the upright will be discussed later in
greater detail. Finally the assembly is secured via a washer, nut, retainer, and cotter pin.
Previously a dead-spindle setup was used in the front suspension package. With dead-
spindle setups, the hub has bearings press fit within its inner diameter. The hub is then slipped over
the spindle shaft and is free to rotate. The spindle shaft is then press fit into the upright. Notice the
difference in this setup compared to the live-spindle setup. Again, the assembly is secured at the
end by a washer, nut, retainer, and cotter pin.
Figure 35. Live spindle setup schematic (Jeepz.com)

48
A live-spindle setup was ultimately chosen for both the front and rear of the suspension
package. This was done in an effort to eliminate failure modes previously found in the old car,
unify suspension components, and to reduce weight. For the front suspension, no drive shaft is
present, as the vehicle is rear wheel drive, so the shaft rotating within the hub is not connected to
any power transmission components. By performing these changes, significant weight was reduced
in the suspension. Below, weight savings in just the upright and hubs can be observed.
Figure 36. Dead-spindle setup schematic (S10forum.com)
Table 6. Weight reduction in uprights and hubs
New Component Weight (lb) Old Component Weight (lb)
Upright 0.93 2.60
Hub 1.78 1.65
Total 2.71 4.25
Weight Savings (lb)
% Weight Reduction
1.54
36.24

49
6.3.4 Upright
One of the most important components of the suspension package are the uprights. They
are responsible for transferring the loading encountered from the hubs and general motion of the
car to the chassis. In addition to their responsibility of load transfer, they are also vital to the
steering of the car. Specifically, the steering is largely possible with the uprights because of the
Ackermann arms. These arms are bolt-on additions to the front uprights.
Being that the Panther Motorsports team is utilizing a live-spindle setup, the uprights must
sport a set of bearings in order to accommodate for the loading and high speed rotation of the
moving spindle. Specifically, the bearings are model 6008-2rs1. These bearings were chosen
because they are more robust than the previous bearings used in last year’s formula car. The change
in bearing selection was due to several reasons. First, the change in upright geometry required a
different size of bearing. Second, failure was beginning to occur in last year’s bearings. Any
potential failure would essentially render the Panther Motorsports team incapable of competing in
any dynamic events in the Michigan competition.
As mentioned before in the report, the uprights were optimized in HyperWorks. This
optimization led to the dramatic weight reduction, noted in section 6.3.3. Not only did this aid in
the overall weight reduction of the car, but it also contributed to a lower amount of un-sprung
weight.
6.4 Construction
The construction of the suspension assembly has already been briefly covered. Now, a
thorough understanding of the assembly process can be understood. As before, the construction
will start with the wheel and tire assembly. The wheel and tire assembly are both mounted on to
the wheel hubs via the wheel studs and lug nuts. Four wheel studs will be used for the design of
the car.
It should be noted that the wheel hubs will be held secure by the threaded end of the rotating
spindle along with a large nut and cotter pin. Before the nut is tightened on to the rotating spindle,
the spindle is press fit into a bearing. This bearing is also press fit into the upright. This ensures
that the spindle will securely rotate in a fashion that is concentric to the inner diameter of the
upright. As was mentioned before, the press fit assembly will be secured by the threaded end of
the spindle and the large nut and cotter pin.

50
The upright has several locations of importance. The first two points are devoted to the
upper and lower A-arms. These components are some of the most important of the entire assembly,
as they bridge the gap between the sprung and unsprung mass of the car.
Located on the side of the front uprights are the Ackermann arm mounts, also known as the steering
arm mounts. The bolt-on Ackermann arms are bolted on to the uprights, and then steering rods are
mounted on to the Ackermann arms. The Ackermann arms will be constructed of aluminum, as
they will not be encountering forces high enough to require the strength of steel.
The last mounting points on the uprights are the brake caliper mounts. These are located
on all four uprights. They were designed with the calipers in mind, as the calipers were not custom
manufactured, and already had pre-determined dimensions.
All uprights consist of rod ends that were specifically designed to hold spherical bearings.
These bearings enable a certain range of motion in all directions, as is required when the
suspension travels while driving. The spherical bearings are pressed into steel sleeves, specially
designed with 45 degree chamfers that assist in the press-fitting process.
Figure 37. Upright mounting points

51
On the lower control arms, pushrods are added. These pushrods transmit much of the
loading to the bell cranks, which than transfer the loading to the coilover assembly. The same is
done in the back, but the rod connected to the bellcranks are known as pull-rods. This is because
the pull rods are mounted to the upper A-arms. When the tire moves upward, the rod pulls on the
bell crank, opposite to that of the push rod.
Finally, all bell cranks are mounted directly to the chassis, and so ends the suspension
package and its construction.
6.5 Prototype Cost Analysis
The following contains a series of tables that displays all expenses paid throughout the
process of designing the Panther Motorsports suspension package. The first table displays the
theoretical total cost, not including the effect of donations, discounts, and sponsorships. Whereas,
the second table includes all donations, discounts, and sponsorships, and is thus significantly lower
in cost.

52
Table 7. Cost Analysis without discounts
Uprights
Material Price Per Unit Quantity Cost
6061 Aluminum Stock 12"x12" 228.62 4 914.48
6061 Aluminum Flat Bar 1.75"x2.00" 21.16 2 42.32
Wheel Bearings 6008-2RS1 65.95 8 527.6
Black-Finish Steel Internal Retaining Ring 9.4 1 9.4
Outsourced Machining 2780 1 2780
Total 4273.8
Wheel Hubs
Material Price Per Unit Quantity Cost
6061 Aluminum Round Stock 5"x5" 123.25 4 493
Wheel Studs 1.5 14 21
Outsourced Machining 1300 1 1300
Total 1814
Control Arms and Bellcranks
Material Price Per Unit Quantity Cost
6061 Aluminum Plate 12"x24" 96.21 4 384.84
4130 Steel Tube 0.5"OD .049" Wall 4' length 12.6 6 75.6
4130 Steel Sheet 6"x12"x.125" 9.95 1 9.95
.032" Thick Washer for 5/8" Shaft Diameter 1.1 8 8.8
Cage Assembly for 5/8" Shaft Diameter, 3.11 4 12.44
Steel Needle-Roller Bearing 11.54 2 23.08
4130 Steel Round Tube, .375" OD, .065"
Wall 6.51 1 6.51
4130 Steel Tube, .875" OD, .120" Wall 14.85 1 14.85
3/16" 1018 Steel Plate 12"x24" 21.08 1 21.08
Aurora Spherical Bearings 16.67 30 500.1
Water Jet Services 230 1 230
Total 1287.25
Grand Total 7375.05

53
Table 8. Cost analysis with discounts and savings
Uprights
Material Price Per Unit Quantity Cost
6061 Aluminum Stock 12"x12"(Donated) 228.62 4 0
6061 Aluminum Flat Bar 1.75"x2.00" 21.16 2 42.32
Wheel Bearings 6008-2RS1 (Donated) 65.95 8 0
Black-Finish Steel Internal Retaining Ring 9.4 1 9.4
Outsourced Machining (Donated) 2780 1 0
Total 51.72
Wheel Hubs
Material Price Per Unit Quantity Cost
6061 Aluminum Round Stock 5"x5" (Donated) 123.25 4 0
Wheel Studs 1.5 14 21
Outsourced Machining 1300 1 1300
Total 1321
Control Arms and Bellcranks
Material Price Per Unit Quantity Cost
6061 Aluminum Plate 12"x24" (Donated) 96.21 1 0
4130 Steel Tube 0.5"OD .049" Wall 4' length 12.6 6 75.6
4130 Steel Sheet 6"x12"x.125" 9.95 1 9.95
.032" Thick Washer for 5/8" Shaft Diameter 1.1 8 8.8
Cage Assembly for 5/8" Shaft Diameter, 3.11 4 12.44
Steel Needle-Roller Bearing 11.54 2 23.08
4130 Steel Round Tube, .375" OD, .065" Wall 6.51 1 6.51
4130 Steel Tube, .875" OD, .120" Wall 14.85 1 14.85
3/16" 1018 Steel Plate 12"x24" 21.08 1 21.08
Aurora Spherical Bearings (50% Donated) 16.67 30 250.05
Water Jet Services 230 1 230
Total 652.36
Grand Total 2025.08

54
7. Testing and Evaluation
7.1 Overview
When testing a formula SAE vehicle there are many factors that may be taken into account
when the vehicle is being driven. In this case, the main focus was validating the suspension forces
that act thru the A-arm Testing would determine the axial loads placed on the A-arm links and will
also show any bending placed on the A-arm. These two factors are important when optimizing a
suspension system, with real time data you can redesign suspension components and specifically
suspension links with thinner wall thickness or bigger diameters based on the loadings achieved
during driving. Bending within the suspension links is an unfavorable factor that causes
discrepancies while driving the vehicle, and can cause failure of suspension components if
extreme.
7.2 Design of Experiments - Description of Experiments
In order to test the forces on the suspension links we refer to the calculation of strain within
a body. Knowing the equation, the material, the cross sectional area and measuring the strain
exerted on the suspension links it is possible to calculate the force exerted on the member with the
equation below.
𝐹𝑎𝑥𝑖𝑎𝑙 = 𝐸𝜀𝐴𝐴
To determine the unknown variable, strain, Vishay strain gages were placed on all the links.
In specific Vishay’s 125UT Tee Rosette was used in order to measure both strain in parallel and
perpendicular directions, in this case the directions correspond to axial and bending stresses
respectfully. A picture of the setup is shown below.
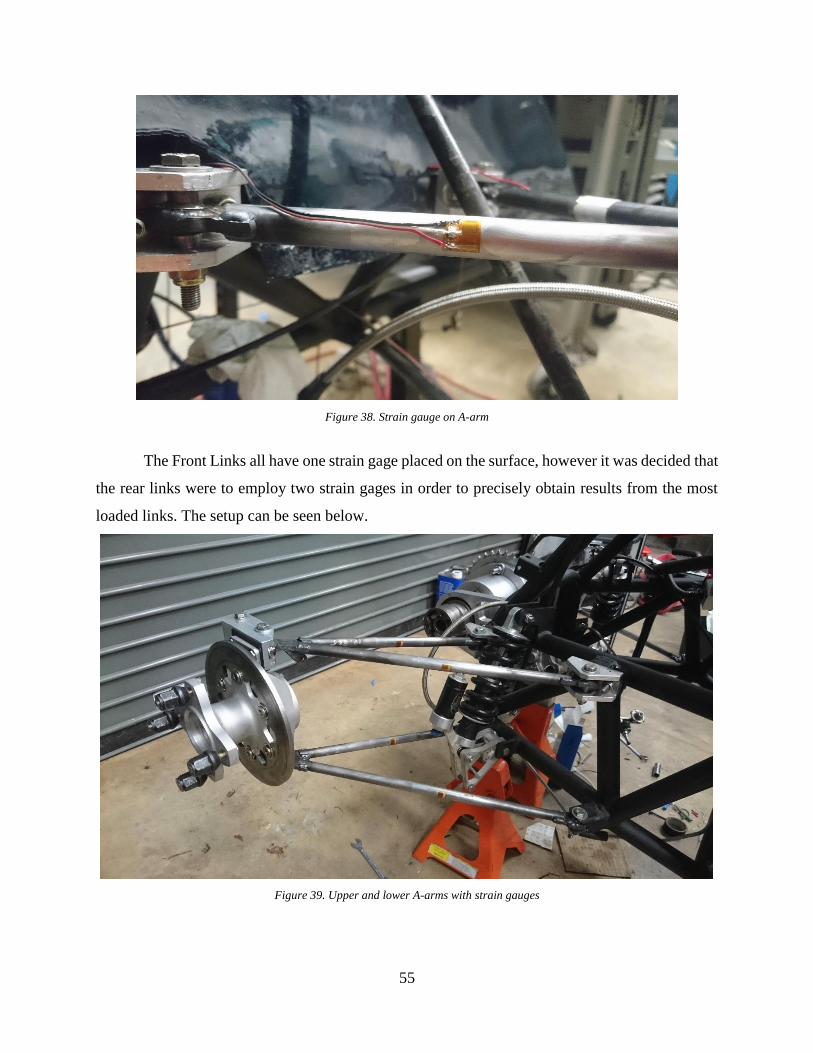
55
Figure 38. Strain gauge on A-arm
The Front Links all have one strain gage placed on the surface, however it was decided that
the rear links were to employ two strain gages in order to precisely obtain results from the most
loaded links. The setup can be seen below.
Figure 39. Upper and lower A-arms with strain gauges

56
The data will be recorded using a National Instruments Data Acquisition System, otherwise
known as a DAQ, and then be interpreted on a laptop using the supplied LabVIEW program. The
dynamic tests that will be performed are the same as those competed in within the Formula SAE
competition, with the exception of the endurance event. While recording data from the strain gages,
the coefficient of friction for the different events will be simultaneously tested for. To do this the
use of an onboard accelerometer is needed, this is convenient seeing as the onboard DL-1 DAQ
from Race Technology has a integrated 6g 3 axis accelerometer. This is useful as the acceleration
obtained from driving can then be used to calculate the coefficient of friction generated from the
nor.al force exerted on the tire.
7.3 Evaluation of Experimental Results
For evaluation the Formula SAE competition may be used, however with testing being
accomplished before the event evaluating the data and correlating it to that of the theoretical data
is a possibility. The Formula SAE event shall just be a guideline as to how the data is observed
and collected. The vehicle will be scored solely on the dynamic portions which include
acceleration, skid pad and autocross. The score will then be calculated using official FSAE
calculations as shown below.
Table 9. Scoring Calculation
Equations Max Points
𝑎𝑐𝑐𝑒𝑙𝑒𝑟𝑎𝑡𝑖𝑜𝑛 𝑠𝑐𝑜𝑟𝑒 =71.5 ∗ (
𝑇𝑚𝑎𝑥𝑇𝑦𝑜𝑢𝑟
) − 1
((𝑇𝑚𝑎𝑥𝑇𝑚𝑖𝑛
) − 1) + 3.5
(Tmax = 150% Tmin, Tmin=elapsed time of fastest car, Tyour= your time)
75
𝑆𝑘𝑖𝑑𝑝𝑎𝑑 𝑆𝑐𝑜𝑟𝑒 =47.5 ∗ (
𝑇𝑚𝑎𝑥𝑇𝑦𝑜𝑢𝑟
)2
− 1
((𝑇𝑚𝑎𝑥𝑇𝑚𝑖𝑛
)2
− 1) + 2.5
(Tmax = 150% Tmin, Tmin=elapsed time of fastest car, Tyour= your time)
50
𝑎𝑢𝑡𝑜𝑐𝑟𝑜𝑠𝑠 𝑠𝑐𝑜𝑟𝑒 = 142.5 ∗(
𝑇𝑚𝑎𝑥𝑇𝑦𝑜𝑢𝑟
) − 1
((𝑇𝑚𝑎𝑥𝑇𝑚𝑖𝑛
) − 1)
+ 7.5
(Tmax = 150% Tmin, Tmin=elapsed time of fastest car, Tyour= your time)
150

57
8. Design Considerations
8.1 Health and Safety
Due to the fact that weight savings is one of the top priorities for the Senior Design Team,
close attention must also be paid to safety because factors of safety will be lower than in typical
driving applications due to the decrease in material being used for structural components. This will
be done by performing a series of simulations ran at different load values in order to determine the
most ideal design that combines both safety and weight savings.
In addition to monitoring the structural integrity of the suspension package, a ride
frequency must be obtained that enables the driver to easily control the car. Any potential loss of
control could result in severe over or understeer, resulting in a possible crash.
8.2 Assembly and Disassembly
Various subsystems within the suspension package must be assembled prior to the full
assembly of the package. Specifically, the A-arms involve a press fit bearing, as well as a series
of welds, vital to the structural integrity of the pieces. Besides welding involved in the A-arms, the
priority of the assembly occurs due to fasteners, such as nuts and bolts. Although uniformity of
parts used is ideal, various diameters of nuts and bolts are used depending on what the geometry
of the subsystem allows.
Once the entire suspension package has been assembled separately from the chassis, the
body of the car must be placed on to the car. This must occur prior to the mounting of the
suspension package because the body is unable to be mounted if the suspension is already in place.
Additional information on the assembly of the sub-components can be found in Chapter 6.
8.3 Manufacturability
In designing the suspension package, one of the main items to consider is
manufacturability. One must ask how easily something can be made, and how much will it cost if
outsourcing is needed. A large portion of the manufacturing was performed in house on the lathe,
band saw, and end mills. In addition to those pieces of equipment, the TIG welder has been of
utmost importance to the Senior Design Group because many of the components required welding.

58
In addition to needing welding, many of the components used were composed of aluminum, which
made TIG welding one of the only forms of welding accepted to the design team.
Three major components of the suspension package had to be outsourced due to the
complexity of their design. These three components were the uprights, wheel hubs, and bellcranks.
Fortunately, the difficulty that came in manufacturing these three components was offset by a
series of donations and discounts from various companies.
8.4 Maintenance of the System
The longest amount of time that many of the components are expected to be used is one to
two years. Therefore, the longevity of the components are designed as such. One of the key items
that was modified in order to aid in any future maintenance was the upright and wheel hub package.
Should any bearings ever fail, which is far more unlikely after the modifications made, the
replacement of them will be much easier due to accessibility.
8.5 Environmental Impact
There were virtually no negative environmental impacts made by the creation of the
suspension package. The car is infrequently ran, and therefore, does not emit much pollution. A
large amount of the materials used were already found in the machine shop, this reduced any form
of pollution through waste elimination, and reduced carbon emissions due to the lack of shipping.
9. Design Experience
9.1 Overview
While designing the suspension package for the Panther Motorsports team, it became very
apparent to the Senior Design Group that the design process would be a very painstaking and
involved process. Because the suspension package is a subsystem of the entire FSAE car, it must
be seamlessly integrated into the rest of the car. With that being said, a very detailed collaboration
was conducted between the Senior Design Group for the suspension and for the chassis. In doing
so, it was understood what forces were to be used in simulation.
Another key feature that was to be taken into serious consideration while designing was
the pre-existing geometry of the car. Specifically, the chassis mounts on the car significantly

59
affected how the geometry of the suspension package would take shape. Because the suspension
geometry was limited by the chassis, special attention was to be paid to all other parameters of the
previous suspension in order to maximize performance, all while maintaining a somewhat similar
geometry.
As mentioned previously in the report, the Panther Motorsports financial standing must
always be taken into consideration. Therefore, the design goals of the Senior Design Group were
largely governed by the financial limitations of the Panther Motorsports team as a whole.
9.2 Standards Used in the Project
The standards used throughout the project primarily come from two sources. For all of the
metal grades and specifications, ASTM standards are used. Being that the competition is held and
sponsored by the Society of Automotive Engineers, many of the standards used for the car are
developed by the SAE.
Because the car is specifically used for racing and not for every-day use, many standards
do not apply to it. The majority of the standards are SAE standards because they are required to be
met in order to simply gain entrance into the competition.
9.3 Impact of Design in a Global and Societal Context
The design and manufacturing of the Panther Motorsports car does not immediately have
an effect on the world or society. However, the experience and technologies developed while
participating in the Panther Motorsports team will be used in the future in order to aid all aspects
of the globe and society. Specifically, one of the goals of this project was to research many of the
benefits and capabilities of carbon fiber used for structural components. Although the carbon fiber
was not used in the final design of the suspension, a large amount of knowledge on the subject
matter was acquired that can be used in the future to eventually lower the weight of the car. As
mentioned before in the report, the weight savings could eventually lead to lower fossil fuel
consumption in the future if the technology be applied to more of the car.

60
9.4 Professional and Ethical Responsibility
This particular involves a lot more attention to detail in that the factor of safety for many
of the components is lower due to the fact that weight savings is a huge priority. However, finding
the balance between weight savings and safety requires a lot more diligent work. It is not only the
responsibility of the team to make sure that the driver of the Panther Motorsports’ car is safe, but
also that all people near the car be safe while the car is operating.
This close attention to detail is applicable towards all future projects that the members will
be working on. It is the responsibility of all engineers to thoroughly monitor all design processes
in order to ensure that the job was done well and properly.
9.5 Life-Long Learning Experience
By participating in the Senior Design Project, all members of the group have grown in
many ways. Specifically, all members have become much more skilled in time management and
analytical thinking. Analytical thinking is one of the most sought after skills in the working world
that make engineers one of the most desired candidates for any position. While working with one
another, each member learned what their strongest skills were and how to apply them in order to
contribute to a high efficiency project. While learning what their strong skills were, each member
also developed skills in delegating work to team members in order to achieve a common goal in a
timely fashion.
10. Conclusion
10.1 Conclusion and Discussion
The FSAE suspension package is a complex system of components that have all undergone
rigorous engineering study. By utilizing parameters derived from top performance metrics, a total
analysis was performed. The two scenarios of encountering a curve of 1.3 G’s and breaking during
a curve, provided the team with an idea of the forces developed from acceleration. From there, a
ground-up approach was taken in order to produce a final design.
Everything begins with the wheel and tire setup up. From there, the forces developed from
driving are transmitted into the wheel hubs. These aluminum wheel hubs then proceed to transmit
the forces through the axle and upright. Upon reaching the upright, the force from driving is then

61
transferred to both the top and bottom A-arms. Depending on whether one is focusing on the front
or rear of the car, the pivoting motion of the A-arms is handled by the push or pull rod. This rod is
then connected to the lower A-arms and either pushes or pulls on the bell cranks. These bell cranks
are then mounted to the chassis. In addition, the A-arms are also mounted to the chassis. The
movement of the A-arms is permitted by the use of spherical bearings at all mounting points.
A large portion of funding for the project came from FCA, Chevron, and Mauer Welding
Supply. Additionally, significant funding came from the Toyota Technical Center in order to have
all four uprights machined. The total amount of money coming from the team was well below
$1,000, which would not have been possible, had it not been for the sponsors.
The car will perform in the Michigan FSAE competition at the end of May, where overall
judging of the car will take place. This will be another way in which the team can gauge the
performance of the suspension, and any future improvements it may require.
10.2 Evaluation of Integrated Global Design Aspects
By participating in an FSAE activity, one can soon become familiar with the use of
standards, rules, and regulations. Although standards vary from country to country, the
understanding of their importance and knowledge of when to apply them into designing is a skill
needed by all engineers over the world. By completing this project, the team will have gained
knowledge in the following areas:
1. Automotive Design Standards (SAE)
2. Geometric Dimensioning and Tolerancing
3. Structural Carbon Fiber
A skill that is all too often ignored is GD&T. However, it was frequently used throughout
the project because many of the parts had to be externally machined. Parts that held bearings or
would encounter high loading were especially in need of precise tolerancing in order to
successfully assemble the suspension package. Skills like these are universal, in that they must be
used throughout the world in order to complete a project that could potentially affect the lives of
many people.

62
One of the primary areas of focus throughout the project was structural carbon fiber.
Unfortunately, the carbon fiber tubing was not used in the final revision of the car due to financing
the aluminum mounts required. However, a study was conducted to determine the feasibility of
incorporating them into the 2017 FSAE car. By studying structural carbon fiber and its benefits, it
is possible to eventually replace more structural steel components with carbon fiber. By decreasing
weight in vehicles, it may be possible to move to engines with lower displacement. This decrease
in engine size could potentially lead to less fossil fuel consumption, which would benefit everyone
in the world.
10.3 Evaluation of Intangible Experiences
All members of the team have gained new skills throughout the experience. Specifically,
each member has dealt with roles in which leadership was required. It should be noted that while
working on the project, Luis Rojas was simultaneously acting as the Chief Engineer for the entire
Panther Motorsports Team.
The skill that proved to be the most useful throughout the entirety of the project was time
management. It was understood from the beginning of August that I tight schedule was to be held
in order to successfully complete the entire FSAE car. That being said, it was also known that there
was significant pressure placed on the Senior Design group to complete the research, design, and
manufacturing of the suspension. By utilizing the skill of time management, all deadlines were
met, enabling the car to perform in the competition held in Michigan.
In house manufacturing led to significant savings with the project. It also equipped each
member of the Senior Design group with new manufacturing skills. After completing the project,
all members of the team have become experienced in operating a lathe, end mill, band saw, and
other machinery within the FIU Student Machine Shop.
Finally, all members of the team developed and put to use their interpersonal skills. In order
to resolve any conflicts with the car, all business had to be conducted in a professional manner.
This is very similar to what will be happening in the futures of graduating engineers. Thanks to
the cohesive environment the Senior Design Group created, no issues were ever left unresolved,
and the car was successfully completed.

63
10.4 Patent/Copyright Application
There will be no use of a patent or copyright application as the car is the sole property of
Florida International University. FSAE is an organization that fosters a learning environment in
which engineering students may gain the ability to successfully lead, design, and manufacture
automobiles. Although new cutting edge designs and technology may be discovered while
participating in the Panther Motorsports Team, no part of the car will be patented.
10.5 Commercialization Prospects of the Product
As mentioned in Section 10.4, the FSAE car is not meant for profit, but as a tool for learning
designated for the FIU engineering students. The car is not meant to be commercialized. However,
experience gained throughout the projects of the car may someday lead to future inventions.
10.6 Future Work
The car will always be a work in progress. Through each passing year, the car becomes
better, and the team as a whole, gains more knowledge. After completing this project, it is the
hopes of the Senior Design Group that the Panther Motorsports team pursues the use of carbon
fiber for structural components of the suspension. Even though the funding was limited for the
2016 car, the use of carbon fiber for structural components would most definitely provide the team
with much more design points and reduced weight.

64
References
[1]Aboudi, J., & Arnold, S. (2013). Micromechanics of composite materials a generalized
multiscale analysis approach. Amsterdam: Butterworth-Heinemann.
[2]Budynas, R., & Nisbett, J. (2011). Shigley's mechanical engineering design (9th ed.). New York:
McGraw-Hill.
[3]Milliken, D. (2003). Race car vehicle dynamics: Problems, answers, and experiments.
Warrendale, PA: SAE International.
[4]Pacejka, H., & Besselink, I. (2012). Tire and vehicle dynamics (3rd ed.). Oxford, UK:
Butterworth-Heinemann ;.
[5]Smith, C. (1978). Tune to win. Fallbrook, CA: Aero.
[6](n.d.). Retrieved November 25, 2015, from http://fsaeonline.com/page.aspx?pageid=e179e647-
cb8c-4ab0-860c-ec69aae080a3.

65
Appendices
Appendix A: 2015-2016 Formula SAE Rules

66

67

68

69

70

71

72

73

74

75
Appendix B: Milliken and Milliken Race Car Vehicle Dynamics

76

77

78
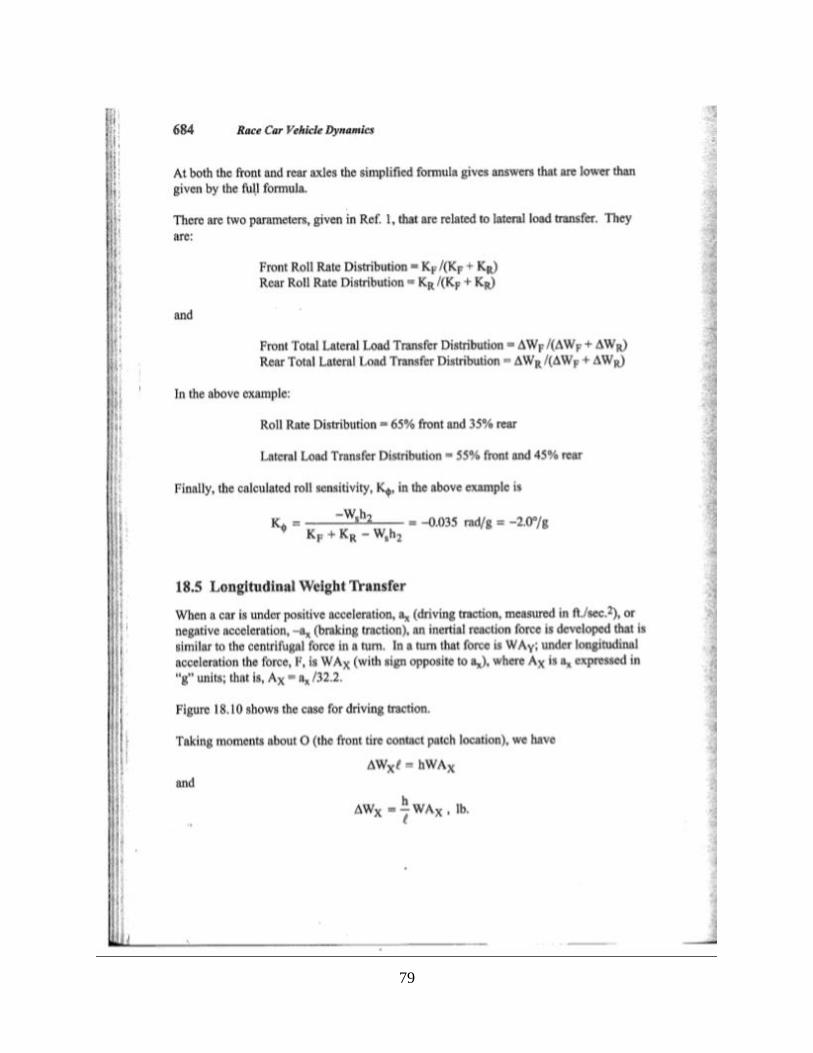
79
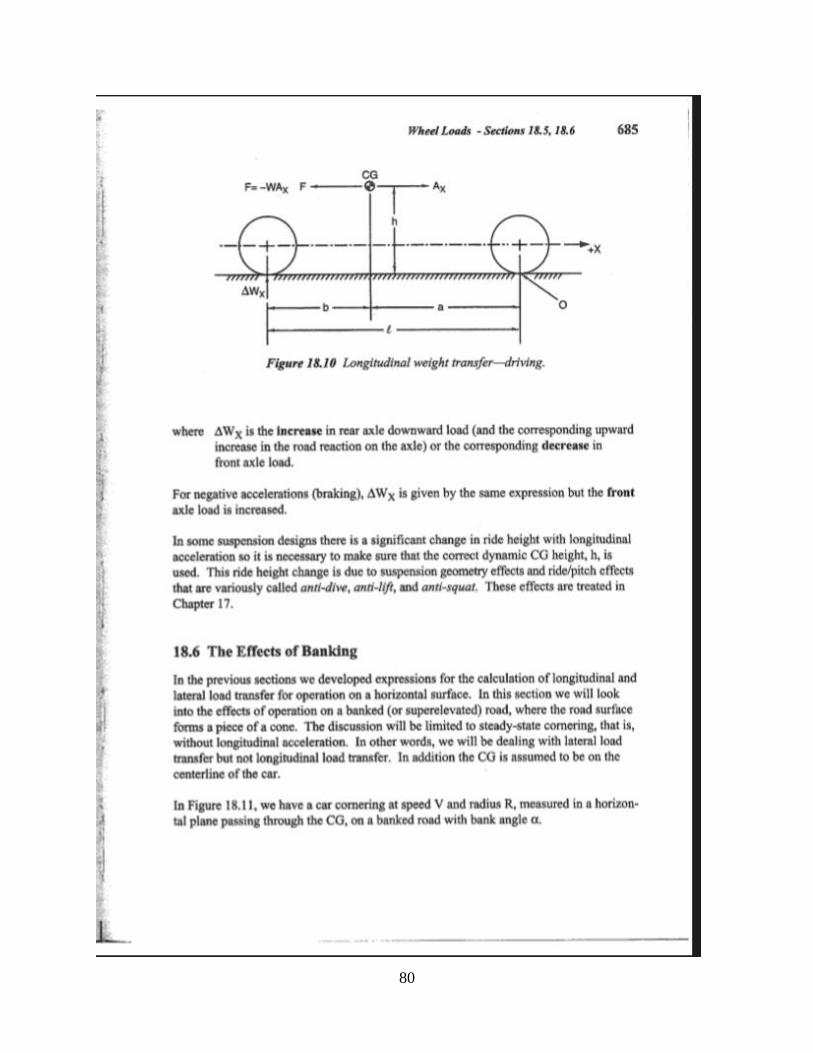
80

81
Appendix C: Calspan TTC Data

82