seca core program – seca core program seca core … library/research/coal/energy systems... ·...
TRANSCRIPT

SECA Core Program – Recent Development of SECA Core Program Modeling Activities at PNNL
SECA Core Program –– Recent Development of Recent Development of Modeling Activities at PNNL Modeling Activities at PNNL
MA KhaleelEmail: [email protected] Phone (509) 375-2438
KP Recknagle, Z Lin, B Koeppel, S Moorehead, KI Johnson, N Nguygen
Pacific Northwest National LaboratoryRichland, WA 99352
Don CollinsNational Energy Technology Laboratory
2
Integrated Modeling of Solid Oxide Fuel Cells
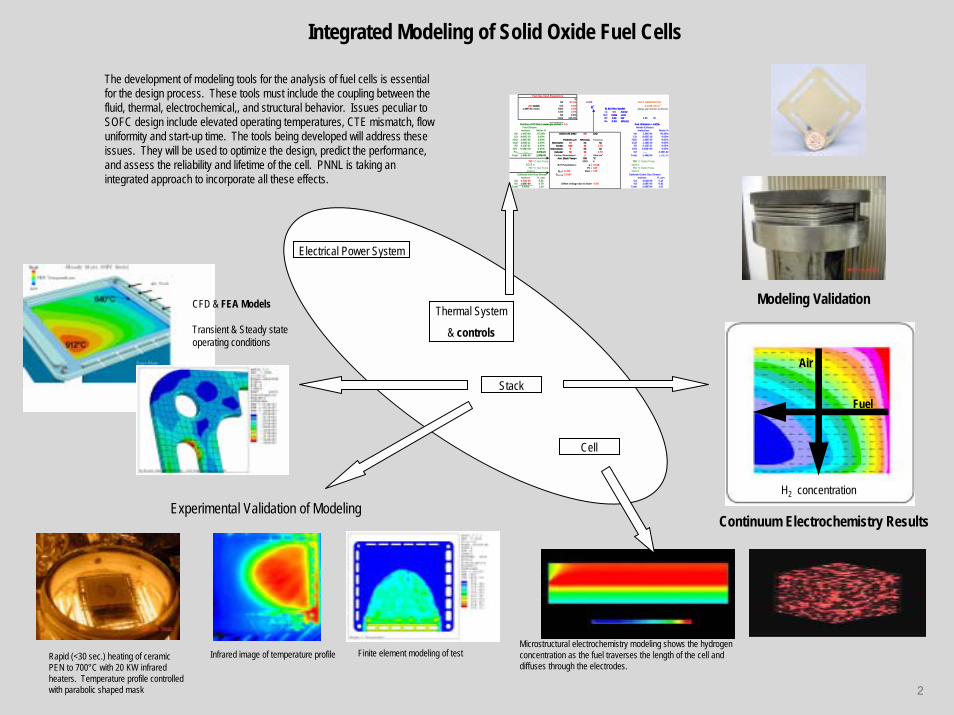
The development of modeling tools for the analysis of fuel cells is essential for the design process. These tools must include the coupling between the fluid, thermal, electrochemical,, and structural behavior. Issues peculiar to SOFC design include elevated operating temperatures, CTE mismatch, flow uniformity and start-up time. The tools being developed will address these issues. They will be used to optimize the design, predict the performance, and assess the reliability and lifetime of the cell. PNNL is taking an integrated approach to incorporate all these effects.
%H2 97.0% 0.970 HEAT GENERATION
200 sccm CO 0.0% -0.2088 W/cm2
1.49E-04 mol/s H2O 3.0% (Minus sign denotes exotherm)CO2 0.0% i = 0.5 A/cm2
N2 0.0% Vi = 0.869 voltsTotal 100.0% P= 0.00 kW 1.65 W
P= 0.43 W/cm2Fraction of CO that is water-gas shifted = 0.5 Fuel Utilization = 6.82%
mol/sec Molar % moles/sec Molar %H2 1.44E-04 97.00% Active cell area= 3.8 cm2 H2 1.34E-04 90.38%CO 9.64E-10 0.00% CO 8.85E-10 0.00%
H2O 4.46E-06 3.00% Thickness ,µm %Porosity Tortuosity H2O 1.43E-05 9.62%CO2 3.64E-11 0.00% Electrolyte= 10 na na CO2 1.15E-10 0.00%
N2 4.13E-21 0.00% Anode= 600 30 2.50 N2 4.13E-21 0.00%CH4 0.00E+00 0.00% Interconnect= 0 na na CH4 0.00E+00 0.00%Po2 ------ 2.67E-23 Cathode= 50 30 2.50 O2 ----- 3.16E-22
Total 1.49E-04 1.00E+00 Contact Resistance= 0 Ohm-cm2 Total 1.49E-04 1.00E+00Ave. Stack Temp= 750 °C
750 °C Inlet Temp 1023 K 750 °C Outlet Temp1023 K B-V Parameters: α = 0.518 1023 K
750 °C Inlet Temp Px = 127 750 °C Outlet Temp1023 K QH2= 0.425 Eact = 110 1023 K
Dsurf-H2 0.0107mol/sec P, atm mol/sec P, atm
O2 4.50E-05 0.21 O2 4.01E-05 0.19N2 1.69E-04 0.79 Offset voltage due to leak= -0.06 N2 1.69E-04 0.81
Total 0.0002 1.00 Total 2.09E-04 1.00
ELECTRIC WORK
Anode Exhaust
Cathode Inlet Gas Stream Cathode Outlet Gas Stream
Fuel Stream
Fuel Gas Input Parameters
e-
Experimental Validation of Modeling
CFD & FEA Models
Transient & Steady stateoperating conditions
Thermal System
& controls
Stack
Cell
Electrical Power System
Modeling Validation
H2 concentration
Fuel
Air
Rapid (<30 sec.) heating of ceramic PEN to 700°C with 20 KW infrared heaters. Temperature profile controlled with parabolic shaped mask
Infrared image of temperature profile Finite element modeling of testMicrostructural electrochemistry modeling shows the hydrogen concentration as the fuel traverses the length of the cell and diffuses through the electrodes.
Continuum Electrochemistry Results
3
OutlineOutlineOutline
Quick Updates on SECA supercomputer, software tools and trainingExperimental validation case for the thermo-fluid-electrochemical modeling of planar SOFC stacks.Coupled thermal, electrochemistry and flow simulation for full geometry planar SOFCs by finite element analysis.Thermal-mechanical stress analysis of compressive seals in SOFC stacks.SOFC system modeling and controls.

4
Solid-State Energy Conversion Alliance (SECA) Modeling and Simulation Training Session
August 28th and 29th
AGENDA
Day 1:STAR-CD basics & fuel cell modeling (adapco)
MARC basicsMARC fuel cell modeling
FLUENT basics & fuel cell modeling
Reception
Day 2:EC Spreadsheet Model User Training
EC in CFD code (using STAR-CD as example)Matlab / System Models User Training
EC in FE code (using MARC as example)Feed back / Comments

5
Training ParticipantsTraining ParticipantsTraining Participants

6
New SECA Computational ResourceNew SECA Computational ResourceNew SECA Computational Resource
Objectives:! Provide SECA Industrial Teams access to a high-
performance computer for numerical analysis of Fuel Cell designs using commercial software with PNNL developed Fuel Cell sub-models
! Provide platform for continued sub-model development and testing
Time Line:! Arrived Friday September 26th
! Operational within 2 weeks

7
Computer InformationComputer InformationComputer Information
Silicon Graphics Inc" 3700 Altix Server" Linux based" 24 Intel “Madison” CPUs" Expandable to 64 CPUs in
current chassis" 64 GBytes RAM - Shared
Memory - also greatly expandable
" Binary compatibility with PNNL 128 CPU SGI computer

8
Offsite Access for SECA Industrial Team Members
Offsite Access for Offsite Access for SECA Industrial Team MembersSECA Industrial Team Members
All offsite non-PNNL users will need to be hosted by a PNNL staff memberHost will complete a Computer Access Request Form and Smartcart RequestOffsite computers must have a Hardware Firewall (PNNL staff use Linksys), or a software Firewall (Hardware Firewall is preferred)Access is via:" VPN software for PC or Macintosh Platforms (provided by PNNL)" ssh (secure shell) for Unix/Linux" Users connect into PNNL using Smartcard (transient passwords in
sync with PNNL base station)

9
PNNL 128 CPU SGI Computer PNNL 128 CPU SGI Computer PNNL 128 CPU SGI Computer

10
Commercial Software ToolsSteve MacDonald, the president of the CD adapco Group, has agreed with Dr. Moe Khaleel of PNNL to develop an expert system module for solid oxide fuel cell simulation. The es-sofc module will use as it’s basic engine the PNNL electro chemical simulation subroutines in combination with STAR-CD. The first release will occur in January,2004.
Reza Sadeghi, VP for software development at MSC, has agreed to develop within the MARC code solid oxide fuel cell simulation (flow, electrochemical, thermal and stress) with a user interface. The module will use as it’s basic engine the PNNL electro chemical simulation subroutines in combination. The first release will occur in January,2004.
Lewis Collins, Fluent, and PNNL signed a joint development agreement to work on the development of solid oxide fuel cell simulation. The agreement was signed August 2003.

Experimental validation case for the thermo-fluid-electrochemical modeling of planar SOFC stacks
Experimental validation case for the tthermo-ffluid-eelectrochemical mmodeling of pplanar SOFC sstacks

12
Experimental Setup - HardwareExperimental Setup Experimental Setup -- HardwareHardware
Typical One-cell, cross-flow stack" 110 cm2 active cell area" Stack rested upon 3.1 cm thick
hearth plate and insulating material
" Air and fuel inflow and outflow lines enter and exit the hearth plate sides via metal tubing.
" Atop the stack was a 1.5 cm thick load plate
" The assembly was enclosed in an electric resistance heated oven to control stack temperature.
Fuel and air inflow and outflow temperatures were measured using thermo-couples located mid-manifold, within the hearth plate, near the gas ports. Fuel inflow Port
Hearth Plate Load Plate
Cell
Air inflow Port

13
Experimental Setup – Test ConditionsExperimental Setup Experimental Setup –– Test ConditionsTest Conditions
Inputs:Fuel: 2 slpm H2 + 2 slpm N2
Air: 6 slpmCell Voltage: 0.7Target operating temperature: 750 C" Controlled by the oven temperature and monitoring of the gas inflow
and outflow temperaturesOutputs:
Quantities for comparison with prediction:" Power = 40 Watts (57 Amps @ 0.7 Volts), [20% fuel utilization]" Measured gas stream temperatures
14
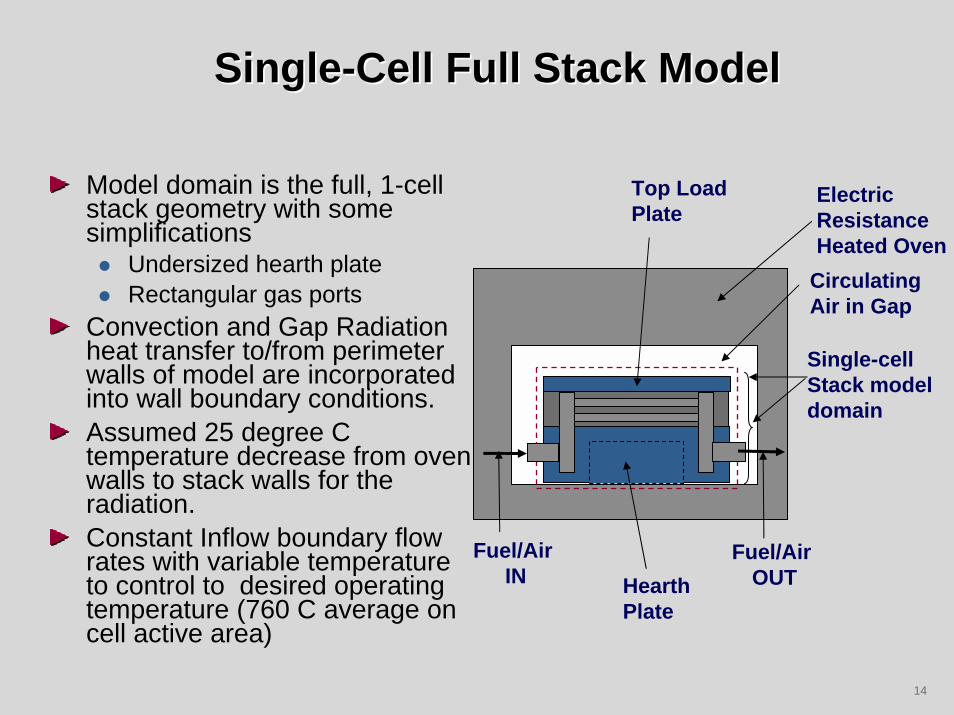
Single-Cell Full Stack Model SingleSingle--Cell Full Stack Model Cell Full Stack Model
Model domain is the full, 1-cell stack geometry with some simplifications " Undersized hearth plate" Rectangular gas ports
Convection and Gap Radiation heat transfer to/from perimeter walls of model are incorporated into wall boundary conditions.Assumed 25 degree C temperature decrease from oven walls to stack walls for the radiation.Constant Inflow boundary flow rates with variable temperature to control to desired operating temperature (760 C average on cell active area)
CirculatingAir in Gap
Single-cellStack modeldomain
Fuel/Air OUT
Top LoadPlate
ElectricResistanceHeated Oven
Fuel/Air IN Hearth
Plate

15
Cathode Air Elements OnlyCathode Air Cathode Air Elements OnlyElements Only
Cathode Air, PEN, & Fuel Elements
Cathode Air, PEN, & Cathode Air, PEN, & Fuel ElementsFuel Elements
Cathode Air and PEN ElementsCathode Air and Cathode Air and PEN ElementsPEN Elements
With Seals and Spacers
With Seals and With Seals and SpacersSpacers

16
Full Model with Hearth and Top PlateFull Model with Hearth and Top PlateFull Model with Hearth and Top Plate89000
computational elements
" 39000 fluid" 50000 solid
Converged solution in 140 iterations
Compute time: 12-minutes
" Run on 8 HP/Linux “Itanium2” 1.5 GHz processors

17
Calculation Inputs & ConditionsCalculation Inputs & ConditionsCalculation Inputs & Conditions
Inputs:Fuel: 2 slpm H2 + 2 slpm N2Air: 6 slpm AirCell Voltage: 0.7Target operating temperature of 750 C yielded gas stream temperatures that were 5-8 degrees lower than those measured.Therefore: Target temperature set to 760 C" Resulted in slightly elevated power and fuel utilization & reasonable
temperature match.Outputs:
Power & Fuel Utilization" Experimental: Power = 40 W (57 Amps @ 0.7 Volts), [20% fuel utilization]" Predicted: Power = 44 W (63 Amps @ 0.7 Volts), [22% fuel utilization]
Gas stream temperatures (next slide)#
Butler-Volmer Parameters:alpha = 0.56
pre-exp = 1300e-act = 133

18
Comparison of Measured and Predicted Gas Stream Temperatures
Comparison of Measured and Predicted Comparison of Measured and Predicted Gas Stream TemperaturesGas Stream Temperatures
Gas temperatures taken mid-manifold,in line with ports – coinciding with Thermocouple locations.
Predicted Temperature -Inflow range: 744-749 COutflow range: 747-752 C
Air in
Air out
Fuel in
Fuel out
Gas Flow Temperatures
745
749 749
754
746
751
747
752
740742744746748750752754756
Air IN Air OUT Fuel IN Fuel OUT
Flow Port
Tem
pera
ture
, C
MeasuredPredicted
Temperature Plot: Subset of model containing air & fuel elements at level of ports
Fuel Utilization:- Experiment: 20% - Model: 22% (current x 6.96 = cm3/min H2 burned)

19
Cell/Stack Temperature DistributionCell/Stack Temperature DistributionCell/Stack Temperature Distribution
Relatively isothermal compared to stack operating in insulated enclosure" 15-degree C delta-T
on present cell" 94-degree C delta-T
on insulated cell (fpc1c750.4gps.mdl)
Stack in heated oven(present case)
Stack in insulatedenclosure with similaraverage temperature (750C)and 22 W (32 Amps @ 0.7 Volts)

20
Current DensityCurrent DensityCurrent Density
Relatively uniform current density in this “oven heated” case
Insulated stack

21
Hydrogen ConcentrationHydrogen ConcentrationHydrogen Concentration
Insulated stack
Uniform fuel utilization

22
ConclusionsConclusionsConclusions
Suitable gas stream temperature match achieved at elevated cell temperature – thus elevated power and fuel utilizationPredictions matched inflow and outflow gas temperatures to within 2-degrees CCell temperature of experimental “oven heated” stack relatively isothermal compared to “insulated” stack ( 15-degree ∆T, compared to 94-degree ∆T)Relatively uniform current densityUniform fuel utilization

Coupled Thermal, Electrochemistry and Flow
Simulation for Full Geometry Planar SOFCs by Finite
Element Analysis
Coupled Thermal, Coupled Thermal, Electrochemistry and Flow Electrochemistry and Flow
Simulation for Full Geometry Simulation for Full Geometry Planar Planar SOFCsSOFCs by Finite by Finite
Element AnalysisElement Analysis

24
Purpose of Current Modeling Effort Purpose of Current Modeling Effort Purpose of Current Modeling Effort Develop multi-cell SOFC models in the Marc code.Extend previous electrochemistry-active-area-only SOFC models to include the intake and exhaust manifolds and the picture frames in the heat transfer and thermal stress solutions.Current models provide a platform for " linking PNNL’s electrochemistry module to a generic fuel
cell model." MSC development of a graphical user interface for
industry partners to define their fuel cell models.Both heat transfer (with coupled EC) and thermal stress models have been developed.

25
Layered Construction of Full-Feature Model
Interconnect and Cathode Spacer
Air in Channel and Manifolds
Pictureframe and PEN layers
Closeup of Layers in Planar Constructionof the 4-Cell Model
CloseupCloseup of Layers in Planar of Layers in Planar ConstructionConstructionof the 4of the 4--Cell Model
44--Cell Model Showing Cell Model Showing Layered Construction
Fuel in Channel and Manifolds Layered Construction Cell Model

26
Linkage between EC module and MARCLinkage between EC module and Linkage between EC module and MARCMARCMARC source subroutine (flux(f,ts,n,time))
Input temperature profile and geometry info↓ ↑return heat flux and other state variables
EC module interface subroutine
MARCFlow – Thermal - Electrical -
MechanicalSTRESSES
FLUX
Heat Flux
PLOTV
ELEVAR
EC
T, pp(i)
Cell Voltage
Gas, Chemistry,
Heat Generation
Update
State Variables
Model Geometry, Temperature, Current Distribution

27
Coupling of EC to the Full-Feature Marc Model
Coupling of EC to the Coupling of EC to the FullFull--Feature Feature MarcMarc ModelModel
EC operates on an internal mesh and maps the heat fluxes in the PEN active area to the Marc mesh.
This is done for each cell.
EC Heat Fluxes
Marc Thermal Solution
Marc calculates temperatures and stresses based on the EC heat fluxes and passes the temperatures back where they are mapped onto the EC internal mesh.

28
Results for the 2-cell stack(Electrolyte and pictureframe)
Temperature Profiles
Current Density Profiles

29
Species concentration calculated in active area
H2 CO
O2H2O

30
Thermal Stress Predictions from theMarc-EC model
Thermal Stress Predictions from theThermal Stress Predictions from theMarcMarc--EC modelEC model
Temperature profiles from coupled Marc-EC model were applied to a structural model to predict thermal stresses.The model could also be run in a single coupled thermal-stress run.Air and Fuel elements are deactivated.Current model assumes all layers are connected.Marc contact capabilities can be used to analysecompression seal designs as well.Stresses in electrolyte shown, results in all other layers are available.

31
Stresses in electrolyteStresses in electrolyteStresses in electrolyte
Sx
Sy
SxyX-direction stress
Y-direction stress
XY-direction stress

32
Thermal Stress Model of a 4-Cell StackThermal Stress Model of a 4Thermal Stress Model of a 4--Cell StackCell Stack
Temperatures specified on the 4-cell stack model
The thermal stress model can be run with a specified temperature distribution.
A 4-cell model was run to test memory size and solution times.
Seal stresses are presented on the next slide as example results.

33
Seal StressSeal StressSeal Stress
Seals between pictureframeand cathode side of PEN
Sx
Sy
Seals between Anode Spacer and Interconnect

Thermal-Mechanical Stress Analysis of Compressive Seals in SOFC Stacks
ThermalThermal--Mechanical Stress Analysis of Mechanical Stress Analysis of Compressive Seals in SOFC StacksCompressive Seals in SOFC Stacks

35
Compressive Seals: ObjectivesCompressive Seals: ObjectivesCompressive Seals: Objectives
Develop a method to analyze compressive seals" Permit components to slide relative to the seals
! Numerical convergence more difficult" Include effects of compression set and thermal cycling
Characterize compressive load distributionsCharacterize seal deformations and identify regions of potential seal damageDevelop constitutive relations for identified degradation mechanisms of compressive sealsDevelop leak rate predictions based on leak path development and/or seal damage

36
Compressive Seals: Example ModelCompressive Seals: Example ModelCompressive Seals: Example Model8-cell planar picture-frame design" 0.2 mm compressive mica
seals at interconnect-anode spacer interface
" Rigid seals at PEN-picture frame interface
Frictional contact at compressive seal interfacesLoad applied to top plate (nominal 200 psi compressive seal load)Simulatedtemperatureprofile
Top Plate
Cells
Base Plate

37
Compressive Seals: ResultsCompressive Seal Pressure Distribution
Compressive Seals: ResultsCompressive Seals: ResultsCompressive Seal Pressure DistributionCompressive Seal Pressure Distribution
Localized compression; susceptible to damage and leak development
Top
Bottom
Areas of no compression; fluid leakage

38
Compressive Seals: ResultsStack Deformation
Compressive Seals: ResultsCompressive Seals: ResultsStack DeformationStack Deformation
Displacements 50x
Deflection in top plate influences stack deformations" Applied load was distributed uniformly
Bending creates edge contact in the seals" Highly localized compression" Areas of no compression (separation)

39
Compressive Seals: ResultsCompressive Seal Pressure Variation
Compressive Seals: ResultsCompressive Seals: ResultsCompressive Seal Pressure VariationCompressive Seal Pressure Variation
50.0
60.0
70.0
80.0
90.0
100.0
110.0
1 2 3 4 5 6 7 8Cell Number
Aver
age
Com
pres
sion
(% n
omin
al)
300.0
400.0
500.0
600.0
700.0
Pea
k C
ompr
essi
on (%
nom
inal
)
Cell Average CompressionCell Peak Compression
Bottom Top
Seal Deformation

40
Compressive Seals: ResultsCompressive Seal Principal Stresses
Compressive Seals: ResultsCompressive Seals: ResultsCompressive Seal Principal StressesCompressive Seal Principal Stresses
Top
Bottom
12 MPa maximum

SOFC System Modeling and Controls
SOFC System Modeling and SOFC System Modeling and ControlsControls

42
SOFC System Modeling and ControlsSOFC System Modeling and ControlsSOFC System Modeling and Controls
Purpose: improve SOFC system efficiency and durability through better control techniques.
Goal: develop system models and control techniques for a complete SOFC system.

43
System ModelSystem ModelSystem Model

44
SOFC System ModelSOFC System ModelSOFC System Model
Major system model components: controller, electrical system, reformer and SOFC stack.SOFC model is based on spreadsheet electro-chemical model. We extended the thermal aspects to deal with heat up phase and are adding dynamic components to the fuel utilization.Reformer model is a POx model and approximates diesel as C12.95H24.38 as fuel.Electrical system modeling models the power conversion electronics as well as the electrical loads such as air conditioning.

45
Stack + Reformer ModelStack + Reformer ModelStack + Reformer Model

46
VI CurvesVI CurvesVI Curves

47
SOFC System ControlSOFC System ControlSOFC System Control
The SOFC system is very complex and as electrical load demands change, the operating point of the reformer/fuel cell must be changed appropriately.A controller must control variables such as: fuel flow rate, reformate composition, cathode flow rate and temperatures throughout the system.Many of these variables are dependent on each other, and the controller must respond to potentially fast load changes.

48
Control ConceptControl ConceptControl Concept
Using a two phase controller – heat up/idle and operating.Heat up/idle controller" Uses a lookup table based on empirical data to specify
desired cathode inlet temp based on stack temp and cathode flow rate.
" Uses a PID controller to actuate HX bypass valve and control cathode temperature.
Operating Controller" PID control of anode flow rate based on fuel utilization.

49
ControllerControllerController

50
Heat Up/Idle ControllerHeat Up/Idle ControllerHeat Up/Idle Controller

51
Heat Up Controller ResultsHeat Up Controller ResultsHeat Up Controller Results
Fuel Utilization Controller Results

52
Future Steps - Compressive SealsFuture Steps Future Steps -- Compressive SealsCompressive Seals
Improve material model to include compressibility and recovery for compressible seal materials (e.g. mica gaskets)Improve material model to include creep effectsDetermine efficient contact element parametersTransfer model to MARC software environmentImplement thermal cycling routines to account for degradation of seal compressionDevelop relations to predict leak rate for compressive seal designs

53
Future Steps – Next QuarterFuture Steps Future Steps –– Next QuarterNext Quarter
Work with the software vendor to complete the beta version of es-sofc and MARC-sofc software tools.Perform validation studies on 3 cell stacks.Develop constitutive relations and FEA models for rigid and compressive stacks.Create high level and optimal controllers for the SOFC system.Hold a workshop to establish technical activities regarding long-term degradations.Publish draft modeling and simulation roadmap (October 2003)