secarb early test retrospective library/events/2016/fy16 cs rd/thur... · rite, bp, ccp, durham,...
TRANSCRIPT
SECARB Early Test Retrospective
Susan Hovorka, Ramón Treviño, Tip Meckel,
Jacob Anderson, Seyyed Hosseini, Jiemin Lu, JP Nicot,
Katherine Romanak, Changbing Yang, Vanessa Nuñez-Lopez
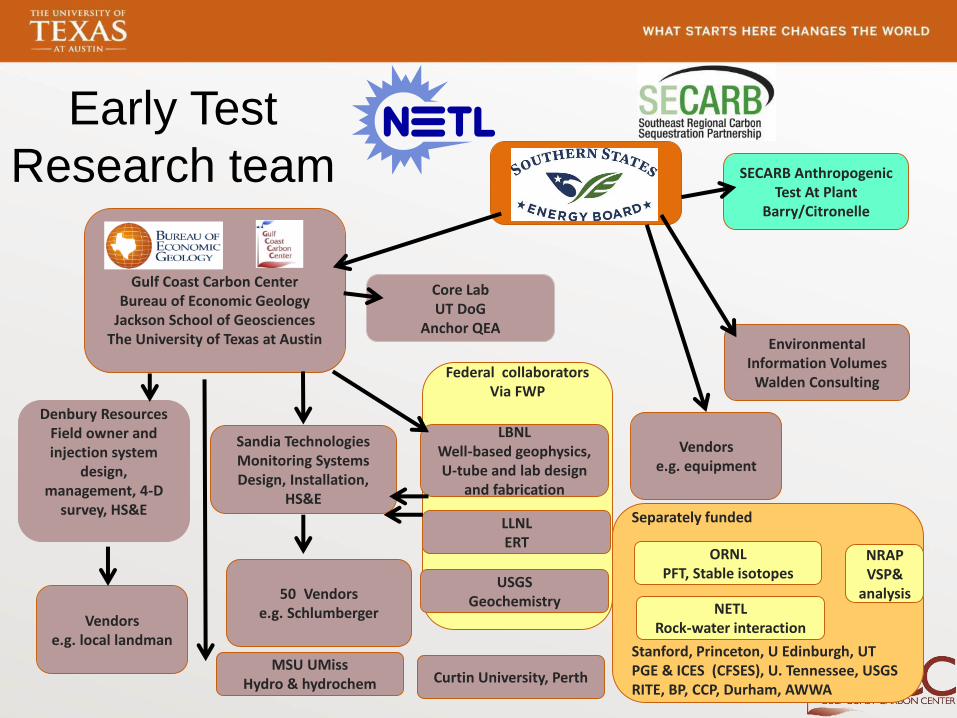
Federal collaboratorsVia FWP
Separately funded
Stanford, Princeton, U Edinburgh, UT PGE & ICES (CFSES), U. Tennessee, USGS RITE, BP, CCP, Durham, AWWA
Gulf Coast Carbon CenterBureau of Economic Geology
Jackson School of GeosciencesThe University of Texas at Austin
Sandia Technologies Monitoring Systems Design, Installation,
HS&E
Denbury ResourcesField owner and injection system
design, management, 4-D
survey, HS&E
LBNLWell-based geophysics, U-tube and lab design
and fabrication
LLNLERT
ORNLPFT, Stable isotopes
NETLRock-water interaction
USGSGeochemistry
Environmental Information Volumes
Walden Consulting
SSEB
50 Vendorse.g. SchlumbergerVendors
e.g. local landman
Vendorse.g. equipment
MSU UMissHydro & hydrochem
Core LabUT DoG
Anchor QEA
NRAPVSP&
analysis
SECARB Anthropogenic Test At Plant
Barry/Citronelle
Curtin University, Perth
Early Test
Research team
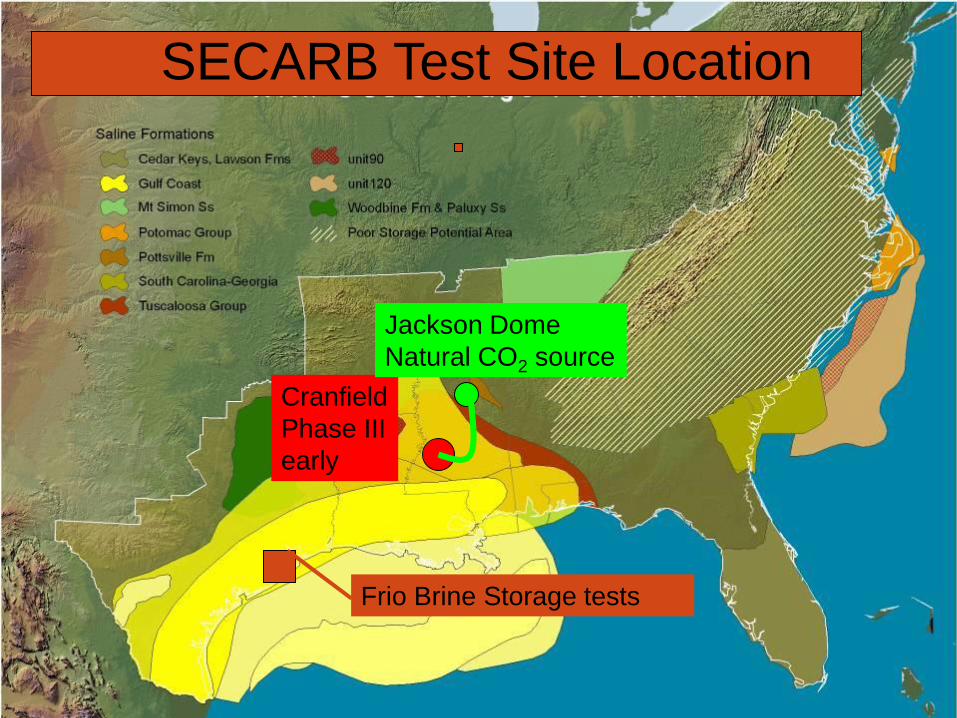
Frio Brine Storage tests
Cranfield
Phase III
early
Jackson Dome
Natural CO2 source
SECARB Test Site Location

Cranfield: geological location
DAS
Tu
scalo
osa F
m
Tuscaloosa D-E reservoir
Oil-water contact
Based on log annotation and
recent side-walls
Tuscaloosa confining system

Injector
Producer
(monitoring point)Observation Well
High Volume
Injection Test
(HiVIT)
Detail Area
Study DAS
GMT
Phase II
Five Study Areas
Pipeline head&
Separation facility
5km
GIS base Tip Meckel
Psite
5
EGL-7
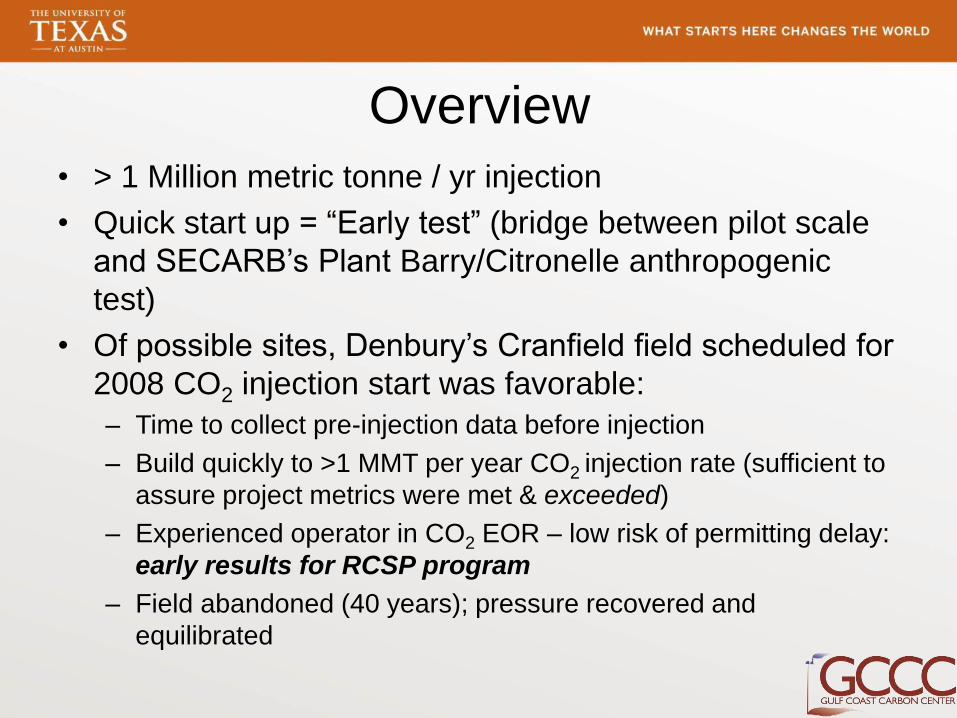
Overview
• > 1 Million metric tonne / yr injection
• Quick start up = “Early test” (bridge between pilot scale
and SECARB’s Plant Barry/Citronelle anthropogenic
test)
• Of possible sites, Denbury’s Cranfield field scheduled for
2008 CO2 injection start was favorable:
– Time to collect pre-injection data before injection
– Build quickly to >1 MMT per year CO2 injection rate (sufficient to
assure project metrics were met & exceeded)
– Experienced operator in CO2 EOR – low risk of permitting delay:
early results for RCSP program
– Field abandoned (40 years); pressure recovered and
equilibrated

Brine Phase II
InjectorProducer
Phase
III
InjectorObservation
wells
Observation Well
Residual
Oil
Favorable Characteristics of Cranfield for
SECARB Early test
• Follow-on
between Phase II
and Phase III
• Phase III planned
in water leg
downdip of oil
zone
• Provided RCSP
experience with
CO2 EOR, (grew
in importance)

Less than-ideal characteristics• CO2 from Jackson Dome (not anthropogenic)
• Field commercial EOR– operational aspects not under project’s control
– some data proprietary
• Research purpose only – Designed prior to EPA or international regulations
• Relatively complex geology both deep & near surface
• Modeling reservoir’s injection response complicated – by oil presence
– injection and withdrawal complexities – managed…
Simplified by: Focus on the DAS - brine only
Early timing - production & recycle was minimal

Developing the Experiment• Year-long series of meetings (2007-2008)
– designed plan
• Aligned general research objectives– well locations
– selected team members
– budget
• Designed detailed plans - major components
• Adapted to fast EOR field development – NEPA permitting (slow)
– other timeline issues • equipment rental
• procurement
• cash flow (2009 “cash call”)
Project objectives• Connect CO2 plume development with pressure
response
– in far-field of reservoir (“in-zone”)
• Above-Zone Monitoring Interval (AZMI) pressure
response
– first time in CCS
• Advance understanding of geomechanical
response (deformation, microseismic)
• Advance understanding of
– risk to groundwater / value of groundwater as a
monitoring approach
– soil gas methods as a monitoring approach

AZMI
surface
Casing
cemented to
isolate
Injection zone (IZ)
AZMI
TimeP
ressure
Injection
zone
AMZI
Confining zone

Team contributions (2)• LLNL
– Multiphase geophysics
– Cross-well EM fielding and interpretation
• USGS
– reservoir fluid sampling & analyses
• Schlumberger Carbon Services
– well logging
– Cross well Seismic
– AZMI fluid collection
• LBNL / NRAP
– U-tube,
– 3-D VSP
– downhole fiber optic CASSM
• Oak Ridge NL
– PFT and sampling
• University Edinburgh
– Noble gasses
• Local landowners
– access
• Walden Consulting
– NEPA

DAS Monitoring SiteInjector
CFU 31F1
Obs
CFU 31 F2
Obs
CFU 31 F3
Above-zone
monitoringF1 F2 F3
Injection Zone
Above Zone Monitoring
10,500 feet BSL
Closely
spaced well
array to
examine flow
in complex
reservoir
68m
112 mPetrel model Tip Meckel
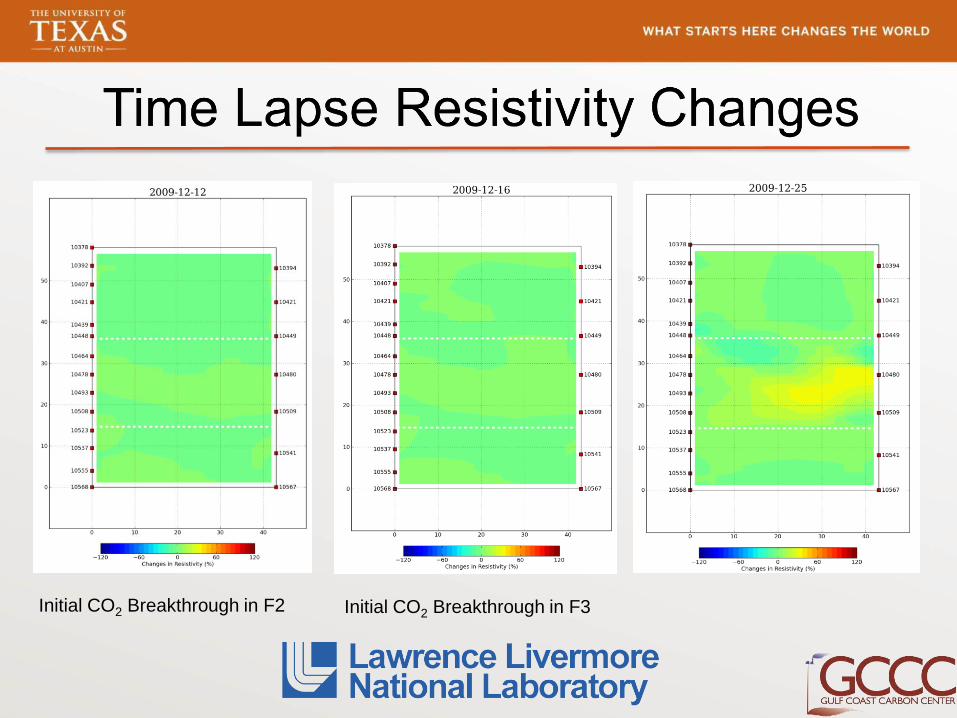
Initial CO2 Breakthrough in F2 Initial CO2 Breakthrough in F3

After Work-
over in 9/2010

Contributions: Support Collaborators
• CFSES
– rock samples for geomechanics
• NRAP
– field site for 3D-VSP
• SIM SEQ
– comparative modeling data set
• NETL
– CO2 EOR model data
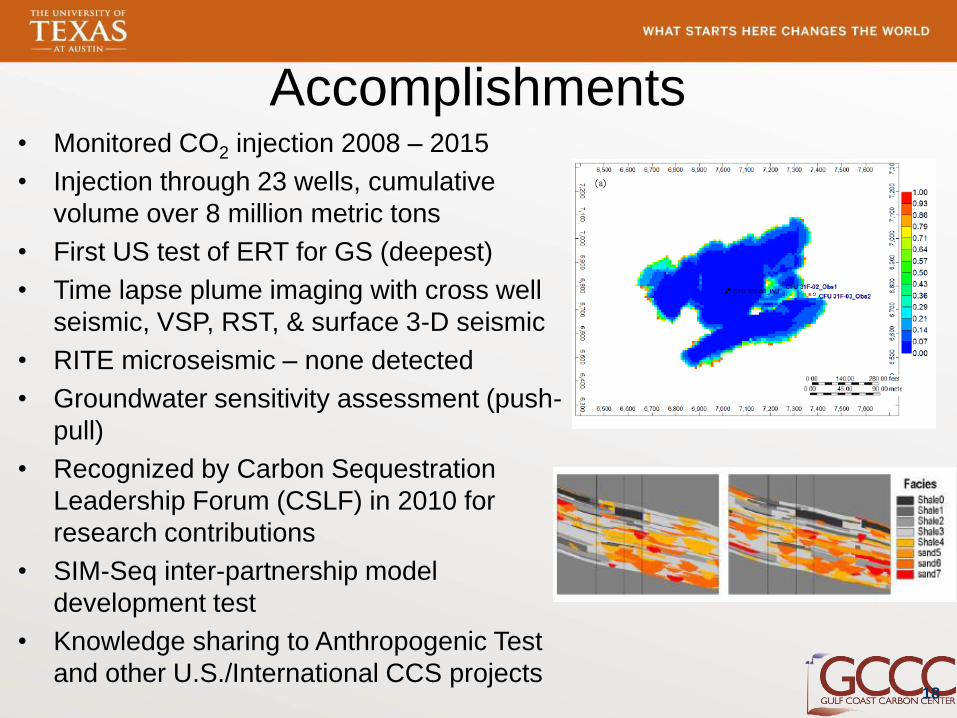
Accomplishments • Monitored CO2 injection 2008 – 2015
• Injection through 23 wells, cumulative
volume over 8 million metric tons
• First US test of ERT for GS (deepest)
• Time lapse plume imaging with cross well
seismic, VSP, RST, & surface 3-D seismic
• RITE microseismic – none detected
• Groundwater sensitivity assessment (push-
pull)
• Recognized by Carbon Sequestration
Leadership Forum (CSLF) in 2010 for
research contributions
• SIM-Seq inter-partnership model
development test
• Knowledge sharing to Anthropogenic Test
and other U.S./International CCS projects18

“Early Test’s” Major Contributions
• Large volume injection bridged RCSP to current
& future anthropogenic sources
• Value of AZMI pressure monitoring in
demonstrating reservoir fluid retention
• Probabilistic monitoring helps history-match fluid
response to injection in a complex reservoir
• Process-based soil gas method developed and
demonstrated for the first time
• Demonstrated utility and site-specific limitations
of groundwater monitoring
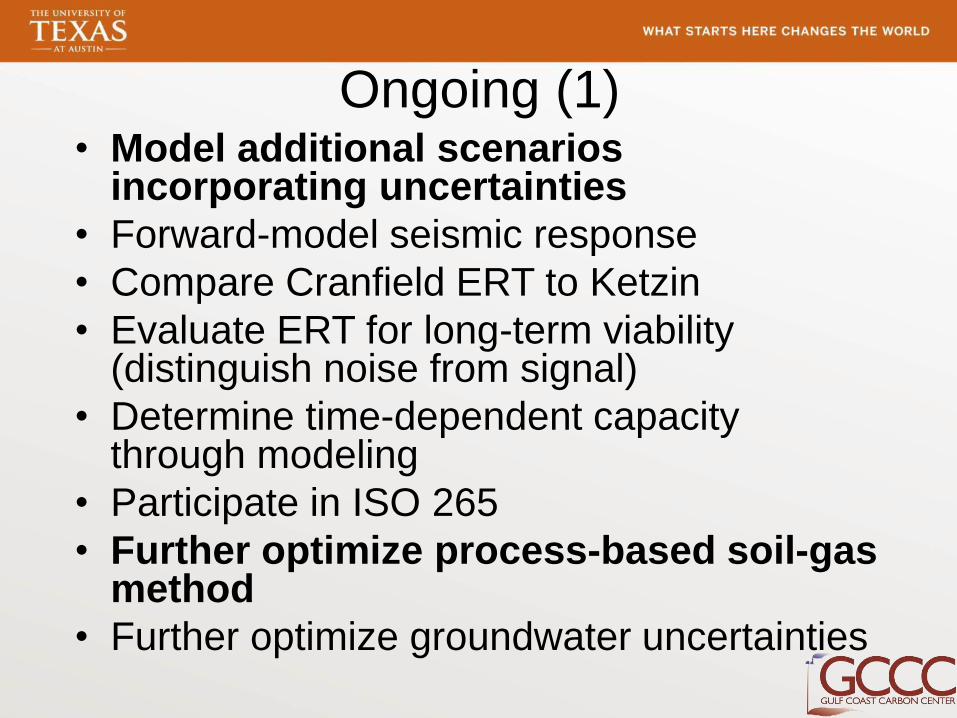
Ongoing (1)• Model additional scenarios
incorporating uncertainties
• Forward-model seismic response
• Compare Cranfield ERT to Ketzin
• Evaluate ERT for long-term viability (distinguish noise from signal)
• Determine time-dependent capacity through modeling
• Participate in ISO 265
• Further optimize process-based soil-gas method
• Further optimize groundwater uncertainties
Ongoing (2)
• Technology transfer
– Deployment of monitoring strategies
developed at SECARB “Early” test as well as
other RCSP and international CCUS sites
– Support for maturation of monitoring for EOR
as well as saline sites through international
standards, best practices, critical reviews

Cranfield NE
section model
• Compositional simulation
• Total number of block =
82,500
• CO2 distribution:• Super critical phase: ?%
• Dissolved in oil: ?%
• Dissolved in brine: ?%
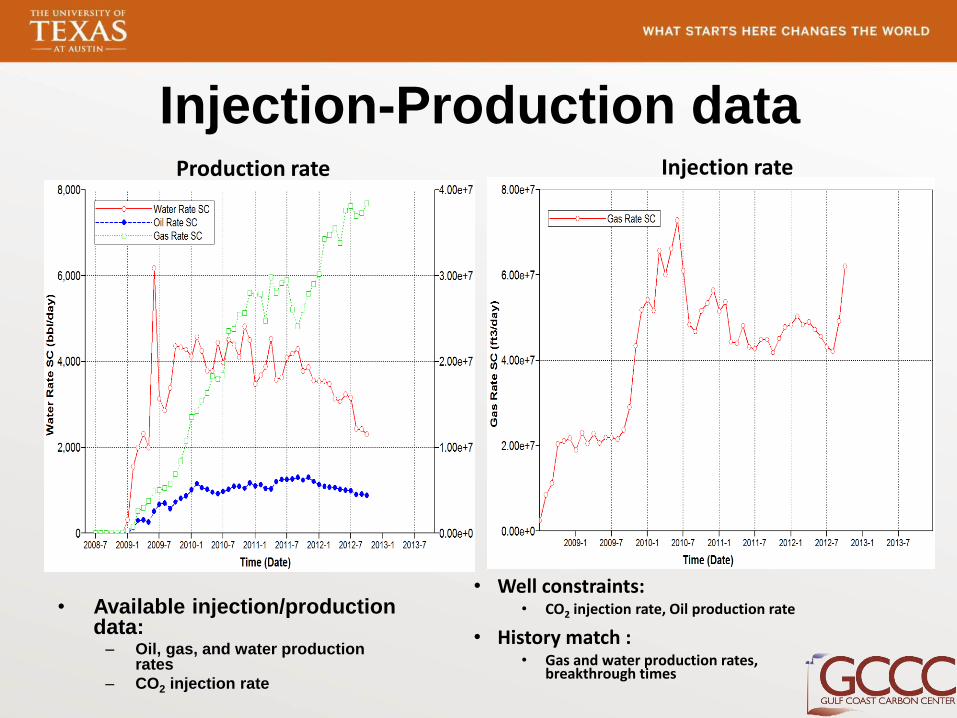
Injection-Production data
• Available injection/production data:
– Oil, gas, and water production rates
– CO2 injection rate
• Well constraints:• CO2 injection rate, Oil production rate
• History match :• Gas and water production rates,
breakthrough times
Production rate Injection rate
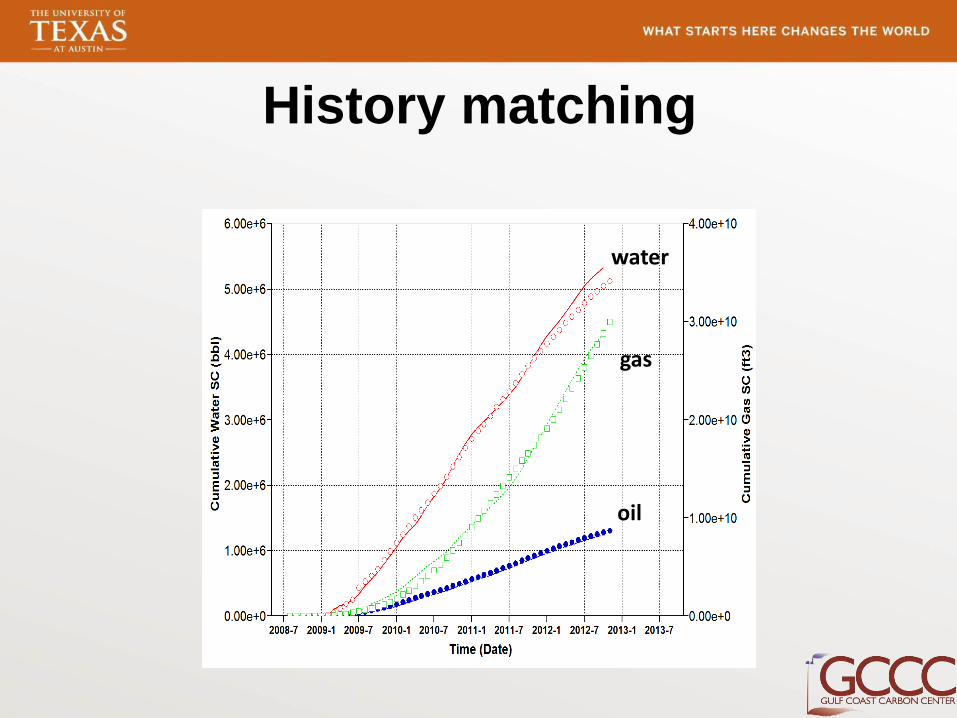
History matching
water
gas
oil
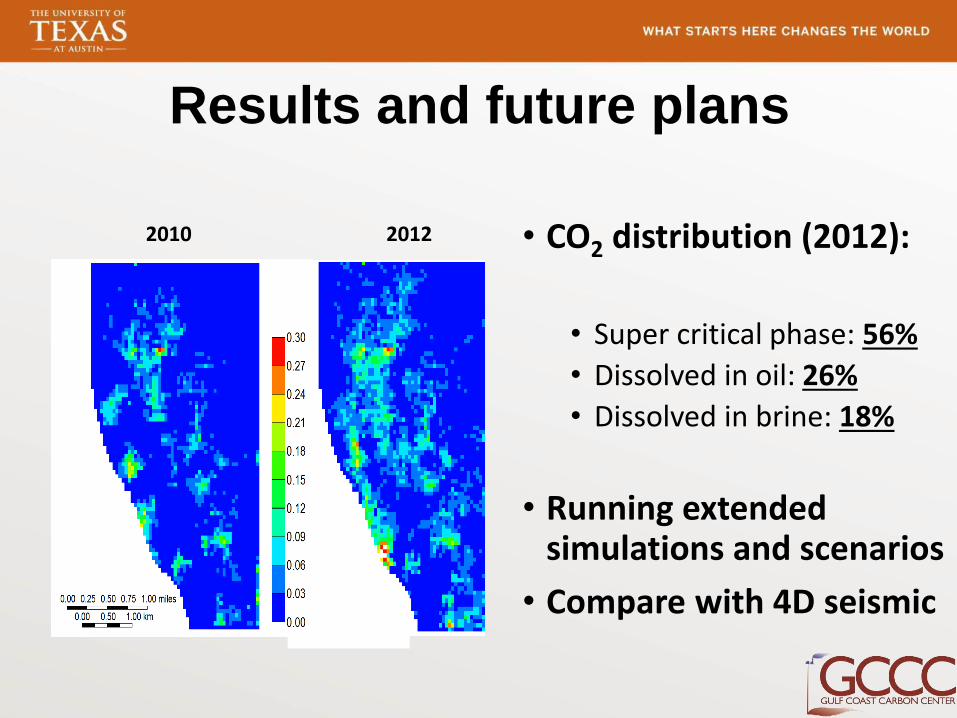
Results and future plans
• CO2 distribution (2012):
• Super critical phase: 56%
• Dissolved in oil: 26%
• Dissolved in brine: 18%
• Running extended simulations and scenarios
• Compare with 4D seismic
2010 2012
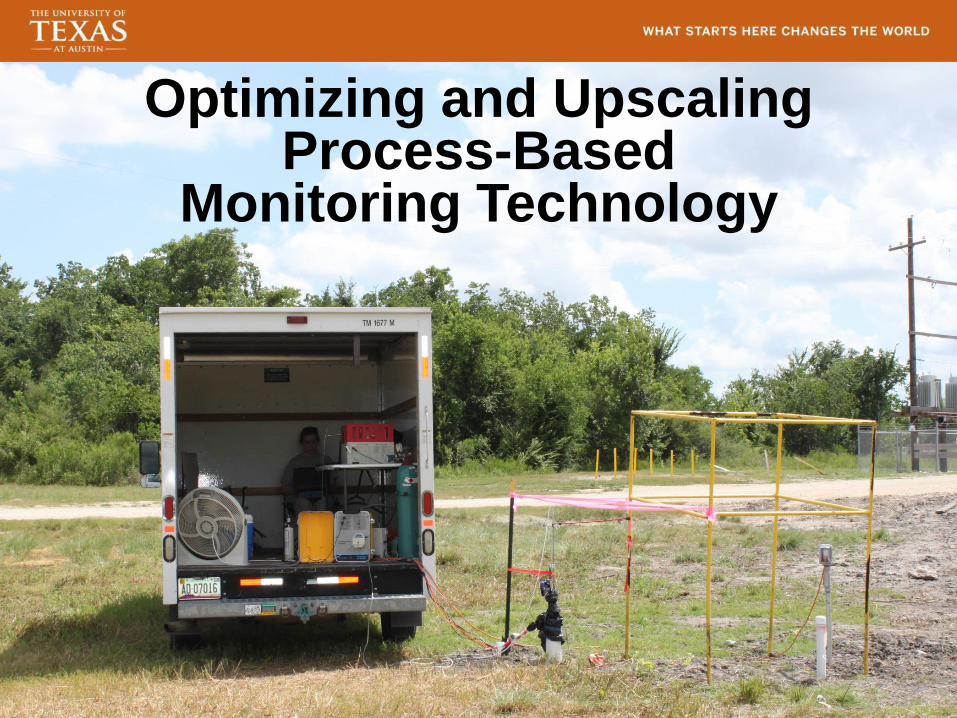
Optimizing and Upscaling Process-Based
Monitoring Technology

Understanding Complex Environments

Testing and
Developing
Sensing
Capabilities
• Continuous
• Real-time
• Smart

Current Method Shortfalls
• Requires a manned gas chromatograph (GC)
• Time- and labor-intensive
• Requires consumable supplies
• No continuous real-time data

“User-Friendly” for Public Engagement• Instant data reduction
• Reduces risk of false positives.
• Graphical analysis
• Continuous monitoring capability will give instant real-time leakage
detection information.
30
Respira
tion
Leakage
FieldLeakage
Field
Katherine Romanak BEG

Extra Slides
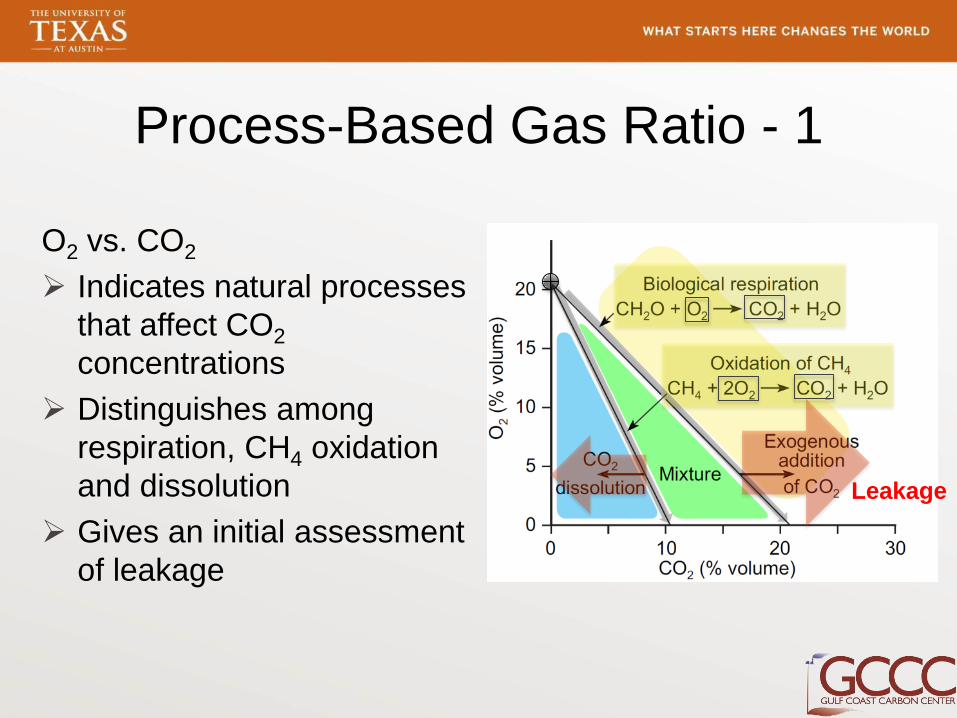
O2 vs. CO2
Indicates natural processes
that affect CO2
concentrations
Distinguishes among
respiration, CH4 oxidation
and dissolution
Gives an initial assessment
of leakage
Process-Based Gas Ratio - 1
Leakage

Process-Based Gas Ratio - 2
CO2 vs. N2
Identifies whether gas
has migrated from
depth.
Indicates whether CO2
is being added
through leakage or
lost through
dissolution.