section 3.15 – socioeconomics and environmental...
TRANSCRIPT

CJMT EIS/OEIS Chapter 3, Affected Environment April 2015 Draft Socioeconomics and Environmental Justice
3-243
3.15 SOCIOECONOMICS AND ENVIRONMENTAL JUSTICE
Section 3.15 provides a summary of the general condition and character of CNMI socioeconomics and potential environmental justice issues. Because of the size and singular government of the CNMI, some of the anticipated socioeconomic impacts are expected to affect the Commonwealth as a whole but also at individual island level. Therefore, the region of influence includes the CNMI with particular emphasis on Tinian and Pagan (and in some cases Saipan).
3.15.1 Definition
Socioeconomics is generally defined as the study of the interrelation between social behavior and economics. Socioeconomic analyses typically address issues such as population, demographics, business activity, employment and income, and environmental justice. Impacts to these fundamental socioeconomic components can also influence other systemic issues such as housing, the provision of public services (e.g., emergency services, education, health services), and the general quality of life in a community.
The U.S. Environmental Protection Agency defines environmental justice as, “the fair treatment and meaningful involvement of all people regardless of race, color, national origin, or income, with respect to the development, implementation, and enforcement of environmental laws, regulations, and policies” (U.S. Environmental Protection Agency 2012). It goes on to clarify that “no group of people should bear a disproportionate share of the negative environmental consequences resulting from industrial, governmental, and commercial operations or policies.” The U.S. Environmental Protection Agency guidance states that “each Federal agency shall make achieving environmental justice part of its mission by identifying and addressing, as appropriate, disproportionately high and adverse human health or environmental effects of its programs, policies, and activities on minority populations and low-income populations in the United States and its territories, the District of Columbia, the Commonwealth of Puerto Rico, and the Commonwealth of Northern Mariana Islands.”
Minority populations are “identified where either: (a) the minority population of the affected area exceeds 50% or (b) the minority population percentage of the affected area is meaningfully greater than the minority population percentage in the general population or other appropriate unit of geographic analysis” (Executive Order 12989). Minority populations include populations that report their ethnicity as something other than non-Hispanic White alone, including Native Hawaiian or other Pacific Islander, Asian, Black or African American, Hispanic or Latin, American Indian, or Alaska Native (U.S. Census Bureau 2011); specifically, for this EIS/OEIS, minority populations are primarily Pacific Islanders (Chamorro and Carolinian) and Asians.
Low-income populations “should be identified with the annual statistical poverty thresholds from the Bureau of the Census’ Current Population Reports, Series P-60 on Income and Poverty” (Executive Order 12989). The Bureau of Census further defines poverty areas as “census tracts or block numbering areas where at least 20% of residents were below the poverty level.”
Children are defined as those individuals under the age of 18 years old (Executive Order 13045).

CJMT EIS/OEIS Chapter 3, Affected Environment April 2015 Draft Socioeconomics and Environmental Justice
3-244
3.15.2 Regulatory Framework
The Council on Environmental Quality regulations implementing NEPA state that when economic or social effects and natural or physical environmental effects are interrelated, the EIS would discuss these effects on the human environment (40 CFR § 1508.14). The Council on Environmental Quality regulations further state that the “human environment shall be interpreted comprehensively to include the natural and physical environment and the relationship of people with that environment.” In addition, 40 CFR § 1508.8 states that agencies need to assess not only direct effects, but also “aesthetic, historic, cultural, economic, social, or health” effects. Following from these regulations, the socioeconomic analysis in this EIS/OEIS evaluates how elements of the human environment such as population, employment, housing, and public services might be affected by the proposed action.
Two executive orders deal directly with the socioeconomic conditions and concerns of potentially affected communities. Executive Order 12898, Federal Actions to Address Environmental Justice in Minority Populations and Low-Income Populations requires federal agencies to assess whether their actions could have disproportionately high and adverse environmental and health impacts on minority or low-income populations. Executive Order 13045, Protection of Children from Environmental Health Risks and Safety Risks requires a similar analysis for children.
3.15.3 Methodology
Information presented in this section is based on research, analysis, and personal interviews conducted for Appendix Q of this EIS/OEIS, the Socioeconomic Impact Analysis Study (DoN 2014). In order to gather data for the Socioeconomic Impact Assessment Study, a series of interviews with CNMI and Tinian government agencies, non-governmental organizations, and private organizations were conducted on Tinian and on Saipan during the final week of January and first week of February 2014 (see Appendix B of the Socioeconomic Impact Assessment Study (Appendix Q) for interview meeting records). Information from those interviews supplements data gathered from other sources, which include those published by the U.S. Census and other U.S. federal government agencies, CNMI government agencies, and academic institutions. This information gathered through personal interviews was noted as being a statement that was made by the interviewee, and the Socioeconomic Impact Assessment Study (Appendix Q) (DoN 2014) was provided as the citation. Interview meeting records are presented in complete form in Appendix Q, Socioeconomic Impact Assessment Study (see Appendix B of the study).
Information presented in this section includes some projections of future economic activity. The projections, collectively, comprise the expected future baseline to which effects of the proposed action were compared to determine the magnitude of impacts. These projections were developed using a methodology that is presented in Appendix A of the Socioeconomic Impact Assessment Study (Appendix Q), and more detailed information on these projections can also be found in Chapter 4 of the Socioeconomic Impact Assessment Study (Appendix Q). Some of the projections indicate whether certain economic development projects would be expected to occur absent the proposed action. Development of these expectations is consistent with methods described in reference to cumulative impact assessment (see Chapter 5, Cumulative Impacts, Section 5.3.1) but also take economic feasibility into consideration.
CJMT EIS/OEIS Chapter 3, Affected Environment April 2015 Draft Socioeconomics and Environmental Justice
3-245
While the footprint of the proposed action would be limited to Tinian and Pagan, the entire population of the CNMI may be affected by the proposed action. As such, data on the population and economy of Saipan and Rota were included. The ways in which the proposed action may affect the CNMI (to include Tinian, Pagan, Saipan, and Rota) are through potential changes to the overall economic activity in the CNMI and changes to CNMI government revenues, which are distributed to each CNMI municipality.
Typically, an analysis of environmental justice is begun by determining the presence and proximity of low-income and minority populations relative to potential adverse impacts of a proposed action. In conjunction, a comparison of populations, that may be impacted, is made to determine the potential for disproportionate effects (i.e., the potential for disproportionate effects is established by looking at whether impacts would have greater effects on certain locations than other locations). However, in this case, environmental justice analysis is complicated by the CNMI’s unique capability to meet the purpose and need of the proposed action. As summarized in Chapter 1, the Department of Defense has identified the need for increased training capabilities in the Western Pacific with the greatest number of unfilled training requirements in the Mariana Islands, specifically the CNMI. As described in Chapter 2, of the 14 CNMI islands, only a combination of Tinian and Pagan meet unit level and combined level screening criteria, and could satisfy the unfilled training requirements. In this analysis, the populated islands in the CNMI (Saipan, Tinian, and Rota) were analyzed to determine the presence of low-income and minority populations.
3.15.4 Socioeconomic Context
3.15.4.1 Commonwealth of the Northern Mariana Islands
As described in Chapter 1, in June of 1975, with 78.8% of votes cast in favor, the people of the CNMI accepted the Covenant to Establish a Commonwealth of the Northern Mariana Islands in Political Union
with the U.S. On November 4, 1986, the final provision of the 1976 Covenant came into effect and U.S. citizenship was conferred upon qualified CNMI residents.
The late 1980s and early 1990s were a boom period for the CNMI economy, in large part due to Japanese investments that were geared towards making the CNMI a tourist destination. Also contributing to the boom was growth in Chinese investments in the garment manufacturing industry. During the early part of the boom period, it became clear that the CNMI labor pool could not support the magnitude of its economy (DoN 2014). To meet labor demand, non-resident workers were brought in on CNMI-Only Transitional Worker visas. The visa allows CNMI business owners to apply for temporary permission to employ foreign (nonimmigrant) workers.
In 2005, the U.S. entered a global trade agreement that removed the quota system for garments made overseas allowing even cheaper textile imports from other parts of the world into the U.S., effectively closing down the CNMI garment manufacturing industry and ending the boom. In 2006, Japan Airlines withdrew from the CNMI due to a declining Japanese tourism market. These and other factors led to a prolonged contraction of the CNMI economy from 2002 to 2011 (DoN 2014).
Data show that from 2011 to 2012, the CNMI economy began to improve as gross domestic product increased for the first time in over a decade, by 7.7% (DoN 2014). The improvement was in large part due to increases in the number of Chinese visitors. Compared to traveling to the mainland U.S., travel to

CJMT EIS/OEIS Chapter 3, Affected Environment April 2015 Draft Socioeconomics and Environmental Justice
3-246
the CNMI, for Chinese tourists, is relatively simple because of the allowance, referred to as “parole in place,” whereby the U.S. government permits visits of up to 45 days without requiring a visa.
3.15.4.2 Tinian
In January 1983, the U.S. and the CNMI governments finalized a lease agreement for military use of approximately two-thirds of northern Tinian (i.e., the Military Lease Area). In 1994, the U.S military signed a lease back agreement for a portion of the land that it had leased; this Lease Back Area was made available to Tinian residents for subsistence agriculture and grazing. One-year agricultural permits were administered by the CNMI Department of Public Lands and limited to 12 acres (5 hectares). The 1994 lease back agreement has since expired but the CNMI and U.S. have continued the terms of the lease back agreement on a short-term, interim basis while negotiations continue on a long-term lease back agreement.
Since the 1990s, Tinian’s economy has been led by tourism and local government employment (U.S. Census Bureau 2010a, 2014). The Tinian Dynasty Hotel and Casino, which opened on April 25, 1998, currently draws visitors to Tinian, primarily from China. Tinian Dynasty management indicated that Chinese visitors purchase tour packages that typically include visits to Saipan for a couple of nights and Tinian for a couple of nights (DoN 2014). Tinian Dynasty Management and a Tinian tour operator also noted that visitors often take windshield tours of the island that stop at historical, scenic, and beach sites (DoN 2014).
3.15.4.3 Pagan
The first post-war economic development on Pagan took place in 1951 when the Northern Islands Development Company brought Chamorros to Pagan to collect and market copra (coconut meat) (Russell 1998). In 1976, about 75 tons (83 metric tons) of copra was produced on Pagan, generating sales of about $13,000 (CNMI Office of Transition Studies and Planning 1978). As of 1978, there were no stores on Pagan or evidence of cash exchanges among residents for goods or services. There was “limited potential for development” on Pagan due to lack of comparative advantage over other islands in the region, relative inaccessibility, and lack of modern infrastructure necessary to make potentially productive operations (e.g., basalt mining) feasible (CNMI Office of Transition Studies and Planning 1978).
Pagan is home to two active volcanoes, one of which (Mount Pagan) erupted in May 1981 forcing the evacuation of all residents to Saipan; the island remains unpopulated because of continued safety concerns. While no official homesteading has occurred on Pagan, there is anecdotal information indicating that people periodically visit the island and some may stay for extended periods. In 2010, the CNMI enacted Public Law 16-50, a homesteading law to establish the Northern Islands Village and Agricultural Homesteading program for current or former residents of the Northern Islands or any qualified person interested in residing on the Northern Islands. The law, however, requires extensive municipal planning and infrastructure development prior to homesteading deeds being issued, and to date, the CNMI has not deeded any land on Pagan (DoN 2014).
CJMT EIS/OEIS Chapter 3, Affected Environment April 2015 Draft Socioeconomics and Environmental Justice
3-247
3.15.5 Population Characteristics
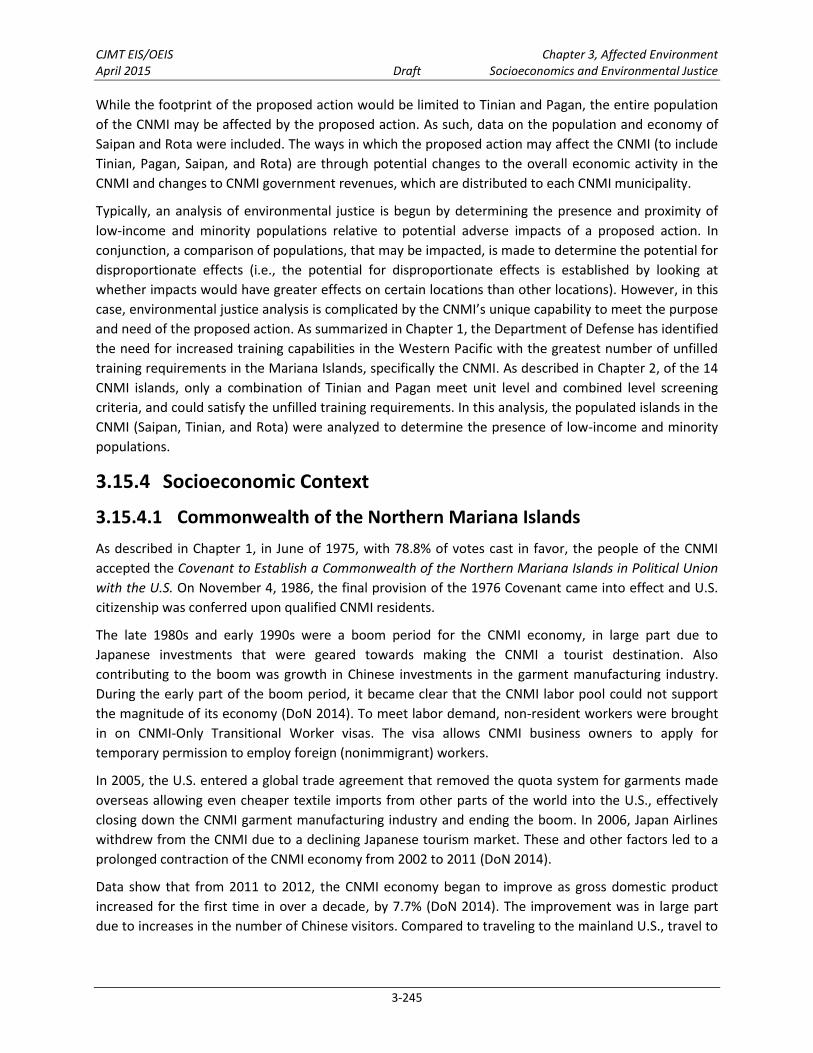
Figure 3.15-1 shows the population trend over time for the CNMI overall, Saipan, Tinian, Rota, the Northern Islands, and temporary residents. According to the 2010 Census, Saipan, Tinian, and Rota are the only three islands in the CNMI with permanent residents (U.S. Census Bureau 2010a). The CNMI population increased by 730% between 1958 and 2000 (from 8,290 to 69,221) but decreased from 2000 to 2010 by 22% (from 69,221 to 53,883).
The first major population influx was during the 1980s. During that decade, the CNMI population more than doubled from 16,780 to 43,345. The population increased substantially again during the 1990s, growing 60% from 43,345 to 69,221. The massive population influxes during the 1980s and 1990s were driven by the introduction and increasing numbers of temporary non-residents (Pacific Web 2013).
A range of projections indicates that during the time that the proposed action would be implemented, CNMI (including Tinian) population could range between 3% lower than counted in the 2010 Census and 18% higher than 2010 levels. See Appendix Q, Socioeconomic Impact Assessment Study (Section 4.1.1 of the study).
Figure 3.15-1 CNMI Population Trends, 1958-2000 Source: U.S. Census Bureau 2000, 2010a; Pacific Web 2013.
The racial composition of the CNMI is primarily Asian and Pacific Islander. As of 2010, 50% of the population was Asian (mostly Filipino) and 35% was Pacific Islander (mostly Chamorro) (U.S. Census Bureau 2010a). On Tinian in 2010, 47% of the population was Asian while 39% was Pacific Islander. Of the 1,222 Pacific Islanders on Tinian in 2010, 1,183 were Chamorro (97%) (U.S. Census Bureau 2010a). On average, CNMI households had 3.26 people and a median annual income of $19,958. Of the municipalities in the CNMI, Tinian had the fewest persons per household (3.21) and the highest median household income ($24,470); Saipan had the most people per household (3.27) and the lowest median household income ($19,607) (U.S. Census Bureau 2010a).
0
10,000
20,000
30,000
40,000
50,000
60,000
70,000
1958 1970 1980 1990 2000 2010
Po
pu
lati
on
Saipan Tinian Rota Northern Islands Temporary Non-residents

CJMT EIS/OEIS Chapter 3, Affected Environment April 2015 Draft Socioeconomics and Environmental Justice
3-248
3.15.6 Economic Characteristics
3.15.6.1 Employment and Income
According to the 2010 Census, the labor participation rate in the CNMI was 72%, and 11.2% of the labor force in the CNMI was unemployed (U.S. Census Bureau 2010a). In comparison to the CNMI as a whole, Tinian’s unemployment rate was low, at 6.7%. Table 3.15-1 lists the number and percent of the labor force, employed, and unemployed in the CNMI overall and broken down into Tinian, Saipan, and Rota.
Table 3.15-1. CNMI Labor Force, Employment, and Unemployment, 2010 Labor Force CNMI Tinian Saipan Rota
Population 16 Years and Over 38,679 2,311 34,581 1,787 Not in Labor Force 10,711 433 9,855 423 Labor Force Participation Rate 72% 81% 71% 76% In Civilian Labor Force 27,949 1,878 24,709 1,362 Employed 24,826 1,752 21,816 1,258 Unemployed 3,123 126 2,893 104 Unemployment Rate 11.2% 6.7% 11.7% 7.6%
Source: U.S. Census Bureau 2010a.
Table 3.15-2 shows 2010 employment by industry for the CNMI and Tinian. In 2010, the industry with the highest number employed both in the CNMI and on Tinian was the arts, entertainment, recreation, accommodation and food services industry; this tourism-related industry employed 672 people on Tinian (38% of employment) and 5,519 people in the CNMI (22% of employment).
Table 3.15-2. Employment by Industry, 2010
Industry CNMI Overall CNMI % of
Employment Tinian
Tinian % of Employment
Arts, entertainment, recreation, accommodation, and food services 5,519 22% 672 38%
Educational services, health care, and social assistance 3,085 12% 178 10%
Retail trade 2,645 11% 76 4% Other services, except public administration 2,553 10% 131 7% Public administration 2,414 10% 320 18% Professional, scientific, management, administrative, and waste management services 1,974 8% 53 3%
Construction 1,786 7% 79 5% Transportation and warehousing, and utilities 1,429 6% 127 7% Finance, insurance, real estate, rental, and leasing 1,064 4% 31 2% Wholesale trade 700 3% 10 1% Manufacturing 689 3% 5 0% Information 496 2% 29 2% Agriculture, forestry, fishing, hunting, and mining 472 2% 41 2%
Source: U.S. Census Bureau 2010a.
Projections indicate that during the timeframe that the proposed action would be implemented, CNMI (including Tinian) employment could range between 8.4% and 35% higher than 2010 Census levels. See Appendix Q, Socioeconomic Impact Assessment Study (Section 4.2.3 of the study).

CJMT EIS/OEIS Chapter 3, Affected Environment April 2015 Draft Socioeconomics and Environmental Justice
3-249
In the CNMI, the average hourly wage was $9.67, in 2011, and the median hourly wage was $6.00. This is lower than the U.S. minimum wage of $7.25 per hour because the CNMI does not fall under U.S. minimum wage regulations. Average annual pay was $20,114 and the median annual pay was $12,480. The highest paying jobs were legal (average annual pay of $59,467) and healthcare practitioner (average annual pay of $48,693). The lowest paying was food preparation and service-related occupations (average annual pay of $11,606). Table 3.15-3 presents 2011 CNMI income by occupation (CNMI Department of Commerce 2012a).
Table 3.15-3. CNMI Income by Occupation, 2011
Occupation Hourly Wage Annual Pay
Average Median Average Median
Weighted Average1
$9.67 $6.00 $20,114 $12,480
Management $15.55 $13.07 $32,344 $27,186 Business and Financial Operations $11.56 $9.30 $24,045 $19,344 Computer and Mathematical $16.11 $14.18 $33,509 $29,494 Architecture and Engineering $14.48 $10.13 $30,118 $21,070 Life, Physics, and Social Science $12.58 $10.50 $26,166 $21,840 Community and Social Services $9.12 $8.40 $18,970 $17,472 Legal $28.59 $27.31 $59,467 $56,805 Education, Training, and Library $16.18 $16.43 $33,654 $34,174 Arts, Design, Entertainment, Sports, and Media $8.36 $6.09 $17,389 $12,667 Healthcare (Practitioners and Technical) $23.41 $16.68 $48,693 $34,694 Healthcare Support $7.52 $5.94 $15,642 $12,355 Protective Service $8.27 $7.56 $17,202 $15,725 Food Preparation and Serving Related $5.58 $5.05 $11,606 $10,504 Building and Grounds Cleaning and Maintenance $5.79 $5.05 $12,043 $10,504 Personal Care and Service $6.42 $5.09 $13,354 $10,587 Sales and Related $5.80 $5.05 $12,064 $10,504 Office and Administrative Support $8.45 $5.82 $17,576 $12,106 Farming, Fishing, and Forestry $6.58 $5.05 $13,686 $10,504 Construction and Extraction $6.21 $5.05 $12,917 $10,504 Installation, Maintenance, and Repair $7.38 $5.67 $15,350 $11,794 Production $7.27 $5.15 $15,122 $10,712 Transportation and Material Moving $7.11 $5.25 $14,789 $10,920
Note: 1Weighting based on number of employees in each occupation. Source: CNMI Department of Commerce 2012a.
Figure 3.15-2 shows the trend for CNMI total employee compensation and gross domestic product over the years of 2002-2012. Over that period, total employee compensation was greatest in 2004 ($752 million), a year before the garment manufacturing industry experienced losses. After 2004, total compensation declined every year up to 2012, reaching a low of $482 million (U.S. Bureau of Economic Analysis 2012, 2013).
Projections indicate that during the timeframe that the proposed action would be implemented, due to anticipated expansion in the tourism industry and expected increases in the minimum wage, CNMI total compensation could range between 21% and 51% higher than 2012 levels shown in Figure 3.15-2. See Appendix Q, Socioeconomic Impact Assessment Study (Section 4.2.3 of the study).

CJMT EIS/OEIS Chapter 3, Affected Environment April 2015 Draft Socioeconomics and Environmental Justice
3-250
Figure 3.15-2 Compensation and Gross Domestic Product
3.15.6.2 Gross Domestic Product
Gross domestic product is a measure of overall economic activity in a region. It typically is the market value of all officially recognized final goods and services produced within an area in a given year. The CNMI’s gross domestic product declined every year from 2002 to 2009 (see Figure 3.15-2), decreasing from $1.22 billion in 2002 to $651 million in 2011 (a 47% decline). From 2011 to 2012, the gross domestic product of the CNMI increased for the first time since 2002, to $701 million, up 7.7% from 2011 levels (U.S. Bureau of Economic Analysis 2012, 2013).
Projections indicate that during the timeframe that the proposed action would be implemented, due to anticipated expansion in the tourism industry, CNMI gross domestic product could range between 25% and 56% higher (unadjusted for price changes) than 2012 Census levels. See Section 4.2.2 of the Socioeconomic Impact Assessment Study.
3.15.6.3 Commonwealth Government Finances
CNMI government revenues, by source, are presented in Table 3.15-4. Revenues increased from 2002 to 2004, but declined from 2004 to 2009. Data from the first two quarters of 2010 indicate that government revenues increased from 2009 to 2010 (CNMI Department of Commerce 2013).
$300
$400
$500
$600
$700
$800
$900
$1,000
$1,100
$1,200
$1,300
2002 2003 2004 2005 2006 2007 2008 2009 2010 2011 2012
Mil
lio
ns
of
$s
Gross Domestic Product Compensation of Employees
Source: U.S. Bureau of Economic Analysis 2012, 2013.

CJMT EIS/OEIS Chapter 3, Affected Environment April 2015 Draft Socioeconomics and Environmental Justice
3-251
Table 3.15-4. CNMI Government Revenues by Source, 2002-2009 (Millions of $’s) Revenue Type 2002 2003 2004 2005 2006
2007 2008 2009
Business Gross Receipt Tax $48.6 $50.6 $54.5 $58.3 $54.1 $49.0 $51.8 $44.8 Wage and Salary Tax $31.2 $31.1 $35.0 $32.7 $28.6 $26.2 $25.1 $24.4 Personal/Corporate Income Tax1 $12.8 $17.0 $11.2 $10.0 $15.1 $8.3 $12.9 $15.5 Garment Certification Fee $30.9 $29.3 $30.6 $24.1 $18.1 $11.4 $3.6 $0.1 Excise Tax $18.7 $22.3 $24.4 $23.9 $24.4 $20.6 $19.7 $18.0 Hotel Occupancy Tax $4.9 $5.4 $6.0 $6.5 $5.5 $4.9 $5.6 $5.1 Fuel/Container/Bar tax $6.8 $8.2 $9.9 $10.2 $7.3 $6.8 $7.3 $6.4 Fees, Charges, and Other Revenues $34.2 $45.8 $46.4 $44.6 $33.8 $39.3 $33.2 $30.0 Transfers from Other Funds - - - - - - $7.3 $12.1 Revenue Transfer to Other Funds - - - - - -$3.5 -$3.6 -$1.7 Total $187.9 $209.8 $217.9 $210.3 $192.0 $163.0 $162.8 $154.7 Note: 1Northern Marianas Territorial Income Taxes. Sources: CNMI Department of Commerce 2006, 2008, 2012b.
Projections indicate that during the timeframe that the proposed action would be implemented, due to anticipated increases overall economic activity spurred by expansion in the tourism industry, CNMI government revenues could range between 14% and 42% higher than 2009 levels. See Section 4.2.4 of the Socioeconomic Impact Assessment Study (Appendix Q).
3.15.6.4 Housing
In 2010, there were 20,850 housing units in the CNMI, most of which were in Saipan (18,683). Vacancy rates in the CNMI as a whole were 23%. Tinian was at 22%, twice the U.S. average (U.S. Census Bureau 2010b). The least expensive housing units in the CNMI were on Rota (valued at $109,900) and the most expensive were on Saipan (valued at $127,600) (U.S. Census Bureau 2010a). There were 1,118 housing units on Tinian in 2010, 874 were occupied, 244 were vacant, and 101 were for rent (U.S. Census Bureau 2010a).
The West San Jose Village Homestead, located in northwest San Jose and south of the airport, broke ground on February 5, 2014 and 170 families received homestead permits to build homes. Five other homestead sites are expected to be developed on Tinian that would house an additional 345 families (Eugenio 2014).
3.15.6.5 Tourism
CNMI Overall 3.15.6.5.1
From 1999 to 2011, there has been a general decline in the number of tourism visitors. Figure 3.15-3 presents the number of tourists and Figure 3.15-4 illustrates the percent change over the same years (CNMI Department of Commerce 2006, 2008, 2012b). There are a variety of reasons for this decline, including the exit of Japan Airlines from the CNMI market, the March 2011 Japan natural disaster, and confusion over visas for Russian and Chinese visitors (Mariana Visitors Authority 2012). From 2011 to 2013, however, the number of visitors increased, rising from 340,957 in 2011 to 438,978 in 2013.

CJMT EIS/OEIS Chapter 3, Affected Environment April 2015 Draft Socioeconomics and Environmental Justice
3-252
Figure 3.15-3 CNMI Total Visitors, 2000-2013
Figure 3.15-4 Percent Change in Total Visitors to the CNMI, 2000-2013
Projections indicate that during the timeframe that the proposed action would be implemented, the number of CNMI tourism visitors could be between 25% and 56% higher than 2012 levels, due to continued growth from Chinese and Korean markets. See Section 4.2.1 of the Socioeconomic Impact
Assessment Study (Appendix Q).
Tinian 3.15.6.5.2
According to Tinian Dynasty management, over 90% of all Tinian visitors stay overnight at the Tinian Dynasty Hotel and Casino (the remaining 10% may not stay overnight or may stay at other accommodations). In 2013, 54,814 visitors from off-island stayed at the Tinian Dynasty. About 80% of visitors were from China and about 10% were from Korea. Tinian Dynasty management indicated that
1999 2000 2001 2002 2003 2004 2005 2006 2007 2008 2009 2010 2011 2012 2013
Total Visitors 501,788 528,597 444,281 475,169 459,457 589,224 491,701 428,050 389,261 397,271 353,956 379,091 340,957 401,201 438,978
300,000
350,000
400,000
450,000
500,000
550,000
600,000
650,000
Vis
ito
rs
2000 2001 2002 2003 2004 2005 2006 2007 2008 2009 2010 2011 2012 2013
% Change 5% -16% 7% -3% 28% -17% -11% -11% 2% -11% 7% -10% 18% 10%
-20%
-10%
0%
10%
20%
30%
40%
% C
han
ge

CJMT EIS/OEIS Chapter 3, Affected Environment April 2015 Draft Socioeconomics and Environmental Justice
3-253
visitors tend to participate in multiple activities while on Tinian that included island tours and nature activities such as scenic viewing and diving (DoN 2014).
Pagan 3.15.6.5.3
Scientific research draws some visitors to Pagan, as does camping and hunting activities (see Section 3.8, Recreation); however, there has been little direct economic activity related to tourism on Pagan since the 1981 evacuation. The Silver Explorer, a cruise ship operated by Silversea Expeditions, stopped at Pagan on its way from Otaru, Japan to Apra, Guam on September 28, 2014 bringing tourists to the island for an afternoon.
3.15.6.6 Commercial Agriculture
Data presented in this section were derived from the 2007 Agricultural Census (U.S. Department of Agriculture 2009) and relate to places with agricultural operations qualifying as farms according to the census definition. This included all places from which $1,000 or more of agricultural products were produced and sold during the 2007 calendar year. Data from the 2007 Agricultural Census is the most recent available as the U.S. Department of Agriculture has not conducted, and does not intend on publishing, an updated agricultural census for the CNMI (U.S. Department of Agriculture 2014).
Research provides no indication that any commercial agricultural activity occurs on Pagan (DoN 2014) and therefore, the topic is not discussed further with relation to Pagan.
CNMI Overall 3.15.6.6.1
Farms are found on all of the populated islands in the CNMI. In 2007, Saipan had the most farms (128), Rota the second most (97), and Tinian had the fewest (31) (U.S. Department of Agriculture 2009). Fruits and nuts (45%), vegetables and melons (43%), and root crops (41%) made up nearly all of the $1.85 million in agricultural product sales in the CNMI in 2007 (U.S. Department of Agriculture 2009). Additionally, CNMI farms had sales of livestock and poultry.
Tinian 3.15.6.6.2
Farms 3.15.6.6.2.1
As of 2014, 29 lots in the Military Lease Area were permitted for noncommercial, subsistence agriculture and grazing; these lots constituted 2,375 acres (961 hectares) (DoN 2014). Based on the Census definition, a person is engaged in subsistence activities if he or she mainly produces goods for his or her own or family’s use and needs, and not solely for commercial purposes (U.S. Census Bureau 2014). While it is not possible to discern with any certainty, Agricultural Census data suggest that some lots in the Military Lease Area sold more than $1,000 worth of agricultural products and therefore are considered farms (U.S. Department of Agriculture 2009); however, other lots, that had less than $1,000 in sales, would not be considered farms. Table 3.15-5 provides information on the number of Tinian farms and the amount of land in those farms. In 2007, there were 31 farms on Tinian, an increase of 8 farms from 2002. Farms with sales over $1,000 used 2,071 acres (838 hectares) of Tinian land in 2007 (U.S. Department of Agriculture 2009).

CJMT EIS/OEIS Chapter 3, Affected Environment April 2015 Draft Socioeconomics and Environmental Justice
3-254
Table 3.15-5. Farms, Land in Farms, and Land Use by Municipality, 2002 and 2007
Farms Tinian
2002 2007
Number of Farms 23 31 Land in Farms (acres) 672/272 2,071/838
Source: U.S. Department of Agriculture 2009.
Of the 31 farms on Tinian in 2007, 74% were owned by individuals, 15% by a partnership, and 6% by corporations; 29% of farms were on owned land and 71% were on rented land from others; 29 of the 31 farms used unpaid labor (indicating family workers); 77% of farms were operated by Chamorros and 19% were operated by Asians; 13% of farm operators were not a U.S. citizen (U.S. Department of Agriculture 2009).
Agricultural Products 3.15.6.6.2.2
In 2007, the market value of all agricultural products sold on Tinian (including root crops, vegetables, melons, fruits, and nuts) totaled $152,537. Fruits and nuts, and vegetables and melon sales were $72,339 and $77,188, respectively (U.S. Department of Agriculture 2009).
Gathering 3.15.6.6.2.3
Multiple Tinian government agencies and other anecdotal reports indicated that hot peppers named “Donni Sali” are sometimes gathered, processed, and sold. According to the Tinian Department of Labor, pepper gathering for sale is a common source of income for community members that are not working and is a supplement to income for those who need extra money (DoN 2014).
Livestock 3.15.6.6.2.4
As of 2014, the Lease Back Area (i.e., southern portion of the Military Lease Area) supported approximately 2,375 acres (961 hectares) of agricultural grazing permits. However, not all of that land was utilized. Data and research of cattle grazing on Tinian have been published in the Beef Cattle Herd Survey, 2013, by the Northern Marianas College Cooperative Research, Extension, and Education Service (NMC-CREES) (2013). Table 3.15-6 provides information on the Tinian herd as presented in that report. According to the Cattle Herd Survey, in 2013, there were 37 ranching operations that covered 1,834 acres (742.5 hectares) (NMC-CREES 2013). Of these 37 ranching operations, the Tinian Cattlemen’s Association estimates that 32 are located in the Military Lease Area (DoN 2014). Of the 1,834 acres on Tinian being used for cattle grazing, an estimated 1,010 is in the Military Lease area.
Table 3.15-6. Tinian Cattle Ranching Data, December 2012-February 2013
Ranching Operations
Cattle and Calves
Acres in Production
Cattle/Calves per Acre
Estimated Value of Tinian Herd (2012 $s)
1
37 1,043 1,834 0.6 $547,850 Note: 1Live weight value as determined in the cattle survey. Based on average live weight Tinian market values for 2012. Source: NMC-CREES 2013. Data collected over a period of three months (December 2012 through
February 2013) via personal interviews.
In 2012, 177 cattle were sold (with a permit) for a total of $97,350. In 2013, the herd numbered 1,043 and the live weight value, calculated based on sales in 2012, was about $547,850 (NMC-CREES 2013). According to the survey, there were about 0.6 cattle per acre (1.4 per hectare) on Tinian around the

CJMT EIS/OEIS Chapter 3, Affected Environment April 2015 Draft Socioeconomics and Environmental Justice
3-255
start of 2013. The Tinian Cattlemen’s Association indicated that there was no crowding of cattle, that there was more than enough space for the number of cows in the herd, and that ideally there could be more cows per acre (1 per acre or 2.5 per hectare were noted to be ideal) (NMC-CREES 2013).
3.15.6.7 Commercial Fishing
Commercial fishing occurs throughout the CNMI, mostly around Saipan and Tinian. Interviews conducted with groups that have knowledge of fishing in waters off of Pagan indicated that Pagan waters are good for fishing but costs associated with fishing there are very high due to Pagan’s remoteness, and therefore only a small amount of fishing is conducted there (DoN 2014). Therefore, the topic is not discussed further with relation to Pagan.
CNMI Overall 3.15.6.7.1
An estimated $503,822 worth of fish were landed in the CNMI in 2010 (217,099 pounds (98,474 kilograms) at an average price of $2.32 per pound), over 90% of which were landed on Saipan (National Oceanic and Atmospheric Administration 2013a).
Tinian 3.15.6.7.2
As of 2011, the number of fishing boats on Tinian was between 15 and 20, with the majority of those boats less than 25 feet (8 meters) in length (National Oceanic and Atmospheric Administration 2013b). While the waters to the northwest of Tinian are used for fishing by the Saipan commercial fishing fleet, there is no evidence of a commercial fishing industry based out of Tinian. According to the Tinian Department of Land and Natural Resources and the Western Pacific Fishery Management Council, fishing boats on Tinian are not used for commercial fishing; when fish are sold, it is to cover the expenditures of fishing excursions (DoN 2014).
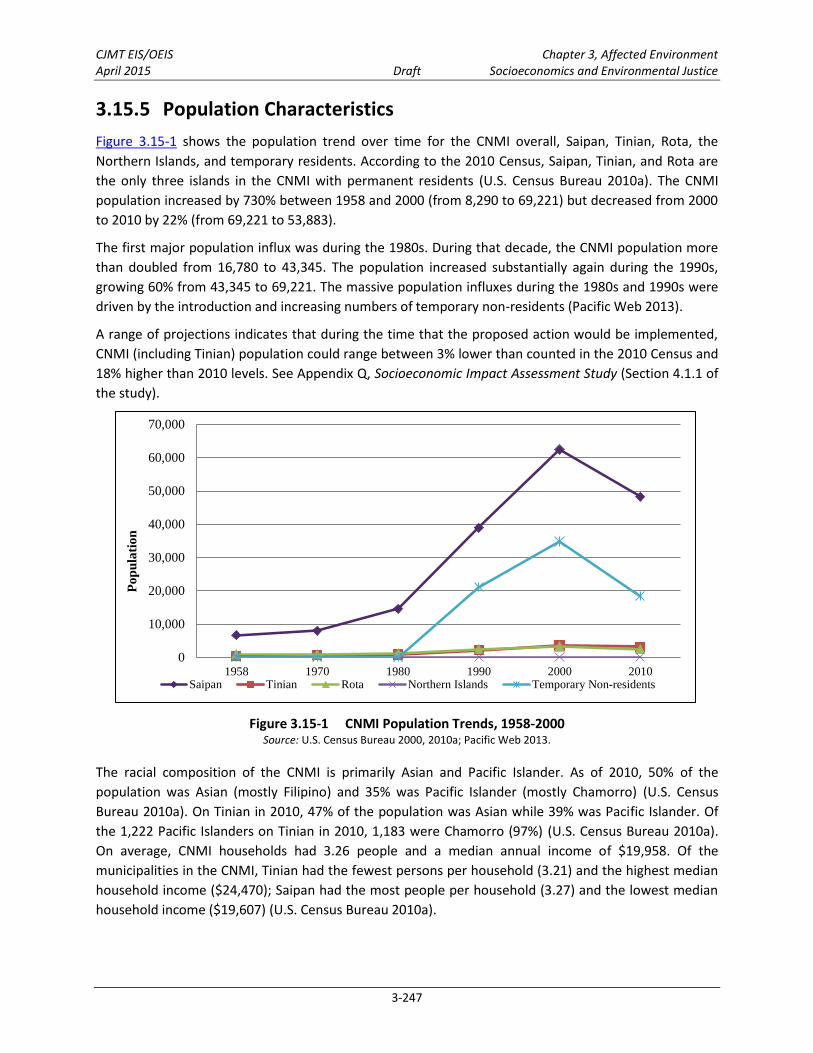
Table 3.15-7 and Figure 3.15-5 identify fishing areas around Tinian and the type of fishing that takes place at each area. While the CNMI has a moratorium on gill nets, the Department of Land and Natural Resources reports gill net fishing so it is included here. The water is notably calmer on the western side of Tinian, which makes it more attractive for fishing than the eastern side. Types of fishing that require boats are almost exclusively limited to the western side of the island. According to the Tinian Department of Land and Natural Resources, waters on the eastern side are rougher and, for the most part, only good for land-based cliff-fishing (DoN 2014).
Table 3.15-7. Tinian Fishing Areas and Type of Fishing Location From To Type of Fishing
Northwest Puntan Tahgong Puntan Diapblo Spearfishing, rod and reel (casting from boat), and cliff fishing
Southwest Puntan Diapblo Puntan Carolinas Trolling and bottom fishing Southeast Puntan Carolinas Puntan Baranga Spearfishing and cliff fishing East Puntan Baranga Puntan Chiget Cliff fishing Northeast Puntan Chiget Puntan Tahgong Sea crab, throw net, cast net, gill net, and spearfishing
Source: DoN 2014.
Puntan Tahgong
Pacific Ocean
Tinian Harbor
Marpo Point
Puntan Carolinas
Puntan Diapblo
Puntan Barangka
Puntan Chiget
State
Stre
et
Grand Avenue
Masa
lok B
each
Roa
d
Broa
dway
42nd Street
8th Avenue86th Street
96th Street 96th Street
8th Av
enue
123rdStreetRive
rside D
rive
124th Street
Broa
dway
InternationalBroadcastingBureau
Figure 3.15-5Tinian Fishing Areas and Type of Fishing
LegendMilitary Lease AreaInternational Broadcasting Bureau
Type of Fishing
!(R Trolling/Bottom
!(³ Spear
!@ Net (throw, cast, gill)
!} Prime Sea Crab
!l Rod & Reel (casting from boat)
!(_ Cliff
!(_!(³
!(³
!(³
!(R
!l
!(_
!(_
!}!@
N0 1 20.5
Miles
0 1 20.5Kilometers
3-256

CJMT EIS/OEIS Chapter 3, Affected Environment April 2015 Draft Socioeconomics and Environmental Justice
3-257
Saipan 3.15.6.7.3
Saipan residents surveyed in 2005 (Van Beukering et al. 2006), who said they were active and/or commercial fishermen, were asked to answer questions to better understand the cultural importance of fishing on Saipan and the social and economic role it plays among households and individuals (Van Beukering et al. 2006). Saipan anglers reported that about 90% of their catch was consumed by themselves, family, and friends while about 8% of their catch was sold. The survey showed that the cost of fishing exceeded fish sales for almost every income group except those fishermen earning over $501 a month and those earning less than $26 (National Oceanic and Atmospheric Administration 2013b). The survey authors concluded that even those fishermen that do sell fish, do not sell to earn a profit but rather, sell fish to recover some of the costs of fishing (Van Beukering et al. 2006). This condition is thought to be the same for anglers throughout the CNMI (DoN 2014).
3.15.6.8 Aquaculture
Aquaculture in the CNMI is primarily land-based with major products that include tilapia and shrimp. Production in 2009 was estimated at 10 metric tons (11 tons) with a value of $56,000. Fish are sold live or fresh, usually at a size of 7-9 ounces (200-250 grams), for a price of $2-$3 per pound ($5-$6 per kilogram). As of 2011, there were eight tilapia farmers in the CNMI (five on Saipan, two on Rota, and one on Tinian) (NMC-CREES 2011). A local source with expertise in aquaculture indicated that the two farms on Rota were government-sponsored demonstration farms, four of the five Saipan farms were for subsistence, and the continued operation of the farm on Tinian was uncertain since the passing of its operator (Michael Ogo, personal communication, May 2014).
3.15.6.9 Commercial Hunting
Research indicated that no commercial hunting takes place in the CNMI; rather, hunting is limited to subsistence purposes only (DoN 2014).
3.15.6.10 Minerals
Tinian 3.15.6.10.1
Through ownership in FPA Pacific Corp., Hawaiian Rock has operated a quarry and ready mix concrete plant on Tinian since 1993.
Pagan 3.15.6.10.2
Mineral resources have been identified on Pagan and include basalt and pozzolan (a substance used as an additive for producing cement). The 1978 Pagan Physical Development Master Plan (CNMI Office of Transition Studies and Planning 1978) noted that one possibility for economic development on Pagan might be the exploitation of the island's basalt deposits (basalt is sometimes used in construction as an aggregate mixed into concrete). The Master Plan noted that investigation by the Government of Guam Department of Public Works suggested that although the basalt resource on Pagan was extensive, the cost of infrastructure improvements necessary to mine, process, and transport the basalt would make mining it too expensive to earn a profit. To make it feasible, “joint development funding including capital improvement program development funds from the Northern Mariana Islands Capital Improvement Program, Economic Development Authority Funds, Federal Aviation Administration, Airport

CJMT EIS/OEIS Chapter 3, Affected Environment April 2015 Draft Socioeconomics and Environmental Justice
3-258
Development Aid Program funds, and finally a long term contract for supplying basalt to Guam would appear to be necessary to make such a program successful” (CNMI Office of Transition Studies and Planning 1978).
Pozzolan is the result of the 1981 eruption of Mount Pagan and is defined as any substance that, if in small enough particles, reacts chemically to form compounds that contain cement-like properties. Economic use of pozzolan is to mix it with Portland cement to create blended cement. On Pagan, the pozzolan material is primarily volcanic ash and glass (pumice and pumicite).
In 2007, a field program drilled samples from 32 sites on Pagan and conducted analysis of the pozzolan material that was extracted. The study indicated there was an estimated 13.1 million tons (11.9 million metric tons) of pozzolan that could be extracted and that the pozzolan was suitable for industrial use (DoN 2014).
The price of pozzolan in 2012 was $35 per metric ton (U.S. Geological Survey 2013), which is lower than the cost would be to ship pozzolan to market (Saipan Shipping Company 2014), indicating that, while a permit to mine pozzolan was provided by the CNMI Department of Public Lands to a private mining company, a pozzolan mine on Pagan may not be economically feasible (see Appendix Q, Socioeconomic
Impact Assessment Study, Section 4.2.10 for more information). One of the permit conditions is to provide an economic feasibility study within 1 year of permit issuance.
3.15.6.11 Airports and Sea Ports
The Commonwealth Ports Authority operates, maintains, and is responsible for improvements of all airports and sea ports in the CNMI. Airports and sea ports are located on Tinian, Saipan, and Rota and facilitate economic activity in the CNMI. Airports facilitate the movement of tourists and goods between islands and sea ports facilitate the transportation of goods between islands. As of September 30, 2012, the Commonwealth Ports Authority had 122 employees on Saipan, 25 on Tinian, and 21 on Rota (Commonwealth Ports Authority 2013).
Airports 3.15.6.11.1
There are three major airports in the CNMI: Saipan International Airport, Tinian International Airport, and Rota International Airport. Air taxi operations (i.e., aircraft designed to carry 60 or fewer passengers or carry up to 18,000 pounds of cargo) constituted 76% of operations at Saipan International Airport and 94% of operations at Tinian International Airport. Military operations constituted 4.1% of operations at Rota International Airport, 1% of operations at Tinian International Airport, and 0.3% of operations at Saipan International Airport. The Pagan airfield is partially covered by lava from the 1981 volcanic eruption, is unattended, and has not received a Federal Aviation Administration inspection since 1980 (Federal Aviation Administration 2014).
Sea Ports 3.15.6.11.2
In fiscal year 2012, a total of 395,070 inbound revenue tons and 14,244 outbound revenue tons were brought in and out of CNMI ports. The Port of Tinian is located on the southwest side of the island and is currently used for fuel supply and other commodities such as food. Fuel is brought in by tanker that makes deliveries on a monthly basis (Commonwealth Ports Authority 2014). The fuel tanker docks at the port and fuel is piped to storage tanks located about 300 feet (91 meters) inland. A tug and barge are

CJMT EIS/OEIS Chapter 3, Affected Environment April 2015 Draft Socioeconomics and Environmental Justice
3-259
used to bring shipping containers over from Saipan. According to the Saipan Shipping Company and Tinian Marine Stevedores Incorporated, the barge only transits about once every other month (DoN 2014). Recently completed improvements at the Port of Tinian include new fenders and bollards and repairs to the concrete cap (Commonwealth Ports Authority 2014). There are no port facilities on Pagan.
3.15.6.12 Power Utility Rates
The CNMI’s electric system is owned by the Commonwealth Utilities Corporation, which is a public corporation that is part of the CNMI government. All CNMI electricity customers pay a fuel surcharge that varies with the world price of diesel fuel; this surcharge is known as the Levelized Energy Adjustment Clause rate. Large commercial electricity consumers on Tinian include the Tinian Dynasty and the International Broadcasting Bureau, which, combined, consume an average daily load of 0.75 megawatts (see Appendix P, Utilities Study). There are no electric utility systems on Pagan.
3.15.7 Public Services
3.15.7.1 Education
CNMI 3.15.7.1.1
The CNMI Public School System, created in 1988, is a state education agency for preschool, elementary, and secondary education. It also includes the Early Intervention Program for infants up to 3 years old, and Head Start for children aged 3 to 4. Public education services are funded through a mixture of CNMI and federal funds. During fiscal year 2011, the CNMI Public School System received $58,374,747 in overall federal grants (Deloitte 2013a), though much of that ($28 million) was awarded under the American Recovery and Restoration Act, which is a temporary source of funding.
The CNMI Public School System comprises 12 elementary schools, 4 junior high schools, and 5 high schools. Kindergarten is offered at every elementary school, and there are 10 Head Start centers (CNMI Public School System 2013). Enrollment in elementary schools was 5,412 students, and in secondary schools it was 5,093 students (DoN 2014).
Tinian 3.15.7.1.2
There are two accredited public schools on Tinian, an elementary school (grades kindergarten through grade 6) and a junior/senior high school (grades 7 through 12). Both schools are located in the village of San Jose. According to 2011 to 2012 school year data, published by the CNMI Public School System, Tinian elementary had 14 teachers and 260 students (student to teacher ratio of 19:1), and Tinian Junior/Senior High School had 15 teachers and 229 students (student to teacher ratio of 15:1). The overall student to teacher ratio on Tinian during the 2011 to 2012 school year was 17:1. There is one Head Start center on Tinian, and as of 2011, there were 34 children enrolled and one staff member (CNMI Public School System 2013).
Representatives of the CNMI Public School System indicated that due to Tinian’s declining population, Tinian schools are using less of their capacity than during previous years. The total of 489 students for the 2011 to 2012 school year is below the highest number of students that recent data show for Tinian, which was 615 students during the 2007 to 2008 school year (CNMI Public School System 2011).
CJMT EIS/OEIS Chapter 3, Affected Environment April 2015 Draft Socioeconomics and Environmental Justice
3-260
Pagan 3.15.7.1.3
Research indicated that no education services are currently provided on Pagan (DoN 2014).
3.15.7.2 Emergency Services
CNMI 3.15.7.2.1
The Department of Public Safety provides emergency services including police, fire, and emergency medical services in the CNMI. The Department consists of four major divisions, including the Commonwealth State Police Division, the Fire Division, the Bureau of Motor Vehicles, and the Commissioner. Emergency services are funded through a mixture of CNMI and federal funds. In fiscal year 2011, the CNMI received over $2 million in grants from the U.S. Department of Justice (Deloitte 2013b).
In 2013, the CNMI Department of Public Safety handled 4,604 Emergency Medical Services incidents, 3,521 fire related incidents, and there were a total of 3,105 criminal offenses (including 1,129 burglaries/robberies/thefts, 699 disturbances, 569 violent crimes, and 316 property crimes) (CNMI Department of Public Safety 2013a).
Tinian 3.15.7.2.2
The Tinian Department of Public Safety indicated that, as of February 2014, they were staffed by 17 police officers (a ratio of 6 officers for every 1,000 residents) and 11 firefighters (a ratio of 3.8 firefighters per 1,000 residents) (CNMI Department of Public Safety 2013a). While Tinian police officers are often responsible for a variety of tasks (for example, the same officer may be trained in boating safety and 911 call reception), the 6 officers per 1,000 residents is double the average for the U.S. as a whole, which is less than 3 officers per 1,000 residents (Bureau of Justice Statistics 2003). In addition, the ratio of 3.8 firefighters per 1,000 residents greatly exceeds the historical U.S. ratio of about 1.7. Since ratios of both officer and firefighter per 1,000 residents on Tinian are more than double of those in the U.S., Tinian emergency safety services are generally considered to have the capacity to meet the needs of the public.
The condition of the Department of Public Safety’s building was noted as fair and able to accommodate current personnel and operations (DoN 2014). Additionally, the Department indicated that it has a refurbished fire engine and ambulance, and that a boating safety facility will be operational sometime in 2014 (DoN 2014). The Commonwealth Ports Authority maintains firefighting capability at Tinian International Airport as a requirement for airport operations. This capability is available to the Tinian Department of Public Safety in the event of an emergency. According to the Commonwealth Ports Authority, Tinian International Airport has two fire-fighting vehicles (DoN 2014).
In 2013, 86 criminal offenses were recorded in San Jose; the most common offenses included 30 thefts or burglaries, 15 incidences of disturbing the peace, and 15 assaults (CNMI Department of Public Safety 2013b). It was noted that burglary is often drug-related and domestic violence is often alcohol-related and that these crimes are also related to weak economic conditions (DoN 2014).

CJMT EIS/OEIS Chapter 3, Affected Environment April 2015 Draft Socioeconomics and Environmental Justice
3-261
Pagan 3.15.7.2.3
The Department of Public Safety indicated that it maintains no personnel or facilities on Pagan and if a visitor on Pagan were to require emergency assistance, the CNMI government would likely contract a charter helicopter or airplane to fly to Pagan and bring the individual to Saipan for treatment (DoN 2014). The CNMI Homeland Security and Emergency Management Office requires travelers to the Northern Islands, which includes Pagan, to provide notification if they plan to visit so that the agency can better respond to requests for emergency assistance.
3.15.7.3 Health
CNMI 3.15.7.3.1
Public health services are funded through a mixture of patient fees and CNMI and U.S. federal government funds. The Commonwealth Healthcare Corporation is an autonomous public corporation of the CNMI government. It provides hospital, primary care, and public health services to Saipan, Tinian, and Rota. There is no major trauma center in the CNMI; the closest major trauma center is on Guam.
Tinian 3.15.7.3.2
The Tinian Health Center is the island’s primary health care facility. Part of the Commonwealth Healthcare Corporation, the Health Center facility was built in 1987, currently has five holding beds, and in 2013, the Health Center accommodated 8,000 outpatient visits and 1,600 urgent care visits (DoN 2014). Information provided by staff indicates that there is one full-time physician, one nurse practitioner, four registered nurses, five licensed practical nurses, one nursing aide, and a dentist that visits periodically (DoN 2014). Medical staff explained that non-communicable diseases such as diabetes and hypertension are a major concern on Tinian, much like the rest of the CNMI (DoN 2014).
Despite clearly apparent limitations necessitated by operational efficiencies in areas with small populations such as Tinian (e.g., major emergency and specialty medical cannot be provided here but in Saipan), Health Center staff did not indicate that the facility was overburdened in any way. Some concerns were expressed about available space for treatment, but expansions are underway that should alleviate those concerns (DoN 2014).
Saipan 3.15.7.3.3
The largest hospital in the CNMI, the Commonwealth Health Center, is located on Saipan. Recent information indicates that the hospital offers inpatient and outpatient medical and surgical services, emergency care, public and mental health services, dental services, hemodialysis, electrocardiography, ultrasound, radiology, as well as other ancillary and diagnostic services (Air Force 2012). According to Health Center staff, as of 2014, there were 32 physicians employed (DoN 2014). Commonwealth Health Center management further indicated that it treats approximately 60,000 outpatient visitors (including those from Tinian) per year (DoN 2014). The Health Center indicated that the hospital is of sufficient size to accommodate existing staff and patients and has 86 beds, 76 of which are functioning (DoN 2014). In addition to the Commonwealth Health Center, there are private health, dental, and optical clinics on Saipan (Air Force 2012).

CJMT EIS/OEIS Chapter 3, Affected Environment April 2015 Draft Socioeconomics and Environmental Justice
3-262
Pagan 3.15.7.3.4
No health services are provided on Pagan. Research indicated that emergency care requires evacuation by plane or helicopter to Saipan for treatment (DoN 2014).
3.15.8 Social and Community Topics
Community and social topics are a collection of activities or goals that are important to a social group or community. Changes to community and social topics are measured in terms of changes in community character and community cohesion.
Community character is the distinctive identity of a particular place that results from the interaction of many factors that give it unique or special characteristics—built form, landscape, history, people, and activities within the place as a whole (American Planning Association 2011). The topic areas of homesteads, agriculture, fishing, and hunting in particular contribute to community character in the CNMI and are detailed in the sections below.
Community or social cohesion measures the levels of “relationship between individuals, groups, and organizations within a community” (Holdsworth 2009). In a community with strong community cohesion, high levels of characteristics such as social ties, interdependence, trust, and reciprocity exist and bind people within that community together. A lack of community cohesion occurs when there are “divisions between groups, individuals, and systems” (Stone and Hughes 2002). Again, the topic areas of homesteads, agriculture, fishing, and hunting are the characteristics within the region that allow the building of relationships between individuals, groups, and organizations within the community and are thus covered in the sections below.
3.15.8.1 CNMI
Homesteads 3.15.8.1.1
The Northern Islands Village and Agricultural Homesteading Act of 2008 was passed by the CNMI legislature to:
a) Establish the Northern Islands Village and Agricultural Homesteading program for current or former residents of the Northern Islands or any qualified person interested to reside on the Northern Islands.
b) Enable residents of the Northern Islands who hold a homestead permit to borrow money to build a safe and sanitary home.
c) Initiate and promote economic development on the Northern Islands through long-term commercial leases and permanent settlements.
d) Provide the Department of Public Lands sufficient authority and flexibility to administer this act.
e) Allow the Department of Public Lands to review homestead claims on their merits.
In addition, per Article 11 Section 5 of the CNMI constitution, some portions of public lands are to be set aside for a homestead program. In concept, one gains ownership of an unowned natural resource by performing an act of original appropriation under the program. Appropriation could be enacted by putting an unowned resource to active use (as with using it to produce a product), joining it with

CJMT EIS/OEIS Chapter 3, Affected Environment April 2015 Draft Socioeconomics and Environmental Justice
3-263
previously acquired property, or by marking it as owned (as with livestock branding). Eligibility requirements to receive a homestead permit, set forth in Title 2 Section 4303 of the Commonwealth Code, provide that an applicant must be of Northern Marianas descent and an applicant is eligible for a homestead permit on only one lot. Once a permit is granted, the recipient of the permit may begin to make improvements on the homestead lot. A deed of ownership of the homestead lot may be granted after a period of time if certain conditions are met, such as subdivision conditions consistent with modern planning standards (i.e., power and water utilities are present) and that a home has been built on the lot, or a minimum $10,000 investment has been made on the land.
3.15.8.2 Tinian
The early history of Tinian is covered in Section 3.11, Cultural Resources. The modern Tinian community is small and quiet with only a few stores and restaurants. Families often go to the beaches on weekends and attend barbeques. People also engage in agriculture, fishing, and hunting activities for both traditional and subsistence purposes. These agriculture, gathering, hunting, fishing, and grazing activities, when mainly conducted for a person’s own or family’s use and needs and not primarily for commercial purposes, are considered subsistence activities (U.S. Census Bureau 2014). The 2010 Census identified 103 Tinian residents over the age of 16 that participated in subsistence activities (U.S. Census Bureau 2010a). Of the 103 people that engaged in subsistence activity, 91 were elsewhere employed (part-time), 44 were unemployed, and 8 were not in the labor force.
Agriculture 3.15.8.2.1
The CNMI Department of Community and Cultural Affairs indicated that agricultural products grown in the Military Lease Area include taro, sweet potatoes, and melons (DoN 2014). Other agricultural products harvested in the Military Lease Area include hot peppers, yams, and beef (DoN 2014).
Farming. According to Tinian and CNMI government agencies, farming is done for subsistence on Tinian; as of 2014, 29 lots in the Military Lease Area were permitted for subsistence agriculture (DoN 2014). According to staff at the Tinian Health Center, Tinian is traditionally an agricultural community, but has become less so over the past several years. The trend has been away from foods that are produced locally and towards processed food that are purchased at stores (DoN 2014).
Ranching. Cattle grazing has occurred on Tinian since cattle were first introduced by the Spanish in the 16th century (NMC-CREES 2013). After the Spanish-Chamorro War, for a few hundred years, feral cattle roamed across Tinian. When Tinian was transferred from Spanish to German control, the Germans preserved the herd for food and the monetary value. The Japanese administration later oversaw a decrease in the size of the herd as sugarcane fields took over the Tinian landscape. After World War II, much of Tinian was leased to Ken Jones, a businessman who expanded the herd to include 7,000 beef cows and 1,000 milk cows; during this time the Tinian herd was the primary source of beef and milk products consumed by residents of Tinian, Saipan, Guam, and other nearby islands. The modern herd provides local residents with fresh beef for regular consumption and for traditional cultural events (NMC-CREES 2013). Tinian beef cannot be sold commercially because slaughtering facilities do not meet U.S. federal standards (21 CFR §§ 601).

CJMT EIS/OEIS Chapter 3, Affected Environment April 2015 Draft Socioeconomics and Environmental Justice
3-264
Gathering. According to multiple Tinian government agencies, people gather yams and hot peppers as a cultural tradition. It is often something that mothers and daughters do together (DoN 2014). The hot pepper is also the basis for the island’s largest community event—the Pika Festival. This festival has been ongoing for more than 10 years and features song and dance performances, including performances by school groups, and events such as a crab race, a hot pepper eating contest, and a pika burger eating contest (Camacho 2014). While the peppers have more of a cultural value than for subsistence purposes, Tinian government agency sources indicated that yams are consumed by gatherers and their families (DoN 2014).
Fishing 3.15.8.2.2
On April 19, 1999, the National Marine Fisheries Service officially identified the CNMI as a fishing community. The legal concept of a fishing community means “a community which is substantially dependent on, or substantially engaged in the harvest or processing of fishery resources to meet social and economic needs” (National Oceanic and Atmospheric Administration 2012). According to multiple Tinian government agencies, fishing is a cultural and traditional activity that is passed down from father to son at an early age (DoN 2014).
According to the Tinian Department of Land and Natural Resources and the Western Pacific Fishery Management Council, Tinian fishermen typically do not sell fish to earn a profit, they do so to obtain food for themselves and their family (DoN 2014). The frequency and value of subsistence fishing on Tinian is not known, but on Saipan data indicate that 90% of the catch was consumed by fishermen, family, and friends, while about 8% was sold.
Hunting 3.15.8.2.3
According to Tinian government agencies, hunting is a cultural and traditional activity that is passed down from father to son (DoN 2014). The Tinian Department of Land and Natural Resources indicated that wildlife that are hunted include turtledoves, coconut crabs, sea crabs, as well as feral goats and chickens (DoN 2014). While the entire island could be considered a hunting ground, the majority of hunting resources are located in the unpopulated northern two-thirds of the island, in the Military Lease Area. The reason for this in part is because there are laws against firing weapons in populated, residential areas found in the south (DoN 2014). Agencies noted that the mid-west to east part of the island is prime coconut crab area, but during the coconut crab season they can be hunted anywhere on the island, and that a prime area for sea crabs is on the northeast coast within the Military Lease Area (DoN 2014).
3.15.8.3 Pagan
Throughout the early history of Pagan there has been a pattern of settlement and relocation and a continuous desire to settle the island. The early history of Pagan is discussed in Section 3.11, Cultural
Resources.
There are no official residents of Pagan, though research indicates that about 100 families claim that they have personal or ancestral ties (DoN 2014). Some people that grew up on Pagan currently live on Saipan because of the 1981 eruption of Mount Pagan; others have ancestors that lived on the island or are buried there (DoN 2014). People with personal or ancestral ties consider Pagan as part of their

CJMT EIS/OEIS Chapter 3, Affected Environment April 2015 Draft Socioeconomics and Environmental Justice
3-265
language and culture and they have expressed a desire to go back permanently (DoN 2014); others have indicated they want to visit their former home sites.
Since the passage of the Northern Islands Village and Agricultural Homesteading Act of 2008, no Northern Islands homesteads have been permitted or deeded (a permit would allow home construction on a homestead lot while a deed would imply actual ownership of the homestead lot). In 2013, CNMI House Bill 18-109 was enacted to simplify the homestead permit process by waiving certain eligibility requirements. Eligibility requirements notwithstanding, the Department of Public Lands indicates that while homestead permits may be issued, they cannot legally provide homestead deeds until the homestead lands have the infrastructure (i.e., water, electricity) necessary to ensure safe and sanitary living (DoN 2014).
CNMI government agencies indicate that they would need to make provisions to provide public services for any villages that would be developed on Pagan (DoN 2014). Because physical and public services infrastructure would need to be developed on the distant island, homesteading on Pagan would be very costly to the CNMI government (DoN 2014). Those who wish to re-settle Pagan indicate that they do not require publicly provided infrastructure; they can live in housing that uses sustainable techniques that make large-scale public infrastructure unnecessary (DoN 2014). However, development without public services may violate certain public safety and child protective statutes of the CNMI.
3.15.9 Environmental Justice and the Protection of Children
Tinian is a small island of approximately 39 square miles (101 square kilometers) in size with a little over 3,000 residents. Local residents occupy the southern one-third of the island and live generally in the villages of San Jose, Marpo, and Carolinas, with the majority in San Jose. The population is predominately of Pacific Islander and Asian decent with low numbers of other races. Approximately 30% of the Tinian population is made up of children less than 18 years of age.
Pagan does not support any permanent residents or schools (U.S. Census Bureau 2010b) for whom environmental justice and the protection of children evaluations could be made.
3.15.9.1 Minority Population Areas
Table 3.15-8 shows the 2010 minority population proportions for the CNMI overall and Tinian. The CNMI minority population comprised 97.9% of the total population (2.1% of CNMI population was non-minority), while the Tinian population is 98.2% minority. As defined by Council on Environmental Quality guidelines and presented in Section 3.15.1, Definition, any area where 50% or more of the population is minority, then it is considered a minority population area. Therefore, all of Tinian is considered a minority population area.

CJMT EIS/OEIS Chapter 3, Affected Environment April 2015 Draft Socioeconomics and Environmental Justice
3-266
Table 3.15-8. Minority Population Areas (> 50%) by Census Tract
Location Total
Population Minority
Population %
Minority
Census Tract 9501, Rota 2,527 2,488 98.5% Census Tract 1, Saipan 1,527 1,455 95.3% Census Tract 2, Saipan 1,457 1,419 97.4% Census Tract 3, Saipan 1,705 1,598 93.7% Census Tract 4, Saipan 3,983 3,953 99.2% Census Tract 5, Saipan 2,820 2,776 98.4% Census Tract 6, Saipan 2,577 2,504 97.2% Census Tract 7, Saipan 3,369 3,334 99.0% Census Tract 8, Saipan 2,078 2,051 98.7% Census Tract 9, Saipan 3,650 3,634 99.6% Census Tract 10, Saipan 2,451 2,420 98.7% Census Tract 11, Saipan 1,520 1,503 98.9% Census Tract 12, Saipan 2,635 2,590 98.3% Census Tract 13, Saipan 3,272 3,252 99.4% Census Tract 14, Saipan 4,980 4,916 98.7% Census Tract 15, Saipan 3,853 3,687 95.7% Census Tract 16, Saipan 4,226 4,204 99.5% Census Tract 17, Saipan 2,117 1,903 89.9% Census Tract 9501.01, Tinian 1,939 1,904 98.2% Census Tract 9502, Tinian 1,197 1,175 98.2% Source: U.S. Census Bureau 2010a.
The Tinian population is further defined in the 2010 Census as 47% Asian, 39% Pacific Islander (of which 97% was Chamorro), and 12% two or more races.
3.15.9.2 Low-income Population Areas
The 2010 low-income population proportions for the CNMI overall and Tinian are presented by Census Tract on Figure 3.15-6 and in Table 3.15-9. For the CNMI overall, 52% of the population was below the poverty line in 2010. On Tinian, 43.6% of the population was below the poverty line as defined by the Bureau of Census. Therefore, the island is low income and from the perspective of Executive Order 12898, the majority of the residents of Tinian are both minority and low income.

Figure 3.15-6Minority and Low-income Population Areas
Legend
Source: United States Census 2010
RotaInternational Airport
9501
NRota
Marpi Point
BirdIsland
Sanctuary
SaipanInternational Airport
Naftan Point
1
17
13
157
5
3
16
6
14
2
8
109
4
1112
3(1)
Saipan
Unai Masalok
Tinian InternationalAirport
Ushi "Cross" Point
Unai Lam Lam
Unai ChigetUnai Chulu
Unai Dankulo
North Field
9502
9501.01
Tinian
per Council on EnvironmentalQuality guidelines
0 2 41Miles
0 2 41Kilometers
Legend2010 Census Tract BoundaryMinority and Low-incomePopulation Area
NN
3-267
CJMT EIS/OEIS Chapter 3, Affected Environment April 2015 Draft Socioeconomics and Environmental Justice
3-268
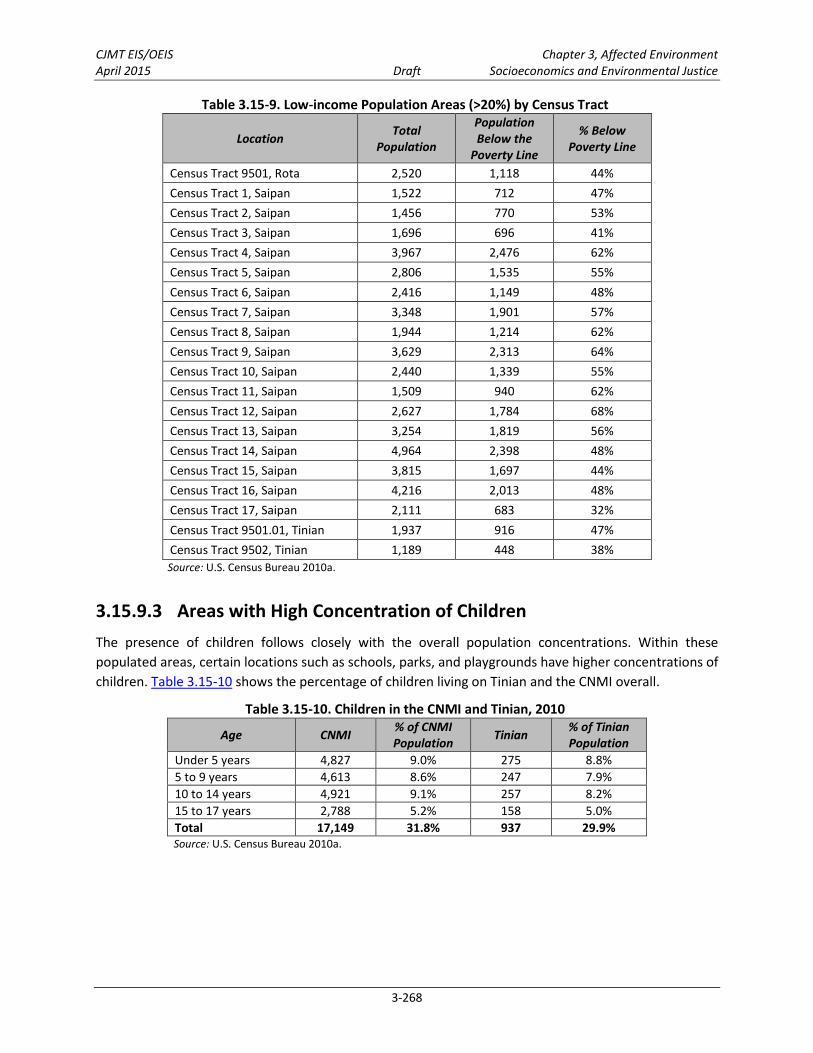
Table 3.15-9. Low-income Population Areas (>20%) by Census Tract
Location Total
Population
Population Below the
Poverty Line
% Below Poverty Line
Census Tract 9501, Rota 2,520 1,118 44% Census Tract 1, Saipan 1,522 712 47% Census Tract 2, Saipan 1,456 770 53% Census Tract 3, Saipan 1,696 696 41% Census Tract 4, Saipan 3,967 2,476 62% Census Tract 5, Saipan 2,806 1,535 55% Census Tract 6, Saipan 2,416 1,149 48% Census Tract 7, Saipan 3,348 1,901 57% Census Tract 8, Saipan 1,944 1,214 62% Census Tract 9, Saipan 3,629 2,313 64% Census Tract 10, Saipan 2,440 1,339 55% Census Tract 11, Saipan 1,509 940 62% Census Tract 12, Saipan 2,627 1,784 68% Census Tract 13, Saipan 3,254 1,819 56% Census Tract 14, Saipan 4,964 2,398 48% Census Tract 15, Saipan 3,815 1,697 44% Census Tract 16, Saipan 4,216 2,013 48% Census Tract 17, Saipan 2,111 683 32% Census Tract 9501.01, Tinian 1,937 916 47% Census Tract 9502, Tinian 1,189 448 38% Source: U.S. Census Bureau 2010a.
3.15.9.3 Areas with High Concentration of Children
The presence of children follows closely with the overall population concentrations. Within these populated areas, certain locations such as schools, parks, and playgrounds have higher concentrations of children. Table 3.15-10 shows the percentage of children living on Tinian and the CNMI overall.
Table 3.15-10. Children in the CNMI and Tinian, 2010
Age CNMI % of CNMI Population
Tinian % of Tinian Population
Under 5 years 4,827 9.0% 275 8.8% 5 to 9 years 4,613 8.6% 247 7.9% 10 to 14 years 4,921 9.1% 257 8.2% 15 to 17 years 2,788 5.2% 158 5.0% Total 17,149 31.8% 937 29.9% Source: U.S. Census Bureau 2010a.

CJMT EIS/OEIS Chapter 3, Affected Environment April 2015 Draft Socioeconomics and Environmental Justice
3-269
Table 3.15-11 shows the percentage of children living under the poverty line on Tinian and in the CNMI overall.
Table 3.15-11. Percentage of Children Below the Poverty Line Age CNMI Tinian
Under 5 years 59% 49% 5 years 58% 48% 6 to 11 years 56% 45% 12 to 17 years 50% 36% All Children 55% 43% Source: U.S. Census Bureau 2010a.
Figure 3.15-7 shows populated areas and school locations on Tinian, as well as on Saipan and Rota for comparison purposes. The greatest concentration of schools on Tinian is located in the village of San Jose, to the southeast of the Military Lease Area and in the southwest end of Saipan.

Figure 3.15-7Schools and Highly Populated Areas
Legend
Source: Pacific Disaster Center 2013
åå
RotaInternational Airport
Sinapalu
Song Song
Legendå School Location
Populated Area
åå
åå
åå
å
å
å
å
Marpi Point
BirdIsland
Sanctuary
SaipanInternational Airport
Naftan Point
Kagman
Garapan
Agingan
Chalan Kanoa
San Roque
Capitol Hill
Dan Dan
Tanapag
Lau Lauå åå
Unai Masalok
Ushi "Cross" Point
Unai Lam Lam
Unai ChigetUnai Chulu
Unai Dankulo
Tinian InternationalAirport
North Field
San Jose
0 2 41Miles
0 2 41Kilometers
RotaSaipan Tinian
NNN
3-270