seismic evaluation of a steel moment frame with cover ... evaluation of a steel moment frame with...
TRANSCRIPT
Seismic Evaluation of a Steel Moment Frame with Cover Plate Connection Considering Flexibility by Component Method
*M. Ghassemieh1), A.R. Bahadori2)
1), 2) School of Civil Engineering, University of Tehran, Tehran, Iran
1) [email protected] 2) [email protected]
Abstract
Cover plate (CP) moment resisting connections have been recognized as a very practical steel moment connections for steel structures due to their seismic performance. Since almost every moment connections in moment resisting frames are considered as being fully-rigid and the certain behavior of this connection is neglected, this study aims at investigating the seismic performance of a steel moment frame considering influence of flexibility of its connections. This paper deals with a spring-stiffness model called “the component method” to predicting the real behavior of steel moment connections (specially their moment-rotation curves).
The behavior of the frame with cover plate moment connections in both cases of including as well as excluding the flexibility of the connections is compared using nonlinear static pushover, and incremental dynamic analyses. In all models, P-Delta effects along with material and geometrical nonlinearities were included in the analyses. Results revealed that taking the realistic behavior of beam column connection into account results in almost different outcome.
Keywords. Cover plate, Beam to box column connection, Component method, Flexibility. 1. INTRODUCTION The behavior of steel moment resisting frames is greatly affected by the properties of the beam to column connections, specially in seismic zones and understanding the strength and rigidity of connection regions is necessary for the efficient design of steel building systems. Before the Northridge earthquake, moment frames with full penetration welds acquired reputation as an ideal seismic resistant systems. However, the Northridge earthquake has revealed brittle fracture near the beam to column flange groove welds in this connection. The behavior of steel connections continues to be an issue of interest in
1)
Professor 2)
Student

the area of steel structures. The nonlinear behavior of steel frames joints is experimentally proved even in the case of welded connections. A practical method for later concept is considering the real behavior of the connections in moment resisting frames. Cover plate (CP) moment resisting connections is one of those connections which supposed to reveal rigid behavior in beam to box column connections. A considerable number of literatures have been published on the seismic behavior of beam to column connections considering the real behavior of the joints. Ang and Morris (1984) studied the performance of unbraced steel frames with semi rigid connections considering the flexibility of connections in the models. Azizinamini and Radziminski (1989) investigated on static and cyclic performance of semi rigid steel beam to column joints. Results revealed that the behavior of the moment-rotation of the joint depend on the length and the thickness of the angles. Nader and Astaneh-Asl (1991) studied the behavior of a structure with rigid, semi rigid, and pinned connections under different seismic records. Their results had shown that frames with semi rigid connections had a better performance rather than rigid joints. Lui and Lopez (1997) investigated on dynamic analysis and response of semi rigid frames. Mazroi et al. (1999) studied the behavior of the beam to box column connections with cover plates. Awkar and Lui (1999) investigated the behavior of a five and eight story frame with rigid, semi-rigid and pinned connections. Results have shown that the connection flexibility tends to reduce frame stiffness and hence increase vibration periods, specially in lower modes. While it increases damping and when properly designed, steel frames with semi rigid connection are very efficient against resisting forces generated from ground motion because of their ability to dissipate seismic energy through large inelastic deformation and damping. Natural period and base shear in the frames with semi rigid connection can be controlled. Da Silva et al. (2001) investigated on steel joints at elevated temperatures. McMullin and Astaneh-Asl (2003) studied on seismic behavior of semi rigid connections in column-Tree moment resisting frame. Urbonas and Daniūnas (2005) studied on the behavior of semi-rigid steel beam-to-beam joints under bending and axial forces. The results showed that tensile and compression forces respectively decreased and increased the rotational stiffness of the joints. Ghassemieh et al. (2013) studied on flexibility of end-plate steel joints using finite element method when the connection is subjected to seismic excitation. Ghassemieh et al. (2014) investigated on seismic response of end-plate moment connections adopting the flexibility of the joint. The purpose of this research is to investigate on seismic performance of a seven story frame with CP connection by considering the actual behavior of connection. First, considered sample was modeled using component method for predicting the flexibility of the connection, then for the evaluation of obtained results, the connection modeling by component method was verified by the connections designed by Saneei Nia et al (2013). Then pushover analyses and incremental dynamic analyses (IDA) of 7-story frame with different behavior for connections are conducted in order to compare the behavior of the frame with realistic rigidity of the connection with the rigidity normally used in the idealistic behavior.
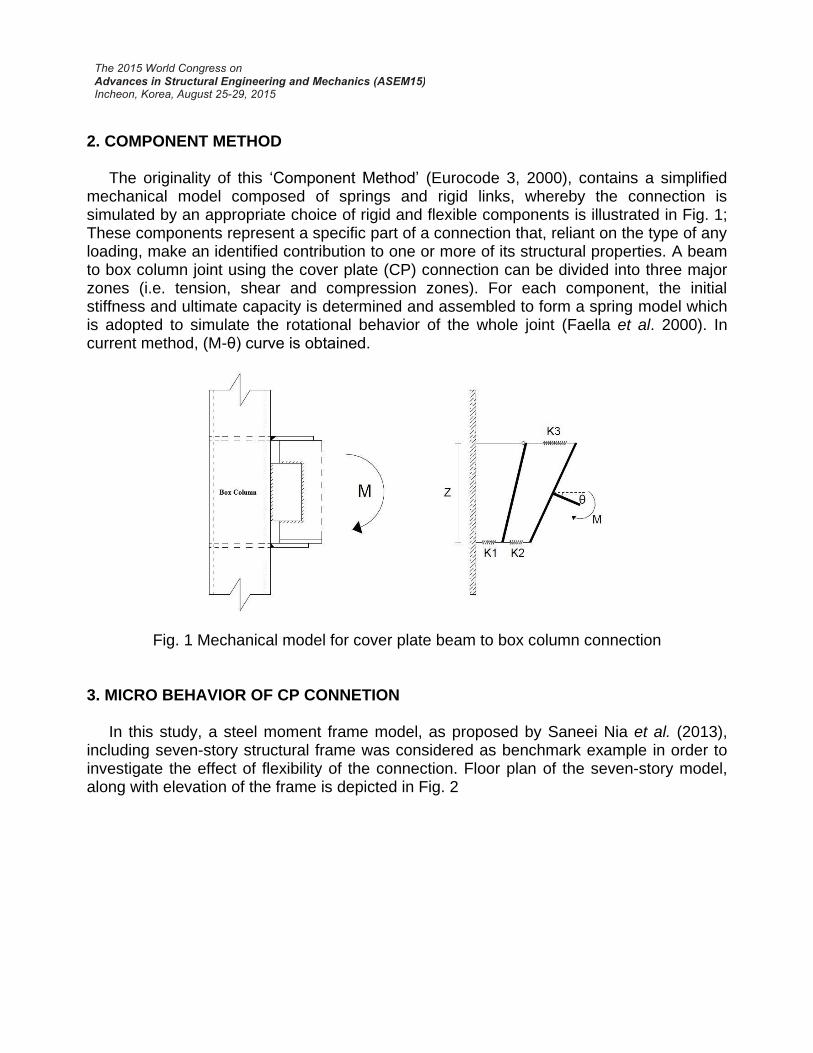
2. COMPONENT METHOD The originality of this ‘Component Method’ (Eurocode 3, 2000), contains a simplified mechanical model composed of springs and rigid links, whereby the connection is simulated by an appropriate choice of rigid and flexible components is illustrated in Fig. 1; These components represent a specific part of a connection that, reliant on the type of any loading, make an identified contribution to one or more of its structural properties. A beam to box column joint using the cover plate (CP) connection can be divided into three major zones (i.e. tension, shear and compression zones). For each component, the initial stiffness and ultimate capacity is determined and assembled to form a spring model which is adopted to simulate the rotational behavior of the whole joint (Faella et al. 2000). In current method, (M-θ) curve is obtained.
Fig. 1 Mechanical model for cover plate beam to box column connection 3. MICRO BEHAVIOR OF CP CONNETION In this study, a steel moment frame model, as proposed by Saneei Nia et al. (2013), including seven-story structural frame was considered as benchmark example in order to investigate the effect of flexibility of the connection. Floor plan of the seven-story model, along with elevation of the frame is depicted in Fig. 2

Fig. 2 Plan and elevation view of selected frame (Saneei Nia et al, 2013)
Details of the designed beams and columns are provided in Table 1. In addition, Fig. 3 and Table 2 provide the information on geometrical details of the cover plate for the designed specimens. All the connections for the above mentioned frames are designed in accordance with the design steps of the prequalified connections in the Iranian Building Code No.10 (IBC).
Table 1. Beams and columns properties (Saneei Nia et al, 2013)
Beam bf (mm) tf (mm) hb (mm) tw (mm)
PG1 150 10 320 8 PG2 200 15 300 8
Column bc (mm) tc (mm) hc (mm) tw (mm)
Box 300x20 300 20 300 20 Box 250x20 250 20 250 20
Table 2. Dimensions and characteristics of the specimens
Specimens Column Beam Top Plate (mm) Seat Plate (mm)
Continuity Plate
Thickness (mm) bt tt bs ts tct tcs
TSP1 Box 300x20 PG2 240 35 240 25 35 25 TSP2 Box 250x20 PG2 240 35 240 25 35 25 TSP3 Box 250x20 PG1 160 30 180 20 30 20
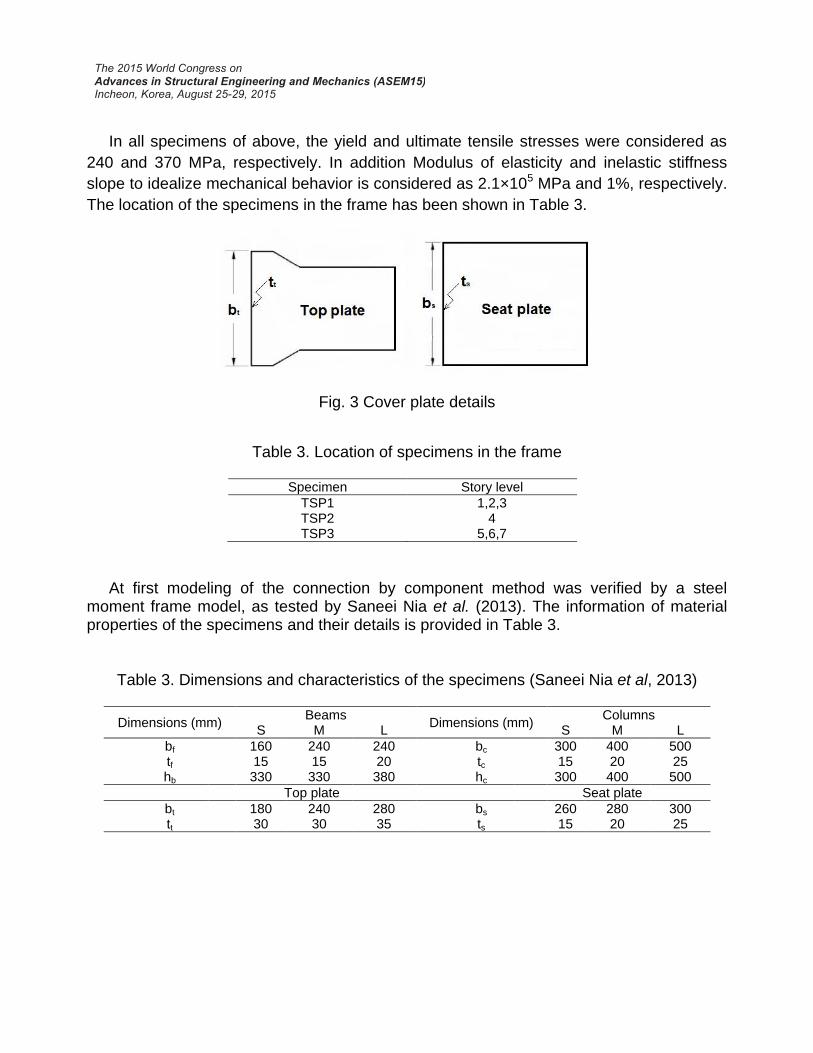
In all specimens of above, the yield and ultimate tensile stresses were considered as
240 and 370 MPa, respectively. In addition Modulus of elasticity and inelastic stiffness
slope to idealize mechanical behavior is considered as 2.1×10⁵ MPa and 1%, respectively.
The location of the specimens in the frame has been shown in Table 3.
Fig. 3 Cover plate details
Table 3. Location of specimens in the frame
Specimen Story level
TSP1 1,2,3 TSP2 4 TSP3 5,6,7
At first modeling of the connection by component method was verified by a steel moment frame model, as tested by Saneei Nia et al. (2013). The information of material properties of the specimens and their details is provided in Table 3.
Table 3. Dimensions and characteristics of the specimens (Saneei Nia et al, 2013)
Columns Dimensions (mm)
Beams Dimensions (mm)
L M S L M S
500 400 300 bc 240 240 160 bf 25 20 15 tc 20 15 15 tf
500 400 300 hc 380 330 330 hb
Seat plate Top plate
300 280 260 bs 280 240 180 bt 25 20 15 ts 35 30 30 tt
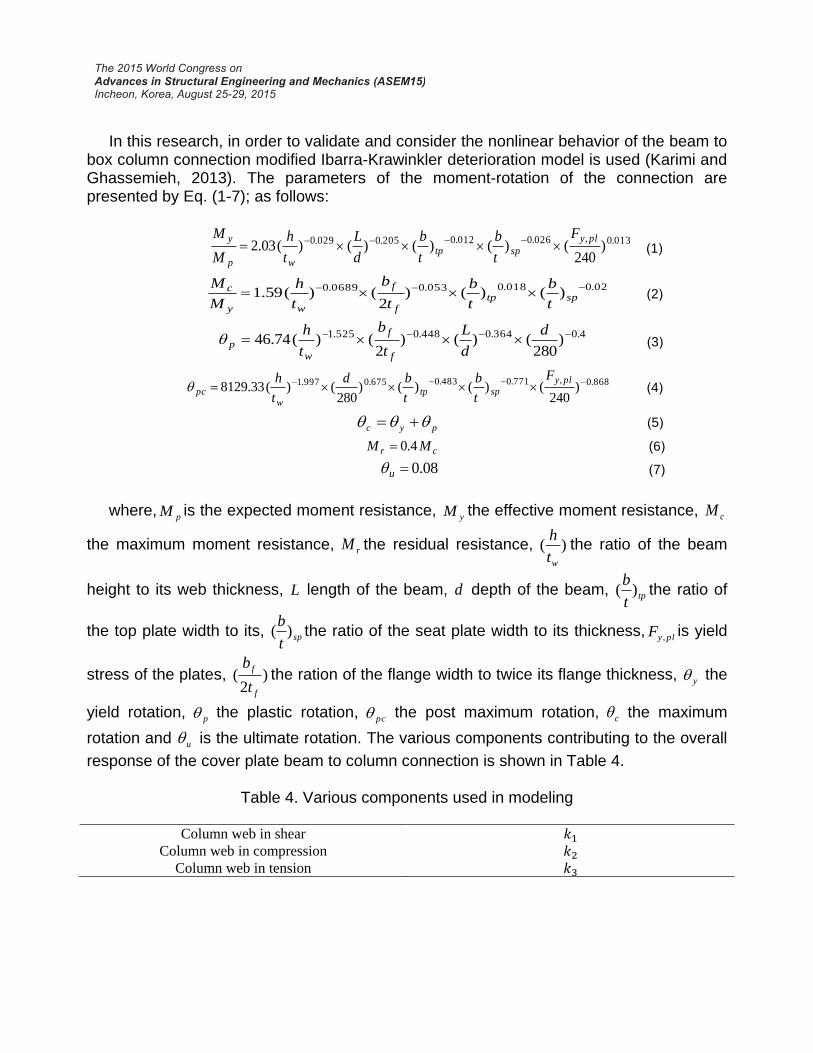
In this research, in order to validate and consider the nonlinear behavior of the beam to box column connection modified Ibarra-Krawinkler deterioration model is used (Karimi and Ghassemieh, 2013). The parameters of the moment-rotation of the connection are presented by Eq. (1-7); as follows:
(1) 013.0,026.0012.0205.0029.0 )
240()()()()(03.2
ply
sptpwp
y F
t
b
t
b
d
L
t
h
M
M
(2) 02.0018.0053.00689.0 )()()
2()(59.1
sptpf
f
wy
c
t
b
t
b
t
b
t
h
M
M
(3) 4.0364.0448.0525.1 )
280()()
2()(74.46
d
d
L
t
b
t
h
f
f
wp
(4) 868.0,771.0483.0675.0997.1 )
240()()()
280()(33.8129
ply
sptpw
pc
F
t
b
t
bd
t
h
(5) pyc
((6 cr MM 4.0
(7) 08.0u
where,pM is the expected moment resistance,
yM the effective moment resistance, cM
the maximum moment resistance, rM the residual resistance, )(wt
hthe ratio of the beam
height to its web thickness, L length of the beam, d depth of the beam, tpt
b)( the ratio of
the top plate width to its, spt
b)( the ratio of the seat plate width to its thickness,
plyF ,is yield
stress of the plates, )2
(f
f
t
bthe ration of the flange width to twice its flange thickness,
y the
yield rotation, p the plastic rotation,
pc the post maximum rotation, c the maximum
rotation and u is the ultimate rotation. The various components contributing to the overall
response of the cover plate beam to column connection is shown in Table 4.
Table 4. Various components used in modeling
Column web in shear
Column web in compression
Column web in tension
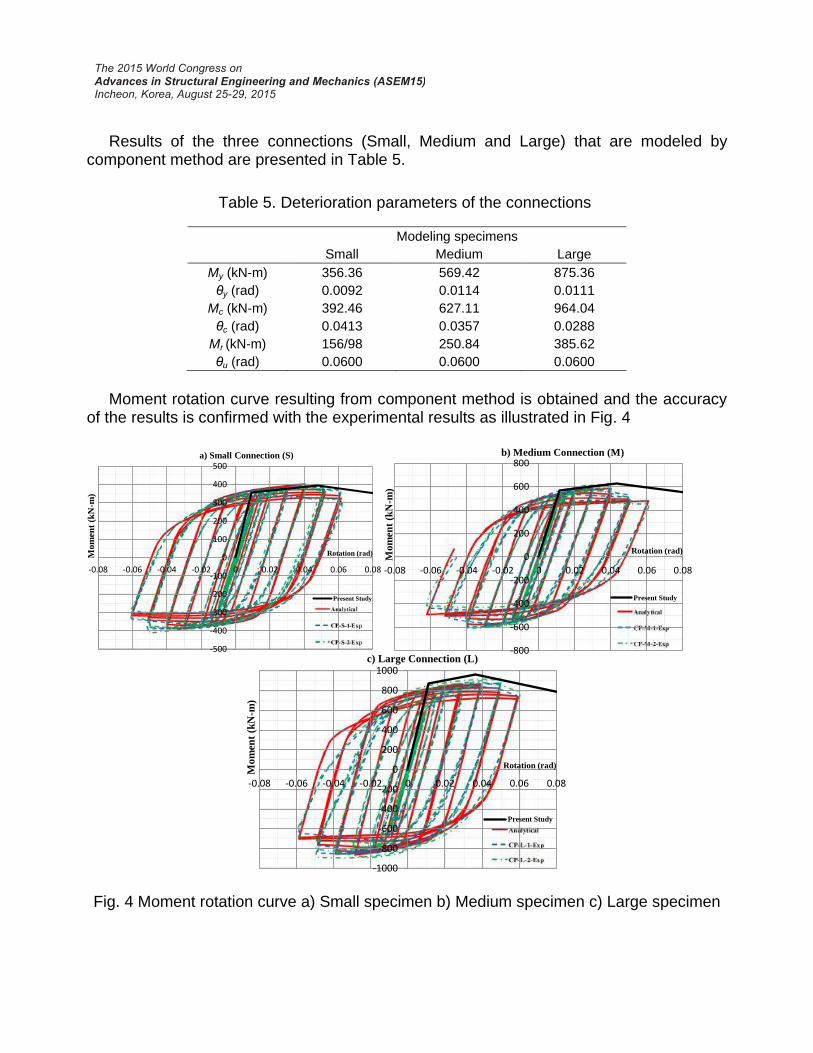
Results of the three connections (Small, Medium and Large) that are modeled by component method are presented in Table 5.
Table 5. Deterioration parameters of the connections
Modeling specimens
Small Medium Large
My (kN-m) 356.36 569.42 875.36
θy (rad) 0.0092 0.0114 0.0111
Mc (kN-m) 392.46 627.11 964.04
θc (rad) 0.0413 0.0357 0.0288
Mr (kN-m) 156/98 250.84 385.62
θu (rad) 0.0600 0.0600 0.0600
Moment rotation curve resulting from component method is obtained and the accuracy of the results is confirmed with the experimental results as illustrated in Fig. 4
Fig. 4 Moment rotation curve a) Small specimen b) Medium specimen c) Large specimen
-500
-400
-300
-200
-100
0
100
200
300
400
500
-0.08 -0.06 -0.04 -0.02 0 0.02 0.04 0.06 0.08
Mo
men
t (k
N-m
)
a) Small Connection (S)
Rotation (rad)
Present Study
-800
-600
-400
-200
0
200
400
600
800
-0.08 -0.06 -0.04 -0.02 0 0.02 0.04 0.06 0.08
Mo
men
t (k
N-m
)
Rotation (rad)
b) Medium Connection (M)
Present Study
-1000
-800
-600
-400
-200
0
200
400
600
800
1000
-0.08 -0.06 -0.04 -0.02 0 0.02 0.04 0.06 0.08
Mo
men
t (k
N-m
)
Rotation (rad)
c) Large Connection (L)
Present Study

After verification, the proposed connections (TSP1, TSP2 and TSP3) were modeled by using component method and the moment rotation curves of the connections were illustrated in Fig. 5 Results have been presented in Table 6.
Fig. 5 Moment rotation curve using component method a) TSP1 b) TSP2 c) TSP3
-500
-400
-300
-200
-100
0
100
200
300
400
500
-0.08 -0.06 -0.04 -0.02 0 0.02 0.04 0.06 0.08
Mo
men
t (k
N-m
)
Rotation (Rad)
a) TSP1
TSP1
-500
-400
-300
-200
-100
0
100
200
300
400
500
-0.08 -0.06 -0.04 -0.02 0 0.02 0.04 0.06 0.08
Mo
men
t (k
N-m
)
Rotation (Rad)
b) TSP2
TSP2
-500
-400
-300
-200
-100
0
100
200
300
400
500
-0.08 -0.06 -0.04 -0.02 0 0.02 0.04 0.06 0.08
Mo
men
t (k
N-m
)
Rotation (Rad)
c) TSP3
TSP3
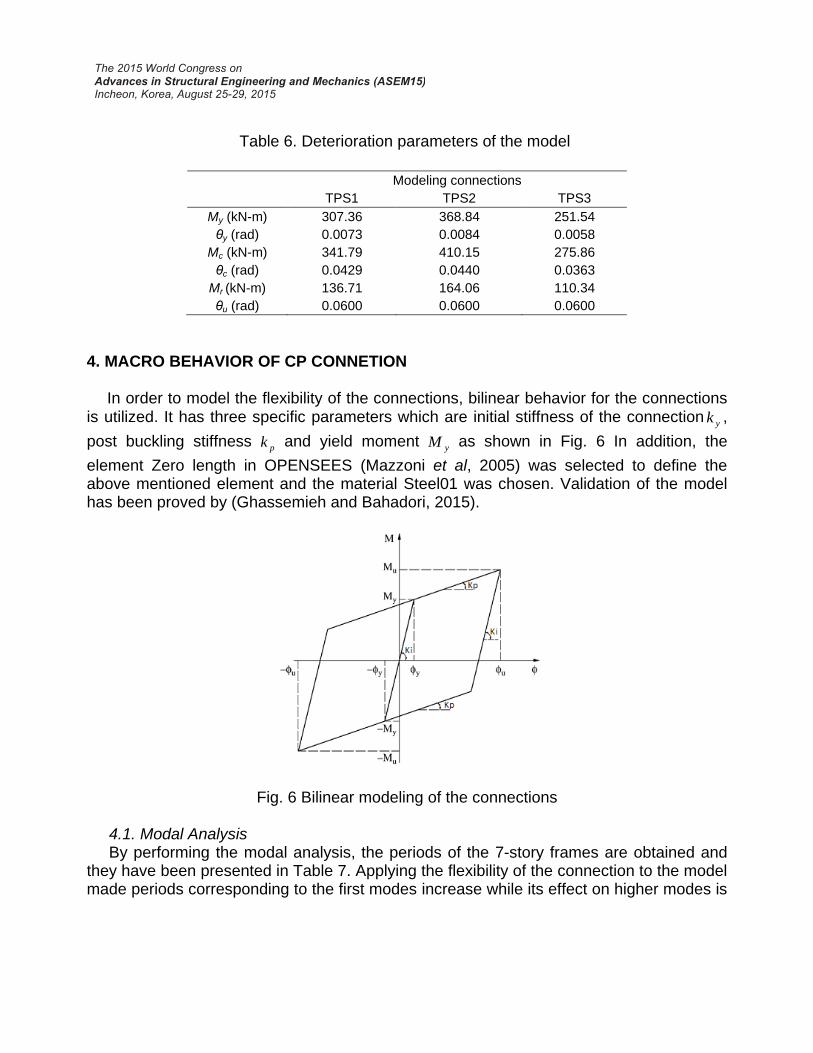
Table 6. Deterioration parameters of the model
Modeling connections
TPS1 TPS2 TPS3
My (kN-m) 307.36 368.84 251.54
θy (rad) 0.0073 0.0084 0.0058
Mc (kN-m) 341.79 410.15 275.86
θc (rad) 0.0429 0.0440 0.0363
Mr (kN-m) 136.71 164.06 110.34
θu (rad) 0.0600 0.0600 0.0600
4. MACRO BEHAVIOR OF CP CONNETION In order to model the flexibility of the connections, bilinear behavior for the connections is utilized. It has three specific parameters which are initial stiffness of the connection
yk ,
post buckling stiffness pk and yield moment
yM as shown in Fig. 6 In addition, the
element Zero length in OPENSEES (Mazzoni et al, 2005) was selected to define the above mentioned element and the material Steel01 was chosen. Validation of the model has been proved by (Ghassemieh and Bahadori, 2015).
Fig. 6 Bilinear modeling of the connections
4.1. Modal Analysis By performing the modal analysis, the periods of the 7-story frames are obtained and they have been presented in Table 7. Applying the flexibility of the connection to the model made periods corresponding to the first modes increase while its effect on higher modes is
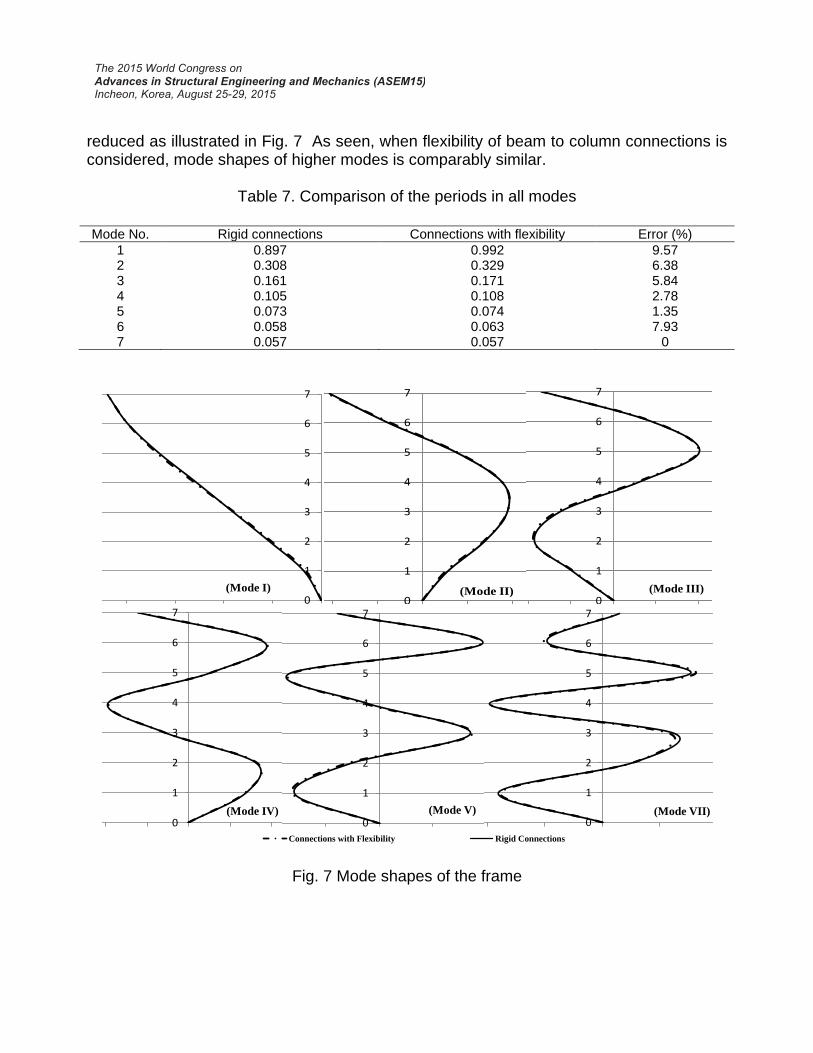
reduced as illustrated in Fig. 7 As seen, when flexibility of beam to column connections is considered, mode shapes of higher modes is comparably similar.
Table 7. Comparison of the periods in all modes
Mode No. Rigid connections Connections with flexibility Error (%)
1 0.897 0.992 9.57 2 0.308 0.329 6.38 3 0.161 0.171 5.84 4 0.105 0.108 2.78 5 0.073 0.074 1.35 6 0.058 0.063 7.93 7 0.057 0.057 0
Fig. 7 Mode shapes of the frame
0
1
2
3
4
5
6
7
-0.0025 -0.002 -0.0015 -0.001 -0.0005 0
Connections with…Rigid Connections
(Mode I)
0
1
2
3
4
5
6
7
-0.003 -0.002 -0.001 0 0.001 0.002 0.003
with Flexibility (Mode II)
Rigid (Mode II)
(Mode II)0
1
2
3
4
5
6
7
-0.003 -0.002 -0.001 0 0.001 0.002 0.003
with Flexibility (Mode III)
Rigid (Mode III)
(Mode III)
0
1
2
3
4
5
6
7
-0.003 -0.002 -0.001 0 0.001 0.002 0.003
with Flexibility (Mode IV)
Rigid (Mode IV)
(Mode IV)0
1
2
3
4
5
6
7
-0.002 -0.001 0 0.001 0.002 0.003
with Flexibility (Mode V)
Rigid (Mode V)
(Mode V)0
1
2
3
4
5
6
7
-0.003 -0.002 -0.001 0 0.001 0.002
with Flexibility (Mode VI)Rigid (Mode VII)
(Mode VII)
0
1
2
3
4
5
6
7
-0.0025 -0.002 -0.0015 -0.001 -0.0005 0 0.0005 0.001 0.0015 0.002
Connections with Flexibility Rigid Connections
(Mode VII)
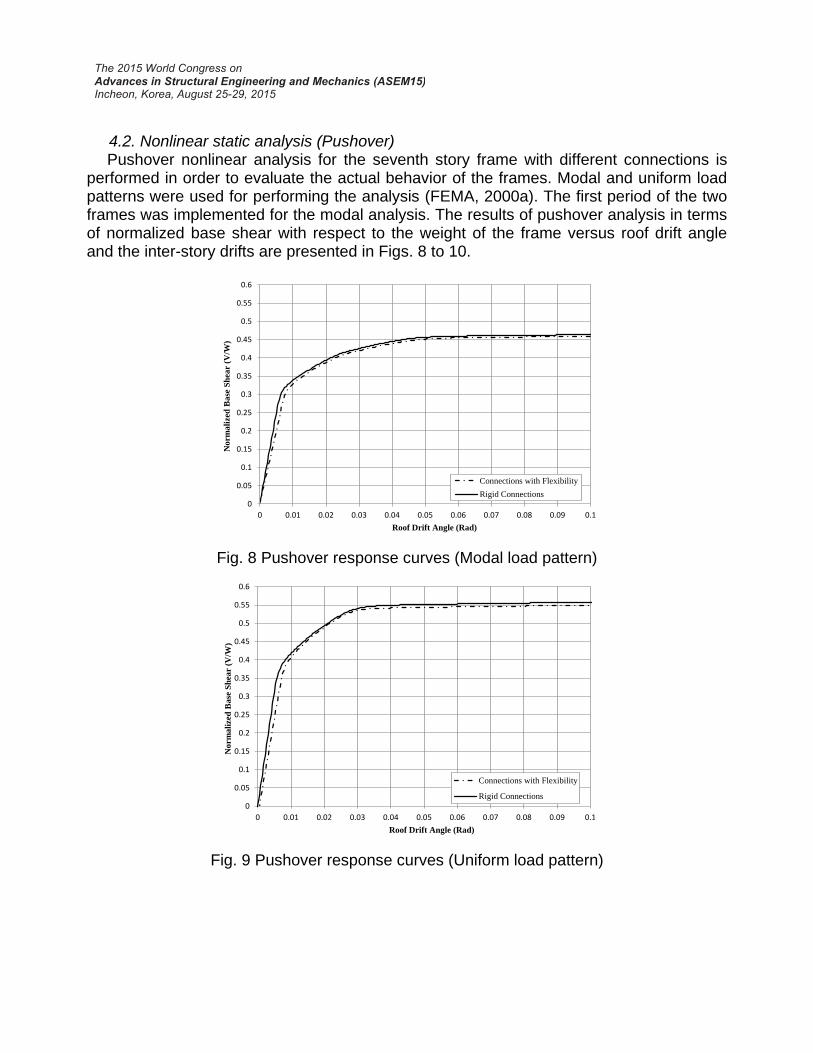
4.2. Nonlinear static analysis (Pushover) Pushover nonlinear analysis for the seventh story frame with different connections is performed in order to evaluate the actual behavior of the frames. Modal and uniform load patterns were used for performing the analysis (FEMA, 2000a). The first period of the two frames was implemented for the modal analysis. The results of pushover analysis in terms of normalized base shear with respect to the weight of the frame versus roof drift angle and the inter-story drifts are presented in Figs. 8 to 10.
Fig. 8 Pushover response curves (Modal load pattern)
Fig. 9 Pushover response curves (Uniform load pattern)
0
0.05
0.1
0.15
0.2
0.25
0.3
0.35
0.4
0.45
0.5
0.55
0.6
0 0.01 0.02 0.03 0.04 0.05 0.06 0.07 0.08 0.09 0.1
No
rma
lize
d B
ase
Sh
ear
(V/W
)
Modal
Roof Drift Angle (Rad)
Connections with Flexibility
Rigid Connections
0
0.05
0.1
0.15
0.2
0.25
0.3
0.35
0.4
0.45
0.5
0.55
0.6
0 0.01 0.02 0.03 0.04 0.05 0.06 0.07 0.08 0.09 0.1
No
rma
lize
d B
ase
Sh
ear
(V/W
)
Uniform
Roof Drift Angle (Rad)
Connections with Flexibility
Rigid Connections
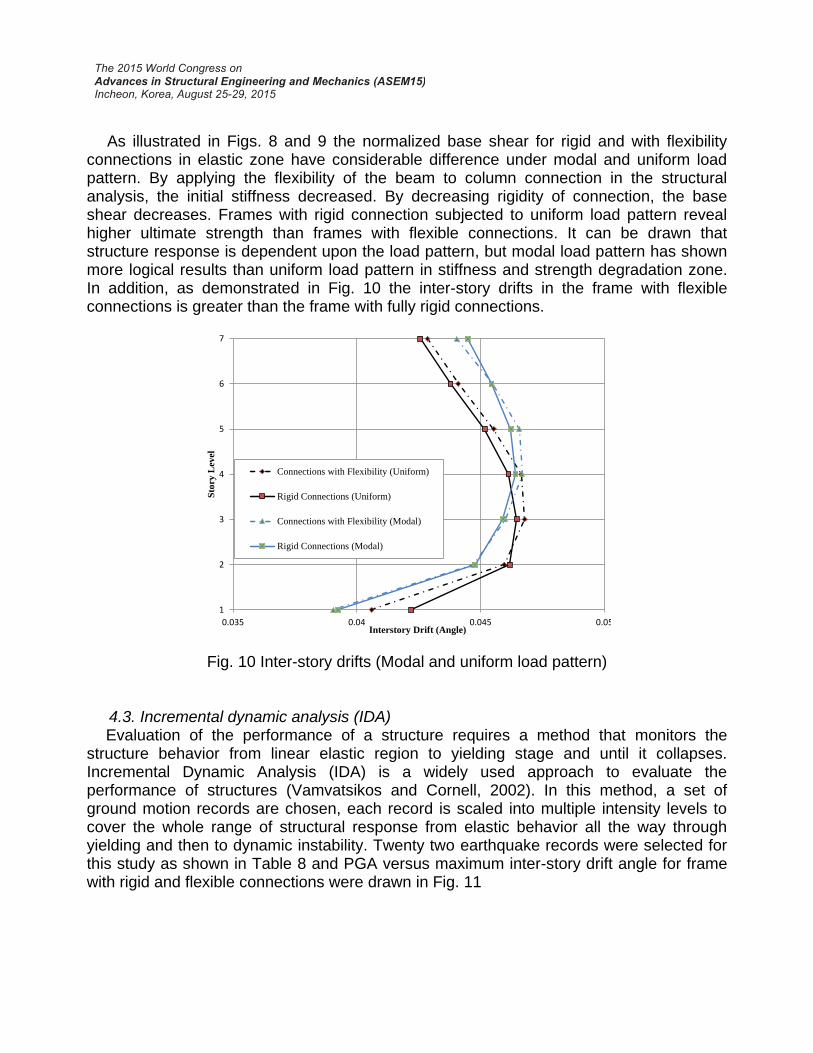
As illustrated in Figs. 8 and 9 the normalized base shear for rigid and with flexibility connections in elastic zone have considerable difference under modal and uniform load pattern. By applying the flexibility of the beam to column connection in the structural analysis, the initial stiffness decreased. By decreasing rigidity of connection, the base shear decreases. Frames with rigid connection subjected to uniform load pattern reveal higher ultimate strength than frames with flexible connections. It can be drawn that structure response is dependent upon the load pattern, but modal load pattern has shown more logical results than uniform load pattern in stiffness and strength degradation zone. In addition, as demonstrated in Fig. 10 the inter-story drifts in the frame with flexible connections is greater than the frame with fully rigid connections.
Fig. 10 Inter-story drifts (Modal and uniform load pattern) 4.3. Incremental dynamic analysis (IDA) Evaluation of the performance of a structure requires a method that monitors the structure behavior from linear elastic region to yielding stage and until it collapses. Incremental Dynamic Analysis (IDA) is a widely used approach to evaluate the performance of structures (Vamvatsikos and Cornell, 2002). In this method, a set of ground motion records are chosen, each record is scaled into multiple intensity levels to cover the whole range of structural response from elastic behavior all the way through yielding and then to dynamic instability. Twenty two earthquake records were selected for this study as shown in Table 8 and PGA versus maximum inter-story drift angle for frame with rigid and flexible connections were drawn in Fig. 11
1
2
3
4
5
6
7
0.035 0.04 0.045 0.05
Sto
ry L
evel
Interstory Drift (Angle)
Connections with Flexibility (Uniform)
Rigid Connections (Uniform)
Connections with Flexibility (Modal)
Rigid Connections (Modal)
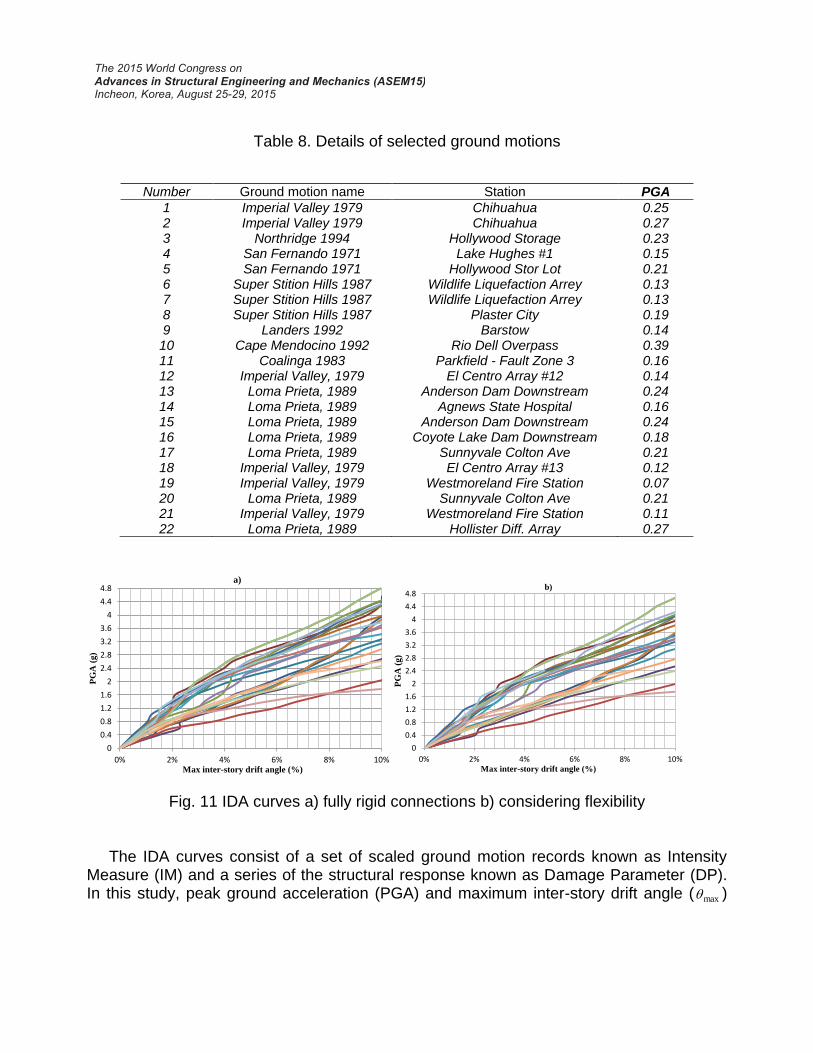
Table 8. Details of selected ground motions
Fig. 11 IDA curves a) fully rigid connections b) considering flexibility
The IDA curves consist of a set of scaled ground motion records known as Intensity Measure (IM) and a series of the structural response known as Damage Parameter (DP). In this study, peak ground acceleration (PGA) and maximum inter-story drift angle ( max )
0
0.4
0.8
1.2
1.6
2
2.4
2.8
3.2
3.6
4
4.4
4.8
0% 2% 4% 6% 8% 10%
PG
A (
g)
Max inter-story drift angle (%)
1
2
3
4
5
6
7
8
9
10
11
12
13
14
15
16
17
18
19
20
21
22
23
24
25
26
27
28
29
30
a)
0
0.4
0.8
1.2
1.6
2
2.4
2.8
3.2
3.6
4
4.4
4.8
0% 2% 4% 6% 8% 10%
PG
A (
g)
Max inter-story drift angle (%)
1
2
3
4
5
6
7
8
9
10
11
12
13
14
15
16
17
18
19
20
21
22
23
24
25
26
27
28
29
30
b)
Number Ground motion name Station PGA
1 Imperial Valley 1979 Chihuahua 0.25 2 Imperial Valley 1979 Chihuahua 0.27 3 Northridge 1994 Hollywood Storage 0.23 4 San Fernando 1971 Lake Hughes #1 0.15 5 San Fernando 1971 Hollywood Stor Lot 0.21 6 Super Stition Hills 1987 Wildlife Liquefaction Arrey 0.13 7 Super Stition Hills 1987 Wildlife Liquefaction Arrey 0.13 8 Super Stition Hills 1987 Plaster City 0.19 9 Landers 1992 Barstow 0.14 10 Cape Mendocino 1992 Rio Dell Overpass 0.39 11 Coalinga 1983 Parkfield - Fault Zone 3 0.16 12 Imperial Valley, 1979 El Centro Array #12 0.14 13 Loma Prieta, 1989 Anderson Dam Downstream 0.24 14 Loma Prieta, 1989 Agnews State Hospital 0.16 15 Loma Prieta, 1989 Anderson Dam Downstream 0.24 16 Loma Prieta, 1989 Coyote Lake Dam Downstream 0.18 17 Loma Prieta, 1989 Sunnyvale Colton Ave 0.21 18 Imperial Valley, 1979 El Centro Array #13 0.12 19 Imperial Valley, 1979 Westmoreland Fire Station 0.07 20 Loma Prieta, 1989 Sunnyvale Colton Ave 0.21 21 Imperial Valley, 1979 Westmoreland Fire Station 0.11 22 Loma Prieta, 1989 Hollister Diff. Array 0.27
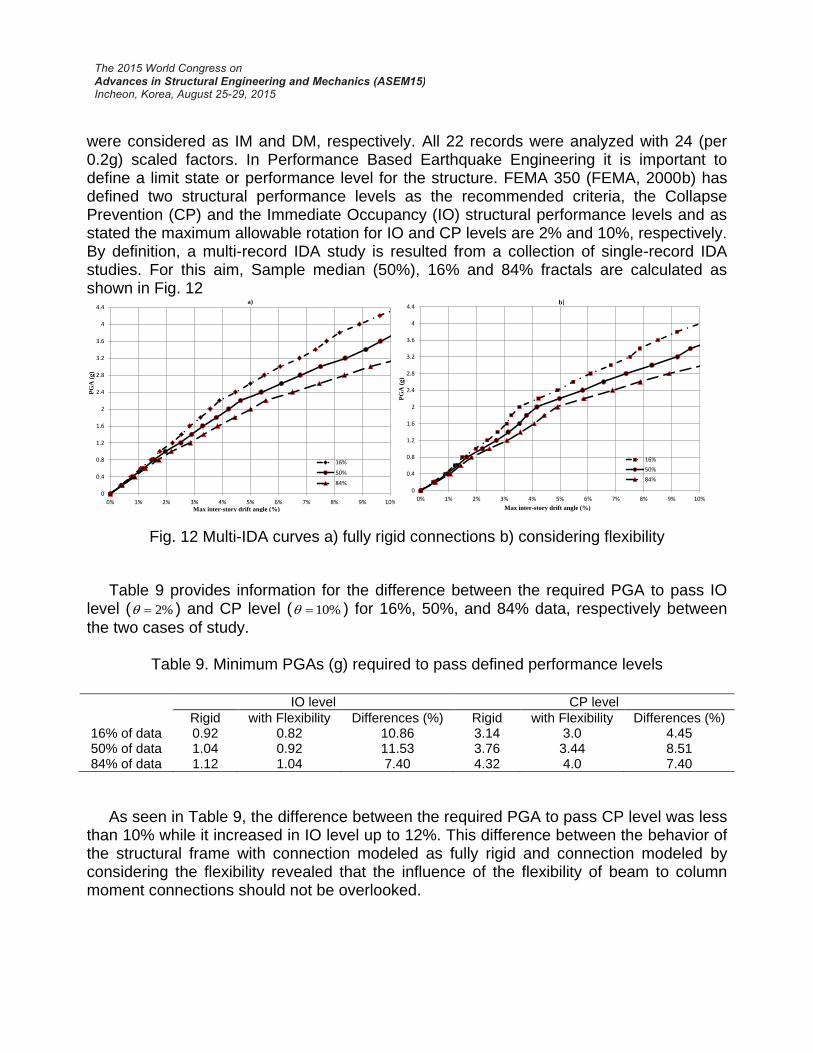
were considered as IM and DM, respectively. All 22 records were analyzed with 24 (per 0.2g) scaled factors. In Performance Based Earthquake Engineering it is important to define a limit state or performance level for the structure. FEMA 350 (FEMA, 2000b) has defined two structural performance levels as the recommended criteria, the Collapse Prevention (CP) and the Immediate Occupancy (IO) structural performance levels and as stated the maximum allowable rotation for IO and CP levels are 2% and 10%, respectively. By definition, a multi-record IDA study is resulted from a collection of single-record IDA studies. For this aim, Sample median (50%), 16% and 84% fractals are calculated as shown in Fig. 12
Fig. 12 Multi-IDA curves a) fully rigid connections b) considering flexibility
Table 9 provides information for the difference between the required PGA to pass IO level ( %2 ) and CP level ( %10 ) for 16%, 50%, and 84% data, respectively between
the two cases of study.
Table 9. Minimum PGAs (g) required to pass defined performance levels
IO level CP level
Rigid with Flexibility Differences (%) Rigid with Flexibility Differences (%) 16% of data 0.92 0.82 10.86 3.14 3.0 4.45 50% of data 1.04 0.92 11.53 3.76 3.44 8.51 84% of data 1.12 1.04 7.40 4.32 4.0 7.40
As seen in Table 9, the difference between the required PGA to pass CP level was less than 10% while it increased in IO level up to 12%. This difference between the behavior of the structural frame with connection modeled as fully rigid and connection modeled by considering the flexibility revealed that the influence of the flexibility of beam to column moment connections should not be overlooked.
0
0.4
0.8
1.2
1.6
2
2.4
2.8
3.2
3.6
4
4.4
0% 1% 2% 3% 4% 5% 6% 7% 8% 9% 10%
PG
A (
g)
Max inter-story drift angle (%)
16%
50%
84%
a)
0
0.4
0.8
1.2
1.6
2
2.4
2.8
3.2
3.6
4
4.4
0% 1% 2% 3% 4% 5% 6% 7% 8% 9% 10%
PG
A (
g)
Max inter-story drift angle (%)
16%
50%
84%
b)
5. CONCLUSION In this study, the moment-rotation behavior of beam to box column with cover plate was investigated by component method and the correctness of this method was investigated by using experimental samples available in literature. Comparing obtained results from component method and experimental tests have shown a good agreement between the predicted curves and the real behavior of the connection obtained from tests. The results from the pushover analysis revealed that the initial stiffness and the ultimate strength of the cover plate frames with fully rigid connections are more than their counterpart frame with considering the flexibility of connections. In addition, considering the flexibility of the connection in the behavior of the structural frame made the period of the structure increases. Moreover, the maximum inter-story drifts in frame with considering the flexibility of the connections experience greater values than frames with fully rigid connections. And finally, conducting the incremental dynamic analysis revealed significant difference between the two seven story frames in terms of performance levels and indicated that overlooking the flexibility of beam to column moment connections may lead to inaccurate conclusions. 6. REFERENCES Ang, K.M. and Morris, G.A., (1984),“Analysis of Three Dimensional Frames with Flexible
Beam column connections”, Canadian. J. of Civil. Eng., Vol.11, 245-254. Awkar, J.C., and Lui., E. M. (1999), “Seismic analysis and Response of Multistory
Semirigid Frames.” J. of Eng. Struc., Vol. 21 (5), 425–441. Azizinamini, A., and Radziminski. J. B. (1989), “Static and Cyclic Performance of Semirigid
Steel Beam-to-column Connections.” J. of Struc. Eng., Vol. 115 (12), 2979–2999. Da Silva L.S, Santiago, S and Vila Real. P. (2001),“A component model for the behavior
of steel joints at elevated temperatures”, J. of Const. Steel. Res., Vol. 57, 1169–1195. Eurocode 3, prEN-1993-1-8: 20. (2000). Design of steel structures, draft 2 rev., 6
December. Brussels: CEN, European Committee for Standardization. Faella, C., Piluso, V. and Rizzano, G. (2000), “Structural Steel Semi-Rigid Connections”,
Theory, Design and Software, CRC Press LLC. FEMA. (2000a), FEMA-356, rehabilitation of buildings, prepared by ASCE for federal
Emergency Management Agency (Prepared by ASCE). FEMA, Washington, DC. FEMA. (2000b), FEMA-350,recommended seismic design criteria for new steel moment
frame buildings (prepared by SAC joint venture). FEMA, Washington, DC. Ghassemieh, M., and Bahadori, A.R. (2015), “Seismic evaluation of steel moment frames
with end plate moment connection considering connection flexibility by component method”, 1th Int Conf of Steel and Struc., Tehran, Iran, 25-26 February.
Ghassemieh, M., Baei, M., Goudarzi, A. Kari, A. and Laefer, D.F. (2014), “Adopting flexibility of the end-plate connections in steel moment frames”, Int. J. of Steel and Comp. Struc., Vol. 18(5), 1215-1237.
Ghassemieh, M., and Kiani, J. (2013), “Seismic evaluation of reduced beam section frames considering connection flexibility”, the Struc. Des. of Tall and Special Buildings., Vol. 21(1), 15-37.
Karimi, S. (2013). Modeling of component deterioration in steel moment frames using I beam connections to box column, A thesis submitted to the Graduate Studies Office in partial fulfillment of the requirements for degree of M.Sc. in Structural Engineering, University of Tehran.
Lima,L.R.O., Da Silva, L.S., da S Vellasco, P.C.G., and de Andrade, S.A.L. (2002). “Exprimental evaluation of extended endplate beam-to-column joints”, Inte. J. of Mech. Sci., Vol. 44, 1047–1065.
Lui, E. M., and A. Lopes., (1997), “Dynamic Analysis and Response of Semirigid Frames.” Eng. Struc., Vol. 19 (8), 644–654.
Mazroi A., Simunian W., and Nik Khah M. (1999), “An empirical investigation of fixed rigid welded connections common in Iran”, report No. 305, BHRC Institute.
Mazzoni, S., McKenna, F. and Fenves, G.L. (2005). OpenSees command language manual. Pacific Earthquake Eng. Res. (PEER) Center.
McMullin, K. M., and Astaneh-Asl, A. (2003), “Seismic Behavior of Steel Semirigid Column-Tree Moment Resisting Frame.” J. of Struc. Eng., Vol. 129 (9): 1243–1249
Nader, M. N., and Astaneh-Asl, A. (1991), “Dynamic behavior of flexible, semi rigid and rigid steel frames.” J. of Const. Steel. Res.,Vol. 18 (3), 179–192.
Saneenia, Z., Ghassemieh M., and Mazroi A. (2013), “WUF-W connection performance to box column subjected to uniaxial and biaxial loading”, J. of Const. Steel. Res., Vol. 88, 90-108.
Structural Building code 10th (2008), Iranian Building Codes and Standards, Design and Construction of Steel Structures, 3rd Edition, Road, Housing and Urban Development Research Center, BHRC Publication, Iran.
Urbonas, K., and Daniūnas, A. (2005), “component method extension to steel beam to beam and beam to column knee joints under bending and axial forces”, J. of Civil Eng. Mang., Vol 11(3), 217-224.
Vanvatsikos, D.,Cornell, C.A. (2002), “Incremental Dynamic Analysis”, J. Earthquake Eng. Struct.Dyn., Vol. 31(3), 491-514.