select graphics that support learning graphics to teach ... · on the x-axis and probability of...
TRANSCRIPT

C H A P T E R O U T L I N E
Do Visuals Make a Difference?
Multimedia Principle: Include Both Words and Graphics
Select Graphics That Support Learning
Some Ways to Use Graphics to Promote Learning
Graphics to Teach Content Types
Graphics as Topic Organizers
Graphics to Show Relationships
Graphics as Lesson Interfaces
Psychological Reasons for the Multimedia Principle
Evidence for Using Words and Pictures
The Multimedia Principle Works Best for Novices
Should You Change Static Illustrations into Animations?
Ch004.indd 66Ch004.indd 66 6/18/11 1:28:28 PM6/18/11 1:28:28 PM

6 7
W H AT ’ S N E W I N T H I S C H A P T E R ?
IN THE SECOND EDITION of this book we summarized evidence
for learning gains that result from combining text and relevant graphics in
e-lessons. In the past few years we see growing consensus for the multime-
dia principle as one of the most recognized principles of learning (Halpern,
Graesser, & Hackel, 2007; Pashler, Bain, Bottage, Graesser, Koedinger,
McDaniel, & Metcalfe, 2007). This chapter provides updated evidence and
support for the multimedia principle and explores its boundary conditions.
In particular, we provide evidence concerning (1) whether the multimedia
principle depends on the experience level of the learners and (2) whether the
multimedia principle depends on whether the graphics are static (illustrations
or photos) or dynamic (animations or video). Another addition to this chapter
involves a look at whether people learn better when graphic organizers are
added to text.
4Applying the Multimedia PrincipleU S E W O R D S A N D G R A P H I C S R AT H E R
T H A N W O R D S A L O N E
Ch004.indd 67Ch004.indd 67 6/18/11 1:28:28 PM6/18/11 1:28:28 PM

e - Le a r n i n g a n d t h e S c i e n c e o f I n s t r u c t i o n6 8
D E S I G N D I L E M M A : Y O U D E C I D E
The new VP of corporate learning and performance is anxious to get started with
the company’s new e-learning initiative. She wants to show results quickly to offset
upper management’s impression that e-learning development is so slow that by
the time it’s released, it’s already out of date. She has committed to an asynchro-
nous course on Excel for Small Business to be ready in the next month. “After all”,
she says to Matt, the project lead, “We already have the content from our current
instructor-led course. Let’s quickly put it into e-learning!”
Ben, the project programmer, works quickly converting the classroom lecture
notes into HTML. He proudly shows the team his fi rst-draft storyboards, such as
the one shown in Figure 4.1.
Figure 4.1. A Screen from Ben’s First Draft of the Excel Course.
Reshmi, one of the course designers, reacts negatively: “Hey Ben, it’s great that
you got a draft together quickly since we don’t have much development time. But this
looks pretty boring to me! In e-learning the computer screen is our main connection
Ch004.indd 68Ch004.indd 68 6/18/11 1:28:29 PM6/18/11 1:28:29 PM

C h a p t e r 4 : A p p l y i n g t h e M u l t i m e d i a Pr i n c i p l e 6 9
Do Visuals Make a Difference?
In training, it is customary to use words—either in printed or spoken form—
as the main vehicle for conveying information. Words are quick and inexpen-
sive to produce. The question is whether there is any return on investment
for supplementing words with pictures—either static graphics such as draw-
ings or photos, or dynamic graphics such as animation or video. In particular, do
people learn more deeply from words and graphics than from words alone?
This is the issue we want to explore with you in this chapter.
with the students and screens fi lled with text will turn them off right away. We
need this fi rst project to be engaging. We need to add graphics and animations!”
“Yeah,” Ben replies. “Graphics are great but we don’t have a graphic artist so,
other than some screen grabs, I’ll have to download some clip art.” “Clip art is
cheesy,” Reshmi replies. “Let’s contract an artist to create some custom Flash
animations for us so we can really show what e-learning can do”. Matt, the project
manager, jumps in: “It will take time to get a contract set up and get the artist up
to speed—time we don’t have. Let’s just start simple on this fi rst project by going
with mostly text with some screen grabs and one or two pieces of clip art here and
there to add interest. We can try for a graphic artist on future projects. After all,
basically our goal is to explain how small businesses can use Excel, and we can do
that effectively with words.” Based on your own experience or intuition, which of the
following options is correct:
A. Matt is right. Learning will be just as effective from good textual explanations
as from text plus graphics.
B. Ben is right. Adding clip art to a few screens will make the lesson more interest-
ing. However, to save time, providing text alone will be as effective as adding
visuals.
C. Reshmi is right. Customized visuals, including animations to demonstrate how to
use Excel and to show how Excel works, will add appeal and improve learning.
D. Not sure which options are correct.
Ch004.indd 69Ch004.indd 69 6/18/11 1:28:29 PM6/18/11 1:28:29 PM

e - Le a r n i n g a n d t h e S c i e n c e o f I n s t r u c t i o n7 0
Multimedia Principle: Include Both Words
and Graphics
Based on cognitive theory and research evidence, we recommend that
e-learning courses include words and graphics rather than words alone. By
words, we mean printed text (that is, words printed on the screen that people
read) or spoken text (that is, words presented as speech that people listen to
through earphones or speakers). By graphics we mean static illustrations such
as drawings, charts, graphs, maps, or photos, and dynamic graphics such as
animation or video. We use the term multimedia presentation to refer to any
presentation that contains both words and graphics. For example, if you
are given an instructional message that is presented in words alone, such as
shown in Figure 4.1, we recommend you convert it into a multimedia pre-
sentation consisting of words and pictures, such as shown in Figure 4.2.
Figure 4.2. A Revision of Figure 4.1 with Visuals and Words.
Pictures should not be an afterthought. Instead of selecting pictures after
the words are written, instructional designers should consider how words and
pictures work together to create meaning for the learner. Therefore, visuals
Ch004.indd 70Ch004.indd 70 6/18/11 1:28:29 PM6/18/11 1:28:29 PM
C h a p t e r 4 : A p p l y i n g t h e M u l t i m e d i a Pr i n c i p l e 7 1
as well as words should be planned together as the job analysis is conducted
and the course is designed.
The rationale for our recommendation is that people are more likely to
understand material when they can engage in active learning—that is, when
they engage in relevant cognitive processing such as attending to the relevant
material in the lesson, mentally organizing the material into a coherent cogni-
tive representation, and mentally integrating the material with their existing
knowledge. Multimedia presentations can encourage learners to engage in
active learning by mentally representing the material in words and in pic-
tures and by mentally making connections between the pictorial and verbal
representations. In contrast, presenting words alone may encourage learners—
especially those with less experience or expertise—to engage in shallow learn-
ing such as not connecting the words with other knowledge.
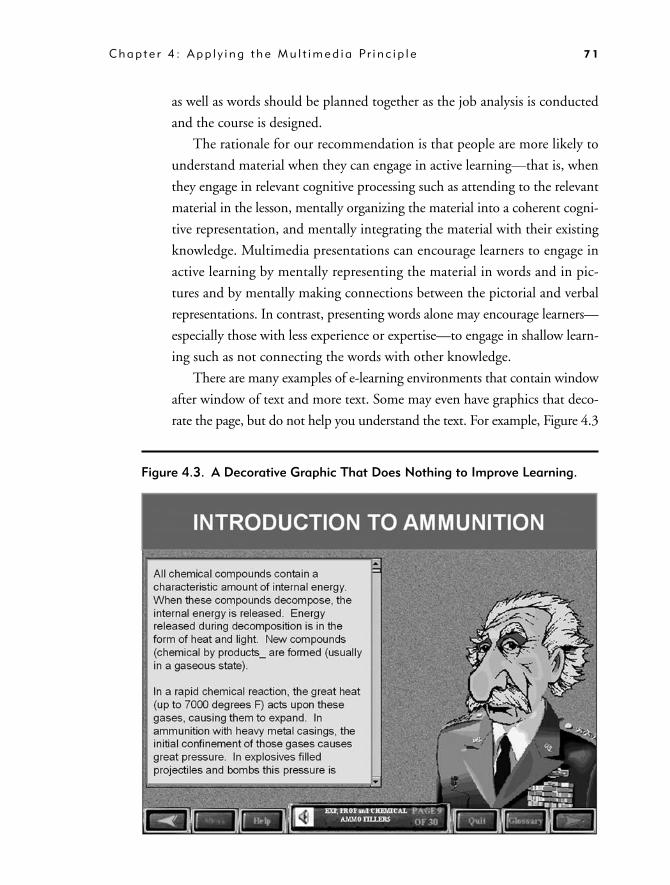
There are many examples of e-learning environments that contain window
after window of text and more text. Some may even have graphics that deco-
rate the page, but do not help you understand the text. For example, Figure 4.3
Figure 4.3. A Decorative Graphic That Does Nothing to Improve Learning.
Ch004.indd 71Ch004.indd 71 6/18/11 1:28:30 PM6/18/11 1:28:30 PM

e - Le a r n i n g a n d t h e S c i e n c e o f I n s t r u c t i o n7 2
from a military course on ammunition presents scrolling text and a picture of
a general as a decorative element. As you can see, the general graphic does not
support the text, but rather simply serves to decorate screen space.
Select Graphics That Support Learning
Instead of presenting words alone, we recommend presenting words and
graphics. However, not all kinds of graphics are equally helpful. For example,
let’s consider several possible functions of graphics:
1. Decorative graphics serve to decorate the page without enhancing the
message of the lesson, such as photo or a video of person riding a
bicycle in a lesson on how bicycle tire pumps work.
2. Representational graphics portray a single element, such as photo of
the bicycle tire pump along with a caption, “Bicycle Tire Pump.”
3. Relational graphics portray a quantitative relationship among two or more
variables, such as a line graph showing the relation between years of age
on the x-axis and probability of being in a bicycle accident on the y-axis.
4. Organizational graphics depict the relations among elements, such as a
diagram of a bicycle tire pump with each part labeled or a matrix giving
a defi nition and example of each of three different kinds of pumps.
5. Transformational graphics depict changes in an object over time,
such as a video showing how to fi x a fl at tire, or a series of anno-
tated frames showing stages of how a bicycle tire pump works.
6. Interpretive graphics illustrate invisible relationships such as an ani-
mation of the bicycle pump that includes small dots to show the
fl ow of air into and out of the pump.
Based on this analysis, we recommend that you minimize graphics that
decorate the page (decorative graphics) or simply represent a single object (rep-
resentational graphics), and that you incorporate graphics that help the learner
understand the material (transformational and interpretive graphics) or organize
the material (organizational graphics). For example, Table 4.1 is an organiza-
tional graphic that gives the name, defi nition, and example of six functions
of graphics in the form of a matrix. When the text describes a quantitative
Ch004.indd 72Ch004.indd 72 6/18/11 1:28:31 PM6/18/11 1:28:31 PM

C h a p t e r 4 : A p p l y i n g t h e M u l t i m e d i a Pr i n c i p l e 7 3
Table 4.1. An Organizational Graphic of Graphic Types.
Adapted from Clark and Lyons, 2011.
Graphic Type Description Examples
Decorative Visuals added for aesthetic appeal or for humor
1. The general in Figure 4.32. A person riding a bicycle in a lesson
on how a bicycle pump works3. Baseball-related icons as a game
theme in a lesson on product knowledge
Representational Visuals that illustrate the appearance of an object
1. The screen capture in Figure 4.22. A photograph of equipment in a
maintenance lesson
Organizational Visuals that show qualitative relationships among content
1. A matrix such as this table2. A concept map3. A tree diagram
Relational Visuals that summarize quantitative relationships
1. A bar graph or pie chart2. A map with circles of different sizes
representing location and strength of earthquakes
Transformational Visuals that illustrate changes in time or over space
1. An animated demonstration of a computer procedure
2. A video of how volcanoes erupt3. A time-lapse animation of seed
germination
Interpretive Visuals that make intangible phenomena visible and concrete
1. Drawings of molecular structures2. A series of diagrams with arrows
that illustrate the fl ow of blood through the heart
3. Pictures that show how data is transformed and transmitted through the Internet
Ch004.indd 73Ch004.indd 73 6/18/11 1:28:31 PM6/18/11 1:28:31 PM

e - Le a r n i n g a n d t h e S c i e n c e o f I n s t r u c t i o n7 4
relationship, then a relational graphic is warranted; and when the text describes
changes over time, then a transformational graphic is warranted.
In Chapter 2, we summarized the dual channels principle that learners
have separate channels for processing verbal material and pictorial material.
We see the job of an instructional professional as not just to present
information—such as presenting text that contains everything the learner
needs to know—but rather to leverage both channels in ways that enable the
learner to make sense out of the material.
In Chapter 1, we introduced the engagement matrix. Relevant visuals are
one powerful method to support psychological engagement in the absence
of behavioral activity. In other words, visuals are one instructional method
that falls into the upper left cell of the matrix shown in Figure 1.5. Providing
relevant graphics with text is a proven method of fostering deeper cognitive
processing in learners. In short, learning is facilitated when the graphics and
text work together to communicate the instructional message.
Some Ways to Use Graphics to Promote Learning
Helping you determine how to create the best types of graphics to meet your
instructional goals requires a book in itself. In fact, just such a book is Graphics for
Learning (2nd ed.) by Ruth Colvin Clark and Chopeta Lyons. Here we offer just a
few examples of the ways to use graphics that serve instructional rather than deco-
rative roles: to teach content types, as topic organizers, and as lesson interfaces.
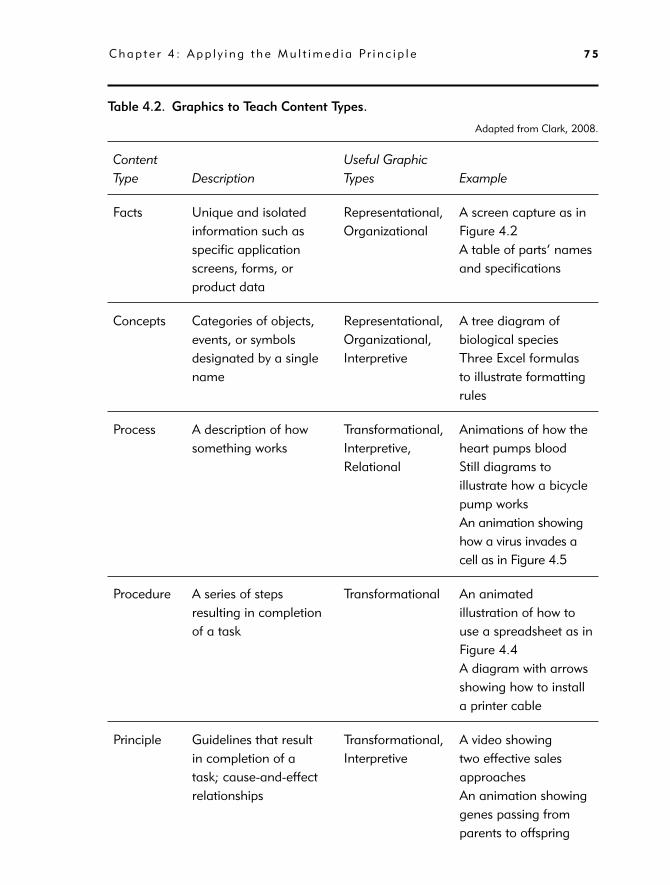
Graphics to Teach Content Types
Clark (2008) has identifi ed fi ve different kinds of content: fact, concept,
process, procedure, and principle. Table 4.2 briefl y describes each content
type and lists graphic types commonly used to teach specifi c lesson content
such as facts, concepts, processes, procedures, and principles.
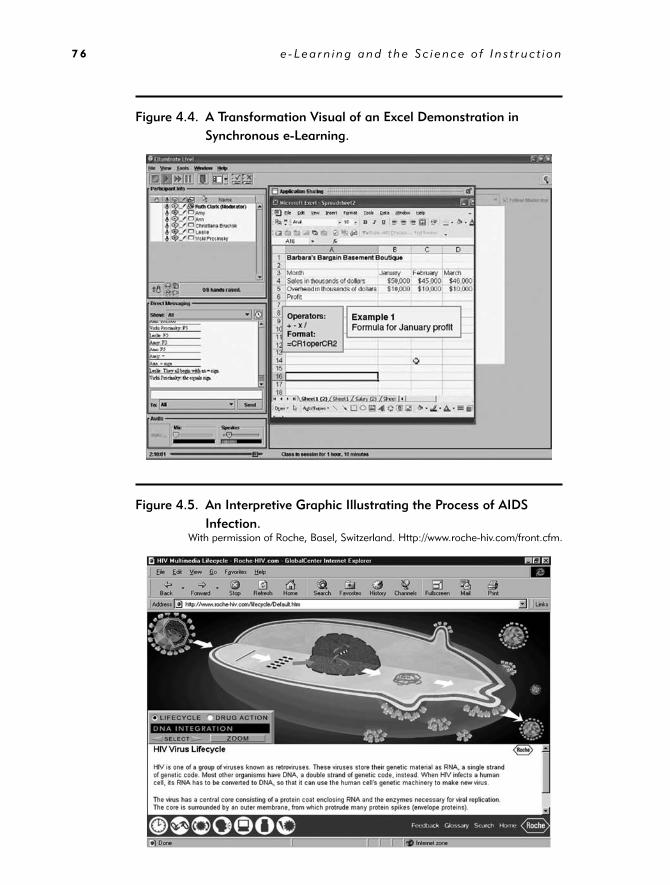
Since 63 percent of computer-systems training is delivered by e-learning
(ASTD, 2010), many e-learning graphics are screen captures. A screen
capture is a graphic that is a replication of an actual software screen.
For example, Figure 4.4 is a screen capture from a synchronous e-learning
class on Excel. At this point in the lesson, the instructor uses the application-
sharing feature of the virtual classroom to demonstrate how to use formulas
in Excel. Another content type that profi ts from graphic support is process. A
Ch004.indd 74Ch004.indd 74 6/18/11 1:28:31 PM6/18/11 1:28:31 PM
C h a p t e r 4 : A p p l y i n g t h e M u l t i m e d i a Pr i n c i p l e 7 5
Table 4.2. Graphics to Teach Content Types.
Adapted from Clark, 2008.
Content Type Description
Useful Graphic Types Example
Facts Unique and isolated information such as specifi c application screens, forms, or product data
Representational, Organizational
A screen capture as in Figure 4.2 A table of parts’ names and specifi cations
Concepts Categories of objects, events, or symbols designated by a single name
Representational, Organizational, Interpretive
A tree diagram of biological speciesThree Excel formulas to illustrate formatting rules
Process A description of how something works
Transformational, Interpretive, Relational
Animations of how the heart pumps bloodStill diagrams to illustrate how a bicycle pump worksAn animation showing how a virus invades a cell as in Figure 4.5
Procedure A series of steps resulting in completion of a task
Transformational An animated illustration of how to use a spreadsheet as in Figure 4.4A diagram with arrows showing how to install a printer cable
Principle Guidelines that result in completion of a task; cause-and-effect relationships
Transformational, Interpretive
A video showing two effective sales approachesAn animation showing genes passing from parents to offspring
Ch004.indd 75Ch004.indd 75 6/18/11 1:28:31 PM6/18/11 1:28:31 PM
e - Le a r n i n g a n d t h e S c i e n c e o f I n s t r u c t i o n7 6
Figure 4.4. A Transformation Visual of an Excel Demonstration in
Synchronous e-Learning.
Figure 4.5. An Interpretive Graphic Illustrating the Process of AIDS
Infection.With permission of Roche, Basel, Switzerland. Http://www.roche-hiv.com/front.cfm.
Ch004.indd 76Ch004.indd 76 6/18/11 1:28:31 PM6/18/11 1:28:31 PM

C h a p t e r 4 : A p p l y i n g t h e M u l t i m e d i a Pr i n c i p l e 7 7
process is a step-by-step description of how a system works, including busi-
ness, scientifi c, and mechanical systems. Process information is effectively visu-
alized with a series of static frames or, in some cases, animations. Figure 4.5 is a
screen from an animated graphic showing how the AIDS virus infects cells.
Graphics as Topic Organizers
In addition to illustrating specifi c content types, graphics such as topic maps
can serve an organizational function by showing relationships among topics
in a lesson. For example, Figure 4.6 shows a screen with a series of coach-
ing topics mapped in the left-hand bar, including where to coach, when to
coach, how long to coach, and so on. When the mouse is placed over each
of the topics in the graphic organizer, a different illustration appears on the
right side of the screen. In this example, the topic of formal and informal
coaching sessions is explained with text and photographs.
Figure 4.6. An Organizational Graphic on Coaching Topics.
Ch004.indd 77Ch004.indd 77 6/18/11 1:28:33 PM6/18/11 1:28:33 PM

e - Le a r n i n g a n d t h e S c i e n c e o f I n s t r u c t i o n7 8
Graphics to Show Relationships
Graphics in the form of dynamic and static graphs can make invisible phenom-
ena visible and show relationships. Imagine an e-learning lesson to teach fast-
food workers safe cooking and food-handling practices. An animated line graph
with numbers on the vertical axis and time on the horizontal axis illustrates
changes in bacterial growth in food cooked at different temperatures or handled
in safe and unsafe ways. The lesson includes an interactive simulation in which
the learner adjusts the cooking temperature and sees the impact on a dynamic
line graph called a “germ meter.” As another example, a geographic map can
illustrate population density by adding a small red dot to represent fi ve thousand
individuals. If made interactive, the map could include a slider bar that accessed
different time periods allowing the viewer to see population shifts over time.
Graphics as Lesson Interfaces
Finally, courses designed using a guided discovery approach often use a
graphical interface as a backdrop to present case studies. For example, in
Figure 1.6 we showed an interface for a troubleshooting course for automo-
tive technicians. The virtual shop includes most of the testing tools available
in a normal shop, allowing the learner to run and interpret tests to diagnose
and repair an automotive failure.
Psychological Reasons for the Multimedia Principle
Perhaps the single greatest human invention is language, and the single great-
est modifi cation of this invention is printed language. Words allow us to com-
municate effectively, and printed words allow us to communicate effectively
across miles and years. (So does recorded speech, by the way, which is yet
another modifi cation of the great invention of language.) Therefore, it makes
sense to use words when we provide training or instruction. For thousands of
years, the main format for education has been words—fi rst in spoken form
and more recently in printed form (and recorded form). Words are also the
most effi cient and effective way of producing e-learning because words can
convey a lot of information and are easier to produce than graphics.
This line of thinking is based on the information acquisition view
in which teaching consists of presenting information and learning consists of
Ch004.indd 78Ch004.indd 78 6/18/11 1:28:33 PM6/18/11 1:28:33 PM
C h a p t e r 4 : A p p l y i n g t h e M u l t i m e d i a Pr i n c i p l e 7 9
acquiring information, as summarized in the middle of Table 2.1. Information
can be delivered in many forms—such as printed words, spoken words, illus-
trations, photos, graphs, animation, video, and narration. Over the years, it
has become clear that words are an effi cient and effective method for present-
ing information, so based on this view, in most situations instruction should
involve simply presenting words. According to the information acquisition
view, the format of the information (for example, words versus pictures) does
not matter, as long as the information is delivered to the learner.
In our opinion, the information acquisition view is based on an inad-
equate conception of how people learn. Instead, we favor a knowledge con-
struction view in which learning is seen as a process of active sense-making
and teaching is seen as an attempt to foster appropriate cognitive process-
ing in the learner, as summarized in the bottom of Table 2.1. According to
this learning metaphor, it is not good enough to deliver information to the
learner; instructors must also guide the learner’s cognitive processing during
learning, thereby enabling and encouraging learners to actively process the
information. An important part of active processing is to mentally construct
pictorial and verbal representations of the material and to mentally connect
them. This goal is more likely to be achieved with multimedia lessons con-
taining both words and corresponding pictures that work together to explain
the same to-be-learned content. Adding relevant graphics to words can be a
powerful way to help learners engage in active learning. Overall, your view of
the cognitive stages of how learning works (as summarized in Table 2.1) can
infl uence your decisions about how to design instruction (Mayer, 2003).
Evidence for Using Words and Pictures
There is consistent evidence that people learn more deeply from words and
pictures than from words alone, at least for some simple instructional situa-
tions. In eleven different studies, researchers compared the test performance
of students who learned from animation and narration versus narration alone
or from text and illustrations versus text alone (Mayer, 1989b; Mayer &
Anderson, 1991, 1992; Mayer, Bove, Bryman, Mars, & Tapangco, 1996;
Mayer & Gallini, 1990; Moreno & Mayer, 1999b, 2002b). The lessons
taught scientifi c and mechanical processes, including how lightning works,
Ch004.indd 79Ch004.indd 79 6/18/11 1:28:33 PM6/18/11 1:28:33 PM
e - Le a r n i n g a n d t h e S c i e n c e o f I n s t r u c t i o n8 0
how a car’s braking system works, how pumps work, and how electrical gen-
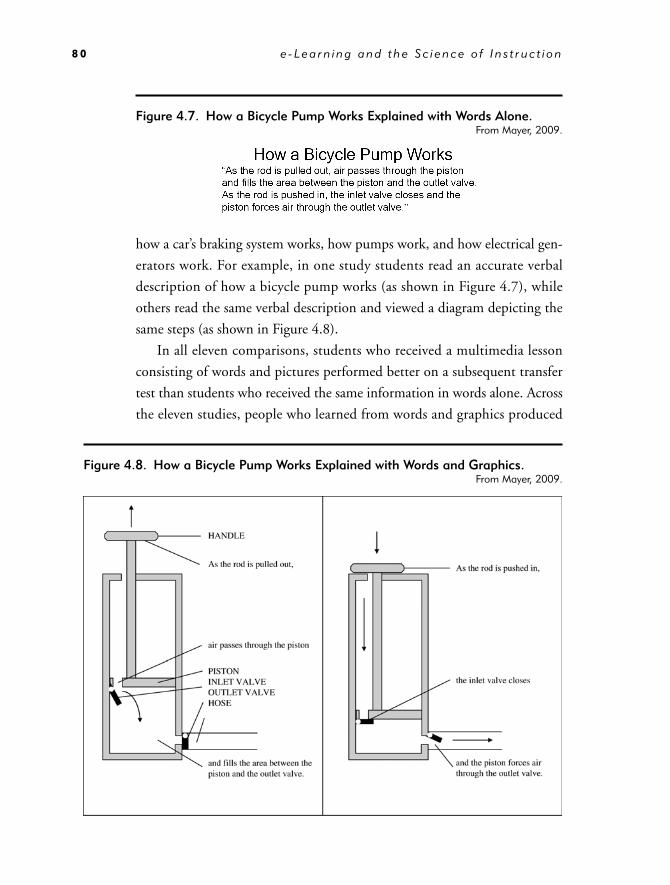
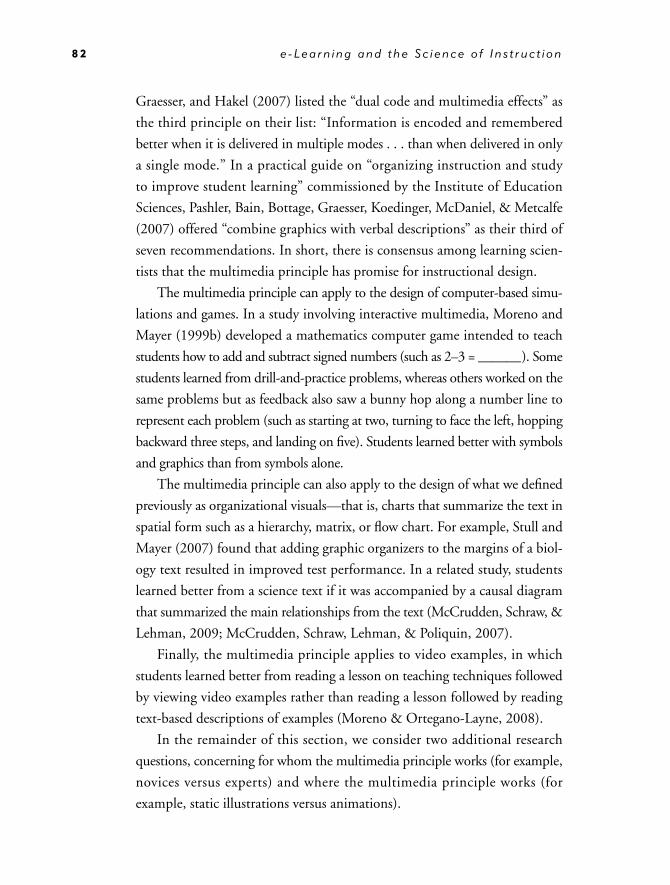
erators work. For example, in one study students read an accurate verbal
description of how a bicycle pump works (as shown in Figure 4.7), while
others read the same verbal description and viewed a diagram depicting the
same steps (as shown in Figure 4.8).
In all eleven comparisons, students who received a multimedia lesson
consisting of words and pictures performed better on a subsequent transfer
test than students who received the same information in words alone. Across
the eleven studies, people who learned from words and graphics produced
Figure 4.7. How a Bicycle Pump Works Explained with Words Alone.From Mayer, 2009.
Figure 4.8. How a Bicycle Pump Works Explained with Words and Graphics.From Mayer, 2009.
Ch004.indd 80Ch004.indd 80 6/18/11 1:28:33 PM6/18/11 1:28:33 PM

C h a p t e r 4 : A p p l y i n g t h e M u l t i m e d i a Pr i n c i p l e 8 1
between 55 percent to 121 percent more correct solutions to transfer prob-
lems than people who learned from words alone. Across all studies, a median
percentage gain of 89 percent was achieved with a median effect size of 1.50.
Recall from our discussion in Chapter 3 that effect sizes over .8 are consid-
ered large. Figure 4.9 shows a result from one of these experiments. Similarly,
Butcher (2006) found that people developed a deeper understanding of how the
human heart works from text with simple illustrations than from text alone.
We call this fi nding the multimedia effect—people learn more deeply
from words and graphics than from words alone. In a recent review, Fletcher
and Tobias (2005, p. 128) concluded: “The multimedia principle, which
suggests that learning and understanding are enhanced by adding pictures to
text rather than presenting text alone, appears to be well supported by fi nd-
ings from empirical research.” The multimedia effect is the starting point for
our discussion of best instructional methods for e-learning because it estab-
lishes the potential for multimedia lessons to improve human learning.
In recent years, the multimedia principle has been recognized as one
of the most well-established principles of learning that can be applied to
education. For example, in their review of twenty-fi ve “principles of learn-
ing” commissioned by the Association of Psychological Science, Halpern,
Figure 4.9. Learning Is Better from Words Plus Graphics Than from
Words Alone.Adapted from Mayer, 2001a.
Ch004.indd 81Ch004.indd 81 6/18/11 1:28:34 PM6/18/11 1:28:34 PM
e - Le a r n i n g a n d t h e S c i e n c e o f I n s t r u c t i o n8 2
Graesser, and Hakel (2007) listed the “dual code and multimedia effects” as
the third principle on their list: “Information is encoded and remembered
better when it is delivered in multiple modes . . . than when delivered in only
a single mode.” In a practical guide on “organizing instruction and study
to improve student learning” commissioned by the Institute of Education
Sciences, Pashler, Bain, Bottage, Graesser, Koedinger, McDaniel, & Metcalfe
(2007) offered “combine graphics with verbal descriptions” as their third of
seven recommendations. In short, there is consensus among learning scien-
tists that the multimedia principle has promise for instructional design.
The multimedia principle can apply to the design of computer-based simu-
lations and games. In a study involving interactive multimedia, Moreno and
Mayer (1999b) developed a mathematics computer game intended to teach
students how to add and subtract signed numbers (such as 2–3 = ———). Some
students learned from drill-and-practice problems, whereas others worked on the
same problems but as feedback also saw a bunny hop along a number line to
represent each problem (such as starting at two, turning to face the left, hopping
backward three steps, and landing on fi ve). Students learned better with symbols
and graphics than from symbols alone.
The multimedia principle can also apply to the design of what we defi ned
previously as organizational visuals—that is, charts that summarize the text in
spatial form such as a hierarchy, matrix, or fl ow chart. For example, Stull and
Mayer (2007) found that adding graphic organizers to the margins of a biol-
ogy text resulted in improved test performance. In a related study, students
learned better from a science text if it was accompanied by a causal diagram
that summarized the main relationships from the text (McCrudden, Schraw, &
Lehman, 2009; McCrudden, Schraw, Lehman, & Poliquin, 2007).
Finally, the multimedia principle applies to video examples, in which
students learned better from reading a lesson on teaching techniques followed
by viewing video examples rather than reading a lesson followed by reading
text-based descriptions of examples (Moreno & Ortegano-Layne, 2008).
In the remainder of this section, we consider two additional research
questions, concerning for whom the multimedia principle works (for example,
novices versus experts) and where the multimedia principle works (for
example, static illustrations versus animations).
Ch004.indd 82Ch004.indd 82 6/18/11 1:28:34 PM6/18/11 1:28:34 PM
C h a p t e r 4 : A p p l y i n g t h e M u l t i m e d i a Pr i n c i p l e 8 3
The Multimedia Principle Works Best for Novices
Does the multimedia principle apply equally to all learners? There is evi-
dence that our recommendation to use words and graphics is particularly
important for learners who have low knowledge of the domain (whom
we can call novices) rather than learners who have high knowledge of the
domain (whom we can call experts). For example, in a series of three exper-
iments involving lessons on brakes, pumps, and generators, Mayer and
Gallini (1990) reported that novices learned better from text and illustra-
tions (such as shown in Figure 4.8) than from words alone (such as shown
in Figure 4.7), but experts learned equally well from both conditions.
Apparently, the more experienced learners are able to create their own
mental images as they read the text about how the pump works, whereas
the less experienced learners need help in relating the text to a useful picto-
rial representation.
In a related study, Ollerenshaw, Aidman, and Kidd (1997) presented
text lessons on how pumps work to learners who had low or high knowledge
of the domain. Low-knowledge learners benefi ted greatly when animation
was added to the text, whereas high-knowledge learners did not. These and
related results (Kalyuga, Chandler, & Sweller, 1998, 2000; Mayer & Gallini,
1990; Ollerenshaw, Aidman, & Kidd, 1997) led Kalyuga and colleagues
(Kalyuga, 2005; Kalyuga, Ayres, Chandler, & Sweller 2003) to propose
the expertise reversal effect—the idea that instructional supports that help
low-knowledge learners may not help (and may even hurt) high-knowledge
learners. Overall, we recommend that you be sensitive to the level of prior
knowledge of your learners so that you can provide needed supports—such
as multimedia instruction—to low-knowledge learners. If you are work-
ing on a course for a less advanced group of learners—beginning trainees,
for example—you should be especially careful to supplement text-based
instruction with coordinated graphics. If you have a more advanced group
of learners, such as medical residents or engineers experienced in the topic
you are presenting, they may be able to learn well mainly from text or even
mainly from graphics.
Ch004.indd 83Ch004.indd 83 6/18/11 1:28:34 PM6/18/11 1:28:34 PM
e - Le a r n i n g a n d t h e S c i e n c e o f I n s t r u c t i o n8 4
Should You Change Static Illustrations
into Animations?
If it is important to add graphics to words, is it better to use animations
or to use static illustrations? Flash animations are currently very popular
additions to many e-learning lessons. At fi rst glance, you might think that
animations are best because they are an active medium, which can depict
changes and movement. Similarly, you might think that static illustrations
are a poorer choice because they are a passive medium, which cannot depict
changes and movement in as much detail as animations can. In spite of these
impressions, a number of research studies have failed to fi nd that animations
are more effective than a series of static frames depicting the same material
(Betrancourt, 2005; Hegarty, Kriz, & Cate, 2003; Mayer, Hegarty, Mayer, &
Campbell, 2005; Tversky, Morrison, & Betrancourt, 2002).
Let’s consider two ways to use multimedia to explain how lightning
storms develop—a paper-based lesson of a series of static illustrations with
printed text (as shown in Figure 4.10) or a computer-based lesson of nar-
rated animations in which the words are spoken and the transitions between
frames are animated. On a transfer test, students in the paper group per-
formed 32 percent better than students in the computer group, yielding an
effect size of .55 (Mayer, Hegarty, Mayer, & Campbell, 2005). In four such
comparisons—involving lessons on lightning, ocean waves, hydraulic brakes,
and toilet tanks—the illustrations-and-text group always performed better
than the animation-and-narration group, yielding a median effect size of .57.
Presumably, the so-called passive medium of illustrations and text actually
allowed for active processing because the learners had to mentally animate
the changes from one frame to the next and learners were able to control the
order and pace of their processing. In contrast, the so-called active medium
of animations and narration may foster passive learning because the learner
did not have to mentally animate and could not control the pace and order of
the presentation. In addition, animation may overload the learner’s working
memory because the images are so rich in detail and are so transitory that they
must be held in memory. In contrast, a series of static frames does not impose
extra cognitive load because the learner can always review a previous frame.
Ch004.indd 84Ch004.indd 84 6/18/11 1:28:34 PM6/18/11 1:28:34 PM

C h a p t e r 4 : A p p l y i n g t h e M u l t i m e d i a Pr i n c i p l e 8 5
Figure 4.10. A Series of Static Visuals to Teach How Lightning Forms.From Mayer, Hegarty, Mayer, and Campbell, 2005.
Ch004.indd 85Ch004.indd 85 6/18/11 1:28:34 PM6/18/11 1:28:34 PM

e - Le a r n i n g a n d t h e S c i e n c e o f I n s t r u c t i o n8 6
In spite of these results, there may be some content that is particularly
suited to animation or video rather than static frames of illustrations or pho-
tos, such as descriptions of how to perform a motor skill. There is some evi-
dence that animations (or video) may be particularly helpful for tasks that
require complicated manual skills. For example, animation was more effective
than static diagrams in helping students learn to make paper fl owers and hats
through paper folding (ChanLin, 1998; Wong, Marcus, Ayres, Smith, Cooper,
Paas, & Sweller, 2009) and in helping students learn to tie knots and com-
plete puzzle rings (Ayres, Marcus, Chan, & Qian, 2009). In contrast, studies
in which static diagrams are better or just as effective as animations tend to
involve explanations of how a complex system works, such as a braking system
or how ocean waves work. In other words, it appears that static visuals might
be most effective to promote understanding of processes, whereas animated
visuals may be more effective to teach hands-on procedures.
Additionally, animations can serve an interpretive function when
designed with special effects that reveal relationships not otherwise visible.
Hegarty (2004) suggests that “dynamic displays can distort reality in
various ways such as slowing down some processes and speeding up others,
showing an object or phenomenon from different or changing viewpoints,
augmenting the display with cues to draw viewers’ attention to the most rel-
evant parts, or having moving objects leave a trace or wake” (p. 345). A time-
lapse video of seed germination or a slow-motion video of hummingbirds in
fl ight are two examples of how special effects can make phenomena visible.
Animations can cost more to develop than static diagrams, so it makes sense
to use a series of static frames as our default graphic. Overall, our recommen-
dation is to use static illustrations unless there is a compelling instructional
rationale for animation. In particular, when you have an explanative illustration,
we recommend presenting a series of static frames to depict the various states
of the system rather than a lock-step animation.
What We Don’t Know About Visuals
We have good evidence that relevant visuals promote learning. Now it’s time to
fi nd out more about what types of visuals are most effective for different learners
and instructional goals. Some of the unresolved issues around graphics include:
Ch004.indd 86Ch004.indd 86 6/18/11 1:28:35 PM6/18/11 1:28:35 PM
C h a p t e r 4 : A p p l y i n g t h e M u l t i m e d i a Pr i n c i p l e 8 7
1. When is an animation more effective than a static graphic?
2. What are the long-term effects of graphics? Most of our research data
measures learning immediately after taking the lesson. We need more
information on the effectiveness of visuals for longer term learning.
3. What is the return on investment of graphics? Explanatory visuals
can be time-consuming to produce and require an investment in
graphic design resources. What are the cost benefi ts for creating cus-
tomized visuals to illustrate technical content?
D E S I G N D I L E M M A : R E S O L V E D
In our chapter introduction, you considered the following options for use of graphics in
the database course:
A. Matt is right. Learning will be just as effective from good textual explanations
as from text plus graphics.
B. Ben is right. Adding clip art to a few screens will make the lesson more interesting.
However, to save time, providing text alone will be as effective as adding visuals.
C. Reshmi is right. Customized visuals including screen shot animation demonstrations
to illustrate the content will add appeal and improve learning.
D. Not sure which options are correct.
Based on the evidence we presented in this chapter, we conclude that Reshmi is
on the right track. e-Learning is a visual medium and relevant graphics will add appeal
and improve learning. The lesson segments that involve Excel procedures might benefi t
from animated demonstrations. However, lesson sections that explain Excel concepts
and processes will benefi t as much from static graphics. Ben’s idea to add decorative
graphics in the form of clip art will most likely not contribute to learning and in fact, as
we will see in Chapter 8 on the coherence principle, may even detract from learning.
We recommend that the team use an authoring system to capture animated screen
procedures and engage a graphic designer to create a few simple but functional
visuals to support the lesson concepts—including visuals that serve organizational,
transformational, and interpretive functions. Even if a few extra days are required, the
improvement in instructional quality and appeal is worth the investment.
Ch004.indd 87Ch004.indd 87 6/18/11 1:28:35 PM6/18/11 1:28:35 PM

e - Le a r n i n g a n d t h e S c i e n c e o f I n s t r u c t i o n8 8
W H A T T O L O O K F O R I N e - L E A R N I N G
Graphics and text are used to present instructional content.
Graphics are relevant to the instructional purpose rather than decorative.
Representative graphics are used to illustrate concrete facts, concepts, and
their parts.
Animations are used primarily to illustrate hands-on procedures.
Organizational graphics are used to show relationships among ideas or lesson
topics or where the parts are located within a whole structure.
Relational graphics are used to show quantitative relationships among
variables.
Transformational graphics, such as a video showing how to operate equipment,
are used to show changes over time.
Interpretive graphics, such as a series of static frames, are used to explain how
a system works or to make invisible phenomena visible.
Graphics are used as a lesson interface for case studies.
�
�
�
�
�
�
�
�
�
C O M I N G N E X T
In this chapter we have seen that learning is improved by the use of relevant
graphics combined with words to present instructional content. In the next
chapter, we will build upon this principle by examining the contiguity principle
that addresses the best ways to position graphics and related text on the screen.
Suggested Readings
Butcher, K.R. (2006). Learning from text with diagrams: Promoting mental
model development and inference generation. Journal of Educational
Psychology, 98, 182–197.
Clark, R.C., & Lyons, C. (2011). Graphics for learning (2nd ed.) San
Francisco: Pfeiffer.
Ch004.indd 88Ch004.indd 88 6/18/11 1:28:35 PM6/18/11 1:28:35 PM
C h a p t e r 4 : A p p l y i n g t h e M u l t i m e d i a Pr i n c i p l e 8 9
Fletcher, J.D., & Tobias, S. (2005). The multimedia principle. In R.E. Mayer
(Ed.), The Cambridge handbook of multimedia learning (pp. 117–134).
New York: Cambridge University Press.
Mayer, R.E. (1989b). Systematic thinking fostered by illustrations in scientifi c
text. Journal of Educational Psychology, 81, 240–246.
Mayer, R.E., & Anderson, R.B. (1992). The instructive animation: Helping
students build connections between words and pictures in multimedia
learning. Journal of Educational Psychology, 84, 444–452.
Mayer, R.E., & Anderson, R.B. (1991). Animations need narrations: An
experimental test of a dual-processing system in working memory. Journal
of Educational Psychology, 90, 312–320.
Mayer, R.E., & Gallini, J.K. (1990). When is an illustration worth ten thousand
words? Journal of Educational Psychology, 88, 64–73.
Mayer, R.E., Hegarty, M., Mayer, S., & Campbell, J. (2005). When static
media promote active learning: Annotated illustrations versus narrated
animations in multimedia instruction. Journal of Experimental Psychology:
Applied, 11, 256–265.
Robinson, D.H. (2002). Spatial text adjuncts and learning. Educational
Psychology Review, 14(1).
Ch004.indd 89Ch004.indd 89 6/18/11 1:28:35 PM6/18/11 1:28:35 PM