september 2015s21.q4cdn.com/.../dorianlpg_deck_september.pdf · end 2013 end 2014 end 2015 end 2016...
TRANSCRIPT
September 2015

1
Disclaimer
Forward-Looking Statements
This Presentation contains certain forward-looking statements relating to the business, future financial performance and results of the Company and/or the
industry in which it operates. In particular, this Presentation contains forward-looking statements such as those with respect to cost of construction of the
Company’s newbuildings and timing of their delivery, values of the assets of the Company and the potential future revenue and EBITDA these assets may
yield under current or future contracts, the potential future revenues and cash flows of the Company, the potential future demand and market for the
Company’s assets and the Company’s equity and debt financing requirements and its ability to obtain financing in a timely manner and at favorable terms.
Forward-looking statements concern future circumstances and results and other statements that are not historical facts, sometimes identified by the words
“believes”, “expects”, “predicts”, “intends”, “projects”, “plans”, “estimates”, “aims”, “foresees”, “anticipates”, “targets”, and similar expressions. The
forward-looking statements contained in this Presentation, including assumptions, opinions and views of the Company or cited from third party sources, are
solely opinions and forecasts which are subject to risks, uncertainties and other factors that may cause actual events to differ materially from any
anticipated development. Potential investors are expressly advised that financial projections, such as the revenue and cash flow projections contained
herein, cannot be used as reliable indicators of future revenues or cash flows. Neither the Company, nor any of their parent or subsidiary undertakings or
any such person’s officers or employees provides any assurance that the assumptions underlying such forward-looking statements are free from errors nor
does any of them accept any responsibility for the future accuracy of the opinions expressed in this Presentation or the actual occurrence of the forecasted
developments. No obligation is assumed to update any forward-looking statements or to conform these forward-looking statements to our actual results.

2
13
21 22
Current Fleet End 2015 Feb-16
Investment HighlightsLargest ECO VLGC fleet, VLGCs represent
critical link in the LPG supply chain
Fleet3 Modern VLGCs, 10 ECO VLGCs,
1 pressurized LPG carrier
9 ECO VLGCs (Delivering Q4’15 – Q1’16)
ManagementFully Integrated, In-house
Commercial & Technical management
Chartering strategyBalanced mix of time charters and spot
exposure, targeting high quality
counterparties
Key Counterparties
Global presenceStamford, CT (Headquarters), London, UK
and Athens, Greece
Entry into LPG 2002
Overview:
VLGC Vessel Count
Average Age (Years)
+8
+1
End of 2014 End of 2015
3.6
1.6
3
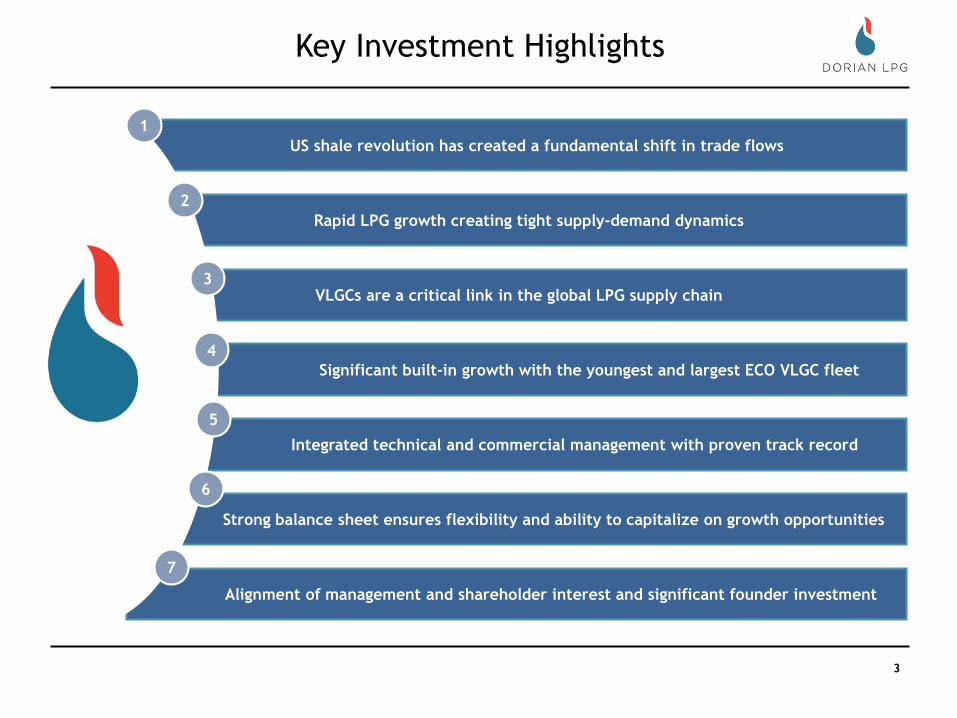
Key Investment Highlights
US shale revolution has created a fundamental shift in trade flows
Rapid LPG growth creating tight supply-demand dynamics
VLGCs are a critical link in the global LPG supply chain
Significant built-in growth with the youngest and largest ECO VLGC fleet
Strong balance sheet ensures flexibility and ability to capitalize on growth opportunities
Integrated technical and commercial management with proven track record
Alignment of management and shareholder interest and significant founder investment
1
2
3
4
5
6
7

4
Dorian (Hellas), S.A. of Greece was established in 1973,
representing the shipping interests of principals with more
than a century of shipping experience
Entered the LPG market in 2002 through the acquisition of
two pressurized vessels followed by four additional
acquisitions over the following 18 months
Expanded into the VLGC segment by commissioning three
newbuildings that were delivered from 2006-2008
Our founders and management have collectively invested
in excess of US$70m in Dorian LPG since its inception
Dorian LPG is the only US headquartered major VLGC
owner (Stamford, CT), giving it proximity to major US LPG
exporters
Significant market presence with 22 Modern VLGCs
and targeting further consolidation
Overview Timeline
Source: Dorian LPG
The Evolution of Dorian LPG
July 2013: Ordered 3
ECO VLGCs at HHI
2011: Dorian wins
Statoil’s Working
Safely with Suppliers
Award for ‘Best
Shipping Supplier’
2002-2003: Dorian
Hellas S.A. Acquires
first pressurized LPG
carriers
2005-2006:
Placed order for
4xVLGCs at HHI,
Korea
November 2013:
Acquired 13 VLGC
NBs from STNG
February 2014:
Exercised option for
3 additional VLGCs
May 2014:
Successful IPO on
the NYSE
July 2014: Delivery of
First NB VLGC
“Comet” at HHI
London, UK
Offices
Headquarters
Stamford, USA
Athens, Greece
Aug 2015:
Board Authorizes stock
buyback of up to
$100MM
10 VLGC NBs
Delivered to date.
March 2015:
Completion of debt
financing for NBs

5
VLGCs are a Critical Link in the Global Supply Chain
ProductionLPG (Propane and Butane) is a by-product
of oil and gas
ShippingVLGCs are the most cost effective
means of long haul LPG transportation
End UseBroad range of end uses for LPG
Oil production and refining (~40%)
Gas production (~60%)
VLGCs
Cooking /
Heating
Autogas
Chemical
Industrial
Other
Refinery
Source: Poten & PartnersR
eta
il m
ark
et
60%
Bulk
mark
et
40%
The most cost effective means of long haul LPG transportation

6
Global LPG Supply Surging
LPG Volumes traded continuing to grow:
Source: ICIS China, IHS
U.S. set to be the world’s single largest LPG
exporting nation
Competitive Pricing:
linked to NGL supply demand dynamics not oil
Excess U.S. supply targeted towards export markets
U.S average monthly liftings
rising rapidly
0
10,000,000
20,000,000
30,000,000
40,000,000
50,000,000
60,000,000
70,000,000
80,000,000
90,000,000
100,000,000
2012 2013 2014 LTM
Global Seaborne LPG Volumes
Jan Feb Annual (Q4 2014)

7
U.S. Taking Market Share
Source: IHS
Global LPG Export Volumes by Region
8
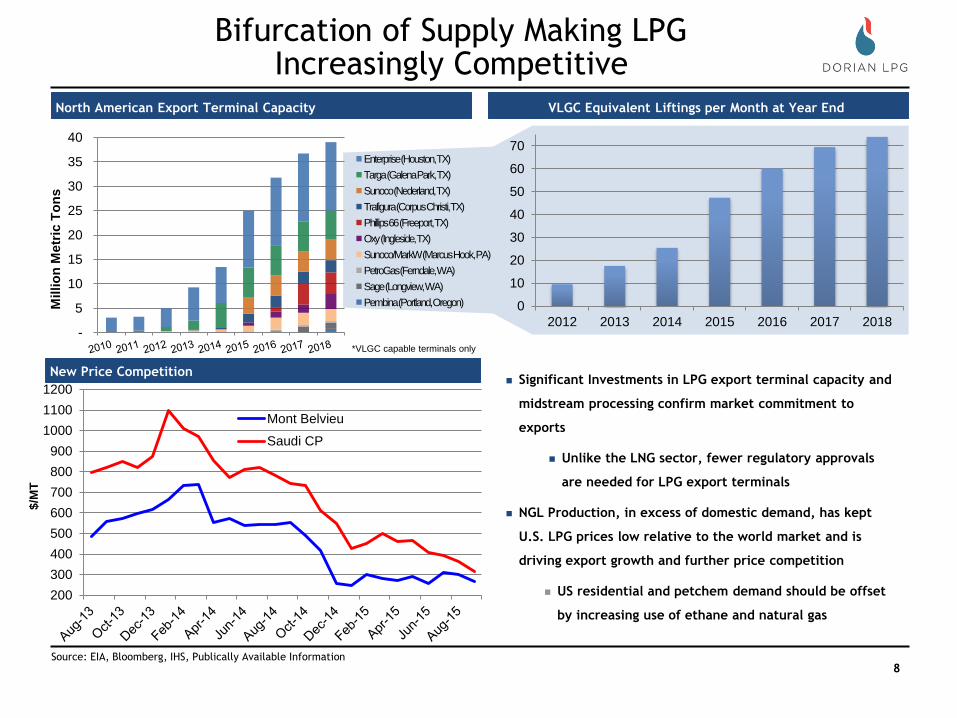
Bifurcation of Supply Making LPGIncreasingly Competitive
Source: EIA, Bloomberg, IHS, Publically Available Information
North American Export Terminal Capacity
*VLGC capable terminals only
New Price Competition Significant Investments in LPG export terminal capacity and
midstream processing confirm market commitment to
exports
Unlike the LNG sector, fewer regulatory approvals
are needed for LPG export terminals
NGL Production, in excess of domestic demand, has kept
U.S. LPG prices low relative to the world market and is
driving export growth and further price competition
US residential and petchem demand should be offset
by increasing use of ethane and natural gas
VLGC Equivalent Liftings per Month at Year End
$/M
T
200
300
400
500
600
700
800
900
1000
1100
1200
Mont Belvieu
Saudi CP
-
5
10
15
20
25
30
35
40
Millio
n M
etr
ic T
on
s
Enterprise (Houston, TX)
Targa (Galena Park, TX)
Sunoco (Nederland, TX)
Trafigura (Corpus Christi, TX)
Phillips 66 (Freeport, TX)
Oxy (Ingleside, TX)
Sunoco/MarkW (Marcus Hook, PA)
PetroGas (Ferndale, WA)
Sage (Longview, WA)
Pembina (Portland, Oregon) 0
10
20
30
40
50
60
70
2012 2013 2014 2015 2016 2017 2018

9
Surge in Chinese PDH adds to Global Demand
Note: Propylene production capacity to VLGC Equivalents of Propane demand: 1 tonne of propylene requires 1.18 tonnes of propane; 1 VLGC equivalent is 44,000
tonnes of propane
Source: ICIS, Poten & Partners
16
56
102
137
155
235
0
2,000
4,000
6,000
8,000
10,000
12,000
0
50
100
150
200
250
End 2013 End 2014 End 2015 End 2016 End 2017 AllPlanned
New Cumulative Chinese PDH Propane Feedstock
New Cumulative Chinese PDH Propylene Production
Propylene
Capacity (000 tonnes)
VLGC
Equivalents
Commenced & Planned Chinese PDH Projects Propane Feedstock Required
PDH importers require high purity propane, best sourced
from the US or Middle East
It is estimated that total new propane demand from
Chinese PDH plants in 2015 will be about 2 million tonnes
China is expected to reduce its reliance on imported
polypropylene, which currently accounts for
approximately 30% of its demand
There are currently four Chinese PDH plants in
operation
Sinopec, Tianjin Bohai, Oriental Energy, Fujain Meide,
and Shaoxing Sanyuan Petrochemical have all signed
long term supply contracts for US LPG
Project
Polypropylene
production
kt/year
Operational Main Application
Tianjin Bohai 600 OperatingPropylene derivative,
Acrylic acid etc.
Ningbo Haiyue 600 OperatingPropylene derivative,
Acrylic acid etc.
Satellite Petchem 450 Operating Polypropylene
Sanyuan Petchem
(JV O.E.)
450Operating
Propylene derivative,
Acrylic acid etc.
Yangtze Petchem 600 July, 2015Propylene derivative,
Acrylic acid etc.
Wanhua Petchem 600Expected
End 2015Polypropylene
Hebei Haiwei 500Expected
2016Polypropylene
Meide Petchem 660Expected
2016Polypropylene
Ningbo Fortune
(O.E.)660
Beyond
2016Polypropylene
Tianjin Bohai 2nd 600 2017 Polypropylene

10
10
Growing Markets for LPG
US Virgin Islands
South Africa
India
China
Thailand
Indonesia
Turkey
BrazilEast Africa

11
Key Factors Favoring LPG Adoption for
Power Generation and Retail Consumption
By-product of
natural gas and
oil production
Source: ExceptionalEnergy.com
Economic Environmental
Low cost Infrastructure
Easy to set up distribution
Price competitive
Newly bifurcated supply dynamics
By-product of oil and nat gas production
Favorable Emission
Autogas -most accepted alternative fuel
20% less CO2 than heating oil
50% less CO2 than coal
Avoids harmful and dangerous waste
LPG should be the fuel of choice for emerging economies

12
The Future: Virgin Islands Conversion Project with Vitol
Vitol is leading the transformation of the
power sector in the US Virgin Islands
Upon completion of the $91mm project,
Virgin Island power consumers can expect
savings of up to 30%
Current Residential prices: 39cents/KW hour
vs 51cents in Sep. 2014
By July, both St. Thomas and St Croix will
derive 100% of their electricity needs from
propane
Green house gas emissions slated to decline
20%
St Croix Conversion
St Thomas Conversion
- VLGCS will deliver
the cargo and
perform STS to
pressure vessels
every 3 days (w/ two
designated pressure
vessels) for
discharge at the
small berth

13
China
Seaborne LPG imports into China tallied 7,993,199 MT in 2014, up from 3,980,283 MT in 2013
While this was primarily due to PDH plant start ups, there are opportunities for further expansion in Power Gen and Retail.
Retail growth is very dependent on government policy. China’s Clean Air Action Plan has 2017 target – could see new projects
China’s residential / commercial demand has been climbing in tandem with their initiative to displace solid biofuels in rural areas
LPG Demand for Power Gen could increase as ‘post-crash’ LPG prices threaten LNG
Sources : http://www.chinagasholdings.com.hk/siteen/xmgli/index.html
General Administration of Customs and the National Bureau of Statistics.
Retail & Power Generation
Consolidation Ex: China Gas Holdings acquired retail competitor and LPG trader: Panva Gas in 2013 The group has 8 LPG terminals with
over 300,000m3 storage and 98 LPG distribution projects covering 10 different provinces

14
Seaborne LPG imports to India were up 142% in 2014, from 5,857,859 to 8,324,550.
2013-2014: Total demand growth for LPG in India increased abt. 18.5%
2010-2014: Government has proactively pushed population away from traditional heating/cooking methods by subsidizing LPG
2014: The cap on subsidized cylinders per household was lifted from 9 to 12
Demand expected to increase within residential and commercial sector
India
Source: Poten & Partners
Indian LPG Retail Demand

15
VLGC Day Rates at Healthy Levels
Baltic VLGC Rate:
Dayra
tein
USD
/day
Rapid increase in VLGC liftings from the USGC (Targa, Enterprise, P66)
Increasing arbitrage movements West to East resulting in higher tonne-mile demand
Demand from India, China, and SEA absorbing incremental LPG tonnage
Key Drivers of Rate Strength
-
20,000
40,000
60,000
80,000
100,000
120,000
140,000
160,000
TCE/day
6M Trailing Average
3Yr Trailing Average

16
Fleet Built at World Class Korean Shipyards
Source: Clarksons
VLGC Newbuild Deliveries by Shipyard 2006-2016
LPG vessels are highly engineered, and exacting technical specifications determine commercial
acceptance
HHI and DSME also design and build some of the world’s most complex offshore vessels and rigs
Dorian has built 17 vessels at HHI since 2004 and maintains a strong relationship
*
60%
7%
7%
13%
13%
HHI is the most active and
experienced yard in the
design and construction of
gas carriers
17
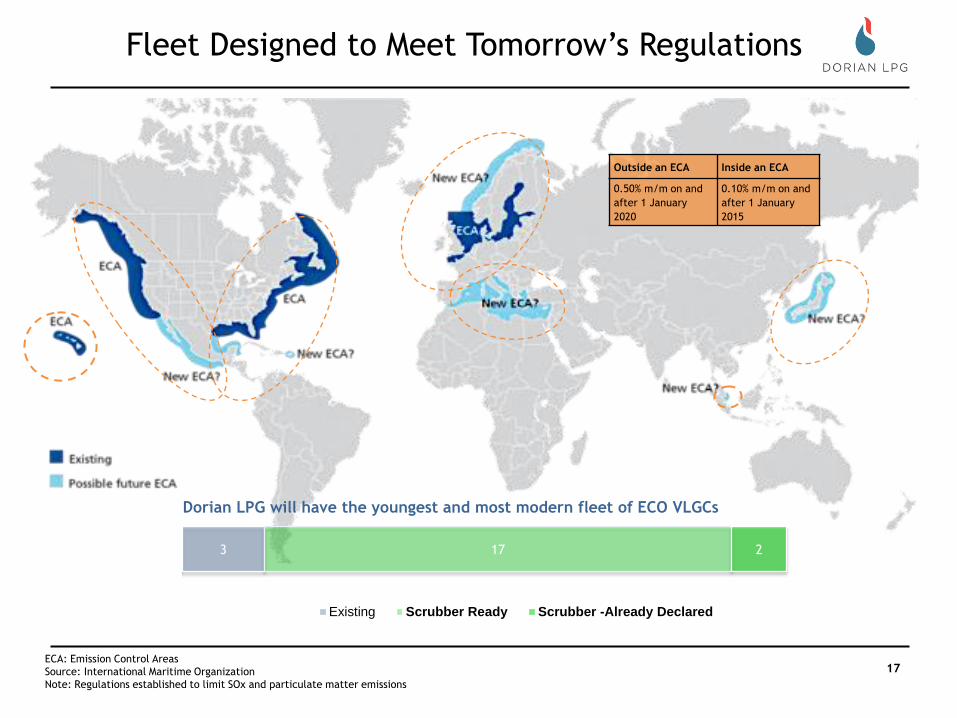
Fleet Designed to Meet Tomorrow’s Regulations
ECA: Emission Control Areas
Source: International Maritime Organization
Note: Regulations established to limit SOx and particulate matter emissions
3 17 2
Existing Scrubber Ready Scrubber -Already Declared
Dorian LPG will have the youngest and most modern fleet of ECO VLGCs
Outside an ECA Inside an ECA
0.50% m/m on and
after 1 January
2020
0.10% m/m on and
after 1 January
2015

18
44.046.1
36.538.4
25
30
35
40
45
50
55
ECO-Vessels Represent Significant Additional Earnings Potential
Source: Hyundai Heavy Industries (HHI), MAN B&W, FT Maritime Services, Company, Managers
¹ Fuel saving assuming loaded condition at 16 knots and Fuel price at USD 450/MT for HFO (Basis AG-East round trip voyage, including port days)
Heavy Fuel Oil (HFO)Marine Gas Oil (MGO)
Average daily fuel savings of >$3,0001
Optimized Hull Design
Optimized Hull Design
Babcock’s New LGE Cooling Plant
Greater Re-liquefaction Efficiency
Ethane in LPG Mix: 8% vs. 2.5%
Cargo Combinations: 16 vs. 8
Cooling Capability: -52º vs. -48ºC
Traditional VLGC
Dorian ME-G type NB (ECO)
-17%
MAN B&W’s New G-Type Engine
Electronic Engine Control
De-rated, Long Stroke Design
Improved Propeller Design
Low Friction, Self Polishing Paint
-17%
Fuel Oil Consumption Analysis
Scrubber /
Scrubber Ready

19
Major Oil Companies Require Experienced Operators
Integrated, LPG Company with all Commercial/Technical
services in-house. Meets requirements of the most
demanding Oil Majors
Dedicated, Independent department on HSSEQ (Health,
Safety, Security, Environment and Quality)
Doubling up crews on VLGCs in order to meet officer
matrix requirements for future NB deliveries
Creating new training department under HSSEQ focused
solely on Dorian SMS familiarization for new crew
US presence provides proximity to US based Oil Majors
and traders and easy access to US export terminals
Awarded by Statoil to Dorian for outstanding
service and performance and steadfast
commitment to HSE over 30 other shipping
service providers
Working Safely
with Suppliers Award

20
2014 2015 2016
Current Fleet: ShipyardSister Delivery /
Open1H’14 2H’14 1H’15 2H’15 1H’16 2H'16
Vessels
Captain Nicholas ML A -
Captain John NP A -
Captain Markos NL A Q3’19
Grendon - -
Comet B Q2’19
Corsair B Q2’18
Corvette B -
Cougar B Q2’15
Concorde B Q2’15
Cobra B Q2’16
Continental B Q3’15
Constitution B Q3’15
Commodore B Q3’15
Cresques C Q3’15
Newbuildings:
Constellation B Q3’15
Cheyenne B Q4’15
Cratis B Q4’15
Clermont B Q4’15
Chaparral C Q4’15
Commander C Q4’15
Copernicus B Q4’15
Challenger B Q1’16
Caravelle B Q1’16
Dorian LPG Fleet Overview
Overview of Vessel EmploymentOverview of Chartering Strategy
4 R Customers & Shareholders:
Return on Capital:
Mix of long term and
spot charters
Regular Employment:
Fleet utilization
Risk Management:
Strong counterparties
Responsive:
To customers and the
market
Statoil
Shell, Q3 2014 – Q2 2019
Statoil Shell, Q4 2014 – Q4 2019
Legend
Past charters
Spot Market
Delivery date
Current charters
Petrobras
Exxon Mobil, Q3 2015 – Q3 2018
Shell, Q2 2015 – Q2 2016*
*Cobra 12 Month TC to Shell is through the Helios LPG Pool

21
21
Alliance with HNA Group of China
Enhances Dorian LPG’s access to and knowledge of the Chinese LPG market and
customers
Pool with Phoenix Tankers Ltd., one of the foremost VLGC operators in Asia
Expands the Company’s global presence and strengthen its position in the increasingly important Eastern LPG market including India
Increases overall fleet utilization
Strategic Business Development Initiatives
22
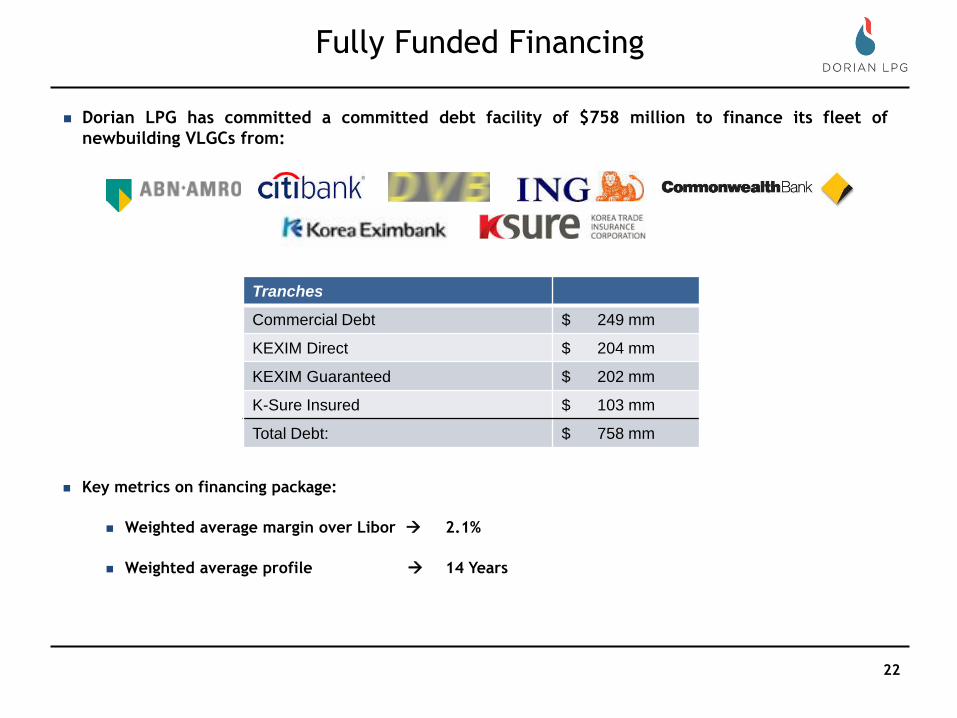
Fully Funded Financing
Dorian LPG has committed a committed debt facility of $758 million to finance its fleet of
newbuilding VLGCs from:
Key metrics on financing package:
Weighted average margin over Libor 2.1%
Weighted average profile 14 Years
Tranches
Commercial Debt $ 249 mm
KEXIM Direct $ 204 mm
KEXIM Guaranteed $ 202 mm
K-Sure Insured $ 103 mm
Total Debt: $ 758 mm
23
Fleet of 22 VLGCs with 19 ECO newbuilds contracted for delivery 2015–
February 2016
Expect to have opportunities to increase exposure through: pooling
arrangements, further vessel acquisitions and strategic partnerships with
major oil companies and traders
Time chartering strategy creates opportunity for shareholders to realize
more value through potential MLP-style monetizations
Strong, moderately leveraged balance sheet and stable earnings create
opportunities to fund growth or pay dividends
Board authorized $100 MM stock buyback program
Multiple Pillars for Creating Shareholder Value

24
Key Investment Highlights
US shale revolution has created a fundamental shift in trade flows
Rapid LPG growth creating tight supply-demand dynamics
VLGCs are a critical link in the global LPG supply chain
Significant built-in growth with the youngest and largest ECO VLGC fleet
Strong balance sheet ensures flexibility and ability to capitalize on growth opportunities
Integrated technical and commercial management with proven track record
Alignment of management and shareholder interest and significant founder investment
1
2
3
4
5
6
7
25
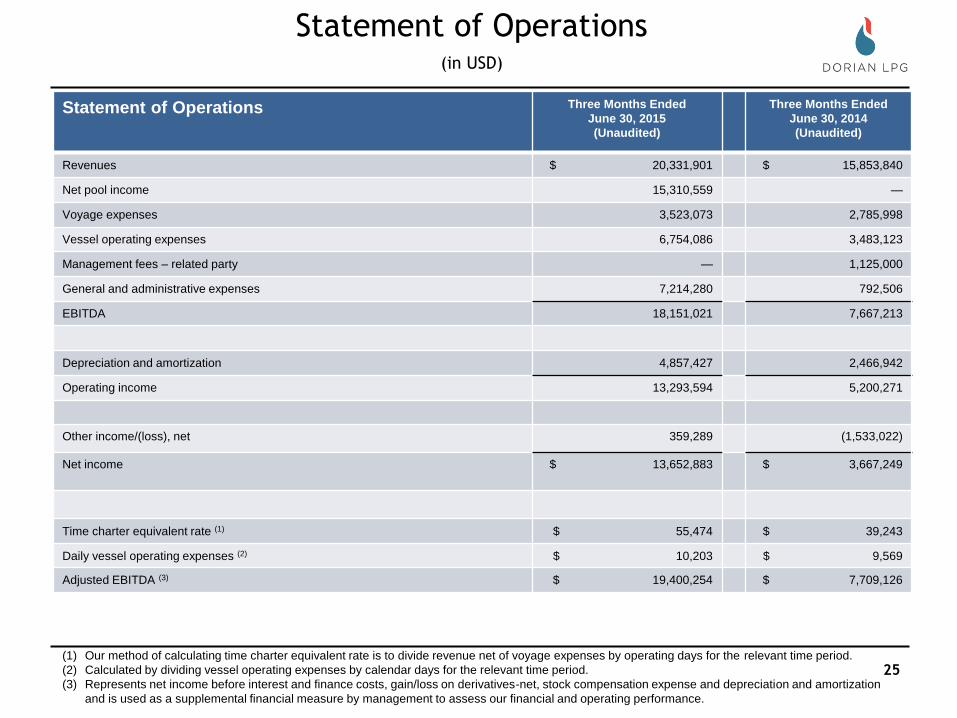
Statement of Operations(in USD)
Statement of Operations Three Months Ended
June 30, 2015
(Unaudited)
Three Months Ended
June 30, 2014
(Unaudited)
Revenues $ 20,331,901 $ 15,853,840
Net pool income 15,310,559 —
Voyage expenses 3,523,073 2,785,998
Vessel operating expenses 6,754,086 3,483,123
Management fees – related party — 1,125,000
General and administrative expenses 7,214,280 792,506
EBITDA 18,151,021 7,667,213
Depreciation and amortization 4,857,427 2,466,942
Operating income 13,293,594 5,200,271
Other income/(loss), net 359,289 (1,533,022)
Net income $ 13,652,883 $ 3,667,249
Time charter equivalent rate (1) $ 55,474 $ 39,243
Daily vessel operating expenses (2) $ 10,203 $ 9,569
Adjusted EBITDA (3) $ 19,400,254 $ 7,709,126
(1) Our method of calculating time charter equivalent rate is to divide revenue net of voyage expenses by operating days for the relevant time period.
(2) Calculated by dividing vessel operating expenses by calendar days for the relevant time period.
(3) Represents net income before interest and finance costs, gain/loss on derivatives-net, stock compensation expense and depreciation and amortization
and is used as a supplemental financial measure by management to assess our financial and operating performance.

26
Balance Sheet and Cash Flows(in USD)
Balance Sheet June 30, 2015
(Unaudited)
March 31, 2015
(Audited)
Cash and cash equivalents $ 134,715,783 $ 204,821,183
Restricted cash, non-current 36,512,789 33,210,000
Total assets 1,240,826,724 1,099,101,270
Current portion of long-term debt 25,325,629 15,677,553
Long-term debt – net of current portion 299,577,256 184,665,874
Total liabilities 353,063,043 225,887,011
Total shareholders' equity $ 887,763,681 $ 873,214,259
Cash Flows Three Months Ended
June 30, 2015
(Unaudited)
Three Months Ended
June 30, 2014
(Unaudited)
Net income $ 13,652,883 $ 3,667,249
Adjustments 4,611,152 2,907,009
Changes in operating assets and liabilities (1,371,228) (3,094,348)
Net cash provided by operating activities 16,892,807 3,479,910
Net cash used in investing activities (207,434,058) (61,272,300)
Net cash provided by financing activities 120,341,194 153,930,747
Effects of exchange rates on cash and cash equivalents 94,657 (120,830)
Net (decrease)/increase in cash and cash equivalents $ (70,105,400) $ 96,017,527

27
www.dorianlpg.com