series issn: 1932-3166 dimitriu a, b, see… in 3d
TRANSCRIPT

Series ISSN: 1932-3166
DIM
ITR
IUA
, B, S
EE
… IN
3D
MO
RG
AN
& C
LAY
PO
OLw w w . m o r g a n c l a y p o o l . c o m
A, B, See… in 3D
Dan G. Dimitriu, PhD, P.E.
A, B, See… in 3DA Workbook to Improve 3-D Visualization Skills
The workbook provides over 100 3D visualization exercises challenging the student to create three dimensions from two. It is a powerful and effective way to help engi-neering and architecture educators teach spatial visualization. Most of the 3-D visual-ization exercises currently being used by students in Design and Graphics classes pres-ent the objects in isometric views already in 3-D, asking the viewer to create multiple views, fold patterns, manipulate, reflect, or rotate them. The exercises presenting the objects in incomplete multiview projections asking the students to add missing lines use mostly real 3D objects that are more easily recognizable to help the student cor-relate 2D with 3D.
This workbook uses a different approach. Each view of the solid represents a letter of the alphabet. The letters are by definition 2D representations and when they are com-bined to create a 3D object, visualizing it becomes quite a challenge.
This workbook is intended for Engineering, Architecture, and Art students and faculty that want to increase their 3-D visualization skills
A Workbook to Improve 3-D Visualization Skills
Dan G. Dimitriu, PhD, P.E., Professor, San Antonio College
ISBN: 978-1-62705-818-6
9 781627 058186
9 0 0 0 0

A,B,See… in 3DA Workbook to Improve 3-D Visualization Skills
Dan G. Dimitriu, PhD, P.E. San Antonio College

Copyright © 2015 by Morgan & Claypool
All rights reserved. No part of this publication may be reproduced, stored in a retrieval system, or transmitted in any form or by any means—electronic, mechanical, photocopy, recording, or any other except for brief quotations in printed reviews, without the prior permission of the publisher.
A,B, See.... in 3D: A Workbook to Improve 3-D Visualization SkillsDan G. Dimitriu
www.morganclaypool.com
ISBN-13: 9781627058186 paperback
ISBN-13: 9781627058193 ebook
First Edition
10 9 8 7 6 5 4 3 2 1
Printed in the United States of America

Contents
Table of Content .............................................................................................................. 1Abstract ........................................................................................................................... 2Introduction .................................................................................................................... 3Methodology .....................................................................................................................List of Problems by Difficulty ......................................................................................... 10Alphabetical Listing by Letter Combinations ................................................................. 11Chapter 1 - Combination of Cubes (C) ............................................................................ 12
Level of difficulty: EasyChapter 2 - First Level (F) .............................................................................................. 25
Level of difficulty: LowChapter 3 - Second Level (S) .......................................................................................... 52
Level of difficulty: MediumChapter 4 - Third Level (T) ............................................................................................. 84
Level of difficulty: DifficultList of Problem Solutions by Chapter .............................................................................106
Chapter 1 (C) - Solutions ............................................................................................. 107Chapter 2 (F) - Solutions ............................................................................................. 111Chapter 3 (S) - Solutions ............................................................................................. 124Chapter 4 (T) - Solutions ............................................................................................. 137
Author Info ..................................................................................................................144
1

ABSTrACTThe workbook provides over 100 3D visualization exercises challenging the student to create three dimen-sions from two. It is a powerful and effective way to help engineering and architecture educators teach spatial visualization. Most of the 3-D visualization exercises currently being used by students in Design and Graphics classes present the objects in isometric views already in 3-D, asking the viewer to create multiple views, fold patterns, manipulate, reflect, or rotate them. The exercises presenting the objects in incomplete multiview projections asking the students to add missing lines use mostly real 3D objects that are more eas-ily recognizable to help the student correlate 2D with 3D.
This workbook uses a different approach. Each view of the solid represents a letter of the alphabet. The letters are by definition 2D representations and when they are combined to create a 3D object, visualizing it becomes quite a challenge.
This workbook is intended for Engineering, Architecture, and Art students and faculty that want to increase their 3-D visualization skills.
2
Introduction
There is ample evidence that instruction in spatial visualization skills is effective in improving outcomes for engineering students. Research conducted since the early 1990’s has proven that spatial visualization practice and training leads to better grades in engineering graphics and engineering coursework, and in the retention of underrepresented groups in the field.
In 1993 Dr. Sheryl Sorby (1998, 2006, 2009) of Michigan Technological University began work under and NSF grant to figure out why first-year women engineering students were more than three times as likely to fail the Purdue Spatial Visualization Test: Rotations (PSVT:R) as men, and what could be done about it. Sorby’s analysis of the results of the test and a background questionnaire she administered to test-takers showed that previous experience in design-related courses such as drafting, mechanical drawing, and art, as well as play as children with construction toys such as Legos, Lincoln Logs, and Erector Sets, predicted good performance on the PSVT:R. She and her colleagues then developed a three-credit hour spatial-visualization course and administered it to students who had failed the PSVT:R. The course covered topics such as cross sections of solids, sketching multiview drawings of simple objects, and paper folding to illus-trate 2-D to 3-D transformations. In the lab, students used solid-modeling computer-aided design (CAD) Software. Student’s tests scores on the PSVT:R improved from an average of 52% to an average of 82%. Work by Hsi, et al (1997) supported the effect of spatial strategies instruction on erasing gender differences and improving grades for engineering students.
Additional spatial visualization training was also discovered to positively affect retention in engineer-ing for women. Sorby found that among the women who initially failed the PSVT:R and took the spatial-visualization course between 1993 and 1998, 77% were retained in Engineering Design, compared to 48% of the women who didn’t take the course (Female n=251). In additional studies Sorby also found that middle school girls who took a spatial-visualization course took more advanced-level math and science courses in high school than did girls who did not take the course, and that the materials were shown to be effective in improving spatial skills for undergraduate students outside of engineering, and for students in high school.
After offering the three-hour spatial visualization course for six years (yielding improvements of 20 to 32 percentage points on the PSVT:R), Sorby condensed the course to a one-hour course and tested it be-tween 2000 and 2002, seeing average improvement on the PSVT:R of 26%. In 2003 Sorby, Beverly Baart-mans and Anne Wysocki, published a multimedia software-workbook package which contained content similar to the course Introduction to 3D Spatial Visualization, now used for engineering graphics education throughout the nation.
At Penn State Erie, Dr. Kathy Holliday-Darr and Dr. Dawn Blasko (2009) conducted a one-credit-hour intervention with mechanical engineering technology and plastic engineering technology students who performed below criteria on the PSVT, the Mental Rotation Test (MRT, and paper-folding and water-level tasks. They used the Sorby and Wysocki multimedia package and found significant improvement compared to an untreated control group. The improvement was correlated with grades in other courses and scores on spatial tasks correlated with overall GPA and key courses taken in the following semester and year.
3

At Virginia State University, a Historically Black College or University (HBCU), retention of minori-ties in STEM-related majors tended to be lower than their non-minority peers, and students enrolled in introductory engineering graphics courses had significantly lower-than-average test scores on the PSVT. Dr. Nancy Study piloted changes to engineering graphics courses, including the use of sketching, blocks and multimedia, that resulted in improvement of students’ visualization abilities. Significantly higher GPAs were earned by students taking the enhanced pilot engineering graphics course, compared to a control group that did not take the enhanced course, and a higher percentage of students in the test group were retained both in an engineering or technology major and at the university even if they did change their major.
Uttal, Meadow and Newcombe, (2010) conducted a meta-analysis of 200 studies on improvement of spatial skills and found that the average effect size of improvement for students who receive extensive prac-tice on spatially-relevant skills, such as mentally rotating figures or disembodying, was .53 (equivalent to an intervention improving SAT scores by more than 50 points or IQ scores by more than 7.5 points). They also found that the effects of training endured over time, after practice interventions were completed.
Although the materials currently being used nationally are now assisting the new generations of en-gineering students to succeed, they do not challenge the student to create three dimensions from two. On today’s market there are some valuable tools with which engineering and architecture educators teach spatial visualization. Most of the 3-D visualization exercises currently being used for students in Design and Graphics classes present objects in isometric views already in 3-D, asking the viewer to create multiple views, fold patterns, manipulate, reflect, or rotate them. The materials presented in this workbook take a universally accepted 2-D flat pattern (a letter) and ask the viewer to mold it as part of a 3-D solid, in com-bination with two other flat-pattern letters from adjacent views.
This workbook is intended for Engineering, Architecture, and Art students and faculty that want to increase their 3-D visualization skills.
4

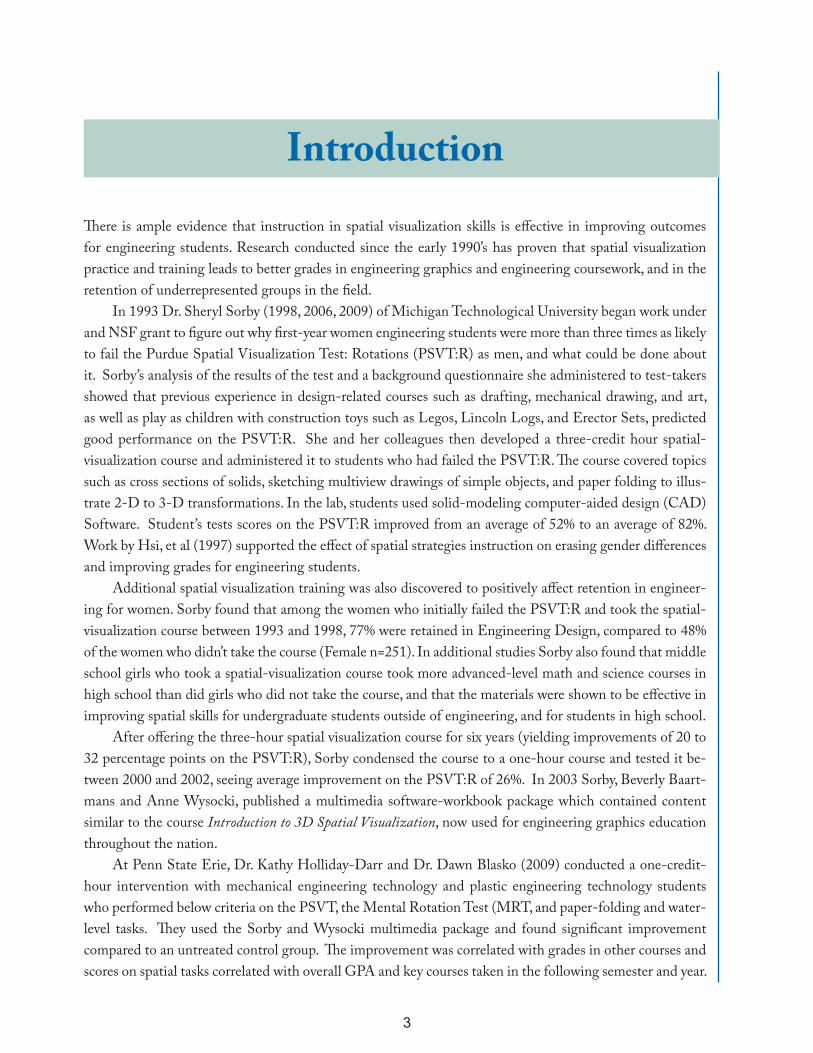
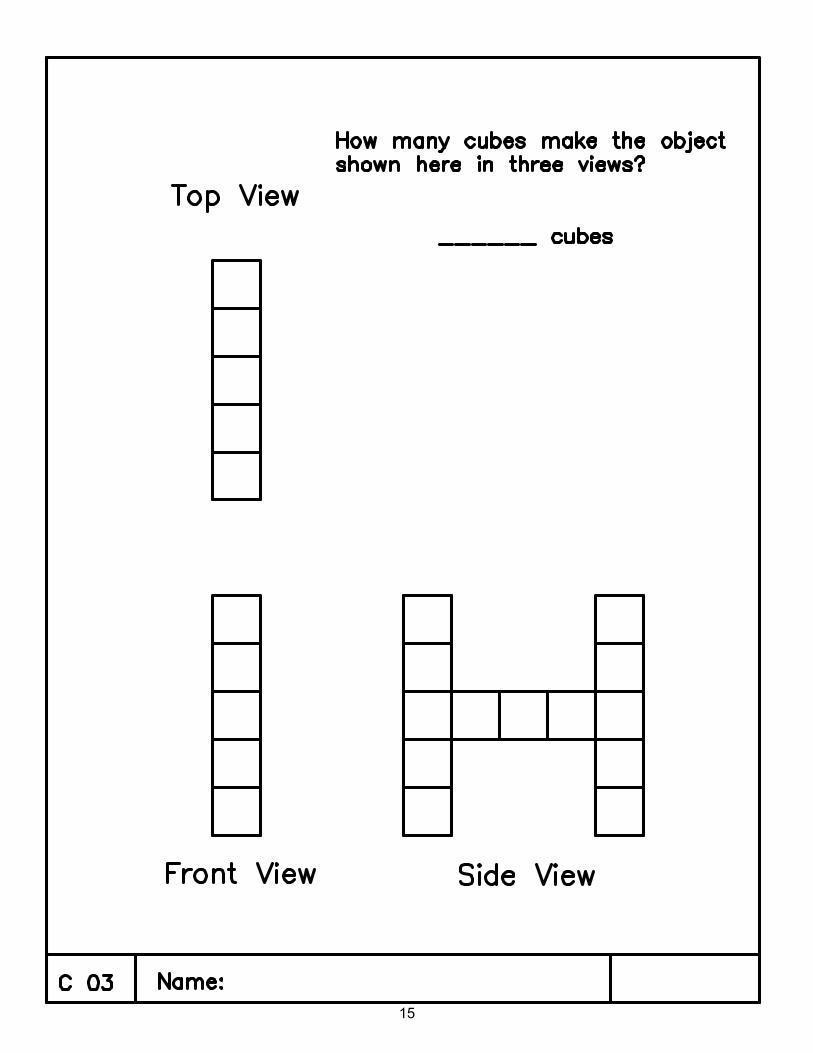
The exercises use alphabet letters represented in standard multiview projections (front, top, right, left, or bottom side views). The 3-D object made up of the three letters, one in each view, has to be mentally as-sembled in 3-D, with no assistance from an isometric representation of the solution figure. The problems ask the solver to break out of the 2-D image of the letter and visualize the third dimension, the depth, or “Z axis”, and combine with the other two letters from the other views of the 3-D object. The exercises are presented with increasing degrees of difficulty to help students improve their 3-D visualization skills. No other universally-recognized flat patterns are currently being used to enhance students’ ability to spatially visualize 3-D objects.
“A, B, See...” presents over 100 three-letter combinations many of them with multiple solutions and a brief instructional text on how to solve these exercises. The problems will build on the body of knowledge already developed in early stages of graphics core concepts such as:
• Alphabetoflines(visible,hidden,andcenterlines)• MultiviewOrthographicProjections• SurfaceandEdgeClassifications(Normal,Inclined,Oblique,andCurved)
The graphical problems are presented in order of increasing difficulty and they are designed to gradu-ally break students out of their 2-D preconceptions about 3-D space. The student must learn how to represent a variety of surfaces normal, inclined, oblique and cylindrical in multiple positions, visible and invisible, in edge view, true size and shape, or foreshortened in order to complete these assignments. No other universally-recognized flat patterns are currently being used to enhance students’ ability to spatially visualize 3-D objects.
Methodology
5

6
Figure 2
Figure 3
Figure 1
Solution: 9 cubes
How many cubes
make the solid
shown here in three
views?
_____ cubes
Solution: 13 cubes

7
Figure 4 Figure 5
See solutions for Figures 4 and 5 on page 9.
Solution

8
Because letters are universally known, they are images that can be kept in mind by the student
as they are mentally manipulated, rather than forcing the student to compare shapes on a page. Their
universality also allows students to draw them from memory and manipulate them mentally. They
can work on the assignments everywhere, at home, at lunch, or when they go for a walk in the park.
For this reason, the solutions for these exercises are also easy to compare with other students’
solutions and argue about. In addition, within the alphabet soup is a progression of easy-to-difficult
that gives students a sense of accomplishment as they advance through spatial skills levels. All
letters of the alphabet are present in this workbook and while just as challenging as isometric
workbook exercises, the letter-based problems appear more like puzzles, and therefore more like fun.
Procedure
The table of content has two configurations. The exercises are organized following the letter
combinations and by the level of difficulty. There are five letter combinations and four categories of
difficulty listed under four chapters. The first group of problems show straight letters that can be
made completely out of cubes and, with one exception, have only normal edges and surfaces. The
challenge is to determine the exact number of cubes needed to make the object despite the fact that a
cube might appear in more than one view. The last three problems have more than one solution and
the instructions ask for the minimum number of cubes required.
The second chapter “First Level” takes the cube problems and by eliminating the cubes
presents them as solids with straight faces without the cube partitions. Ten more combinations of
letters are defining new solids in this chapter. Beginning with this chapter, the problems ask the
solver to place the missing lines standing for visible and hidden edges and surfaces within the
confines of the contours to complete the views. It is suggested that each exercise should be limited
initially to the following cross sectional shapes:
The following chapters “Second Level” and “Third Level” are increasingly challenging, as the
solvers have to visualize letter parts that are not where they are appear to be from the 2D image.
Almost all the problems have multiple solutions as the letter parts can be visualized from rectangular
prisms, to triangular ones, or even cylindrical shapes as indicated above. At these advanced stages

9
students can experiment with other shapes as well such as a hexagon or a rhombus. The challenge is
to have the correct representation with visible, hidden, and centerlines in each view. The advantage
of all these exercises is that the solution can be easily verified for correctness by building a 3D model
in any 3D modeling package. The standard front, top, and side view projections of the model should
reveal all the necessary lines for verification.
Many times the students propose new solutions or start to look for new combination of
letters which is a challenge in itself because not all combinations of three letters can form a solid.
That is another way to improve the visualization abilities.
Imagination is the only limit!
Solutions for Figures 4 and 5:
Solution 1 Solution 2
Solution 3 Solution 1

List of Problems by Difficulty
Page #
12
25
52
84Chapter 4 - Third Level
Level of difficulty: Difficult
Chapter 1 - Combination of Cubes
Level of difficulty: Easy
Chapter 2 - First Level
Level of difficulty: Low
Chapter 3 - Second Level
Level of difficulty: Medium
10

Alphabetical listing by Letter Combinations
EFT C 09 AUL F 26HHH C 10 DEL F 20HLE C 08 EDU S 12HLL C 05 EFD S 14HTT C11 EFT F 12IIH C 03 ELM S 15IIL C 02 FEZ T 01IIT C 01 FJT T 02LLL C 04 GOP T 03LUF C 12 HEB T 18TTT C 06 HLE F 18UHL C 07 HMT S 01
HUT S 16HUV 1 S 17a
DDD F 21 HUV 2 S 17bEEE S 22 HZT S 24FFF S23 KLE S 05HHH F 11 LCX T 04LLL F 06 LED S 02OOO F19 LOT S 04TTT F 10 LUF F 24XXX T 21 MHE T 05
MHF T 06MLU S 18
EEN S 13 MOE S 19IIA F 04 MUD S 20IIH F 03 MUE S 21IIL F 02 MUG S 22IIM F 05 MUL S 23IIT F 01 MUZ S 30LLA F 09 NHB T 17LLD F 08 NUE S 26LLQ S 03 NUL S 25TTH F 15 OLE S 27
OUA T 11PET S 06
ATT F 14 PFT S 08HLL F 07 PLE S 09MOO T 10 POT S 10OHH F 16 RET S 07XAA T 15 SET S 11XTT F 13 TAP T 19XVV T 16 UAL S 28ZEE T 07 UHL F 25ZHH F 17 VLT S 29ZOO T 09 WMX T 20
WTF T 12YTF T 13ZEF T 08ZXN T 14
All Three Different LettersLetters Made Out of Cubes
Three Identical Letters
Two Identical + One Different
One Different + Two Identical
11

Chapter 1 Problems - Combination of Cubes (C)
Problem Letters Page #
C 01 IIT 13
C 02 IIL 14
C 03 IIH 15
C 04 LLL 16
C 05 HLL 17
C 06 TTT 18
C 07 UHL 19
C 08 HLE 20
C 09 EFT 21
C 10 HHH 22
C 11 HTT 23
C 12 LUF 24
Level of difficulty: Easy
12

13

14
15
16

17