series population and development 120
TRANSCRIPT
The 2020 census round:challenges of
the 2030 Agenda for Sustainable
Development, the Sustainable
Development Goals and the
Montevideo Consensus
on Population and Development
ISSN 1680-9009
SERIES
120POPULATION AND DEVELOPMENT
ECLACPublications
Thank you for your interest in
this ECLAC publication
Please register if you would like to receive information on our editorial
products and activities. When you register, you may specify your particular
areas of interest and you will gain access to our products in other formats.
www.cepal.org/en/publications
Publicaciones www.cepal.org/apps
SERIES
The 2020 census round: challenges of the 2030 Agenda
for Sustainable Development, the Sustainable Development
Goals and the Montevideo Consensus on Population
and Development
POPULATION AND DEVELOPMENT 120
United Nations publicationISSN: 1680-9009 (electronic version)ISSN: 1680-8991 (printed version)LC/TS.2017/93Distribution: LCopyright © United Nations, 2021All rights reservedPrinted at United Nations, SantiagoS.20-00630
This publication should be cited as: Economic Commission for Latin America and the Caribbean (ECLAC), “The 2020 census round: challenges of the 2030 Agenda for Sustainable Development, the Sustainable Development Goals and the Montevideo Consensus on Population and Development”, Population and Development series, No. 120 (LC/TS.2017/93), Santiago, 2021.
Applications for authorization to reproduce this work in whole or in part should be addressed to the Economic Commission for Latin America and the Caribbean (ECLAC), Documents and Publications Division, [email protected]. Member States and their governmental institutions may reproduce this work without prior authorization, but are requested to mention the source and to inform ECLAC of such reproduction.
This document is the outcome of a process of review and reflection on the indicators of the 2030 Agenda for Sustainable Development, the Sustainable Development Goals and the Montevideo Consensus on Population and Development. It aims to analyse the potential of censuses to measure these indicators and, in conjunction with the countries of the region, to establish their viability in the context of the 2020 census round.
The document was prepared by the Latin American and Caribbean Demographic Centre (CELADE)-Population Division of the Economic Commission for Latin America and the Caribbean (ECLAC), under the auspices of the Development Account Programme on Statistics and Data (1617A). Its preparation was supported by the Regional Office for Latin America and the Caribbean of the United Nations Population Fund (UNFPA-LACRO). It contains the conclusions and recommendations arising from the seminar organized by these institutions in coordination with the Working Group on Censuses of the Statistical Conference of the Americas of ECLAC, held in Panama City on 22–24 November 2016. Production of this document is a joint initiative by CELADE, the Statistical Conference of the Americas and UNFPA; and it forms part of the 2016–2017 work programme of the Statistical Conference of the Americas Working Group on Censuses. Technical supervision was provided by CELADE Population Affairs Officer, Fabiana Del Popolo; and drafting was done by Alejandro Giusti, UNFPA Consultant, and Lina Márquez, CELADE Consultant. We would like to thank the national statistical institutes of Latin America, and the UNFPA and CELADE teams, for their valuable contributions and comments.
The views expressed in this document, which is a translation of an original produced without formal editing, are those of the authors and do not necessarily coincide with the views of the Organization.
ECLAC - Population and Development series No. 120 The 2020 census round: challenges of the 2030 Agenda... 3
Contents
Abstract .......................................................................................................................................................................... 5
Introduction .................................................................................................................................................................. 7
I. Development agendas: A2030 and MCPD ......................................................................................... 11A. The Sustainable Development Goals ........................................................................................................11B. Montevideo Consensus on Population and Development (MCPD) ..............................................13C. The Panama seminar: measuring indicators through censuses......................................................16
II. Censuses as basic sources for measuring indicators in the framework of the 2030 Agenda and the Montevideo Consensus ................................................................. 19
III. Working methodology .............................................................................................................................. 21A. Preparation of basic information ..............................................................................................................21B. Classification and selection of indicators by type:
population-based and not population-based ......................................................................................21C. Ranking of the selected indicators by degree of complexity for measurement
through the census (from low to high) .................................................................................................. 22D. Review of previous experience of the region’s countries ................................................................. 23E. Preparation of technical notes for each indicator .............................................................................. 25
IV. Key issues for harmonizing indicators regionwide ........................................................................27A. Age thresholds ............................................................................................................................................... 27B. Disaggregation of indicators ..................................................................................................................... 27C. Relationship with other data sources ..................................................................................................... 30
V. General conclusions ....................................................................................................................................33
Bibliography ...............................................................................................................................................................35
ECLAC - Population and Development series No. 120 The 2020 census round: challenges of the 2030 Agenda...4
Annexes ........................................................................................................................................................................39Annex 1 ............................................................................................................................................................................ 40Annex 2 ............................................................................................................................................................................ 43Annex 3 ............................................................................................................................................................................ 45
Series Population and Development: issues published .......................................................................................... 116
Table
Table 1 Latin America: disaggregation variables according to SDG 17.18 that were investigated in the 2010 census ...........................................................................28
Boxes
Box 1 The Sustainable Development Goals .................................................................................... 12Box 2 Montevideo Consensus chapters ........................................................................................... 14Box 3 Inclusion of questions to characterize issues that are not traditionally
captured in censuses ..................................................................................................................24Box 4 Use of cartography for thematic and geographic disaggregation .............................. 31
Diagram
Diagram 1 Selected indicators potentially derived from the census, by dimension and level of complexity ..............................................................................................................23
ECLAC - Population and Development series No. 120 The 2020 census round: challenges of the 2030 Agenda... 5
Abstract
This document reports the recommendations made by the countries on the potential of the 2020 census round to measure the indicators of the agendas of the Sustainable Development Goals (SDGs) and the Montevideo Consensus on Population and Development. An analytical proposal prepared by the Latin American and Caribbean Demographic Centre (CELADE) and the United Nations Population Fund (UNFPA) (as part of an activity of the Development Account Programme on Statistics and Data 2016-2019) was presented in Panama on 22–24 November 2016, through the Working Group on Censuses of the Statistical Conference of the Americas of the Economic Commission for Latin America and the Caribbean (SCA-ECLAC); and it was discussed in detail by the countries.
The countries reviewed the conceptual and operational definitions assigned to each of the 50 indicators selected, based on previous census experiences and assumptions that would make it possible to measure them at the census source. The region is in a position to establish baselines from census data, and to evaluate the extent to which the countries have achieved the targets assumed by the two initiatives, particularly with a view towards 2030.
The analysis focuses not only on the potential of this data source to measure the indicator at a general level, but also on its disaggregation to lower geographical levels and the identification of gaps in terms of social and economic conditions revealed by the censuses, as a universal source.
The recommendations have formed the basis for developing a work plan that the SCA-ECLAC census group hopes to fulfil, in order to reach consensus, guarantee the regional comparability of the indicators, make this evaluation feasible and acertain the extent to which the levels and gaps, in terms of living conditions and access to rights measured by the indicators, have been reduced.

ECLAC - Population and Development series No. 120 The 2020 census round: challenges of the 2030 Agenda... 7
Introduction
In 2015, after eight rounds of intergovernmental negotiations with input from a wide variety of stakeholders, the 2030 Agenda for Sustainable Development (A2030) and the 17 Sustainable Development Goals (SDGs) were launched.1 The Agenda encompasses the economic, social and environmental pillars for sustainable development.
In this context, the Inter-Agency and Expert Group on Sustainable Development Goal Indicators developed a set of 230 global indicators which cover all SDGs and their targets, including the means for their implementation. This indicator set was agreed upon at the United Nations Statistical Commission in March 2016.2
Achieving these goals is linked to the pledge that “No one will be left behind”, which requires that the tools used to measure progress must make it possible to operate at very specific levels of disaggregation, which take into account the specific situation of different populations as well as different territories.
The Latin America and the Caribbean region defined its own population and development agenda, based on the 2013 Regional Conference on Population and Development of Latin America and the Caribbean (Montevideo Consensus on Population and Development – hereinafter MCPD) and its Operational Guide for Implementation and Follow-up of the Montevideo Consensus on Population and Development (ECLAC, 2015a). The Montevideo Consensus is the most important intergovernmental agreement on population and development to have been adopted in the region; and it became a key part of the process of reviewing the Programme of Action of the International
1 Further details of this initiative can be found at https://www.cepal.org/en/topics/2030-agenda-sustainable-development/about-2030-agenda-sustainable-development.
2 In the report on the forty-eighth session of the United Nations Statistical Commission (7–10 March 2017), it was agreed to conduct a comprehensive review of the indicators of the 2030 Agenda, which will be presented to the Commission in two sessions (2020 and 2025) where the indicators could be included, removed or adjusted on the basis of the following: the indicator does not correlate well with the goal; additional indicators are needed to cover all aspects of the goal; new data sources exist; methodological development of Tier III indicators has stalled or has not produced the expected results; or the indicator does not measure progress towards the goal. This situation demonstrates the flexible framework of indicators and the possibility of also making adjustments during their development (ECOSOC, 2017). https://unstats.un.org/unsd/statcom/48th-session/documents/.
Conference on Population and Development and its follow-up beyond 2014. To fulfill this mission and to carry out follow-up, a framework of indicators (initially totalling 130) has been developed to monitor the region’s achievements on population and development.3
It was also agreed that the indicators should be precise, comparable, measurable, delimited and aligned with those that emerge from the 2030 Agenda for Sustainable Development process and the follow-up of the Programme of Action of the International Conference on Population and Development beyond 2014.4
The priority measures promoted by MCPD are targeted on the region’s specific realities and requirements; and they represent a state-of-the-art tool for implementing the International Conference on Population and Development beyond 2014 (ICPD +2014). Their scope may even surpass the levels of effort proposed by the SDG global goals and targets on population issues.
There is recognition that the contents and targets of both agendas (A2030 and MCPD) converge in certain respects. Nonetheless, a number of specific indicators for monitoring SDGs are not present in the monitoring of MCPD and vice versa; in other cases there are complementary commitments.
Of the 230 indicators for measuring SDGs and 130 for MCPD available at the time of writing, 184 are for SDGs only, 84 are exclusive to MCPD, and 46 coincide, in accordance with the principle of seeking synergies between the agendas. The MCPD regional follow-up is expected to contribute to the review of implementation of the 2030 Agenda for Sustainable Development in the region, pursuant to the 700(XXXVI) Mexico resolution on the establishment of the Forum of the Countries of Latin America and the Caribbean on Sustainable Development.5
This document pertains to a joint initiative by the Latin American and Caribbean Demographic Centre (CELADE)-Population Division of ECLAC the Statistical Conference of the Americas of the Economic Commission for Latin America and the Caribbean (SCA-ECLAC) and the United Nations Population Fund (UNFPA); and it forms part of the 2016–2017 work programme of the SCA-ECLAC Working Group on Censuses. It has also sought to include the recommendations arising from the process of discussion and reflection arising from the analysis of the position paper prepared for the seminar organized in Panama City on 22–24 November 2016 by CELADE/ECLAC, the SCA-ECLAC Census Group and the Regional Office for Latin America and the Caribbean of the United Nations Population Fund (UNFPA-LACRO).
The document consists of five chapters. Chapter I provides a synthesis of the main milestones that have shaped the two agendas (SDG and MCPD) thus far; although it goes without saying that this is a dynamic process that is hard to encompass in this text. It also presents the seminar’s recommendations, which result in the reformulation of the position paper, particularly the content and order of the technical notes prepared to demonstrate the viability of measuring the 54 selected indicators.
Chapter II then provides a brief overview of the importance of censuses as a potential source for measuring the indicators of the two agendas.
Chapter III describes the methodology used to select indicators that are potentially measurable from census sources. It also documents the process of creating the indicator technical notes.
3 As is the case with the Sustainable Development Goals of the 2030 Agenda, the Montevideo Consensus on Population and Development is in the process of constructing both indicators and measurement methodologies. At the time of updating this document, there were 134 indicators. The four indicators that were added are not SDGs, nor are they feasible to measure from the population census; for that reason, they were not considered in detail in this document.
4 Point 13 of Resolution 1 (ECLAC, 2016a).5 “At the thirty-sixth session of the Economic Commission for Latin America and the Caribbean (ECLAC), held in Mexico City
from 23 to 27 May 2016, the member States adopted resolution 700(XXXVI), brokered by Mexico, establishing the Forum of the Countries of Latin America and the Caribbean on Sustainable Development as a regional mechanism to follow up and review the implementation of the 2030 Agenda for Sustainable Development, including the Sustainable Development Goals and targets, and its means of implementation, including the Addis Ababa Action Agenda adopted at the Third International Conference on Financing for Development” (ECLAC,2017).
ECLAC - Population and Development series No. 120 The 2020 census round: challenges of the 2030 Agenda...8
ECLAC - Population and Development series No. 120 The 2020 census round: challenges of the 2030 Agenda... 9
Chapter IV discusses several important issues that could be considered to achieve regional harmonization around the proposed indicators, such as: age thresholds, possibilities for common disaggregation of indicators, and integration with other data sources. A number of key reflections are presented that should be viewed as proposals for further work to be done in designing the 2020 round of population censuses.
Lastly, chapter V sets forth general conclusions arising from the document. This is followed by three annexes that list 54 indicators selected from the two agendas (annex 1), the preparedness of Latin American and Caribbean countries to measure the selected indicators based on the questions included in the 2010 census round (annex 2), and the individual technical notes for each indicator (annex 3) giving information on their characteristics.

ECLAC - Population and Development series No. 120 The 2020 census round: challenges of the 2030 Agenda... 11
I. Development agendas: A2030 and MCPD
The following paragraphs summarize the processes followed in creating the A2030 and MCPD agendas. They identify the main milestones that elucidate the process of the two sets of commitments up to early 2017, and they reference the original documentation on which the sequencing is based.
A. The Sustainable Development Goals
Experience with the Millennium Development Goals (MDGs)6 motivated United Nations work between 2000 and 2015 that resulted in the 2030 Agenda for Sustainable Development with its 17 Sustainable Development Goals (SDGs), as listed in box 1 along with their 169 targets.7
The main milestones in preparing this global agenda thus far are as follows:
2012–20141. United Nations Conference on Sustainable Development - Rio+20. The conference
document “The future we want” served as the basis for several intergovernmental processes that concluded in September 2014. Their results on the 2030 Agenda negotiation process were reported that year during the sixty-ninth session of the United Nations General Assembly.8
2. High-Level Panel of Eminent Persons on the post-2015 Development Agenda.9 At the General Assembly, United Nations Secretary-General Ban Ki-moon announced the creation of a 27-member group to support the process of creating the post-2015 global development agenda. The group, co-chaired by the Presidents of Indonesia and Liberia along with the Prime Minister of the United Kingdom, included leaders from
6 See Economic Commission for Latin America and the Caribbean (ECLAC), “Millennium Development Goals (MDGs)” [online] https://www.cepal.org/en/topics/millennium-development-goals-mdgs and Economic Commission for Latin America and the Caribbean (ECLAC), “Metadatos” [online] http://www.cepal.org/mdg/metadata/.
7 See Economic Commission for Latin America and the Caribbean (ECLAC), “About the 2030 Agenda for Sustainable Development” [online] https://www.cepal.org/en/topics/2030-agenda-sustainable-development/about-2030-agenda-sustainable-development.
8 See United Nations, “Agenda of the 69th regular session” [online] https://www.un.org/en/ga/69/agenda/.9 See High Level Panel on the Post-2020 Development Agenda [online] http://www.post2015hlp.org.
ECLAC - Population and Development series No. 120 The 2020 census round: challenges of the 2030 Agenda...12
civil society, the private sector and government. The group’s work reflected the new development challenges and drew on the experiences gained during implementation of the Millennium Development Goals (United Nations, 2013).
3. Open Working Group. This working group is composed of 30 States Members of the United Nations, with contributions from civil society. It held 13 rounds of intense negotiations which resulted in the proposal of the Sustainable Development Goals (SDGs) and specific targets for the new global agenda.10
Box 1 The Sustainable Development Goals
Goal 1. End poverty in all its forms everywhere Goal 2. End hunger, achieve food security and improved nutrition and promote sustainable agricultureGoal 3. Ensure healthy lives and promote well-being for all at all ages Goal 4. Ensure inclusive and equitable quality education and promote lifelong learning opportunities for all Goal 5. Achieve gender equality and empower all women and girls Goal 6. Ensure availability and sustainable management of water and sanitation for all Goal 7 Ensure access to affordable, reliable, sustainable and modern energy for all Goal 8. Promote sustained, inclusive and sustainable economic growth, full and productive employment and
decent work for all Goal 9. Build resilient infrastructure, promote inclusive and sustainable industrialization and foster innovation Goal 10. Reduce inequality within and among countries Goal 11. Make cities and human settlements inclusive, safe, resilient and sustainable Goal 12. Ensure sustainable consumption and production patterns Goal 13. Take urgent action to combat climate change and its impacts Goal 14. Conserve and sustainably use the oceans, seas and marine resources for sustainable development Goal 15 Goal 16. Promote peaceful and inclusive societies for sustainable development, provide access to justice for all
and build effective, accountable and inclusive institutions at all levels Goal 17. Strengthen the means of implementation and revitalize the Global Partnership for Sustainable
Development
Source: United Nations, Transforming our world: the 2030 Agenda for Sustainable Development (A/RES/70/1), New York, 2015.
2014–20151. At the General Assembly, the United Nations Secretary General launched an unpublished
version of his Synthesis Report which served as a basis for negotiations on the new development agenda: The road to dignity by 2030: ending poverty, transforming all lives and protecting the planet. Synthesis report of the Secretary-General on the post-2015 sustainable development agenda (United Nations, 2014).
2. Regional Commissions. These have been identified as an important mechanism for advancing regional discussions for the implementation and monitoring of global agendas, among other issues. Eight sessions were held in New York, and their reports will be discussed at the seventy-fifth session of the General Assembly in 2015.11
20151. 2030 Agenda for Sustainable Development including SDGs.12 Adopted in New York by
that session of the General Assembly during the United Nations summit for the adoption of the post-2015 development agenda, under the theme Transforming our world:
10 See United Nations, “The 17 goals” [online] https://sustainabledevelopment.un.org/index.php?menu=1300.11 See United Nations, “High-level meetings of the 70th session” [online] https://www.un.org/en/ga/70/meetings/.12 See United Nations, “Transforming our world: the 2030 Agenda for Sustainable Development”, Sustainable Development
Goals Knowledge Platform [online] https://sustainabledevelopment.un.org/post2015/transformingourworld.
ECLAC - Population and Development series No. 120 The 2020 census round: challenges of the 2030 Agenda... 13
the 2030 Agenda for Sustainable Development (United Nations, 2015) the 2030 Agenda is the result of the work of the aforementioned groups and commissions. Its 17 goals represent an integrated, holistic view and a renewed international collaboration.13
2. The Sustainable Development Goals are subdivided into 230 indicators.14 The United Nations Statistics Division disseminated the list of indicators for each SDG, together with a compilation of the metadata15 for most of them (the latest version available in February 2017 has been considered for this document).16
3. The agencies and countries also classified each indicator’s measurement possibilities based on the available sources, defining those that are easy to measure as tier 1, and those that are not currently measurable with those sources as tier 3 (United Nations, 2016a).
20161. Forum of the Countries of Latin America and the Caribbean on Sustainable Development.
In this context, the countries of the region used the 700(XXXVI) Mexico resolution on the establishment of the Forum of the Countries of Latin America and the Caribbean on Sustainable Development, approved in May 2016 during the thirty-sixth session of ECLAC, to create this forum as a regional mechanism for the implementation and follow-up of the 2030 Agenda for Sustainable Development, the Sustainable Development Goals, and their targets and means of implementation (ECLAC, 2016b).
2. This forum will be convened annually under the auspices of ECLAC, beginning in 2017, and... will encourage participation by all relevant stakeholders, including governments of the region, civil society and the private sector [...] It is expected that this forum will provide opportunities for peer learning, including through voluntary reviews, the sharing of best practices and discussion of shared targets, benefiting from the cooperation of regional and subregional commissions and organizations, in order to guide an inclusive regional process towards sustainable development in Latin America and the Caribbean.17
3. In December 2016, an updated tiers classification document was prepared (United Nations, 2016b) based on interventions and decisions made, and as a follow-up to the fourth meeting of the Inter-Agency and Expert Group on Sustainable Development Goal Indicators,18 which was held in Geneva in November 2016. The changes include updates to the classification, based on agencies involved in the initiative; and they are included in this document.
B. Montevideo Consensus on Population and Development (MCPD)
The Montevideo Consensus on Population and Development (MCPD) is a regional agreement adopted by the Latin American and Caribbean States at the first session of the Regional Conference on Population and Development, which was held in Montevideo, Uruguay, in August 2013 (ECLAC, 2013b). Framed by the commemoration of 20 years of the International Conference on Population and Development, the Regional Conference aimed to review the progress made in the region over
13 See United Nations, “The 17 goals” [online] https://sustainabledevelopment.un.org/sdgs.14 See United Nations, “Transforming our world: the 2030 Agenda for Sustainable Development”, Sustainable Development
Goals Knowledge Platform [online] https://sustainabledevelopment.un.org/post2015/transformingourworld.15 See United Nations, “IAEG-SDGs Inter-agency Expert Group on SDG Indicators. Compilation of Metadata for the Proposed
Global Indicators for the Review of the 2030 Agenda for Sustainable Development”, Sustainable Development Goals [online] http://unstats.un.org/sdgs/iaeg-sdgs/metadata-compilation/.
16 See United Nations, “SDG Indicators. Metadata repository”, Sustainable Development Goals [online] https://unstats.un.org/sdgs/metadata/.
17 See http://www.cepal.org/es/actividades-preparatorias-para-la-agenda-para-el-desarrollo-post-2015. [REF: Author, this link does not work.]
18 See United Nations, “Events. Fourth meeting of the IAEG-SDGs” [online] https://unstats.un.org/sdgs/meetings/iaeg-sdgs-meeting-04/.
ECLAC - Population and Development series No. 120 The 2020 census round: challenges of the 2030 Agenda...14
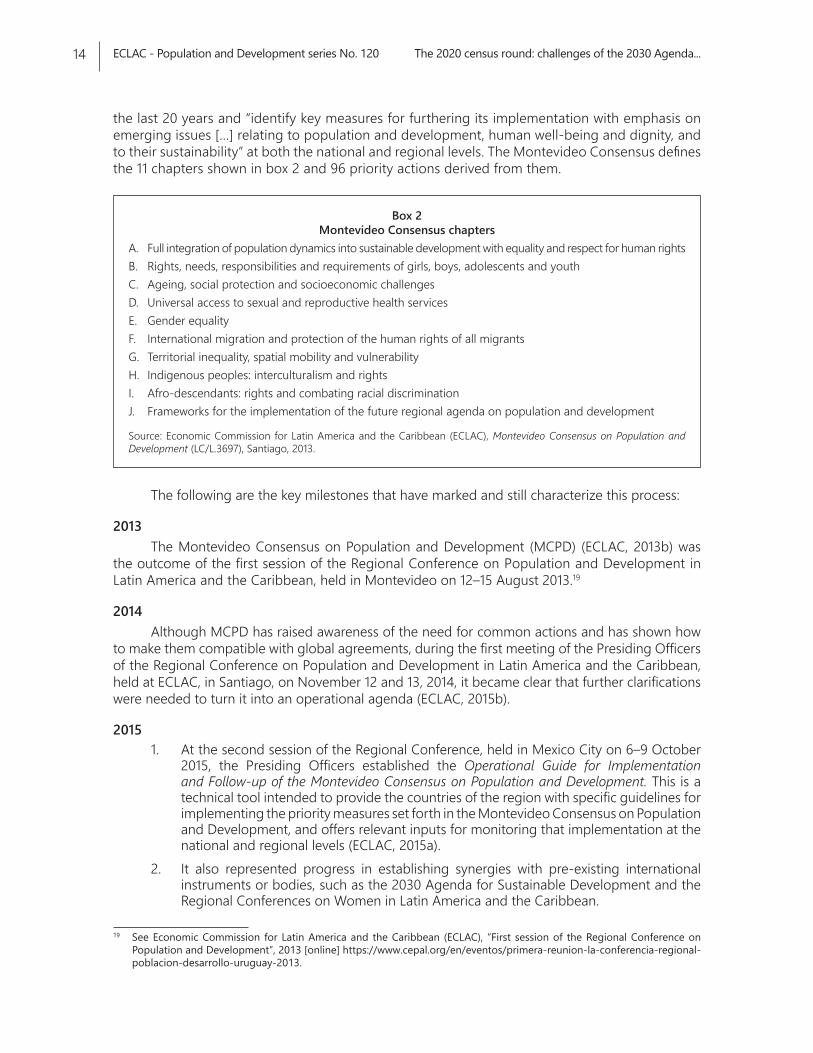
the last 20 years and “identify key measures for furthering its implementation with emphasis on emerging issues […] relating to population and development, human well-being and dignity, and to their sustainability” at both the national and regional levels. The Montevideo Consensus defines the 11 chapters shown in box 2 and 96 priority actions derived from them.
Box 2 Montevideo Consensus chapters
A. Full integration of population dynamics into sustainable development with equality and respect for human rights B. Rights, needs, responsibilities and requirements of girls, boys, adolescents and youth C. Ageing, social protection and socioeconomic challenges D. Universal access to sexual and reproductive health services E. Gender equality F. International migration and protection of the human rights of all migrants G. Territorial inequality, spatial mobility and vulnerability H. Indigenous peoples: interculturalism and rights I. Afro-descendants: rights and combating racial discrimination J. Frameworks for the implementation of the future regional agenda on population and development
Source: Economic Commission for Latin America and the Caribbean (ECLAC), Montevideo Consensus on Population and Development (LC/L.3697), Santiago, 2013.
The following are the key milestones that have marked and still characterize this process:
2013The Montevideo Consensus on Population and Development (MCPD) (ECLAC, 2013b) was
the outcome of the first session of the Regional Conference on Population and Development in Latin America and the Caribbean, held in Montevideo on 12–15 August 2013.19
2014Although MCPD has raised awareness of the need for common actions and has shown how
to make them compatible with global agreements, during the first meeting of the Presiding Officers of the Regional Conference on Population and Development in Latin America and the Caribbean, held at ECLAC, in Santiago, on November 12 and 13, 2014, it became clear that further clarifications were needed to turn it into an operational agenda (ECLAC, 2015b).
20151. At the second session of the Regional Conference, held in Mexico City on 6–9 October
2015, the Presiding Officers established the Operational Guide for Implementation and Follow-up of the Montevideo Consensus on Population and Development. This is a technical tool intended to provide the countries of the region with specific guidelines for implementing the priority measures set forth in the Montevideo Consensus on Population and Development, and offers relevant inputs for monitoring that implementation at the national and regional levels (ECLAC, 2015a).
2. It also represented progress in establishing synergies with pre-existing international instruments or bodies, such as the 2030 Agenda for Sustainable Development and the Regional Conferences on Women in Latin America and the Caribbean.
19 See Economic Commission for Latin America and the Caribbean (ECLAC), “First session of the Regional Conference on Population and Development”, 2013 [online] https://www.cepal.org/en/eventos/primera-reunion-la-conferencia-regional-poblacion-desarrollo-uruguay-2013.
ECLAC - Population and Development series No. 120 The 2020 census round: challenges of the 2030 Agenda... 15
3. At this meeting, the Ad Hoc Working Group was set up to prepare a proposal for the revision and specification of indicators for the regional monitoring of MCPD.20
4. It was also stipulated that the indicators should be “accurate, comparable, measurable, limited and aligned with those emerging from the process related to the 2030 Agenda for Sustainable Development and follow-up on the Programme of Action of the International Conference on Population and Development beyond 2014.21
5. Through the same resolution, the Conference also decided that ECLAC, with support from UNFPA, should act as the technical secretariat of the working group, which provides for the incorporation, participation and opinion of civil society representatives and other stakeholders in preparing the recommendations.
20161. In its capacity as Chair of the Presiding Officers of the Regional Conference on Population
and Development and coordinator of the working group, the Government of Mexico tasked the Technical Secretariat with preparing a Preliminary proposal of indicators (PPI) for regional follow-up of MCPD. It convened a workshop to review progress made in preparing the indicators proposal for regional follow-up of the Montevideo Consensus on Population and Development on 8–9 June, 2016 (ECLAC, 2016c).
2. The proposals and suggestions made at the workshop served as input for the review of PPI and the preparation of the first draft of the proposed indicators for regional follow-up of the Montevideo Consensus on Population and Development, prepared in Santiago in July 2016. The indicators are still undergoing consolidation in various aspects (metadata, technical definitions and adjustment of their number and scope). At that meeting, the ad hoc working group responsible for proposing indicators for the regional monitoring of MCPD presented the Progress report of the ad hoc working group for the preparation of a proposal on the indicators for regional follow-up of the Montevideo Consensus on Population and Development (ECLAC, 2016d), which identified a preliminary list of 130 indicators associated with the chapters of the Consensus.
3. There is coincidence between the disaggregation of indicators for certain population groups in Chapter A of the reformulated MCPD and the way data is broken down in SDG target 17.18. The two represent a guiding principle for the reading and interpretation of the indicators in each of the chapters of the draft of this proposal.22
4. The aforementioned progress report was considered at the third meeting of the Presiding Officers of the Regional Conference on Population and Development, held in Santiago on 4–6 October 2016, where progress was made on the first draft of the proposed indicators for regional follow-up of the Montevideo Consensus on Population and Development. Its final report will be presented as the working group’s contribution to the third session of the Regional Conference (CRPD-3), to be held in San Salvador in November 2017.
20 Resolution 1, point 13: The working group, initially constituted by Antigua and Barbuda, Argentina, the Bolivarian Republic of Venezuela, Brazil, Colombia, Costa Rica, Cuba, Dominican Republic, Ecuador, El Salvador, Guyana, Jamaica, Panama, Peru, Puerto Rico and Uruguay, aims to work with all members of the Regional Conference on Population and Development to develop a proposal for the revision and specification of the SDG indicators, to be used for regional monitoring of the Montevideo Consensus (ECLAC, 2016a).
21 See Economic Commission for Latin America and the Caribbean (ECLAC), “Millennium Development Goals (MDGs)” [online] https://www.cepal.org/en/topics/millennium-development-goals-mdgs y Economic Commission for Latin America and the Caribbean (ECLAC), “Metadatos” [online] http://www.cepal.org/mdg/metadata/.
22 “By 2020, improve capacity-building support to developing countries, including least developed countries and small island developing States, to significantly increase the availability of timely, reliable and high-quality data disaggregated by income, gender, age, race, ethnicity, migration status, disability, geographical location and other characteristics relevant to national contexts.
ECLAC - Population and Development series No. 120 The 2020 census round: challenges of the 2030 Agenda...16
In this connection, although the countries may not be in a position to measure the indicators immediately given the scope of the available data sources, this should not prevent them from considering the indicators and starting to generate the sources needed to measure them in the future, with support, cooperation and inputs from other countries in the region that already have the information in question.
C. The Panama seminar: measuring indicators through censuses
The seminar titled “2020 Census Round: Possibilities and Challenges Presented by the Sustainable Development Goals and the Montevideo Consensus within the Framework of the 2030 Agenda”, was organized jointly by the Latin American and Caribbean Demographic Centre (CELADE)-Population Division of ECLAC, SCA-ECLAC and UNFPA-LACRO in Panama City, on 22–24 November 2016. Its aim was to provide a mechanism for discussion and critical analysis of the role of national statistical institutes in producing information for global and regional development agendas for 2030, particularly through census processes. The following sections describe the methodology and results of this seminar.
The objective of the seminar was to analyze the potential of censuses to measure the indicators of the SDG and MCPD agendas,23 with a view to establishing with the region’s countries the feasibility of measuring them in the 2020 census round. It was suggested that there is an urgent need to identify aspects that can be influenced technically and operationally, in order to obtain information with the qualities needed to follow up on the development agendas and address the challenges and demands of the region’s countries. This also connects with the provisions of the fifteenth meeting of the Executive Committee of the Statistical Conference of the Americas, which seeks to promote mechanisms for exchange and discussion aimed at strengthening census processes, with special emphasis on the objectives defined for the working subgroups recommended at that meeting:24 (1) content of the censuses; (2) integration of the censuses with other data sources; (3) cartography; and (4) census technologies.
In order to guide the exchange of experiences and technical discussion among the countries, a reference document was prepared in Spanish with the same title as the seminar, “Los censos de la ronda 2020: desafíos ante la Agenda 2030 para el Desarrollo Sostenible, los Objetivos de Desarrollo Sostenible y el Consenso de Montevideo sobre Población y Desarrollo” which provides analytical tools to address the 54 indicators identified as those that could potentially be derived from the population and housing censuses.25
During the meeting, the data collection challenges were analyzed, along with the main lessons learned from the implementation of past censuses; the possibility of measuring the proposed indicators in their next censuses; the questions that would enable this and the eventual willingness to agree, through a work schedule, on modifications to harmonize measurement regionwide.
23 “Urges the Statistical Coordination Group for the 2030 Agenda in Latin America and the Caribbean to coordinate its activities with the ad hoc working group for the preparation of a proposal on the indicators for regional follow-up of the Montevideo Consensus on Population and Development, adopted by the Regional Conference on Population and Development in Latin America and the Caribbean at its first session” and “14. Further adopts the programme of work 2016-2017 of the Working Group on Censuses, which includes providing training on vital statistics, censuses and population estimates, gathering information on the progress made in the 2020 census round and analysing the scope of and challenges involved in using population censuses to generate indicators for follow-up of the Sustainable Development Goals and the Montevideo Consensus on Population and Development (ECLAC, 2016e).
24 “Recommends that the Working Group on Censuses analyse the possibility of creating task forces on the content of censuses, cartography, census technologies and the integration of censuses with other data sources (ECLAC, 2016e).
25 These indicators correspond to those in which the numerators and denominators have a direct or indirect relationship to results derived from the census process.
ECLAC - Population and Development series No. 120 The 2020 census round: challenges of the 2030 Agenda... 17
One of the recommendations arising from the aforementioned seminar was that CELADE, in its capacity as Technical Secretariat of the SCA-ECLAC Working Group on Censuses, with support from UNFPA, should revise the reference document presented at the meeting, to incorporate the observations and contributions made by the countries, an activity that has been accomplished with the publication of this document.
Another set of recommendations and actions was also defined to give continuity to this work, as follows:
• The SCA-ECLAC Working Group on Censuses, with support from the Technical Secretariat (CELADE) and UNFPA, shall:− Facilitate the organization in 2017 of the four sub-working groups set up during
the seminar, in line with the recommendation contained in the last resolution of the Executive Committee of SCA-ECLAC, namely Subgroup on Contents: Argentina and Uruguay; Subgroup on Cartography: Chile and Brazil; Subgroup on Technologies: Bolivarian Republic of Venezuela and Colombia; and Subgroup on Integration with other sources: Ecuador and Colombia.
− Each subgroup should define its terms of reference and work agenda for 2017, which should be submitted by a date to be notified by CELADE-Population Division of ECLAC in early 2017.
− A detailed work programme will be established in the work agenda (based on online forums and either virtual or face-to-face meetings) which will make it possible to specify the definition and agreements on issues that emerged from the seminar (including deprivation, social protection, environment, basic services, employment, education, etc.), in order to finally identify the direct and complementary indicators that can be measured with the proposed censuses.
− The work programme will also make it possible to specify comparable thresholds for disaggregations such as age, migratory status or territorial location; and for making progress towards harmonization of the variables established in SDG 17.18, in particular the more complex ones such as poverty, ethnicity or disability.
− The work programme includes the processing of the 2010 census with a view to evaluating complementary indicators and disaggregation thresholds, and to defining joint pilot tests.
• Mechanisms need to be created to link the work to be done with the other SCA-ECLAC thematic groups, such as poverty, disability, gender, information technologies, among others. Moreover, where appropriate, virtual communication tools will be deployed, such as for discussion and sharing of good practices on the topics defined by the subgroups of the SCA-ECLAC working group on censuses, also including some face-to-face meetings.
• It is also necessary to identify and link the group’s actions with other key global and regional processes, so as to avoid duplicating efforts and, not least, to stimulate the search for funding.
• Promote and establish a strategy for horizontal cooperation and training activities in the region, both in terms of conceptual design and in the area of cartographic and technological needs, drawing on all of the region’s accumulated experience and knowledge.
• Lastly, the Technical Secretariat will produce a report on this meeting, which will be submitted to the participating countries for their review, prior to dissemination. Materials from the meeting and produced elsewhere will be made available through a website.

ECLAC - Population and Development series No. 120 The 2020 census round: challenges of the 2030 Agenda... 19
II. Censuses as basic sources for measuring indicators in the framework of the 2030 Agenda and the Montevideo Consensus
Population and housing censuses represent a key tool in facing the challenges of information that is essential for a country’s development. Their universal scope —they involve each and every person living in a territory, the households they belong to and the homes they inhabit— makes it possible to obtain information that is vital for understanding the population’s living conditions, for minor geographical areas and small population groups, without the errors attributable to other data sources that include sampling in their design.26
A population and housing census also serves as the basis for other statistical operations that countries need to carry out; it makes it possible to prepare and update the sample frameworks used in the development of surveys within national statistical systems; it allows for the application of basic and extended forms in the census itself; it also allows for the implementation of surveys complementary to census programmes27 (which include revisiting households in order to deepen the study and analysis of certain complex phenomena associated with situations such as disability, belonging to indigenous and Afrodescendent peoples; international migrant status, internally displaced persons, among others); as well as the development of post-census surveys (to evaluate the coverage and quality of the census in certain areas).
Censuses are also used to make population projections and estimates in intercensal periods, since these depend on initial population data, age and sex. In addition to censuses, producing estimates also depends on administrative and survey records, when administrative records are unreliable for determining the level and structure of different components of demographic change.
26 Except when the census project uses this type of methodology to obtain part of its information, such as the censuses of Argentina (1991, 2010), Brazil (2000, 2010), Colombia (2005) and Mexico (2000, 2010), which used basic questionnaires for the total population and extended questionnaires for a sample of households; or when samples of specific population groups are selected to implement complementary post-census surveys (Argentina, 2001).
27 Evidence of the scope and limitations of this type of complementary survey can be obtained from the 2001 census in Argentina.
ECLAC - Population and Development series No. 120 The 2020 census round: challenges of the 2030 Agenda...20
Lastly, the census not only provides population data for more detailed subnational levels of territorial disaggregation, but also for specific population groups that would be required as denominators for different indicators measured from other sources, not only at the census dates but also for their longitudinal follow-up.
Census processes are thus a fundamental means of identifying the populations that should be at the centre of sustainable development policies, given the implications they have for their demographic dynamics.
The historical moment in which the new agendas are being proposed coincides with the start of the 2020 census rounds; so the censuses are an essential source for defining baselines for the starting dates of indicator monitoring. They will also be partly responsible for recording progress towards 2030, the year by which it is proposed to achieve the new targets and the start of a new census round.
Hence the importance of paying urgent attention to the indicators that censuses can potentially measure. At the same time, a special situation arises form developing coordinated action with other data sources, agreeing on conceptual and operational definitions with general and specific surveys, and reviewing how to enhance their use in conjunction with administrative records.
Many Latin American countries have begun the process of preparing census surveys for the next round. A recent CELADE consultation found that 14 of the 18 countries that responded had already planned their census date.28 Five countries plan to conduct censuses between 2017 and 2018 (Chile, Colombia, El Salvador, Haiti and Peru);29 six will do so in 2020 (Brazil, Costa Rica, the Dominican Republic, Ecuador, Mexico and Panama); two in 2022 (Cuba and the Plurinational State of Bolivia). Although five had not set their dates at the time of the survey, it is already known that Argentina will hold its census in 2020 and Guatemala will do so in 2018.
28 In 2016, the Latin American and Caribbean Demographic Centre (CELADE) - Population Division of the Economic Commission for Latin America and the Caribbean (ECLAC) prepared a final report on the results of the Survey on progress towards the 2020 censuses and identification of national needs (Ruiz, Silva and Villarroel, 2016).
29 In the case of Chile, this is an abbreviated census that was carried out to obtain more reliable data on the population and its basic sociodemographic characteristics as well as its spatial location. The thematic content of the census was restricted in order to capture the minimum amount of information needed to make population estimates and projections and to update the sampling frameworks. However, the census planned for 2022 will have the characteristics of the usual census.
ECLAC - Population and Development series No. 120 The 2020 census round: challenges of the 2030 Agenda... 21
III. Working methodology
The following paragraphs describe some of the methodological issues that informed development of the reference document, which was used to gauge the potential of the 2020 census round to measure the selected indicators. The changes recommended by the Panama seminar are included.
A. Preparation of basic information
The information used to analyse the indicator sets of the two initiatives (SDG and MCPD) was as follows:
(i) The names and numbers assigned to the indicators in both initiatives (both numbers were included where the indicators overlap).
(ii) The metadata defined for the measurement of the SDG indicators (as of the time of writing, the official MCPD indicators metadata were not available), and the classification by availability of methodologies and data sources assigned by SDG (Tiers).
(iii) The technical definition (numerators and denominators) cited in the SDG metadata, along with the operational definitions commonly used by census sources in the region.
B. Classification and selection of indicators by type: population-based and not population-based
The technical definitions of the indicators were reviewed in order to distinguish between those that are potentially measurable through censuses and those that should definitely be investigated through other data sources, or else via triangulation between sources (see Annex 1. SDG and MCPD indicators potentially measurable by censuses). Each indicator was classified by type (examples in parentheses).
ECLAC - Population and Development series No. 120 The 2020 census round: challenges of the 2030 Agenda...22
(i) Population-based: for individuals (Proportion and number of children aged 5–17 years engaged in child labour, by sex and age, Indicator SDG 8.7.1); for households (Proportion of population living in households with access to basic services, Indicator SDG 1.4.1.); for housing (Proportion of urban population living in slums, informal settlements or inadequate housing, SDG Indicator 11.1.1; or derived (Average hourly earnings of female and male employees, by occupation, age and persons with disabilities, SDG Indicator 8.5.1.)
(ii) Not population-based: institutional (Volume of official development assistance flows for scholarships by sector and type of study, SDG Indicator 4.b.1.); referring to other observation units (Proportion of fish stocks within biologically sustainable levels 14.4.1.); or which cannot be measured through population censuses, with exceptions that will be made explicit in the document.
(iii) Population-based indicators were considered as potentially measurable through censuses. There are 54 in all, of which 22 belong exclusively to the 2030 Agenda (SDGs), 10 to MCPD and 22 are overlapping.
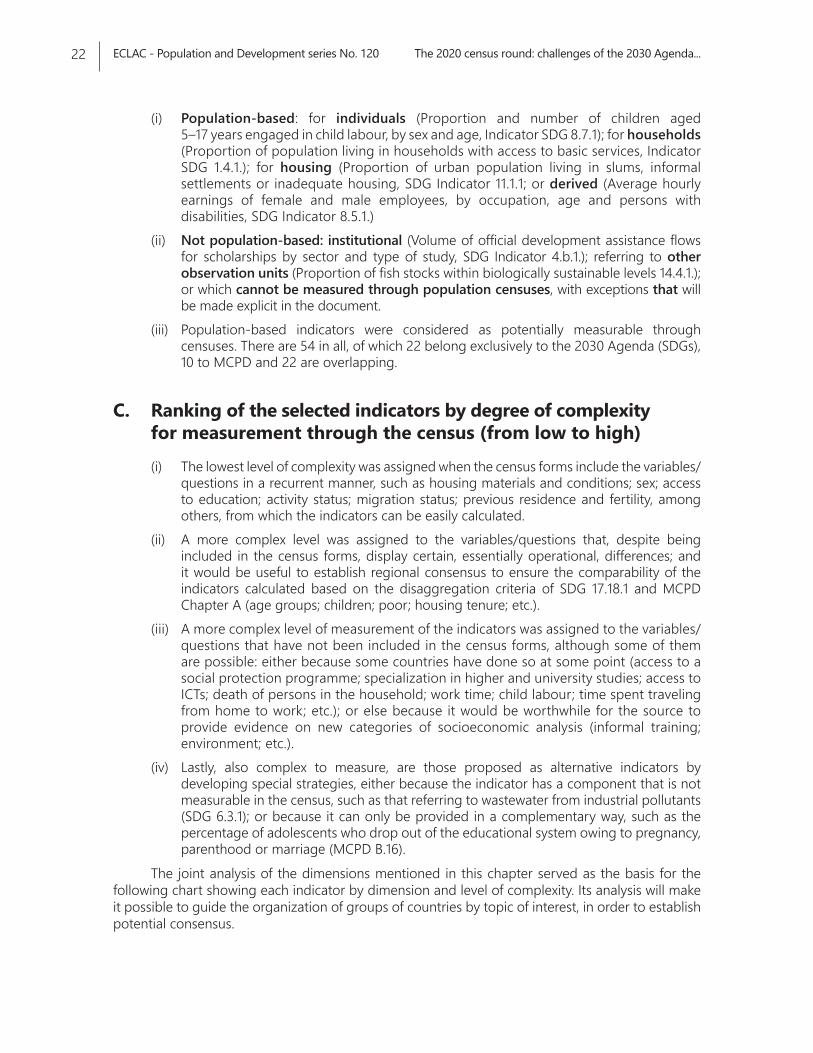
C. Ranking of the selected indicators by degree of complexity for measurement through the census (from low to high)(i) The lowest level of complexity was assigned when the census forms include the variables/
questions in a recurrent manner, such as housing materials and conditions; sex; access to education; activity status; migration status; previous residence and fertility, among others, from which the indicators can be easily calculated.
(ii) A more complex level was assigned to the variables/questions that, despite being included in the census forms, display certain, essentially operational, differences; and it would be useful to establish regional consensus to ensure the comparability of the indicators calculated based on the disaggregation criteria of SDG 17.18.1 and MCPD Chapter A (age groups; children; poor; housing tenure; etc.).
(iii) A more complex level of measurement of the indicators was assigned to the variables/questions that have not been included in the census forms, although some of them are possible: either because some countries have done so at some point (access to a social protection programme; specialization in higher and university studies; access to ICTs; death of persons in the household; work time; child labour; time spent traveling from home to work; etc.); or else because it would be worthwhile for the source to provide evidence on new categories of socioeconomic analysis (informal training; environment; etc.).
(iv) Lastly, also complex to measure, are those proposed as alternative indicators by developing special strategies, either because the indicator has a component that is not measurable in the census, such as that referring to wastewater from industrial pollutants (SDG 6.3.1); or because it can only be provided in a complementary way, such as the percentage of adolescents who drop out of the educational system owing to pregnancy, parenthood or marriage (MCPD B.16).
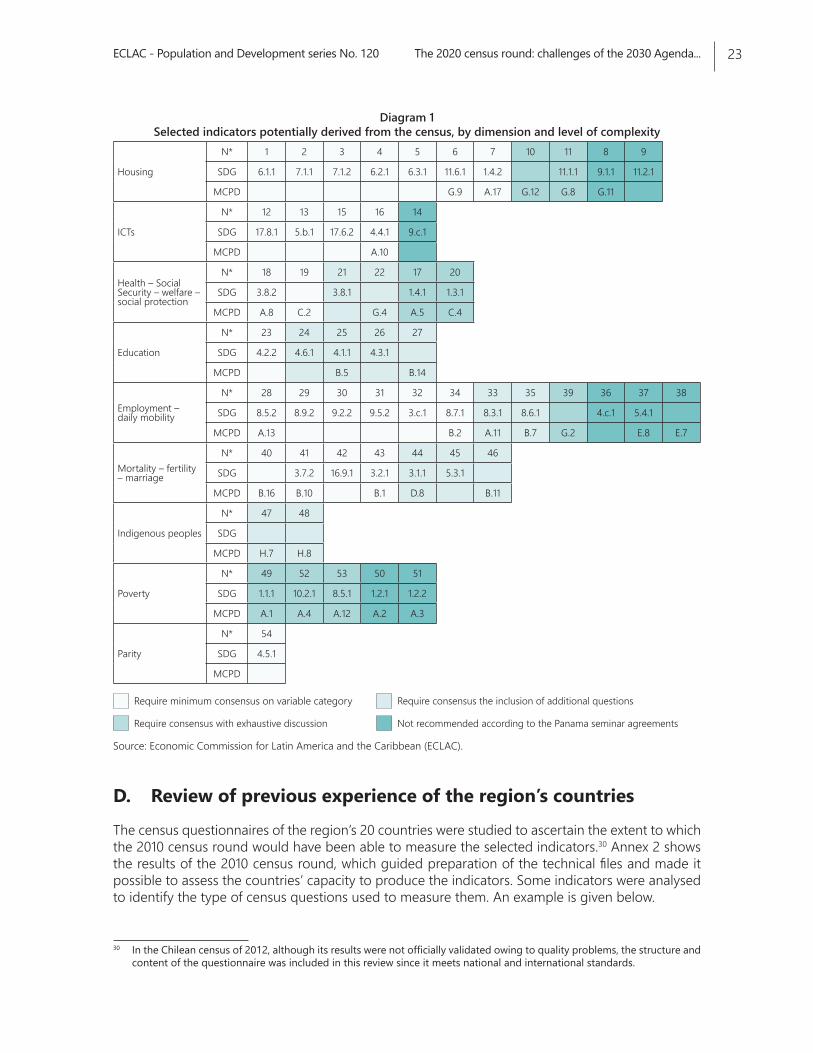
The joint analysis of the dimensions mentioned in this chapter served as the basis for the following chart showing each indicator by dimension and level of complexity. Its analysis will make it possible to guide the organization of groups of countries by topic of interest, in order to establish potential consensus.
ECLAC - Population and Development series No. 120 The 2020 census round: challenges of the 2030 Agenda... 23
Diagram 1 Selected indicators potentially derived from the census, by dimension and level of complexity
Housing
N* 1 2 3 4 5 6 7 10 11 8 9
SDG 6.1.1 7.1.1 7.1.2 6.2.1 6.3.1 11.6.1 1.4.2 11.1.1 9.1.1 11.2.1
MCPD G.9 A.17 G.12 G.8 G.11
ICTs
N* 12 13 15 16 14
SDG 17.8.1 5.b.1 17.6.2 4.4.1 9.c.1
MCPD A.10
Health – Social Security – welfare – social protection
N* 18 19 21 22 17 20
SDG 3.8.2 3.8.1 1.4.1 1.3.1
MCPD A.8 C.2 G.4 A.5 C.4
Education
N* 23 24 25 26 27
SDG 4.2.2 4.6.1 4.1.1 4.3.1
MCPD B.5 B.14
Employment – daily mobility
N* 28 29 30 31 32 34 33 35 39 36 37 38
SDG 8.5.2 8.9.2 9.2.2 9.5.2 3.c.1 8.7.1 8.3.1 8.6.1 4.c.1 5.4.1
MCPD A.13 B.2 A.11 B.7 G.2 E.8 E.7
Mortality – fertility – marriage
N* 40 41 42 43 44 45 46
SDG 3.7.2 16.9.1 3.2.1 3.1.1 5.3.1
MCPD B.16 B.10 B.1 D.8 B.11
Indigenous peoples
N* 47 48
SDG
MCPD H.7 H.8
Poverty
N* 49 52 53 50 51
SDG 1.1.1 10.2.1 8.5.1 1.2.1 1.2.2
MCPD A.1 A.4 A.12 A.2 A.3
Parity
N* 54
SDG 4.5.1
MCPD
Require minimum consensus on variable category Require consensus the inclusion of additional questions
Require consensus with exhaustive discussion Not recommended according to the Panama seminar agreements
Source: Economic Commission for Latin America and the Caribbean (ECLAC).
D. Review of previous experience of the region’s countries
The census questionnaires of the region’s 20 countries were studied to ascertain the extent to which the 2010 census round would have been able to measure the selected indicators.30 Annex 2 shows the results of the 2010 census round, which guided preparation of the technical files and made it possible to assess the countries’ capacity to produce the indicators. Some indicators were analysed to identify the type of census questions used to measure them. An example is given below.
30 In the Chilean census of 2012, although its results were not officially validated owing to quality problems, the structure and content of the questionnaire was included in this review since it meets national and international standards.
ECLAC - Population and Development series No. 120 The 2020 census round: challenges of the 2030 Agenda...24
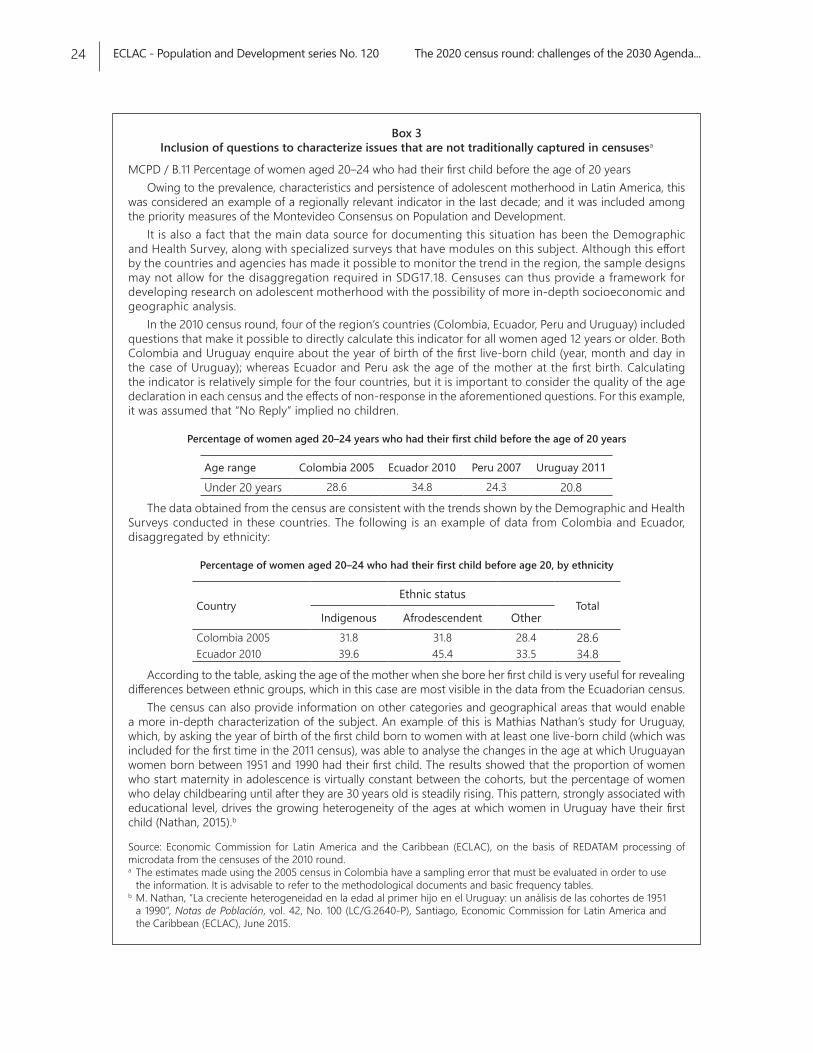
Box 3 Inclusion of questions to characterize issues that are not traditionally captured in censusesa
MCPD / B.11 Percentage of women aged 20–24 who had their first child before the age of 20 yearsOwing to the prevalence, characteristics and persistence of adolescent motherhood in Latin America, this
was considered an example of a regionally relevant indicator in the last decade; and it was included among the priority measures of the Montevideo Consensus on Population and Development.
It is also a fact that the main data source for documenting this situation has been the Demographic and Health Survey, along with specialized surveys that have modules on this subject. Although this effort by the countries and agencies has made it possible to monitor the trend in the region, the sample designs may not allow for the disaggregation required in SDG17.18. Censuses can thus provide a framework for developing research on adolescent motherhood with the possibility of more in-depth socioeconomic and geographic analysis.
In the 2010 census round, four of the region’s countries (Colombia, Ecuador, Peru and Uruguay) included questions that make it possible to directly calculate this indicator for all women aged 12 years or older. Both Colombia and Uruguay enquire about the year of birth of the first live-born child (year, month and day in the case of Uruguay); whereas Ecuador and Peru ask the age of the mother at the first birth. Calculating the indicator is relatively simple for the four countries, but it is important to consider the quality of the age declaration in each census and the effects of non-response in the aforementioned questions. For this example, it was assumed that “No Reply” implied no children.
Percentage of women aged 20–24 years who had their first child before the age of 20 years
Age range Colombia 2005 Ecuador 2010 Peru 2007 Uruguay 2011
Under 20 years 28.6 34.8 24.3 20.8The data obtained from the census are consistent with the trends shown by the Demographic and Health
Surveys conducted in these countries. The following is an example of data from Colombia and Ecuador, disaggregated by ethnicity:
Percentage of women aged 20–24 who had their first child before age 20, by ethnicity
CountryEthnic status
TotalIndigenous Afrodescendent Other
Colombia 2005 31.8 31.8 28.4 28.6Ecuador 2010 39.6 45.4 33.5 34.8
According to the table, asking the age of the mother when she bore her first child is very useful for revealing differences between ethnic groups, which in this case are most visible in the data from the Ecuadorian census.
The census can also provide information on other categories and geographical areas that would enable a more in-depth characterization of the subject. An example of this is Mathias Nathan’s study for Uruguay, which, by asking the year of birth of the first child born to women with at least one live-born child (which was included for the first time in the 2011 census), was able to analyse the changes in the age at which Uruguayan women born between 1951 and 1990 had their first child. The results showed that the proportion of women who start maternity in adolescence is virtually constant between the cohorts, but the percentage of women who delay childbearing until after they are 30 years old is steadily rising. This pattern, strongly associated with educational level, drives the growing heterogeneity of the ages at which women in Uruguay have their first child (Nathan, 2015).b
Source: Economic Commission for Latin America and the Caribbean (ECLAC), on the basis of REDATAM processing of microdata from the censuses of the 2010 round.a The estimates made using the 2005 census in Colombia have a sampling error that must be evaluated in order to use
the information. It is advisable to refer to the methodological documents and basic frequency tables.b M. Nathan, “La creciente heterogeneidad en la edad al primer hijo en el Uruguay: un análisis de las cohortes de 1951
a 1990”, Notas de Población, vol. 42, No. 100 (LC/G.2640-P), Santiago, Economic Commission for Latin America and the Caribbean (ECLAC), June 2015.
ECLAC - Population and Development series No. 120 The 2020 census round: challenges of the 2030 Agenda... 25
E. Preparation of technical notes for each indicator
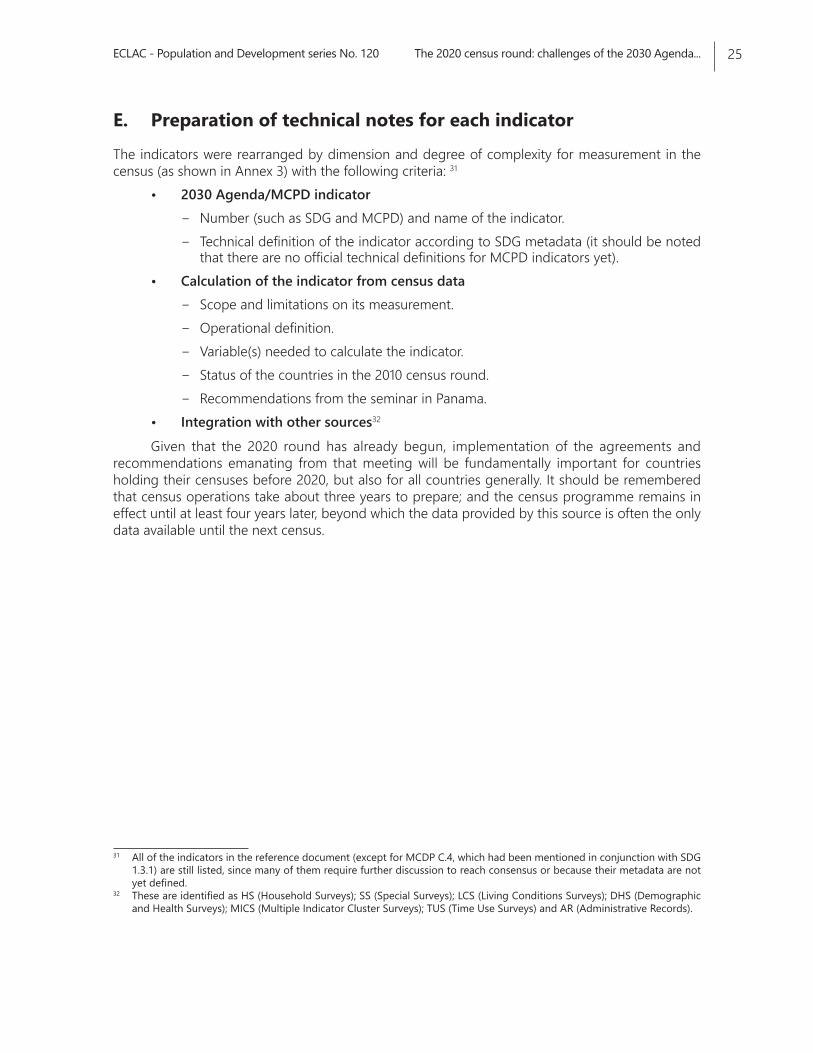
The indicators were rearranged by dimension and degree of complexity for measurement in the census (as shown in Annex 3) with the following criteria: 31
• 2030 Agenda/MCPD indicator − Number (such as SDG and MCPD) and name of the indicator.− Technical definition of the indicator according to SDG metadata (it should be noted
that there are no official technical definitions for MCPD indicators yet).• Calculation of the indicator from census data
− Scope and limitations on its measurement.− Operational definition.− Variable(s) needed to calculate the indicator.− Status of the countries in the 2010 census round.− Recommendations from the seminar in Panama.
• Integration with other sources32
Given that the 2020 round has already begun, implementation of the agreements and recommendations emanating from that meeting will be fundamentally important for countries holding their censuses before 2020, but also for all countries generally. It should be remembered that census operations take about three years to prepare; and the census programme remains in effect until at least four years later, beyond which the data provided by this source is often the only data available until the next census.
31 All of the indicators in the reference document (except for MCDP C.4, which had been mentioned in conjunction with SDG 1.3.1) are still listed, since many of them require further discussion to reach consensus or because their metadata are not yet defined.
32 These are identified as HS (Household Surveys); SS (Special Surveys); LCS (Living Conditions Surveys); DHS (Demographic and Health Surveys); MICS (Multiple Indicator Cluster Surveys); TUS (Time Use Surveys) and AR (Administrative Records).

ECLAC - Population and Development series No. 120 The 2020 census round: challenges of the 2030 Agenda... 27
IV. Key issues for harmonizing indicators regionwide
An analysis of the technical notes for each indicator, reordered and revised in the light of the meeting’s recommendations, reveals the need to consider three additional aspects for decision-making in the SCA-ECLAC census group: A. the age thresholds above which the census questions will be asked; B. the possibility of disaggregating the indicators based on SDG 17.18 and the potential for using digital mapping and technological innovations to present the data with geographic and thematic criteria; and C. the relationship with other data sources.
A. Age thresholds
It is essential to review the age thresholds from which to measure certain phenomena. In some cases it would be advisable to discuss the ages at which certain phenomena are investigated, in the light of evidence on including earlier and later ages than those considered in the past. Examples include those referring to employment, to measure child labour; or fertility, to include girls under 10 and women over 49.
Accordingly, aside from the shortcomings of this source (from which others are not immune), it would seem appropriate to obtain complete information for the extreme ages of the population pyramid, especially since these are the ages at which phenomena that have gained analytical relevance and greater visibility in recent times occur. Examples include child labour and increasingly early adolescent fertility.
B. Disaggregation of indicators
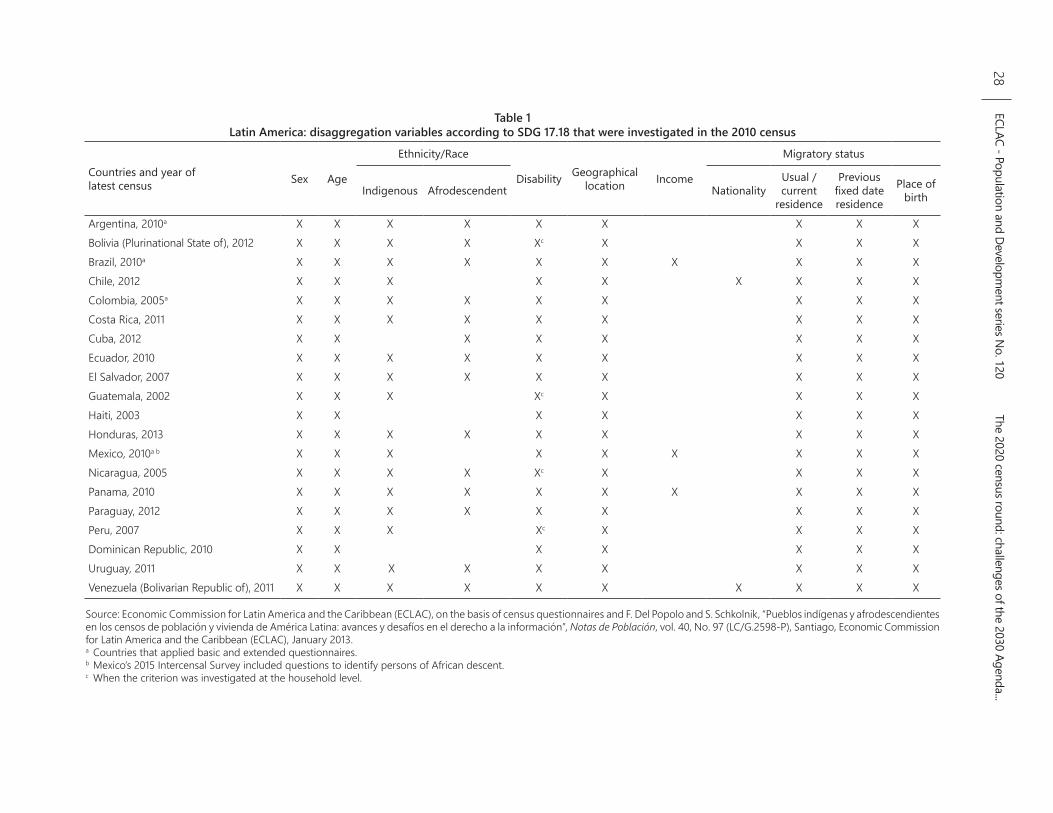
An analysis of the disaggregation criteria shows that, in many cases, it ought to be possible for the countries to reach consensus, for many of the disaggregation criteria could be applied in the censuses, since most of them include the required variables, as can be seen in table 1.
ECLAC - Population and Development series N
o. 120 The 2020 census round: challenges of the 2030 Agenda...
28
Table 1 Latin America: disaggregation variables according to SDG 17.18 that were investigated in the 2010 census
Countries and year of latest census Sex Age
Ethnicity/Race
Disability Geographical location Income
Migratory status
Indigenous Afrodescendent NationalityUsual / current
residence
Previous fixed date residence
Place of birth
Argentina, 2010a X X X X X X X X XBolivia (Plurinational State of), 2012 X X X X Xc X X X XBrazil, 2010a X X X X X X X X X XChile, 2012 X X X X X X X X XColombia, 2005a X X X X X X X X XCosta Rica, 2011 X X X X X X X X XCuba, 2012 X X X X X X X XEcuador, 2010 X X X X X X X X XEl Salvador, 2007 X X X X X X X X XGuatemala, 2002 X X X Xc X X X XHaiti, 2003 X X X X X X XHonduras, 2013 X X X X X X X X XMexico, 2010a b X X X X X X X X XNicaragua, 2005 X X X X Xc X X X XPanama, 2010 X X X X X X X X X XParaguay, 2012 X X X X X X X X XPeru, 2007 X X X Xc X X X XDominican Republic, 2010 X X X X X X XUruguay, 2011 X X X X X X X X XVenezuela (Bolivarian Republic of), 2011 X X X X X X X X X X
Source: Economic Commission for Latin America and the Caribbean (ECLAC), on the basis of census questionnaires and F. Del Popolo and S. Schkolnik, “Pueblos indígenas y afrodescendientes en los censos de población y vivienda de América Latina: avances y desafíos en el derecho a la información”, Notas de Población, vol. 40, No. 97 (LC/G.2598-P), Santiago, Economic Commission for Latin America and the Caribbean (ECLAC), January 2013.a Countries that applied basic and extended questionnaires.b Mexico’s 2015 Intercensal Survey included questions to identify persons of African descent.c When the criterion was investigated at the household level.
ECLAC - Population and Development series No. 120 The 2020 census round: challenges of the 2030 Agenda... 29
The seminar analysed the variables that should be used to disaggregate the indicators, such as age groups and migration status, which will shape the concept of poverty,33ethnicity or disability, or other criteria not mentioned but included in SDG target 17.18.
Consensus on these criteria will also be useful when calculating indicators that require a parity calculation, such as 4.5.1 (on education).
There was agreement at the seminar that some indicators are simple to treat, provided common definitions are accepted; while others, which are more conceptually and operationally complex, require further discussion. Many of these issues are addressed in guidelines in the 2010 census round handbook “Recomendaciones para los censos de la década de 2010 en América Latina” (ECLAC, 2011b), which have made it possible to reach consensuses on regional application.
Criteria admitting simple treatment (a) The sex variable does not require further discussion.(b) Other variables that are normally investigated in censuses are conceptually and
operationally agreed upon but require criteria to be defined for their disaggregation into categories of interest. Examples include variables such as age (age groups, child or childhood, adolescent, older adult), migratory status or condition, geographic location, employment status, or others that are defined by regional interest.
Criteria of greater conceptual and operational complexity(a) In the case of disability, there are recognized differences between countries, which calls for
greater discussion and exchange of experiences in order to reach a regional consensus. This requires a debate on the positions adopted by the Washington Group on Disability Statistics (of relative importance in the United Nations Statistical Commission) and the World Health Organization (WHO); and the discrepancies between them in the census data obtained from previous rounds, since the possibility of a regional view on measuring the phenomenon in question depends on this. It was also considered important to consult civil society, not only to define the contents of the census form but also to raise awareness on identification of the disabled population in the census process.
(b) The identification of indigenous and Afrodescendent peoples also enjoys a broad degree of conceptual consensus, with self-identification being the criterion agreed upon for definition and quantification in censuses and other data sources (Del Popolo and Schkolnik, 2013). For indigenous peoples, there is greater evidence of their inclusion in recent censuses, even though the mode of capture has been varied (in households, through individuals, inquiring about the language spoken, etc.). Inclusion of Afrodescendent groups in the census is more recent, and new consensuses are still required, although national realities are different (Brazil, for example, has enquired about race in several censuses in the past, while in other countries this question may not be feasible).
(c) Lastly, another complex criterion that is not treated uniformly is poverty. Although some countries have had varying degrees of success in measuring poverty through income as reported in censuses, the working groups recommend that income-based measurement should be improved upon. In the SDG and MCPD documents, phenomena of a similar or linked nature are referred to differently: poverty, social vulnerability, unmet basic needs, socioeconomic level, inequality, inequity, regional poverty, multidimensional poverty, to name but a few. Each of these concepts has different underlying definitions, as well as methodological approaches to their measurement of a direct or indirect, simple or multivariate nature. These must be brought to the table to reach a consensus that will enable comparisons to be made between countries in time and space. As regards
33 Since most censuses in the region do not measure income, the concept of poverty would be defined by other dimensions associated with it.
ECLAC - Population and Development series No. 120 The 2020 census round: challenges of the 2030 Agenda...30
including questions on income in the census, varying results have been observed both in terms of quality and in the analyses that can be derived from them. Accordingly, the inclusion of income variables in census questionnaires is not recommended unless there is no other specialized data source available to capture this information and the country in question officially requires it. Nonetheless, all possible safeguards should be adopted to ensure the measurement is performed properly.
C. Relationship with other data sources
The topics discussed above beg the question of the relationship with other data sources, which was also reviewed in the seminar. In fact, the foregoing points invite discussion on the consensuses to be reached on how the different data sources are related, which sometimes depends on the agency that is responsible for conducting the census.
1. A first issue is consensus on the years in which the censuses are actually carried out. The proposal of the two initiatives (SDG and MCPD) for the definition of baselines and monitoring of the trend of the indicators between 2020 and 2030 has a special significance for the 2020 round of population censuses, as discussed above. In fact, it provides an almost unique opportunity, compared to past initiatives such as the Millennium Development Goals, since the census source can provide data both for the baseline of the defined indicators (required for policy formulation) and for their evaluation in 2030, the year for which the targets were set.
Efforts should be made to agree with those responsible for the different surveys (continuous household surveys, living conditions surveys, MICS, DHS and others that may be adopted in the period) on the substantive issues mentioned above, so that all can contribute to defining a baseline and monitoring historical series between 2020 and 2030.
In this connection, there is an advantage in having a baseline obtained from the census for the highest levels of disaggregation and the same baseline for the surveys. In the first case, comparability between the next census and the 2030 round can be guaranteed. In the second case, conceptual and operational harmonization between sources can be achieved at the start of the period; and the evolution of the indicators in the intercensal periods can be monitored —for example, measuring poverty, the use of computer technology or child labour in the same way in all sources from the base year in a series.
Obviously, surveys are appropriate for expanding the information on complex phenomena and exploring details that cannot be measured in the censuses. Although these sources allow disaggregated information to be obtained only to the extent that levels of representativeness permit, in most cases a basic characterization is possible to formulate and adjust policies in the period of interest.
2. Another issue to be reviewed concerns the relationship between the censuses and administrative records —not only for the joint self-evaluation of each source at the start of the period, but also to exploit the potential for providing substantive information to visualize the phenomena in the territory, through cartographic technology. There is no doubting the traditional importance of vital statistics as a basic source for studying demographic issues and health phenomena that have been included as targets (infant, maternal and adult mortality from different causes), with which the censuses have a historical relationship.
The relationship between the censuses and other records should be made the most of. Examples include the records of firms that provide public services such as transportation, health, education, communications and energy, to mention a few, which can provide basic data for georeferencing in relation to the housing and population data provided by the census.
ECLAC - Population and Development series No. 120 The 2020 census round: challenges of the 2030 Agenda... 31
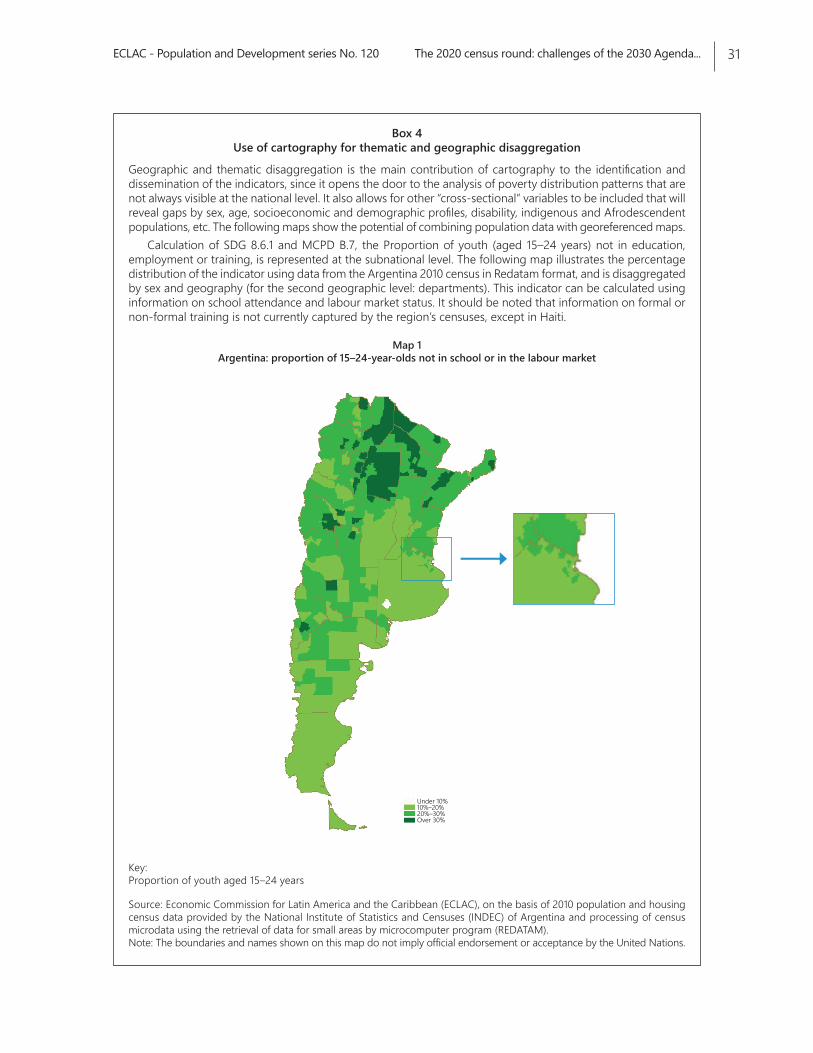
Box 4 Use of cartography for thematic and geographic disaggregation
Geographic and thematic disaggregation is the main contribution of cartography to the identification and dissemination of the indicators, since it opens the door to the analysis of poverty distribution patterns that are not always visible at the national level. It also allows for other “cross-sectional” variables to be included that will reveal gaps by sex, age, socioeconomic and demographic profiles, disability, indigenous and Afrodescendent populations, etc. The following maps show the potential of combining population data with georeferenced maps.
Calculation of SDG 8.6.1 and MCPD B.7, the Proportion of youth (aged 15–24 years) not in education, employment or training, is represented at the subnational level. The following map illustrates the percentage distribution of the indicator using data from the Argentina 2010 census in Redatam format, and is disaggregated by sex and geography (for the second geographic level: departments). This indicator can be calculated using information on school attendance and labour market status. It should be noted that information on formal or non-formal training is not currently captured by the region’s censuses, except in Haiti.
Map 1 Argentina: proportion of 15–24-year-olds not in school or in the labour market
Under 10%10%–20%20%–30%Over 30%
Key:Proportion of youth aged 15–24 years
Source: Economic Commission for Latin America and the Caribbean (ECLAC), on the basis of 2010 population and housing census data provided by the National Institute of Statistics and Censuses (INDEC) of Argentina and processing of census microdata using the retrieval of data for small areas by microcomputer program (REDATAM). Note: The boundaries and names shown on this map do not imply official endorsement or acceptance by the United Nations.
ECLAC - Population and Development series No. 120 The 2020 census round: challenges of the 2030 Agenda...32
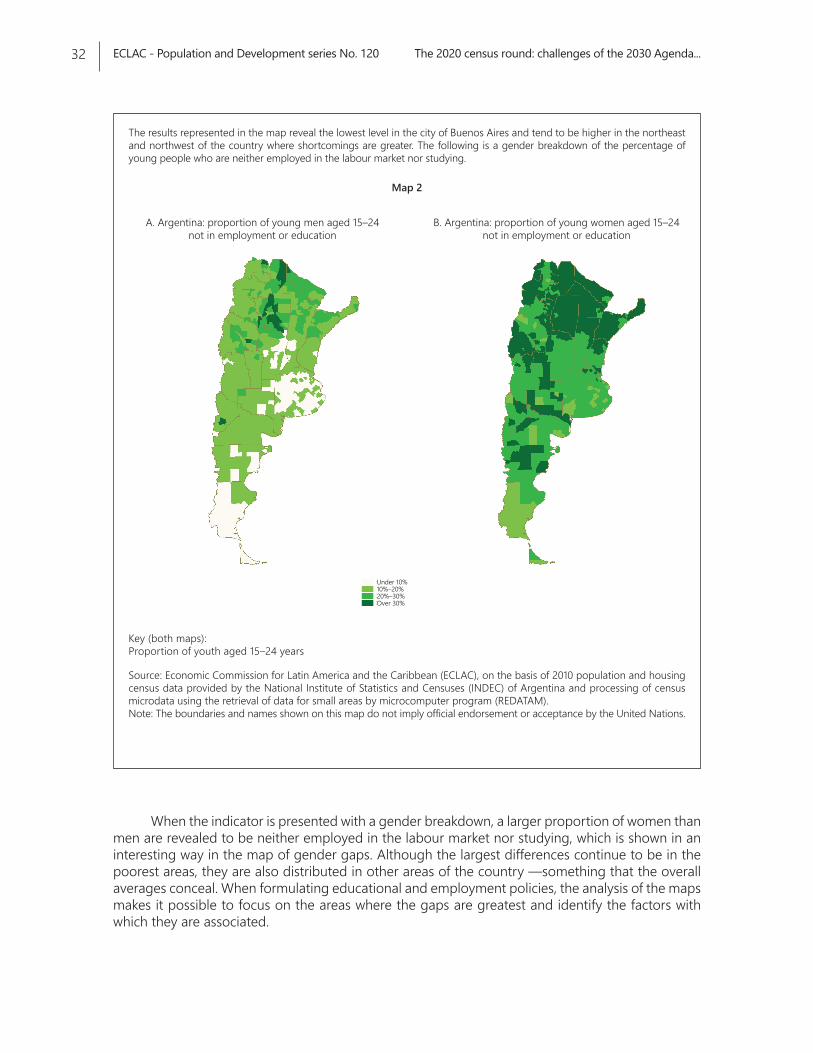
The results represented in the map reveal the lowest level in the city of Buenos Aires and tend to be higher in the northeast and northwest of the country where shortcomings are greater. The following is a gender breakdown of the percentage of young people who are neither employed in the labour market nor studying.
Map 2
A. Argentina: proportion of young men aged 15–24not in employment or education
B. Argentina: proportion of young women aged 15–24not in employment or education
Under 10%10%–20%20%–30%Over 30%
Key (both maps):Proportion of youth aged 15–24 years
Source: Economic Commission for Latin America and the Caribbean (ECLAC), on the basis of 2010 population and housing census data provided by the National Institute of Statistics and Censuses (INDEC) of Argentina and processing of census microdata using the retrieval of data for small areas by microcomputer program (REDATAM). Note: The boundaries and names shown on this map do not imply official endorsement or acceptance by the United Nations.
When the indicator is presented with a gender breakdown, a larger proportion of women than men are revealed to be neither employed in the labour market nor studying, which is shown in an interesting way in the map of gender gaps. Although the largest differences continue to be in the poorest areas, they are also distributed in other areas of the country —something that the overall averages conceal. When formulating educational and employment policies, the analysis of the maps makes it possible to focus on the areas where the gaps are greatest and identify the factors with which they are associated.
ECLAC - Population and Development series No. 120 The 2020 census round: challenges of the 2030 Agenda... 33
V. General conclusions
The censuses will make it possible to construct direct or complementary indicators for the list defined for the 2030 Agenda (SDGs) and MCPD; and, owing to regional heterogeneity, in some countries they will be the only available source until survey systems and, especially, continuous records are strengthened. This will be the case for some mortality and fertility indicators, for example.
It is also possible to distinguish between indicators on which a consensus can be reached for them to be calculated by all countries, and others that are only recommended for countries that do not have well-functioning continuous records, or do not have special short- and medium-term surveys.
It was also noted that censuses offer the comparative advantage of making it possible to obtain the disaggregations specified in SDG 17.18 for as many indicators as possible, particularly for migratory status, indigenous peoples, Afrodescendent populations, and persons with disabilities. Moreover, for some topics where the information may come from records or surveys, it would be convenient to use the census as a source for making the disaggregations needed for certain age ranges, territories, or special groups (disability). It would also make it possible to define baselines that provide the updated sample framework for designing household surveys to track the 2030 Agenda. In practice, these will provide the denominators for many of the indicators.
It will also be necessary to more precisely specify the efforts to be considered in preparing the next censuses, to ensure their feasibility and maintain the quality of the data to be collected, so as to have a set of regionally comparable indicators. The definition of more structural versus more short-term indicators may be one of the guiding elements in this task. In short, it is not a question of overloading the censuses, but rather to seek their optimization and strike that highly desired and delicate balance in the art of taking the pulse of population behaviour.
The review of the 54 indicators proposed on the basis of the national contributions and experiences presented during the seminar revealed the need to persevere with the process of conceptual harmonization, and cartographic and technological improvement; and to meet the challenges involved in integrating the census with other data sources. In doing so, the varied strengths of the different countries in the region need to be considered.
ECLAC - Population and Development series No. 120 The 2020 census round: challenges of the 2030 Agenda...34
A final thought deserves to be made explicit. The processes of consolidating the initiatives (SDG and MCPD) have a different type of dynamic than that of planning, implementation, processing and dissemination of the census data and the indicators derived from them. As noted above, the pre-census stages are already scheduled in almost all of the region’s countries; and in some cases the censuses are now imminent. Thus, the idea behind preparing the document and discussing it at the seminar was precisely to ensure that no census is “left behind”; hence the urgent need to forge consensuses as soon as possible.
ECLAC - Population and Development series No. 120 The 2020 census round: challenges of the 2030 Agenda... 35
Bibliography
Alkire, S. (n/d), “ Iniciativa de Desarrollo Humano y Reducción de la Pobreza”, Oxford, Oxford Poverty and Human Development Initiative [online] https://revistas.udea.edu.co/index.php/ceo/article/download/7045/6461/.
Beccaria, L. (2010), “Enfoque de derechos y pobreza multidimensional”, document presented at the international seminar Multidimensional Poverty Measurement in Latin America, Santiago, Economic Commission for Latin America and the Caribbean (ECLAC)/Ministry of Planning and Cooperation/Foundation for Overcoming Poverty/Oxford Poverty and Human Development Initiative, 13–14 May.
Boltvinik, J. (2013) “Multidimensional measurement of poverty: Latin America from pioneer to laggard”, Revista Sociedad y Equidad, No. 5, Santiago, University of Chile, January [online] https://sye.uchile.cl/index.php/RSE/article/view/26337/27840.
Bravo, J. (2001), “Estimaciones de ingreso y pobreza para áreas geográficas menores: avances recientes en América Latina y el Caribe”, Notas de Población, vol. 28, No. 71 (LC/G.2101-P), Santiago, Economic Commission for Latin America and the Caribbean (ECLAC), March.
CONEVAL (National Council for the Evaluation of Social Development Policy) (2010), Metodologia para la medición multidimensional de la pobreza en México, Mexico City, November.
Del Popolo, F. and S. Schkolnik (2013), “Pueblos indígenas y afrodescendientes en los censos de población y vivienda de América Latina: avances y desafíos en el derecho a la información”, Notas de Población, vol. 40, No. 97 (LC/G.2598-P), Santiago, Economic Commission for Latin America and the Caribbean (ECLAC), January.
ECLAC (Economic Commission for Latin America and the Caribbean) (2017), “Summary of the Chair of the Forum of the Countries of Latin America and the Caribbean on Sustainable Development”, 28 April [online] https://foroalc2030.cepal.org/2017/sites/default/files/17-00420_-_fds.1_resumen_de_la_presidencia_del_foro_ing.pdf.
(2016a), Report of the second session of the Regional Conference on Population and Development in Latin America and the Caribbean. Population dynamics as an axis of sustainable development: the Montevideo Consensus as a tool for reducing inequality in the framework of human rights (LC/G.2678), Santiago, March.
(2016b), “Resolutions adopted by the Economic Commission for Latin America and the Caribbean at its thirty-sixth session”, Santiago, June [online] http://repositorio.cepal.org/bitstream/handle/11362/40178/S1600569_es.pdf?sequence=1&isAllowed=y [accessed in August 2017].
ECLAC - Population and Development series No. 120 The 2020 census round: challenges of the 2030 Agenda...36
(2016c), Report on the workshop to review progress in the preparation of a proposal of indicators for the regional monitoring of the Montevideo Consensus on Population and Development (DDR/1 (MDP.3)), Santiago, September.
(2016d), Progress report of the ad hoc working group for the preparation of a proposal on the indicators for regional follow-up of the Montevideo Consensus on Population and Development (LC/L.4201(MDP.3/3), Santiago.
(2016e), Report of the fifteenth meeting of the Executive Committee of the Statistical Conference of the Americas of the Economic Commission for Latin America and the Caribbean (LC/L.4235), Santiago.
(2016f), “Los censos de la ronda 2020: potencialidades y desafíos frente a los Objetivos de Desarrollo Sostenible y al Consenso de Montevideo en el marco de la Agenda 2030” [online] https://www.cepal.org/en/node/39482 [accessed in July 2017].
(2015a), Operational guide for implementation and follow-up of the Montevideo Consensus on Population and Development (LC/L.4061 CRPD.2/3), Santiago, September.
(2015b), Report of the first meeting of the Presiding Officers of the Regional Conference on Population and Development in Latin America and the Caribbean (LC/L.3990), Santiago, April.
(2014), Social Panorama of Latin America 2014 (LC/G.2635-P), Santiago, December. (2013a), “Principales cambios en las boletas de los censos latinoamericanos de las décadas de
1990, 2000 y 2010”, Manuales series, No. 80 (LC/L.3734), Santiago, November. (2013b), Montevideo Consensus on Population and Development (LC/L.3697), Santiago. (2012), “Code of Good Practice in Statistics for Latin America and the Caribbean (November
2011)”, Santiago, January [online] https://repositorio.cepal.org/bitstream/handle/11362/16423/FILE_148024_en.pdf?sequence=1&isAllowed=y.
(2011a), “Los censos de 2010 y las condiciones de vida: informe del seminario-taller”, Seminars and Conferences series, No. 60 (LC/L.3282-P), Santiago, January.
(2011b), “Recomendaciones para los censos de la década de 2010 en América Latina”, Manuales series, No. 72 (LC/L.3364), Santiago, August.
(2009), “Censos 2010 y la inclusión del enfoque étnico: hacia una construcción participativa con pueblos indígenas y afrodescendientes de América Latina”, Seminars and Conferences series, No. 57 (LC/L.3095-P), Santiago, September.
(2007), “Potencialidades y aplicaciones de los datos censales: una contribución a la explotación del Censo de Población y Vivienda de Nicaragua 2005”, Manuales series, No. 56 (LC/L.2786-P), Santiago.
ECLAC/OSILAC (Economic Commission for Latin America and the Caribbean/Observatory for the Information Society in Latin America and the Caribbean) (2010), “Compendio de prácticas sobre implementación de preguntas de TIC en encuestas de hogares y en encuestas de empresas en América Latina y el Caribe: revisión 2010”, Project Documents, No. 340 (LC/W.340), Santiago, September.
ECOSOC (Economic and Social Council) (2017), “Statistical Commission. Report on the forty-eighth session (7-10 March 2017)”, Official Records 2017, Supplement, No. 4 (E/2017/24-E/CN.3/2017/35), New York.
INE (National Institute of Statistics) (2010), “Conceptos censales básicos y armonización de encuestas de hogares”, Santiago, August [online] http://studylib.es/doc/4705396/conceptos-censales-b%C3%A1sicos-y-armonizaci%C3%B3n-de-encuestas-de [accessed in July 2017].
ITU (International Telecommunication Union) (2010), Core ICT Indicators 2010, Geneva. (2009), Manual for Measuring ICT Access and Use by Households and Individuals, Geneva. Molinatti, F. (2016), “Potencialidades de los censos de población y complementariedad con otras fuentes
de información para la evaluación de resultados de políticas habitacionales”, Notas de Población, vol. 43, No. 102 (LC/G.2673-P), Santiago, Economic Commission for Latin America and the Caribbean (ECLAC), June.
Nathan, M. (2015), “La creciente heterogeneidad en la edad al primer hijo en el Uruguay: un análisis de las cohortes de 1951 a 1990”, Notas de Población, vol. 42, No. 100 (LC/G.2640-P), Santiago, Economic Commission for Latin America and the Caribbean (ECLAC), June.
Quiroga, R., P. Stockins and I. Azócar (2010) “Vacíos y discrepancias estadísticas en los indicadores ODM: hacia una estrategia regional de conciliación estadística para América Latina y el Caribe”, Estudios Estadisticos y Prospectivos, No. 70 (LC/L.3176-P), Santiago, Economic Commission for Latin America and the Caribbean (ECLAC), April.
ECLAC - Population and Development series No. 120 The 2020 census round: challenges of the 2030 Agenda... 37
Rico, M. N. and E. Espíndola (2010), “Pobreza infantil en América Latina y el Caribe: el enfoque de las privaciones multiples”, document presented at the international seminar Multidimensional Poverty Measurement in Latin America, Santiago, Economic Commission for Latin America and the Caribbean (ECLAC)/Ministry of Planning and Cooperation/Foundation for Overcoming Poverty/Oxford Poverty and Human Development Initiative, 13-14 May.
Rodríguez Vignoli, J. (2014), “La reproducción en la adolescencia y sus desigualdades en América Latina: introducción al análisis demográfico, con énfasis en el uso de microdatos censales de la ronda de 2010”, Project Documents (LC/W.605), Santiago, Economic Commission for Latin America and the Caribbean (ECLAC), June.
Ruiz, M., A. Silva and C. Villarroel (2016), “Encuesta sobre estado de avance de los censos de 2020 e identificación de las necesidades nacionales. Informe final de resultados”, Santiago, Economic Commission for Latin America and the Caribbean (ECLAC) [online] http://celade.cepal.org/censosinfo/Documentos/INFORME_CENSOS_RONDA_2020_LAyCARIBE.pdf [accessed in August 2017].
Ruiz-Tagle, J. and K. Sehnbruch (2010), “The quality of employment: a missing link in development strategies? The example of the Chilean labour market”, presentation at the seminar “Construyendo los Pilares de la Política Nacional de Empleo”, Ministry of Labour of Chile, Santiago, 6 January.
UNCTAD (United Nations Conference on Trade and Development) (2009), Manual for the Production of Statistics on the Information Economy. Revised Edition (UNCTAD/SDTE/ECB/2007/2/REV.1), New York/Geneva.
UNFPA (United Nations Population Fund) (2016), Mapa de embarazos de niñas y adolescentes en El Salvador 2015, El Salvador, July.
United Nations (2016a), “Provisional proposed tiers for global SDG indicators as of March 24, 2016” [online] https://unstats.un.org/sdgs/files/meetings/iaeg-sdgs-meeting-03/Provisional-Proposed-Tiers-for-SDG-Indicators-24-03-16.pdf [accessed in August 2017].
(2016b), “Tier classification for global SDG indicators 21 December 2016” [online] https://unstats.un.org/sdgs/files/meetings/iaeg-sdgs-meeting-04/Tier%20Classification%20of%20SDG%20Indicators_21%20Dec%20for%20website.pdf [accessed in August 2017].
(2015), Transforming our world: the 2030 Agenda for Sustainable Development (A/RES/70/1), New York. (2014), The road to dignity by 2030: ending poverty, transforming all lives and protecting the
planet. Synthesis report of the Secretary-General on the post-2015 sustainable development agenda (A/69/7000), New York.
(2013), A new global partnership: eradicate poverty and transform economies through sustainable development. The report of the High-level Panel of Eminent Persons on the post-2015 development agenda, Nueva York.

ECLAC - Population and Development series No. 120 The 2020 census round: challenges of the 2030 Agenda... 39
Annexes
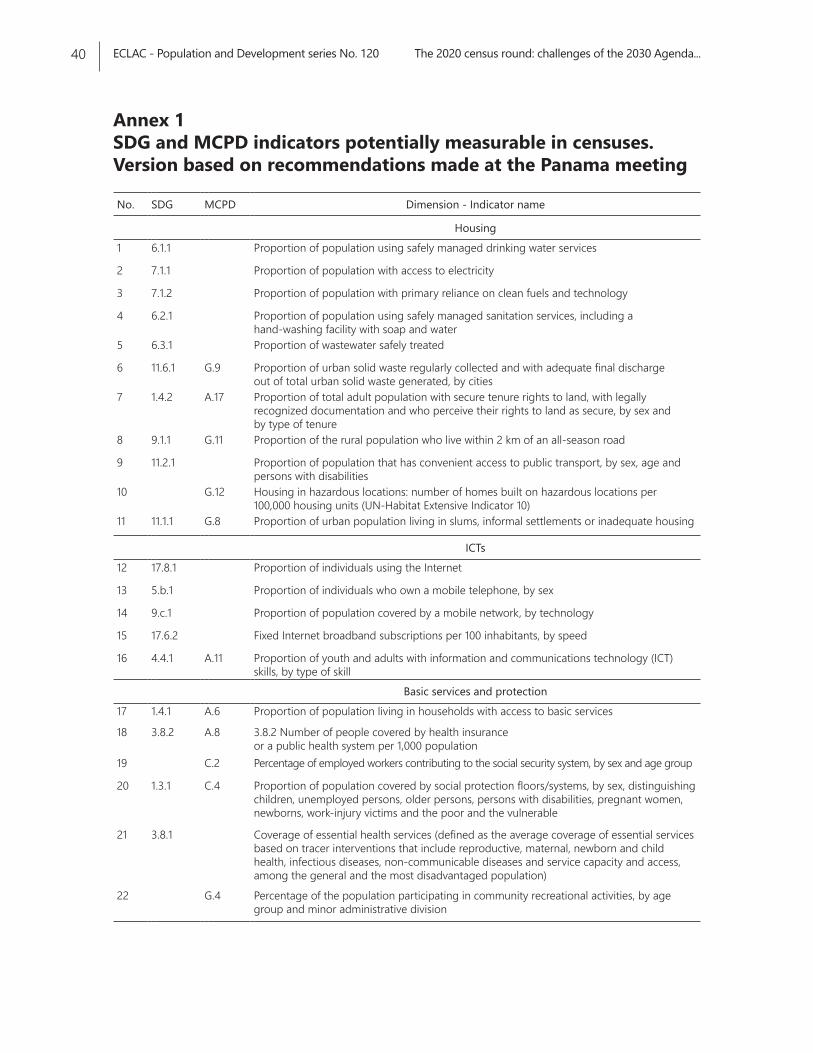
ECLAC - Population and Development series No. 120 The 2020 census round: challenges of the 2030 Agenda...40
Annex 1 SDG and MCPD indicators potentially measurable in censuses. Version based on recommendations made at the Panama meeting
No. SDG MCPD Dimension - Indicator name
Housing1 6.1.1 Proportion of population using safely managed drinking water services
2 7.1.1 Proportion of population with access to electricity
3 7.1.2 Proportion of population with primary reliance on clean fuels and technology
4 6.2.1 Proportion of population using safely managed sanitation services, including a hand-washing facility with soap and water
5 6.3.1 Proportion of wastewater safely treated
6 11.6.1 G.9 Proportion of urban solid waste regularly collected and with adequate final discharge out of total urban solid waste generated, by cities
7 1.4.2 A.17 Proportion of total adult population with secure tenure rights to land, with legally recognized documentation and who perceive their rights to land as secure, by sex and by type of tenure
8 9.1.1 G.11 Proportion of the rural population who live within 2 km of an all-season road
9 11.2.1 Proportion of population that has convenient access to public transport, by sex, age and persons with disabilities
10 G.12 Housing in hazardous locations: number of homes built on hazardous locations per 100,000 housing units (UN-Habitat Extensive Indicator 10)
11 11.1.1 G.8 Proportion of urban population living in slums, informal settlements or inadequate housing
ICTs12 17.8.1 Proportion of individuals using the Internet
13 5.b.1 Proportion of individuals who own a mobile telephone, by sex
14 9.c.1 Proportion of population covered by a mobile network, by technology
15 17.6.2 Fixed Internet broadband subscriptions per 100 inhabitants, by speed
16 4.4.1 A.11 Proportion of youth and adults with information and communications technology (ICT) skills, by type of skill
Basic services and protection17 1.4.1 A.6 Proportion of population living in households with access to basic services
18 3.8.2 A.8 3.8.2 Number of people covered by health insuranceor a public health system per 1,000 population
19 C.2 Percentage of employed workers contributing to the social security system, by sex and age group
20 1.3.1 C.4 Proportion of population covered by social protection floors/systems, by sex, distinguishing children, unemployed persons, older persons, persons with disabilities, pregnant women, newborns, work-injury victims and the poor and the vulnerable
21 3.8.1 Coverage of essential health services (defined as the average coverage of essential services based on tracer interventions that include reproductive, maternal, newborn and child health, infectious diseases, non-communicable diseases and service capacity and access, among the general and the most disadvantaged population)
22 G.4 Percentage of the population participating in community recreational activities, by age group and minor administrative division
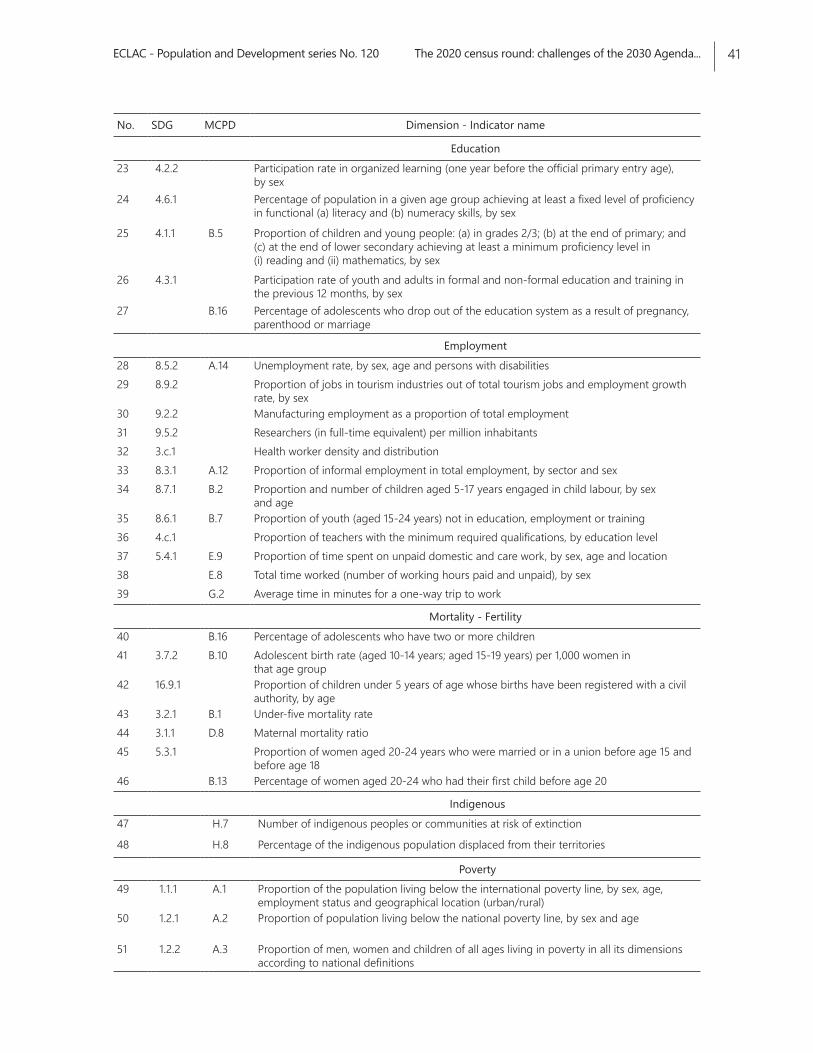
ECLAC - Population and Development series No. 120 The 2020 census round: challenges of the 2030 Agenda... 41
No. SDG MCPD Dimension - Indicator name
Education23 4.2.2 Participation rate in organized learning (one year before the official primary entry age),
by sex24 4.6.1 Percentage of population in a given age group achieving at least a fixed level of proficiency
in functional (a) literacy and (b) numeracy skills, by sex
25 4.1.1 B.5 Proportion of children and young people: (a) in grades 2/3; (b) at the end of primary; and (c) at the end of lower secondary achieving at least a minimum proficiency level in (i) reading and (ii) mathematics, by sex
26 4.3.1 Participation rate of youth and adults in formal and non-formal education and training in the previous 12 months, by sex
27 B.16 Percentage of adolescents who drop out of the education system as a result of pregnancy, parenthood or marriage
Employment28 8.5.2 A.14 Unemployment rate, by sex, age and persons with disabilities29 8.9.2 Proportion of jobs in tourism industries out of total tourism jobs and employment growth
rate, by sex30 9.2.2 Manufacturing employment as a proportion of total employment31 9.5.2 Researchers (in full-time equivalent) per million inhabitants32 3.c.1 Health worker density and distribution33 8.3.1 A.12 Proportion of informal employment in total employment, by sector and sex34 8.7.1 B.2 Proportion and number of children aged 5-17 years engaged in child labour, by sex
and age35 8.6.1 B.7 Proportion of youth (aged 15-24 years) not in education, employment or training36 4.c.1 Proportion of teachers with the minimum required qualifications, by education level37 5.4.1 E.9 Proportion of time spent on unpaid domestic and care work, by sex, age and location38 E.8 Total time worked (number of working hours paid and unpaid), by sex39 G.2 Average time in minutes for a one-way trip to work
Mortality - Fertility40 B.16 Percentage of adolescents who have two or more children 41 3.7.2 B.10 Adolescent birth rate (aged 10-14 years; aged 15-19 years) per 1,000 women in
that age group42 16.9.1 Proportion of children under 5 years of age whose births have been registered with a civil
authority, by age43 3.2.1 B.1 Under-five mortality rate44 3.1.1 D.8 Maternal mortality ratio45 5.3.1 Proportion of women aged 20-24 years who were married or in a union before age 15 and
before age 1846 B.13 Percentage of women aged 20-24 who had their first child before age 20
Indigenous47 H.7 Number of indigenous peoples or communities at risk of extinction
48 H.8 Percentage of the indigenous population displaced from their territories
Poverty49 1.1.1 A.1 Proportion of the population living below the international poverty line, by sex, age,
employment status and geographical location (urban/rural)50 1.2.1 A.2 Proportion of population living below the national poverty line, by sex and age
51 1.2.2 A.3 Proportion of men, women and children of all ages living in poverty in all its dimensions according to national definitions
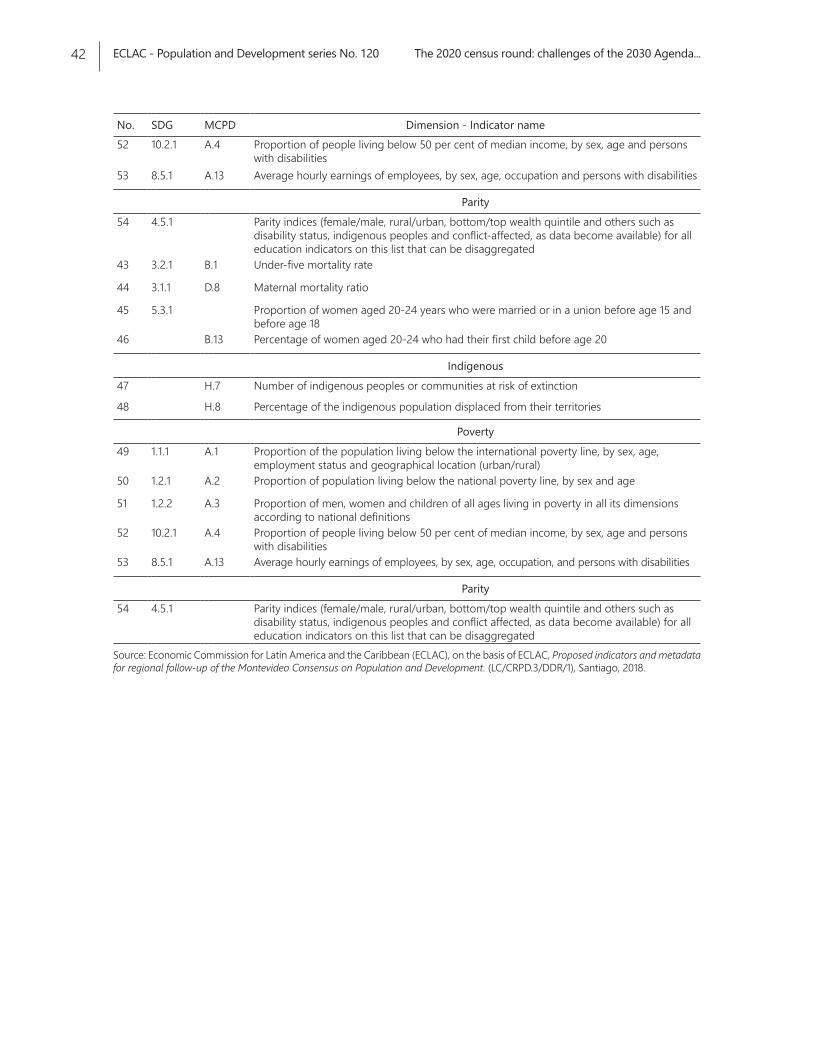
ECLAC - Population and Development series No. 120 The 2020 census round: challenges of the 2030 Agenda...42
No. SDG MCPD Dimension - Indicator name52 10.2.1 A.4 Proportion of people living below 50 per cent of median income, by sex, age and persons
with disabilities53 8.5.1 A.13 Average hourly earnings of employees, by sex, age, occupation and persons with disabilities
Parity54 4.5.1 Parity indices (female/male, rural/urban, bottom/top wealth quintile and others such as
disability status, indigenous peoples and conflict-affected, as data become available) for all education indicators on this list that can be disaggregated
43 3.2.1 B.1 Under-five mortality rate
44 3.1.1 D.8 Maternal mortality ratio
45 5.3.1 Proportion of women aged 20-24 years who were married or in a union before age 15 and before age 18
46 B.13 Percentage of women aged 20-24 who had their first child before age 20
Indigenous47 H.7 Number of indigenous peoples or communities at risk of extinction
48 H.8 Percentage of the indigenous population displaced from their territories
Poverty49 1.1.1 A.1 Proportion of the population living below the international poverty line, by sex, age,
employment status and geographical location (urban/rural)50 1.2.1 A.2 Proportion of population living below the national poverty line, by sex and age
51 1.2.2 A.3 Proportion of men, women and children of all ages living in poverty in all its dimensions according to national definitions
52 10.2.1 A.4 Proportion of people living below 50 per cent of median income, by sex, age and persons with disabilities
53 8.5.1 A.13 Average hourly earnings of employees, by sex, age, occupation, and persons with disabilities
Parity54 4.5.1 Parity indices (female/male, rural/urban, bottom/top wealth quintile and others such as
disability status, indigenous peoples and conflict affected, as data become available) for all education indicators on this list that can be disaggregated
Source: Economic Commission for Latin America and the Caribbean (ECLAC), on the basis of ECLAC, Proposed indicators and metadata for regional follow-up of the Montevideo Consensus on Population and Development. (LC/CRPD.3/DDR/1), Santiago, 2018.
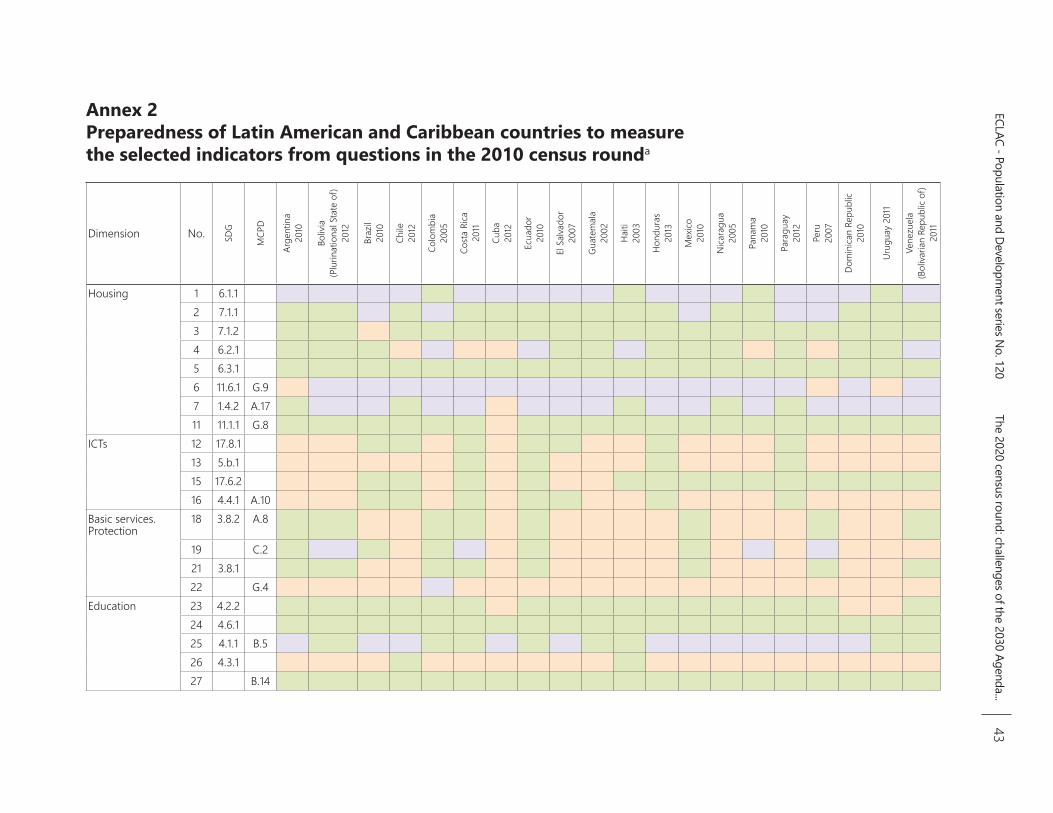
ECLAC - Population and Development series N
o. 120 The 2020 census round: challenges of the 2030 Agenda...
43
Annex 2 Preparedness of Latin American and Caribbean countries to measure the selected indicators from questions in the 2010 census rounda
Dimension No. SDG
MCP
D
Arge
ntin
a 20
10
Boliv
ia
(Plu
rinat
iona
l Sta
te o
f) 20
12
Braz
il 20
10
Chile
20
12
Colo
mbi
a
2005
Cost
a Ri
ca
2011
Cuba
20
12
Ecua
dor
2010
El S
alva
dor
2007
Guat
emal
a 20
02
Haiti
2003
Hond
uras
20
13
Mex
ico
2010
Nica
ragu
a 20
05
Pana
ma
2010
Para
guay
20
12
Peru
20
07
Dom
inica
n Re
publ
ic 20
10
Urug
uay
2011
Vene
zuel
a (B
oliva
rian
Repu
blic
of)
2011
Housing 1 6.1.12 7.1.13 7.1.24 6.2.15 6.3.16 11.6.1 G.97 1.4.2 A.1711 11.1.1 G.8
ICTs 12 17.8.113 5.b.115 17.6.216 4.4.1 A.10
Basic services. Protection
18 3.8.2 A.8
19 C.221 3.8.122 G.4
Education 23 4.2.224 4.6.125 4.1.1 B.526 4.3.127 B.14
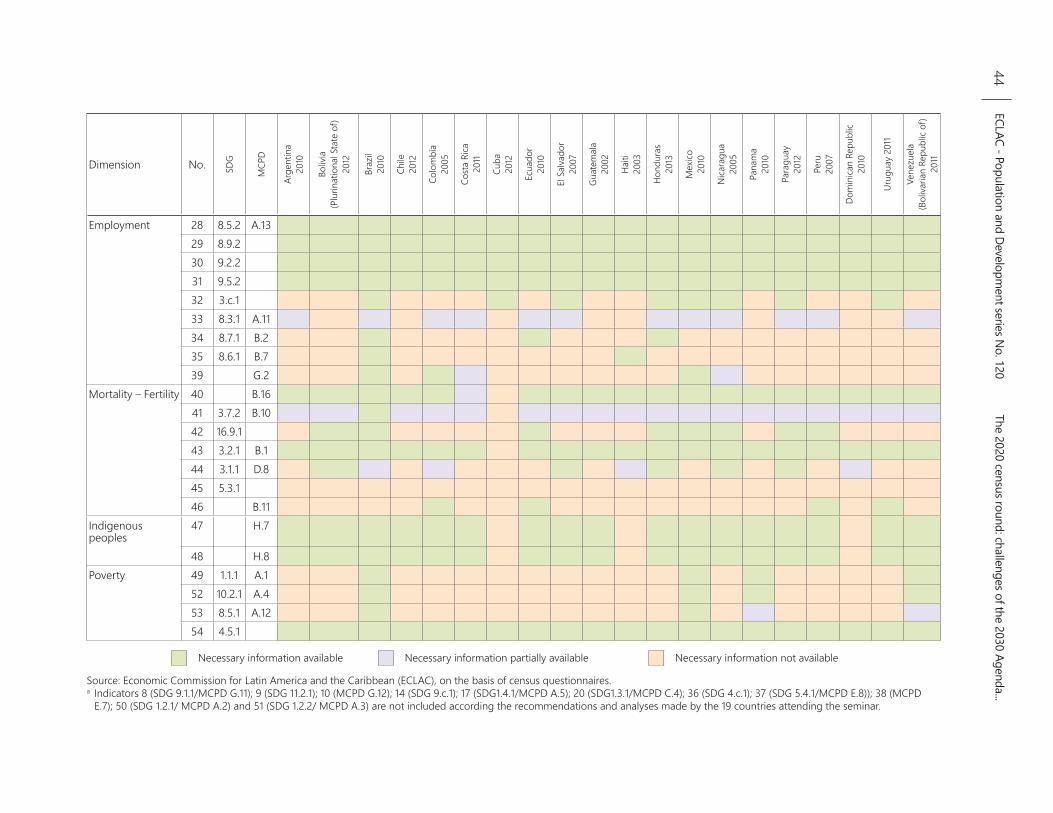
ECLAC - Population and Development series N
o. 120 The 2020 census round: challenges of the 2030 Agenda...
44
Dimension No. SDG
MCP
D
Arge
ntin
a 20
10
Boliv
ia
(Plu
rinat
iona
l Sta
te o
f) 20
12
Braz
il 20
10
Chile
20
12
Colo
mbi
a
2005
Cost
a Ri
ca
2011
Cuba
20
12
Ecua
dor
2010
El S
alva
dor
2007
Guat
emal
a 20
02
Haiti
2003
Hond
uras
20
13
Mex
ico
2010
Nica
ragu
a 20
05
Pana
ma
2010
Para
guay
20
12
Peru
20
07
Dom
inica
n Re
publ
ic 20
10
Urug
uay
2011
Vene
zuel
a (B
oliva
rian
Repu
blic
of)
2011
Employment 28 8.5.2 A.1329 8.9.230 9.2.231 9.5.232 3.c.133 8.3.1 A.1134 8.7.1 B.235 8.6.1 B.739 G.2
Mortality – Fertility 40 B.1641 3.7.2 B.1042 16.9.143 3.2.1 B.144 3.1.1 D.845 5.3.146 B.11
Indigenous peoples
47 H.7
48 H.8Poverty 49 1.1.1 A.1
52 10.2.1 A.453 8.5.1 A.1254 4.5.1
Necessary information available Necessary information partially available Necessary information not available
Source: Economic Commission for Latin America and the Caribbean (ECLAC), on the basis of census questionnaires. a Indicators 8 (SDG 9.1.1/MCPD G.11); 9 (SDG 11.2.1); 10 (MCPD G.12); 14 (SDG 9.c.1); 17 (SDG1.4.1/MCPD A.5); 20 (SDG1.3.1/MCPD C.4); 36 (SDG 4.c.1); 37 (SDG 5.4.1/MCPD E.8)); 38 (MCPD
E.7); 50 (SDG 1.2.1/ MCPD A.2) and 51 (SDG 1.2.2/ MCPD A.3) are not included according the recommendations and analyses made by the 19 countries attending the seminar.
ECLAC - Population and Development series No. 120 The 2020 census round: challenges of the 2030 Agenda... 45
Annex 3 Indicator technical notes
Abbreviations used• SS Specialized surveys • HS Household surveys • AR Administrative records • QLS Quality-of-life surveys • MICS Multiple indicator cluster surveys• DHS Demographic and health surveys • UTS Use of time surveys• n/a Not applicable
Housing Indicators
No. 1
1. 2030 Agenda/MCPD indicatorSDG 6.1.1
Proportion of population using safely managed drinking water services.Technical definition of the indicator according to SDG metadata
“Improved” drinking water services mean that the water in question is free of faecal and chemical contamination. The WHO/UNICEF Joint Monitoring Programme for the Water Supply and Sanitation Sector (JMP) developed the concept of “improved” water sources as an indicator of “safe water,” and states that such sources (piped water into the dwelling, yard, or plot; public taps or standpipes; boreholes or tubewells; protected dug wells; protected springs; and rainwater) are likely to be protected from faecal and chemical contamination. This criterion has been used since 2000 to analyse progress made towards the Millennium Development Goal (MDG) target; and international consultations since 2011 have established consensus on the need to build on and address the shortcomings of this indicator; specifically, to address normative criteria of the human right to water including accessibility, availability and quality. For the past decade, JMP has estimated this indicator on the basis of statistical models that combine survey and census data.
For further information see United Nations, “Goal 6: Ensure availability and sustainable management of water and sanitation for all”, 2017 [online] http://unstats.un.org/sdgs/metadata/files/Metadata-06-01-01.pdf.
2. Calculation of the indicator from census dataScope and limitations for measurement
Extending the concept to include the dimensions of frequency and quality, in addition to accessibility, as proposed by JMP, reduces the capacity of the census to cover this indicator, at least from a regional perspective. In past censuses, some countries have included questions on the continuity of service (temporary availability) and storage. However, it is desirable to maintain the criteria of water access and provision, which are usually included in all censuses, as a proxy for access to drinking water (improved for JMP), rather than encouraging inclusion of the other two dimensions, thereby making a regional consensus possible. Obviously, incorporation of the
ECLAC - Population and Development series No. 120 The 2020 census round: challenges of the 2030 Agenda...46
other dimensions by some countries is respected. Nonetheless, these countries could document their experience for the information of the other countries and for possible future use.
To improve the wording of the question it would be important instead to discuss the possibility of using the concept of “water for drinking and cooking” instead of “water…” As most of the region’s countries do.
The information provided by the surveys on all the dimensions based on the rights approach would make it possible to measure this indicator as complementary but restricted to the areas and groups that the samples represent. Moreover, data from administrative records would permit a broader analysis of the situation by combining with census data in digital georeferencing contexts.Proposed alternative indicator
Proportion of population with access to water for eating and cooking piped into the dwelling.Operational definition for measurement
Numerator: Household population by access to water for drinking and cooking piped into the dwelling.
Denominator: Total household population.
Variable(s) needed to calculate the indicator1. Population in households with access to water (for drinking and cooking).2. Distribution of water piped into the dwelling.
Status of the countries in the 2010 census roundCountries that have the necessary information: 4 (CO-HA-PA-UY).Countries that have part of the necessary information:a 16 (AR-BO-BR-CH-CR-CU-EC-
SL-GU-HO-MX-N-PY-PE-DO-VE).Countries that do not have the necessary information: 0.
Recommendations made by the countries in the seminarThe seminar suggested enquiring whether access to water is “continuous”, because in some
countries it is not. Likewise, as regards water “storage”. Both questions refer to the considerations mentioned in the target on accessibility, availability and quality. It was also recommended to agree on the “type of source” categories and whether to use the term “improved” water or to include “water for drinking or cooking” in the wording of the question. The concept of “improved” is very abstract for a census question. Lastly, it is recognized that knowledge of the availability of piped water into dwellings is an approximation to the availability of drinking water.
Paraguay recommended reviewing a document on “sanitation” produced as a result of MDG monitoring.
3. Integration with other sourcesThe use of geographic information systems (GIS) with census data, in conjunction with data from
regulatory or service provider firms, can display the situation with a geographic and population scope. Other sources that can include information according to the metadata are the specialized surveys (SS) implemented by the regulatory authorities and the administrative records (AR) of provider firms.
Additionally, for intercensal monitoring, household surveys (HS), quality-of-life surveys (QLS) and multiple-indicator cluster surveys (MICS).a If the question were rephrased to cover water for drinking and cooking, all countries would be able to report this indicator.
ECLAC - Population and Development series No. 120 The 2020 census round: challenges of the 2030 Agenda... 47
No. 2
1. 2030 Agenda/MCPD indicatorSDG 7.1.1
Proportion of population with access to electricity.Technical definition of the indicator according to SDG metadata
Percentage of the total population with access to electricity The concept of access to electricity is limited to the household having an electrical connection, although it does not guarantee that the household has an adequate, quality and reliable energy supply that is affordable in terms of cost —dimensions that have been addressed in SDG7. There is a tested methodology known as the Multi-Tier Framework (MTF) for measuring energy access (World Bank), which is able to capture broader dimensions of service quality beyond energy access, through a more refined approach that explicitly considers the affordability and reliability of energy access. This methodology represents a consensus view among international agencies working in the field. A first Global Energy Access Survey using this methodology will report its initial results in early 2017. In addition, coordination with the World Bank’s Household Survey Technical Working Group is being developed to mainstream this methodology into the standardized design of household questionnaires, which will be applied every three years in all low-income countries between 2015 and 2030, as part of the broader SDG monitoring exercise.
For further information, see United Nations, “Goal 7: Ensure access to affordable, reliable, sustainable and modern energy for all”, 2020 [online] https://unstats.un.org/sdgs/metadata/files/Metadata-07-01-01.pdf. The SDG proposal uses triangulation of sources, basically the Demographic and Health Survey, (DHS): the Living Standards Measurement Survey (LSMS); multiple indicator cluster surveys (MICS); the World Health Survey (WHS)) and others developed and executed nationally, in order to provide a metabase of statistics on electricity access. The electrification database covers more than 180 countries spanning 1990-2012 and is regularly updated.
For further information, see World Bank/International Energy Agency (IEA), Sustainable Energy for All: Global Tracking Framework, Vienna, 2013, pp. 82-87 and 127-129, and Energy Sector Management Assistance Programme (ESMAP), “The Energy Progress Report”, 2020 [online] http://trackingenergy4all.worldbank.org.
2. Calculation of the indicator from census dataScope and limitations for measurement
Beyond the importance of surveys to account for a multidimensional phenomenon, population censuses usually enquire about the existence of electricity in the home, but also about the sources of supply —information that has been used historically to measure household access to electricity. It is therefore considered viable to use this information to obtain the alternative indicator. Some countries include questions on frequency of access. From a regional perspective, the task would be, firstly, to agree on the system of categories used by the countries to make it equivalent and comparable; and, secondly, to assess whether it is worthwhile adding other variables to the forms such as those related to frequency of access.Proposed alternative indicator
Proportion of population with access to electricity.Operational definition for measurement
Numerator: Population that uses electricity.Denominator: Total population.
ECLAC - Population and Development series No. 120 The 2020 census round: challenges of the 2030 Agenda...48
Variable(s) needed to calculate the indicator1. Population in households with access to electricity.2. Source of the electricity.
Status of the countries in the 2010 census roundCountries that have the necessary information: 15 (AR-BO-CH-CU-CR-EC-GU-SL-HA-
HN-NI-PY-RD-UY-VE).Countries that have part of the necessary information: 5 (BR-CO-MX-PA-PE).
Recommendations made by the countries in the seminarIn addition to agreeing with the technical notes, the seminar raised the possibility of
investigating other sources of energy, including solar panels. Some countries have very high coverage rates in terms of access to the service, so the relevance of investigating other sources in this context is not very clear.
3. Integration with other sourcesThe use of geographic information systems (GIS) with census data, in conjunction with
data from regulatory or service provider firms can display the situation with a geographic and population scope.
Other sources that can include information according to the metadata are the specialized surveys (SS) implemented by the regulatory authorities and the administrative records (AR) of provider firms.
Additionally, for intercensal monitoring, HS/QLS/MICS.
No. 3
1. 2030 Agenda/MCPD indicatorSDG 7.1.2
Proportion of population with primary reliance on clean fuels and technology.Technical definition of the indicator according to SDG metadata
Current global data collection focuses on the primary fuel used for cooking, categorized as solid or nonsolid fuels, where solid fuels are considered polluting and non-modern, while non-solid fuels are considered clean. This single measure captures a good part of the lack of access to clean cooking fuels, but fails to collect data on type of device or technology is used for cooking, and also fails to capture other polluting forms of energy use in the home such as those used for lighting and heating, which are SDG-recommended. The World Health Organization (WHO), in cooperation with the Bank and the Global Alliance for Clean Cookstoves, is leading the development of a methodology using a multi-level model based on available survey data (Demographic and Health Surveys (DHS), Living Standards Measurement System (LSMS), multi-indicator cluster surveys (MICS), World Health Survey (WHS), and censuses.
For further information, see United Nations, “Goal 7: Ensure access to affordable, reliable, sustainable and modern energy for all”, 2020 [online] http://unstats.un.org/sdgs/metadata/files/Metadata-07-01-02.pdf.
ECLAC - Population and Development series No. 120 The 2020 census round: challenges of the 2030 Agenda... 49
2. Calculation of the indicator from census dataScope and limitations for measurement
Censuses usually include the fuel used for cooking but not the type of cooker. In most countries, the categories used refer to the use of solid or non-solid (non-polluting) fuels in the sense mentioned in the SDG metadata. Aspects related to household heating and lighting are generally not included (although the latter is covered in the questions on access to electricity). While it is possible to include questions on the fuel used for heating and lighting in the next round, it is considered sufficient to maintain the usual questions, while perhaps discussing a more precise wording of the question and a broader fuel-category system.Proposed alternative indicator
Population in households that use clean (non-solid) fuels for cooking.Operational definition for measurement
Numerator: Population in households with access to clean (non-solid) fuel for cooking.Denominator: Total household population.
Variable(s) needed to calculate the indicator 1. Access to clean (non-solid) fuels for cooking.
Status of the countries in the 2010 census roundCountries that have the necessary information: 19 (AR-BO-CH-CO-CU-CR-EC-GU-SL-
HA-HN-MX-NI-PA-PY-PE-RD-UY-VE).Countries that do not have the necessary information: 1 (BR).
Recommendations made by the countries in the seminarThe importance of knowing whether a separate place exists for cooking was emphasized,
but it is not considered in the metadata.
3. Integration with other sourcesThe use of GIS with census data, in conjunction with data from regulatory or service provider
firms can display the situation with a geographic and population scope. Other sources that can include information according to the metadata are the specialized surveys (SS) implemented by the regulatory authorities and the administrative records (AR) of provider firms.
Additionally, for intercensal monitoring, HS/QLS/MICS.
No. 4
1. 2030 Agenda/MCPD indicatorSDG 6.2.1
Proportion of population using safely managed sanitation services, including a hand-washing facility with soap and water.Technical definition of the indicator according to SDG metadata
Access to water and sanitation are considered basic socioeconomic and health indicators; and as determinants of child survival, maternal and child health, family well-being and productivity.
ECLAC - Population and Development series No. 120 The 2020 census round: challenges of the 2030 Agenda...50
This indicator is currently being measured as the proportion of the population using a basic sanitation facility in the dwelling that is not shared with other households, and where excreta is safely disposed of in situ or treated off-site. The “improved” source is defined in the same way as is used to monitor MDGs, for example, flush or pour-flush toilets to sewer systems, septic tanks or pit latrines, ventilated improved pit latrines, pit latrines with a slab, and composting toilets. A population with a handwashing facility is defined as a population that has a device to contain, transport, or regulate the flow of water to facilitate handwashing with soap and water in the dwelling. It is an indicator that comes from MDG 7C which called for “sustainable access” to “basic sanitation”. The WHO/UNICEF Joint Monitoring Programme for Water Supply and Sanitation (JMP) developed the metric of use of “improved” sanitation facilities, which are likely to hygienically separate excreta from human contact. Starting in 2011, the aim was to address the shortcomings of the indicator by including normative criteria of the human right to water, including accessibility, acceptability and safety. In addition, safe management of faecal waste should be considered, since untreated wastewater discharges into the environment create hazards. Since 2017, data for the indicator have been obtained from global and regional estimates of safely managed sanitation services, using available survey and census data on the types of basic sanitation and their characteristics, as well as the presence of handwashing units; this information is combined with estimates of the proportion of faecal waste that is safely disposed of in situ or treated off-site.
For further information, see United Nations, “Goal 6: Ensure availability and sustainable management of water and sanitation for all”, 2017 [online] http://unstats.un.org/sdgs/metadata/files/Metadata-06-02-01.pdf.
2. Calculation of the indicator from census informationScope and limitations for measurement
The data for the indicator proposed by JMP are applicable in occasional but special household surveys such as those known globally (DHS, LSMS. MICS, etc.). In the case of censuses, questions on water and sanitation have been almost systematically and universally captured for decades, and are mostly formulated as appropriate for measuring access to “safe” excreta disposal services —not only the existence of flush toilets but also where human waste is drained. In this sense, it is viable to measure the indicator that shows amenities such as those proposed by the Sustainable Development Goals. The existence of a suitable place for handwashing is related to the existence and type of water supply inside the dwelling, which are also investigated in the census (and potentially used to measure indicators 6.1.1. and 6.2.1).Proposed alternative indicator
Population in dwellings with private bathrooms and toilets discharging to a sewer or septic tank (safely managed sanitation services).
Operational definition for measurementNumerator: Population in households with private bathrooms and toilets discharging to
a sewer or septic tank.Denominator: Total household population.
Variable(s) needed to calculate the indicator1. Household access to a bathroom with flush toilet discharging to a sewer or septic tank.2. Bathroom for exclusive use of the household.
ECLAC - Population and Development series No. 120 The 2020 census round: challenges of the 2030 Agenda... 51
Status of the countries in the 2010 census roundCountries that have the necessary information: 11 (AR-BO-BR-SL-GU-HO-MX-NI-PY-DO- UY).Countries that have part of the necessary information: 4 (CO-EC-HA- VE).Countries that do not have the necessary information:a 5 (CH-CR-CU-PA- PE).
Recommendations made by the countries in the seminarThe technical notes were recognized, and the usefulness of knowing whether the bathroom
is for the exclusive use of the household was emphasized. The existence of a bathroom with a toilet, which discharges into a sewer or septic tank, suggests that household members have a place to wash with soap and water.
3. Integration with other sourcesThe use of geographic information systems (GIS) with census data, in conjunction with
data from regulatory or service provider firms can display the situation with a geographic and population scope. Other sources that can include information according to the metadata are the specialized surveys (SS) implemented by the regulatory authorities and the administrative records (AR) of provider firms.
Additionally, for intercensal monitoring, HS/QLS/MICS.a Censuses that enquire into the household sanitation service with discharge to a sump or sewer are counted as not
capturing the information according to the required criteria.
No. 5
1. 2030 Agenda/MCPD indicatorSDG 6.3.1
Proportion of wastewater safely treated.Technical definition of the indicator according to SDG metadata
Proportion of wastewater generated by households and economic activities that is safely treated relative to total wastewater generated by households and economic activities.
For further information see https://unstats.un.org/sdgs/metadata/ and United Nations, “International recommendations for water statistics”, Statistical Papers, Series M, No. 91 (ST/ESA/STAT/SER.M/91), New York, 2012 [online] https://unstats.un.org/unsd/publication/seriesM/seriesm_91e.pdf and International Recommendations for Water Statistics (IRWS), at http://unstats.un.org/unsd/envaccounting/irws/ irwswebversion.pdf. The household share comes from the same indicator as 6.2.1.
For further information, see United Nations, “Goal 6: Ensure availability and sustainable management of water and sanitation for all”, 2020 [online] https://unstats.un.org/sdgs/metadata/files/Metadata-06-03-01.pdf.
2. Calculation of the indicator from census dataScope and limitations for measurement
This would be a complementary indicator to that defined by SDGs, which considers only the component related to discharge of the toilet to the sewer or septic tank by households or dwellings. However, this approach does not include other wastewater that may be generated in the household and discharged directly into sewerage systems.
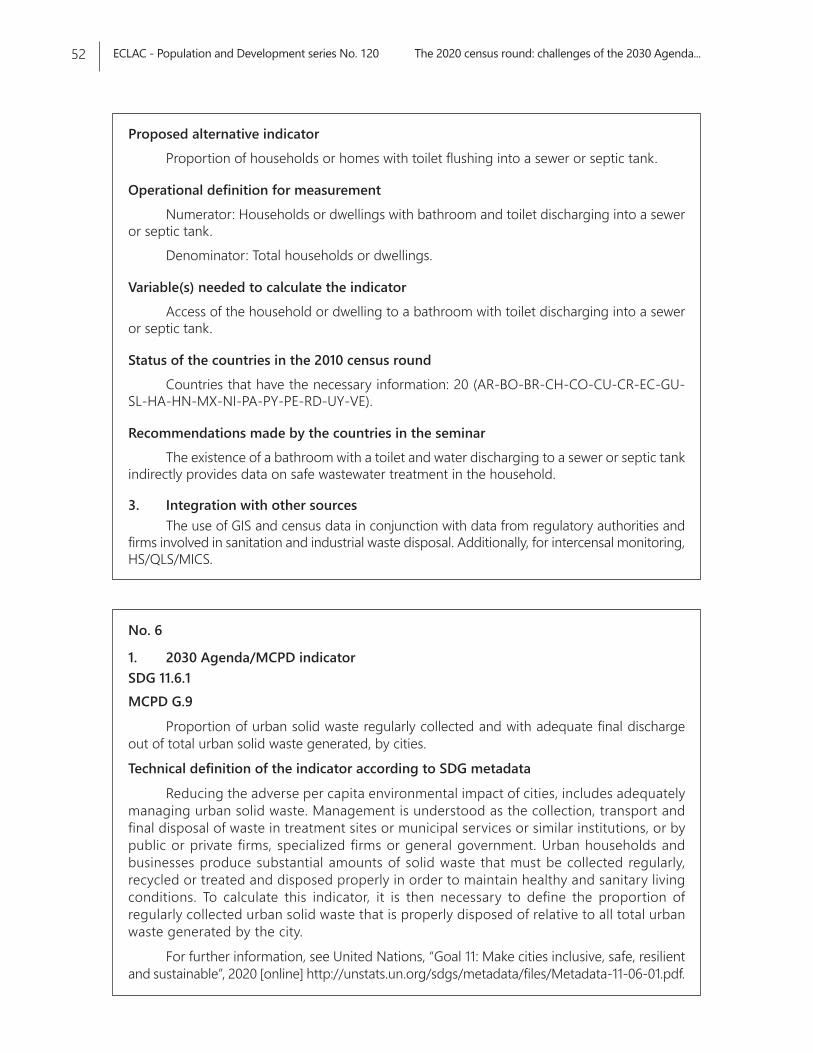
ECLAC - Population and Development series No. 120 The 2020 census round: challenges of the 2030 Agenda...52
Proposed alternative indicatorProportion of households or homes with toilet flushing into a sewer or septic tank.
Operational definition for measurement Numerator: Households or dwellings with bathroom and toilet discharging into a sewer
or septic tank.Denominator: Total households or dwellings.
Variable(s) needed to calculate the indicatorAccess of the household or dwelling to a bathroom with toilet discharging into a sewer
or septic tank.
Status of the countries in the 2010 census roundCountries that have the necessary information: 20 (AR-BO-BR-CH-CO-CU-CR-EC-GU-
SL-HA-HN-MX-NI-PA-PY-PE-RD-UY-VE).
Recommendations made by the countries in the seminarThe existence of a bathroom with a toilet and water discharging to a sewer or septic tank
indirectly provides data on safe wastewater treatment in the household.
3. Integration with other sourcesThe use of GIS and census data in conjunction with data from regulatory authorities and
firms involved in sanitation and industrial waste disposal. Additionally, for intercensal monitoring, HS/QLS/MICS.
No. 6
1. 2030 Agenda/MCPD indicatorSDG 11.6.1MCPD G.9
Proportion of urban solid waste regularly collected and with adequate final discharge out of total urban solid waste generated, by cities.
Technical definition of the indicator according to SDG metadata
Reducing the adverse per capita environmental impact of cities, includes adequately managing urban solid waste. Management is understood as the collection, transport and final disposal of waste in treatment sites or municipal services or similar institutions, or by public or private firms, specialized firms or general government. Urban households and businesses produce substantial amounts of solid waste that must be collected regularly, recycled or treated and disposed properly in order to maintain healthy and sanitary living conditions. To calculate this indicator, it is then necessary to define the proportion of regularly collected urban solid waste that is properly disposed of relative to all total urban waste generated by the city.
For further information, see United Nations, “Goal 11: Make cities inclusive, safe, resilient and sustainable”, 2020 [online] http://unstats.un.org/sdgs/metadata/files/Metadata-11-06-01.pdf.
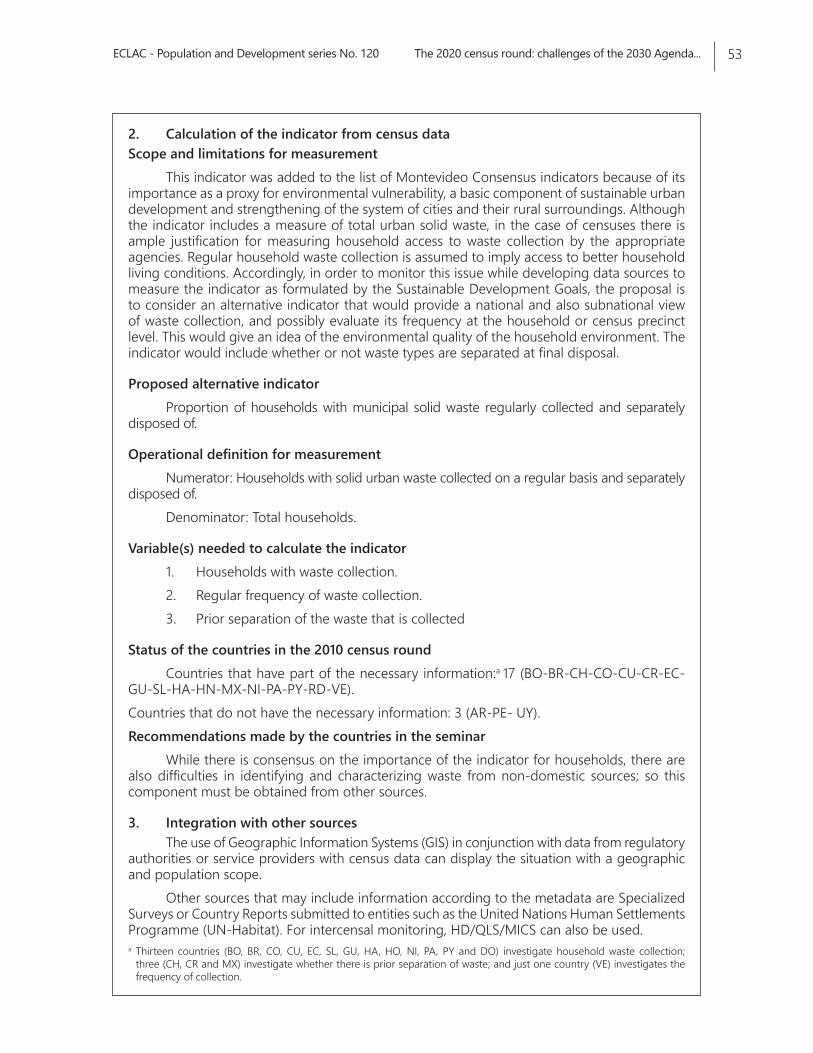
ECLAC - Population and Development series No. 120 The 2020 census round: challenges of the 2030 Agenda... 53
2. Calculation of the indicator from census dataScope and limitations for measurement
This indicator was added to the list of Montevideo Consensus indicators because of its importance as a proxy for environmental vulnerability, a basic component of sustainable urban development and strengthening of the system of cities and their rural surroundings. Although the indicator includes a measure of total urban solid waste, in the case of censuses there is ample justification for measuring household access to waste collection by the appropriate agencies. Regular household waste collection is assumed to imply access to better household living conditions. Accordingly, in order to monitor this issue while developing data sources to measure the indicator as formulated by the Sustainable Development Goals, the proposal is to consider an alternative indicator that would provide a national and also subnational view of waste collection, and possibly evaluate its frequency at the household or census precinct level. This would give an idea of the environmental quality of the household environment. The indicator would include whether or not waste types are separated at final disposal.
Proposed alternative indicatorProportion of households with municipal solid waste regularly collected and separately
disposed of.
Operational definition for measurement Numerator: Households with solid urban waste collected on a regular basis and separately
disposed of. Denominator: Total households.
Variable(s) needed to calculate the indicator1. Households with waste collection.2. Regular frequency of waste collection.3. Prior separation of the waste that is collected
Status of the countries in the 2010 census roundCountries that have part of the necessary information:a 17 (BO-BR-CH-CO-CU-CR-EC-
GU-SL-HA-HN-MX-NI-PA-PY-RD-VE).Countries that do not have the necessary information: 3 (AR-PE- UY).Recommendations made by the countries in the seminar
While there is consensus on the importance of the indicator for households, there are also difficulties in identifying and characterizing waste from non-domestic sources; so this component must be obtained from other sources.
3. Integration with other sourcesThe use of Geographic Information Systems (GIS) in conjunction with data from regulatory
authorities or service providers with census data can display the situation with a geographic and population scope.
Other sources that may include information according to the metadata are Specialized Surveys or Country Reports submitted to entities such as the United Nations Human Settlements Programme (UN-Habitat). For intercensal monitoring, HD/QLS/MICS can also be used.a Thirteen countries (BO, BR, CO, CU, EC, SL, GU, HA, HO, NI, PA, PY and DO) investigate household waste collection;
three (CH, CR and MX) investigate whether there is prior separation of waste; and just one country (VE) investigates the frequency of collection.
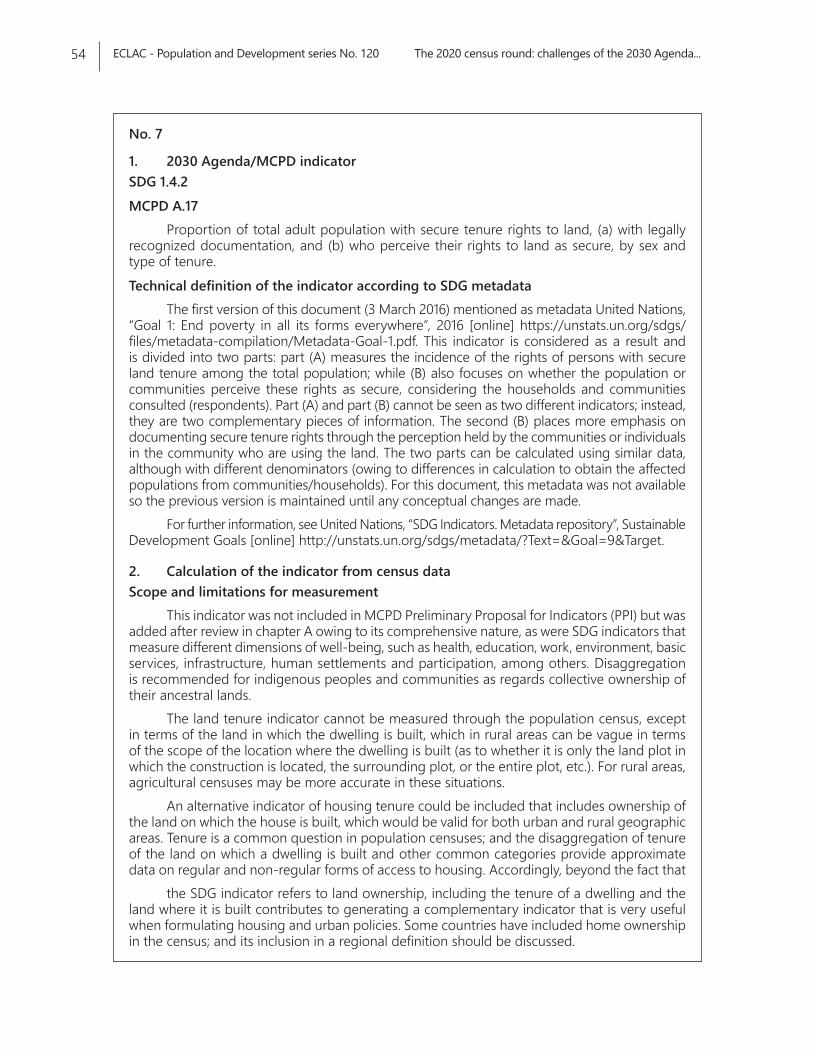
ECLAC - Population and Development series No. 120 The 2020 census round: challenges of the 2030 Agenda...54
No. 7
1. 2030 Agenda/MCPD indicatorSDG 1.4.2MCPD A.17
Proportion of total adult population with secure tenure rights to land, (a) with legally recognized documentation, and (b) who perceive their rights to land as secure, by sex and type of tenure.Technical definition of the indicator according to SDG metadata
The first version of this document (3 March 2016) mentioned as metadata United Nations, “Goal 1: End poverty in all its forms everywhere”, 2016 [online] https://unstats.un.org/sdgs/files/metadata-compilation/Metadata-Goal-1.pdf. This indicator is considered as a result and is divided into two parts: part (A) measures the incidence of the rights of persons with secure land tenure among the total population; while (B) also focuses on whether the population or communities perceive these rights as secure, considering the households and communities consulted (respondents). Part (A) and part (B) cannot be seen as two different indicators; instead, they are two complementary pieces of information. The second (B) places more emphasis on documenting secure tenure rights through the perception held by the communities or individuals in the community who are using the land. The two parts can be calculated using similar data, although with different denominators (owing to differences in calculation to obtain the affected populations from communities/households). For this document, this metadata was not available so the previous version is maintained until any conceptual changes are made.
For further information, see United Nations, “SDG Indicators. Metadata repository”, Sustainable Development Goals [online] http://unstats.un.org/sdgs/metadata/?Text=&Goal=9&Target.
2. Calculation of the indicator from census dataScope and limitations for measurement
This indicator was not included in MCPD Preliminary Proposal for Indicators (PPI) but was added after review in chapter A owing to its comprehensive nature, as were SDG indicators that measure different dimensions of well-being, such as health, education, work, environment, basic services, infrastructure, human settlements and participation, among others. Disaggregation is recommended for indigenous peoples and communities as regards collective ownership of their ancestral lands.
The land tenure indicator cannot be measured through the population census, except in terms of the land in which the dwelling is built, which in rural areas can be vague in terms of the scope of the location where the dwelling is built (as to whether it is only the land plot in which the construction is located, the surrounding plot, or the entire plot, etc.). For rural areas, agricultural censuses may be more accurate in these situations.
An alternative indicator of housing tenure could be included that includes ownership of the land on which the house is built, which would be valid for both urban and rural geographic areas. Tenure is a common question in population censuses; and the disaggregation of tenure of the land on which a dwelling is built and other common categories provide approximate data on regular and non-regular forms of access to housing. Accordingly, beyond the fact that
the SDG indicator refers to land ownership, including the tenure of a dwelling and the land where it is built contributes to generating a complementary indicator that is very useful when formulating housing and urban policies. Some countries have included home ownership in the census; and its inclusion in a regional definition should be discussed.
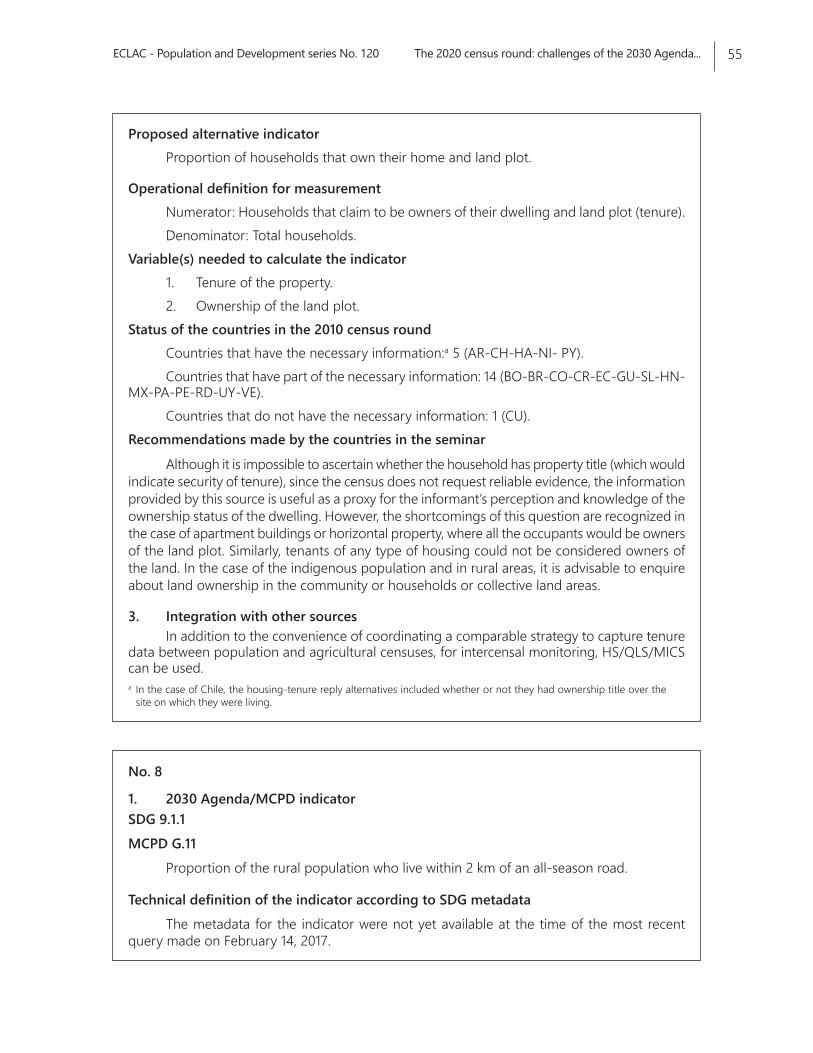
ECLAC - Population and Development series No. 120 The 2020 census round: challenges of the 2030 Agenda... 55
Proposed alternative indicatorProportion of households that own their home and land plot.
Operational definition for measurementNumerator: Households that claim to be owners of their dwelling and land plot (tenure).Denominator: Total households.
Variable(s) needed to calculate the indicator1. Tenure of the property.2. Ownership of the land plot.
Status of the countries in the 2010 census roundCountries that have the necessary information:a 5 (AR-CH-HA-NI- PY).Countries that have part of the necessary information: 14 (BO-BR-CO-CR-EC-GU-SL-HN-
MX-PA-PE-RD-UY-VE).Countries that do not have the necessary information: 1 (CU).
Recommendations made by the countries in the seminar
Although it is impossible to ascertain whether the household has property title (which would indicate security of tenure), since the census does not request reliable evidence, the information provided by this source is useful as a proxy for the informant’s perception and knowledge of the ownership status of the dwelling. However, the shortcomings of this question are recognized in the case of apartment buildings or horizontal property, where all the occupants would be owners of the land plot. Similarly, tenants of any type of housing could not be considered owners of the land. In the case of the indigenous population and in rural areas, it is advisable to enquire about land ownership in the community or households or collective land areas.
3. Integration with other sourcesIn addition to the convenience of coordinating a comparable strategy to capture tenure
data between population and agricultural censuses, for intercensal monitoring, HS/QLS/MICS can be used.a In the case of Chile, the housing-tenure reply alternatives included whether or not they had ownership title over the
site on which they were living.
No. 8
1. 2030 Agenda/MCPD indicatorSDG 9.1.1MCPD G.11
Proportion of the rural population who live within 2 km of an all-season road.
Technical definition of the indicator according to SDG metadataThe metadata for the indicator were not yet available at the time of the most recent
query made on February 14, 2017.
ECLAC - Population and Development series No. 120 The 2020 census round: challenges of the 2030 Agenda...56
For further information, United Nations, “SDG Indicators. Metadata repository”, Sustainable Development Goals [online] http://unstats.un.org/sdgs/metadata/?Text=&Goal=9&Target=.
2. Calculation of the indicator from census data
Scope and limitations for measurement
This indicator was not included in the Preliminary Proposal of Indicators (PPI) of the Montevideo Consensus, but was added after revision because it is a key aspect of the rural environment and a basic component of sustainable urban development, and also for strengthening of the system of cities and their rural environment. The instruments related to the census precinct can be used to capture the data. For rural areas, a question on whether the household/dwelling is located less than 2 km from an all-season road can also be included. Nonetheless, the census precinct, the environment of the home or the dwelling itself requires special post-census consolidation treatment and associated mapping to measure distances and characteristics of access.
Proposed alternative indicatorNone proposed given the shortcomings of the source, discussed during the seminar.
Operational definitionNone proposed given the shortcomings of the source, discussed during the seminar.
Variable(s) needed to calculate the indicator None proposed given the shortcomings of the source, discussed during the seminar.
Status of the countries in the 2010 census roundNone proposed given the shortcomings of the source, discussed during the seminar.
Recommendations made by the countries in the seminar
As there were no metadata, there was no point discussing this issue. Nonetheless, the seminar recognized that the concept of “all-season” is very complex, since it includes not only the conditions of the road, but also the type of road (terrestrial, waterway, etc.) and access to it at different times of the year. However, there is no consensus on including this indicator in the regional context.
Another dimension from which complementary information could be obtained is that of distance and means of transport to access health centres, school or work —an issue that could be discussed in the corresponding indicators.
It is expected that this information will be obtained from georeferenced systems.
3. Integration with other sourcesThe use of GIS and census data, in conjunction with data from regulatory authorities or
service providers, can display the situation with a geographic and population scope.
Other sources that may include information aligned with the metadata are the specialized surveys or country reports submitted to entities such as UN-Habitat. For intercensal monitoring, HS/QLS can also be used.
ECLAC - Population and Development series No. 120 The 2020 census round: challenges of the 2030 Agenda... 57
No. 9
1. 2030 Agenda/MCPD indicatorSDG 11.2.1
Proportion of population that has convenient access to public transport, by sex, age and persons with disabilities.
Technical definition of the indicator according to SDG metadataThis indicator will be monitored by the proportion of the population that has convenient
access to public transport. As most public transport users walk from their journey origin to public transport stops and from public transport stops to their journey destination, local spatial availability and accessibility is sometimes assessed in terms of pedestrian access. Accordingly, access to public transport is considered convenient when an officially recognized stop is accessible within a distance of 0.5 km from a reference point such as a home, school, workplace, market, etc. Additional criteria for defining public transport that is convenient include: a. Public transport accessible to all special-needs customers, including those who are physically, visually, and/or hearing-impaired, as well as those with temporary disabilities, the elderly, children and other people in vulnerable situations. b. Public transport with frequent service during peak travel times c. Stops present a safe and comfortable station environment. Public transport is defined as a shared passenger transport service that is available to the general public. It includes cars, buses, trolleys, trams, trains, subways, and ferries that are shared by strangers without prior agreement. However, it excludes taxis, carpools, and hired buses.
For further information, see United Nations, “Goal 11: Make cities inclusive, safe, resilient and sustainable”, 2016 [online] https://unstats.un.org/sdgs/metadata/files/Metadata-11-02-01.pdf.
2. Calculation of the indicator from census dataProposed alternative indicator
None proposed given the shortcomings of the source, discussed during the seminar.
Operational definitionNone proposed given the shortcomings of the source, discussed during the seminar.
Variable(s) needed to calculate the indicator it None proposed given the shortcomings of the source, discussed during the seminar.
Status of the countries in the 2010 census roundNone proposed given the shortcomings of the source, discussed during the seminar.
Recommendations made by the countries in the seminarThere is consensus that the indicator as defined cannot feasibly be measured in population
censuses. However, the relevance of a proxy indicator that includes some of the alternatives discussed at the meeting, such as travel time to work or study, could be discussed. In fact, there is experience in the region. For example, Mexico investigated these two issues in the 2015 Intercensal Questionnaire; and Brazil and Colombia enquired about commuting time in their most recent census questionnaires. Ecuador asks whether any household member travels to study or work outside the parish, and a very specific example. Nicaragua investigated travel time to a health centre, as well as the distance and means of transport used.
ECLAC - Population and Development series No. 120 The 2020 census round: challenges of the 2030 Agenda...58
3. Integration with other sourcesThe use of Geographic Information Systems (GIS) in conjunction with data from regulatory
authorities or supplier firms, and road network and census data can display the situation with a geographical and population scope.
For intercensal monitoring, the use of HS/QLS/MICS would also be feasible.
No. 10
1. 2030 Agenda/MCPD indicatorMCPD G.12
Houses in hazardous locations: number of housing units built in hazardous locations per 100,000 housing units (United Nations Human Settlements Programme (UN-Habitat) Extensive Indicator 10).Technical definition of the indicator according to SDG metadata
The metadata of the Montevideo Consensus indicators are either under construction, or else the contents of those that have global reference (methodology or monitoring by agencies) are being adapted to the region. In the Habitat proposal, this indicator reports homes in hazardous locations per 100,000 housing units. According to the proposed methodology: The existence of housing in hazardous locations is more frequent in settlements that originated informally. However, this situation can also extend to other areas of the city owing to changes in the configuration of the surface and subsoil generated by the same urbanization processes that alter the cycles and effects of natural phenomena. Thus, a safe location is as important as the fact that the home is built of durable materials to ensure the physical integrity of its inhabitants.
2. Calculating the indicator from census dataScope and limitations for measuring the indicator according to the technical definition
This indicator was included in the Preliminary Proposal of Indicators (PPI) of the Montevideo Consensus because of the importance of preventing and mitigating the impact of socioenvironmental disasters. It is therefore advisable to follow the methodology of UN-Habitat Extensive Indicator 10: Houses in hazardous locations. However, the definition of hazardous locations is not yet clear in terms of its scope.Proposed alternative indicator
Percentage of housing units built in irrigated areas with respect to the total number of housing units.Operational definition
Numerator: Housing units in a hazardous zone (as defined).Denominator: Total number of housing units.
Variable(s) needed to calculate the indicatorNone proposed given the shortcomings of the technical definition available thus far.
Status of the countries in the 2010 census roundNone proposed given the shortcomings of the technical definition available thus far.
ECLAC - Population and Development series No. 120 The 2020 census round: challenges of the 2030 Agenda... 59
Recommendations made by the countries in the seminarIt is recommended that the concept of risk be specified, since some dimensions
correspond to other non-census sources related to civil protection (seismic zones, landslide areas, meteorological phenomena, etc.) even though the population component is fundamental when it comes to digital cartography.
3. Integration with other sourcesThe use of GIS and census data, in conjunction with data from the competent authorities
or supplier firms, can display the situation with a geographical and population scope.For intercensal monitoring, SS/HS/QLS/MICS.
No. 11
1. 2030 Agenda/MCPD indicatorSDG 11.1.1MCPD G.8
Proportion of urban population living in slums, informal settlements or inadequate housingTechnical definition according to SDG metadata
This indicator is relevant because it is a continuation of MDG target 7.D and is useful for understanding the growing number of people living in slums, informal settlements or inadequate housing, characterized by a lack of basic services. UN-Habitat believes that integrating these three components would enable it to capture realities that are also present in both developing and developed regions. The technical definitions of slums, informal settlements or inadequate housing include the fact that the inhabitants suffer one or more of the following “household deprivations”.
Slums: 1. Lack of access to improved water source, 2. Lack of access to improved sanitation facilities, 3. Lack of sufficient living area, 4. Lack of housing durability and, 5. Lack of security of tenure. By extension, the term ‘slum dweller’ refers to a person living in a household that lacks any of the above attributes.].
Informal settlements: 1. Inhabitants have no security of tenure vis-à-vis the land or dwellings they inhabit, with modalities ranging from squatting to informal rental housing, 2. The neighbourhoods usually lack, or are cut off from, formal basic services and city infrastructure, and 3. The housing may not comply with current planning and building regulations, is often situated in geographically and environmentally hazardous areas, and may lack a municipal permit.
Inadequate housing: 1. Legal security of tenure, which guarantees legal protection against forced evictions, harassment and other threats; 2. Availability of services, materials, facilities and infrastructure, including safe drinking water, adequate sanitation, energy for cooking, heating, lighting, food storage or refuse disposal; Affordability, as housing is not adequate if its cost threatens or compromises the occupants’ enjoyment of other human rights; 4. Habitability, as housing is not adequate if it does not guarantee physical safety or provide adequate space, as well as protection against the cold, damp, heat, rain, wind, other threats to health and structural hazards; 5. Accessibility, as housing is not adequate if the
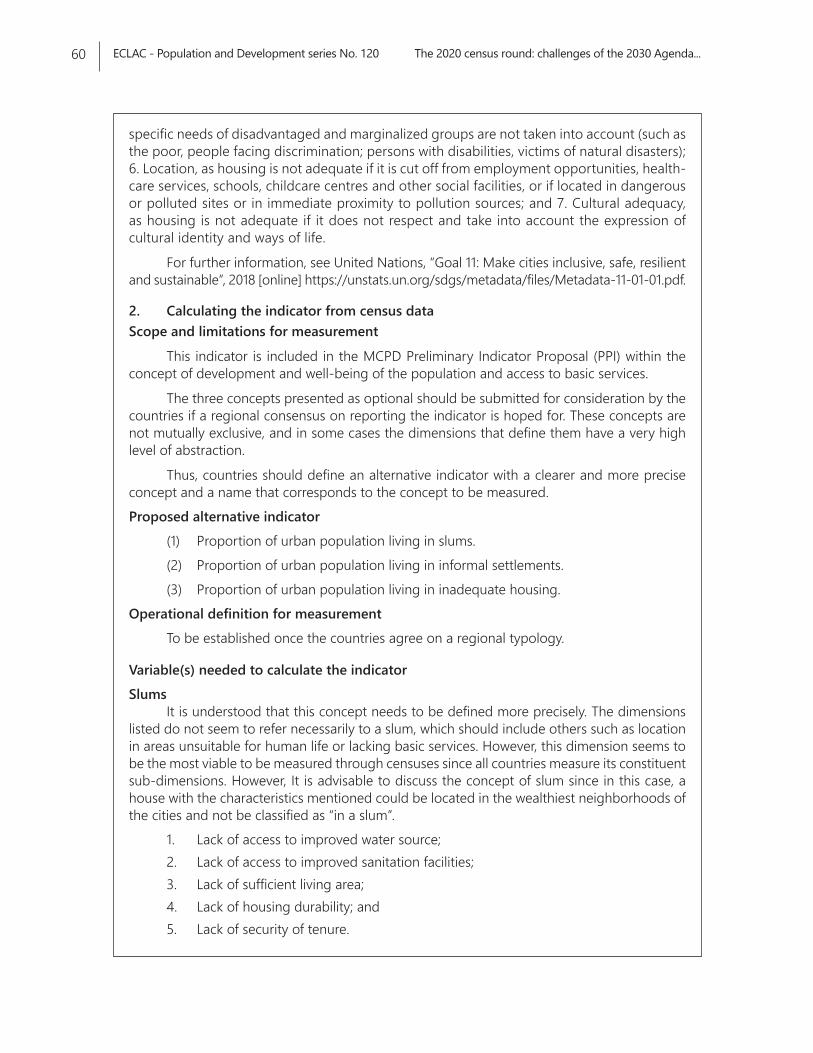
ECLAC - Population and Development series No. 120 The 2020 census round: challenges of the 2030 Agenda...60
specific needs of disadvantaged and marginalized groups are not taken into account (such as the poor, people facing discrimination; persons with disabilities, victims of natural disasters); 6. Location, as housing is not adequate if it is cut off from employment opportunities, health-care services, schools, childcare centres and other social facilities, or if located in dangerous or polluted sites or in immediate proximity to pollution sources; and 7. Cultural adequacy, as housing is not adequate if it does not respect and take into account the expression of cultural identity and ways of life.
For further information, see United Nations, “Goal 11: Make cities inclusive, safe, resilient and sustainable”, 2018 [online] https://unstats.un.org/sdgs/metadata/files/Metadata-11-01-01.pdf.
2. Calculating the indicator from census dataScope and limitations for measurement
This indicator is included in the MCPD Preliminary Indicator Proposal (PPI) within the concept of development and well-being of the population and access to basic services.
The three concepts presented as optional should be submitted for consideration by the countries if a regional consensus on reporting the indicator is hoped for. These concepts are not mutually exclusive, and in some cases the dimensions that define them have a very high level of abstraction.
Thus, countries should define an alternative indicator with a clearer and more precise concept and a name that corresponds to the concept to be measured.Proposed alternative indicator
(1) Proportion of urban population living in slums.(2) Proportion of urban population living in informal settlements.(3) Proportion of urban population living in inadequate housing.
Operational definition for measurementTo be established once the countries agree on a regional typology.
Variable(s) needed to calculate the indicator Slums
It is understood that this concept needs to be defined more precisely. The dimensions listed do not seem to refer necessarily to a slum, which should include others such as location in areas unsuitable for human life or lacking basic services. However, this dimension seems to be the most viable to be measured through censuses since all countries measure its constituent sub-dimensions. However, It is advisable to discuss the concept of slum since in this case, a house with the characteristics mentioned could be located in the wealthiest neighborhoods of the cities and not be classified as “in a slum”.
1. Lack of access to improved water source;2. Lack of access to improved sanitation facilities;3. Lack of sufficient living area;4. Lack of housing durability; and5. Lack of security of tenure.
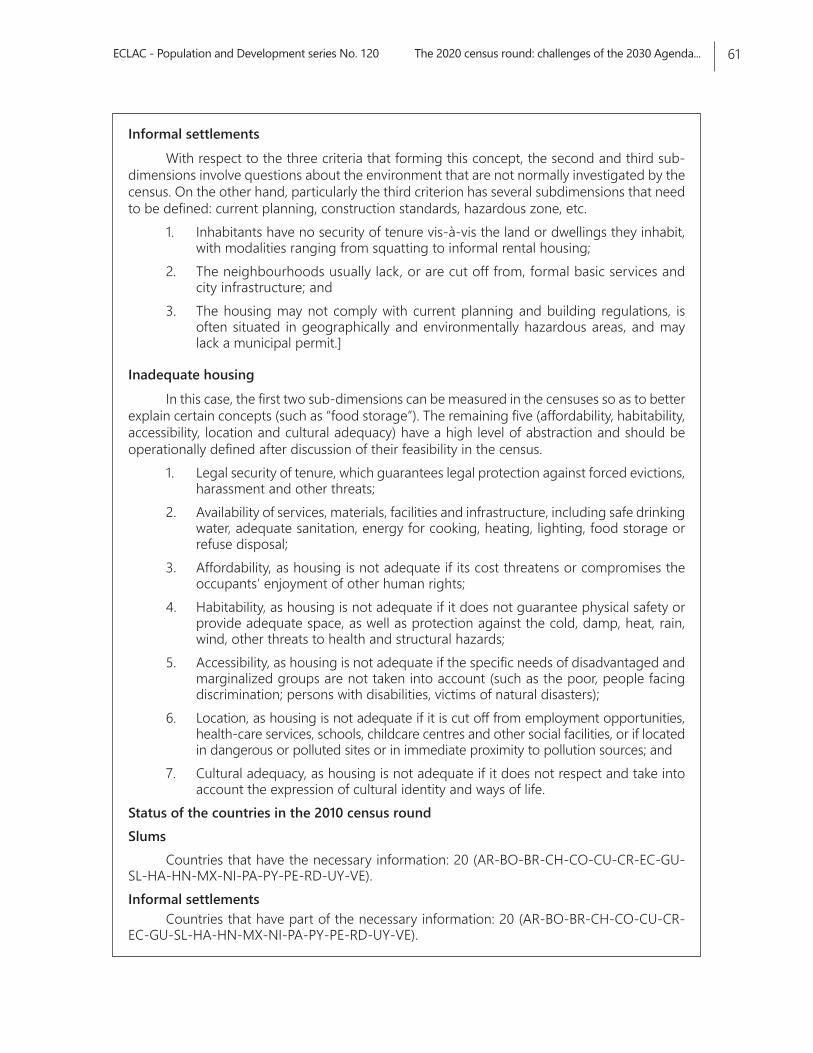
ECLAC - Population and Development series No. 120 The 2020 census round: challenges of the 2030 Agenda... 61
Informal settlementsWith respect to the three criteria that forming this concept, the second and third sub-
dimensions involve questions about the environment that are not normally investigated by the census. On the other hand, particularly the third criterion has several subdimensions that need to be defined: current planning, construction standards, hazardous zone, etc.
1. Inhabitants have no security of tenure vis-à-vis the land or dwellings they inhabit, with modalities ranging from squatting to informal rental housing;
2. The neighbourhoods usually lack, or are cut off from, formal basic services and city infrastructure; and
3. The housing may not comply with current planning and building regulations, is often situated in geographically and environmentally hazardous areas, and may lack a municipal permit.]
Inadequate housingIn this case, the first two sub-dimensions can be measured in the censuses so as to better
explain certain concepts (such as “food storage”). The remaining five (affordability, habitability, accessibility, location and cultural adequacy) have a high level of abstraction and should be operationally defined after discussion of their feasibility in the census.
1. Legal security of tenure, which guarantees legal protection against forced evictions, harassment and other threats;
2. Availability of services, materials, facilities and infrastructure, including safe drinking water, adequate sanitation, energy for cooking, heating, lighting, food storage or refuse disposal;
3. Affordability, as housing is not adequate if its cost threatens or compromises the occupants’ enjoyment of other human rights;
4. Habitability, as housing is not adequate if it does not guarantee physical safety or provide adequate space, as well as protection against the cold, damp, heat, rain, wind, other threats to health and structural hazards;
5. Accessibility, as housing is not adequate if the specific needs of disadvantaged and marginalized groups are not taken into account (such as the poor, people facing discrimination; persons with disabilities, victims of natural disasters);
6. Location, as housing is not adequate if it is cut off from employment opportunities, health-care services, schools, childcare centres and other social facilities, or if located in dangerous or polluted sites or in immediate proximity to pollution sources; and
7. Cultural adequacy, as housing is not adequate if it does not respect and take into account the expression of cultural identity and ways of life.
Status of the countries in the 2010 census roundSlums
Countries that have the necessary information: 20 (AR-BO-BR-CH-CO-CU-CR-EC-GU-SL-HA-HN-MX-NI-PA-PY-PE-RD-UY-VE).Informal settlements
Countries that have part of the necessary information: 20 (AR-BO-BR-CH-CO-CU-CR-EC-GU-SL-HA-HN-MX-NI-PA-PY-PE-RD-UY-VE).
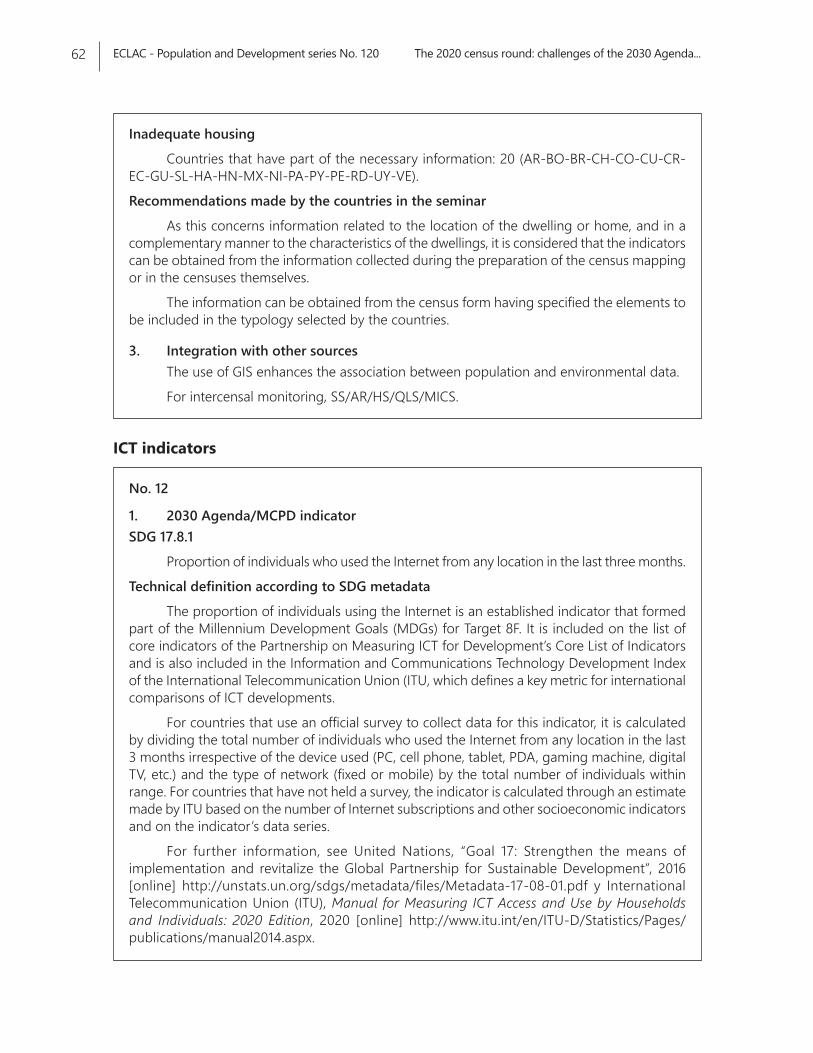
ECLAC - Population and Development series No. 120 The 2020 census round: challenges of the 2030 Agenda...62
Inadequate housing
Countries that have part of the necessary information: 20 (AR-BO-BR-CH-CO-CU-CR-EC-GU-SL-HA-HN-MX-NI-PA-PY-PE-RD-UY-VE).
Recommendations made by the countries in the seminar
As this concerns information related to the location of the dwelling or home, and in a complementary manner to the characteristics of the dwellings, it is considered that the indicators can be obtained from the information collected during the preparation of the census mapping or in the censuses themselves.
The information can be obtained from the census form having specified the elements to be included in the typology selected by the countries.
3. Integration with other sourcesThe use of GIS enhances the association between population and environmental data.
For intercensal monitoring, SS/AR/HS/QLS/MICS.
No. 12
1. 2030 Agenda/MCPD indicatorSDG 17.8.1
Proportion of individuals who used the Internet from any location in the last three months.
Technical definition according to SDG metadata
The proportion of individuals using the Internet is an established indicator that formed part of the Millennium Development Goals (MDGs) for Target 8F. It is included on the list of core indicators of the Partnership on Measuring ICT for Development’s Core List of Indicators and is also included in the Information and Communications Technology Development Index of the International Telecommunication Union (ITU, which defines a key metric for international comparisons of ICT developments.
For countries that use an official survey to collect data for this indicator, it is calculated by dividing the total number of individuals who used the Internet from any location in the last 3 months irrespective of the device used (PC, cell phone, tablet, PDA, gaming machine, digital TV, etc.) and the type of network (fixed or mobile) by the total number of individuals within range. For countries that have not held a survey, the indicator is calculated through an estimate made by ITU based on the number of Internet subscriptions and other socioeconomic indicators and on the indicator’s data series.
For further information, see United Nations, “Goal 17: Strengthen the means of implementation and revitalize the Global Partnership for Sustainable Development”, 2016 [online] http://unstats.un.org/sdgs/metadata/files/Metadata-17-08-01.pdf y International Telecommunication Union (ITU), Manual for Measuring ICT Access and Use by Households and Individuals: 2020 Edition, 2020 [online] http://www.itu.int/en/ITU-D/Statistics/Pages/publications/manual2014.aspx.
ICT indicators
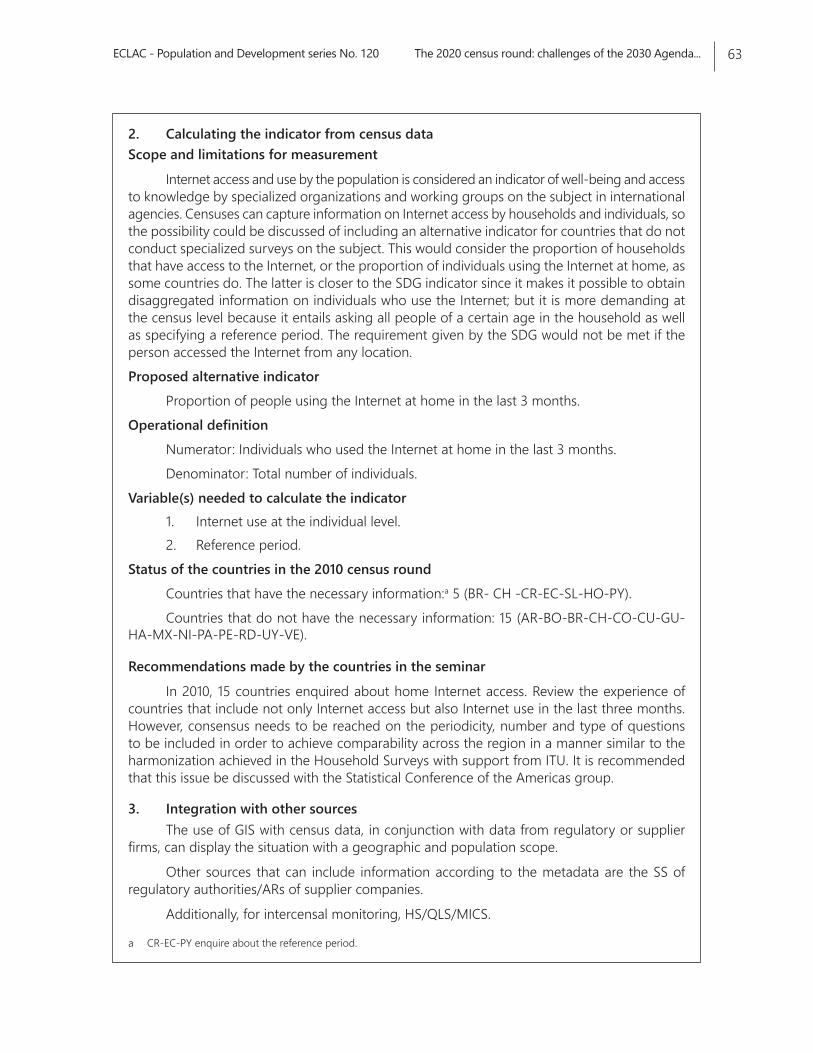
ECLAC - Population and Development series No. 120 The 2020 census round: challenges of the 2030 Agenda... 63
2. Calculating the indicator from census dataScope and limitations for measurement
Internet access and use by the population is considered an indicator of well-being and access to knowledge by specialized organizations and working groups on the subject in international agencies. Censuses can capture information on Internet access by households and individuals, so the possibility could be discussed of including an alternative indicator for countries that do not conduct specialized surveys on the subject. This would consider the proportion of households that have access to the Internet, or the proportion of individuals using the Internet at home, as some countries do. The latter is closer to the SDG indicator since it makes it possible to obtain disaggregated information on individuals who use the Internet; but it is more demanding at the census level because it entails asking all people of a certain age in the household as well as specifying a reference period. The requirement given by the SDG would not be met if the person accessed the Internet from any location.Proposed alternative indicator
Proportion of people using the Internet at home in the last 3 months.Operational definition
Numerator: Individuals who used the Internet at home in the last 3 months.Denominator: Total number of individuals.
Variable(s) needed to calculate the indicator 1. Internet use at the individual level. 2. Reference period.
Status of the countries in the 2010 census roundCountries that have the necessary information:a 5 (BR- CH -CR-EC-SL-HO-PY).Countries that do not have the necessary information: 15 (AR-BO-BR-CH-CO-CU-GU-
HA-MX-NI-PA-PE-RD-UY-VE).
Recommendations made by the countries in the seminar
In 2010, 15 countries enquired about home Internet access. Review the experience of countries that include not only Internet access but also Internet use in the last three months. However, consensus needs to be reached on the periodicity, number and type of questions to be included in order to achieve comparability across the region in a manner similar to the harmonization achieved in the Household Surveys with support from ITU. It is recommended that this issue be discussed with the Statistical Conference of the Americas group.
3. Integration with other sourcesThe use of GIS with census data, in conjunction with data from regulatory or supplier
firms, can display the situation with a geographic and population scope.
Other sources that can include information according to the metadata are the SS of regulatory authorities/ARs of supplier companies.
Additionally, for intercensal monitoring, HS/QLS/MICS.
a CR-EC-PY enquire about the reference period.
ECLAC - Population and Development series No. 120 The 2020 census round: challenges of the 2030 Agenda...64
No. 13
1. 2030 Agenda/MCPD indicatorSDG 5.b.1
Proportion of individuals who own a mobile telephone, by sex.Technical definition according to SDG metadata
This indicator is defined as the “proportion of individuals who own a mobile telephone, by sex”. An individual owns a mobile cellular phone if he/she has a mobile cellular phone device with at least one active SIM card for personal use. Mobile cellular phones supplied by employers that can be used for personal reasons (to make personal calls, access the Internet, etc.) are included. Individuals who have only active SIM card(s) and not a mobile phone device are excluded. Individuals who have a mobile phone for personal use that is not registered under his/her name are also included. An active SIM card is a SIM card that has been used in the last three months.]. Countries may collect data on this indicator through national household surveys. This indicator is calculated by dividing the total number of individuals within range of a mobile phone by the total number of individuals within range.
For further information, see United Nations, “Goal 5: Achieve gender equality and empower all women and girls”, 2016 [online] https://unstats.un.org/sdgs/metadata/files/Metadata-05-0B-01.pdf.
Scope and limitations for measurement Discuss enquiring about the existence of at least one mobile phone in the household
(may be included if there is a mobile phone in the household). However, it would be convenient to do it at the individual level.
Proposed alternative indicatorProportion of individuals who own a mobile phone.
Operational definition for measurementNumerator: People who own a mobile phone.Denominator: Total number of people.
Variable(s) needed to calculate the indicatorIndividuals in possession of a cell phone.
Status of the countries in the 2010 census roundCountries that have the necessary information: 4 (CR-EC-HO-PY).Countries that do not have the necessary information: 16 (AR-BO-BR-CH-CO-CU-GU-
SL-HA-MX-NI-PA-PE-RD-UY-VE).
Recommendations made by the countries in the seminarMost countries have included a question on this issue, 11 of them at the household level.
Those that have done so at the individual level have had good results. It is understood that possession connotes use, regardless of whether or not the user owns the mobile phone in question. It was noted that asking about the type of technology (3G, 4G, etc.) would be more precise but is not easy to treat in a census. Nonetheless, it is recommended that this topic be discussed with the Statistical Conference of the Americas group.
ECLAC - Population and Development series No. 120 The 2020 census round: challenges of the 2030 Agenda... 65
3. Integration with other sourcesThe use of GIS and census data, in conjunction with data from regulatory authorities or
service providers, can display the situation with a geographic and population scope.Other sources that may include information according to the metadata are the SS of
regulatory authorities/ARs of supplier companies.For intercensal monitoring, HS/QLS/MICS/AR.
No. 14
1. 2030 Agenda/MCPD indicatorSDG 9.c.1
Proportion of population covered by a mobile network, by technology.
Technical definition according to SDG metadataThe percentage of the population covered by a mobile cellular network can be considered
as a minimum indicator for ICT access since it provides people with the possibility to subscribe to and use mobile-cellular services to communicate. The indicator highlights the importance of mobile networks in the provision of basic communication services and will help in the design of policies to overcome infrastructure barriers and address the digital divide. The indicator “Percentage of population covered by a mobile network, by technology” refers to the percentage of inhabitants living within range of a mobile-cellular signal, whether or not they are mobile phone subscribers or users.
The indicator is calculated by dividing the number of inhabitants within range of a mobile-cellular signal by the total population and multiplying by 100. The indicator should identify whether mobile and cellular technology service coverage is provided through narrowband (2G), which provides limited (and mainly voice-based) services; or through broadband (3G and up) providing increasingly fast, reliable and high-quality access to the Internet and its growing amount of information, content, services and applications. The International Telecommunications Union (ITU) collects data for this indicator through an annual questionnaire applied to national regulatory authorities or Ministries of Information and Communication Technologies, which in turn collect data from Internet service providers.
For further information, see United Nations, “Goal 9: Build resilient infrastructure, promote inclusive and sustainable industrialization and foster innovation”, 2016 [online] http://unstats.un.org/sdgs/metadata/files/Metadata-09-0C-01.pdf.
2. Calculating the indicator from census dataScope and limitations for measurement
This indicator requires information provided by regulatory agencies or service providers in a way that would not be feasible in the census as defined by SDG, unless the census asks about the population’s access to a mobile network, which is easy to so and could provide important information. It would not be possible to obtain reliable information on the technology used by the household or individuals.
Proposed alternative indicatorNone proposed given the shortcomings of the source, discussed during the seminar.
ECLAC - Population and Development series No. 120 The 2020 census round: challenges of the 2030 Agenda...66
Operational definition
None proposed given the shortcomings of the source, discussed during the seminar.
Variables required to calculate the indicator
None proposed given the shortcomings of the source, discussed during the seminar.
Status of the countries in the 2010 census round
It is not proposed given the shortcomings of the source, discussed during the seminar.
Recommendations made by the countries in the seminar
The seminar recommended that this information be obtained from regulatory agencies and provider firms, since the population at large is generally unaware of this type of information. This is not information on use but on the coverage in the area where the house is located.
3. Integration with other sourcesThe use of GIS and census data, in conjunction with data from regulatory authorities or
service providers, can display the situation with a geographic and population scope.
No. 15
1. 2030 Agenda/MCPD indicatorSDG 17.6.2
Fixed Internet broadband subscriptions per 100 inhabitants, by speed.
Technical definition according to SDG metadataFixed Internet broadband subscriptions per 100 inhabitants, by speed. Total fixed (wired)
broadband Internet subscriptions refers to subscriptions to high-speed access to the public Internet (a TCP/IP connection), at downstream speeds equal to, or greater than, 256 kbit/s. This can include for example cable modem, DSL, fibre-to-the-home/building and other fixed (wired) broadband subscriptions. The data needed to calculate this indicator are collected by ITU through an annual questionnaire applied to national regulatory authorities or Ministries of Information and Communication Technology (ICT), which in turn compile data from Internet service providers. Data can be collected by asking each service provider in the country to provide the number of their fixed broadband subscriptions according to the speeds indicated. The data are then aggregated to obtain the country totals.
For further information, see United Nations, “Goal 17: Strengthen the means of implementation and revitalize the Global Partnership for Sustainable Development”, 2016 [online] https://unstats.un.org/sdgs/metadata/files/Metadata-17-06-02.pdf.
2. Calculating the indicator from census dataScope and limitations for measurement
Knowledge of the type of band and speed is very limited among the population at large, unless one asks about the existence of an Internet service in the home. In this way it is possible to discuss an alternative indicator that considers the proportion of households with Internet access.
ECLAC - Population and Development series No. 120 The 2020 census round: challenges of the 2030 Agenda... 67
Proposed alternative indicatorHouseholds with Internet access.
Operational definition Numerator: Households with Internet access.Denominator: Total households.
Variable(s) needed to calculate the indicator Internet access in the home.
Status of the countries in the 2010 census roundCountries that have the necessary information: 15 (BO-BR-CH-CR-EC-HA-HO-MX-NI-
PA-PY-PE-RD-UY-VE).Countries that do not have the necessary information: 5 (AR-CO-CU-GU-SL).
Recommendations made by the countries in the seminarThe seminar recommended that the data in question be obtained from regulatory bodies
and supplier firms since the population is generally unaware of this type of information —both access to the mobile network and the speed at which it is contracted. If there is no specialized survey or indicators on the companies that provide the service by entity and municipality, the seminar suggested that the census form consider Internet subscription only without specifying broadband and speed. There, one could ask about the number of people who use the Internet, even if not at home, which would cover what is requested by the SDG 17.8.1 indicator. It is advisable to articulate this topic with the Statistical Conference of the Americas group.
3. Integration with other sourcesThe use of GIS and census data, in conjunction with data from regulatory authorities
or service providers, can display the situation with a geographic and population scope. It is also possible to access bandwidth information. Other sources that can include the information according to the metadata are the SS of regulatory authorities/ARs of provider companies. In addition, for intercensal monitoring, HS/QLS/MICS.
No. 16
1. 2030 Agenda/MCPD indicatorSDG 4.4.1 MCPD A.10
Proportion of youth and adults with information and communications technology (ICT) skills, by type of technical knowledge.
Technical definition according to SDG metadata
This indicator is relatively new, but it is based on an agreed-upon definition and methodology that has been developed under the coordination of the ITU and its Expert Groups following an extensive consultation process with countries. It is also a core indicator of the Partnership on Measuring ICT for Development’s Core List of Indicators, which was approved
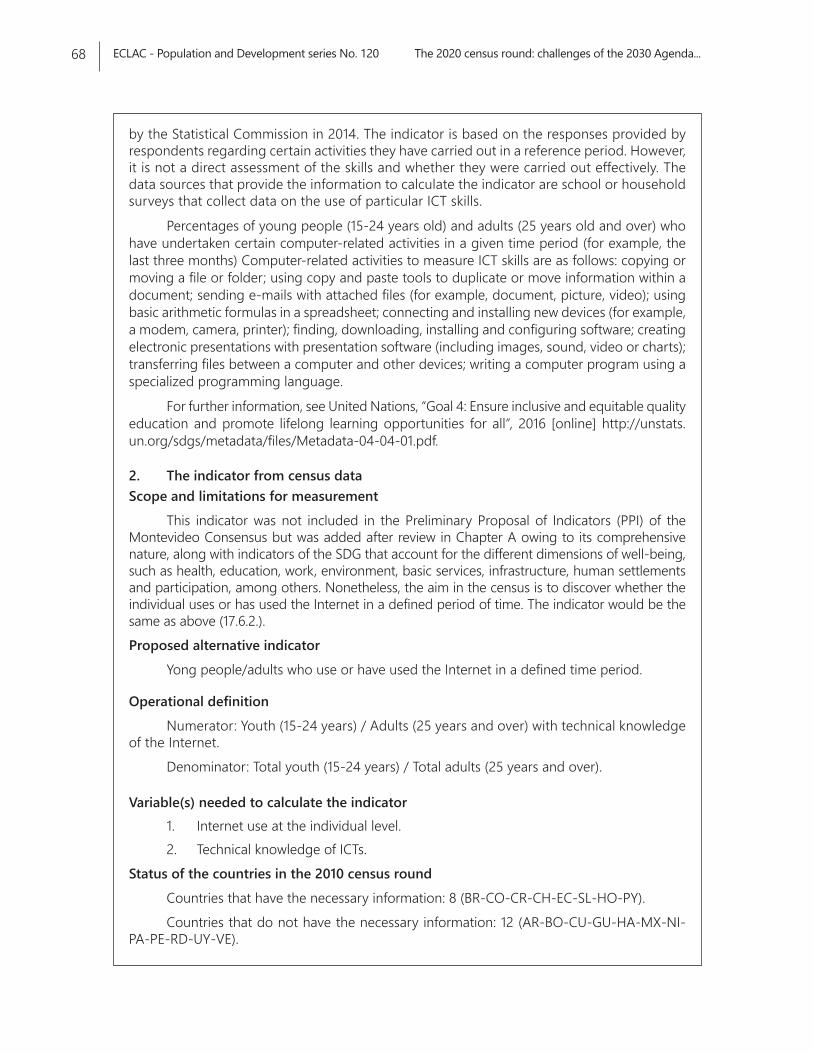
ECLAC - Population and Development series No. 120 The 2020 census round: challenges of the 2030 Agenda...68
by the Statistical Commission in 2014. The indicator is based on the responses provided by respondents regarding certain activities they have carried out in a reference period. However, it is not a direct assessment of the skills and whether they were carried out effectively. The data sources that provide the information to calculate the indicator are school or household surveys that collect data on the use of particular ICT skills.
Percentages of young people (15-24 years old) and adults (25 years old and over) who have undertaken certain computer-related activities in a given time period (for example, the last three months) Computer-related activities to measure ICT skills are as follows: copying or moving a file or folder; using copy and paste tools to duplicate or move information within a document; sending e-mails with attached files (for example, document, picture, video); using basic arithmetic formulas in a spreadsheet; connecting and installing new devices (for example, a modem, camera, printer); finding, downloading, installing and configuring software; creating electronic presentations with presentation software (including images, sound, video or charts); transferring files between a computer and other devices; writing a computer program using a specialized programming language.
For further information, see United Nations, “Goal 4: Ensure inclusive and equitable quality education and promote lifelong learning opportunities for all”, 2016 [online] http://unstats.un.org/sdgs/metadata/files/Metadata-04-04-01.pdf.
2. The indicator from census dataScope and limitations for measurement
This indicator was not included in the Preliminary Proposal of Indicators (PPI) of the Montevideo Consensus but was added after review in Chapter A owing to its comprehensive nature, along with indicators of the SDG that account for the different dimensions of well-being, such as health, education, work, environment, basic services, infrastructure, human settlements and participation, among others. Nonetheless, the aim in the census is to discover whether the individual uses or has used the Internet in a defined period of time. The indicator would be the same as above (17.6.2.).Proposed alternative indicator
Yong people/adults who use or have used the Internet in a defined time period.
Operational definitionNumerator: Youth (15-24 years) / Adults (25 years and over) with technical knowledge
of the Internet. Denominator: Total youth (15-24 years) / Total adults (25 years and over).
Variable(s) needed to calculate the indicator1. Internet use at the individual level.2. Technical knowledge of ICTs.
Status of the countries in the 2010 census roundCountries that have the necessary information: 8 (BR-CO-CR-CH-EC-SL-HO-PY).Countries that do not have the necessary information: 12 (AR-BO-CU-GU-HA-MX-NI-
PA-PE-RD-UY-VE).
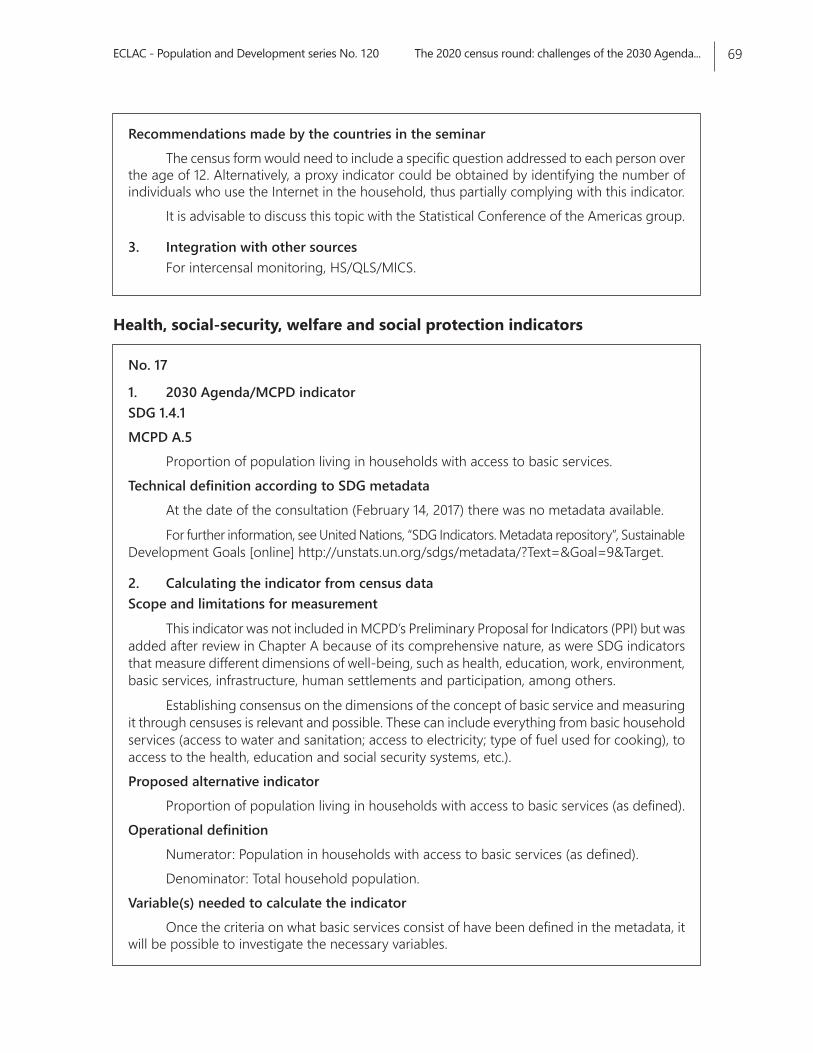
ECLAC - Population and Development series No. 120 The 2020 census round: challenges of the 2030 Agenda... 69
Recommendations made by the countries in the seminarThe census form would need to include a specific question addressed to each person over
the age of 12. Alternatively, a proxy indicator could be obtained by identifying the number of individuals who use the Internet in the household, thus partially complying with this indicator.
It is advisable to discuss this topic with the Statistical Conference of the Americas group.
3. Integration with other sourcesFor intercensal monitoring, HS/QLS/MICS.
No. 17
1. 2030 Agenda/MCPD indicatorSDG 1.4.1 MCPD A.5
Proportion of population living in households with access to basic services.Technical definition according to SDG metadata
At the date of the consultation (February 14, 2017) there was no metadata available.
For further information, see United Nations, “SDG Indicators. Metadata repository”, Sustainable Development Goals [online] http://unstats.un.org/sdgs/metadata/?Text=&Goal=9&Target.
2. Calculating the indicator from census dataScope and limitations for measurement
This indicator was not included in MCPD’s Preliminary Proposal for Indicators (PPI) but was added after review in Chapter A because of its comprehensive nature, as were SDG indicators that measure different dimensions of well-being, such as health, education, work, environment, basic services, infrastructure, human settlements and participation, among others.
Establishing consensus on the dimensions of the concept of basic service and measuring it through censuses is relevant and possible. These can include everything from basic household services (access to water and sanitation; access to electricity; type of fuel used for cooking), to access to the health, education and social security systems, etc.).Proposed alternative indicator
Proportion of population living in households with access to basic services (as defined).Operational definition
Numerator: Population in households with access to basic services (as defined).Denominator: Total household population.
Variable(s) needed to calculate the indicatorOnce the criteria on what basic services consist of have been defined in the metadata, it
will be possible to investigate the necessary variables.
Health, social-security, welfare and social protection indicators
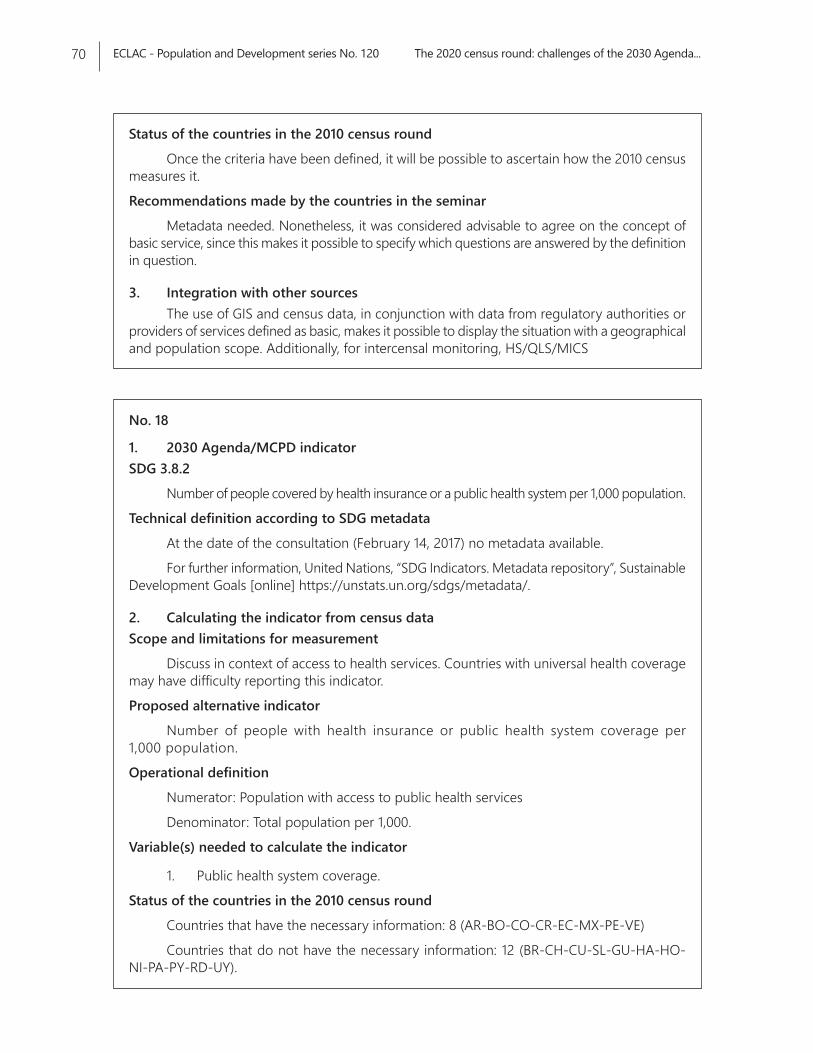
ECLAC - Population and Development series No. 120 The 2020 census round: challenges of the 2030 Agenda...70
Status of the countries in the 2010 census round
Once the criteria have been defined, it will be possible to ascertain how the 2010 census measures it.
Recommendations made by the countries in the seminar
Metadata needed. Nonetheless, it was considered advisable to agree on the concept of basic service, since this makes it possible to specify which questions are answered by the definition in question.
3. Integration with other sourcesThe use of GIS and census data, in conjunction with data from regulatory authorities or
providers of services defined as basic, makes it possible to display the situation with a geographical and population scope. Additionally, for intercensal monitoring, HS/QLS/MICS
No. 18
1. 2030 Agenda/MCPD indicatorSDG 3.8.2
Number of people covered by health insurance or a public health system per 1,000 population.
Technical definition according to SDG metadata
At the date of the consultation (February 14, 2017) no metadata available.
For further information, United Nations, “SDG Indicators. Metadata repository”, Sustainable Development Goals [online] https://unstats.un.org/sdgs/metadata/.
2. Calculating the indicator from census dataScope and limitations for measurement
Discuss in context of access to health services. Countries with universal health coverage may have difficulty reporting this indicator.
Proposed alternative indicator
Number of people with health insurance or public health system coverage per 1,000 population.
Operational definition
Numerator: Population with access to public health services
Denominator: Total population per 1,000.
Variable(s) needed to calculate the indicator
1. Public health system coverage.
Status of the countries in the 2010 census round
Countries that have the necessary information: 8 (AR-BO-CO-CR-EC-MX-PE-VE)
Countries that do not have the necessary information: 12 (BR-CH-CU-SL-GU-HA-HO-NI-PA-PY-RD-UY).
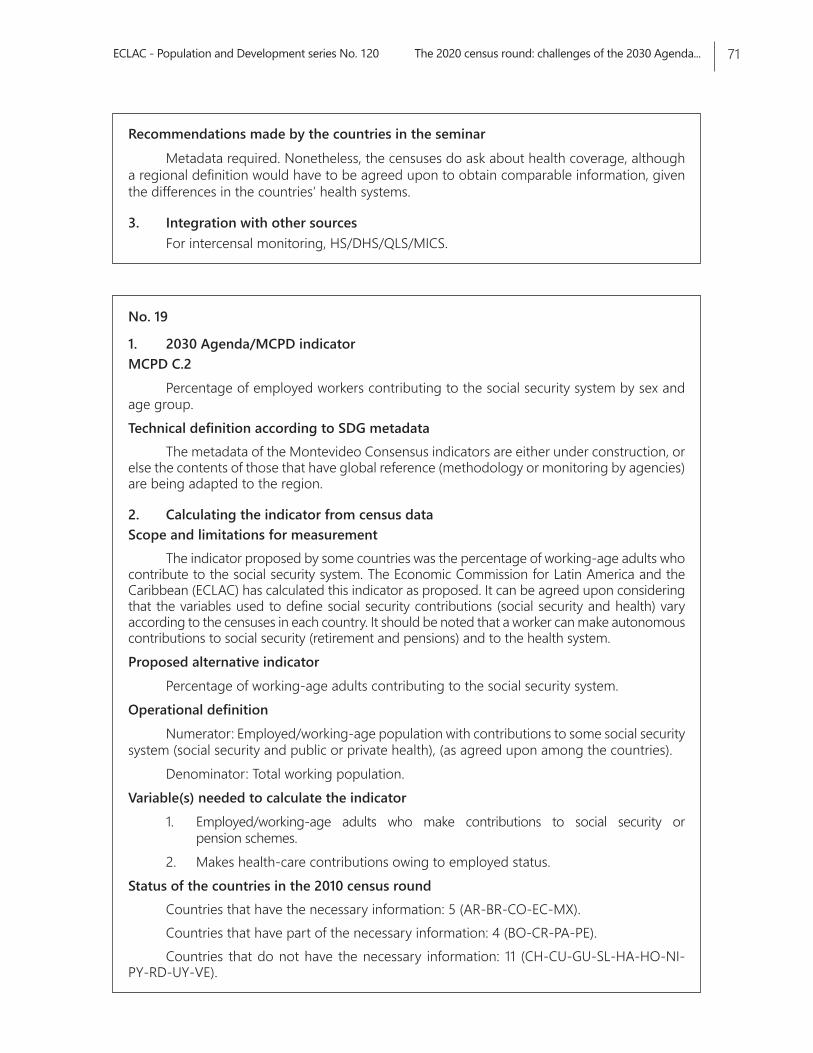
ECLAC - Population and Development series No. 120 The 2020 census round: challenges of the 2030 Agenda... 71
Recommendations made by the countries in the seminarMetadata required. Nonetheless, the censuses do ask about health coverage, although
a regional definition would have to be agreed upon to obtain comparable information, given the differences in the countries’ health systems.
3. Integration with other sourcesFor intercensal monitoring, HS/DHS/QLS/MICS.
No. 19
1. 2030 Agenda/MCPD indicatorMCPD C.2
Percentage of employed workers contributing to the social security system by sex and age group.Technical definition according to SDG metadata
The metadata of the Montevideo Consensus indicators are either under construction, or else the contents of those that have global reference (methodology or monitoring by agencies) are being adapted to the region.
2. Calculating the indicator from census dataScope and limitations for measurement
The indicator proposed by some countries was the percentage of working-age adults who contribute to the social security system. The Economic Commission for Latin America and the Caribbean (ECLAC) has calculated this indicator as proposed. It can be agreed upon considering that the variables used to define social security contributions (social security and health) vary according to the censuses in each country. It should be noted that a worker can make autonomous contributions to social security (retirement and pensions) and to the health system.Proposed alternative indicator
Percentage of working-age adults contributing to the social security system.Operational definition
Numerator: Employed/working-age population with contributions to some social security system (social security and public or private health), (as agreed upon among the countries).
Denominator: Total working population.Variable(s) needed to calculate the indicator
1. Employed/working-age adults who make contributions to social security or pension schemes.
2. Makes health-care contributions owing to employed status.Status of the countries in the 2010 census round
Countries that have the necessary information: 5 (AR-BR-CO-EC-MX).Countries that have part of the necessary information: 4 (BO-CR-PA-PE).Countries that do not have the necessary information: 11 (CH-CU-GU-SL-HA-HO-NI-
PY-RD-UY-VE).
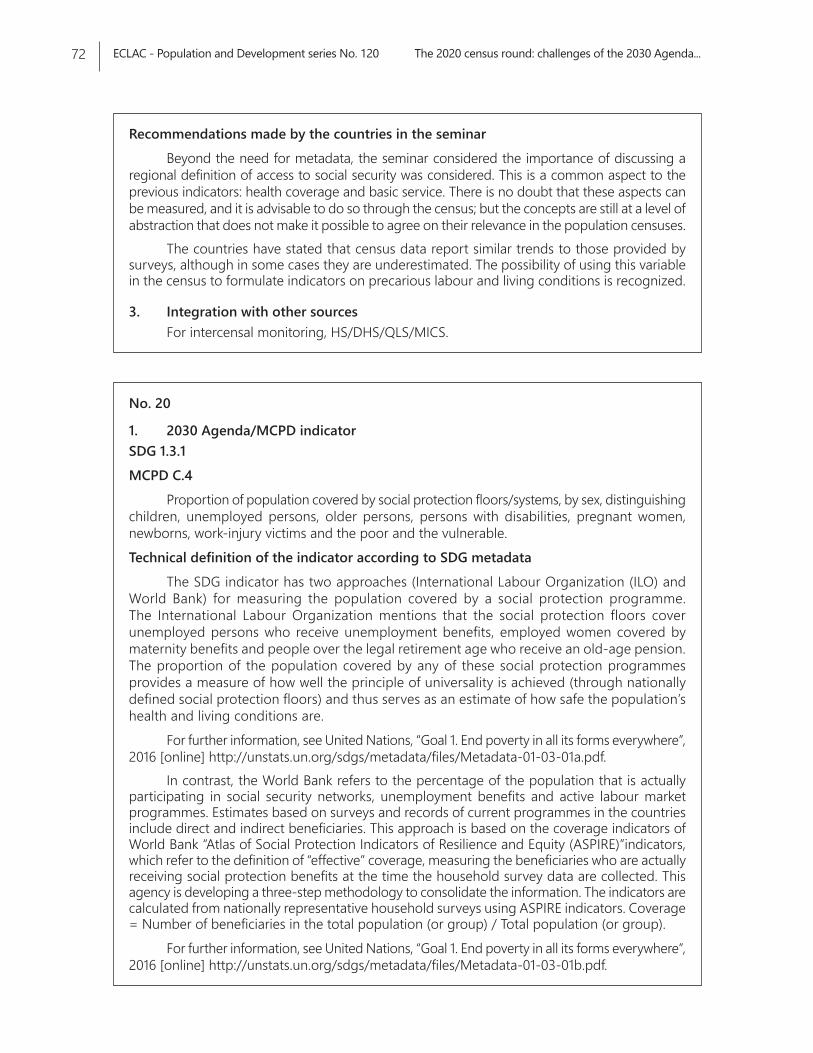
ECLAC - Population and Development series No. 120 The 2020 census round: challenges of the 2030 Agenda...72
Recommendations made by the countries in the seminarBeyond the need for metadata, the seminar considered the importance of discussing a
regional definition of access to social security was considered. This is a common aspect to the previous indicators: health coverage and basic service. There is no doubt that these aspects can be measured, and it is advisable to do so through the census; but the concepts are still at a level of abstraction that does not make it possible to agree on their relevance in the population censuses.
The countries have stated that census data report similar trends to those provided by surveys, although in some cases they are underestimated. The possibility of using this variable in the census to formulate indicators on precarious labour and living conditions is recognized.
3. Integration with other sourcesFor intercensal monitoring, HS/DHS/QLS/MICS.
No. 20
1. 2030 Agenda/MCPD indicatorSDG 1.3.1MCPD C.4
Proportion of population covered by social protection floors/systems, by sex, distinguishing children, unemployed persons, older persons, persons with disabilities, pregnant women, newborns, work-injury victims and the poor and the vulnerable.Technical definition of the indicator according to SDG metadata
The SDG indicator has two approaches (International Labour Organization (ILO) and World Bank) for measuring the population covered by a social protection programme. The International Labour Organization mentions that the social protection floors cover unemployed persons who receive unemployment benefits, employed women covered by maternity benefits and people over the legal retirement age who receive an old-age pension. The proportion of the population covered by any of these social protection programmes provides a measure of how well the principle of universality is achieved (through nationally defined social protection floors) and thus serves as an estimate of how safe the population’s health and living conditions are.
For further information, see United Nations, “Goal 1. End poverty in all its forms everywhere”, 2016 [online] http://unstats.un.org/sdgs/metadata/files/Metadata-01-03-01a.pdf.
In contrast, the World Bank refers to the percentage of the population that is actually participating in social security networks, unemployment benefits and active labour market programmes. Estimates based on surveys and records of current programmes in the countries include direct and indirect beneficiaries. This approach is based on the coverage indicators of World Bank “Atlas of Social Protection Indicators of Resilience and Equity (ASPIRE)”indicators, which refer to the definition of “effective” coverage, measuring the beneficiaries who are actually receiving social protection benefits at the time the household survey data are collected. This agency is developing a three-step methodology to consolidate the information. The indicators are calculated from nationally representative household surveys using ASPIRE indicators. Coverage = Number of beneficiaries in the total population (or group) / Total population (or group).
For further information, see United Nations, “Goal 1. End poverty in all its forms everywhere”, 2016 [online] http://unstats.un.org/sdgs/metadata/files/Metadata-01-03-01b.pdf.
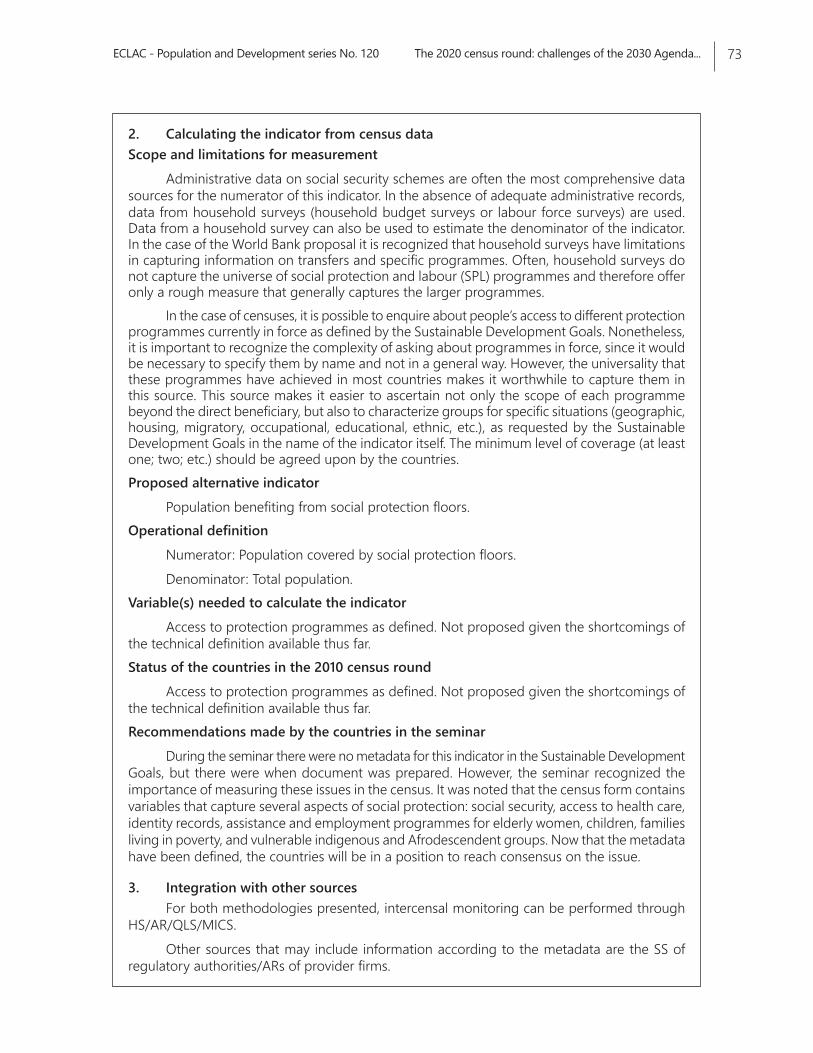
ECLAC - Population and Development series No. 120 The 2020 census round: challenges of the 2030 Agenda... 73
2. Calculating the indicator from census dataScope and limitations for measurement
Administrative data on social security schemes are often the most comprehensive data sources for the numerator of this indicator. In the absence of adequate administrative records, data from household surveys (household budget surveys or labour force surveys) are used. Data from a household survey can also be used to estimate the denominator of the indicator. In the case of the World Bank proposal it is recognized that household surveys have limitations in capturing information on transfers and specific programmes. Often, household surveys do not capture the universe of social protection and labour (SPL) programmes and therefore offer only a rough measure that generally captures the larger programmes.
In the case of censuses, it is possible to enquire about people’s access to different protection programmes currently in force as defined by the Sustainable Development Goals. Nonetheless, it is important to recognize the complexity of asking about programmes in force, since it would be necessary to specify them by name and not in a general way. However, the universality that these programmes have achieved in most countries makes it worthwhile to capture them in this source. This source makes it easier to ascertain not only the scope of each programme beyond the direct beneficiary, but also to characterize groups for specific situations (geographic, housing, migratory, occupational, educational, ethnic, etc.), as requested by the Sustainable Development Goals in the name of the indicator itself. The minimum level of coverage (at least one; two; etc.) should be agreed upon by the countries. Proposed alternative indicator
Population benefiting from social protection floors.Operational definition
Numerator: Population covered by social protection floors.Denominator: Total population.
Variable(s) needed to calculate the indicatorAccess to protection programmes as defined. Not proposed given the shortcomings of
the technical definition available thus far.Status of the countries in the 2010 census round
Access to protection programmes as defined. Not proposed given the shortcomings of the technical definition available thus far.Recommendations made by the countries in the seminar
During the seminar there were no metadata for this indicator in the Sustainable Development Goals, but there were when document was prepared. However, the seminar recognized the importance of measuring these issues in the census. It was noted that the census form contains variables that capture several aspects of social protection: social security, access to health care, identity records, assistance and employment programmes for elderly women, children, families living in poverty, and vulnerable indigenous and Afrodescendent groups. Now that the metadata have been defined, the countries will be in a position to reach consensus on the issue.
3. Integration with other sourcesFor both methodologies presented, intercensal monitoring can be performed through
HS/AR/QLS/MICS. Other sources that may include information according to the metadata are the SS of
regulatory authorities/ARs of provider firms.
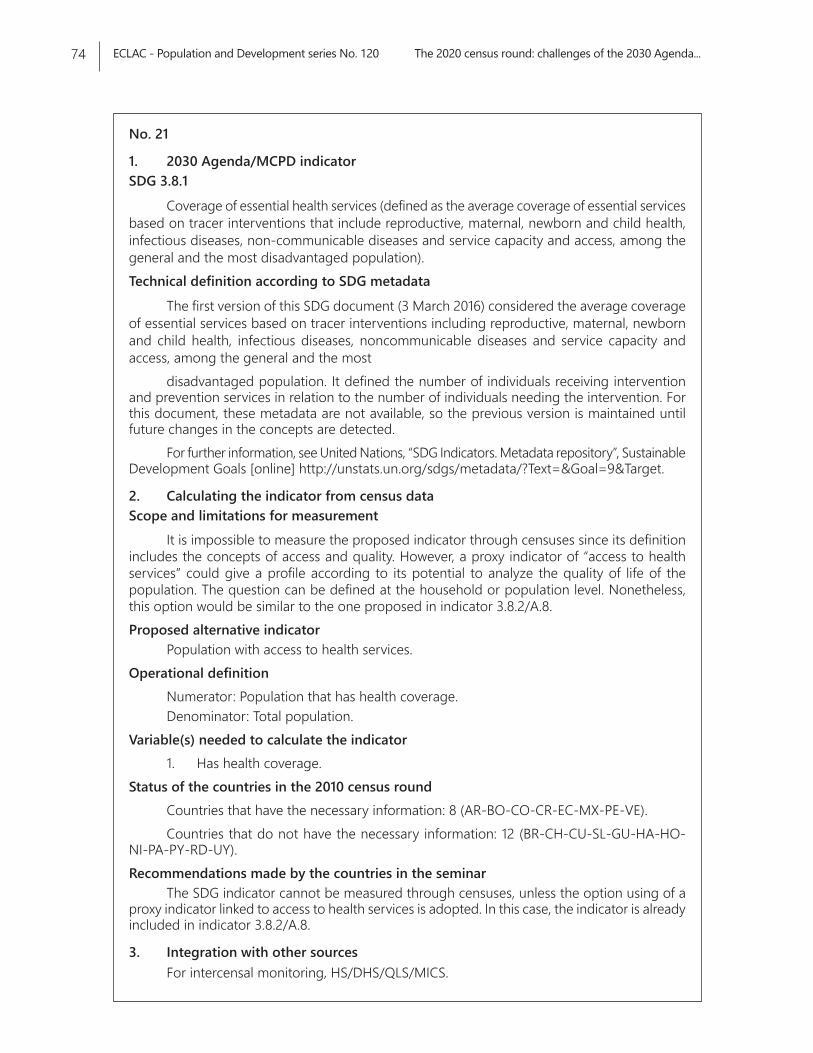
ECLAC - Population and Development series No. 120 The 2020 census round: challenges of the 2030 Agenda...74
No. 21
1. 2030 Agenda/MCPD indicatorSDG 3.8.1
Coverage of essential health services (defined as the average coverage of essential services based on tracer interventions that include reproductive, maternal, newborn and child health, infectious diseases, non-communicable diseases and service capacity and access, among the general and the most disadvantaged population).Technical definition according to SDG metadata
The first version of this SDG document (3 March 2016) considered the average coverage of essential services based on tracer interventions including reproductive, maternal, newborn and child health, infectious diseases, noncommunicable diseases and service capacity and access, among the general and the most
disadvantaged population. It defined the number of individuals receiving intervention and prevention services in relation to the number of individuals needing the intervention. For this document, these metadata are not available, so the previous version is maintained until future changes in the concepts are detected.
For further information, see United Nations, “SDG Indicators. Metadata repository”, Sustainable Development Goals [online] http://unstats.un.org/sdgs/metadata/?Text=&Goal=9&Target.
2. Calculating the indicator from census dataScope and limitations for measurement
It is impossible to measure the proposed indicator through censuses since its definition includes the concepts of access and quality. However, a proxy indicator of “access to health services” could give a profile according to its potential to analyze the quality of life of the population. The question can be defined at the household or population level. Nonetheless, this option would be similar to the one proposed in indicator 3.8.2/A.8. Proposed alternative indicator
Population with access to health services.Operational definition
Numerator: Population that has health coverage.Denominator: Total population.
Variable(s) needed to calculate the indicator1. Has health coverage.
Status of the countries in the 2010 census roundCountries that have the necessary information: 8 (AR-BO-CO-CR-EC-MX-PE-VE).Countries that do not have the necessary information: 12 (BR-CH-CU-SL-GU-HA-HO-
NI-PA-PY-RD-UY).Recommendations made by the countries in the seminar
The SDG indicator cannot be measured through censuses, unless the option using of a proxy indicator linked to access to health services is adopted. In this case, the indicator is already included in indicator 3.8.2/A.8.
3. Integration with other sourcesFor intercensal monitoring, HS/DHS/QLS/MICS.
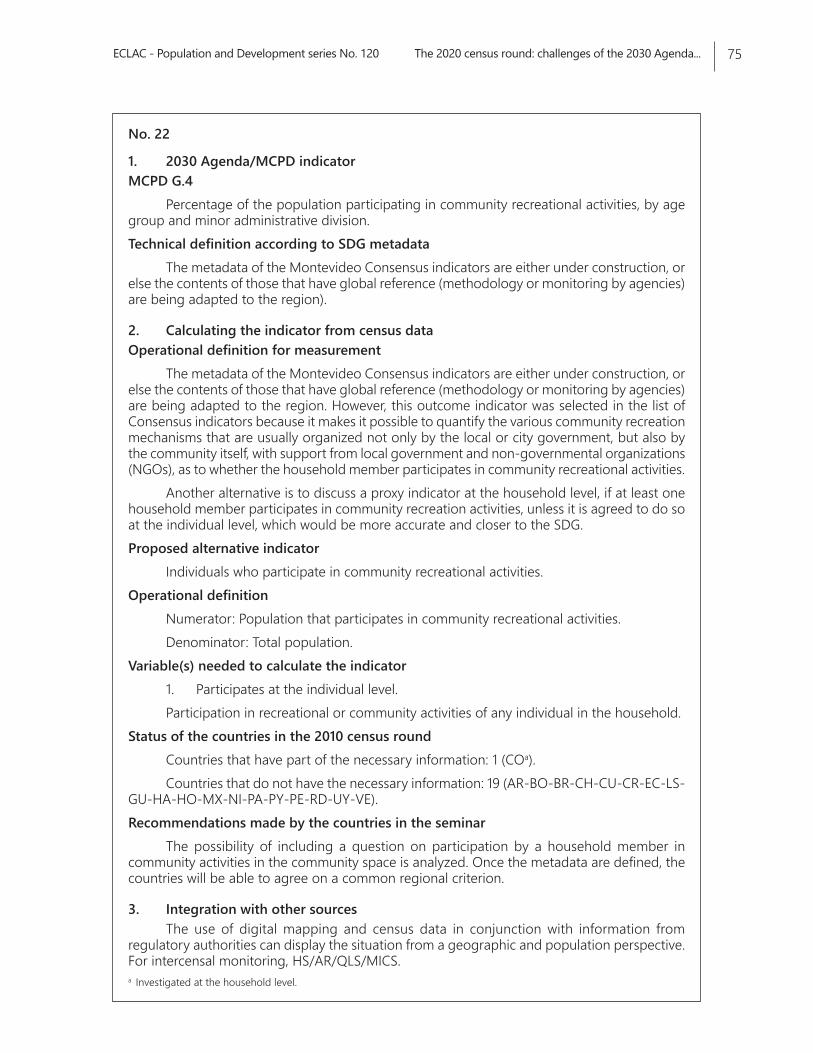
ECLAC - Population and Development series No. 120 The 2020 census round: challenges of the 2030 Agenda... 75
No. 22
1. 2030 Agenda/MCPD indicatorMCPD G.4
Percentage of the population participating in community recreational activities, by age group and minor administrative division.Technical definition according to SDG metadata
The metadata of the Montevideo Consensus indicators are either under construction, or else the contents of those that have global reference (methodology or monitoring by agencies) are being adapted to the region).
2. Calculating the indicator from census dataOperational definition for measurement
The metadata of the Montevideo Consensus indicators are either under construction, or else the contents of those that have global reference (methodology or monitoring by agencies) are being adapted to the region. However, this outcome indicator was selected in the list of Consensus indicators because it makes it possible to quantify the various community recreation mechanisms that are usually organized not only by the local or city government, but also by the community itself, with support from local government and non-governmental organizations (NGOs), as to whether the household member participates in community recreational activities.
Another alternative is to discuss a proxy indicator at the household level, if at least one household member participates in community recreation activities, unless it is agreed to do so at the individual level, which would be more accurate and closer to the SDG.Proposed alternative indicator
Individuals who participate in community recreational activities.Operational definition
Numerator: Population that participates in community recreational activities.Denominator: Total population.
Variable(s) needed to calculate the indicator1. Participates at the individual level.Participation in recreational or community activities of any individual in the household.
Status of the countries in the 2010 census roundCountries that have part of the necessary information: 1 (COa).Countries that do not have the necessary information: 19 (AR-BO-BR-CH-CU-CR-EC-LS-
GU-HA-HO-MX-NI-PA-PY-PE-RD-UY-VE).Recommendations made by the countries in the seminar
The possibility of including a question on participation by a household member in community activities in the community space is analyzed. Once the metadata are defined, the countries will be able to agree on a common regional criterion.
3. Integration with other sourcesThe use of digital mapping and census data in conjunction with information from
regulatory authorities can display the situation from a geographic and population perspective. For intercensal monitoring, HS/AR/QLS/MICS.a Investigated at the household level.
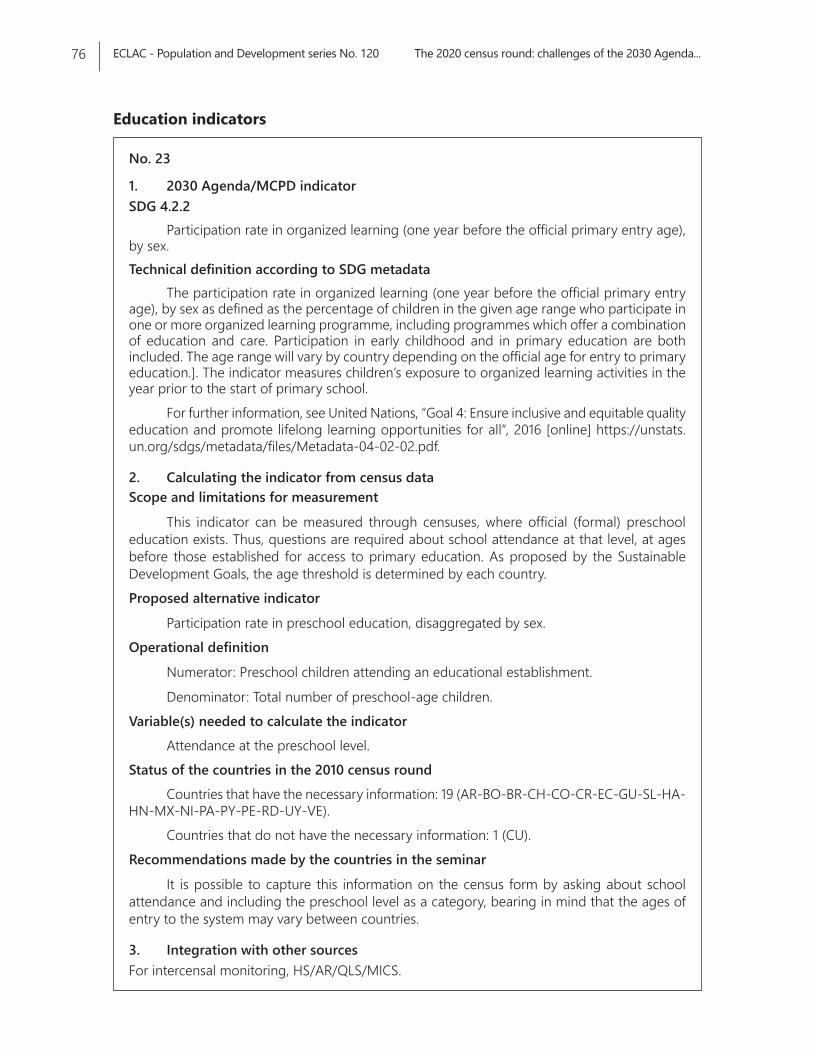
ECLAC - Population and Development series No. 120 The 2020 census round: challenges of the 2030 Agenda...76
No. 23
1. 2030 Agenda/MCPD indicatorSDG 4.2.2
Participation rate in organized learning (one year before the official primary entry age), by sex.Technical definition according to SDG metadata
The participation rate in organized learning (one year before the official primary entry age), by sex as defined as the percentage of children in the given age range who participate in one or more organized learning programme, including programmes which offer a combination of education and care. Participation in early childhood and in primary education are both included. The age range will vary by country depending on the official age for entry to primary education.]. The indicator measures children’s exposure to organized learning activities in the year prior to the start of primary school.
For further information, see United Nations, “Goal 4: Ensure inclusive and equitable quality education and promote lifelong learning opportunities for all”, 2016 [online] https://unstats.un.org/sdgs/metadata/files/Metadata-04-02-02.pdf.
2. Calculating the indicator from census dataScope and limitations for measurement
This indicator can be measured through censuses, where official (formal) preschool education exists. Thus, questions are required about school attendance at that level, at ages before those established for access to primary education. As proposed by the Sustainable Development Goals, the age threshold is determined by each country. Proposed alternative indicator
Participation rate in preschool education, disaggregated by sex.Operational definition
Numerator: Preschool children attending an educational establishment.
Denominator: Total number of preschool-age children.Variable(s) needed to calculate the indicator
Attendance at the preschool level.Status of the countries in the 2010 census round
Countries that have the necessary information: 19 (AR-BO-BR-CH-CO-CR-EC-GU-SL-HA-HN-MX-NI-PA-PY-PE-RD-UY-VE).
Countries that do not have the necessary information: 1 (CU).Recommendations made by the countries in the seminar
It is possible to capture this information on the census form by asking about school attendance and including the preschool level as a category, bearing in mind that the ages of entry to the system may vary between countries.
3. Integration with other sourcesFor intercensal monitoring, HS/AR/QLS/MICS.
Education indicators
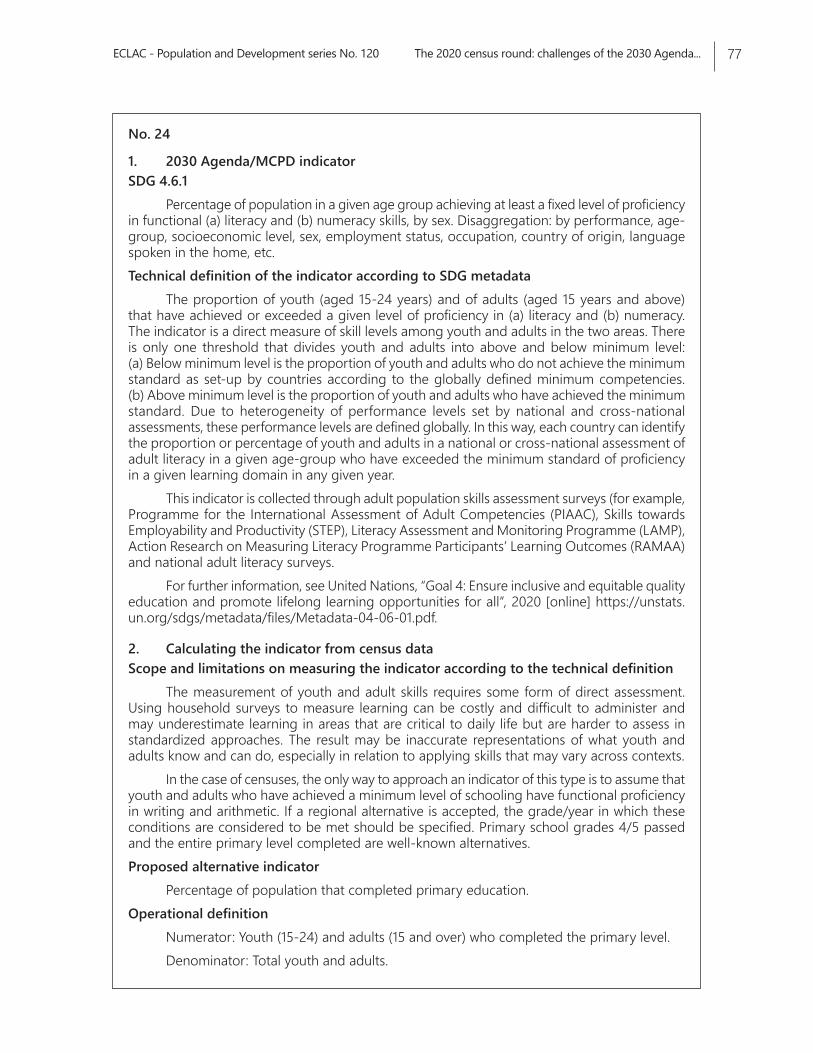
ECLAC - Population and Development series No. 120 The 2020 census round: challenges of the 2030 Agenda... 77
No. 24
1. 2030 Agenda/MCPD indicatorSDG 4.6.1
Percentage of population in a given age group achieving at least a fixed level of proficiency in functional (a) literacy and (b) numeracy skills, by sex. Disaggregation: by performance, age-group, socioeconomic level, sex, employment status, occupation, country of origin, language spoken in the home, etc.Technical definition of the indicator according to SDG metadata
The proportion of youth (aged 15-24 years) and of adults (aged 15 years and above) that have achieved or exceeded a given level of proficiency in (a) literacy and (b) numeracy. The indicator is a direct measure of skill levels among youth and adults in the two areas. There is only one threshold that divides youth and adults into above and below minimum level: (a) Below minimum level is the proportion of youth and adults who do not achieve the minimum standard as set-up by countries according to the globally defined minimum competencies. (b) Above minimum level is the proportion of youth and adults who have achieved the minimum standard. Due to heterogeneity of performance levels set by national and cross-national assessments, these performance levels are defined globally. In this way, each country can identify the proportion or percentage of youth and adults in a national or cross-national assessment of adult literacy in a given age-group who have exceeded the minimum standard of proficiency in a given learning domain in any given year.
This indicator is collected through adult population skills assessment surveys (for example, Programme for the International Assessment of Adult Competencies (PIAAC), Skills towards Employability and Productivity (STEP), Literacy Assessment and Monitoring Programme (LAMP), Action Research on Measuring Literacy Programme Participants’ Learning Outcomes (RAMAA) and national adult literacy surveys.
For further information, see United Nations, “Goal 4: Ensure inclusive and equitable quality education and promote lifelong learning opportunities for all”, 2020 [online] https://unstats.un.org/sdgs/metadata/files/Metadata-04-06-01.pdf.
2. Calculating the indicator from census dataScope and limitations on measuring the indicator according to the technical definition
The measurement of youth and adult skills requires some form of direct assessment. Using household surveys to measure learning can be costly and difficult to administer and may underestimate learning in areas that are critical to daily life but are harder to assess in standardized approaches. The result may be inaccurate representations of what youth and adults know and can do, especially in relation to applying skills that may vary across contexts.
In the case of censuses, the only way to approach an indicator of this type is to assume that youth and adults who have achieved a minimum level of schooling have functional proficiency in writing and arithmetic. If a regional alternative is accepted, the grade/year in which these conditions are considered to be met should be specified. Primary school grades 4/5 passed and the entire primary level completed are well-known alternatives.Proposed alternative indicator
Percentage of population that completed primary education. Operational definition
Numerator: Youth (15-24) and adults (15 and over) who completed the primary level.Denominator: Total youth and adults.
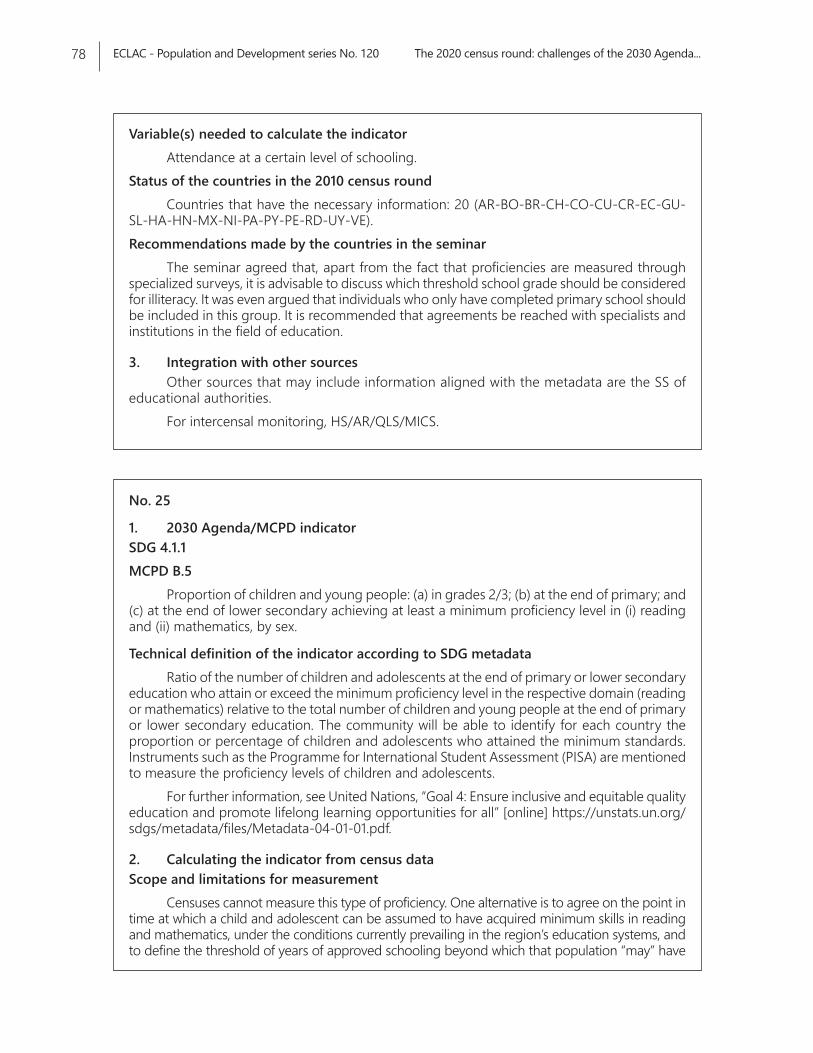
ECLAC - Population and Development series No. 120 The 2020 census round: challenges of the 2030 Agenda...78
Variable(s) needed to calculate the indicator Attendance at a certain level of schooling.
Status of the countries in the 2010 census roundCountries that have the necessary information: 20 (AR-BO-BR-CH-CO-CU-CR-EC-GU-
SL-HA-HN-MX-NI-PA-PY-PE-RD-UY-VE).Recommendations made by the countries in the seminar
The seminar agreed that, apart from the fact that proficiencies are measured through specialized surveys, it is advisable to discuss which threshold school grade should be considered for illiteracy. It was even argued that individuals who only have completed primary school should be included in this group. It is recommended that agreements be reached with specialists and institutions in the field of education.
3. Integration with other sourcesOther sources that may include information aligned with the metadata are the SS of
educational authorities.For intercensal monitoring, HS/AR/QLS/MICS.
No. 25
1. 2030 Agenda/MCPD indicatorSDG 4.1.1MCPD B.5
Proportion of children and young people: (a) in grades 2/3; (b) at the end of primary; and (c) at the end of lower secondary achieving at least a minimum proficiency level in (i) reading and (ii) mathematics, by sex.
Technical definition of the indicator according to SDG metadataRatio of the number of children and adolescents at the end of primary or lower secondary
education who attain or exceed the minimum proficiency level in the respective domain (reading or mathematics) relative to the total number of children and young people at the end of primary or lower secondary education. The community will be able to identify for each country the proportion or percentage of children and adolescents who attained the minimum standards. Instruments such as the Programme for International Student Assessment (PISA) are mentioned to measure the proficiency levels of children and adolescents.
For further information, see United Nations, “Goal 4: Ensure inclusive and equitable quality education and promote lifelong learning opportunities for all” [online] https://unstats.un.org/sdgs/metadata/files/Metadata-04-01-01.pdf.
2. Calculating the indicator from census dataScope and limitations for measurement
Censuses cannot measure this type of proficiency. One alternative is to agree on the point in time at which a child and adolescent can be assumed to have acquired minimum skills in reading and mathematics, under the conditions currently prevailing in the region’s education systems, and to define the threshold of years of approved schooling beyond which that population “may” have
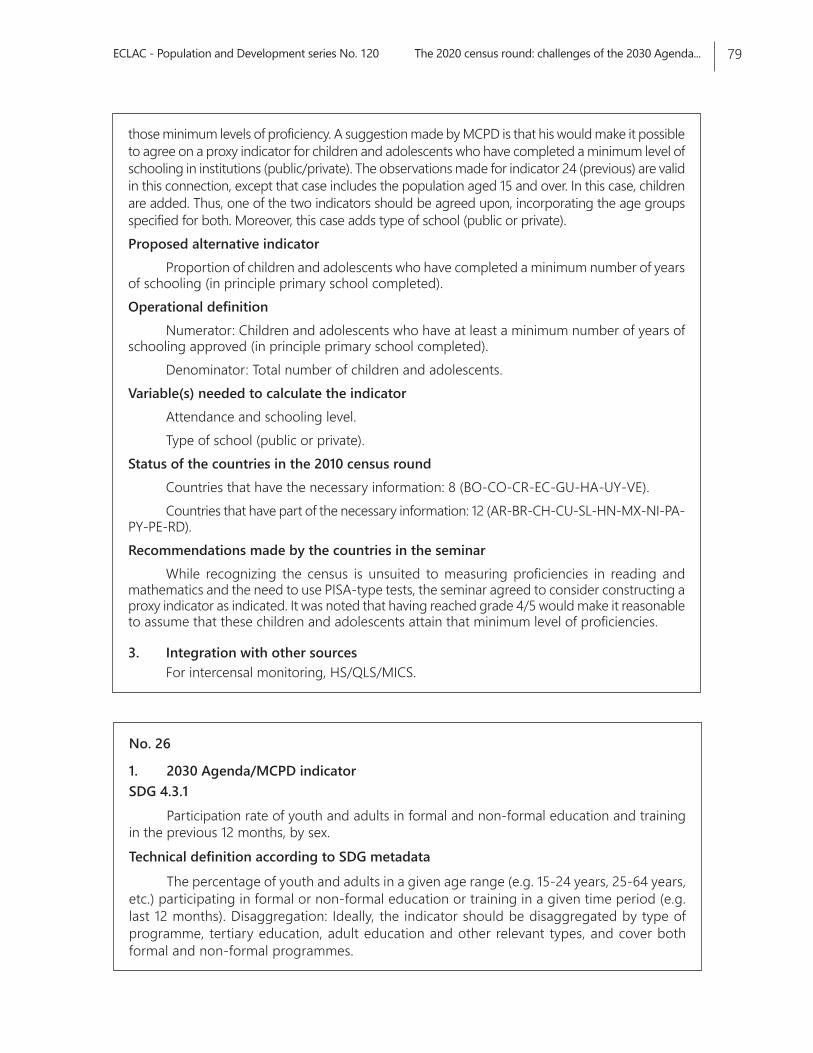
ECLAC - Population and Development series No. 120 The 2020 census round: challenges of the 2030 Agenda... 79
No. 26
1. 2030 Agenda/MCPD indicatorSDG 4.3.1
Participation rate of youth and adults in formal and non-formal education and training in the previous 12 months, by sex.Technical definition according to SDG metadata
The percentage of youth and adults in a given age range (e.g. 15-24 years, 25-64 years, etc.) participating in formal or non-formal education or training in a given time period (e.g. last 12 months). Disaggregation: Ideally, the indicator should be disaggregated by type of programme, tertiary education, adult education and other relevant types, and cover both formal and non-formal programmes.
those minimum levels of proficiency. A suggestion made by MCPD is that his would make it possible to agree on a proxy indicator for children and adolescents who have completed a minimum level of schooling in institutions (public/private). The observations made for indicator 24 (previous) are valid in this connection, except that case includes the population aged 15 and over. In this case, children are added. Thus, one of the two indicators should be agreed upon, incorporating the age groups specified for both. Moreover, this case adds type of school (public or private).Proposed alternative indicator
Proportion of children and adolescents who have completed a minimum number of years of schooling (in principle primary school completed).Operational definition
Numerator: Children and adolescents who have at least a minimum number of years of schooling approved (in principle primary school completed).
Denominator: Total number of children and adolescents.Variable(s) needed to calculate the indicator
Attendance and schooling level.Type of school (public or private).
Status of the countries in the 2010 census roundCountries that have the necessary information: 8 (BO-CO-CR-EC-GU-HA-UY-VE).Countries that have part of the necessary information: 12 (AR-BR-CH-CU-SL-HN-MX-NI-PA-
PY-PE-RD).Recommendations made by the countries in the seminar
While recognizing the census is unsuited to measuring proficiencies in reading and mathematics and the need to use PISA-type tests, the seminar agreed to consider constructing a proxy indicator as indicated. It was noted that having reached grade 4/5 would make it reasonable to assume that these children and adolescents attain that minimum level of proficiencies.
3. Integration with other sourcesFor intercensal monitoring, HS/QLS/MICS.
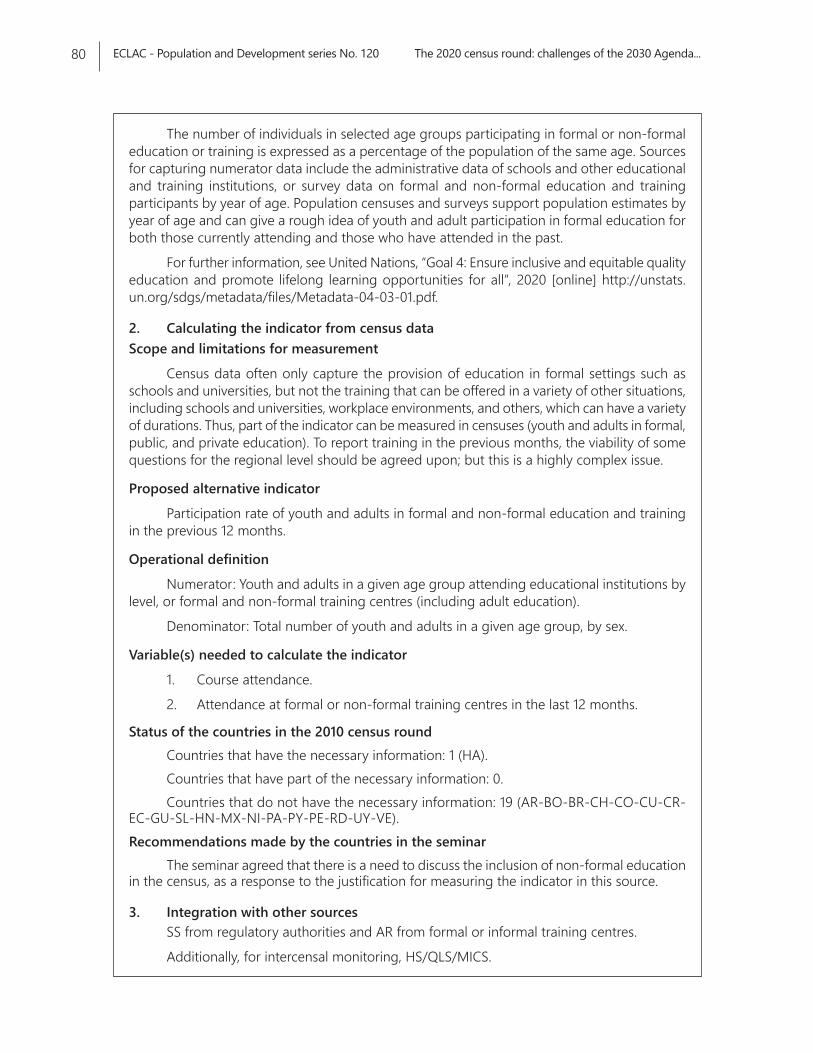
ECLAC - Population and Development series No. 120 The 2020 census round: challenges of the 2030 Agenda...80
The number of individuals in selected age groups participating in formal or non-formal education or training is expressed as a percentage of the population of the same age. Sources for capturing numerator data include the administrative data of schools and other educational and training institutions, or survey data on formal and non-formal education and training participants by year of age. Population censuses and surveys support population estimates by year of age and can give a rough idea of youth and adult participation in formal education for both those currently attending and those who have attended in the past.
For further information, see United Nations, “Goal 4: Ensure inclusive and equitable quality education and promote lifelong learning opportunities for all”, 2020 [online] http://unstats.un.org/sdgs/metadata/files/Metadata-04-03-01.pdf.
2. Calculating the indicator from census dataScope and limitations for measurement
Census data often only capture the provision of education in formal settings such as schools and universities, but not the training that can be offered in a variety of other situations, including schools and universities, workplace environments, and others, which can have a variety of durations. Thus, part of the indicator can be measured in censuses (youth and adults in formal, public, and private education). To report training in the previous months, the viability of some questions for the regional level should be agreed upon; but this is a highly complex issue.
Proposed alternative indicator
Participation rate of youth and adults in formal and non-formal education and training in the previous 12 months.
Operational definition
Numerator: Youth and adults in a given age group attending educational institutions by level, or formal and non-formal training centres (including adult education).
Denominator: Total number of youth and adults in a given age group, by sex.
Variable(s) needed to calculate the indicator
1. Course attendance.
2. Attendance at formal or non-formal training centres in the last 12 months.
Status of the countries in the 2010 census round Countries that have the necessary information: 1 (HA).Countries that have part of the necessary information: 0. Countries that do not have the necessary information: 19 (AR-BO-BR-CH-CO-CU-CR-
EC-GU-SL-HN-MX-NI-PA-PY-PE-RD-UY-VE).Recommendations made by the countries in the seminar
The seminar agreed that there is a need to discuss the inclusion of non-formal education in the census, as a response to the justification for measuring the indicator in this source.
3. Integration with other sourcesSS from regulatory authorities and AR from formal or informal training centres.
Additionally, for intercensal monitoring, HS/QLS/MICS.
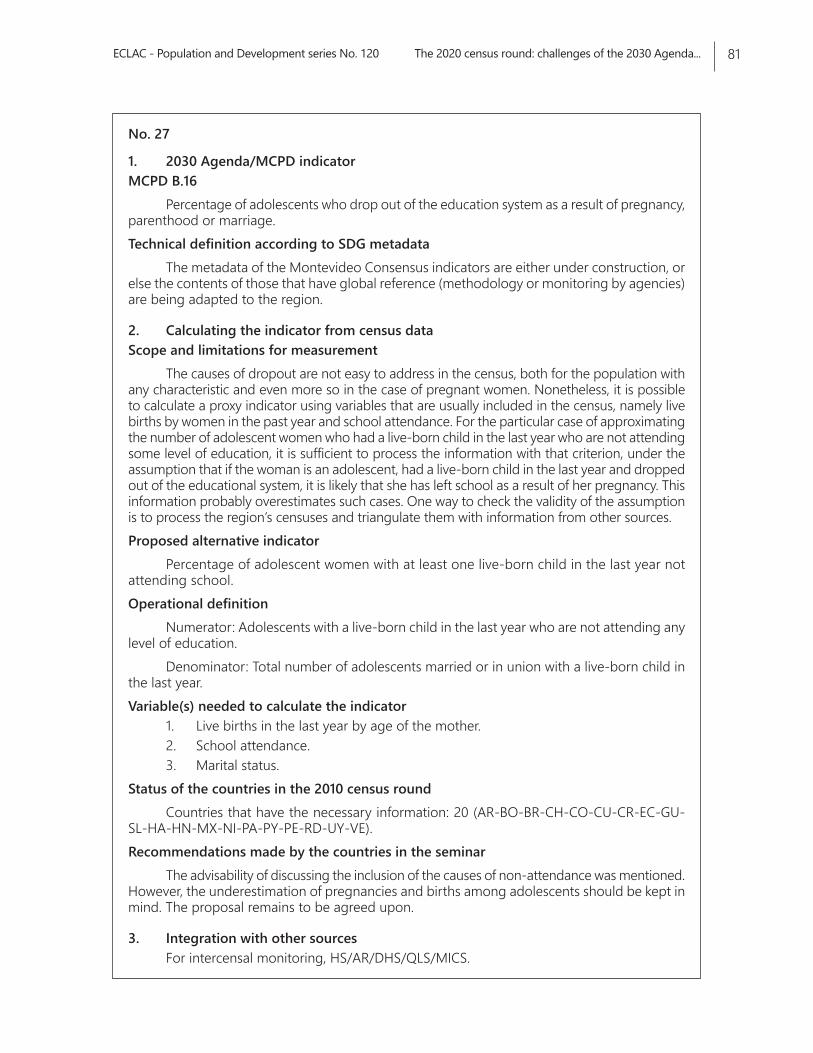
ECLAC - Population and Development series No. 120 The 2020 census round: challenges of the 2030 Agenda... 81
No. 27
1. 2030 Agenda/MCPD indicatorMCPD B.16
Percentage of adolescents who drop out of the education system as a result of pregnancy, parenthood or marriage.Technical definition according to SDG metadata
The metadata of the Montevideo Consensus indicators are either under construction, or else the contents of those that have global reference (methodology or monitoring by agencies) are being adapted to the region.
2. Calculating the indicator from census dataScope and limitations for measurement
The causes of dropout are not easy to address in the census, both for the population with any characteristic and even more so in the case of pregnant women. Nonetheless, it is possible to calculate a proxy indicator using variables that are usually included in the census, namely live births by women in the past year and school attendance. For the particular case of approximating the number of adolescent women who had a live-born child in the last year who are not attending some level of education, it is sufficient to process the information with that criterion, under the assumption that if the woman is an adolescent, had a live-born child in the last year and dropped out of the educational system, it is likely that she has left school as a result of her pregnancy. This information probably overestimates such cases. One way to check the validity of the assumption is to process the region’s censuses and triangulate them with information from other sources.Proposed alternative indicator
Percentage of adolescent women with at least one live-born child in the last year not attending school.Operational definition
Numerator: Adolescents with a live-born child in the last year who are not attending any level of education.
Denominator: Total number of adolescents married or in union with a live-born child in the last year.Variable(s) needed to calculate the indicator
1. Live births in the last year by age of the mother.2. School attendance.3. Marital status.
Status of the countries in the 2010 census roundCountries that have the necessary information: 20 (AR-BO-BR-CH-CO-CU-CR-EC-GU-
SL-HA-HN-MX-NI-PA-PY-PE-RD-UY-VE).Recommendations made by the countries in the seminar
The advisability of discussing the inclusion of the causes of non-attendance was mentioned. However, the underestimation of pregnancies and births among adolescents should be kept in mind. The proposal remains to be agreed upon.
3. Integration with other sourcesFor intercensal monitoring, HS/AR/DHS/QLS/MICS.
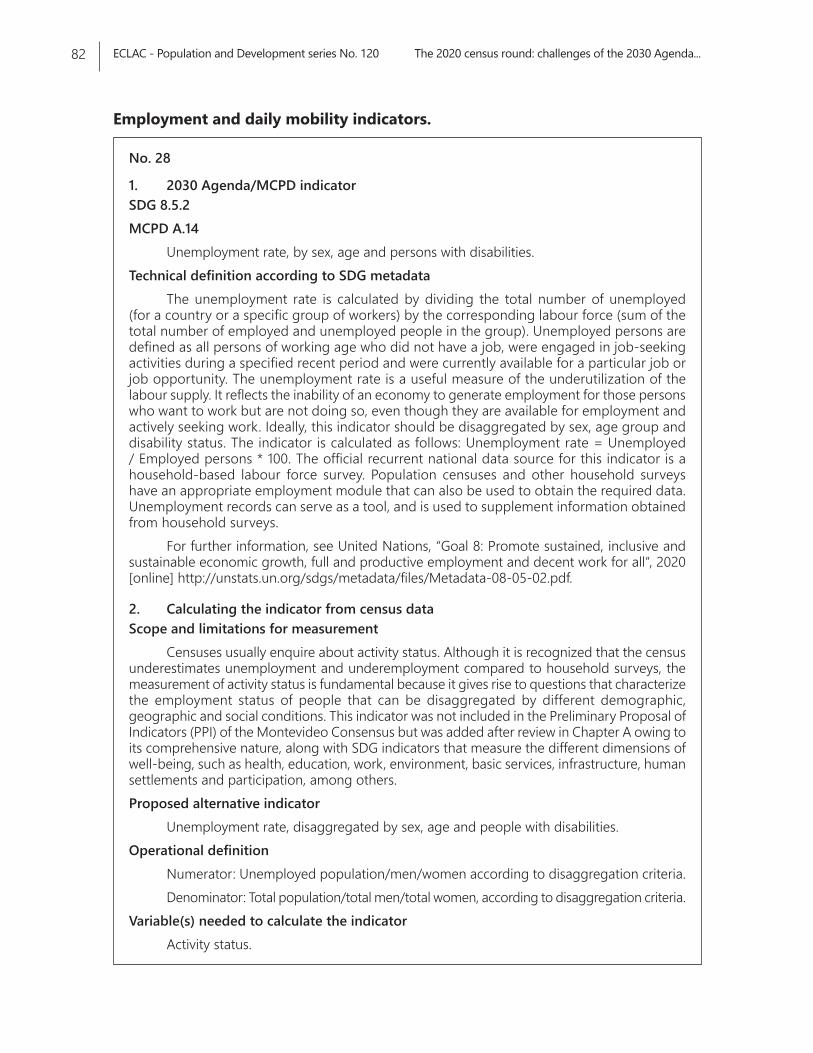
ECLAC - Population and Development series No. 120 The 2020 census round: challenges of the 2030 Agenda...82
No. 28
1. 2030 Agenda/MCPD indicatorSDG 8.5.2MCPD A.14
Unemployment rate, by sex, age and persons with disabilities.Technical definition according to SDG metadata
The unemployment rate is calculated by dividing the total number of unemployed (for a country or a specific group of workers) by the corresponding labour force (sum of the total number of employed and unemployed people in the group). Unemployed persons are defined as all persons of working age who did not have a job, were engaged in job-seeking activities during a specified recent period and were currently available for a particular job or job opportunity. The unemployment rate is a useful measure of the underutilization of the labour supply. It reflects the inability of an economy to generate employment for those persons who want to work but are not doing so, even though they are available for employment and actively seeking work. Ideally, this indicator should be disaggregated by sex, age group and disability status. The indicator is calculated as follows: Unemployment rate = Unemployed / Employed persons * 100. The official recurrent national data source for this indicator is a household-based labour force survey. Population censuses and other household surveys have an appropriate employment module that can also be used to obtain the required data. Unemployment records can serve as a tool, and is used to supplement information obtained from household surveys.
For further information, see United Nations, “Goal 8: Promote sustained, inclusive and sustainable economic growth, full and productive employment and decent work for all”, 2020 [online] http://unstats.un.org/sdgs/metadata/files/Metadata-08-05-02.pdf.
2. Calculating the indicator from census dataScope and limitations for measurement
Censuses usually enquire about activity status. Although it is recognized that the census underestimates unemployment and underemployment compared to household surveys, the measurement of activity status is fundamental because it gives rise to questions that characterize the employment status of people that can be disaggregated by different demographic, geographic and social conditions. This indicator was not included in the Preliminary Proposal of Indicators (PPI) of the Montevideo Consensus but was added after review in Chapter A owing to its comprehensive nature, along with SDG indicators that measure the different dimensions of well-being, such as health, education, work, environment, basic services, infrastructure, human settlements and participation, among others. Proposed alternative indicator
Unemployment rate, disaggregated by sex, age and people with disabilities.Operational definition
Numerator: Unemployed population/men/women according to disaggregation criteria.Denominator: Total population/total men/total women, according to disaggregation criteria.
Variable(s) needed to calculate the indicatorActivity status.
Employment and daily mobility indicators.
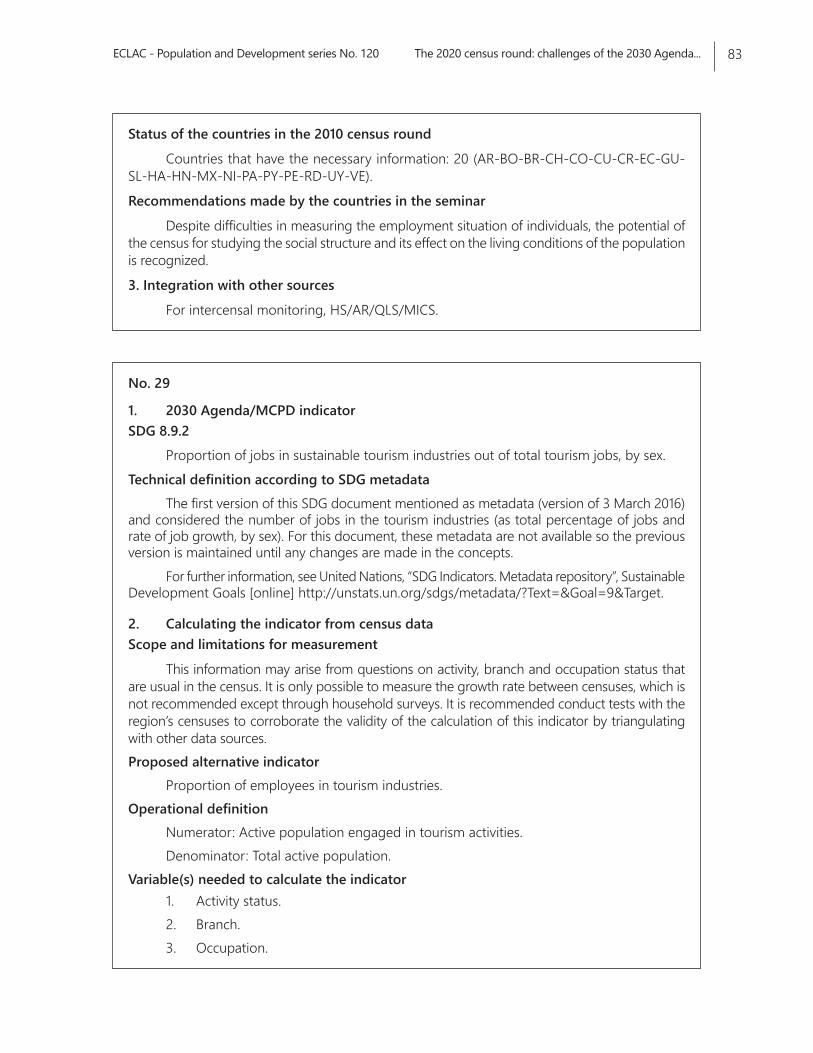
ECLAC - Population and Development series No. 120 The 2020 census round: challenges of the 2030 Agenda... 83
Status of the countries in the 2010 census round
Countries that have the necessary information: 20 (AR-BO-BR-CH-CO-CU-CR-EC-GU-SL-HA-HN-MX-NI-PA-PY-PE-RD-UY-VE).
Recommendations made by the countries in the seminar
Despite difficulties in measuring the employment situation of individuals, the potential of the census for studying the social structure and its effect on the living conditions of the population is recognized.
3. Integration with other sources
For intercensal monitoring, HS/AR/QLS/MICS.
No. 29
1. 2030 Agenda/MCPD indicatorSDG 8.9.2
Proportion of jobs in sustainable tourism industries out of total tourism jobs, by sex.Technical definition according to SDG metadata
The first version of this SDG document mentioned as metadata (version of 3 March 2016) and considered the number of jobs in the tourism industries (as total percentage of jobs and rate of job growth, by sex). For this document, these metadata are not available so the previous version is maintained until any changes are made in the concepts.
For further information, see United Nations, “SDG Indicators. Metadata repository”, Sustainable Development Goals [online] http://unstats.un.org/sdgs/metadata/?Text=&Goal=9&Target.
2. Calculating the indicator from census dataScope and limitations for measurement
This information may arise from questions on activity, branch and occupation status that are usual in the census. It is only possible to measure the growth rate between censuses, which is not recommended except through household surveys. It is recommended conduct tests with the region’s censuses to corroborate the validity of the calculation of this indicator by triangulating with other data sources.Proposed alternative indicator
Proportion of employees in tourism industries.Operational definition
Numerator: Active population engaged in tourism activities.Denominator: Total active population.
Variable(s) needed to calculate the indicator1. Activity status.2. Branch.3. Occupation.
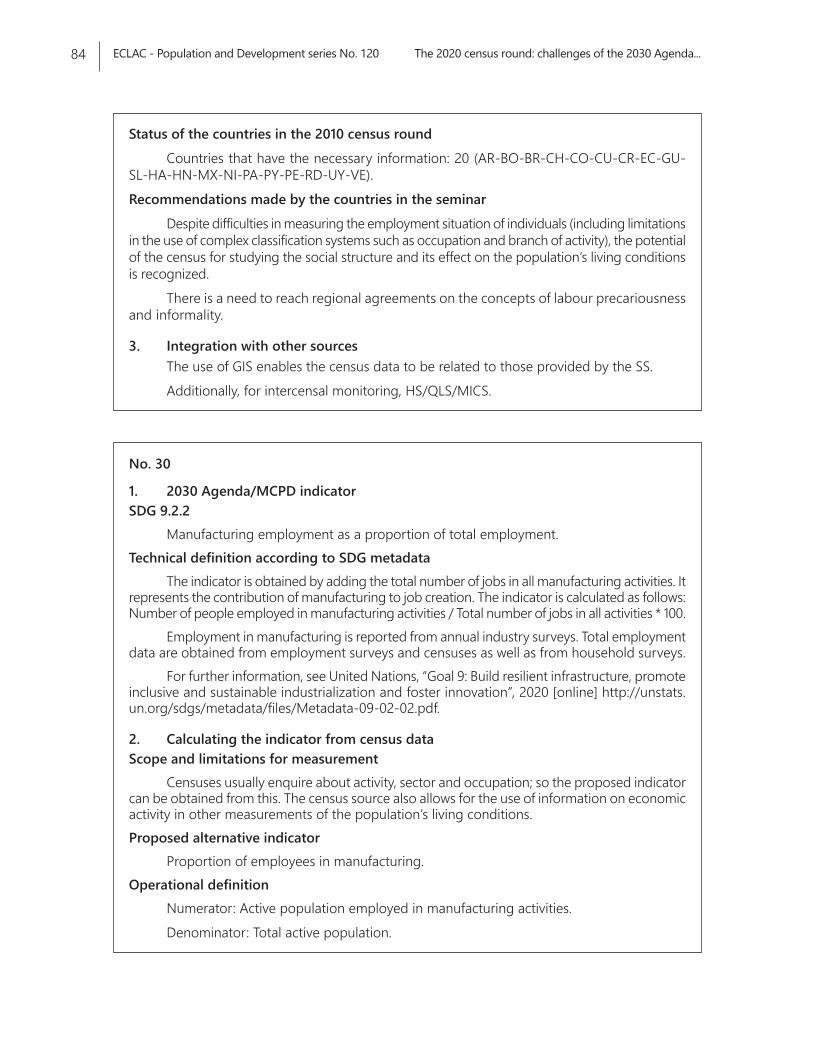
ECLAC - Population and Development series No. 120 The 2020 census round: challenges of the 2030 Agenda...84
Status of the countries in the 2010 census roundCountries that have the necessary information: 20 (AR-BO-BR-CH-CO-CU-CR-EC-GU-
SL-HA-HN-MX-NI-PA-PY-PE-RD-UY-VE).Recommendations made by the countries in the seminar
Despite difficulties in measuring the employment situation of individuals (including limitations in the use of complex classification systems such as occupation and branch of activity), the potential of the census for studying the social structure and its effect on the population’s living conditions is recognized.
There is a need to reach regional agreements on the concepts of labour precariousness and informality.
3. Integration with other sourcesThe use of GIS enables the census data to be related to those provided by the SS. Additionally, for intercensal monitoring, HS/QLS/MICS.
No. 30
1. 2030 Agenda/MCPD indicatorSDG 9.2.2
Manufacturing employment as a proportion of total employment.Technical definition according to SDG metadata
The indicator is obtained by adding the total number of jobs in all manufacturing activities. It represents the contribution of manufacturing to job creation. The indicator is calculated as follows: Number of people employed in manufacturing activities / Total number of jobs in all activities * 100.
Employment in manufacturing is reported from annual industry surveys. Total employment data are obtained from employment surveys and censuses as well as from household surveys.
For further information, see United Nations, “Goal 9: Build resilient infrastructure, promote inclusive and sustainable industrialization and foster innovation”, 2020 [online] http://unstats.un.org/sdgs/metadata/files/Metadata-09-02-02.pdf.
2. Calculating the indicator from census dataScope and limitations for measurement
Censuses usually enquire about activity, sector and occupation; so the proposed indicator can be obtained from this. The census source also allows for the use of information on economic activity in other measurements of the population’s living conditions.Proposed alternative indicator
Proportion of employees in manufacturing.Operational definition
Numerator: Active population employed in manufacturing activities.Denominator: Total active population.
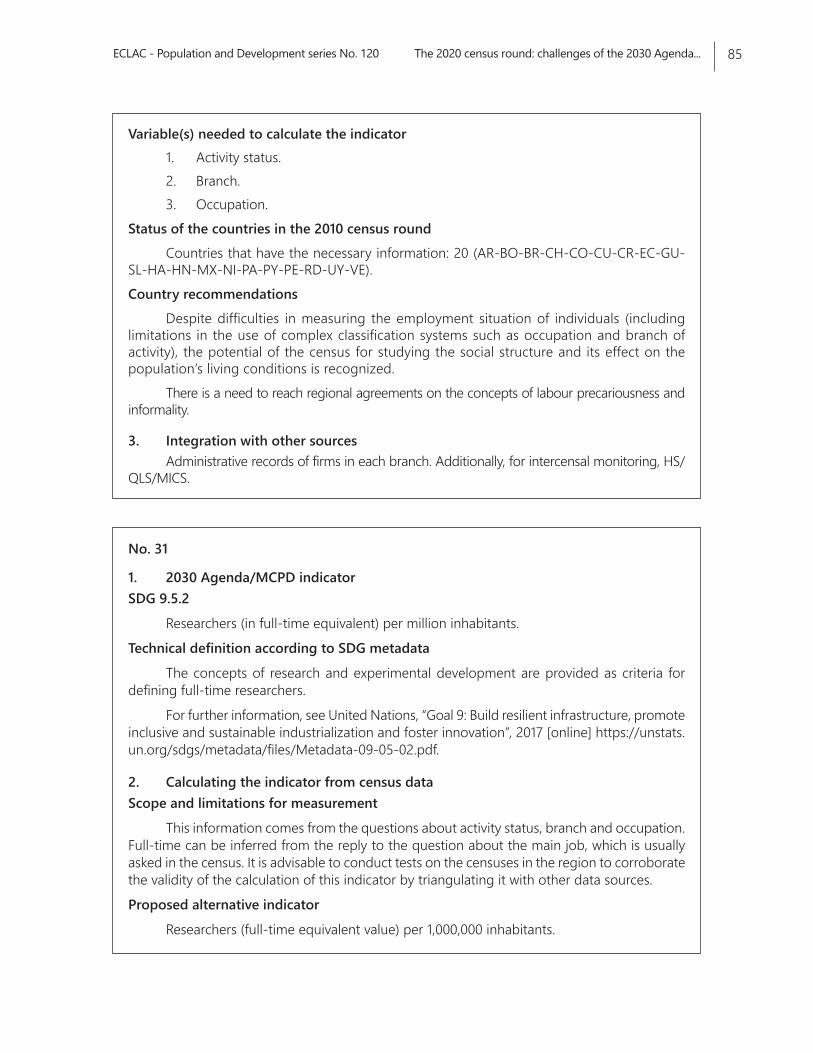
ECLAC - Population and Development series No. 120 The 2020 census round: challenges of the 2030 Agenda... 85
Variable(s) needed to calculate the indicator1. Activity status.2. Branch.3. Occupation.
Status of the countries in the 2010 census roundCountries that have the necessary information: 20 (AR-BO-BR-CH-CO-CU-CR-EC-GU-
SL-HA-HN-MX-NI-PA-PY-PE-RD-UY-VE).Country recommendations
Despite difficulties in measuring the employment situation of individuals (including limitations in the use of complex classification systems such as occupation and branch of activity), the potential of the census for studying the social structure and its effect on the population’s living conditions is recognized.
There is a need to reach regional agreements on the concepts of labour precariousness and informality.
3. Integration with other sourcesAdministrative records of firms in each branch. Additionally, for intercensal monitoring, HS/
QLS/MICS.
No. 31
1. 2030 Agenda/MCPD indicatorSDG 9.5.2
Researchers (in full-time equivalent) per million inhabitants.
Technical definition according to SDG metadata
The concepts of research and experimental development are provided as criteria for defining full-time researchers.
For further information, see United Nations, “Goal 9: Build resilient infrastructure, promote inclusive and sustainable industrialization and foster innovation”, 2017 [online] https://unstats.un.org/sdgs/metadata/files/Metadata-09-05-02.pdf.
2. Calculating the indicator from census dataScope and limitations for measurement
This information comes from the questions about activity status, branch and occupation. Full-time can be inferred from the reply to the question about the main job, which is usually asked in the census. It is advisable to conduct tests on the censuses in the region to corroborate the validity of the calculation of this indicator by triangulating it with other data sources.
Proposed alternative indicator
Researchers (full-time equivalent value) per 1,000,000 inhabitants.
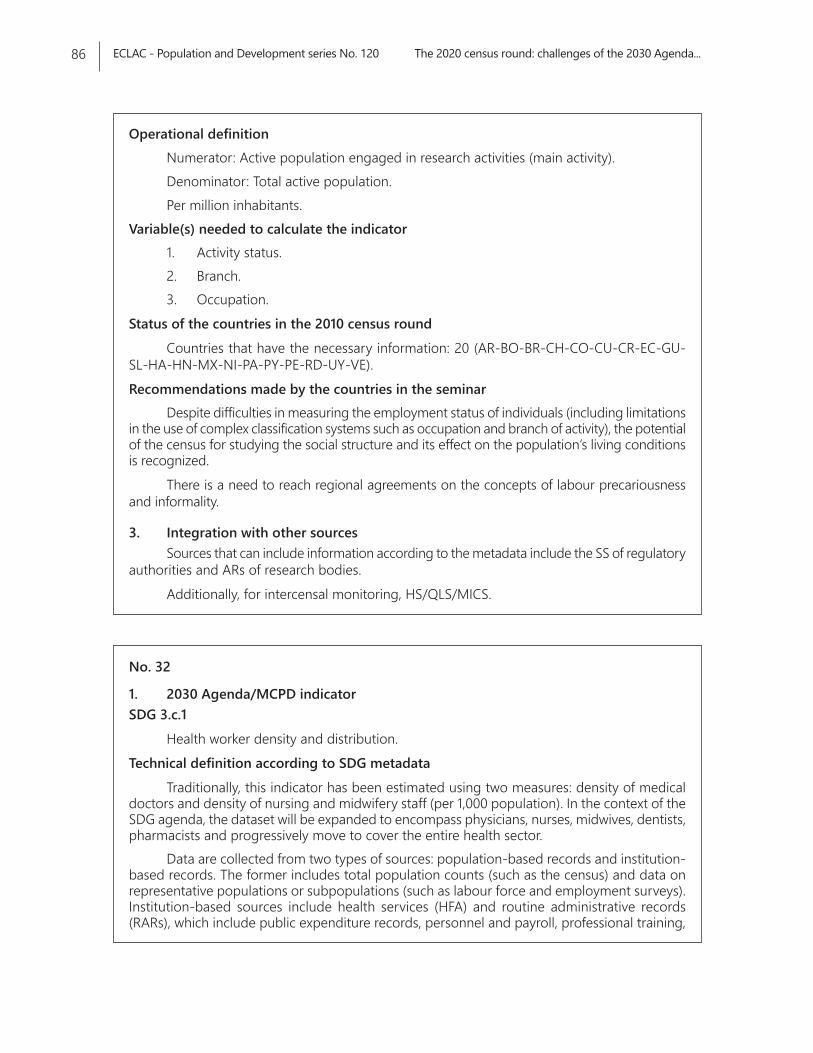
ECLAC - Population and Development series No. 120 The 2020 census round: challenges of the 2030 Agenda...86
Operational definitionNumerator: Active population engaged in research activities (main activity).Denominator: Total active population.Per million inhabitants.
Variable(s) needed to calculate the indicator1. Activity status.2. Branch.3. Occupation.
Status of the countries in the 2010 census roundCountries that have the necessary information: 20 (AR-BO-BR-CH-CO-CU-CR-EC-GU-
SL-HA-HN-MX-NI-PA-PY-PE-RD-UY-VE).Recommendations made by the countries in the seminar
Despite difficulties in measuring the employment status of individuals (including limitations in the use of complex classification systems such as occupation and branch of activity), the potential of the census for studying the social structure and its effect on the population’s living conditions is recognized.
There is a need to reach regional agreements on the concepts of labour precariousness and informality.
3. Integration with other sourcesSources that can include information according to the metadata include the SS of regulatory
authorities and ARs of research bodies.Additionally, for intercensal monitoring, HS/QLS/MICS.
No. 32
1. 2030 Agenda/MCPD indicatorSDG 3.c.1
Health worker density and distribution.Technical definition according to SDG metadata
Traditionally, this indicator has been estimated using two measures: density of medical doctors and density of nursing and midwifery staff (per 1,000 population). In the context of the SDG agenda, the dataset will be expanded to encompass physicians, nurses, midwives, dentists, pharmacists and progressively move to cover the entire health sector.
Data are collected from two types of sources: population-based records and institution-based records. The former includes total population counts (such as the census) and data on representative populations or subpopulations (such as labour force and employment surveys). Institution-based sources include health services (HFA) and routine administrative records (RARs), which include public expenditure records, personnel and payroll, professional training,
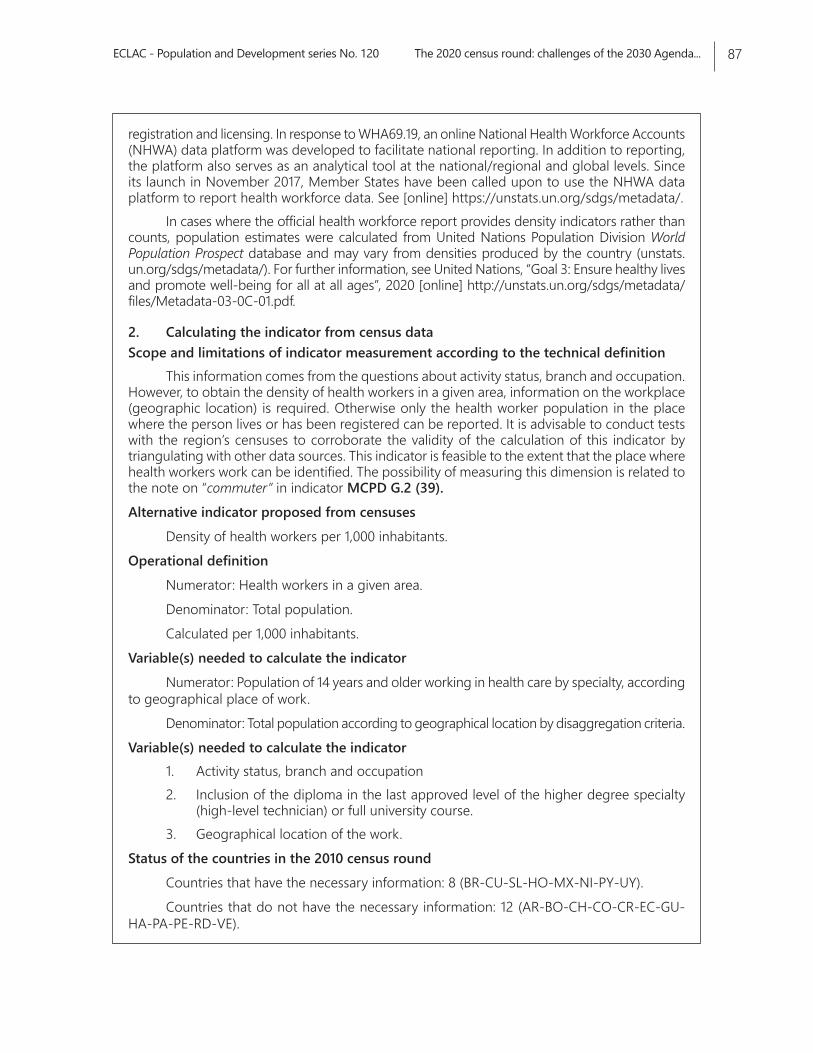
ECLAC - Population and Development series No. 120 The 2020 census round: challenges of the 2030 Agenda... 87
registration and licensing. In response to WHA69.19, an online National Health Workforce Accounts (NHWA) data platform was developed to facilitate national reporting. In addition to reporting, the platform also serves as an analytical tool at the national/regional and global levels. Since its launch in November 2017, Member States have been called upon to use the NHWA data platform to report health workforce data. See [online] https://unstats.un.org/sdgs/metadata/.
In cases where the official health workforce report provides density indicators rather than counts, population estimates were calculated from United Nations Population Division World Population Prospect database and may vary from densities produced by the country (unstats.un.org/sdgs/metadata/). For further information, see United Nations, “Goal 3: Ensure healthy lives and promote well-being for all at all ages”, 2020 [online] http://unstats.un.org/sdgs/metadata/files/Metadata-03-0C-01.pdf.
2. Calculating the indicator from census dataScope and limitations of indicator measurement according to the technical definition
This information comes from the questions about activity status, branch and occupation. However, to obtain the density of health workers in a given area, information on the workplace (geographic location) is required. Otherwise only the health worker population in the place where the person lives or has been registered can be reported. It is advisable to conduct tests with the region’s censuses to corroborate the validity of the calculation of this indicator by triangulating with other data sources. This indicator is feasible to the extent that the place where health workers work can be identified. The possibility of measuring this dimension is related to the note on “commuter” in indicator MCPD G.2 (39).Alternative indicator proposed from censuses
Density of health workers per 1,000 inhabitants.Operational definition
Numerator: Health workers in a given area.Denominator: Total population.Calculated per 1,000 inhabitants.
Variable(s) needed to calculate the indicatorNumerator: Population of 14 years and older working in health care by specialty, according
to geographical place of work.Denominator: Total population according to geographical location by disaggregation criteria.
Variable(s) needed to calculate the indicator 1. Activity status, branch and occupation2. Inclusion of the diploma in the last approved level of the higher degree specialty
(high-level technician) or full university course. 3. Geographical location of the work.
Status of the countries in the 2010 census roundCountries that have the necessary information: 8 (BR-CU-SL-HO-MX-NI-PY-UY).Countries that do not have the necessary information: 12 (AR-BO-CH-CO-CR-EC-GU-
HA-PA-PE-RD-VE).
ECLAC - Population and Development series No. 120 The 2020 census round: challenges of the 2030 Agenda...88
Recommendations made by the countries in the seminarDespite difficulties in measuring the employment situation of individuals (including
limitations in the use of complex classification systems such as occupation and branch of activity), the potential of the census for studying the social structure and its effect on the population’s living conditions is recognized.
There is a need to reach regional agreements on the concepts of labour precariousness and informality.
3. Integration with other sourcesThe use of Geographic Information Systems (GIS) with census data, in conjunction with
data from regulatory areas or health centres can display the situation with a geographic and population scope.
Additionally, for intercensal monitoring, HS/AR/QLS/MICS.
No. 33
1. 2030 Agenda/MCPD indicatorSDG 8.3.1MCPD A.12
Proportion of informal employment in non-agriculture employment, by sex.Technical definition according to SDG metadata
The first version of this SDG document (3 March 2016) mentioned as metadata and considered the number of jobs in informal jobs in non-agricultural sectors as a proportion of total non-agricultural employment. Informal employment comprises persons who in their primary activity or secondary jobs were categorized as (a) self-employed, workers, employers and employees of producers’ cooperatives in their own informal sector enterprises. The informal nature of their work is directly related to the characteristics of the enterprise; the production of goods exclusively for their own final use and the conditions of hiring, labour, social security and tax regulations under which these people work. For this document, these metadata are not available so the previous version is maintained until possible changes in the concepts are observed.
United Nations, “SDG Indicators. Metadata repository”, Sustainable Development Goals [online] http://unstats.un.org/sdgs/metadata/?Text=&Goal=9&Target.
2. Calculating the indicator from census dataScope and limitations for measurement
This indicator was not included in MCPD’s Preliminary Proposal for Indicators (PPI) but was added after review in Chapter A because of its comprehensive nature, as were indicators from the SDG that account for different dimensions of well-being, such as health, education, work, environment, basic services, infrastructure, human settlements and participation, among others.
This requires questions on economic activity, including those that allow for the estimation of informal work.
Given the importance of urban work, the seminar suggested that this indicator be calculated at this level.
ECLAC - Population and Development series No. 120 The 2020 census round: challenges of the 2030 Agenda... 89
Proposed alternative indicatorProportion of informal employment in non-agriculture employment.
Operational definitionNumerator: Population with precarious informal employment in the non-agriculture sector.Denominator: Total population.
Variable(s) needed to calculate the indicatorActivity status, branch and occupation.1. Deductions or contributions for pension schemes.2. Deductions or contributions for health care.3. Size of establishment.4. Number of hours worked.
Status of the countries in the 2010 census roundCountries that have part of the necessary information: 12 (AR-BR-CO-CR-EC-SL-HO-
MX-NI-PY-PE-VE).Countries that do not have the necessary information: 8 (BO-CH-CU-GU-HA-PA-RD-UY).
Recommendations made by the countries in the seminarDespite difficulties in measuring the employment situation of individuals (including
limitations in the use of complex classification systems such as occupation and branch of activity), the potential of the census for studying the social structure and its effect on the population’s living conditions is recognized.
There is a need to reach regional agreements on the concepts of labour precariousness and informality.
Also a need to reach a conceptual and operational definition of consensus on labour informality, which implies the deployment of a minimum set of questions. Some countries have implemented these and It is advisable to learn about this experience in order to seek consensus.
3. Integration with other sourcesFor intercensal monitoring, HS/QLS/MICS.
No. 34
1. 2030 Agenda/MCPD indicatorSDG 8.7.1MCPD B.2
Proportion and number of children aged 5–17 years engaged in child labour, by sex and age.Technical definition according to SDG metadata
Number of children aged 5-17 reported to have been involved in child labour in the past week divided by the total number of children aged 5-17 in the population multiplied by 100. The term child labour reflects the engagement of children in prohibited work and, more generally, the types of work that are being eliminated as socially and morally undesirable in accordance with
ECLAC - Population and Development series No. 120 The 2020 census round: challenges of the 2030 Agenda...90
national legislation and international conventions. The resolution’s target population of the consists of children between the ages of 5 and 17 who, during a specified period of time, were engaged in one or more of the following categories of activities: the worst forms of child labour, employment below the minimum age, and services.
For further information, see United Nations, “Goal 8: Promote sustained, inclusive and sustainable economic growth, full and productive employment and decent work for all”, 2019 [online] http://unstats.un.org/sdgs/metadata/files/Metadata-08-07-01.pdf.
2. Calculating the indicator from census dataScope and limitations for measurement
Although is well known that censuses underestimate the recruitment of minors, there is a tendency to lower the age at which employment is sought. Several countries in the region are already including children under 10 years of age, both on this topic and in that of fertility. This indicator was not included in MCPD’s Preliminary Indicator Proposal (PPI) but was added after review in Chapter A because of its comprehensive nature, as well as indicators from the SDG that measure the different dimensions of well-being, such as health, education, work, environment, basic services, infrastructure, human settlements and participation, among others.
Discuss whether to include the issue of child labour and from what age. Proposed alternative indicator
Proportion and number of children between 5 and 17 years of age who are engaged in child labour (minimum age to be defined).Operational definition
Numerator: Children between 5 and 17 years of age who work (minimum age to be defined)Denominator: Total children from 5 to 17 years old (minimum age to be defined).
Variable(s) needed to calculate the indicator1. Activity status.2. Age range from 5 years old.
Status of the countries in the 2010 census roundCountries that have the necessary information: 2 (EC-HO).Countries that do not have the necessary information:a 18 (AR-BO-BR-CH-CO-CR-CU-SL-
GU-HA-MX-NI-PA-PY-PE-RD-UY-VE).Recommendations made by the countries in the seminar
The subject is easier to measure through specialized surveys that require a specific module to identify work from 5 years of age and older. The topic is sensitive and could certainly be underestimated in a census exercise. It also requires the characterization and modification of the age filter to capture economic characteristics of the population aged 5 years and older, which would certainly invoke a large number of unspecified sensitive topics: income, hours worked, occupation, branch of activity and position at work.
However, the age threshold can be discussed, as some countries set it at 10 years and older.
3. Integration with other sourcesFor intercensal monitoring, HS/QLS/MICS.
a The age ranges used are: PE (6 years and older); BO-GU (7 years and older); BR-CO-SL-HA-NI-PA-PY-RD-VE (10 years and older); CR-MX-UY (12 years and older); AR (14 years and older); CU (15 years and older).
ECLAC - Population and Development series No. 120 The 2020 census round: challenges of the 2030 Agenda... 91
No. 35
1. 2030 Agenda/MCPD indicatorSDG 8.6.1MCPD B.7
Proportion of youth (aged 15–24 years) not in education, employment or training.Technical definition of the indicator according to SDG metadata
Not in education, employment or training (NEET) is defined as the percentage of young people (15-24 years old) who are not working (whether or not they are looking for work), not attending an educational institution or training programmes.
It is a measure that identifies young people who are part of youth unemployment, or discouraged, disabled, working at home and also potentially incorporated into the labour market.
According to the International Standard Classification of Education (ISCED), formal education is defined as education that is institutionalized, intentional, and planned through public organizations and recognized private bodies and, in their totality, make up the formal education system of a country. Non-formal education, like formal education is defined in ISCED as education that is institutionalized, intentional and planned by an education provider but is considered an addition, alternative and/or a complement to formal education. It may be short in duration and/or low in intensity and it is typically provided in the form of short courses, workshops or seminars. Informal learning is defined in ISCED as forms of learning that are intentional or deliberate, but not institutionalized. It is thus less organized and less structured than either formal or non-formal education. Informal learning may include learning activities that occur in the family, in the workplace, in the local community, and in daily life, on a self-directed, family-directed or socially-directed basis. For the purposes of this indicator, persons will be considered in education if they are in formal or non-formal education, as described above, but excluding informal learning.]
For further information, see United Nations, “Goal 8: Promote sustained, inclusive and sustainable economic growth, full and productive employment and decent work for all”, 2020 [online] https://unstats.un.org/sdgs/metadata/files/Metadata-08-06-01.pdf.
2. Calculating the indicator from census dataScope and limitations for measurement
This indicator is not included in MCPD’s Preliminary Indicator Proposal (PPI) but was added to address comments on the need to measure effective opportunities for adolescents and youth. It should be extended to the 25-29 age group to make it compatible with MCPD.
The relevance of including a question to capture formal or informal training should be discussed.
The NEET phenomenon has gained traction as an analytical entity to interpret its influence on the countries’ educational and labour markets. Likewise, its role in the reception of remittances sent to the countries. Apart from specialized surveys, the statistical system only captures access to formal education. However, it is time that the census captured this reality in the most objective manner. Knowing about access to education outside the formal system is a necessity today, when education supply is increasingly broad and heterogeneous. This is not only the case for the groups interested in this indicator, but also for other situations in which training broadens people’s work and knowledge (for example, teachers who take extracurricular courses).
This issue is also taken up in indicator 4.3.1.
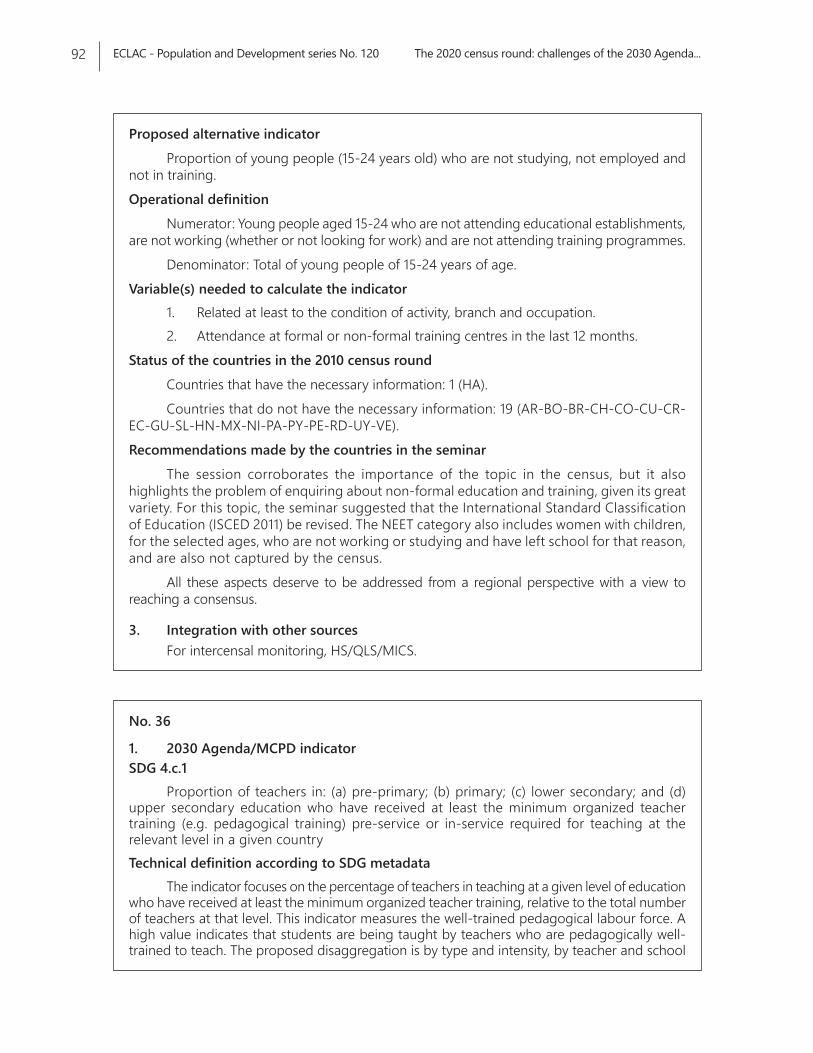
ECLAC - Population and Development series No. 120 The 2020 census round: challenges of the 2030 Agenda...92
Proposed alternative indicatorProportion of young people (15-24 years old) who are not studying, not employed and
not in training.Operational definition
Numerator: Young people aged 15-24 who are not attending educational establishments, are not working (whether or not looking for work) and are not attending training programmes.
Denominator: Total of young people of 15-24 years of age.Variable(s) needed to calculate the indicator
1. Related at least to the condition of activity, branch and occupation.2. Attendance at formal or non-formal training centres in the last 12 months.
Status of the countries in the 2010 census roundCountries that have the necessary information: 1 (HA).Countries that do not have the necessary information: 19 (AR-BO-BR-CH-CO-CU-CR-
EC-GU-SL-HN-MX-NI-PA-PY-PE-RD-UY-VE).Recommendations made by the countries in the seminar
The session corroborates the importance of the topic in the census, but it also highlights the problem of enquiring about non-formal education and training, given its great variety. For this topic, the seminar suggested that the International Standard Classification of Education (ISCED 2011) be revised. The NEET category also includes women with children, for the selected ages, who are not working or studying and have left school for that reason, and are also not captured by the census.
All these aspects deserve to be addressed from a regional perspective with a view to reaching a consensus.
3. Integration with other sourcesFor intercensal monitoring, HS/QLS/MICS.
No. 36
1. 2030 Agenda/MCPD indicatorSDG 4.c.1
Proportion of teachers in: (a) pre-primary; (b) primary; (c) lower secondary; and (d) upper secondary education who have received at least the minimum organized teacher training (e.g. pedagogical training) pre-service or in-service required for teaching at the relevant level in a given countryTechnical definition according to SDG metadata
The indicator focuses on the percentage of teachers in teaching at a given level of education who have received at least the minimum organized teacher training, relative to the total number of teachers at that level. This indicator measures the well-trained pedagogical labour force. A high value indicates that students are being taught by teachers who are pedagogically well-trained to teach. The proposed disaggregation is by type and intensity, by teacher and school
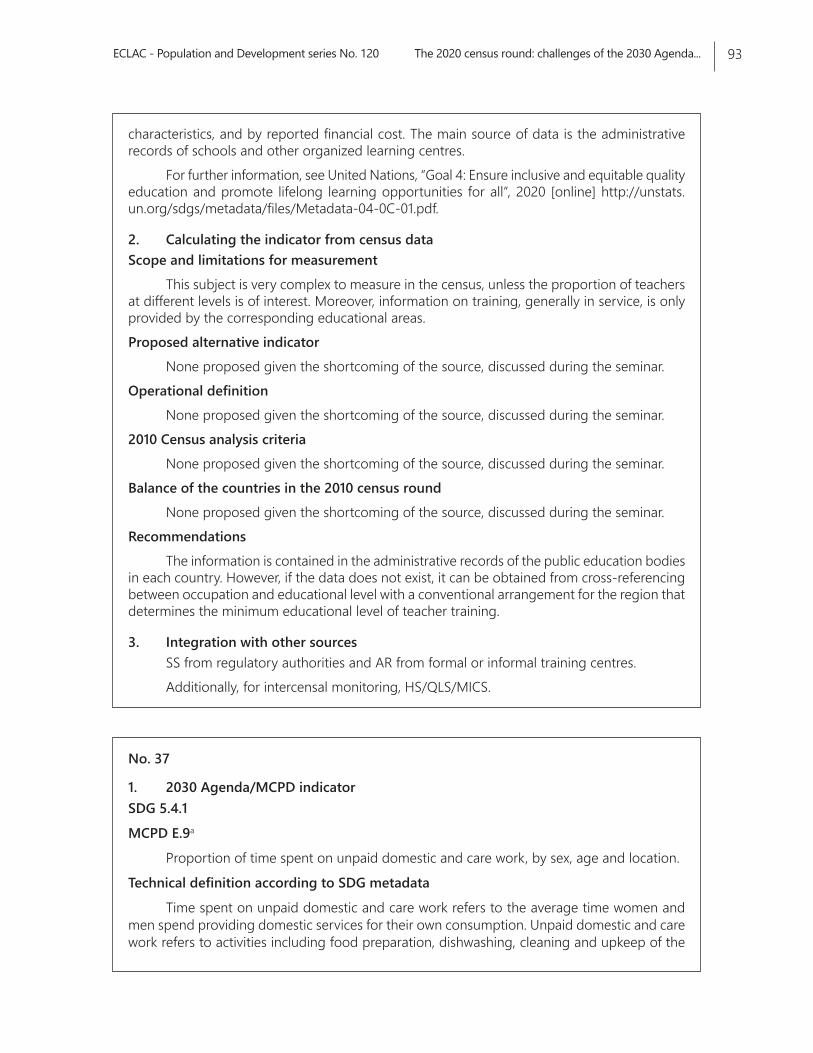
ECLAC - Population and Development series No. 120 The 2020 census round: challenges of the 2030 Agenda... 93
characteristics, and by reported financial cost. The main source of data is the administrative records of schools and other organized learning centres.
For further information, see United Nations, “Goal 4: Ensure inclusive and equitable quality education and promote lifelong learning opportunities for all”, 2020 [online] http://unstats.un.org/sdgs/metadata/files/Metadata-04-0C-01.pdf.
2. Calculating the indicator from census dataScope and limitations for measurement
This subject is very complex to measure in the census, unless the proportion of teachers at different levels is of interest. Moreover, information on training, generally in service, is only provided by the corresponding educational areas. Proposed alternative indicator
None proposed given the shortcoming of the source, discussed during the seminar. Operational definition
None proposed given the shortcoming of the source, discussed during the seminar. 2010 Census analysis criteria
None proposed given the shortcoming of the source, discussed during the seminar. Balance of the countries in the 2010 census round
None proposed given the shortcoming of the source, discussed during the seminar. Recommendations
The information is contained in the administrative records of the public education bodies in each country. However, if the data does not exist, it can be obtained from cross-referencing between occupation and educational level with a conventional arrangement for the region that determines the minimum educational level of teacher training.
3. Integration with other sourcesSS from regulatory authorities and AR from formal or informal training centres.Additionally, for intercensal monitoring, HS/QLS/MICS.
No. 37
1. 2030 Agenda/MCPD indicatorSDG 5.4.1
MCPD E.9a
Proportion of time spent on unpaid domestic and care work, by sex, age and location.
Technical definition according to SDG metadata
Time spent on unpaid domestic and care work refers to the average time women and men spend providing domestic services for their own consumption. Unpaid domestic and care work refers to activities including food preparation, dishwashing, cleaning and upkeep of the
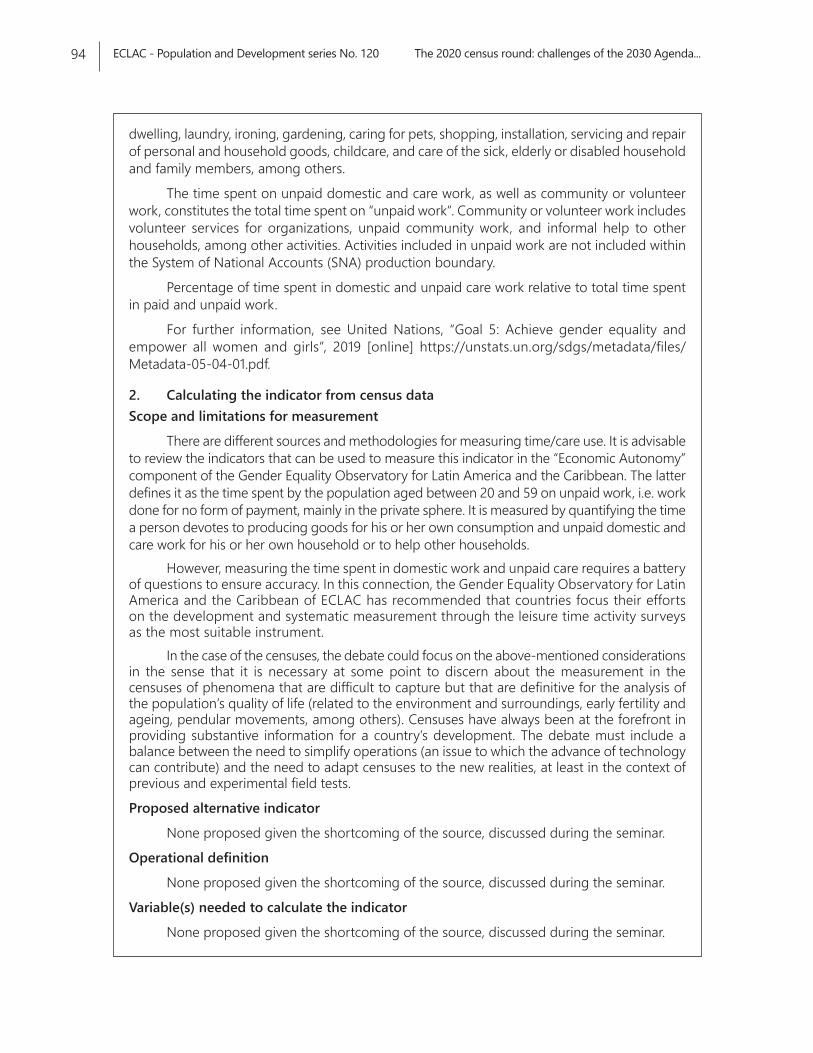
ECLAC - Population and Development series No. 120 The 2020 census round: challenges of the 2030 Agenda...94
dwelling, laundry, ironing, gardening, caring for pets, shopping, installation, servicing and repair of personal and household goods, childcare, and care of the sick, elderly or disabled household and family members, among others.
The time spent on unpaid domestic and care work, as well as community or volunteer work, constitutes the total time spent on “unpaid work”. Community or volunteer work includes volunteer services for organizations, unpaid community work, and informal help to other households, among other activities. Activities included in unpaid work are not included within the System of National Accounts (SNA) production boundary.
Percentage of time spent in domestic and unpaid care work relative to total time spent in paid and unpaid work.
For further information, see United Nations, “Goal 5: Achieve gender equality and empower all women and girls”, 2019 [online] https://unstats.un.org/sdgs/metadata/files/Metadata-05-04-01.pdf.
2. Calculating the indicator from census dataScope and limitations for measurement
There are different sources and methodologies for measuring time/care use. It is advisable to review the indicators that can be used to measure this indicator in the “Economic Autonomy” component of the Gender Equality Observatory for Latin America and the Caribbean. The latter defines it as the time spent by the population aged between 20 and 59 on unpaid work, i.e. work done for no form of payment, mainly in the private sphere. It is measured by quantifying the time a person devotes to producing goods for his or her own consumption and unpaid domestic and care work for his or her own household or to help other households.
However, measuring the time spent in domestic work and unpaid care requires a battery of questions to ensure accuracy. In this connection, the Gender Equality Observatory for Latin America and the Caribbean of ECLAC has recommended that countries focus their efforts on the development and systematic measurement through the leisure time activity surveys as the most suitable instrument.
In the case of the censuses, the debate could focus on the above-mentioned considerations in the sense that it is necessary at some point to discern about the measurement in the censuses of phenomena that are difficult to capture but that are definitive for the analysis of the population’s quality of life (related to the environment and surroundings, early fertility and ageing, pendular movements, among others). Censuses have always been at the forefront in providing substantive information for a country’s development. The debate must include a balance between the need to simplify operations (an issue to which the advance of technology can contribute) and the need to adapt censuses to the new realities, at least in the context of previous and experimental field tests.
Proposed alternative indicator
None proposed given the shortcoming of the source, discussed during the seminar.
Operational definition
None proposed given the shortcoming of the source, discussed during the seminar.
Variable(s) needed to calculate the indicator
None proposed given the shortcoming of the source, discussed during the seminar.
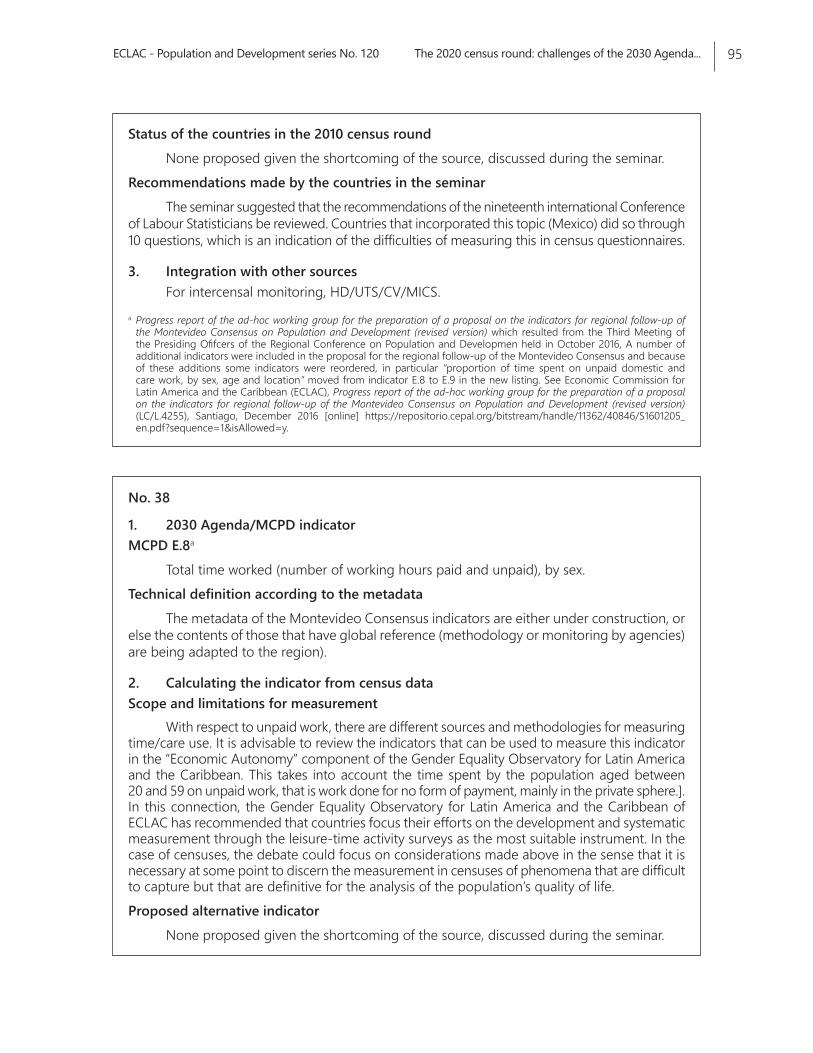
ECLAC - Population and Development series No. 120 The 2020 census round: challenges of the 2030 Agenda... 95
Status of the countries in the 2010 census roundNone proposed given the shortcoming of the source, discussed during the seminar.
Recommendations made by the countries in the seminarThe seminar suggested that the recommendations of the nineteenth international Conference
of Labour Statisticians be reviewed. Countries that incorporated this topic (Mexico) did so through 10 questions, which is an indication of the difficulties of measuring this in census questionnaires.
3. Integration with other sourcesFor intercensal monitoring, HD/UTS/CV/MICS.
a Progress report of the ad-hoc working group for the preparation of a proposal on the indicators for regional follow-up of the Montevideo Consensus on Population and Development (revised version) which resulted from the Third Meeting of the Presiding Ofifcers of the Regional Conference on Population and Developmen held in October 2016, A number of additional indicators were included in the proposal for the regional follow-up of the Montevideo Consensus and because of these additions some indicators were reordered, in particular “proportion of time spent on unpaid domestic and care work, by sex, age and location” moved from indicator E.8 to E.9 in the new listing. See Economic Commission for Latin America and the Caribbean (ECLAC), Progress report of the ad-hoc working group for the preparation of a proposal on the indicators for regional follow-up of the Montevideo Consensus on Population and Development (revised version) (LC/L.4255), Santiago, December 2016 [online] https://repositorio.cepal.org/bitstream/handle/11362/40846/S1601205_en.pdf?sequence=1&isAllowed=y.
No. 38
1. 2030 Agenda/MCPD indicatorMCPD E.8a
Total time worked (number of working hours paid and unpaid), by sex.Technical definition according to the metadata
The metadata of the Montevideo Consensus indicators are either under construction, or else the contents of those that have global reference (methodology or monitoring by agencies) are being adapted to the region).
2. Calculating the indicator from census dataScope and limitations for measurement
With respect to unpaid work, there are different sources and methodologies for measuring time/care use. It is advisable to review the indicators that can be used to measure this indicator in the “Economic Autonomy” component of the Gender Equality Observatory for Latin America and the Caribbean. This takes into account the time spent by the population aged between 20 and 59 on unpaid work, that is work done for no form of payment, mainly in the private sphere.]. In this connection, the Gender Equality Observatory for Latin America and the Caribbean of ECLAC has recommended that countries focus their efforts on the development and systematic measurement through the leisure-time activity surveys as the most suitable instrument. In the case of censuses, the debate could focus on considerations made above in the sense that it is necessary at some point to discern the measurement in censuses of phenomena that are difficult to capture but that are definitive for the analysis of the population’s quality of life.Proposed alternative indicator
None proposed given the shortcoming of the source, discussed during the seminar.
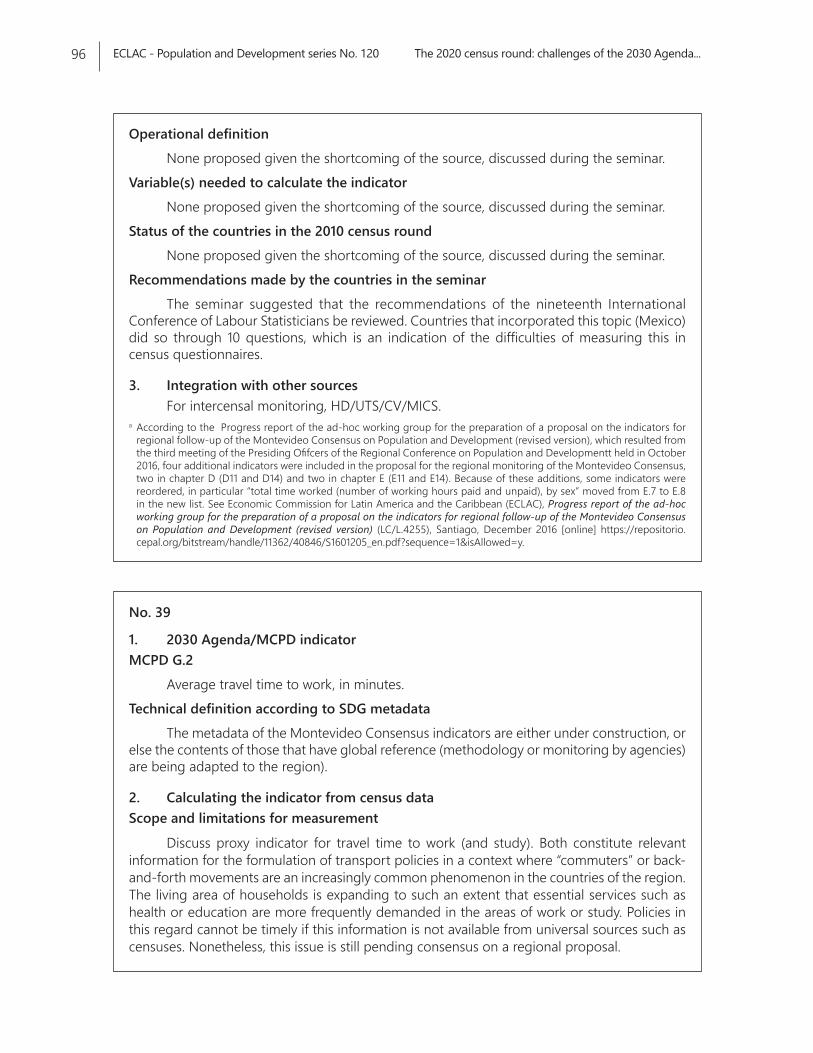
ECLAC - Population and Development series No. 120 The 2020 census round: challenges of the 2030 Agenda...96
Operational definition None proposed given the shortcoming of the source, discussed during the seminar.
Variable(s) needed to calculate the indicatorNone proposed given the shortcoming of the source, discussed during the seminar.
Status of the countries in the 2010 census roundNone proposed given the shortcoming of the source, discussed during the seminar.
Recommendations made by the countries in the seminarThe seminar suggested that the recommendations of the nineteenth International
Conference of Labour Statisticians be reviewed. Countries that incorporated this topic (Mexico) did so through 10 questions, which is an indication of the difficulties of measuring this in census questionnaires.
3. Integration with other sourcesFor intercensal monitoring, HD/UTS/CV/MICS.
a According to the Progress report of the ad-hoc working group for the preparation of a proposal on the indicators for regional follow-up of the Montevideo Consensus on Population and Development (revised version), which resulted from the third meeting of the Presiding Ofifcers of the Regional Conference on Population and Developmentt held in October 2016, four additional indicators were included in the proposal for the regional monitoring of the Montevideo Consensus, two in chapter D (D11 and D14) and two in chapter E (E11 and E14). Because of these additions, some indicators were reordered, in particular “total time worked (number of working hours paid and unpaid), by sex” moved from E.7 to E.8 in the new list. See Economic Commission for Latin America and the Caribbean (ECLAC), Progress report of the ad-hoc working group for the preparation of a proposal on the indicators for regional follow-up of the Montevideo Consensus on Population and Development (revised version) (LC/L.4255), Santiago, December 2016 [online] https://repositorio.cepal.org/bitstream/handle/11362/40846/S1601205_en.pdf?sequence=1&isAllowed=y.
No. 39
1. 2030 Agenda/MCPD indicatorMCPD G.2
Average travel time to work, in minutes.Technical definition according to SDG metadata
The metadata of the Montevideo Consensus indicators are either under construction, or else the contents of those that have global reference (methodology or monitoring by agencies) are being adapted to the region).
2. Calculating the indicator from census dataScope and limitations for measurement
Discuss proxy indicator for travel time to work (and study). Both constitute relevant information for the formulation of transport policies in a context where “commuters” or back-and-forth movements are an increasingly common phenomenon in the countries of the region. The living area of households is expanding to such an extent that essential services such as health or education are more frequently demanded in the areas of work or study. Policies in this regard cannot be timely if this information is not available from universal sources such as censuses. Nonetheless, this issue is still pending consensus on a regional proposal.
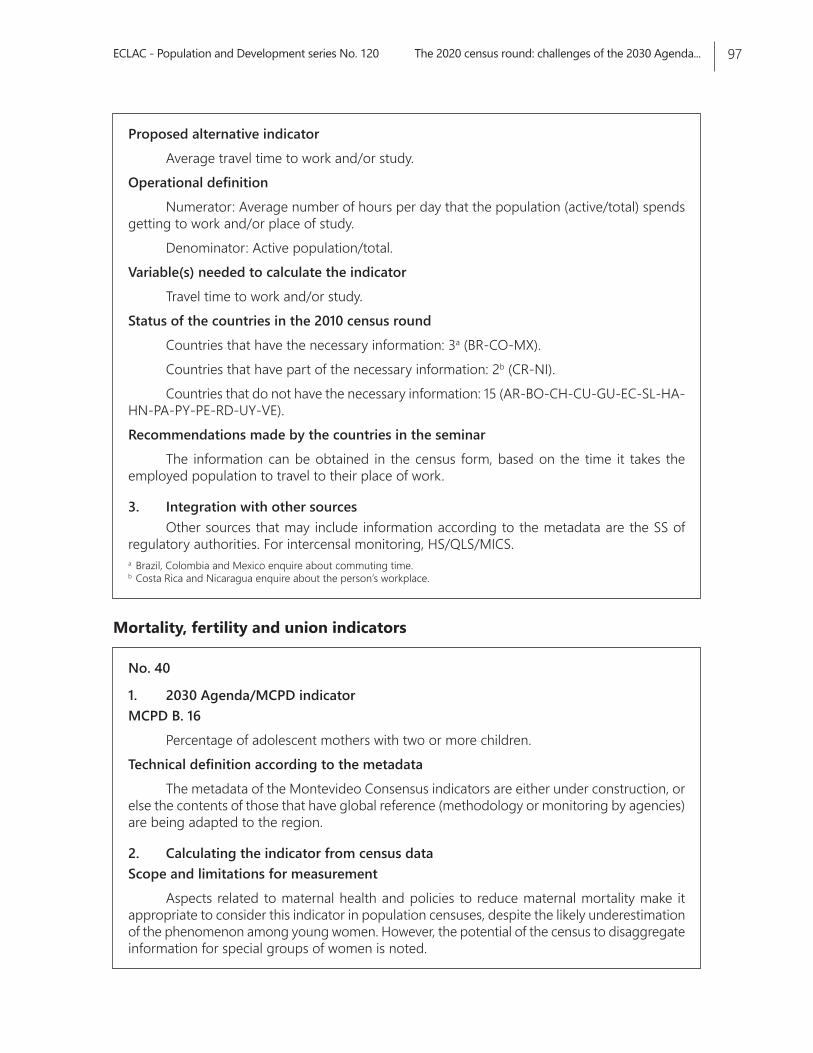
ECLAC - Population and Development series No. 120 The 2020 census round: challenges of the 2030 Agenda... 97
Proposed alternative indicatorAverage travel time to work and/or study.
Operational definition Numerator: Average number of hours per day that the population (active/total) spends
getting to work and/or place of study.Denominator: Active population/total.
Variable(s) needed to calculate the indicatorTravel time to work and/or study.
Status of the countries in the 2010 census roundCountries that have the necessary information: 3a (BR-CO-MX).Countries that have part of the necessary information: 2b (CR-NI).Countries that do not have the necessary information: 15 (AR-BO-CH-CU-GU-EC-SL-HA-
HN-PA-PY-PE-RD-UY-VE).Recommendations made by the countries in the seminar
The information can be obtained in the census form, based on the time it takes the employed population to travel to their place of work.
3. Integration with other sourcesOther sources that may include information according to the metadata are the SS of
regulatory authorities. For intercensal monitoring, HS/QLS/MICS.a Brazil, Colombia and Mexico enquire about commuting time.b Costa Rica and Nicaragua enquire about the person’s workplace.
No. 40
1. 2030 Agenda/MCPD indicatorMCPD B. 16
Percentage of adolescent mothers with two or more children.Technical definition according to the metadata
The metadata of the Montevideo Consensus indicators are either under construction, or else the contents of those that have global reference (methodology or monitoring by agencies) are being adapted to the region.
2. Calculating the indicator from census dataScope and limitations for measurement
Aspects related to maternal health and policies to reduce maternal mortality make it appropriate to consider this indicator in population censuses, despite the likely underestimation of the phenomenon among young women. However, the potential of the census to disaggregate information for special groups of women is noted.
Mortality, fertility and union indicators
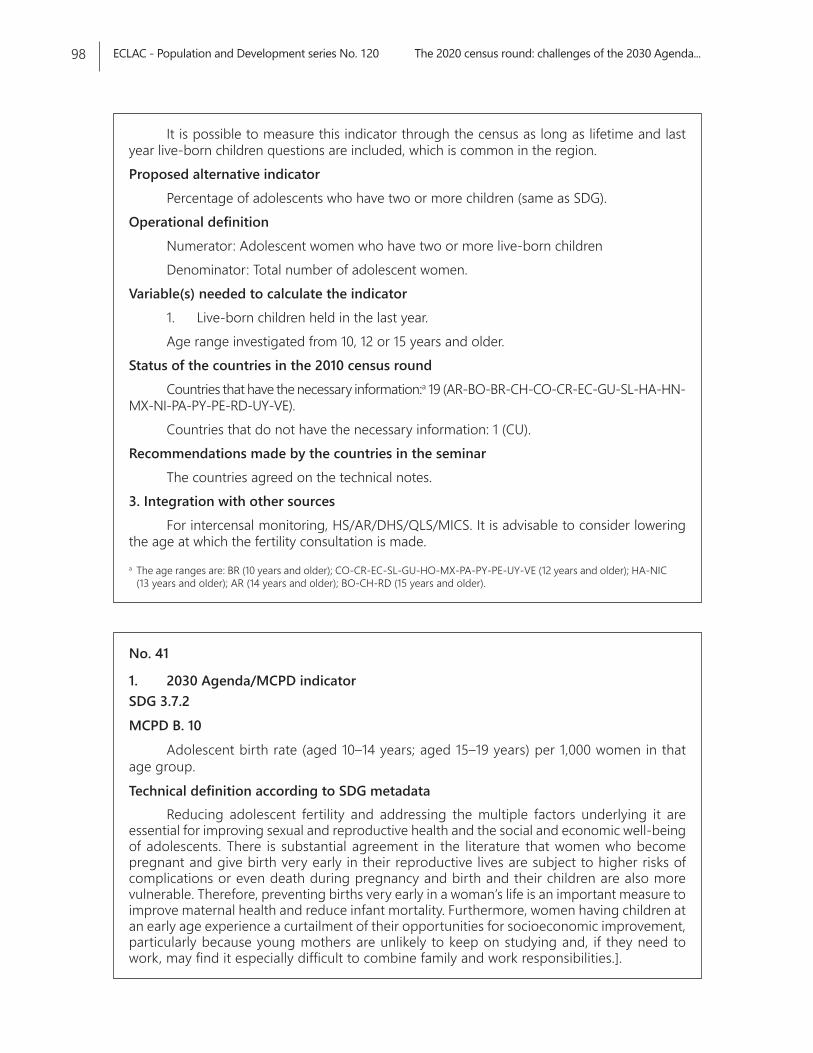
ECLAC - Population and Development series No. 120 The 2020 census round: challenges of the 2030 Agenda...98
It is possible to measure this indicator through the census as long as lifetime and last year live-born children questions are included, which is common in the region. Proposed alternative indicator
Percentage of adolescents who have two or more children (same as SDG).Operational definition
Numerator: Adolescent women who have two or more live-born childrenDenominator: Total number of adolescent women.
Variable(s) needed to calculate the indicator 1. Live-born children held in the last year.Age range investigated from 10, 12 or 15 years and older.
Status of the countries in the 2010 census roundCountries that have the necessary information:a 19 (AR-BO-BR-CH-CO-CR-EC-GU-SL-HA-HN-
MX-NI-PA-PY-PE-RD-UY-VE).Countries that do not have the necessary information: 1 (CU).
Recommendations made by the countries in the seminarThe countries agreed on the technical notes.
3. Integration with other sourcesFor intercensal monitoring, HS/AR/DHS/QLS/MICS. It is advisable to consider lowering
the age at which the fertility consultation is made.a The age ranges are: BR (10 years and older); CO-CR-EC-SL-GU-HO-MX-PA-PY-PE-UY-VE (12 years and older); HA-NIC
(13 years and older); AR (14 years and older); BO-CH-RD (15 years and older).
No. 41
1. 2030 Agenda/MCPD indicatorSDG 3.7.2MCPD B. 10
Adolescent birth rate (aged 10–14 years; aged 15–19 years) per 1,000 women in that age group.Technical definition according to SDG metadata
Reducing adolescent fertility and addressing the multiple factors underlying it are essential for improving sexual and reproductive health and the social and economic well-being of adolescents. There is substantial agreement in the literature that women who become pregnant and give birth very early in their reproductive lives are subject to higher risks of complications or even death during pregnancy and birth and their children are also more vulnerable. Therefore, preventing births very early in a woman’s life is an important measure to improve maternal health and reduce infant mortality. Furthermore, women having children at an early age experience a curtailment of their opportunities for socioeconomic improvement, particularly because young mothers are unlikely to keep on studying and, if they need to work, may find it especially difficult to combine family and work responsibilities.].
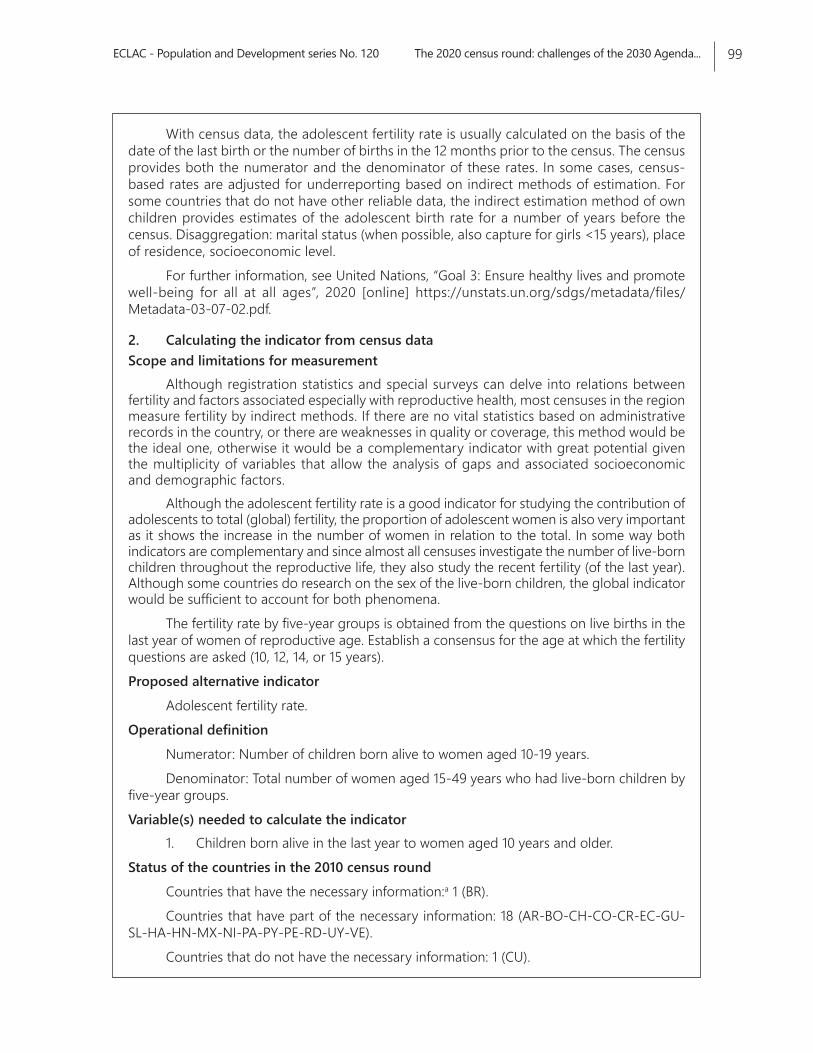
ECLAC - Population and Development series No. 120 The 2020 census round: challenges of the 2030 Agenda... 99
With census data, the adolescent fertility rate is usually calculated on the basis of the date of the last birth or the number of births in the 12 months prior to the census. The census provides both the numerator and the denominator of these rates. In some cases, census-based rates are adjusted for underreporting based on indirect methods of estimation. For some countries that do not have other reliable data, the indirect estimation method of own children provides estimates of the adolescent birth rate for a number of years before the census. Disaggregation: marital status (when possible, also capture for girls <15 years), place of residence, socioeconomic level.
For further information, see United Nations, “Goal 3: Ensure healthy lives and promote well-being for all at all ages”, 2020 [online] https://unstats.un.org/sdgs/metadata/files/Metadata-03-07-02.pdf.
2. Calculating the indicator from census dataScope and limitations for measurement
Although registration statistics and special surveys can delve into relations between fertility and factors associated especially with reproductive health, most censuses in the region measure fertility by indirect methods. If there are no vital statistics based on administrative records in the country, or there are weaknesses in quality or coverage, this method would be the ideal one, otherwise it would be a complementary indicator with great potential given the multiplicity of variables that allow the analysis of gaps and associated socioeconomic and demographic factors.
Although the adolescent fertility rate is a good indicator for studying the contribution of adolescents to total (global) fertility, the proportion of adolescent women is also very important as it shows the increase in the number of women in relation to the total. In some way both indicators are complementary and since almost all censuses investigate the number of live-born children throughout the reproductive life, they also study the recent fertility (of the last year). Although some countries do research on the sex of the live-born children, the global indicator would be sufficient to account for both phenomena.
The fertility rate by five-year groups is obtained from the questions on live births in the last year of women of reproductive age. Establish a consensus for the age at which the fertility questions are asked (10, 12, 14, or 15 years). Proposed alternative indicator
Adolescent fertility rate.Operational definition
Numerator: Number of children born alive to women aged 10-19 years. Denominator: Total number of women aged 15-49 years who had live-born children by
five-year groups.Variable(s) needed to calculate the indicator
1. Children born alive in the last year to women aged 10 years and older.Status of the countries in the 2010 census round
Countries that have the necessary information:a 1 (BR). Countries that have part of the necessary information: 18 (AR-BO-CH-CO-CR-EC-GU-
SL-HA-HN-MX-NI-PA-PY-PE-RD-UY-VE).Countries that do not have the necessary information: 1 (CU).
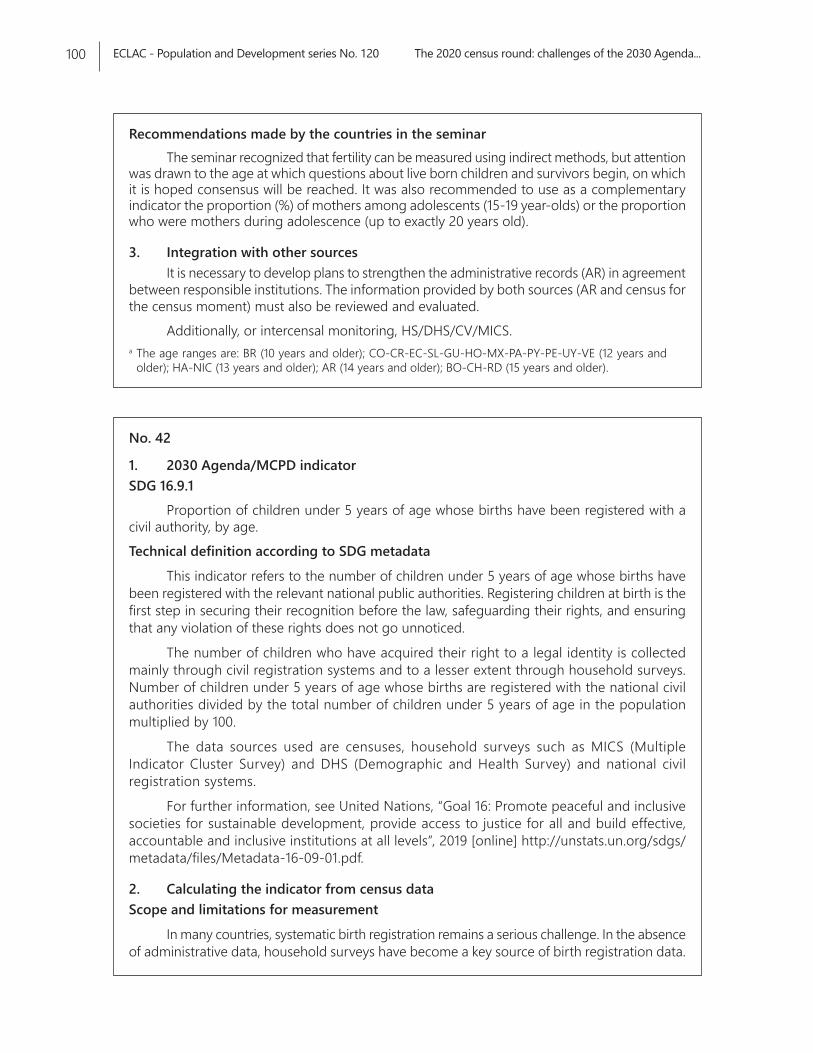
ECLAC - Population and Development series No. 120 The 2020 census round: challenges of the 2030 Agenda...100
Recommendations made by the countries in the seminarThe seminar recognized that fertility can be measured using indirect methods, but attention
was drawn to the age at which questions about live born children and survivors begin, on which it is hoped consensus will be reached. It was also recommended to use as a complementary indicator the proportion (%) of mothers among adolescents (15-19 year-olds) or the proportion who were mothers during adolescence (up to exactly 20 years old).
3. Integration with other sourcesIt is necessary to develop plans to strengthen the administrative records (AR) in agreement
between responsible institutions. The information provided by both sources (AR and census for the census moment) must also be reviewed and evaluated.
Additionally, or intercensal monitoring, HS/DHS/CV/MICS.a The age ranges are: BR (10 years and older); CO-CR-EC-SL-GU-HO-MX-PA-PY-PE-UY-VE (12 years and
older); HA-NIC (13 years and older); AR (14 years and older); BO-CH-RD (15 years and older).
No. 42
1. 2030 Agenda/MCPD indicatorSDG 16.9.1
Proportion of children under 5 years of age whose births have been registered with a civil authority, by age.Technical definition according to SDG metadata
This indicator refers to the number of children under 5 years of age whose births have been registered with the relevant national public authorities. Registering children at birth is the first step in securing their recognition before the law, safeguarding their rights, and ensuring that any violation of these rights does not go unnoticed.
The number of children who have acquired their right to a legal identity is collected mainly through civil registration systems and to a lesser extent through household surveys. Number of children under 5 years of age whose births are registered with the national civil authorities divided by the total number of children under 5 years of age in the population multiplied by 100.
The data sources used are censuses, household surveys such as MICS (Multiple Indicator Cluster Survey) and DHS (Demographic and Health Survey) and national civil registration systems.
For further information, see United Nations, “Goal 16: Promote peaceful and inclusive societies for sustainable development, provide access to justice for all and build effective, accountable and inclusive institutions at all levels”, 2019 [online] http://unstats.un.org/sdgs/metadata/files/Metadata-16-09-01.pdf.
2. Calculating the indicator from census dataScope and limitations for measurement
In many countries, systematic birth registration remains a serious challenge. In the absence of administrative data, household surveys have become a key source of birth registration data.
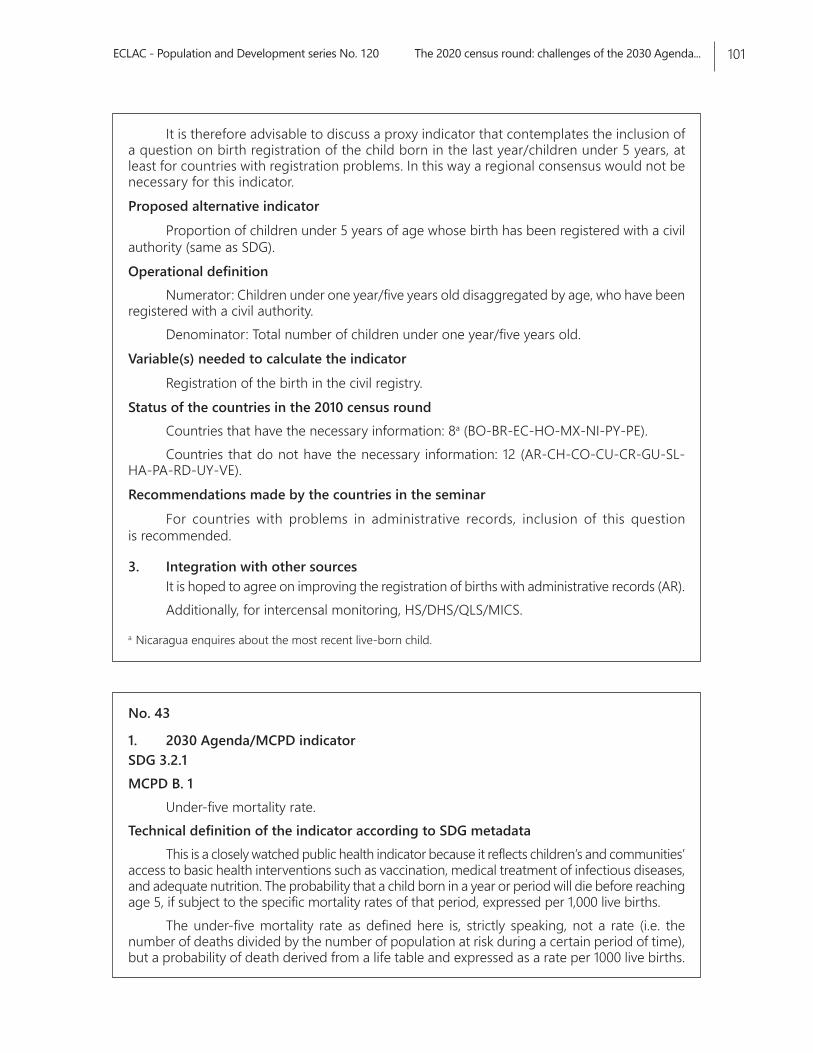
ECLAC - Population and Development series No. 120 The 2020 census round: challenges of the 2030 Agenda... 101
It is therefore advisable to discuss a proxy indicator that contemplates the inclusion of a question on birth registration of the child born in the last year/children under 5 years, at least for countries with registration problems. In this way a regional consensus would not be necessary for this indicator.Proposed alternative indicator
Proportion of children under 5 years of age whose birth has been registered with a civil authority (same as SDG).Operational definition
Numerator: Children under one year/five years old disaggregated by age, who have been registered with a civil authority.
Denominator: Total number of children under one year/five years old.Variable(s) needed to calculate the indicator
Registration of the birth in the civil registry.Status of the countries in the 2010 census round
Countries that have the necessary information: 8a (BO-BR-EC-HO-MX-NI-PY-PE).Countries that do not have the necessary information: 12 (AR-CH-CO-CU-CR-GU-SL-
HA-PA-RD-UY-VE).Recommendations made by the countries in the seminar
For countries with problems in administrative records, inclusion of this question is recommended.
3. Integration with other sourcesIt is hoped to agree on improving the registration of births with administrative records (AR). Additionally, for intercensal monitoring, HS/DHS/QLS/MICS.
a Nicaragua enquires about the most recent live-born child.
No. 43
1. 2030 Agenda/MCPD indicatorSDG 3.2.1MCPD B. 1
Under-five mortality rate.Technical definition of the indicator according to SDG metadata
This is a closely watched public health indicator because it reflects children’s and communities’ access to basic health interventions such as vaccination, medical treatment of infectious diseases, and adequate nutrition. The probability that a child born in a year or period will die before reaching age 5, if subject to the specific mortality rates of that period, expressed per 1,000 live births.
The under-five mortality rate as defined here is, strictly speaking, not a rate (i.e. the number of deaths divided by the number of population at risk during a certain period of time), but a probability of death derived from a life table and expressed as a rate per 1000 live births.
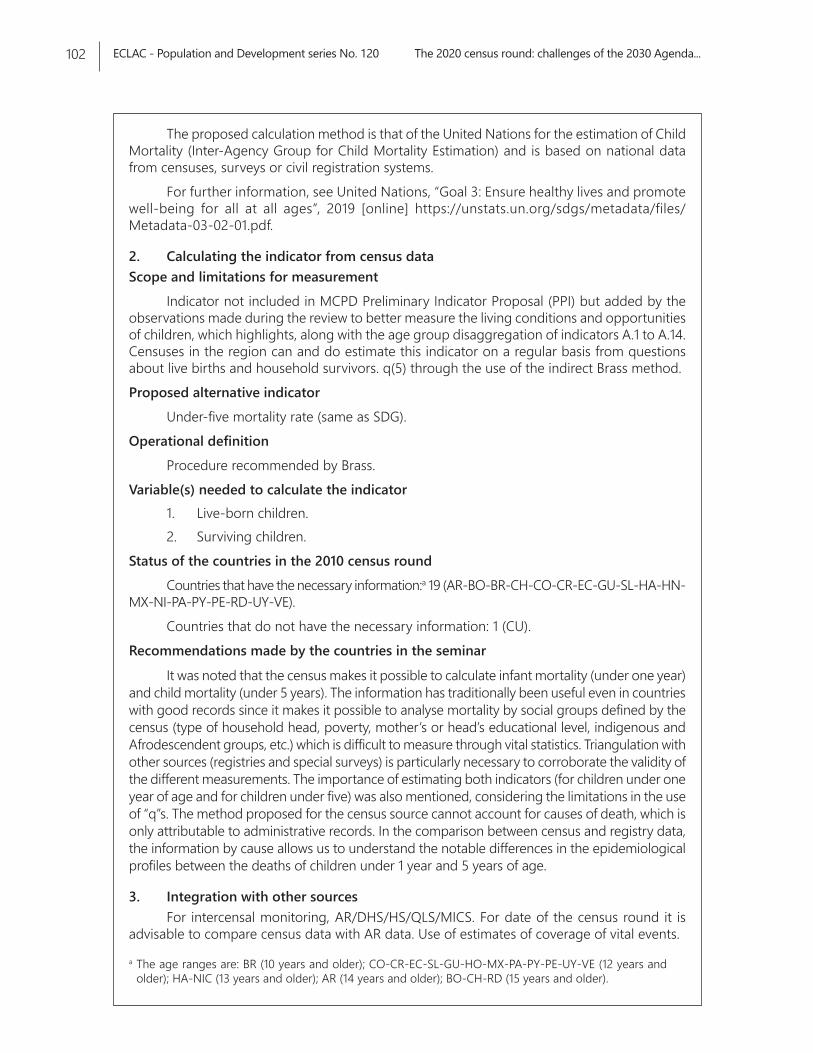
ECLAC - Population and Development series No. 120 The 2020 census round: challenges of the 2030 Agenda...102
The proposed calculation method is that of the United Nations for the estimation of Child Mortality (Inter-Agency Group for Child Mortality Estimation) and is based on national data from censuses, surveys or civil registration systems.
For further information, see United Nations, “Goal 3: Ensure healthy lives and promote well-being for all at all ages”, 2019 [online] https://unstats.un.org/sdgs/metadata/files/Metadata-03-02-01.pdf.
2. Calculating the indicator from census dataScope and limitations for measurement
Indicator not included in MCPD Preliminary Indicator Proposal (PPI) but added by the observations made during the review to better measure the living conditions and opportunities of children, which highlights, along with the age group disaggregation of indicators A.1 to A.14. Censuses in the region can and do estimate this indicator on a regular basis from questions about live births and household survivors. q(5) through the use of the indirect Brass method.Proposed alternative indicator
Under-five mortality rate (same as SDG).Operational definition
Procedure recommended by Brass.Variable(s) needed to calculate the indicator
1. Live-born children.2. Surviving children.
Status of the countries in the 2010 census roundCountries that have the necessary information:a 19 (AR-BO-BR-CH-CO-CR-EC-GU-SL-HA-HN-
MX-NI-PA-PY-PE-RD-UY-VE).Countries that do not have the necessary information: 1 (CU).
Recommendations made by the countries in the seminar
It was noted that the census makes it possible to calculate infant mortality (under one year) and child mortality (under 5 years). The information has traditionally been useful even in countries with good records since it makes it possible to analyse mortality by social groups defined by the census (type of household head, poverty, mother’s or head’s educational level, indigenous and Afrodescendent groups, etc.) which is difficult to measure through vital statistics. Triangulation with other sources (registries and special surveys) is particularly necessary to corroborate the validity of the different measurements. The importance of estimating both indicators (for children under one year of age and for children under five) was also mentioned, considering the limitations in the use of “q”s. The method proposed for the census source cannot account for causes of death, which is only attributable to administrative records. In the comparison between census and registry data, the information by cause allows us to understand the notable differences in the epidemiological profiles between the deaths of children under 1 year and 5 years of age.
3. Integration with other sourcesFor intercensal monitoring, AR/DHS/HS/QLS/MICS. For date of the census round it is
advisable to compare census data with AR data. Use of estimates of coverage of vital events.
a The age ranges are: BR (10 years and older); CO-CR-EC-SL-GU-HO-MX-PA-PY-PE-UY-VE (12 years and older); HA-NIC (13 years and older); AR (14 years and older); BO-CH-RD (15 years and older).
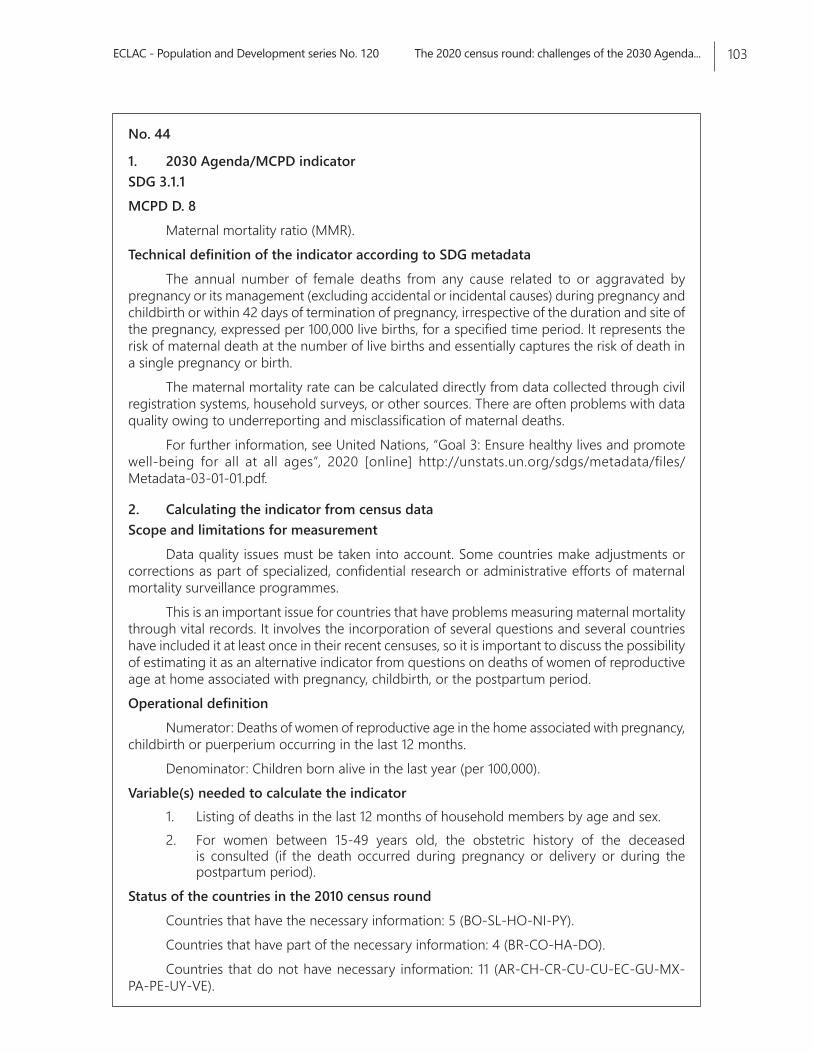
ECLAC - Population and Development series No. 120 The 2020 census round: challenges of the 2030 Agenda... 103
No. 44
1. 2030 Agenda/MCPD indicatorSDG 3.1.1MCPD D. 8
Maternal mortality ratio (MMR).Technical definition of the indicator according to SDG metadata
The annual number of female deaths from any cause related to or aggravated by pregnancy or its management (excluding accidental or incidental causes) during pregnancy and childbirth or within 42 days of termination of pregnancy, irrespective of the duration and site of the pregnancy, expressed per 100,000 live births, for a specified time period. It represents the risk of maternal death at the number of live births and essentially captures the risk of death in a single pregnancy or birth.
The maternal mortality rate can be calculated directly from data collected through civil registration systems, household surveys, or other sources. There are often problems with data quality owing to underreporting and misclassification of maternal deaths.
For further information, see United Nations, “Goal 3: Ensure healthy lives and promote well-being for all at all ages”, 2020 [online] http://unstats.un.org/sdgs/metadata/files/Metadata-03-01-01.pdf.
2. Calculating the indicator from census dataScope and limitations for measurement
Data quality issues must be taken into account. Some countries make adjustments or corrections as part of specialized, confidential research or administrative efforts of maternal mortality surveillance programmes.
This is an important issue for countries that have problems measuring maternal mortality through vital records. It involves the incorporation of several questions and several countries have included it at least once in their recent censuses, so it is important to discuss the possibility of estimating it as an alternative indicator from questions on deaths of women of reproductive age at home associated with pregnancy, childbirth, or the postpartum period. Operational definition
Numerator: Deaths of women of reproductive age in the home associated with pregnancy, childbirth or puerperium occurring in the last 12 months.
Denominator: Children born alive in the last year (per 100,000).Variable(s) needed to calculate the indicator
1. Listing of deaths in the last 12 months of household members by age and sex.2. For women between 15-49 years old, the obstetric history of the deceased
is consulted (if the death occurred during pregnancy or delivery or during the postpartum period).
Status of the countries in the 2010 census roundCountries that have the necessary information: 5 (BO-SL-HO-NI-PY).Countries that have part of the necessary information: 4 (BR-CO-HA-DO).Countries that do not have necessary information: 11 (AR-CH-CR-CU-CU-EC-GU-MX-
PA-PE-UY-VE).
ECLAC - Population and Development series No. 120 The 2020 census round: challenges of the 2030 Agenda...104
Country recommendationsMost countries in the region agreed to consider the importance of calculating this
indicator on the basis of administrative records or DHS surveys, considering the weaknesses of omission and coverage that this indicator may present in the censuses, which although they may characterize fertility trends in the region, should not respond to higher levels of disaggregation, as administrative records or DHS could do instead.
3. Integration with other sourcesIt is recommended that actions be taken with administrative records to apply targeted
search methods for maternal deaths. Additionally, for intercensal follow-up, DHS and MICS.
No. 45
1. 2030 Agenda/MCPD indicatorSDG 5.3.1
Proportion of women aged 20–24 years who were married or in a union before age 15 and before age 18.Technical definition according to SDG metadata
Child marriage often compromises a girl’s development by resulting in early pregnancy and social isolation, interrupting her schooling, limiting her opportunities for career and vocational advancement and placing her at increased risk of intimate partner violence.]. The practice of early marriage/pregnancy is a direct manifestation of gender inequality. The practice of early/child marriage is a direct manifestation of gender inequality. The issue of child marriage is addressed in a number of international conventions and agreements.
There are data collection tools and mechanisms that countries have implemented to monitor the situation with respect to this indicator. The modules used in the DHS and MICS have been harmonized and are recommended. In low- and middle-income countries, some national census or other national household survey research has been conducted since the late 1980s.
This indicator provides the proportion of women aged 20-24 years who were married or in a first union at age 18. It is calculated by dividing the number of women aged 20-24 who were married or in a stable union at 18 by the total number of women aged 20-24 in the population.
For further information, see United Nations, “Goal 5: Achieve gender equality and empower all women and girls”, 2019 [online] https://unstats.un.org/sdgs/metadata/files/Metadata-05-03-01.pdf.
2. Calculating the indicator from census dataScope and limitations for measurement
Despite the potential of special surveys, however, the idea of including this in the census should not be ruled out, not only for the study of nuptiality (via age at first union) but also on aspects related to fertility. Thus, a proxy indicator can be included that arises from asking the entire population about their age at first marriage or union. Example from Brazil in the 1990 Census where the entire population was asked to indicate the month and year of the first union. Proposed alternative indicator
Women between the ages of 20-24 who were married or in an informal union before they turned 15/18.
ECLAC - Population and Development series No. 120 The 2020 census round: challenges of the 2030 Agenda... 105
Operational definition for measurement through censusNumerator: Number of women aged 20-24 who were first married or in union before
age 15 (or before age 18).Denominator: Women 20-24 years old.
Variable(s) needed to calculate the indicatorAge at first marriage or informal union.
Status of the countries in the 2010 census roundCountries that do not have the necessary information: 20 (AR-BO-BR-CH-CO-CU-CR-
EC-GU-SL-HA-HN-MX-NI-PA-PY-PE-RD-UY-VE).Recommendations made by the countries in the seminar
The importance of measuring this indicator is generally recognized, but not necessarily through population censuses, although some countries have included it with relative success.
3. Integration with other sourcesFor intercensal monitoring, HS/DHS/QLS/MICS.
No. 46
1. 2030 Agenda/MCPD indicatorMCPD B.11
Percentage of women aged 20-24 years who had their first child before the age of 20 years.Technical definition according to SDG metadata
The metadata of the Montevideo Consensus indicators are either under construction, or else the contents of those that have global reference (methodology or monitoring by agencies) are being adapted to the region.
2. Calculating the indicator from census dataScope and limitations for measurement
Indicator not included in MCPD’s Preliminary Proposal for Indicators (PPI) but added as a result of comments during its review. It complements the adolescent fertility rate, because it captures the maternity that is a concern in the Montevideo Consensus, which is that which occurs before age 20. It could be expanded to other ages of reproductive initiation (before age 18 and before age 15), owing to the specific risks associated with early reproduction, as was suggested in the review of the preliminary proposal of indicators. Including the question of age at birth of the first child in women aged 20-24 will allow the direct calculation of the indicator, a matter that should be agreed upon from the regional point of view. Uruguay included for the first time in the 2011 Census a question on the year of birth of the first child for women with at least one live birth. Through the construction of life tables, the conditional probabilities of the birth of the first child and the proportion of women without children, by age, were calculated. Proposed alternative indicator
Percentage of women aged 20-24 who had their first child before age 20.
ECLAC - Population and Development series No. 120 The 2020 census round: challenges of the 2030 Agenda...106
Operational definitionNumerator: Women aged 20-24 who had their first child before age 20.Denominator: Women between 20 and 24 years old.
Variable(s) needed to calculate the indicatorMother’s age at first birth (child).
Status of the countries in the 2010 census roundCountries that have the necessary information: 4 (CO-EC-PE-UY).Countries that do not have the necessary information: 16 (AR-BO-BR-CH-CR-SL-GU-HA-
HO-MX-NI-PA-PY-RD-VE).Recommendations made by the countries in the seminar
Although the indicator remains to be defined, four countries ask the question of women aged 20-24 who had their first child before age 20. Uruguay stressed that it is worth seeing its significance and that it worked well in its country. It is recommended that this aspect be observed in light of the decline in the use of DHS in the region in recent years, since the issue of fertility in early unions is a phenomenon that is gaining increasing momentum in the countries. One recommendation is to compare results with DHS in countries that have incorporated these questions. The Latin American and Caribbean Demographic Centre (CELADE) has developed special processes with countries such as Ecuador that have shown significant results in differentiating between ethnic groups.
3. Integration with other sourcesFor intercensal monitoring, HS/AR/DHS/QLS/MICS.Indigenous Peoples Indicators.
No. 47
1. 2030 Agenda/MCPD indicator MCPD H.7
Number of indigenous peoples or communities at risk of extinction.Technical definition according to the metadata
The metadata of the Montevideo Consensus indicators are either under construction, or else the contents of those that have global reference (methodology or monitoring by agencies) are being adapted to the region.
2. Calculating the indicator from census dataScope and limitations for measurement
The concept of “risk of extinction” needs to be defined. The document “Censos 2010 y la inclusión del enfoque étnico: hacia una construcción participativa con pueblos indígenas y afrodescendientes de América Latina”, Seminars and Conferences series, No. 57 (LC/L.3095-P) reports the scope of the incorporation of the ethnic approach in the 2010 population census can be seen in the ECLAC Seminars and Conferences series No. 57.
ECLAC - Population and Development series No. 120 The 2020 census round: challenges of the 2030 Agenda... 107
Operational definitionNumerator: Indigenous peoples who are at risk of extinction (as defined).Denominator: Total of indigenous peoples in the country.
Variable(s) needed to calculate the indicator Defining the concept of “risk of extinction” would make it possible to ascertain the
situation for the 2010 censuses. In the meantime, the criterion to be used is whether to include the question on ethnicity at the individual or household level in order to identify existing villages.Status of the countries in the 2010 census round
Countries that have the necessary information:a 17(AR-BO-BR-CH-CO-CR-EC-SL-GU-HO-MX-NI-PA-PY-PE-UY-VE).
Countries that do not have the necessary information: 3 (CU-HA-RD).Recommendations made by the countries in the seminar
There is a need to define the concept of “extinction” since it seems to be aimed at the existence of small communities and taking into account the spread of indigenous peoples in all territories and the difficulty of applying such a concept to the entire population. Also, review the use of information on internal and international migration.
3. Integration with other sourcesFor intercensal monitoring, HS/QLS/MICS.
a Countries investigate differently, although with the self-identification criterion. AR investigates in the household; MX, PA, PE and VE on the language spoken; MX also whether it is indigenous but without identifying people; PA conducts a special census for indigenous communities.
No. 48
1. 2030 Agenda/MCPD indicatorMCPD H.8
Percentage of the indigenous population displaced from their territories.Technical definition according to the metadata
The metadata of the Montevideo Consensus indicators are either under construction, or else the contents of those that have global reference (methodology or monitoring by agencies) are being adapted to the region.
2. Calculating the indicator from census dataScope and limitations for measurement
The MCPD suggests breaking down the indicator by type of displacement (investment projects, violence, pollution and land degradation, etc.). The concept of displacement from indigenous “territories” needs to be defined. Review experiences related to questions of migration and its causes. This indicator as it stands cannot be measured.Proposed alternative indicator
Percentage of indigenous population displaced from their territories. This is the same MCPD.
ECLAC - Population and Development series No. 120 The 2020 census round: challenges of the 2030 Agenda...108
Operational definition
Numerator: Indigenous population displaced from their territories (as defined).
Denominator: Total indigenous population.
Variable(s) needed to calculate the indicator
Once the concept of “displacement of the territory” has been defined, the situation will be known for the 2010 census. In the meantime, it is worth mentioning the countries that are investigating this aspect and some of the criteria used.
Status of the countries in the 2010 census round
Countries that have the necessary information:a 17 (AR-BO-BR-CH-CO-CR-EC-SL-GU-HO-MX-NI-PA-PY-PE-UY-VE).
Countries that do not have the necessary information: 3 (CU-HA-RD).
Recommendations made by the countries in the seminar
It is necessary to define the concept of “displaced person” and the reasons associated with the displacement. Also review the use of information on internal and international migration.
3. Integration with other sourcesAdministrative records (AR).
a Countries investigate differently, although with the self-identification criterion. AR investigates in the household; MX, PA, PE and VE on the language spoken; MX also whether it is indigenous but without identifying people; PA conducts a special census for indigenous communities.
No. 49
1. 2030 Agenda/MCPD indicatorSDG 1.1.1MCPD A.1
Proportion of the population living below the international poverty line by sex, age, employment status and geographic location (urban/rural).
Technical definition according to SDG metadata
This indicator provides the proportion of the total population and the proportion of the employed population living in households with per capita consumption or income below the international poverty line of US$1.90 per day.
It is calculated by dividing the number of people living in households below the poverty line (disaggregated by sex, age and employment status) by the total number of people (disaggregated by the same sex, age and employment status groups). It combines the poverty indicator in the first axis (1a) of the MDGs on poverty eradication with the corresponding labour indicator for monitoring the second axis (1b) of the MDGs on decent work. By combining the poverty situation with the labour situation, the objective is to measure the number of workers living in poverty, despite being in employment.
Poverty Indicators
ECLAC - Population and Development series No. 120 The 2020 census round: challenges of the 2030 Agenda... 109
For further information, see United Nations, “Goal 1: End poverty in all its forms everywhere”, 2020 [online] https://unstats.un.org/sdgs/metadata/files/Metadata-01-01-01a.pdf and United Nations, “Goal 1: End poverty in all its forms everywhere”, 2020 [online] https://unstats.un.org/sdgs/metadata/files/Metadata-01-01-01b.pdf.
2. Calculating the indicator from census dataScope and limitations for measurement
This indicator can be calculated for countries that include the income and employment situation variable. In this case a threshold would be calculated for the total population and another for those who work, to discern the number of workers living in poverty despite having a job. The MCPD documents state that there was a broad consensus among countries that the SDG indicator, as defined, is insufficient and that a multidimensional approach to poverty is needed. Given that the countries of the region apply different criteria for measuring multidimensional poverty, and also taking into account that ECLAC is working on a methodology that is applicable at the regional level, it was considered appropriate to leave the definition of a common criterion for later. In this context, and in line with SDG 1.2.2 (Proportion of men, women and children of all ages living in poverty, in all its dimensions, according to national definitions), it is necessary to continue to review the methodologies for measuring poverty and inequality so that they reflect the complexity and specificities of each country.
It is advisable to consider a proxy indicator that allows measuring poverty with census data that does not consider income. There are several options in the region, such as regional poverty estimation (Statistical Conference of the Americas - ECLAC); monetary income estimation from the census; Unmet Basic Needs; multidimensional poverty (ECLAC); use of multivariate methods. There is no doubt that even when investigating income, the study of poverty through other variables is substantial in a source such as the census. There are no countries that have not applied some simpler or more complex model to show differences owing to situations of poverty, lack or whatever the phenomenon is called. What is certain is that a regional consensus is needed to measure this indicator and to guarantee comparability among countries and throughout a historical series up to 2030, at a time when political and social demand is for measuring differences and gaps in order to try to reduce them.
Proposed alternative indicator
Option 1: Proportion of the population living below the international poverty line Same as SDG.
Option 2: Proportion of poor population (according to poverty defined by regional consensus that does not include income).
Operational definition
Option 1:
Numerator: Population below the poverty line (calculated by income).
Denominator: Total household population.
Option 2:
Numerator: Poor population (according to poverty defined by regional consensus that does not include income).
Denominator: Total population.
ECLAC - Population and Development series No. 120 The 2020 census round: challenges of the 2030 Agenda...110
Variable(s) needed to calculate the indicatorOption 1: Household income.Option 2: Variables defined in the regional methodology for a poverty measure that does
not include income. Not proposed until consensus is achieved.Status of the countries in the 2010 census roundOption 1:
Countries that have the necessary information: 4 (BR-MX-PA-VE).Countries that do not have the necessary information: 16 (AR-BO-CH-CO-CU-CR-EC-
SL-GU-HA-HO-NI-PY-PE-RD-UY).Option 2:
Depends on the concept agreed upon by the countries for an international comparison with a definition of poverty that does not include income.Recommendations made by the countries in the seminar
Most countries do not include income measurement in the census owing to collection difficulties and quality problems. It is worth asking to what extent countries are willing to incorporate the measurement of this variable and what were the drawbacks for those countries that already incorporated it.
The seminar also recommended taking into account the fact that there are other variants for measuring economic status, poverty or unmet basic needs. Each country has studied the socioeconomic level in a different way; as also has ECLAC which has developed a method for measuring poverty that should be discussed in order to reach a regional agreement on the matter.
3. Integration with other sourcesFor intercensal monitoring, HS/QLS/MICS.
No. 50
1. 2030 Agenda/MCPD indicatorSDG 1.2.1MCPD A.2
Proportion of population living below the national poverty line, by sex and age.Technical definition according to the metadata
Proportion of the total population and the proportion of the population employed in households with per capita consumption or income below the national poverty line. It is calculated by dividing the number of people living in households below the poverty line (disaggregated by sex, age and employment status) by the total number of people (disaggregated by the same sex, age and employment status groups). By combining the poverty situation with the labour situation, the concept of the working poor is captured, whose objective is to measure the number of workers who, despite being in employment, live in poverty.
ECLAC - Population and Development series No. 120 The 2020 census round: challenges of the 2030 Agenda... 111
The national poverty rate is the percentage of the total population living below the national poverty line. The rural poverty rate is the percentage of the rural population living below the national poverty line (or in cases where a separate, rural poverty line is used, the rural poverty line). Urban poverty rate is the percentage of the urban population living below the national poverty line (or in cases where a separate, urban poverty line is used, the urban poverty line).]If individual consumption or income is below the national poverty line (for example, in absolute terms the line could be the price of a consumption package or in relative terms a percentage of the income distribution), then it is counted as poor. Consumption or income data are collected from national surveys.
For further information, see United Nations, “Goal 1: End poverty in all its forms everywhere”, 2017 [online] http://unstats.un.org/sdgs/metadata/files/Metadata-01-02-01.pdf.
2. Calculating the indicator from census dataScope and limitations for measurement
National estimates of income poverty are derived from household survey data. The caveats and limitations inherent in survey data that apply to the construction of indicator 1.1.1 also apply here.
Given that this indicator refers to the national poverty line and that this document proposes the idea of reaching a regional consensus for the measurement of indicators through censuses, it does not warrant inclusion in the discussion. SDG 1.1.1/MCPD A.1 would be the indicator used for regional comparison through census data, via either option 1 or 2 mentioned above.Proposed alternative indicator
As this indicator refers to the national poverty line and this document proposes the idea of reaching a regional consensus, it is not worth including as an indicator to be discussed.Operational definition
As this indicator refers to the national poverty line and this document proposes the idea of reaching a regional consensus, it is not worth including as an indicator to be discussed.Variable(s) needed to calculate the indicator
As this indicator refers to the national poverty line and this document proposes the idea of reaching a regional consensus, it is not worth including as an indicator to be discussed.
Status of the countries in the 2010 census round
Given that this indicator refers to the national poverty line and that this document proposes the idea of reaching a regional consensus, it is not worth including as an indicator to be discussed.
Recommendations made by the countries in the seminarGiven that this indicator refers to the national poverty line and that this document
proposes the idea of reaching a regional consensus, it is not worth including as an indicator to be discussed.3. Integration with other sources
Not applicable (n.a.).
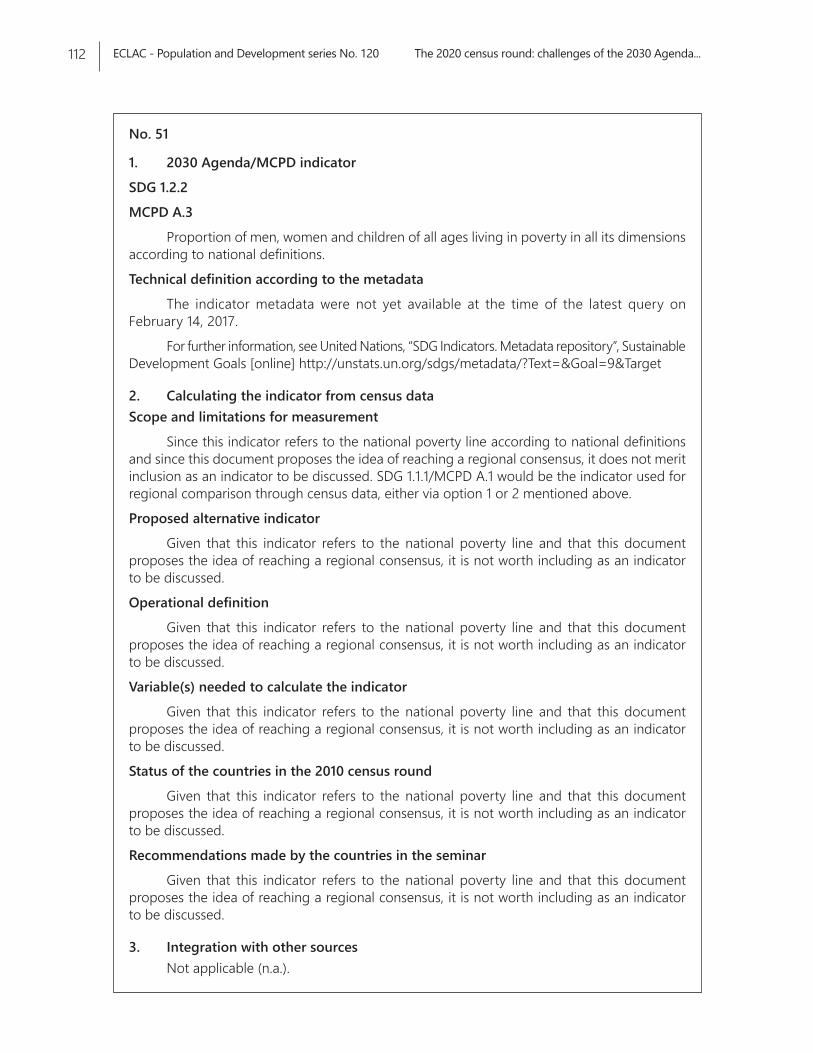
ECLAC - Population and Development series No. 120 The 2020 census round: challenges of the 2030 Agenda...112
No. 51
1. 2030 Agenda/MCPD indicator
SDG 1.2.2
MCPD A.3
Proportion of men, women and children of all ages living in poverty in all its dimensions according to national definitions.
Technical definition according to the metadata
The indicator metadata were not yet available at the time of the latest query on February 14, 2017.
For further information, see United Nations, “SDG Indicators. Metadata repository”, Sustainable Development Goals [online] http://unstats.un.org/sdgs/metadata/?Text=&Goal=9&Target
2. Calculating the indicator from census dataScope and limitations for measurement
Since this indicator refers to the national poverty line according to national definitions and since this document proposes the idea of reaching a regional consensus, it does not merit inclusion as an indicator to be discussed. SDG 1.1.1/MCPD A.1 would be the indicator used for regional comparison through census data, either via option 1 or 2 mentioned above.
Proposed alternative indicator
Given that this indicator refers to the national poverty line and that this document proposes the idea of reaching a regional consensus, it is not worth including as an indicator to be discussed.
Operational definition
Given that this indicator refers to the national poverty line and that this document proposes the idea of reaching a regional consensus, it is not worth including as an indicator to be discussed.
Variable(s) needed to calculate the indicator
Given that this indicator refers to the national poverty line and that this document proposes the idea of reaching a regional consensus, it is not worth including as an indicator to be discussed.
Status of the countries in the 2010 census round
Given that this indicator refers to the national poverty line and that this document proposes the idea of reaching a regional consensus, it is not worth including as an indicator to be discussed.
Recommendations made by the countries in the seminar
Given that this indicator refers to the national poverty line and that this document proposes the idea of reaching a regional consensus, it is not worth including as an indicator to be discussed.
3. Integration with other sourcesNot applicable (n.a.).
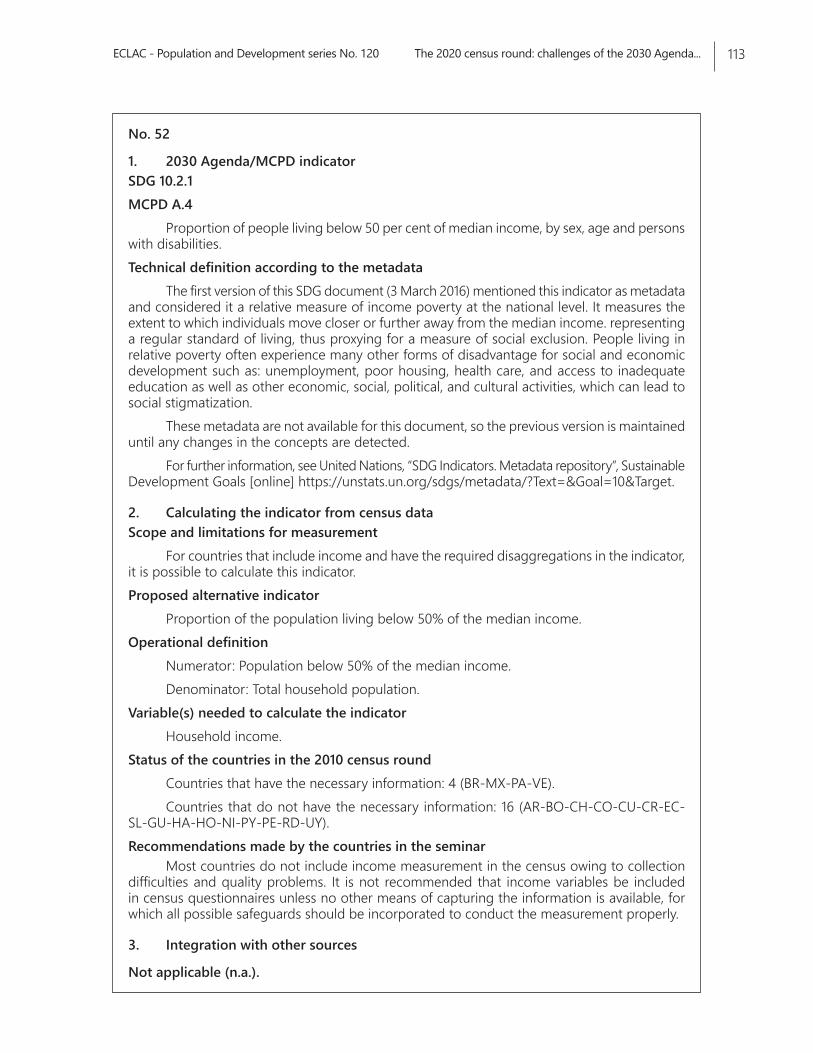
ECLAC - Population and Development series No. 120 The 2020 census round: challenges of the 2030 Agenda... 113
No. 52
1. 2030 Agenda/MCPD indicatorSDG 10.2.1MCPD A.4
Proportion of people living below 50 per cent of median income, by sex, age and persons with disabilities. Technical definition according to the metadata
The first version of this SDG document (3 March 2016) mentioned this indicator as metadata and considered it a relative measure of income poverty at the national level. It measures the extent to which individuals move closer or further away from the median income. representing a regular standard of living, thus proxying for a measure of social exclusion. People living in relative poverty often experience many other forms of disadvantage for social and economic development such as: unemployment, poor housing, health care, and access to inadequate education as well as other economic, social, political, and cultural activities, which can lead to social stigmatization.
These metadata are not available for this document, so the previous version is maintained until any changes in the concepts are detected.
For further information, see United Nations, “SDG Indicators. Metadata repository”, Sustainable Development Goals [online] https://unstats.un.org/sdgs/metadata/?Text=&Goal=10&Target.
2. Calculating the indicator from census dataScope and limitations for measurement
For countries that include income and have the required disaggregations in the indicator, it is possible to calculate this indicator.Proposed alternative indicator
Proportion of the population living below 50% of the median income.Operational definition
Numerator: Population below 50% of the median income.Denominator: Total household population.
Variable(s) needed to calculate the indicatorHousehold income.
Status of the countries in the 2010 census roundCountries that have the necessary information: 4 (BR-MX-PA-VE).Countries that do not have the necessary information: 16 (AR-BO-CH-CO-CU-CR-EC-
SL-GU-HA-HO-NI-PY-PE-RD-UY).Recommendations made by the countries in the seminar
Most countries do not include income measurement in the census owing to collection difficulties and quality problems. It is not recommended that income variables be included in census questionnaires unless no other means of capturing the information is available, for which all possible safeguards should be incorporated to conduct the measurement properly.
3. Integration with other sources
Not applicable (n.a.).
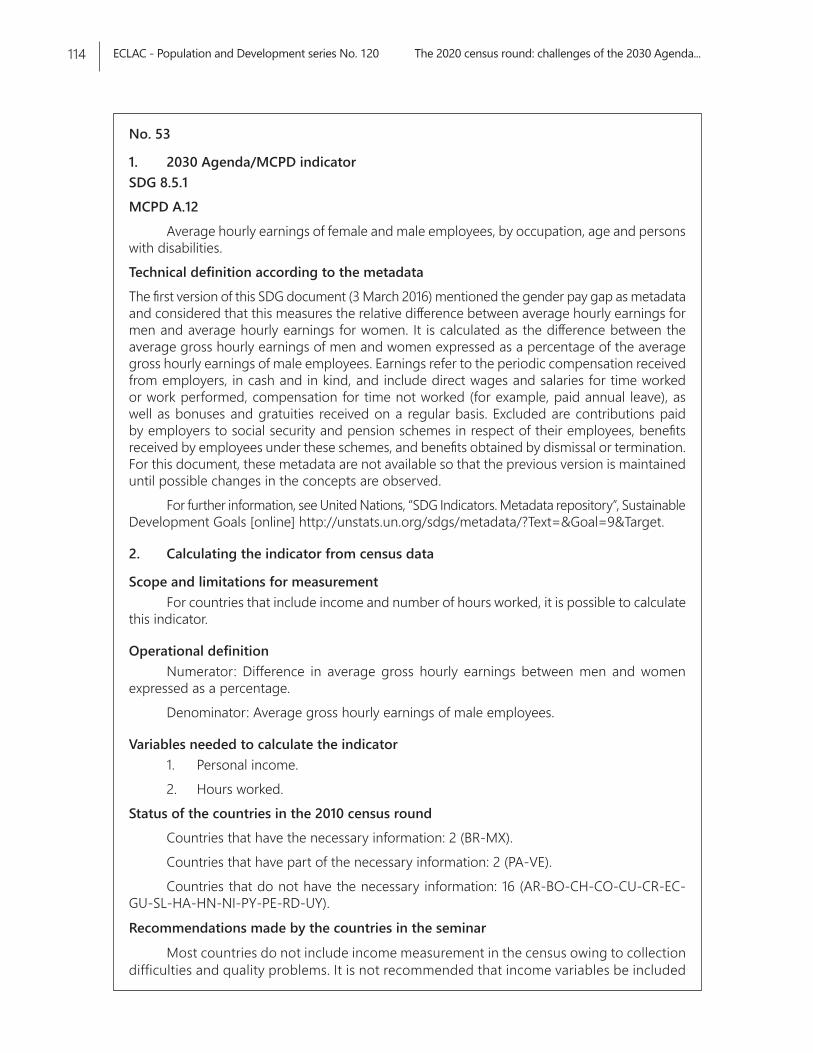
ECLAC - Population and Development series No. 120 The 2020 census round: challenges of the 2030 Agenda...114
No. 53
1. 2030 Agenda/MCPD indicatorSDG 8.5.1MCPD A.12
Average hourly earnings of female and male employees, by occupation, age and persons with disabilities.Technical definition according to the metadataThe first version of this SDG document (3 March 2016) mentioned the gender pay gap as metadata and considered that this measures the relative difference between average hourly earnings for men and average hourly earnings for women. It is calculated as the difference between the average gross hourly earnings of men and women expressed as a percentage of the average gross hourly earnings of male employees. Earnings refer to the periodic compensation received from employers, in cash and in kind, and include direct wages and salaries for time worked or work performed, compensation for time not worked (for example, paid annual leave), as well as bonuses and gratuities received on a regular basis. Excluded are contributions paid by employers to social security and pension schemes in respect of their employees, benefits received by employees under these schemes, and benefits obtained by dismissal or termination. For this document, these metadata are not available so that the previous version is maintained until possible changes in the concepts are observed.
For further information, see United Nations, “SDG Indicators. Metadata repository”, Sustainable Development Goals [online] http://unstats.un.org/sdgs/metadata/?Text=&Goal=9&Target.
2. Calculating the indicator from census data
Scope and limitations for measurement For countries that include income and number of hours worked, it is possible to calculate
this indicator.
Operational definitionNumerator: Difference in average gross hourly earnings between men and women
expressed as a percentage.Denominator: Average gross hourly earnings of male employees.
Variables needed to calculate the indicator 1. Personal income.2. Hours worked.
Status of the countries in the 2010 census roundCountries that have the necessary information: 2 (BR-MX).Countries that have part of the necessary information: 2 (PA-VE).Countries that do not have the necessary information: 16 (AR-BO-CH-CO-CU-CR-EC-
GU-SL-HA-HN-NI-PY-PE-RD-UY).
Recommendations made by the countries in the seminar
Most countries do not include income measurement in the census owing to collection difficulties and quality problems. It is not recommended that income variables be included
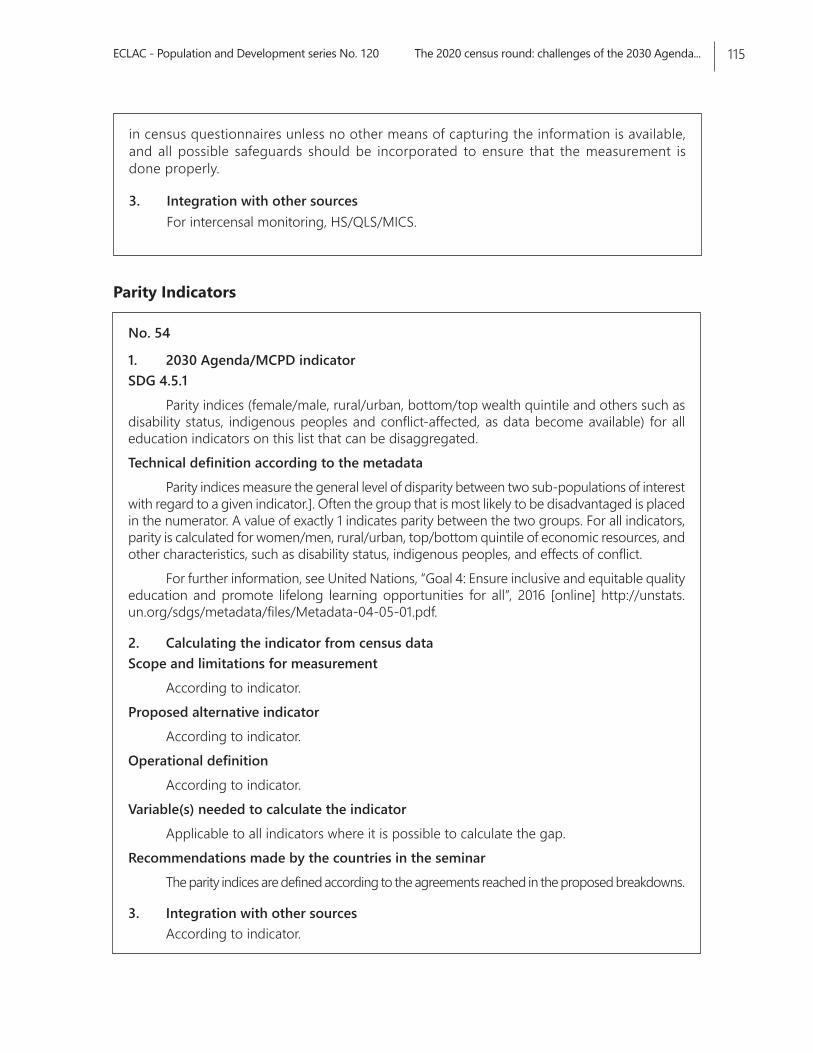
ECLAC - Population and Development series No. 120 The 2020 census round: challenges of the 2030 Agenda... 115
in census questionnaires unless no other means of capturing the information is available, and all possible safeguards should be incorporated to ensure that the measurement is done properly.
3. Integration with other sourcesFor intercensal monitoring, HS/QLS/MICS.
No. 54
1. 2030 Agenda/MCPD indicatorSDG 4.5.1
Parity indices (female/male, rural/urban, bottom/top wealth quintile and others such as disability status, indigenous peoples and conflict-affected, as data become available) for all education indicators on this list that can be disaggregated. Technical definition according to the metadata
Parity indices measure the general level of disparity between two sub-populations of interest with regard to a given indicator.]. Often the group that is most likely to be disadvantaged is placed in the numerator. A value of exactly 1 indicates parity between the two groups. For all indicators, parity is calculated for women/men, rural/urban, top/bottom quintile of economic resources, and other characteristics, such as disability status, indigenous peoples, and effects of conflict.
For further information, see United Nations, “Goal 4: Ensure inclusive and equitable quality education and promote lifelong learning opportunities for all”, 2016 [online] http://unstats.un.org/sdgs/metadata/files/Metadata-04-05-01.pdf.
2. Calculating the indicator from census dataScope and limitations for measurement
According to indicator.Proposed alternative indicator
According to indicator.Operational definition
According to indicator.Variable(s) needed to calculate the indicator
Applicable to all indicators where it is possible to calculate the gap.Recommendations made by the countries in the seminar
The parity indices are defined according to the agreements reached in the proposed breakdowns.
3. Integration with other sourcesAccording to indicator.
Parity Indicators
ECLAC - Population and Development series No. 120 The 2020 census round: challenges of the 2030 Agenda...116
Issues published
A complete list as well as pdf files are available at www.eclac.org/publicaciones
120. The 2020 census round: challenges of the 2030 Agenda for Sustainable Development, theSustainable Development Goals and the Montevideo Consensus on Population and Development(LC/TS.2017/93), 2021.
119. Fecundidad no deseada entre las adolescentes latinoamericanas: un aumento que desafía la saludsexual y reproductiva y el ejercicio de derechos, Jorge Rodríguez Vignoli (LC/TS.2017/92), 2017.
118. Mortalidad materna en pueblos indígenas y fuentes de datos: alcances y desafíos para sumedición en países de América Latina, Lina Márquez, Amalia Plana y María Cecilia Villarroel(LC/TS.2017/68), 2017.
117. Reproducción temprana: diferencias entre grandes regiones del mundo al inicio y al finalde la adolescencia, Jorge Rodríguez Vignoli, Mariachiara Di Cesare y Katherine Páez(LC/TS.2017/36), 2017.
116. Reproducción en la adolescencia en Chile: la desigualdad continua y las políticas activas urgen,Jorge Rodríguez Vignoli, Katherine Páez, Consuelo Ulloa y León Cox (LC/TS.2017/22), 2017.
115. Trends in adolescent motherhood and fertility and related inequalities in the Caribbean. 1990-2010, Valerie E. Nam (LC/L.4212), 2016.
114. Nuevas tendencias y dinámicas migratorias en América Latina y el Caribe, Jorge MartínezPizarro y Cristián Orrego Rivera (LC/L.4164), 2015.
113. La mortalidad materna: ¿por qué difieren las mediciones externas de las cifras de los países?,Magda Ruiz Salguero, Lina Márquez y Tim Miller (LC/L.4102), 2015.
112. Políticas publicas en América Latina para la reducción de la mortalidad materna 2009-2014,Alejandra Burgos Bizama (LC/L.4096), 2015.
111. Hacia la armonización de las estimaciones de mortalidad materna en América Latina. Actualizacióny ampliación a los 20 países de la región, Magda Ruiz Salguero, Tim Miller, Lina Márquez yMaría Cecilia Villarroel (LC/L.4095), 2015.
SeriesPopulation and Development
POPULATION AND DEVELOPMENTIssues published:
120 The 2020 census round: challenges of the 2030 Agenda for Sustainable Development, the Sustainable Development Goals and the Montevideo Consensus on Population and Development
119 Fecundidad no deseada entre las adolescentes latinoamericanasUn aumento que desafía la salud sexual y reproductiva y el ejercicio de derechosJorge Rodríguez Vignoli
118 Mortalidad materna en pueblos indígenas y fuentes de datosAlcances y desafíos para su medición en países de América LatinaLina Márquez, Amalia Plana y María Cecilia Villarroel
117 Reproducción tempranaDiferencias entre grandes regiones del mundo al inicio y al final de la adolescenciaJorge Rodríguez Vignoli, Mariachiara Di Cesare y Katherine Páez