service validation protocol (c5) - · pdf filegmes terrafirma esrin/contract no. 17059/03/i-iw...
TRANSCRIPT
GMES
TERRAFIRMA
ESRIN/Contract no. 17059/03/I-IW
Service Validation Protocol
C5
August 2008
V3.4
Nico Adam and Bert Kampes
DLR
Contributor to Dossier
BRGM, BGS, DLR, NPA
Reviewed by: Project Manager
Ren Capes / signature / date
Approved by: Project Contract Officer
David Morten / signature / date

ESA GMES: Terrafirma C5: Service Validation Protocol August 2008: Version 3.4
Copyright NPA and Terrafirma collaborators 2006 i
CHANGE RECORD
Rev. Date Who Changes
V1 ? ? Initial version
V2 12/04 S. le Mouelic, D.
Raucoules (BRGM)
N/A (29 pages total)
V3 01/06 B. Kampes (DLR) Added this change record; Restructured the document;
Cleaned document from spurious formatting. Added
cross-references; Included specific PSI weaknesses
based on PSIC4 experiences; Included LSM and LSI
products as level 2 and variants (not level 3); Included
hybrid technologies as new product. Clarified difference
between service/process/product validation and quality
control; Included acronyms. Included applicable
reference documents, removed bibliography. Included
validation of new products/upgrades; Included DLR's
role as external organ; Added UTM zone; Added
validation flows for service/process/product validation.
Added example validation report. Added availability
section. Extended introduction, executive summary,
conclusions; Removed original flow charts, sections on
level2/3 validation.
V3.1 11/06 N. Adam (DLR)
- transfer of responsibility from BK to NA
- incorporated comments of Philippe Bally (ESA):
- added section on intended readership
- removed assumption on DLR being the validation
authority
- fixed some spelling mistakes
- updated section 2.2.2 to make clear that ground truth
data are not required for the PsInSAR processing
chain validation
- removed references to PSIC4 in section 2.2.2
- clarified the not planned corrective actions for
production accuracy in section 2.4
- fixed broken cross-references
V3.2
05/07 N. Adam (DLR) - included the Specification of Validation Approach into
the Appendix
- included the Quality Control Document into the
Appendix
V3.3 01/11 N. Adam (DLR) - added Terrafirma Validation Manual
ESA GMES: Terrafirma C5: Service Validation Protocol August 2008: Version 3.4
Copyright NPA and Terrafirma collaborators 2006 ii
V3.4 08/08 N. Adam (DLR) - harmonized the validation status and actions and
the document and validation tables
- removed unnecessary and doubled entries in the
validation tables
- clarified the introduction
- re-adjusted the Executive Summary
- added structure and levels of validation
- fixed product level confusion
- change of concept:
until now: “the End-User is to perform product
validation using all available ground-truth data”
now: independent experts perform a long term
product and process validation
- updated and clarified the validation of
- new OSPs,
- new products and
- software updates
- added examples for new products:
- traffic light product,
- atmospheric phase screen which is related to
the atmospheric water wapour
- included the recent version (1.5) of the
Quality Control Protocol
- improved and replaced many figures
- specified the requirements on the validation
reverence data
ESA GMES: Terrafirma C5: Service Validation Protocol August 2008: Version 3.4
Copyright NPA and Terrafirma collaborators 2006 iii
APPLICABLE REFERENCE DOCUMENTS
Terrafirma. Core User Needs and User Standards. Dossier U1, Version 2, July 2004.
Terrafirma. Service Level Agreement. Dossier C7, Version 3, August 2004.
Terrafirma. Service Portfolio Specifications. Dossier S5, Version 2, August 2004.
Terrafirma. Service Prospectus. Dossier S3, Version 2, September 2004.

ESA GMES: Terrafirma C5: Service Validation Protocol August 2008: Version 3.4
Copyright NPA and Terrafirma collaborators 2006 iv
ACRONYMS
BRGM Bureau de Recherches Geologiques et Minieres
CATInSAR Compact Active Transponder InSAR
CE Civil Engineering company
CRInSAR Corner Reflector InSAR
CUG Core User Group
DEM Digital Elevation Model
DLR Deutsches Zentrum für Luft und Raumfahrt (German Aerospace Center)
EO Earth Observation
ERS European Remote Sensing Satellite
ETRS 89 European Terrestrial Reference System 1989
FTP File Transfer Protocol
GIS Geographical Information System
GPS Global Positioning System
GRS80 Geodetic Reference System 1980
GS Geological Survey
H1/2/3 Historic data product of level 1/2/3
InSAR Interferometric SAR
INSPIRE Infrastructure for Spatial Information in Europe
ISO International Standard Organisation
LSI Landslide Inventory (product)
LSM Landslide Motion mapping (product)
M2 Monitoring data product (level 2)
NPA Nigel Press Associates Ltd.
OSP Operational Service Provider (also VAC)
PS Persistent Scatterer
PSInSAR Persistent Scatterer Interferometric SAR
QC Quality Control
QCP Quality Control Protocol
RMSE Root Mean Square Error
SAR Synthetic Aperture Radar
SLA Service Level Agreement
UTM Universal Transverse Mercator (projection)
VAC (Earth Observation) Value Added Company (also OSP)
ESA GMES: Terrafirma C5: Service Validation Protocol August 2008: Version 3.4
Copyright NPA and Terrafirma collaborators 2006 v
STRATEGY GROUP MEMBER ENDORSEMENT
I, the undersigned, confirm that I have read and endorse this dossier.
Strategy group member for policy
Name……………………………………..……Signature…………………..…….………………….
Strategy group member for science
Name……………………………………..……Signature…………………………………………….
Strategy group member for users
Name……………………………………..……Signature…………………………………………….
ESA GMES: Terrafirma C5: Service Validation Protocol August 2008: Version 3.4
Copyright NPA and Terrafirma collaborators 2004 vi
EXECUTIVE SUMMARY
This dossier describes the top-level definition of the approach for validating all constituents of
the Terrafirma service portfolio. It establishes validation principles that cover all products and
services. In particular, Level 1 products corresponding to raw InSAR and PSI measurements
are clearly specifyed. Furthermore, the general principle and responsibility are defined for
Level 2 products including external data layers (causal) and Level 3 products with global
appraisal and modelling. The document in hand contains the definition, specification and
planned approach for monitoring compliance with user requirements for adherence to the
(user driven) standards. This dossier defines and scopes the Terrafirma Service Validation.
ESA GMES: Terrafirma C5: Service Validation Protocol August 2008: Version 3.4
Copyright NPA and Terrafirma collaborators 2004 vii
TABLE OF CONTENTS
CHANGE RECORD .......................................................................................... I
APPLICABLE REFERENCE DOCUMENTS .................................................. III
ACRONYMS .................................................................................................. IV
STRATEGY GROUP MEMBER ENDORSEMENT ......................................... V
EXECUTIVE SUMMARY ............................................................................... VI
TABLE OF CONTENTS ............................................................................... VII
1 INTRODUCTION ..................................................................................... 1
1.1 Intended Readership ............................................................................... 1
1.2 Outline ..................................................................................................... 1
2 STRUCTURE AND LEVELS OF VALIDATION ...................................... 2
3 VALIDATION OF LEVEL 1 PRODUCTS ................................................ 5
3.1 Process Validation .................................................................................. 6
3.1.1 Conventional InSAR and Stacked InSAR Production ...................................... 6
3.1.2 PSInSAR Production Chain ............................................................................. 6
3.2 Product Validation .................................................................................. 8
3.2.1 Conventional InSAR and Stacked InSAR Production ...................................... 8
3.2.2 PSInSAR Product Validation .......................................................................... 10
3.3 Quality Control Protocol ....................................................................... 13
3.3.1 Validation of the Ordering Procedure ............................................................. 13
3.3.2 Validation of the Delivery ............................................................................... 14
3.3.3 Conformity with the Product Standards .......................................................... 14
3.4 Summary of the Level 1 Validation and Relevant Documents ........... 14
3.4.1 Preparational Documents for the Long Term Validation ................................ 14
3.4.2 Process Validation .......................................................................................... 15
3.4.3 Product Validation .......................................................................................... 16
3.4.4 Quality Control Protocol ................................................................................. 16
3.4.5 General Validation Statements ...................................................................... 17

ESA GMES: Terrafirma C5: Service Validation Protocol August 2008: Version 3.4
Copyright NPA and Terrafirma collaborators 2004 viii
3.5 Time Line and Workflow of the Level 1 Validation .............................. 17
3.6 Product Validation Manual for Level 1 Products ................................ 21
3.6.1 Detection of Risk Areas (Task 1) ................................................................... 21
3.6.2 Measurement of Deformation Rate (Task 2) .................................................. 28
3.6.3 Systematic Effects .......................................................................................... 29
3.6.4 Robustness of Operation ............................................................................... 31
3.6.5 Long Term Validation Result Reporting ......................................................... 32
3.6.6 Remark ........................................................................................................... 35
4 PRODUCT VALIDATION OF LEVEL 2 PRODUCTS ........................... 36
4.1 Landslide Inventory Product (LSI) ....................................................... 37
4.2 Landslide Monitoring Product (LSM) ................................................... 37
5 PRODUCT VALIDATION OF LEVEL 3 PRODUCTS ........................... 38
6 VALIDATION OF REFERENCE DATA ................................................. 39
6.1 Validation of end-User Reference Data ................................................ 39
6.2 Endorsement of Validation from Key External User-Bodies .............. 39
7 VALIDATION OF NEW PRODUCTS AND PROVIDERS AND
SOFTWARE UPGRADES ............................................................................. 40
7.1 New Operational Service Provider (OSP) ............................................ 40
7.2 Software Upgrades................................................................................ 40
7.3 New or Updated Standards ................................................................... 41
7.4 New Products ........................................................................................ 42
7.4.1 Traffic Light Product ....................................................................................... 42
7.4.2 Atmospheric Phase Screen ............................................................................ 43
7.4.3 Hybrid technologies products ......................................................................... 43
8 ACCESS, DISTRIBUTION AND AVAILABILITY OF VALIDATION
DOCUMENTS ................................................................................................ 44
9 SUMMARY AND CONCLUSIONS ........................................................ 45
10 GENERAL TABLES FOR THE SERVICE VALIDATION ..................... 46
ESA GMES: Terrafirma C5: Service Validation Protocol August 2008: Version 3.4
Copyright NPA and Terrafirma collaborators 2004 ix
11 QUALITY CONRTOL PROTOCOL FOR LEVEL 1 PRODUCTS .......... 48
INTRODUCTION ........................................................................................... 52
Purpose and Scope ........................................................................................... 52
Intended Readership ......................................................................................... 52
Glossary ............................................................................................................. 53
References ......................................................................................................... 54
Applicable Documents ................................................................................................... 54
Reference Documents ................................................................................................... 54
Document Overview .......................................................................................... 56
Used Text Styles ................................................................................................ 57
INSAR SOFTWARE AND PRODUCTS OVERVIEW .................................... 58
QUALITY CONTROL WORKING SCENARIOS ............................................ 59
DESCRIPTION OF THE QUALITY CONTROL PROTOCOL ........................ 61
Project Overview ............................................................................................... 61
Data Availability and Feasibility ....................................................................... 62
Relevant Version ............................................................................................... 64
Processing ......................................................................................................... 65
Missing Lines Check on SLCs....................................................................................... 65
Coregistration: Single Scene Outlier Detection ............................................................. 66
Coregistration: Systematic Error Detection ................................................................... 67
Orbit Trend and APS Check .......................................................................................... 74
Coherence Images ........................................................................................................ 76
Single Scene Phase Unwrapping .................................................................................. 77
Scene Calibration .......................................................................................................... 78
PS Detection.................................................................................................................. 80
DEM Update Unwrapping Test...................................................................................... 82
Displacement Unwrapping Test .................................................................................... 83
Visualisations .................................................................................................... 84
Expected Accuracy ........................................................................................... 85

ESA GMES: Terrafirma C5: Service Validation Protocol August 2008: Version 3.4
Copyright NPA and Terrafirma collaborators 2004 x
Product Delivery ................................................................................................ 87
FEEDBACK OF OSPS .................................................................................. 89
Feedback by TRE ............................................................................................... 89
Feedback by Altamira ........................................................................................ 89
Feedback by Gamma RS ................................................................................... 95
Feedback by NPA .............................................................................................. 96
APPENDIX .................................................................................................. 100
Quality Control Protocol Example .................................................................. 100
Quality Control Protocol Template ................................................................. 104

ESA GMES: Terrafirma C5: Service Validation Protocol August 2008: Version 3.4
Copyright NPA and Terrafirma collaborators 2004 1
1 INTRODUCTION
Terrafirma is an ESA GMES project which provides a pan-European ground motion hazard information service. The service is based on the InSAR or PSI processing which is performed by Operational Service Providers (OSPs) being commercial companies capable of generating the InSAR-derived motion information. The used processing software is usually in-house developed and the algorithms are often disclosed. Finally, the generated data products describe terrain motion e.g. subsidence caused by mining, tunnelling, landslides, crustal deformation or volcanic deformation. End users expect the processing results delivered by the different OSPs to be technically conform to agreed standards, validated and to be comparable or even compatible. Terrafirma provides at the moment the steering board to initiate, document and establish such important standard principles for the first time. Therefore, Terrafirma brings together commercial radar remote sensing companies, national geoscience organisations, end users and govermental research institutions. This document defines a series of procedures for validating the Terrafirma services and the data products. These procedures ensure that the production procedures followed by all present and future OSPs are such that the quality of the delivered products conforms to the expectations of the end-users and that they adhere to the user-driven standards identified within the Core User Needs and User Standards Dossier (U1).
1.1 Intended Readership
The document is the guide for the project‟s validation authority as well as the actual and future OSPs. This group of InSAR and PSI specialists is the intended main readership of this document. The rules and the definitions inside of this document need to be agreed on and operated by all project participants generating data products. Finally, the document in hand provides the concept, the specification of the overall validation and quality assurance efforts of the Terrafirma project.
End users of the Terrafirma products (the OSP‟s customers) get an insight into the processing techniques of the motion monitoring, their intermediate data and the quality related parameters by the Quality Control Protocol dossier. This document helps them to interpret the Quality Control Protocol and its deliverables gaining understanding of the actual accuracy and reliability of the delivered final motion data.
1.2 Outline
The outline of this document is as follows. Section 2 introduces the principal constituens of the overall Terrafirma service and provides a coarse overview on the structure and the levels of validation. Sections 3, 4, and 5 describe the validation procedures for Level 1, 2, and 3 products, respectively. The Level 1 product validation is specified in more detail compared to the higher level products. This is the reason section 3 is decomposed into the single validation concepts. These are the process validation, the product validation and the quality control protocol. This section also includes the time line, the relevant reports and a validation manual. The use of external ground truth data during processing and for validation is dealt with in section 6, whereas section 7 deals with the validation of new products, new Operational Service Providers and software upgrades. A summary and conclusions are given in section 9. The appendix contains tables which support the reporting and the actual Quality Control Protocol dossier.
ESA GMES: Terrafirma C5: Service Validation Protocol August 2008: Version 3.4
Copyright NPA and Terrafirma collaborators 2004 2
2 STRUCTURE AND LEVELS OF VALIDATION
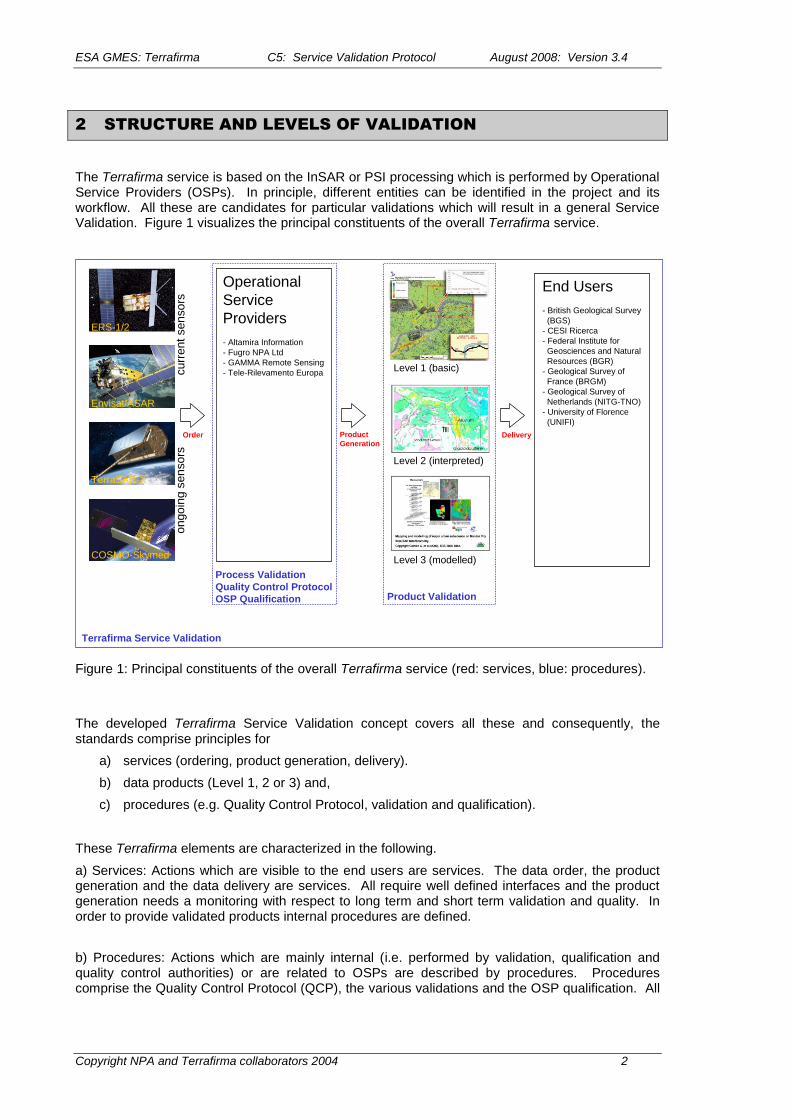
The Terrafirma service is based on the InSAR or PSI processing which is performed by Operational Service Providers (OSPs). In principle, different entities can be identified in the project and its workflow. All these are candidates for particular validations which will result in a general Service Validation. Figure 1 visualizes the principal constituents of the overall Terrafirma service.
Level 1 (basic)
Level 2 (interpreted)
Level 3 (modelled)
Operational
Service
Providers
- Altamira Information
- Fugro NPA Ltd
- GAMMA Remote Sensing
- Tele-Rilevamento Europa
ERS-1/2
Envisat/ASAR
TerraSAR-X
COSMO-Skymed
End Users
- British Geological Survey
(BGS)
- CESI Ricerca
- Federal Institute for
Geosciences and Natural
Resources (BGR)
- Geological Survey of
France (BRGM)
- Geological Survey of
Netherlands (NITG-TNO)
- University of Florence
(UNIFI)
Process Validation
Quality Control Protocol
OSP Qualification Product Validation
Terrafirma Service Validation
DeliveryOrder
curr
ent senso
rson
goin
g s
enso
rs
Product
Generation
Figure 1: Principal constituents of the overall Terrafirma service (red: services, blue: procedures).
The developed Terrafirma Service Validation concept covers all these and consequently, the standards comprise principles for
a) services (ordering, product generation, delivery).
b) data products (Level 1, 2 or 3) and,
c) procedures (e.g. Quality Control Protocol, validation and qualification).
These Terrafirma elements are characterized in the following.
a) Services: Actions which are visible to the end users are services. The data order, the product generation and the data delivery are services. All require well defined interfaces and the product generation needs a monitoring with respect to long term and short term validation and quality. In order to provide validated products internal procedures are defined.
b) Procedures: Actions which are mainly internal (i.e. performed by validation, qualification and quality control authorities) or are related to OSPs are described by procedures. Procedures comprise the Quality Control Protocol (QCP), the various validations and the OSP qualification. All

ESA GMES: Terrafirma C5: Service Validation Protocol August 2008: Version 3.4
Copyright NPA and Terrafirma collaborators 2004 3
these are established to provide assurances to the user communities. In Terrafirma, there are two main validation components:
1. PROCESS validation: This is validation of the product generation i.e. of the actual PSI processing chain, to ensure that it produces consistent, reliable, and up-to-specification Level 1 products. In addition, an overarching quality control standard is established.
2. PRODUCT validation: This validates that the measurements within a Level 1 data product have geological relevance.
The OSP qualification certifies the commercial companies (with their independently developed processing systems) to be conform to the Terrafirma standards. Finally, the qualified processing chains ensure that consistent, reliable, and up-to-specification products are generated by each Terrafirma OSP.
c) Data products: Terrafirma offers two types of products, Historical and Monitoring. The former use SAR data already acquired, which reside in an archive, to make products that are as up-to-date as the latest acquisition. The monitoring product implies specific satellite tasking for future acquisitions. The historical product is available in three levels of sophistication that build upon each other. The Level 1 product is a 'raw' InSAR ground motion measurement. Level 2 involves some analysis by a geophysical expert when the result is integrated with other geospatial data to provide an initial interpretation of the cause of the motion observed. Level 3 products involve geophysical modelling to provide a risk assessment or some forecast as to future events.
Terrafirma provides data products with different levels of value adding. Finally, the data products can be characterized by a hierarchy. Figure 2 visualizes in the left column that Level 1 data are the basis for Level 2 products which are again a basis for Level 3 products. This sequence in the production process has resulted in a validation hierarchy which is visualized in the right hand column of Figure 2. The presented hierarchy implyes that Level 2 data are partly validated by the Level 1 validation. The same principle is applied for Level 3 products which are consequently partially validated by the Level 1 and 2 checks.
Level 1RAW InSAR/PSI
Level 2other geo-spatial data
& interpretation
Level 3geophysical modelling
Level 1
Quality Control Protocol
Process Validation
Product Validation
Level 2
- Product Validation
Level 3
- Product Validation
Short Term Validation
Long Term Validation
Figure 2: Structure and levels of validation

ESA GMES: Terrafirma C5: Service Validation Protocol August 2008: Version 3.4
Copyright NPA and Terrafirma collaborators 2004 4
The prominent importance of the Level 1 data product requires special attention in the validation at this level. Consequently, the Terrafirma project implements a long term and short term validation for these fundamantal data. The long term validation and its reporting allows to reduce the effort in the day-to-day business e.g. by a condensed documentation on the actual processing and product validity. This fact is directly visible in a reduced number of protocol entries, many removed validation tables and is an enourmous advantage compared to the previous Terrafirma validation protocol.
The long term validation is achieved by a special validation project during the stage 2 of Terrafirma. A part of this initial validation effort is the product validation which results in a geo-characterization of the Level 1 data product. It proves the geophysical relevance of the generated data in general. The data generation itself is characterized and checked by a process validation. Both validation procedures are performed by independent core experts only and the outcome is reported to all participants and the end users. The validation covers the actual processing chains and the related data products. I.e. the product quality is assured for the actual sensors (ERS-1/2 and Envisat ASAR), the momentary acquisition mode (i.e. stripmap only) and the actual processing algorithms which are related to a fixed processor version. Another part of the long term validation is the qualification of the Terrafirma OSPs. The long term validation needs to be updated in case new sensors (e.g. TerraSAR-X, RADARSAT-2), new acquisition modes (e.g. Spotlight, ScanSAR) or new estimation techniques are utilized. Also new OSPs need to be checked i.e. qualified as Terrafirma OSP.
The short term validation of the data products is achieved by the implementation of the Quality Control Protocol. It proves the actual processing i.e. the current Level 1 data product to be free of atypical effects.
The validation of the other product levels is based on the cooperation of the VAC and the end users at the moment. The reason is that these validations require typically auxiliary data and information which are very often only avable to the end user of the data. In the near future, this simple validation can be complemented by a more general long term validation (and possible qualification) of the higher level value adding.

ESA GMES: Terrafirma C5: Service Validation Protocol August 2008: Version 3.4
Copyright NPA and Terrafirma collaborators 2004 5
3 VALIDATION OF LEVEL 1 PRODUCTS
The Level 1 products of the service portfolio are described in the dossier Service Portfolio
Specifications (S5). These products include the following types of InSAR measurements:
• Conventional differential interferogram.
• Stacked interferogram.
• Persistent Scatterers type analysis (PSInSAR).
Complete technical specifications are given for each of these products in the S5 dossier. In
particular, it defines the standards used for the map projection type, the type of raster file used, and
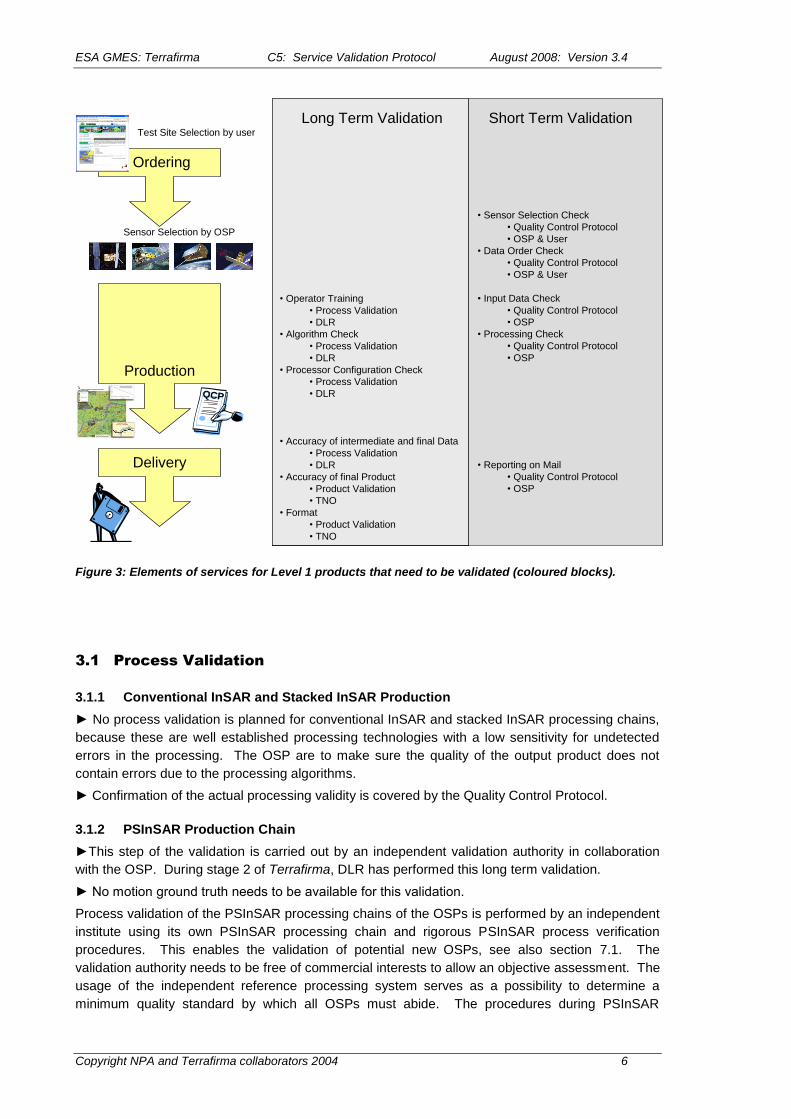
for the exchange of data in general. Figure 3 depicts a diagram of the procedures and services
which need to be validated for H1 products. The Terrafirma validation takes into account all
aspects of the service portfolio constituents in three stages. Finally, the combination of all single
validation efforts and reports guarantee the Technical Conformity of the finally delivered products.
I.e. the data are generated according to the agreed standards of the products and the services.
The three stages of validation are:
1. PROCESS validation: This ensures that the processing algorithms of the different OSPs
provide a similar precision in the deformation estimates and a comparable PS density. I.e.
the OSPs provide a comparable estimation performance and the End-User is without risk
in the selection of an OSP.
2. PRODUCT validation: This encompasses the relevance of the InSAR measurements,
including an assessment of the accuracy/ precision of the InSAR measurements, both from
a planimetric (horizontal) and a topometric (vertical) point of view.
3. Quality Control Protocol (QCP): This report provides the correctness of the actual
production. I.e. this validation ensures that procedures to detect and describe artefacts,
e.g., from atmospheric origin or misregistration, are in place at the OSP and are used to
tune the processing parameters and algorithms accordingly.
These stages are described in the subsequent sections 3.1, 3.2 and 3.3 respectively. The
conclusions of each validation step are to be included in different validation reports. I.e. there will
be no solely Terrafirma validation document for Level 1 data. This results from the concept of long
term and short term validation, the independent validation of the processing and the products and
the different bodies (independent research institutions e.g. IG/DLR/TNO, the OSPs or the end user)
performing the validation work. However, if one of the validations described in section 3.3.1, 3.3.2
and 3.3.3 is negative, the delivered products need to be corrected by the OSP upon request of the
End-User.
ESA GMES: Terrafirma C5: Service Validation Protocol August 2008: Version 3.4
Copyright NPA and Terrafirma collaborators 2004 6
Ordering
Production
Test Site Selection by user
Short Term Validation
Sensor Selection by OSP
Delivery
• Sensor Selection Check
• Quality Control Protocol
• OSP & User
• Data Order Check
• Quality Control Protocol
• OSP & User
• Input Data Check
• Quality Control Protocol
• OSP
• Processing Check
• Quality Control Protocol
• OSP
• Reporting on Mail
• Quality Control Protocol
• OSP
• Operator Training
• Process Validation
• DLR
• Algorithm Check
• Process Validation
• DLR
• Processor Configuration Check
• Process Validation
• DLR
• Accuracy of intermediate and final Data
• Process Validation
• DLR
• Accuracy of final Product
• Product Validation
• TNO
• Format
• Product Validation
• TNO
Long Term Validation
QCP
Figure 3: Elements of services for Level 1 products that need to be validated (coloured blocks).
3.1 Process Validation
3.1.1 Conventional InSAR and Stacked InSAR Production
► No process validation is planned for conventional InSAR and stacked InSAR processing chains,
because these are well established processing technologies with a low sensitivity for undetected
errors in the processing. The OSP are to make sure the quality of the output product does not
contain errors due to the processing algorithms.
► Confirmation of the actual processing validity is covered by the Quality Control Protocol.
3.1.2 PSInSAR Production Chain
►This step of the validation is carried out by an independent validation authority in collaboration
with the OSP. During stage 2 of Terrafirma, DLR has performed this long term validation.
► No motion ground truth needs to be available for this validation.
Process validation of the PSInSAR processing chains of the OSPs is performed by an independent
institute using its own PSInSAR processing chain and rigorous PSInSAR process verification
procedures. This enables the validation of potential new OSPs, see also section 7.1. The
validation authority needs to be free of commercial interests to allow an objective assessment. The
usage of the independent reference processing system serves as a possibility to determine a
minimum quality standard by which all OSPs must abide. The procedures during PSInSAR

ESA GMES: Terrafirma C5: Service Validation Protocol August 2008: Version 3.4
Copyright NPA and Terrafirma collaborators 2004 7
processing are particularly important in the sense that deformation signal may be mis-interpreted
as atmospheric signal, and that the height of the PS points may be difficult to estimate, depending
on the PSInSAR algorithm used. The process validation consists of the following steps:
1. Audit: Check the experience of the scientific and software system engineer, operators and
available resources in computing power, e.g., hard and software, are assessed based on
interviews and/or written documentation provided by the OSP. This can include a list of
key personnel and their curriculum vitae, publications in peer reviewed journals, internal
software documentation and descriptions of previous projects.
2. Quality Control (QC) documents of the OSP: Currently, each OSP has implemented its
own QC procedures which can not really be compared. Consequently, the realisation of
the actual OSP‟s Quality Control Protocol is not checked in detail. It is considered to be
part of the audit (mentioned above) showing the capability of the particular OSP to detect
errornous results and the experience of the developers. However, the implementation of
the overarching general Quality Control Protocol is ongoing. Future process validations or
qualifications of new OSPs will include the check of the correct implementation of the QCP
routines and their correct reporting.
3. Algorithmic assessment: Based on a 3-5 page description of the PSInSAR algorithm
provided by the OSP, the validation authority will assess the procedure to handle typical
problems with PSInSAR processing. This includes for example the robustness of the
coregistration algorithm, the way platform position error are dealt with, the algorithm to
estimate atmospheric signal, the way points are selected, the algorithm to estimate height
and displacement, the procedure to exclude certain images during the processing.
4. Cross-processing: The processing of reference test sites is used to compare the
processing results and delivered output. The OSPs will process previously agreed and
defined data stacks according to the defined validation procedures using their operational
processing system, and deliver a historic Level 1 product to the validation body, including a
Quality Control Protocol report. In first instance, the validation authority acts as the user
and provides the area of interest, available apriory information (e.g. the expected
displacement rates, patterns and location, ground control points and a stable reference
point, orthophotos, etc.). The OSPs provide intermediate processing data according to the
doucument
“Specification of Validation Approach – Part 1 – Process Validation” Adam N., Parizzi A,
Issue 1.8 April 2007.
The validation authority will check the conformity of the intermediate data and the final
product to the standards and compare the estimated displacement in slant range by means
of cross-processing using the reference PSInSAR system with its existing estimation
algorithms. In special cases, another area (not the reference test site area) can be
processed by the validation body and by the OSP, for example to confirm the presence or
absence of a (non-linear) deformation phenomenon, or to validate new algorithms that are
dedicated to new displacement patterns.
All four steps need to be validated positively. If a step is validated negatively, the remaining steps
need not to be validated. A diagram of the steps is provided in Table 2.
The process validation results are reported in two kinds of documents with different intended
audiences. In general the validation results should be publically available.
The “Process Analysis Report A” compiles the analysis of a particular OSP performed in the
Terrafirma Process Validation. It is intended as an internal technical note (TN) and provides a
useful feedback to each OSP directly on its processing result. The TN includes statements on the
• conformity of the PSI processing system to the Terrafirma validation standards,
• observations and

ESA GMES: Terrafirma C5: Service Validation Protocol August 2008: Version 3.4
Copyright NPA and Terrafirma collaborators 2004 8
• optionally recommendations.
It is expected, that the OSP gives a formal feedback on this TN directly to DLR. If relevant, the
OSP should explain the reason for anomalous results and the actions taken to correct for them.
The TN is made anonymous and is distributed to the respective OSP, the product validation
working group (PVW) and the ESA.
The “Process Analysis Report B” compiles the anonymous validation results of all OSPs. It is the
main validation document because it reports the precision and characteristic of the Terrafirma PSI
estimation and unexpected effects. Specific OSPs are not mentioned any more. Instead
anonymous names OSP-A/B/C/D with an arbitrary order are used. This is possible because each
participating OSP supplementary received a detailed technical note on their specific process
validation result. The anonymized “Process Analysis Report B” will be directly distributed to the
Terrafirma PVW, the Terrafirma Validation Project team and ESA.
3.2 Product Validation
► This step of the validation is carried out by the End User for the straight forward processing
concepts and by another independent validation authority for the PSI product which provide the
ground truth and the expertise on the deformation needed for validation. During stage 2 of
Terrafirma, TNO has performed this long term validation.
The availability of independent ground data is an important issue on most test sites. Therefore, the
validation procedure is not only based on geodetic data, but also on, e.g., cartographic material.
The provision of ground data should be conditioned by an agreement on the properties and rights
on the ancillary data used for processing and validation. Requirements on the validation reference
data are specified listed in section 6.
3.2.1 Conventional InSAR and Stacked InSAR Production
► This step of the validation is carried out by the OSP and can be confirmed by the end User.
► The Validation is for straightforwardness based on the Quality Control Protocol mainly.
3.2.1.1 Product Artefacts of Conventional InSAR and Stacked InSAR
In the cases of conventional InSAR or stacked InSAR, some common effects could be misidentified
as deformation signal. If the provided products contain effects that could affect the interpretation in
terms of deformation, these effects have to be mentioned in the OCP report when identified. This
relates in particular to:
• Uncompensated topography: Due to local inaccuracies of the Digital Elevation Model
used, uncompensated topography appears as a fringe pattern, the magnitude of which is
proportional to the perpendicular baseline. Such artefact may be identified by comparing
several interferograms.
• Atmospheric artefacts: In many cases, atmospheric effects can be misinterpreted as
deformation signatures. As they do not repeat identically from one date to another, the
comparison of several interferograms allows the identification of the phenomena.
• Platform position errors: If a phase trend is corrected using a baseline refinement or other
method not using ground control points, this implies that possible displacement signal
which has a trend is also removed. Usage of such a correction method and the
consequences for the reported deformation have to be mentioned in the Quality Control
Protocol report.
• Unwrapping errors: Should be masked out where detected if unwrapped measurements
are delivered.

ESA GMES: Terrafirma C5: Service Validation Protocol August 2008: Version 3.4
Copyright NPA and Terrafirma collaborators 2004 9
3.2.1.2 Product accuracy assessment for conventional InSAR and stacked InSAR
• Planimetric (horizontal) accuracy: External data, such as an ortho-rectified aerial photo or
cartographic data layers should be used to check the planimetric accuracy. A geo-
referenced amplitude image should globally fit with these external data.
• Topometric (height) accuracy: If the height of the product is estimated, a measure should
be provided how accurately this is done. This is important, because the accuracy of the
geo-referencing is likely related to the accuracy of the height estimation.
• Displacement accuracy: Assessments of the maxima of deformation from InSAR must be
compared with ground data assessments of the deformation for the period covered by the
interferogram. The RMSE of the difference between ground-truth data and the InSAR
measurements should be included in the QCP report directly or in the end-user feedback.
An example of an assessment of the accuracy of the estimated accuracy is given in Figure
4.
In many cases, quantitative, geodetic, information could be unavailable, but the user can generally
provide more qualitative information such as the spatial limits of subsidence bowls, approximate
assessment of the maximum of deformation, location of damage caused by the deformation, etc.
In those cases, the level of agreement between this a priori knowledge of the ground deformation
and its mechanism and the radar measurement is to be described in the QCP. Moreover,
comments on the expectations of the agreement should be provided (regarding occurrence of
vertical and horizontal motion, location and accuracy of the ground truth-data, etc.). As this kind of
validation needs expertise both in radar interferometry and on the deformation mechanism, it has to
be carried out by the End-User in collaboration with the OSP. Such information is also used to
complement the point validation when geodetic data are available.
► The Quality Control Protocol report can be updated by the End-User. This feedback can e.g.
include a description of the known deformation phenomena (or reference to it) and a conclusion
about the agreement with the measurements. A discussion can also be included if the difference
between measurements and ground-truth exceeds the expectations. Such a discussion could
include statements on the difference in observation period by the radar measurements and the
ground-truth data, the difference in observed parameters (e.g., radial vs. horizontal or vertical;
compaction of the ground vs. stable buildings).
► In case ground-truth data have been available by the End-User and have been used to correct
the planimetry, the topometry or the estimated displacement, the correction needs to be reported
back to the OSP by an updated Quality Control Protocol.
Figure 4 : Example of product validation of a classical InSAR stacked interferogram product by
comparison with levelling data.
ESA GMES: Terrafirma C5: Service Validation Protocol August 2008: Version 3.4
Copyright NPA and Terrafirma collaborators 2004 10
3.2.2 PSInSAR Product Validation
The displacement information provided by PSI is the core of Terrafirma. Therefore, optimal product
validation is a direct comparison with independent ground based methods such as levelling or GPS
when available, which are the most widely used methods nowadays. Moreover, levelling and GPS
have an official recognition in private companies and national, or legal, authorities that InSAR does
not have, yet. The quantitative agreement between InSAR derived measurements and levelling or
GPS measurements, at least on a part of a studied area, reinforces the reliability of the conclusions
drawn for the whole area.
However, a direct comparison between ground-truth data and PsInSAR measurements is not
always possible, and often complicated by the following factors:
• Lack of ground-truth data: In many cases, quantitative, geodetic, information could be
unavailable, particularly in the area of interest. However, the user can generally provide
qualitative information such as the spatial limits of subsidence bowls, an approximate
assessment of the maximum of the deformation, the location of damage caused by the
deformation, etc. In such cases, the level of agreement between this a priori knowledge of
the ground deformation and its mechanism and the radar measurement is to be described
in the service validation report. Moreover, comments on the expectations of the agreement
should be provided (regarding occurrence of vertical and horizontal motion, location and
accuracy of the ground truth-data, etc.). As this kind of validation needs expertise both in
radar interferometry and on the deformation mechanism, it has to be carried out by the
End-User in collaboration with the OSP. Such information is also used to complement the
point validation when geodetic data are available.
• Spatial sampling of the ground-truth data: If ground data is available, the density is likely
much smaller than that of the PSInSAR product. The location of ground-truth data is often
along profiles (roads) or at easily accessible places. The PS points are likely also present
near such locations, but never at the exact same point. In many cases, the ground-truth
data may not be located in the areas of maximum displacement. The distance of the
ground-truth data to the PS point should be taken into account in the Validation Report.
• Temporal sampling of the ground-truth data: Ground-truth data is often acquired campaign-
style (particularly levelling). Comparison with PSInSAR results is hampered by lower
temporal sampling and non-overlap of the time intervals. A comparison of the
displacement rate should take into account the difference in time intervals, and the
precision of the rate computed using the ground-truth data.
• Precision of the ground-truth data: In many case the PSInSAR measurements may be
more precise than available ground-truth data. The relevance of the ground-truth data is to
be assessed by the End-User.
• Observed variates: PSInSAR measurements are sensitive to line-of-sight displacements of
the radar target, possibly via multi-path reflections. The ground-truth data may be related
to a different displacement. This relates to the influence of horizontal and vertical
movement on the observables, the difference in compaction and subsidence (e.g., bore
holes), the difference between displacement of a building and the surface, etc.
These factors complicate the validation of the PSInSAR results. The following sections propose a
validation plan to reduce the impact of these factors.
3.2.2.1 PSInSAR product artefacts and common problems
PSInSAR products may suffer from errors due to the complex processing algorithms. The following
list identifies the main errors and error sources for PSInSAR products.
ESA GMES: Terrafirma C5: Service Validation Protocol August 2008: Version 3.4
Copyright NPA and Terrafirma collaborators 2004 11
• Bias in the displacement rates: This relates to a single offset of all estimated displacement
rates. Such an offset can be caused by instability of the reference point, to which all other
points are measured.
• Bias in the estimated heights: This relates to a single offset in all estimated heights at all
points. Such an offset can be caused by the assumption that the reference point is located
on the reference body (DEM or ellipsoid), while it actually is not.
• Bias in the georeferenced positions: This bias relates to a single offset in azimuth and a
single offset in range direction, which are mapped to offsets in Northing (mainly azimuth)
and Easting (mainly range). The offset in range direction can be caused by an error in the
estimated height, and by a timing error in range direction. The offset in azimuth can be
caused by an error in azimuth timing of the master acquisition.
• Undetected non-linear displacements: This is the most critical problem of PSInSAR
products. It is possible that displacement signal leaks to other terms, in particular to
estimated atmospheric signal. This may occur in particular when there is no a priori
knowledge on the expected displacement. Validation by the end-user can identify areas
where this happens, and the OSP can then analyse the estimated atmospheric signal in
more detail for such an area.
• Temporal "unwrapping errors": If the unwrapping is mainly based on a temporal
displacement model, then it can happen that the measurements are unwrapped incorrectly
due to this model assumption. For example, if a PS point is stable during the first two
years, and then subsides with a linear rate for eight years, it is likely that the data acquired
during the first two years are "lifted" to best fit the linear model. This is particularly
important when there are temporal gaps in the data. Validation by the end-user can
identify areas where this happens, and the OSP can then fine-tune the processing.
• Mis-detection of PS: The delivered results may contain estimates at points that are not PS
points. For example, such points could be side lobes of strong scatterers, or points that by
random chance have a phase that well fits the displacement model. During a comparison
with ground-truth data it must be made sure such points are not included.
• Outliers: The delivered product can contain outliers. Such estimated points can be filtered
out partly using, e.g., a spatial smoothness criterion, but some may still be present. During
a comparison with ground-truth data it must be made sure such points are not included.
The overall density in general is affected by setting a threshold parameter. A more
restrictive setting will eliminate some outliers, but will also reduce the density of the
product.
• Platform position errors: As for the conventional InSAR products, individual interferograms
may be contained with a regular phase pattern due to orbit errors. Such errors can be
generally identified by analysis of the residual phase after correction of the estimated
parameters for topography and displacement. Such errors can be corrected, which implies
that the estimated displacement field is detrended, or can be left uncorrected, assuming
there are no interferograms with large errors due to this source.
3.2.2.2 PSInSAR product accuracy assessment
► The general Terrafirma product validation, its documentation and reporting is carried out by an
independent validation authority.
► Additionally, it is expected that the OSPs have performed their own validation experiments
during or after the processor development also. Publication of the independent validation work is
not a requirement. However, it indirectly supports the Terrafirma validation due to the availability of
the used approach and the results in public and the eventually applied review process is a very

ESA GMES: Terrafirma C5: Service Validation Protocol August 2008: Version 3.4
Copyright NPA and Terrafirma collaborators 2004 12
good basis for end-user confidence. An ideal example for such Terrafirma independent validation
is:
Ferretti A., G. Savio, R. Barzaghi, A. Borghi, S. Musazzi, F. Novali, C. Prati, F. Rocca
(2007). Submillimeter Accuracy of InSAR Time Series: Experimental Validation. IEEE
TGaRS, Vol. 45, N. 5; 1142-1153.
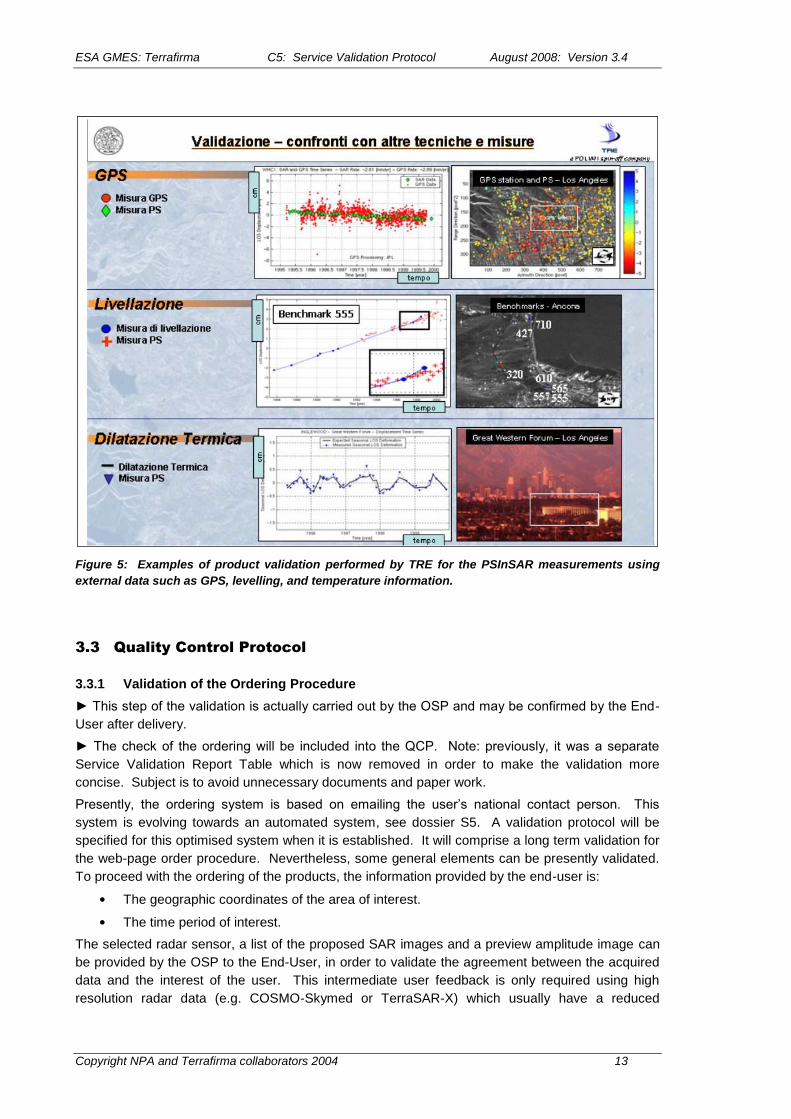
Another valuable example for Terrafirma independent validation provides Figure 5. It is ideal due
to the comprehensibility, the powerful visualisation and the concreteness of the physical
parameters.
► The product validation report should include a realistic expectation for the difference between
the PSInSAR measurement with the ground-truth data, and a clear assessment of the discrepancy
between the geodetic ground data (provided by the end user or any other source) and the radar
measurement. A discussion must be provided if this comparison exceeds the expectations.
Related to the problems identified in the previous section, here a validation protocol for the
accuracy of the PSInSAR product is given which is aimed at overcoming the common problems
with the comparison using ground-truth data, see also Table 3.
• Planimetric (horizontal) accuracy: External data, such as an ortho-rectified aerial photo or
cartographic data layers, or material available via the internet should be used to check the
planimetric accuracy. The consistency between the location and/or absence of the PS and
the presence of expectedly temporally coherent targets such as buildings or bare soils.
For PSInSAR products processed without using ground data, a constant offset of up to a
couple of hundreds of meters in the PS positions is possible. This is mainly due to the
unknown absolute height of a reference point. To a lesser extent, timing errors in range
and azimuth direction can cause errors in the geo-localization of the PS points. In such
cases an a posteriori correction must be carried out for the estimated heights and
georeferenced positions.
• Planimetric (horizontal) precision: An assessment of the planimetric precision of the geo-
referenced PS positions can be performed using cartographic material and ortho-photos.
Such assessments are limited by the different nature of both sources of information.
• Topometric (height) accuracy: If the height of the product is estimated, a measure should
be provided how accurately this is done. This is important, because the accuracy of the
geo-referencing is related to the accuracy of the estimated height of the PS points.
• Displacement rate accuracy: Assuming a linear displacement rate is estimated, a bias of
the displacement field can be estimated by comparison to ground-truth data. The
estimated rates should be corrected for this bias to account for instability of the reference
point. The estimated displacement rates can be compared regarding shape and maximum
of deformation with ground-truth data. The choice for the location of the reference point
should be checked.
• Displacement rate precision: The precision of the estimated rates can be assessed by
comparison of the estimated rates with the displacement rates of the closest by ground-
truth points, taking into account the known error sources described above.points,
• Displacement precision: The data corrected for all biases can be validated using a
comparison of the estimates with available time series of ground-truth data at nearby
locations, taking into account the problems noted above. The RMSE of the difference
should be included in the validation report. In case of non-linear deformation, the time
series from the two techniques should be compared visually to validate the result, in
particular the dates and amplitude of specific events in the series. Qualitative difference
must be mentioned in the validation report. Such comparison is however limited by the
reduced number of time series provided (respectively to the number of point provided with
deformations rates). Figure 5 shows an example of such a validation.
ESA GMES: Terrafirma C5: Service Validation Protocol August 2008: Version 3.4
Copyright NPA and Terrafirma collaborators 2004 13
Figure 5: Examples of product validation performed by TRE for the PSInSAR measurements using
external data such as GPS, levelling, and temperature information.
3.3 Quality Control Protocol
3.3.1 Validation of the Ordering Procedure
► This step of the validation is actually carried out by the OSP and may be confirmed by the End-
User after delivery.
► The check of the ordering will be included into the QCP. Note: previously, it was a separate
Service Validation Report Table which is now removed in order to make the validation more
concise. Subject is to avoid unnecessary documents and paper work.
Presently, the ordering system is based on emailing the user‟s national contact person. This
system is evolving towards an automated system, see dossier S5. A validation protocol will be
specified for this optimised system when it is established. It will comprise a long term validation for
the web-page order procedure. Nevertheless, some general elements can be presently validated.
To proceed with the ordering of the products, the information provided by the end-user is:
• The geographic coordinates of the area of interest.
• The time period of interest.
The selected radar sensor, a list of the proposed SAR images and a preview amplitude image can
be provided by the OSP to the End-User, in order to validate the agreement between the acquired
data and the interest of the user. This intermediate user feedback is only required using high
resolution radar data (e.g. COSMO-Skymed or TerraSAR-X) which usually have a reduced

ESA GMES: Terrafirma C5: Service Validation Protocol August 2008: Version 3.4
Copyright NPA and Terrafirma collaborators 2004 14
coverage making the acquisition of the area of interest more difficult. The check of the requested
time range of interest seems to be too trivial to be included into the validation.
3.3.2 Validation of the Delivery
► This step of the validation is carried out by the OSP and may be confirmed by the End-User
after delivery.
► The actual delivery validation is based on the Quality Control Protocol. The delivery by e-mail or
ftp is included into the Quality Control Protocol. There is no separate Service Validation Report
necessary. The previous extra validation tables are removed now.
The Level 1 products are delivered by mailed CD-ROM or by FTP (see dossier S3 service
prospectus). The following elements should be confirmed by the end-user when receiving the
product:
• agreement between the ordered geographic limits and covered time period and the
delivered product.
• agreement between the ordered and the delivered product type and completeness of the
delivered product (e.g., whether the processing report contains the minimum
specifications).
• the delivery of the motion product within the expected time range. The ordering,
production, and delivery process is expected to be done in less than (see Terrafirma
Service Level Agreement):
o 6 weeks for Image InSAR,
o 6 weeks for PSInSAR (the data ordering can take 4 days, the production after
receipt of data 6 weeks, the delivery 1 day via the internet or 1 week via mailed
CD-ROM)
3.3.3 Conformity with the Product Standards
► This step of the validation is mainly carried out by independent authorities (e.g. DLR, IG and
TNO). It is now a long time validation by concept and is complemented for the actual processing
and product by the Quality Control Protocol which is produced by the OSP and may be confirmed
by the End-User after delivery.
► The previous extra Service Validation Report Tables are removed now. These validation tables
are replaced by better structured and more elaborate validation documents. The documents report
on the process analysis, the product validation, precision and production quality separatly.
3.4 Summary of the Level 1 Validation and Relevant Documents
The overall validation of the Terrafirma services and Level 1 products results from the combination
of different reports. Each document validates and reports on special aspects of the production
process. This section lists the relavant documents the purpose, the author and the current version.
The final validation outcome of the long term validations and the demonstrated ability to correctly
perform the short term quality control is the qualification certificate for each OSP.
3.4.1 Preparational Documents for the Long Term Validation
► “Ground Truth Dossier: Alkmaar-Amsterdam”: C. Bremmer (TNO), S. Dortland (TNO), R.
Hanssen, F. van Leijen (TUDelft); 3 July 2007, Draft version V 2
This report discusses the available ground truth data of the Alkmaar and the Amsterdam test sites.
► “Technical note on the test site selection: Alkmaar-Amsterdam”: M. Crosetto, M. Agudo (IG), C.
Bremmer (TNO), R. Hanssen (TU Delft) April, 2007
ESA GMES: Terrafirma C5: Service Validation Protocol August 2008: Version 3.4
Copyright NPA and Terrafirma collaborators 2004 15
This technical note provides the key information needed to perform the site selection for the
Validation Project of Terrafirma.
► “Specification of Validation Approach – Part 1 – Process Validation”: Adam N., Parizzi A, Issue
1.8 April 2007
This document describes the scope of the process validation work i.e. the planned process
analysis of the actually existing Terrafirma OSPs processing chains. It is intended as a basis for
brief technical discussions between the Terrafirma partners because cooperation and agreement
between the OSPs and DLR is required. Operational Service Providers (OSPs) are mainly the
intended readership. Both, their software developers of the interferometric systems and their
operators are addressed. This document provides the detailed information on
• the definition of the deliverables, i.e. the intermediate products which are assessed,
• the file format of the deliverables,
• the definition of the units of the data values and
• the definition of the coordinate systems,
• the data layout and on
• the planned process analysis using the delivered data.
► “Specification of validation approach – Part 2: Product Analysis Tasks”: M. Crosetto, M. Agudo
(IG), C. Bremmer, S. Dortland (TNO), R.F. Hanssen, F. van Leijen (TU Delft), 15th October 2007
This dossier defines the product analysis tasks and forms the basis to formulate all the key
questions that should drive the validation analysis.
► “Specification of validation approach – Part 3: General Rules to run the Validation Project”: M.
Crosetto, M. Agudo, N. Adam, Issue 5 April, 2007
The objective of this document is to define the key rules to run the Terrafirma Validation Project. It
describes the input data provided to the OSPs e.g. information on the ground motion and goals of
PSI analysis, the SAR images and auxiliary data and all other inputs for the PSI processing.
► “Validation of existing processing chains in Terrafirma stage 2: List of OSP Deliverables
Extended”: M. Crosetto, M. Agudo (IG), R. Burren, A. Tomas (NPA), N. Adam, A. Parizzi (DLR), C.
Bremmer, S. Dortland (TNO), R. Hanssen, F. Van Leijen TUD
This document collects the main inputs to be provided to the OSPs for the PSI processing and lists
the data which need to be delivered by the OSPs to the validation teams.
3.4.2 Process Validation
The documents on the process analysis support the long term validation of the Terrafirma PSI
algorithms and the production process.
► “Process Analysis Report A – Part 1”: N. Adam, A. Parizzi (DLR), 15th January 2008
Each participating OSP supplementary received this detailed technical note on their specific
process validation result. The distribution of the technical note is restricted to the project
participants (OSPs, PVW) and ESA only. In this way the OSPs get a useful feedback on their
results and the validation teams are informed on key issues related to the data they are validating.
► “Process Analysis Report B – Part 1”: N. Adam, A. Parizzi (DLR), 7th April 2008

ESA GMES: Terrafirma C5: Service Validation Protocol August 2008: Version 3.4
Copyright NPA and Terrafirma collaborators 2004 16
This document provides the anonymous validation results. The four OSPs (Altamira Information,
Gamma RS, Fugro-NPA and Tele-Rilevamento Europa) are not mentioned any more. Instead
anonymous names OSP-A/B/C/D with a changed order are used. The document describes the
particular validation principle, detected atypical effects, the typical estimation precision and
compares it with the theory and includes the processing parameter matrices. This Process
Validation Report made anonymous is directly distributed to the Terrafirma PVW, the Terrafirma
Validation Project team and ESA.
► “Process analysis report – Part 2”: IG inter-comparison
This document provides an alternative process analysis report with a description of the inter-
comparison analysis of the deformation velocity, of the deformation time series and of the
topographic correction and of the detection capability of the teams.
► “Certificate Terrafirma Process Validation 2008”: Adam N. (DLR), 5th July 2007
This document certifies the degree of conformity of a particular OSP and that the algorithms and
intermediate data have been analyzed by the DLR process validation team.
3.4.3 Product Validation
The documents on the product validation support the long term validation of the Terrafirma PSI
products i.e. the geo-physical relevance, the product format and annotation.
► “Product validation: Validation in the Amsterdam and Alkmaar area”: R.F. Hanssen, F.J. van
Leijen, G.J. van Zwieten (TU Delft), C. Bremmer, S. Dortland, M. Kleuskens (TNO), 15th February
2008
This document describes the geo-validation. I.e. the PSI measusrements are compared with
independent ground truth data. The test sites and their characteristics are also presented.
3.4.4 Quality Control Protocol
► “Terrafirma Quality Control Protocol for Level 1 Products”: N. Adam (DLR), version 1.5, 16th
March 2008
This is the reference for the Quality Control Protocol (QCP) of the Terrafirma Level 1 product. It is
a customer-facing document, to satisfy customers of the quality of product they will receive, and to
detail procedures to be followed and deliverables to ensure this. The quality protocol has been
developed for the generation of different kinds of interferometric RAW products. Subject is to set
up a common basis for the reliability of the ground motion product mainly on a technical level.
Finally, the QCP provides an overarching and generic standard to track the quality of the
interferometric data processing and should be used in the regular working practice.
This QCP document is self-contained (describing a short term validation) but is complemented by
the other validation related project documents which cover the long term validation. End users of
the Terrafirma products (the OSP‟s customers) get an insight into the processing techniques, their
intermediate data and the quality related parameters. This document helps them to interpret the
Quality Control Protocol and its deliverables gaining understanding of the actual accuracy and
relability of the delivered final Level 1 product. Newly introduced is an End-User for QCP-feedback
based on the OSPs Quality Control Protocol delivery.
Operational service providers are mainly the intended readership. Both, their software developers
of the interferometric systems and their operators are addressed. Of course, the proposed quality

ESA GMES: Terrafirma C5: Service Validation Protocol August 2008: Version 3.4
Copyright NPA and Terrafirma collaborators 2004 17
test and validation routines need to be implemented and tested by the software developers.
Furthermore, they receive information on the error sources in the different interferometric
processing steps. This can be the basis for the improvement of the current algorithms and
implementations of single processing steps. The OSP‟s operators need to follow this quality
protocol and to report their checks.
3.4.5 General Validation Statements
► “Validation of existing processing chains in Terrafirma stage 2”: M. Crosetto, O. Monserrat (IG),
N. Adam, A. Parizzi (DLR), C. Bremmer, S. Dortland (TNO), R.F. Hanssen, F.J. van Leijen (TU
Delft), 30th June 2008
This document is the final report on the validation showing that Terrafirma is able to offer reliable
products and services. It provides the key results from the different validations, the overall
conclusions and recomondations.
► “Review of the Terrafirma Products”: M. Crosetto, B. Pucci (IG); 9th July 2008, Issue 2
The review addresses the practical usefulness of the Terrafirma PSI data, i.e. the following issues:
the main characteristics of the generated TF products, Section 1; the key characteristics of the
measured deformations, Section 2; the H product exploitation, Section 3; the available validation
results, Section 4; the strengths and weaknesses of the TF products are described in Section 5,
providing a critical analysis and recommendations.
3.5 Time Line and Workflow of the Level 1 Validation
The time diagrams given in Table 1, Table 2, and Table 3 provide a summary of the responsibilities
of each involved party of service, process, and product validation, respectively.
Table 1: Time diagram for Service Validation (who, what, when, etc.)
TIME OSP END-USER
↓ Express interest; provide OSP with type of measurement
(differential interferogram, PSInSAR, etc.), the geographic
coordinates of area of interest, and the time period of interest.
Send End-User the (signed by OSP) Service Level
Agreement and request it to be returned.
Return signed Service Level Agreement to OSP.
Send copy of the signed Service Level Agreement
to the Administrative Prime within seven days of
signing for compilation into the Terrafirma dossier
C7: Service Level Agreements.
Check data availability/ assess possibility of
requested type of measurement. Provide the user
with a list of proposed scenes, preview amplitude
image. Write relevant introductionary section of
service validation report and send this to the user.
Possibly confirm proposed area, time frame
(not required)
Order data; Notify the user in case of delays or

ESA GMES: Terrafirma C5: Service Validation Protocol August 2008: Version 3.4
Copyright NPA and Terrafirma collaborators 2004 18
unavailability of proposed data, and assess
possibility of success based on new constraints.
Write relevant section of service validation report.
If notified of data change, confirm/cancel processing
(not required)
Start processing. Ask user for relevant data if
appropriate (reference map, ground truth data,
ground control points, stable areas, expected
deformation, etc.) Include a non-disclosure
agreement if so desired by the user.
Provide requested data for calibration of geo-referencing/
displacement estimates. Inform OSP whether data can be
used for validation and externally published.
(not required)
Perfom the agreed type of processing and report on
the processing by the Quality Control Protocol
document. Create the agreed product.
Possibly update the Quality Control Protocol and indicate
problems with the delivered product, such as non-conformity
to the agreed standard and request an update.
(not required)
If the user indicated a non-conformity, update the
product and the processing chain. Deliver a new
product in acceptable time to the user.
Confirm correct delivery or re-iterate to improve the product.
(required in case of a re-processing request initiated by a
non-conformaty)
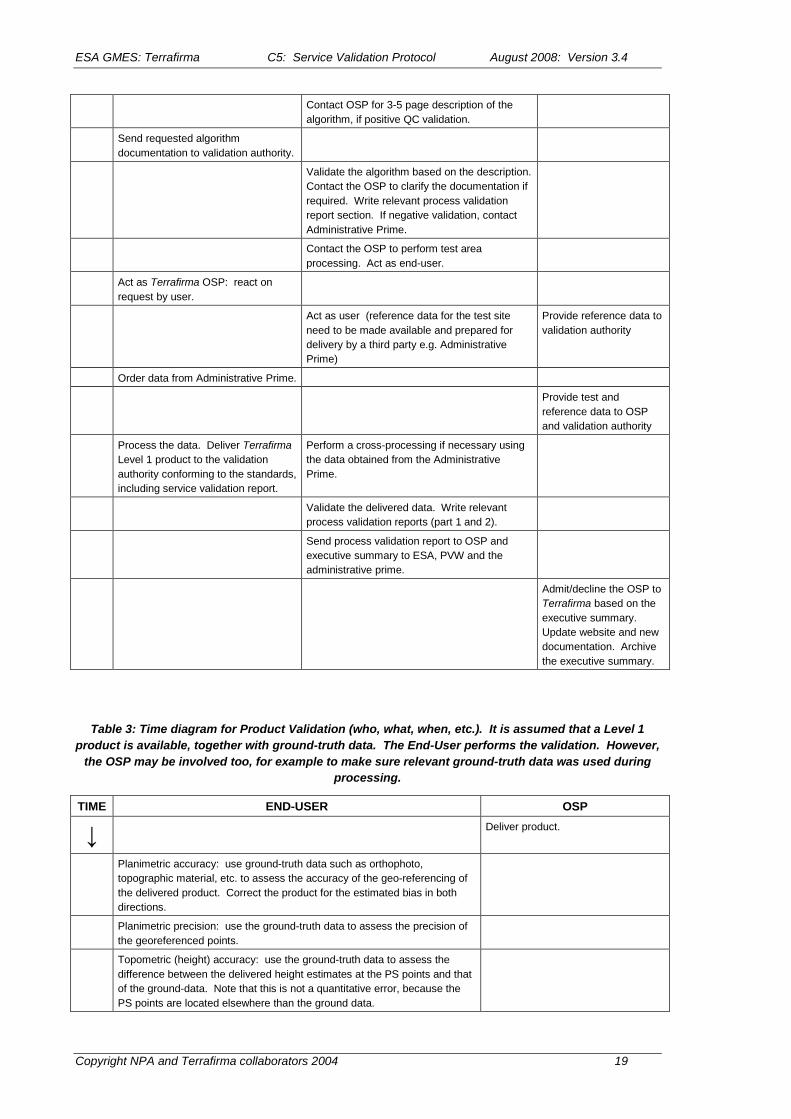
Table 2: Time diagram for Process Validation (who, what, when, etc.)
TIME OSP VALIDATION AUTHORITY ADMINISTRATIVE
PRIME
↓ Express interest to Administrative
Prime.
Contact validation
authority with details on
the process validation
request.
Confirm to OSP and Administrative Prime.
Request specific audit information from the
OSP.
Send requested audit information to
validation authority.
Perform the audit; Contact OSP for more
information if required. Write relevant process
validation report section. If negative validation,
contact Administrative Prime.
Contact OSP for QC document if positive audit
validation step.
Send requested QC documentation to
validation authority.
Perform validation; Contact OSP with
questions. Write relevant process validation
report section. If negative validation, contact
Administrative Prime.
ESA GMES: Terrafirma C5: Service Validation Protocol August 2008: Version 3.4
Copyright NPA and Terrafirma collaborators 2004 19
Contact OSP for 3-5 page description of the
algorithm, if positive QC validation.
Send requested algorithm
documentation to validation authority.
Validate the algorithm based on the description.
Contact the OSP to clarify the documentation if
required. Write relevant process validation
report section. If negative validation, contact
Administrative Prime.
Contact the OSP to perform test area
processing. Act as end-user.
Act as Terrafirma OSP: react on
request by user.
Act as user (reference data for the test site
need to be made available and prepared for
delivery by a third party e.g. Administrative
Prime)
Provide reference data to
validation authority
Order data from Administrative Prime.
Provide test and
reference data to OSP
and validation authority
Process the data. Deliver Terrafirma
Level 1 product to the validation
authority conforming to the standards,
including service validation report.
Perform a cross-processing if necessary using
the data obtained from the Administrative
Prime.
Validate the delivered data. Write relevant
process validation reports (part 1 and 2).
Send process validation report to OSP and
executive summary to ESA, PVW and the
administrative prime.
Admit/decline the OSP to
Terrafirma based on the
executive summary.
Update website and new
documentation. Archive
the executive summary.
Table 3: Time diagram for Product Validation (who, what, when, etc.). It is assumed that a Level 1
product is available, together with ground-truth data. The End-User performs the validation. However,
the OSP may be involved too, for example to make sure relevant ground-truth data was used during
processing.
TIME END-USER OSP
↓ Deliver product.
Planimetric accuracy: use ground-truth data such as orthophoto,
topographic material, etc. to assess the accuracy of the geo-referencing of
the delivered product. Correct the product for the estimated bias in both
directions.
Planimetric precision: use the ground-truth data to assess the precision of
the georeferenced points.
Topometric (height) accuracy: use the ground-truth data to assess the
difference between the delivered height estimates at the PS points and that
of the ground-data. Note that this is not a quantitative error, because the
PS points are located elsewhere than the ground data.

ESA GMES: Terrafirma C5: Service Validation Protocol August 2008: Version 3.4
Copyright NPA and Terrafirma collaborators 2004 20
Topometric (height) precision: not planned to be validated. For PSInSAR,
the height is that of the PS points, which location is difficult to compare with
ground-truth data because the origin of the radar reflection is unknown.
Possibly, a histogram of the estimated height, or DEM error if a good DEM
is available, could give insight in the precision of the estimated heights.
Note that the planimetric precision is related to the precision of the
estimated height.
Deformation shape: comparison with ancillary data map or point data
related to the motion mechanism or consequences (interpolated
deformations maps, damages inventories, hazard maps, mine maps,
piezometric data, …): is the geometric shape of the detected deformation
consistent with the a priori knowledge?
Deformation accuracy: estimate a bias of the delivered displacement
(rates) due to instability of the reference point used during processing.
Correct the estimated displacement (rates) for this bias.
Deformation precision: assess the difference between the Terrafirma
displacement measurements and the ground-truth data and contribute this
to errors in eith er one. Compare rates and PS time-series. In cooperation
with the OSP, contribute the errors in the product to, e.g., incorrectly
estimated atmospheric signal, uncompensated orbit errors. Allow for
improvement of the delivered product using this knowledge. Provide
qualitative examples and quantitative measures of the geological relevance
of the Level 1 product.
Include conclusions in a section of the Service Validation report. Make this
available to the OSP.
Contact Administrative Prime to
publish validation as show case on
website, if appropriate.
ESA GMES: Terrafirma C5: Service Validation Protocol August 2008: Version 3.4
Copyright NPA and Terrafirma collaborators 2004 21
3.6 Product Validation Manual for Level 1 Products
This section synthesises the validation exercise into a user-oriented text providing conclusive
information and data as to the reliability and performance of the products. E.g. this manual
provides an understandable interpretation of the estimation precision stated by the validation. At
the moment, this manual is based on the experiences of the process validation only and is
therefore focussed on the LOS displacement measurement and PS density. The process
validation has shown that each team can provide (at least in one test site) a correct deformation
measurement. Outliers can result from unfortunate setup or operating of the processing chain and
could be excluded from the validation. Only the best deformation processing (regardless of the test
site) should be chosen for the qualification. This approach assesses the potential of a PSI system
and its algorithms but not its operational robustness and quality check. The DEM update
introduces errors in the geocoding of the final product. This is the reason the qualification
threshold needs to be choosen and confirmed by both (the process and the product) validation
teams. DLR suggests that all current OSPs and validation teams negotiate final qualification
thresholds.
A typical user expects two different types of information from the final Level 1 product:
1) a detection of risk (i.e. deformation) areas and
2) a measurement of the deformation rate (e.g. a mean velocity or a time series plot)
Both correspond in principle to two different processing tasks. And accordingly, the requirements
on the Level 1 product are unfortunately complementary for both applications.
The deformation measurement points (i.e. the PSs) are given by chance – but most importantly
their quality (i.e. phase stability) varies on a given test site. Nearly ideal scatterers (e.g. metal
structures like trihedral or dihedral corner reflectors) are rarely given. However the availability of
usable scatterers improves tolerating more deterioration in their quality describing the phase
stability. The detection (task 1) requires a high PS density allowing a high spatial resolution of
measurements and consequently the identification of displacement effect patterns. This can be
achieved by relaxing the PS selection threshold on the cost of precision and can be accepted until
noisy measurements start to hide the displacement effects. However, the number of high precision
displacement measurements can not be tuned. This number is a characteristic of the actual test
site and radar sensor (mainly the resolution and polarisation). The deformation measurement (task
2) should only be based on these high quality scatterers. Including low quality scatterers can
mislead the end user of the Level 1 product. Especially time series of data should only be
generated from the best PSs. This situation has consequences on the assessment and the
validation of a Level 1 product needs to consider both concepts. In the following, the two concepts
and their separate validation are described.
3.6.1 Detection of Risk Areas (Task 1)
The detection of risk areas is based on a displacement map. An example is shown in Figure 4
using DLR‟s estimation of the city of Amsterdam.

ESA GMES: Terrafirma C5: Service Validation Protocol August 2008: Version 3.4
Copyright NPA and Terrafirma collaborators 2004 22
-4 mm/y 0 +4mm/y
Figure 6: Example for a displacement map which can be used for the detection of risk areas (red:
subsidence; blue: uplift); the blue rectangle describes the zoomed area of figure 5
Looking at this displacement map, a detection of risk areas is performed automatically by eye.
Risk areas are identified by
- an accumulation of red or blue dots (e.g. forming clusters) and (or) by
- characteristic patterns of the PS arrangement (e.g. following streets, forming lines).
Unfortunately, the performance of the detection depends on many factors e.g. the PS density, the
scale of the displacement map, the colour table and the size of the plotted points. Figure 5
presents a zoom into the displacement map of figure 4. The change of information with a different
scale becomes visible. On the one hand more details and structures can be identified but on the
other displacement areas can be more hidden due to the noisy measurements. Figure 6 presents
manually detected risk areas. The areas 1 and 4 can be identified due to the accumulation of red
coloured subsidence scatterers. The areas 2 and 3 can be identified because the subsidence
scatterers follow men made structures. The areas 5 and 6 could be identified because of the
strong (unlikely) linear configuration of the scatterers. Obviously, the selection of other risk areas
depends finally extremely on the operator. This introduces a real difficulty into the assessment and
validation of the detection because of the requirement to be objective and comprehensible.

ESA GMES: Terrafirma C5: Service Validation Protocol August 2008: Version 3.4
Copyright NPA and Terrafirma collaborators 2004 23
Figure 7: Zoom into the displacement map which can be used for the detection of risk areas (red:
subsidence; blue: uplift)
Figure 8: Example for the detection of risk areas (red: subsidence; blue: uplift). The areas 1 and 4
can be identified due to the accumulation of subsidence scatterers. The areas 2 and 3 can be
identified because the subsidence scatterers follow men made structures. The areas 5 and 6 can be
identified because of the strong linear configuration of the scatterers.
ESA GMES: Terrafirma C5: Service Validation Protocol August 2008: Version 3.4
Copyright NPA and Terrafirma collaborators 2004 24
The detection provides two information aspects and both indicate the performance of a PSI
processing. Of course, both need to be validated:
1) the detection of the risk areas itself and
2) the identification of heir spatial extension or relation to men made features (e.g. bridges,
streets and railway tracks).
At the moment the H1 product is more focussed on a displacement measurement. Therefore the
detection validation can be simplified. However a traffic light Level 1 product should be designed.
This will be a suitable basis for a more clear detection validation.
The following paragraph describes the actual detection validation. A small set (two or three) of
significant displacement areas are selected in each test site. This selection will be performed by
visual inspection of the validation team in order to justify the validation‟s detection criterias (stated
below). A risk area is considered significant und therefore usable for the validation if it is
- covered by a typical number of PS,
- a linear deformation rate can be estimated,
- the estimated deformation is more than 2 mm/year,
- a clear shape of the deformation area can be described and
- the detection is confirmed by another independent estimation.
The last point is implemtented in the validation by the approach that at least three of the current
processing results are required to have detected the test areas. I.e. the current OSPs and the DLR
processing provide the benchmark for the detection validation. A displacement map similar to
Figure 4 in scale and colour table is the basis for the selection of the detection test areas and the
detection validation of the OSPs. For this reason, DLR visualizes the processing results of the
OSPs using one and the same visualisation routine developed by DLR. All delivered PSs are used
in this visualisation in order to really show the best persistent scatterer density. It is the
responsibility of the OSP to avoid hiding the displacement signal in noise caused by low quality
scatterers. Consequently, the OSPs have to select a suitable threshold for the quality to allow the
detection of risk areas. The order of the plotting of the PSs is not fixed. I.e. there is no possibility
to over-plot low quality estimates by better estimates. Furthermore, DLR‟s visualisation routine will
not be modified for future validations. Specifically, the visualisation will not be changed even in
case better visualisation can be created. The following test areas are proposed for the detection
validation:
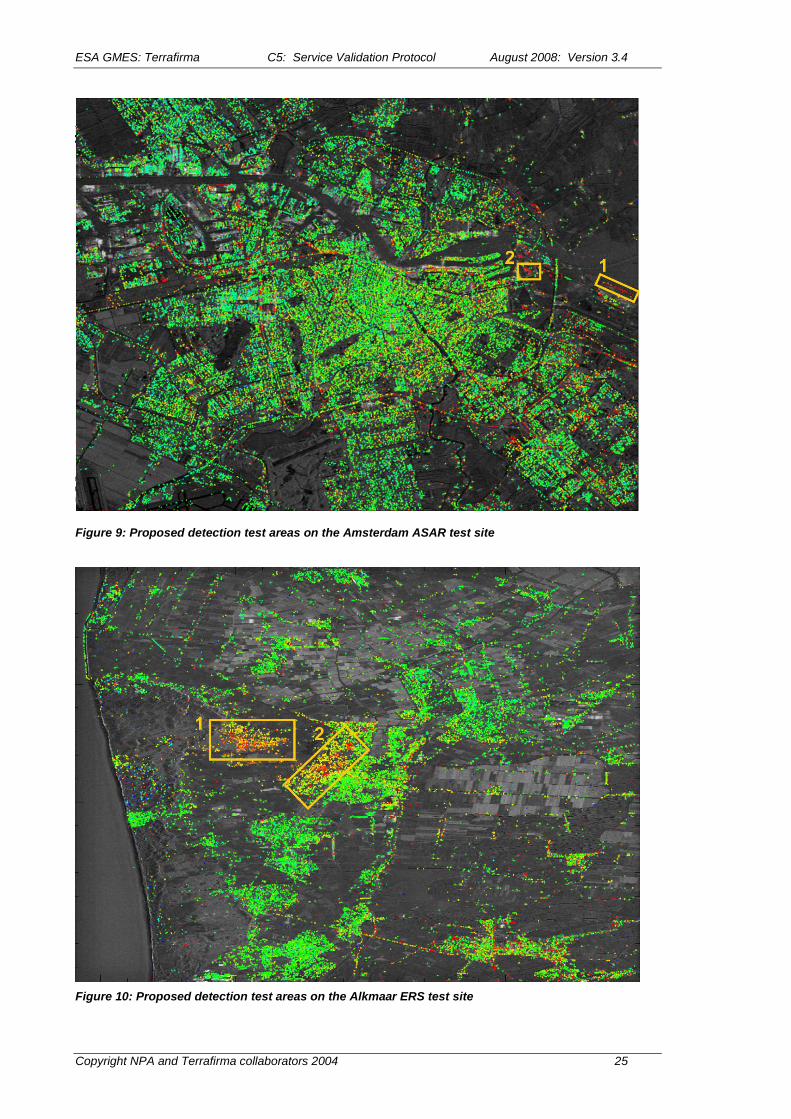
ESA GMES: Terrafirma C5: Service Validation Protocol August 2008: Version 3.4
Copyright NPA and Terrafirma collaborators 2004 25
Figure 9: Proposed detection test areas on the Amsterdam ASAR test site
Figure 10: Proposed detection test areas on the Alkmaar ERS test site

ESA GMES: Terrafirma C5: Service Validation Protocol August 2008: Version 3.4
Copyright NPA and Terrafirma collaborators 2004 26
Figure 11: Proposed detection test areas on the Alkmaar ASAR test site
Some simplifications are introduced into the detection assessment at the moment:
No additional check of the PS density is performed. The described detection validation includes automatically a practical check for a sufficient PS density.
Figure 12 provides an example for the delivered various PS densities from the actual validation.
The contour of the deformation area is not checked in detail. Only the spatial extension and orientation (if any) is considered by the validation team.
Figure 13 visualizes the sequence of actions and checks for the deformation measurement.

ESA GMES: Terrafirma C5: Service Validation Protocol August 2008: Version 3.4
Copyright NPA and Terrafirma collaborators 2004 27
Figure 12: Comparison of the different PS densities delivered by the OSPs. Unfortunately, the low PS
density of OSP C and D does not correspond to a high estimation precision which would be
expected. The PS density is not directly a test parameter for this process validation. Instead, the risk
area detection solves this problem from a more practical (i.e. user) side.
Figure 13: Flow of actions and checks to validate the deformation detection
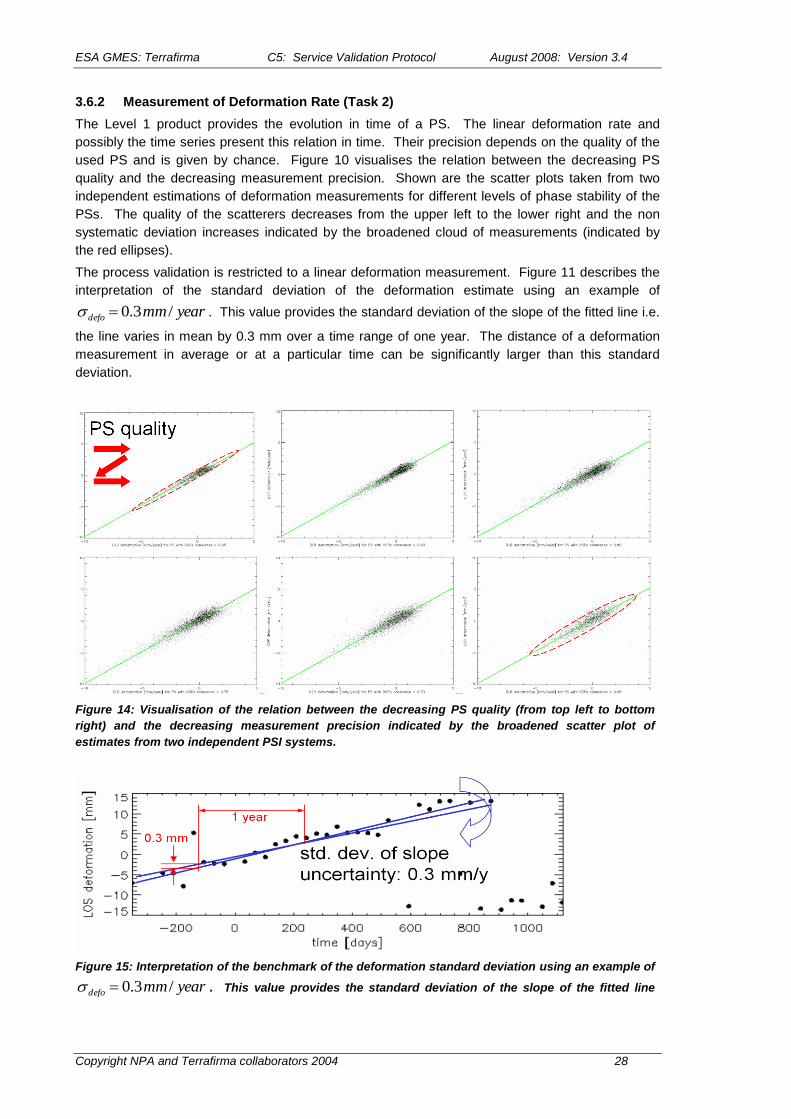
ESA GMES: Terrafirma C5: Service Validation Protocol August 2008: Version 3.4
Copyright NPA and Terrafirma collaborators 2004 28
3.6.2 Measurement of Deformation Rate (Task 2)
The Level 1 product provides the evolution in time of a PS. The linear deformation rate and
possibly the time series present this relation in time. Their precision depends on the quality of the
used PS and is given by chance. Figure 10 visualises the relation between the decreasing PS
quality and the decreasing measurement precision. Shown are the scatter plots taken from two
independent estimations of deformation measurements for different levels of phase stability of the
PSs. The quality of the scatterers decreases from the upper left to the lower right and the non
systematic deviation increases indicated by the broadened cloud of measurements (indicated by
the red ellipses).
The process validation is restricted to a linear deformation measurement. Figure 11 describes the
interpretation of the standard deviation of the deformation estimate using an example of
yearmmdefo /3.0 . This value provides the standard deviation of the slope of the fitted line i.e.
the line varies in mean by 0.3 mm over a time range of one year. The distance of a deformation
measurement in average or at a particular time can be significantly larger than this standard
deviation.
Figure 14: Visualisation of the relation between the decreasing PS quality (from top left to bottom
right) and the decreasing measurement precision indicated by the broadened scatter plot of
estimates from two independent PSI systems.
Figure 15: Interpretation of the benchmark of the deformation standard deviation using an example of
yearmmdefo /3.0 . This value provides the standard deviation of the slope of the fitted line

ESA GMES: Terrafirma C5: Service Validation Protocol August 2008: Version 3.4
Copyright NPA and Terrafirma collaborators 2004 29
(blue) i.e. the line varies in mean by 0.3 mm over a time range of one year.
The following paragraph describes the actual deformation measurement validation. Only the best
quality PSs should be used for time series plots and the validation of the deformation
measurement. Each OSP provides the coherence estimate per PS allowing this approach. I.e. the
OSP‟s values are used as a quality ranking of the PSs. In the course of the Terrafirma project, the
coherence is defined as a relative quality index and consequently the coherence can not be
compared between the OSPs directly. The actual validation approach avoids the overhead of an
absolute coherence calibration. A similar effect can be achieved by decreasingly sorting the
deformation measurements of each OSP according to their estimated coherence. The best 10000
scatterers which are in common with a reference processing are selected to estimate the standard
deviation of the deformation. The fix and the high number of PSs avoid effects in the estimation of
the deformation standard deviation caused by the varying effectiveness regarding the number of
samples. The OSP can be qualified in case the standard deviaton related to the reference
processing is better or in the order of 1 mm/year. In case this benchmark is not meet the OSP‟s
processing is tested against all other OSPs applying the same procedure. I.e. the reference
system is changed and excluded to be the reason for the deviation.
3.6.3 Systematic Effects
DLR's independent processing system PSI GENESIS is used as the reference system to isolate
systematic effects in the deformation estimation. By comparison with all OSPs results DLR's
system is continuously being hardened and insofar also implicitly qualified - at least up to the slant
range estimates of velocity and height. DLR creates scatter plots between the DLR reference
processing and the OSP‟s estimates.
Figure 16 provides an example for the expected (i.e. without systematic effects) scatterer plot.
Examples for not tolerable systematic effects are provided in Figure 17 and Figure 18.
All detected effects are reported to the OSP. In the future, both the OSP processing and the
validation will be repeated up to three times until reliable and comparable results of all OSPs have
been achieved. During the actual validation project it is guaranteed that the required corrections
will be applied by the affected OSPs and no further iteration needs to be made. Instead, a written
confirmation to DLR by the relevant OSPs that they have made the required corrections on their
software package is requested to qualify these OSPs.
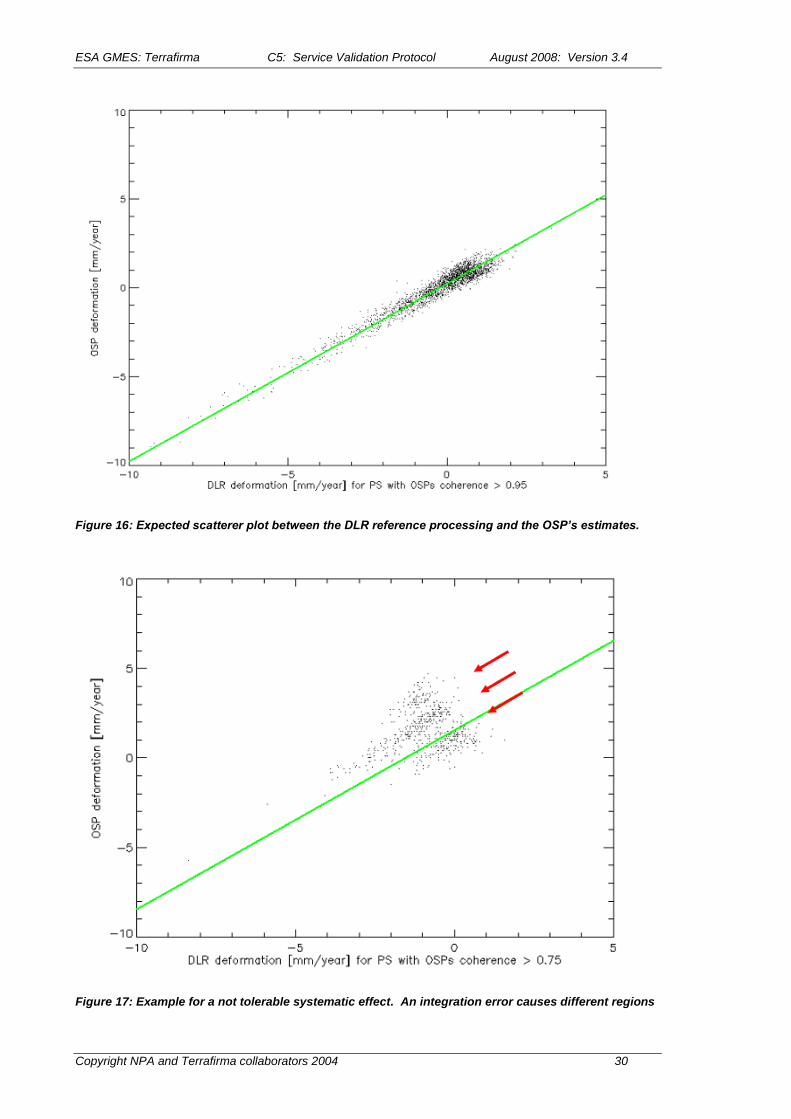
ESA GMES: Terrafirma C5: Service Validation Protocol August 2008: Version 3.4
Copyright NPA and Terrafirma collaborators 2004 30
Figure 16: Expected scatterer plot between the DLR reference processing and the OSP’s estimates.
Figure 17: Example for a not tolerable systematic effect. An integration error causes different regions
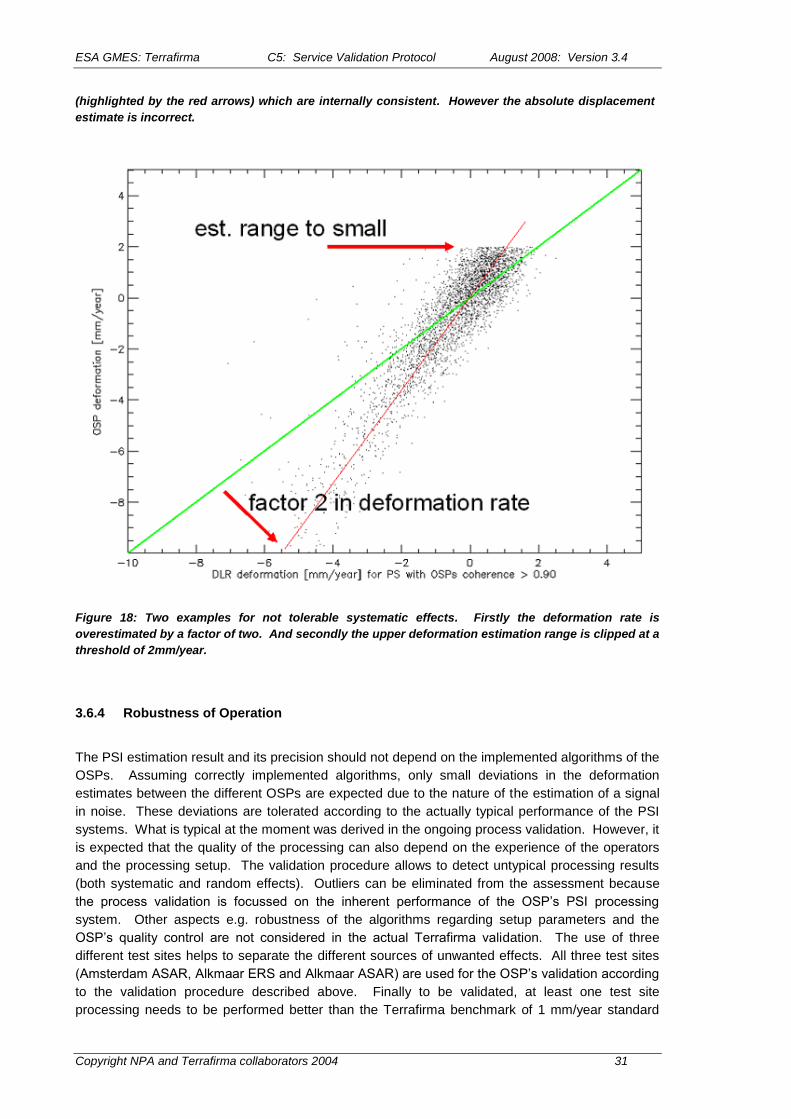
ESA GMES: Terrafirma C5: Service Validation Protocol August 2008: Version 3.4
Copyright NPA and Terrafirma collaborators 2004 31
(highlighted by the red arrows) which are internally consistent. However the absolute displacement
estimate is incorrect.
Figure 18: Two examples for not tolerable systematic effects. Firstly the deformation rate is
overestimated by a factor of two. And secondly the upper deformation estimation range is clipped at a
threshold of 2mm/year.
3.6.4 Robustness of Operation
The PSI estimation result and its precision should not depend on the implemented algorithms of the
OSPs. Assuming correctly implemented algorithms, only small deviations in the deformation
estimates between the different OSPs are expected due to the nature of the estimation of a signal
in noise. These deviations are tolerated according to the actually typical performance of the PSI
systems. What is typical at the moment was derived in the ongoing process validation. However, it
is expected that the quality of the processing can also depend on the experience of the operators
and the processing setup. The validation procedure allows to detect untypical processing results
(both systematic and random effects). Outliers can be eliminated from the assessment because
the process validation is focussed on the inherent performance of the OSP‟s PSI processing
system. Other aspects e.g. robustness of the algorithms regarding setup parameters and the
OSP‟s quality control are not considered in the actual Terrafirma validation. The use of three
different test sites helps to separate the different sources of unwanted effects. All three test sites
(Amsterdam ASAR, Alkmaar ERS and Alkmaar ASAR) are used for the OSP‟s validation according
to the validation procedure described above. Finally to be validated, at least one test site
processing needs to be performed better than the Terrafirma benchmark of 1 mm/year standard

ESA GMES: Terrafirma C5: Service Validation Protocol August 2008: Version 3.4
Copyright NPA and Terrafirma collaborators 2004 32
deviation. The found good test sites can also be used to check the detection. Figure 19 visualizes
the sequence of actions and checks for the deformation measurement.
Figure 19: Flow of actions and checks to validate the measurement of the deformation rate
3.6.5 Long Term Validation Result Reporting
DLR reports the process validation results (detection and deformation rate measurement) to each
OSP directly by a technical note and to the PVW and ESA. The reports include statements on the
conformity of the PSI processing system to the Terrafirma validation standards,
observations and
optionally recommendations.
It is expected that each OSP reports back directly to DLR on its corrective actions. These are not
checked and the Terrafirma qualification is related to the updated processing system only. The
qualification of an OSP can be given in three levels:
fully conform,
minor non conformity
significant non conformity

ESA GMES: Terrafirma C5: Service Validation Protocol August 2008: Version 3.4
Copyright NPA and Terrafirma collaborators 2004 33
The Terrafirma OSPs are qualified by being fully conform or only having a minor non conformity.
This final validation output is the result of firstly the check for the deformation measurement (task 2)
and secondly for the detection of risk areas (task1). Figure 20 visualizes this sequence of checks
and shows that both the detection and the measurement need to be Terrafirma standard conform
in at least one test site. Finally, the result of all validations is the certificate for each successful
OSP. An example is shown in Figure 21.
The level of conformance is finally negotiated by all process validation teams. Consequently it
includes the results from the product validation. The contribution of the process validation is that
the qualified processing systems are established to be free of systematic errors.
Figure 20: Both, detection and measurement need to be conform according to the thresholds. I.e. at
least on test site needs to pass the detection and the measurement check to result in a qualification as
a Terrafirma OSP.

ESA GMES: Terrafirma C5: Service Validation Protocol August 2008: Version 3.4
Copyright NPA and Terrafirma collaborators 2004 34
Figure 21: Example certificate which is the final validation confirmation
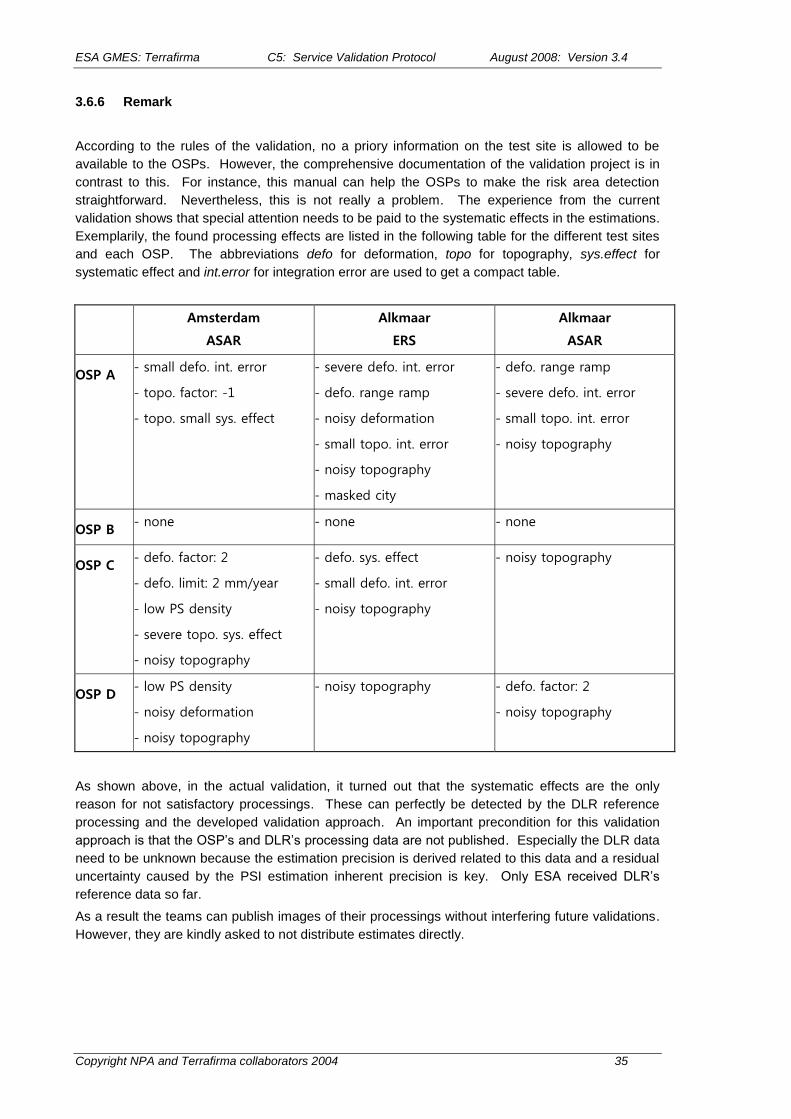
ESA GMES: Terrafirma C5: Service Validation Protocol August 2008: Version 3.4
Copyright NPA and Terrafirma collaborators 2004 35
3.6.6 Remark
According to the rules of the validation, no a priory information on the test site is allowed to be
available to the OSPs. However, the comprehensive documentation of the validation project is in
contrast to this. For instance, this manual can help the OSPs to make the risk area detection
straightforward. Nevertheless, this is not really a problem. The experience from the current
validation shows that special attention needs to be paid to the systematic effects in the estimations.
Exemplarily, the found processing effects are listed in the following table for the different test sites
and each OSP. The abbreviations defo for deformation, topo for topography, sys.effect for
systematic effect and int.error for integration error are used to get a compact table.
Amsterdam
ASAR
Alkmaar
ERS
Alkmaar
ASAR
OSP A - small defo. int. error
- topo. factor: -1
- topo. small sys. effect
- severe defo. int. error
- defo. range ramp
- noisy deformation
- small topo. int. error
- noisy topography
- masked city
- defo. range ramp
- severe defo. int. error
- small topo. int. error
- noisy topography
OSP B - none - none - none
OSP C - defo. factor: 2
- defo. limit: 2 mm/year
- low PS density
- severe topo. sys. effect
- noisy topography
- defo. sys. effect
- small defo. int. error
- noisy topography
- noisy topography
OSP D - low PS density
- noisy deformation
- noisy topography
- noisy topography - defo. factor: 2
- noisy topography
As shown above, in the actual validation, it turned out that the systematic effects are the only
reason for not satisfactory processings. These can perfectly be detected by the DLR reference
processing and the developed validation approach. An important precondition for this validation
approach is that the OSP‟s and DLR‟s processing data are not published. Especially the DLR data
need to be unknown because the estimation precision is derived related to this data and a residual
uncertainty caused by the PSI estimation inherent precision is key. Only ESA received DLR‟s
reference data so far.
As a result the teams can publish images of their processings without interfering future validations.
However, they are kindly asked to not distribute estimates directly.
ESA GMES: Terrafirma C5: Service Validation Protocol August 2008: Version 3.4
Copyright NPA and Terrafirma collaborators 2004 36
4 PRODUCT VALIDATION OF LEVEL 2 PRODUCTS
A Level 2 product includes the comparison of InSAR measurements with external layers of relevant
data. As summarised in the T2-U6 “user standards handbook” dossier, the main types of auxiliary
data that are likely to be incorporated into Level 2 of the service portfolio are:
I. Geological data, 2D and 3D
I. Lithology
I. Superficial thickness
I. Mineralogical properties
I. Local borehole data
I. Geotechnical properties
II. Water table
II. Soil moisture deficit/temporal and spatial rainfall distribution
II. Spring lines
II. Well locations
II. Drainage patterns
II. Hydrogeological properties
III. Extraction records
III. Quarries/underground works
IV. Topographic data
V. RS optical images
The detailed list of auxiliary data is given in section 4.8 of the Service Portfolio Specifications
dossier (S5), which specifies when their usage is appropriate.
The Level 2 is therefore a “causal” product, where observed deformation phenomenon are
tentatively interpreted by geological surveys (or possibly civil engineering companies). The
validation procedure therefore relies mostly on expertise from the Geological Surveys, and is
strongly dependent on the availability of these external data layers. The validation of the
interpretation cannot be standardised as it relies on the relevance and accuracy of the external
data available for a specific deformation event. As stated in the T2-U6 dossier, most of the
auxiliary information is geological or hydrogeological in nature. Much of this information is thus
interpretative in nature, based on limited data. Consequently, it is not possible for „standards‟ to be
applied to much of this information because the way interpretations are carried out is not conducive
to standardisation. Because standardisation in many aspects of geological/hydrogeological
interpretation is relatively difficult, little progress has been made towards standardisation
internationally. At a national level, geological surveys are frequently the main organisation carrying
out this type of work. Consequently, they often set the standard, in so far as such standards are
applied at all. When no standard is available, the validation procedure cannot be defined on a
strict basis. The validation procedure for the Level 2 products will be refined in the second phase
of the project when a sufficient amount of demonstration cases reaching this level will be available.
The minimum required is a verification or an approval system of the interpretative conclusions
summarised in a detailed report produced by the involved partners. Respective Geological
Surveys could interact on a national coverage basis.

ESA GMES: Terrafirma C5: Service Validation Protocol August 2008: Version 3.4
Copyright NPA and Terrafirma collaborators 2004 37
4.1 Landslide Inventory Product (LSI)
The LSI product is a variant based upon the Level 2 products. It maps unstable slopes over whole
basins, incorporating SAR data from the archive. LSI products are made from H1 products, and
utilise auxiliary data including geological, in situ, and Very High Resolution optical imagery.
Validation is performed by the End-User. No formal general validation is possible, see section 4.
However, for the LSI product, a comparison should be made between the estimates in the LSI
product and the location and extent of known landslides.
4.2 Landslide Monitoring Product (LSM)
The LSM product is a variant based upon the Level 2 products. It focuses on the ongoing InSAR
monitoring of specified slopes, incorporating data from new programmed acquisitions. LSM
products are made from both LSI and M1 products, and utilise auxiliary data including geological, in
situ, and Very High Resolution optical imagery.
Validation is performed by the End-User. No formal general validation is possible, see section 4.
However, general cross-validation strategies exist in literature which could be applied.

ESA GMES: Terrafirma C5: Service Validation Protocol August 2008: Version 3.4
Copyright NPA and Terrafirma collaborators 2004 38
5 PRODUCT VALIDATION OF LEVEL 3 PRODUCTS
The Level 3 products include mostly the modelling of the observed phenomenon. This allows:
• A better understanding of the mechanisms and it identifies, and quantifies, the influence of
the most important parameters involved.
• Prediction of the amount of subsidence that can be expected in a site concerned by a
natural or anthropogenic effect. For example, models are commonly used in the mining
industry to forecast the surface deformations which could result from an intensive
extraction activity. This information is important to assess the potential damages to the
overlying buildings, and also to access the impact upon flooding risks.
However, the modelling process cannot be performed systematically, but is rather a project-based
product involving mainly geological surveys and civil engineering companies. It requires a priori
knowledge of the specifics of the test site and of the mechanisms involved.
Even more than for a Level 2 product, the validation of a Level 3 product can not be though as a
standardised process, but rather is an a posteriori control of the output. The quality of the model
can be evaluated by its ability to reproduce the observed past deformations, and when long term
monitoring is possible, by its ability to forecast the ongoing phenomena.

ESA GMES: Terrafirma C5: Service Validation Protocol August 2008: Version 3.4
Copyright NPA and Terrafirma collaborators 2004 39
6 VALIDATION OF REFERENCE DATA
6.1 Validation of end-User Reference Data
► This step of the validation is carried out by the End-User (or CUG member).
► The reporting can be supported by the service validation table in section 1010.
The ground based data which are used for validation processing on any product level can be from
a different nature or in complicated relation with the mechanism of the deformation. Ancillary
ground data are exemplarily independent levelings and reference points. The relevance of the
ground data to the observed deformation is partly an expertise matter and a standard cannot be
defined. Therefore, the End-User (or CUG member carrying out the validation) has to estimate the
relevance of the data set for the validation. It is worth to report the format and accuracy of the used
reference data. Therefore, appreciation of the quality and relevance of these data is to be included
in the particular validation report an can be summarized by a table from section 10 in the validation
report‟s appendix.
6.2 Endorsement of Validation from Key External User-Bodies
► This step of the validation is carried out by the Product Validation Workgroup and the product
validation authority.
Ground truth data need to be used as product validation input. These reference data are very
important i.e. there is a substantial need to know know their quality. The ground truth data are
either already held by the Product Validation Workgroup or will be collected by them during special
validation campaigns. The Workgroup finally nominates the test sites for their validation
campaigns. Of course, the test site selection is based on a review of the available ground truth
data. The reasons for a test site decision needs to be justified and publically reported. The
requirements on the validation reverence data are:
The ownership of the data needs to be known and documented.
The precision needs to be reliable, well known and documented.
The temporal and spatial sampling of the data should be in the order of the PSI data.
The reference data need to be free of artefacts.
The reference data need to be generated with well establishe technices and the
technique needs to be reported.
The permission by the owner of the reference data to publish the results needs to be
documented.
ESA GMES: Terrafirma C5: Service Validation Protocol August 2008: Version 3.4
Copyright NPA and Terrafirma collaborators 2004 40
7 VALIDATION OF NEW PRODUCTS AND PROVIDERS AND
SOFTWARE UPGRADES
This section deals with the validation principles of new products, upgrades and evolving standards.
It also states how to validate a new OSP that might approach the Administrative Prime to join the
Terrafirma consortium.
7.1 New Operational Service Provider (OSP)
► This step of the validation is carried out by an independent validation authority with help of the
administrative prime and in collaboration with the new OSP.
In case a new OSP wants to join the project consortium, it will be guaranteed that the provided
services are of a comparable quality as those delivered by the existing OSPs, regarding the
processing procedures and conformation to the standards. A new OSP will be validated using the
procedures defined in this document, see section 3.1.2. Therefore, the potential OSP must get
access to this document and the product specification.
The validation will be carried out by an independent validation authority and is administered by this
validation body and the administrative prime. The validation manual described in section 3.6 is the
basis for the validation of the new OSPs. Also, the reporting (i.e. the process validation reports) of
the process validation results is similar. If the validation is positive, a certificate equivalent to
Figure 21 confirms the new OSP to be a Terrafirma OSP.
7.2 Software Upgrades
► This step of the validation is carried out by the OSP for minor updates. Minor software updates
are e.g. software changes in order to
improve the processing speed,
get better in precision,
ease the operation,
change the data handling.
The OSP has to make sure that software upgrades do not degrade the quality of the delivered
products and that the products maintain to adhere to the agreed standards. The OSP is
responsible for this validation and in the validation report the software version is to be reported.
The OSP needs to have a configuration control in place to make sure that it can return to a
previous version of the software. Moreover, configuration monitoring needs to remain in place, a
log of the version, and the software version is included in the actual Quality Control Protocol.
The OSP needs to perform a cross-comparison of the results of the previous and the current
version, preferably using the validation test site data set. This test needs to be documented in an
internal upgrade report. If there is doubt with regard to adherence to the standards or the quality of
the product after the upgrade, the OSP can request the independent validation authority to validate
the upgraded software in the same was as the existing software, based on the upgrade report of
the OSP. The upgraded software is considered to be validated if the previous version was
validated, and the upgrade report does not show deteriation of the quality of the product.
In contrast to the minor software updates are major algorithmic changes. Major software updates
are necessary for new high resolution sensors (e.g. Cosmo Skymed and TerraSAR-X) and new
acquisition modes (e.g. spotlight and scansar).

ESA GMES: Terrafirma C5: Service Validation Protocol August 2008: Version 3.4
Copyright NPA and Terrafirma collaborators 2004 41
► Major software updates are again long term validated in an upgrading validation campaign by
an independent validation authority. The result is another qualification of the new processing
and the innovative Level 1 products. The re-validation is necessary because the input data
characteristics changes and the processing and estimation algorithms become more complicated.
Figure 22 shows an example for the topography update estimation using the high resolution 300
MHz spotlight mode data provided by the sensor TerraSAR-X. The resolution of the SLC data is in
the order of 0.5 m x 1.0 m. Each qualification is restricted to the checked sensors and acquisition
modes. The validation of new OSPs can therefore not only be restricted to the most recent
available data. Before an upgraded validation is started, the previous long term validation based
on stripmap mode data from the sensors ERS and ENVISAT/ASAR needs to be performed
successfully.
Figure 22: Topography update estimation using the high resolution 300 MHz spotlight mode data
provided by the sensor TerraSAR-X. The estimated height is color-coded, geocoded and finally
visualized in the Google-Earth-GIS. The example shows the Las Vegas Fashion Show Mall
(processing system: PSI-GENESIS of DLR Oberpfaffenhofen, Remote Sensing Technology Institute)
7.3 New or Updated Standards
► This step of the validation is carried out by the OSP.
When new standards are specified in the S5 dossier, they need to be implemented by the OSP and
validated. For example, evolvement is foreseen in the definition of:
• Projection system:
ESA GMES: Terrafirma C5: Service Validation Protocol August 2008: Version 3.4
Copyright NPA and Terrafirma collaborators 2004 42
o Currently UTM is used for point data. The user may also select to have these data
delivered in their own grid. Raster data is provided unprojected as
latitude/longitude.
o INSPIRE recommends the ETRS89 datum and GRS80 ellipsoid for geo-
referencing, using the Transverse Mercator projection for scales larger than
1:500,000 and the Lambert Conformal Conic projection for scales smaller than
1:500,000.
• Raster file:
o Currently GeoTIFF.
o INSPIRE recommended formats are HDF-EOS, BIIF 12087-5 and CEOS.
• PS point database:
o Currently dBase IV (.dbf) format.
o ISO 19125 standard should be adopted once it reaches full International Standard
status, and is supported by GIS software.
• Metadata:
o Currently a text file providing the product definition parameters.
o ISO 19125 standard should be adopted once it reaches full International Standard
status, and is supported by GIS software.
Validation of these new standards is to be done similarly as is done for the existing standards. The
OSP and the End-User perform this task by checking whether the delivered data conforms to the
standard. If the delivered data does not conform to the standard, the OSP has to make sure the
product will conform in future, and for the delivered product if so desired by the end-user.
7.4 New Products
► This step of the validation is carried out by an independent validation authority and the OSPs.
I.e. the definition of the validation procedures is worked out by the independent validation authority
and the checks are performed in cooperation with the OSPs.
Any new product needs to be defined in the S5 dossier. A definition of a proposed new product will
be submitted to the validation body, via the administrative prime. Afterwards, it must be identifyed
which parameters need to be validated. The validation authority decides if the new product
requires an independent long term validation e.g. by a new process validation and / or by a new
product validation. Finally, the validation authority will integrate the new product into the next
update version of the Service Validation Protocol document (i.e. this document).
7.4.1 Traffic Light Product
The actual Level 1 PSI product does not directly provide the deformation risk areas i.e. only the
affected areas, their shape and the direction of deformation. However, this condensed risk
information is often sufficient for end users and could be a new independent Level 1 product. Due
to its close relation to the already validated Level 1 PSI product an extra long term validation (i.e.
process and product validation) is not necessary. The product format needs to be specified in the
Service Portfolio Specifications Dossier S5 and has to be checked once only by each OSP itself
similar to a minor software update. The independent validation authority should update the quality
control protocol accordingly. Main focus of the update is
a correct processing by suitable processing checks and
a meaningful reporting of the applied thresholds to the end user.

ESA GMES: Terrafirma C5: Service Validation Protocol August 2008: Version 3.4
Copyright NPA and Terrafirma collaborators 2004 43
7.4.2 Atmospheric Phase Screen
During the PSI processing, the atmospheric phase screen (APS) is estimated. Until now, it is not
delivered as a self-contained Level 1 product. However, it is directly related to the atmospheric
water vapour. At the moment, no other sensor or technique can provide water vapour maps with a
resolution comparable to the PSI APS estimate. Consequently, it can be expected that the APS
will result in an independent Level 1 product with different end users e.g. from the filed of
meteorology or climatology. An operational Terrafirma APS product would require an independent
process validation and an independent product validation because the actual long term validation
does not cover the APS processing. Based on the experiences gained during the long term
validation, the quality control protocol should be updated to guarantee a correct processing by an
adequate quality check.
7.4.3 Hybrid technologies products
An emerging Level 1 product is based on hybrid technologies, in particular CR-InSAR and CAT-
InSAR, which is nearing operational status. The nearly ideal scatterers and their optimal
positioning according to the physical displacement effect provide an improved precision in the
deformation estimation. The processing is similar to the processing of a conventional PSI Level 1
product. Therefore, the general validation principles and procedures for these technologies are
identical to the general procedures for the Level 1 products described above. This is the reason,
the process validation and the product validation need not to be repeated. However, the Quality
Control Protocol should be updated in order to cope with new requirements.

ESA GMES: Terrafirma C5: Service Validation Protocol August 2008: Version 3.4
Copyright NPA and Terrafirma collaborators 2004 44
8 ACCESS, DISTRIBUTION AND AVAILABILITY OF VALIDATION
DOCUMENTS
This section describes the availability of several reports defined in this document. This is
particularly important for reports containing sensitive information on algorithms or ground
movements. Table 4 gives an overview of the bodies that have access to these documents.
Table 4: Access, distribution and availability of validation reports to project partners, ESA,
management (NPA), validation workgroup and/ or external parties. Access defines the bodies that are
directly involved and have unrestricted access to the document. Distribution pertains to the body
responsible for distribution and to the media used for distribution. Availability defines who the report
is available to.
REPORT ACCESS DISTRIBUTION AVAILABILITY
Software
upgrade
report
Internal to the
OSP
The OSP needs to archive it. The validation authority can be granted
confidential access if the OSP desires a
process validation of a software upgrade.
Process
validation
report –
Part A
validation
authority,
(potentially new)
OSP;
The validation authority provides
each OSP the process validation
report part A directly via email.
An electronic copy of the TN is also
sent to the PVW and ESA by the
validation authority.
The technical note is not available in
public.
(The TN is access restricted to the project
participants (OSPs, PVW) and ESA only)
Process
validation
report-
Part B
validation
authority,
(potentially new)
OSP;
The validation authority provides
the OSP, the administrative prime,
the PVW and ESA with the process
validation report part B via email.
The anonymized summary is publically
available via the administrative prime via
the Terrafirma website.
Product
validation
reports
validation
authority, CUG,
OSP
Public show cases via world wide
web.
Sensitive information that cannot
be distributed is not distributed.
Public show cases are generally available
via the Terrafirma website.
If prohibited by the provider of the ground
truth data, the product validation report is
confidential between the OSP and the
end-user.
Quality
Control
Protocol
OSP The validation authority delivers the
QCP to the administrative prime
and to the PVW via e-mail.
The administrative prime
distributes the QCP directly to each
OSP via e-mail and makes it
publically available on the
Terrafirma website.
The actual version of the QCP is made
publically available by the administrative
prime.
Previous versions can be made available
on request.

ESA GMES: Terrafirma C5: Service Validation Protocol August 2008: Version 3.4
Copyright NPA and Terrafirma collaborators 2004 45
9 SUMMARY AND CONCLUSIONS
This Service Validation Protocol dossier defines the top-level approach for validation of the
Terrafirma products and processes and describes the general quality assurance. I.e. it specifies
and explains the different validation procedures and the requested process control measures like
auditing, reporting, escalation and the corrective and preventative actions in the appropriate
assessments. Terrafirma guarantees the overall quality by
a long term validation and
the short term validation.
The Terrafirma project provides three product levels (1-3). Level 1 is the basis for Level 2 data
which again are the basis for the Level 3 data. Therfore, particular attention is demanded for the
Level 1 data and a dedicated validation project has been organized for their long term validation. It
included a process validation and a product validation for the Level 1 data. The process validation
ensures that the processing is free of artefacts and conforms to the agreed standards and precision
(i.e. it is not important which OSP generates the product). The product validation is concerned with
the geophysical meaning of the Terrafirma products. Both, the process validation and the product
validation are general long term checks and can result in a Terrafirma qualification of the OSPs. All
long term validations are performed by independent experts acting as validation authorities due to
the responsibility and the complexity of the work.
The short term validation is achieved by the established Quality Control Protocol. It has been
developed by an independent validation authority and checks the correctness of the actual
processing. The QCP guarantees that procedures are in place at each OSP that ensure consistent
and reliable products and the repeatabily of the results.
The validation of Level 2 and Level 3 product is based on ground truth data. Due to the strong
dependency on the particular test case, this validation is performed by cooperation between the
OSP and the experienced end user. The reporting to the PVW results in an evaluation and
publically distribution of the reviewed results.
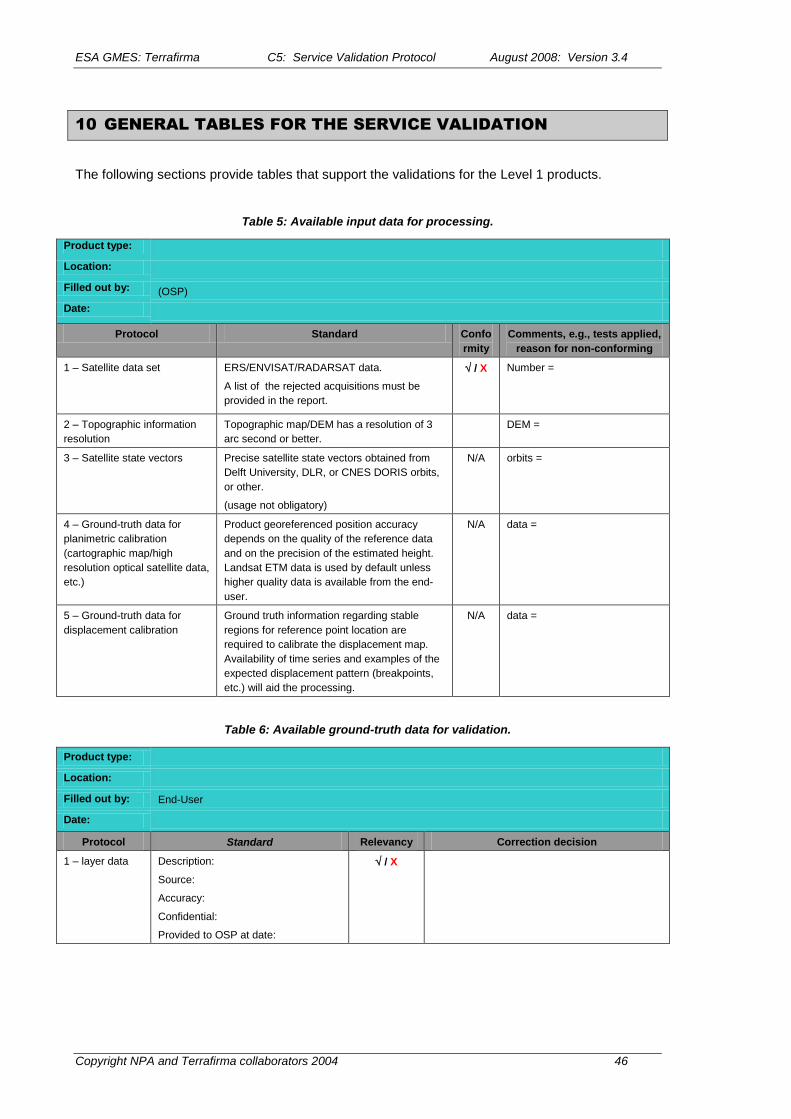
ESA GMES: Terrafirma C5: Service Validation Protocol August 2008: Version 3.4
Copyright NPA and Terrafirma collaborators 2004 46
10 GENERAL TABLES FOR THE SERVICE VALIDATION
The following sections provide tables that support the validations for the Level 1 products.
Table 5: Available input data for processing.
Product type:
Location:
Filled out by: (OSP)
Date:
Protocol Standard Confo
rmity
Comments, e.g., tests applied,
reason for non-conforming
1 – Satellite data set
ERS/ENVISAT/RADARSAT data.
A list of the rejected acquisitions must be
provided in the report.
/ X Number =
2 – Topographic information
resolution
Topographic map/DEM has a resolution of 3
arc second or better.
DEM =
3 – Satellite state vectors Precise satellite state vectors obtained from
Delft University, DLR, or CNES DORIS orbits,
or other.
(usage not obligatory)
N/A orbits =
4 – Ground-truth data for
planimetric calibration
(cartographic map/high
resolution optical satellite data,
etc.)
Product georeferenced position accuracy
depends on the quality of the reference data
and on the precision of the estimated height.
Landsat ETM data is used by default unless
higher quality data is available from the end-
user.
N/A data =
5 – Ground-truth data for
displacement calibration
Ground truth information regarding stable
regions for reference point location are
required to calibrate the displacement map.
Availability of time series and examples of the
expected displacement pattern (breakpoints,
etc.) will aid the processing.
N/A data =
Table 6: Available ground-truth data for validation.
Product type:
Location:
Filled out by: End-User
Date:
Protocol Standard Relevancy Correction decision
1 – layer data Description:
Source:
Accuracy:
Confidential:
Provided to OSP at date:
/ X
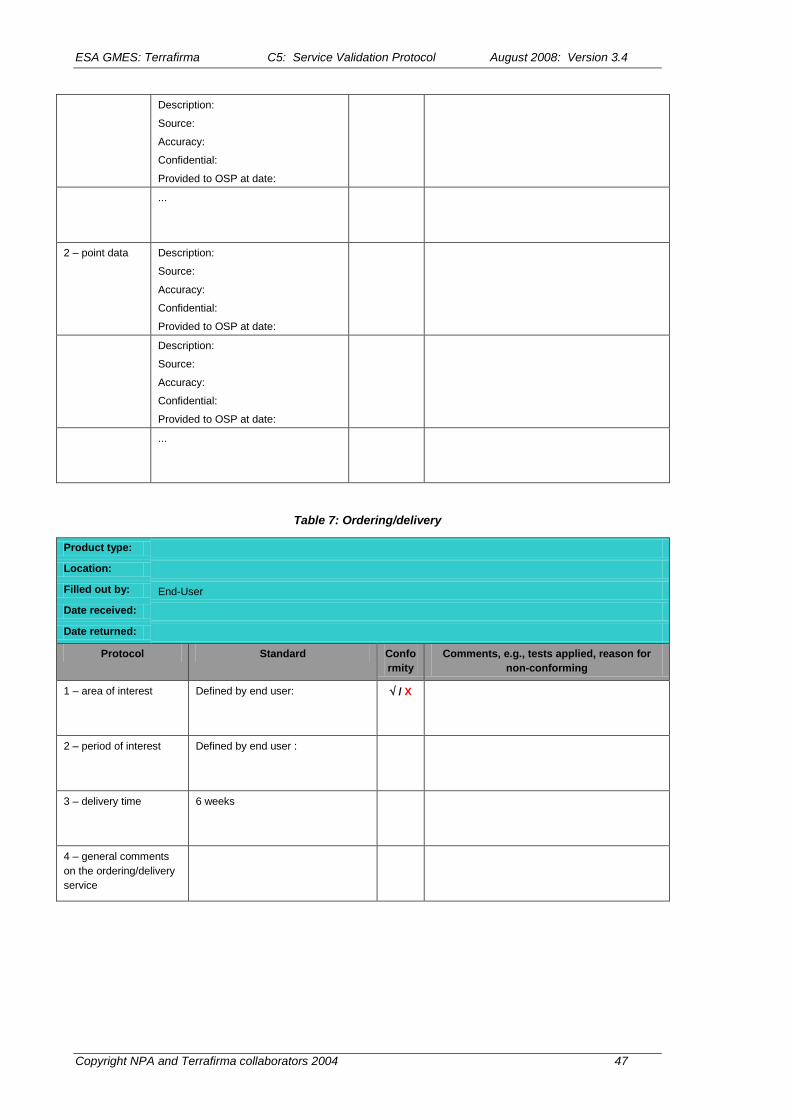
ESA GMES: Terrafirma C5: Service Validation Protocol August 2008: Version 3.4
Copyright NPA and Terrafirma collaborators 2004 47
Description:
Source:
Accuracy:
Confidential:
Provided to OSP at date:
...
2 – point data Description:
Source:
Accuracy:
Confidential:
Provided to OSP at date:
Description:
Source:
Accuracy:
Confidential:
Provided to OSP at date:
...
Table 7: Ordering/delivery
Product type:
Location:
Filled out by: End-User
Date received:
Date returned:
Protocol Standard Confo
rmity
Comments, e.g., tests applied, reason for
non-conforming
1 – area of interest Defined by end user:
/ X
2 – period of interest Defined by end user :
3 – delivery time
6 weeks
4 – general comments
on the ordering/delivery
service

ESA GMES: Terrafirma C5: Service Validation Protocol August 2008: Version 3.4
Copyright NPA and Terrafirma collaborators 2004 48
11 QUALITY CONRTOL PROTOCOL FOR LEVEL 1 PRODUCTS
The following part of the Appendix includes the “Terrafirma Quality Control Protocol for Level 1
Products”. It is available as a separate document and is publicly available. The actual version is
1.5 from 23th July 2008. It is annually updated independently from this “Service Validation
Protocol”.

ESA GMES: Terrafirma C5: Service Validation Protocol August 2008: Version 3.4
Copyright NPA and Terrafirma collaborators 2004 49
prepared:
N. Adam
Date
approved:
R. Capes
Date
released:
Ph. Bally
Date
Terrafirma
Quality Control Protocol
for Level 1 Products
DLR-IMF – Remote Sensing Technology Institute
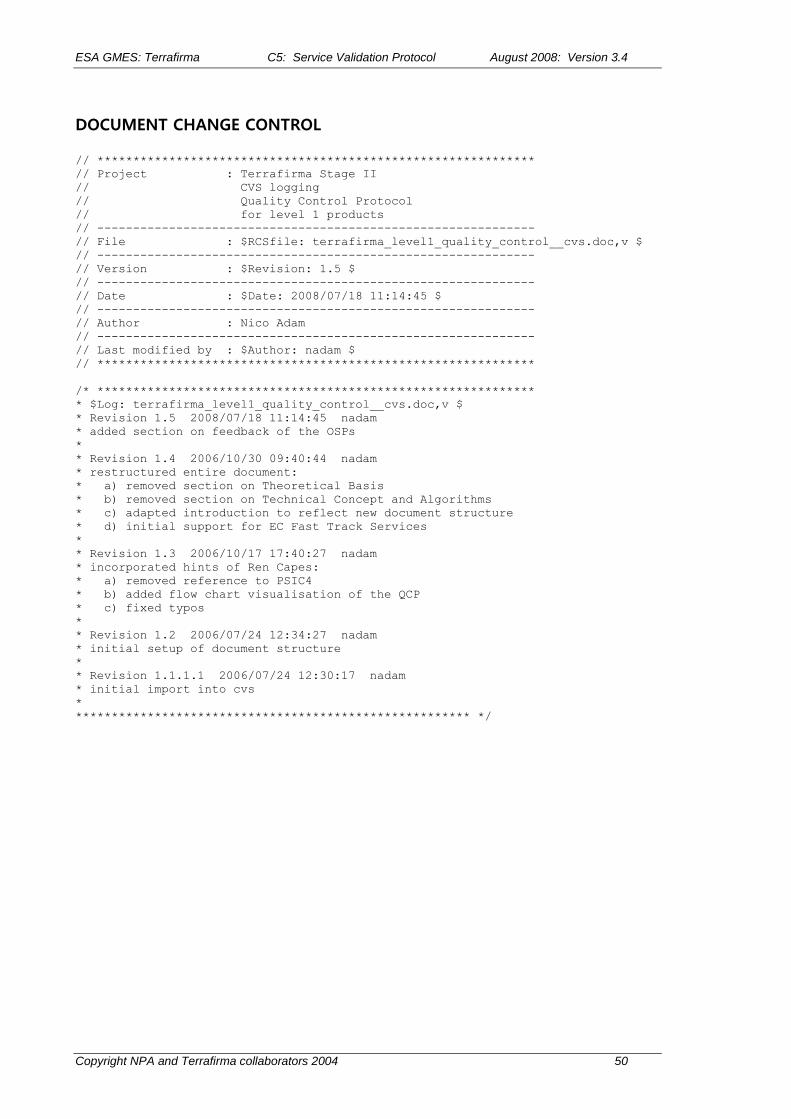
ESA GMES: Terrafirma C5: Service Validation Protocol August 2008: Version 3.4
Copyright NPA and Terrafirma collaborators 2004 50
DOCUMENT CHANGE CONTROL
// *************************************************************
// Project : Terrafirma Stage II
// CVS logging
// Quality Control Protocol
// for level 1 products
// -------------------------------------------------------------
// File : $RCSfile: terrafirma_level1_quality_control__cvs.doc,v $
// -------------------------------------------------------------
// Version : $Revision: 1.5 $
// -------------------------------------------------------------
// Date : $Date: 2008/07/18 11:14:45 $
// -------------------------------------------------------------
// Author : Nico Adam
// -------------------------------------------------------------
// Last modified by : $Author: nadam $
// *************************************************************
/* *************************************************************
* $Log: terrafirma_level1_quality_control__cvs.doc,v $
* Revision 1.5 2008/07/18 11:14:45 nadam
* added section on feedback of the OSPs
*
* Revision 1.4 2006/10/30 09:40:44 nadam
* restructured entire document:
* a) removed section on Theoretical Basis
* b) removed section on Technical Concept and Algorithms
* c) adapted introduction to reflect new document structure
* d) initial support for EC Fast Track Services
*
* Revision 1.3 2006/10/17 17:40:27 nadam
* incorporated hints of Ren Capes:
* a) removed reference to PSIC4
* b) added flow chart visualisation of the QCP
* c) fixed typos
*
* Revision 1.2 2006/07/24 12:34:27 nadam
* initial setup of document structure
*
* Revision 1.1.1.1 2006/07/24 12:30:17 nadam
* initial import into cvs
*
******************************************************* */

ESA GMES: Terrafirma C5: Service Validation Protocol August 2008: Version 3.4
Copyright NPA and Terrafirma collaborators 2004 51
The table of contents has ben moved to the beginning of the overall document.

ESA GMES: Terrafirma C5: Service Validation Protocol August 2008: Version 3.4
Copyright NPA and Terrafirma collaborators 2004 52
INTRODUCTION
The document in hand describes the Quality Control Protocol for the InSAR processing in the
framework of the Terrafirma project.
PURPOSE AND SCOPE
This is the reference for the Quality Control Protocol (QCP) for the level 1 product which is
generated in the course of the Terrafirma project by operational service providers (OSPs). This
protocol is a customer-facing document, to satisfy customers of the quality of product they will
receive, and to detail procedures to be followed and deliverables to ensure this. Following the
protocol ensures that customers receive the highest quality product. The quality protocol has been
developed for the generation of different kinds of interferometric RAW products. It is also the basis
for the quality control of the EC Fast Track Services [R3]. Subject is to set up a common basis for
the reliability of the ground motion product mainly on a technical level. Finally, the QCP provides an
overarching and generic standard to track the quality of the interferometric data processing. In
order to support different processing techniques and as much as possible different algorithmic
approaches the test procedures are kept simple and generic. Besides, this helps to implement the
test routines and to establish this protocol to be the regular working practice.
This QCP document is self-contained but is complemented by the other validation related project
documents. I.e. it does not describe the theory of the various InSAR algorithms and their typical
error sources and the resulting effects in the intermediate data and on the final interferometric data
set. This information will be provided by the Service Validation Protocol C5 [R2] together with the
technical concept and the algorithms to check the quality and to validate the processing chains.
This is a consequence from the fact that the quality control and the processing chain validation will
be based on similar routines and intermediate processing data.
This document provides the information on
the intended readership of the document,
Terrafirma‟s level 1 products and the related processing chains,
quality control working scenarios,
a protocol to check the quality of the most important algorithms and the actual processing.
INTENDED READERSHIP
End users of the Terrafirma products (the OSP‟s customers) get an insight into the processing
techniques, their intermediate data and the quality related parameters. This document
(complemented by [R2]) helps them to interpret the quality control protocol and its deliverables
gaining understanding of the actual accuracy and reliability of the delivered final level 1 product.
Operational service providers are mainly the intended readership. Both, their software developers
of the interferometric systems and their operators are addressed. Of course, the proposed quality
test and validation routines need to be implemented and tested by the software developers.

ESA GMES: Terrafirma C5: Service Validation Protocol August 2008: Version 3.4
Copyright NPA and Terrafirma collaborators 2004 53
Furthermore, they receive information on the error sources in the different interferometric
processing steps. This can be the basis for the improvement of the current algorithms and
implementations of single processing steps. The OSP‟s operators need to follow this quality
protocol and to report their checks.
GLOSSARY
The document uses acronyms which are often used in the InSAR, PSI, Terrafirma and GMES
framework. The following table lists the abbreviations:
AIO area of interest
APS atmospheric phase screen
CR corner reflector
CVS Concurrent Versions System
DEM digital elevation model
D-InSAR Differential SAR Interferometry
ERS European Remote Sensing Satellite
ESA European Space Agency
FFT Fast Fourier Transform
GCP ground control point
Geo TIFF tif data with added geo-information
GMES Global Monitoring for Environment and Security
InSAR SAR Interferometry
LOS line of sight
MPEG Motion Pictures Experts Group
OSP Operational Service Provider
pdf probability density function
PCC Parametric Cubic Convolution
PSI Persistent Scatterer Interferometry
PTA Point Target Analysis
QC Quality Control
QCP Quality control Protocol
SAR Synthetic Aperture Radar
SCR Signal To Clutter Ratio
SLA Service Level Agreement
SLC Single Look Complex Product
SNR signal To Noise Ratio
tiff / tif Taged image File Format
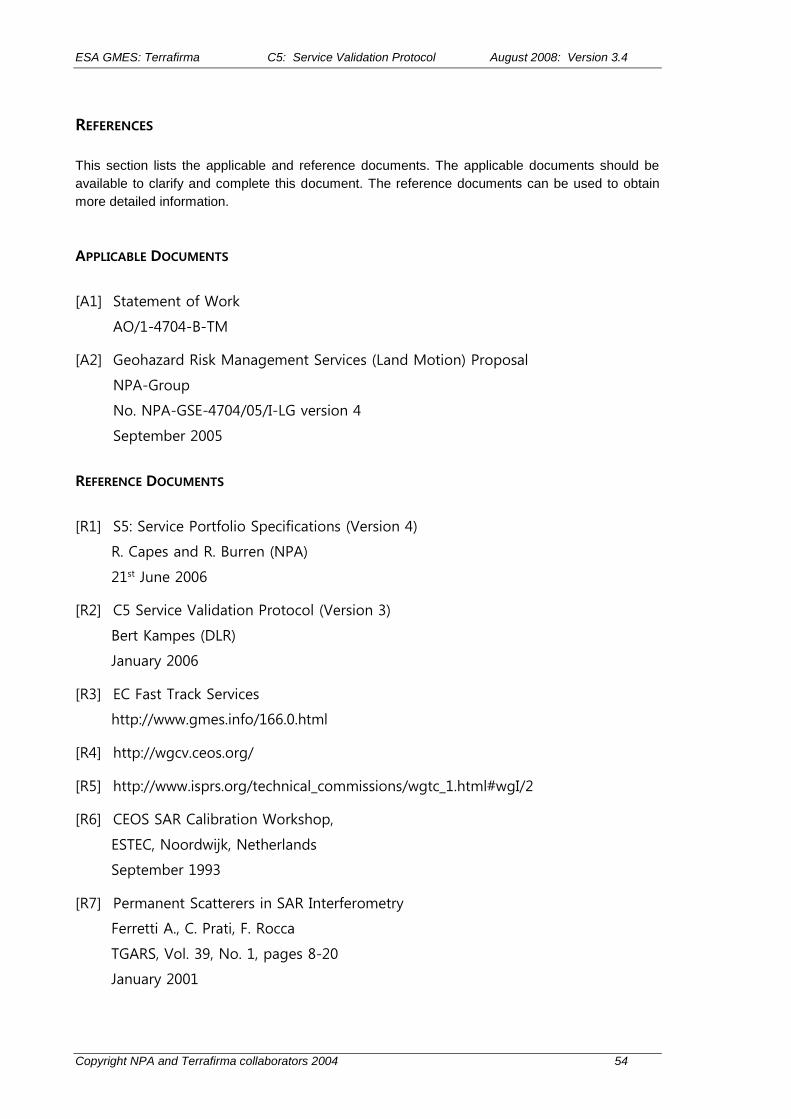
ESA GMES: Terrafirma C5: Service Validation Protocol August 2008: Version 3.4
Copyright NPA and Terrafirma collaborators 2004 54
REFERENCES
This section lists the applicable and reference documents. The applicable documents should be
available to clarify and complete this document. The reference documents can be used to obtain
more detailed information.
APPLICABLE DOCUMENTS
[A1] Statement of Work
AO/1-4704-B-TM
[A2] Geohazard Risk Management Services (Land Motion) Proposal
NPA-Group
No. NPA-GSE-4704/05/I-LG version 4
September 2005
REFERENCE DOCUMENTS
[R1] S5: Service Portfolio Specifications (Version 4)
R. Capes and R. Burren (NPA)
21st June 2006
[R2] C5 Service Validation Protocol (Version 3)
Bert Kampes (DLR)
January 2006
[R3] EC Fast Track Services
http://www.gmes.info/166.0.html
[R4] http://wgcv.ceos.org/
[R5] http://www.isprs.org/technical_commissions/wgtc_1.html#wgI/2
[R6] CEOS SAR Calibration Workshop,
ESTEC, Noordwijk, Netherlands
September 1993
[R7] Permanent Scatterers in SAR Interferometry
Ferretti A., C. Prati, F. Rocca
TGARS, Vol. 39, No. 1, pages 8-20
January 2001

ESA GMES: Terrafirma C5: Service Validation Protocol August 2008: Version 3.4
Copyright NPA and Terrafirma collaborators 2004 55
[R8] Statistics of the Stokes parameters and the complex coherence parameters in
one–look and multi–look speckle fields
I R. Touzi, A. Lopes
EEE Trans. Geosci. Remote Sensing, vol. 34, no 2, pp. 519–531
1996
[R9] ERS SAR Calibration – Derivation of the Backscattering Coefficient s0 in ESA ERS
SAR Products
ES-TN-RS-PM-HL09 Issue 2, Rev. 5f
H. Laur, P. Bally, P. Meadows, J. Sanchez, B. Schaettler, E. Lopinto, D. Esteban
5. Nov 2004
[R10] Replica pulse power correction factor
ESA Product Control Service
http://earth.esa.int/pcs/ers/sar/calibration/replica_pwr/
[R11] Absolute Calibration of ASAR Level 1 Products Generated with PF-ASA
B.Rosich and P. Meadows
issue 1 revision 5
07 October 2004
[R12] Instrument, Level 1b and Absolute Calibrations
M. Rocca et al.
Envisat Validation Review, Esrin
9-13. Dec 2002
http://envisat.esa.int/workshops/validation_12_02/closing/RA2_conclusions-1.htm
[R13] ERS-1 SAR RADIOMETRIC CALIBRATION
H. Laur, P. Meadows, J.I. Sanchez, E. Dwyer
Published in the Proceedings of the CEOS SAR Calibration Workshop
(ESA WPP-048) Sept. 93
[R14] ENVISAT ASAR Product Calibration and Product Quality Status
B. Rosich,
SAR Workshop 2004
Ulm, Germany
27-28 May 2004
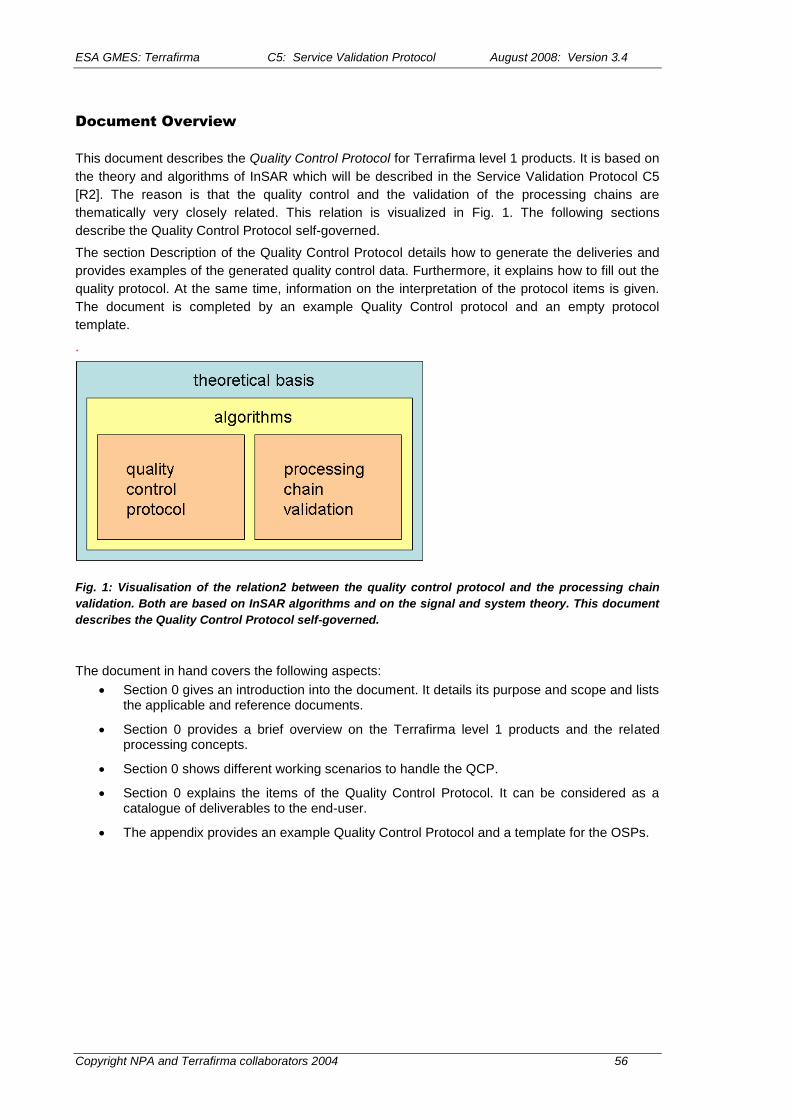
ESA GMES: Terrafirma C5: Service Validation Protocol August 2008: Version 3.4
Copyright NPA and Terrafirma collaborators 2004 56
Document Overview
This document describes the Quality Control Protocol for Terrafirma level 1 products. It is based on
the theory and algorithms of InSAR which will be described in the Service Validation Protocol C5
[R2]. The reason is that the quality control and the validation of the processing chains are
thematically very closely related. This relation is visualized in Fig. 1. The following sections
describe the Quality Control Protocol self-governed.
The section Description of the Quality Control Protocol details how to generate the deliveries and
provides examples of the generated quality control data. Furthermore, it explains how to fill out the
quality protocol. At the same time, information on the interpretation of the protocol items is given.
The document is completed by an example Quality Control protocol and an empty protocol
template.
.
Fig. 1: Visualisation of the relation2 between the quality control protocol and the processing chain
validation. Both are based on InSAR algorithms and on the signal and system theory. This document
describes the Quality Control Protocol self-governed.
The document in hand covers the following aspects:
Section 0 gives an introduction into the document. It details its purpose and scope and lists the applicable and reference documents.
Section 0 provides a brief overview on the Terrafirma level 1 products and the related processing concepts.
Section 0 shows different working scenarios to handle the QCP.
Section 0 explains the items of the Quality Control Protocol. It can be considered as a catalogue of deliverables to the end-user.
The appendix provides an example Quality Control Protocol and a template for the OSPs.
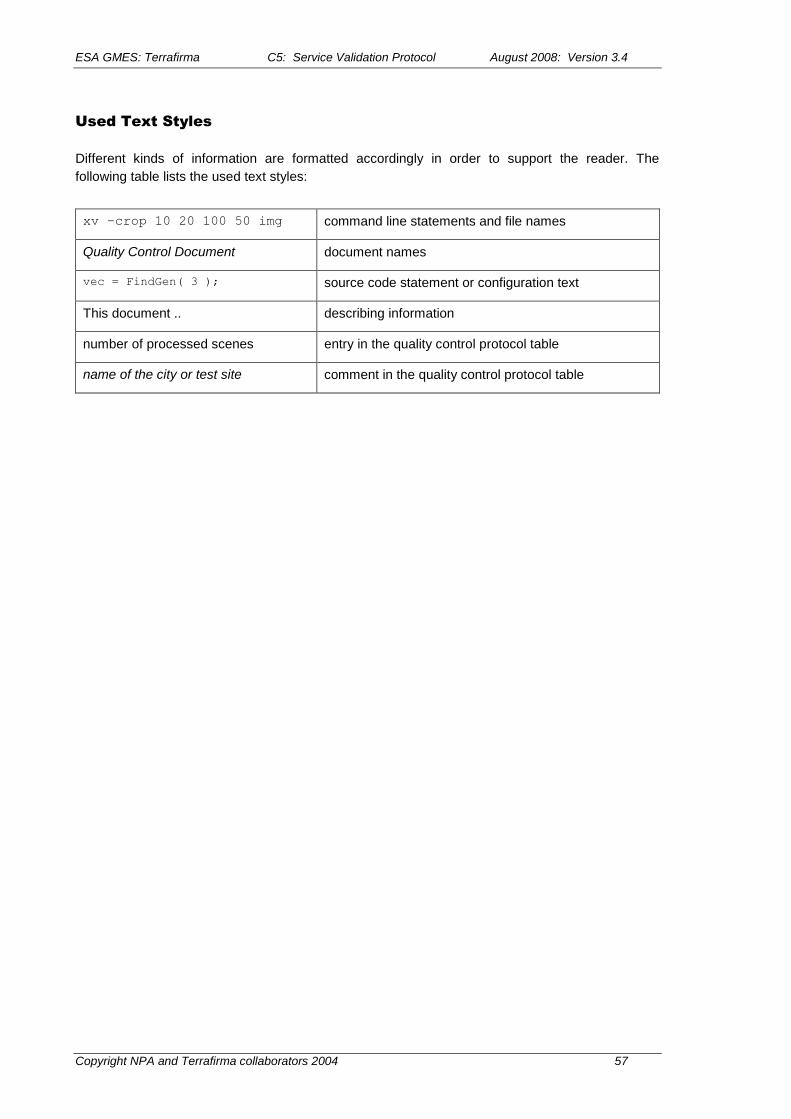
ESA GMES: Terrafirma C5: Service Validation Protocol August 2008: Version 3.4
Copyright NPA and Terrafirma collaborators 2004 57
Used Text Styles
Different kinds of information are formatted accordingly in order to support the reader. The
following table lists the used text styles:
xv –crop 10 20 100 50 img command line statements and file names
Quality Control Document document names
vec = FindGen( 3 ); source code statement or configuration text
This document .. describing information
number of processed scenes entry in the quality control protocol table
name of the city or test site comment in the quality control protocol table

ESA GMES: Terrafirma C5: Service Validation Protocol August 2008: Version 3.4
Copyright NPA and Terrafirma collaborators 2004 58
INSAR SOFTWARE AND PRODUCTS OVERVIEW
Terrafirma establishes the European GMES ground motion hazard service. This service is based
on SAR interferometric processing techniques. Depending on the degree of interpretation and
modelling three levels of InSAR products are the output of the service. These are defined in the
Service Portfolio Specifications [R1]. The proposed quality control procedures are related to the
basic level 1 products only. But due to the hierarchic nature of the Terrafirma product tree the
higher product levels (level 2 and level 3) take advantage from these. The quality control is
independent of the historical or monitoring processing and applies consequently to both level 1
product types (H-1 and M-1).
The Terrafirma level 1 product includes several interferometric processing techniques. The
following list provides the included RAW InSAR measurements:
conventional interferometry (InSAR) and differential interferometry (D-InSAR)
stacked InSAR
Persistent Scatterer Interferometry (PSI)
corner reflector and active transponder InSAR
The different complexity of the processing and the required software is substantial. Fig. 2 shows
two examples for level 1 data.
Fig. 2: Examples for two of the several different level 1 products in the Terrafirma framework. On the left a
simple differential interferogram is shown. Each colour cycle corresponds to about 2.8 cm displacement per
month. The right image shows the permanent scatterer technique on the city of Berlin. The different
complexity of the processing and the required software is substantial.
Nevertheless, all these processing techniques are based on interferometric SAR processing.
Furthermore, the advanced processing techniques (e.g. the persistent scatterer interferometry, the
small baseline subset approach (SBAS) or the stacked InSAR) which utilise long time series of
phase measurements are still very similar. They just implement different types of frequency
estimators in order to get the final displacement product. This fact allows to setup a common
Quality Protocol and to validate the processing chains.
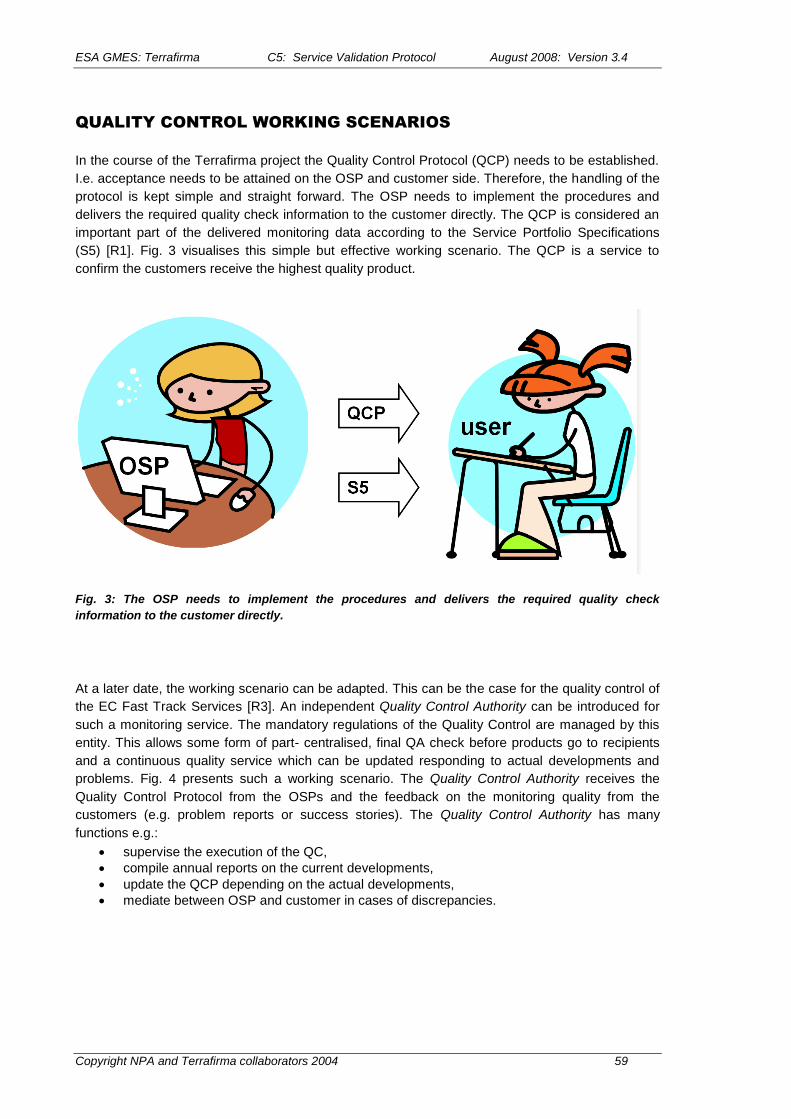
ESA GMES: Terrafirma C5: Service Validation Protocol August 2008: Version 3.4
Copyright NPA and Terrafirma collaborators 2004 59
QUALITY CONTROL WORKING SCENARIOS
In the course of the Terrafirma project the Quality Control Protocol (QCP) needs to be established.
I.e. acceptance needs to be attained on the OSP and customer side. Therefore, the handling of the
protocol is kept simple and straight forward. The OSP needs to implement the procedures and
delivers the required quality check information to the customer directly. The QCP is considered an
important part of the delivered monitoring data according to the Service Portfolio Specifications
(S5) [R1]. Fig. 3 visualises this simple but effective working scenario. The QCP is a service to
confirm the customers receive the highest quality product.
Fig. 3: The OSP needs to implement the procedures and delivers the required quality check
information to the customer directly.
At a later date, the working scenario can be adapted. This can be the case for the quality control of
the EC Fast Track Services [R3]. An independent Quality Control Authority can be introduced for
such a monitoring service. The mandatory regulations of the Quality Control are managed by this
entity. This allows some form of part- centralised, final QA check before products go to recipients
and a continuous quality service which can be updated responding to actual developments and
problems. Fig. 4 presents such a working scenario. The Quality Control Authority receives the
Quality Control Protocol from the OSPs and the feedback on the monitoring quality from the
customers (e.g. problem reports or success stories). The Quality Control Authority has many
functions e.g.:
supervise the execution of the QC,
compile annual reports on the current developments,
update the QCP depending on the actual developments,
mediate between OSP and customer in cases of discrepancies.
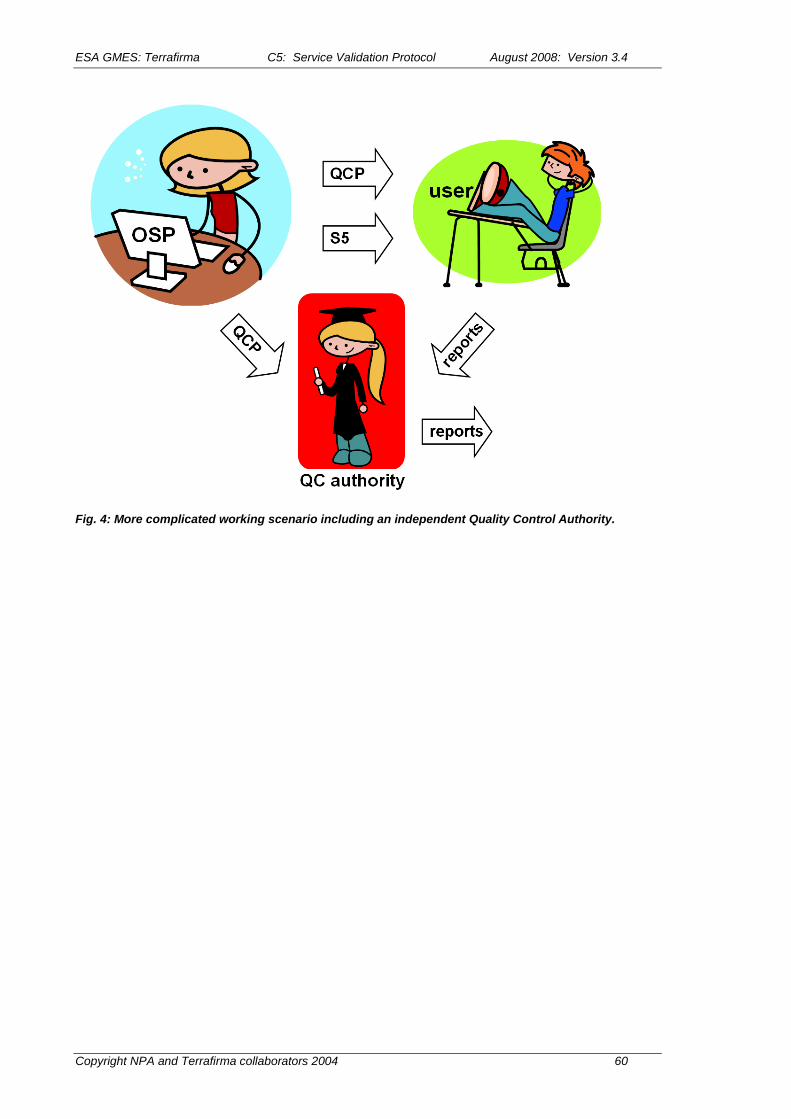
ESA GMES: Terrafirma C5: Service Validation Protocol August 2008: Version 3.4
Copyright NPA and Terrafirma collaborators 2004 60
Fig. 4: More complicated working scenario including an independent Quality Control Authority.

ESA GMES: Terrafirma C5: Service Validation Protocol August 2008: Version 3.4
Copyright NPA and Terrafirma collaborators 2004 61
DESCRIPTION OF THE QUALITY CONTROL PROTOCOL
In the course of the level 1 data generation a large amount of data needs to be processed. This is
the reason manual interaction is avoided in order to allow a high data throughput. However, the
quality check of some processing steps and the report on it requires some operator screening. The
concept of the actual quality control is to minimize this sort of interaction.
An example protocol is provided in section 0 and a template for the usage in the course of the
Terrafirma processing is given in section 0. The following section explains the quality control
protocol and shows examples of the data to be generated. The sequence of quality control actions
follows the processing sequence. Fig. 5 presents an overview on the sections of the protocol and
their relation to the actual processing. The Quality Control Protocol is designed to be generic and
should be generated in table form. In case an entry or deliverable in the report is not relevant it can
be marked as “not applicable“.
Fig. 5: Overview on the sections of the Quality Control Protocol and their relation to the respective data
processing. The hint (4.4.10 Tab4) means that the Displacement Phase Unwrapping test is reported in the
table 4 of the Quality Control Protocol and the test is described in the section 4.4.10 of this document.
Project Overview
The Quality Control Protocol starts with a brief description of the project on the test site area, the
customer or subject, the processing directory, the project‟s start and end date and the backup

ESA GMES: Terrafirma C5: Service Validation Protocol August 2008: Version 3.4
Copyright NPA and Terrafirma collaborators 2004 62
information. This part provides even internal information e.g. on the backup. There are two
reasons. Firstly, all the processing information is kept together for the operator in one and the same
document and secondly the repeatability of the processing is visible and proven to the customer.
The Project Overview part of the Quality Control Protocol is a short table which can be generated
automatically:
test site name of the city or test site
project name single word for the internal project name; e.g. munich
customer / subject customer’s name, or projects subject; e.g. BRGM
analysis type e.g. D-InSAR, stacked InSAR, PSI
processing directory absolute path of the data processing
project start date date of the project’s start
project end date date of the project’s end (usually delivery’s date)
backup date of backup information on the medium (e.g. LTO, USB-disk, DVD),
date of backup the backup-ed data (e.g. SLC, InSAR, PSI) and
date of backup the backup operator (identification code is sufficient)
is continued ..
Data Availability and Feasibility
The data availability is briefly reported in the next section of the Quality Control Protocol. The
subject of this part is to prove the suitability of the data to monitor the testsite with its displacement
effects. The number of ordered scenes, the number of received scenes and the number of
processed scenes are reported in order to show the feasibility of the project. In case the monitoring
is not optimal these table entries provide the information on how to get additional data (e.g. by an
additional data order or by a more complicated processing including difficult scenes). The time
range of ordered data and the time range of available data describe the intended time range of
observation and the observable time range respectively. Together with the data gap in time the
observable displacement effect can be characterized. A high Doppler frequency can make single
acquisitions unusable. The number of scenes, their time range and the action taken (e.g. removed,
processed) are reported in the entry high Doppler frequency scenes. The time – baseline – plot
completes this information. It is a simple diagram of the used (not the available) data into a graph
where the x-axis describes the baseline in meters and the y-axis the time in years. The
visualization of different sensors, Doppler frequencies and absolute time is optional but
recommended. Fig. 6 provides an example for a time – baseline – plot. In each processing system
one scene is selected to provide the reference geometry and all the other scenes are coregistered
on this (super) master scene. The next table entry reports the orbit and the acquisition date of this
scene.
The table entry on SLA signed reports on the successful communication of the OSP (supplier) with
the customer (recipient). The last lines in this section are related to the overall feasibility of the
monitoring of the expected effect with the specified processing algorithm. The final compliance is
given by the feasibility of test site for PSI (D-InSAR / stacked InSAR) entry.

ESA GMES: Terrafirma C5: Service Validation Protocol August 2008: Version 3.4
Copyright NPA and Terrafirma collaborators 2004 63
Fig. 6: example for a time – baseline – plot of the processed data
number of ordered scenes number of ordered scenes e.g. 87
number of received scenes number of received scenes e.g. 87
number of processed scenes number of processed scenes e.g. 87
time range of ordered data intended observation time e.g. 1992 – 2004
time range of available data available observation time e.g. APR 1992 – AUG 2002
largest data gap in time data gap in time after removal of unusable scenes
second largest data gap in time e.g. APR 1993 – FEB 1994 (the data gap should be
third largest data gap in time significant related to the repeat cycle)

ESA GMES: Terrafirma C5: Service Validation Protocol August 2008: Version 3.4
Copyright NPA and Terrafirma collaborators 2004 64
high Doppler frequency scenes
number of scenes 1 of 87
time / time range AUG 2002
action 1 scene removed
time – baseline – plot image image similar to Fig. 6
(super) master scene e.g. orbit 20460, acquired March 20, 1999
SLA signed not applicable
expected effect unknown
feasibility of test site for
PSI (D-InSAR / stacked InSAR)
yes
Relevant Version
The section on the relevant versions allows to track the software versions of the main-subsystems
of the processing and provides the reference document versions. The reference documents are
important because they define the deliverables, the deliverable‟s format (Service Portfolio
Specifications) as well as the quality control deliverables and actions (Quality Control Protocol).
The documentation of the software versions is the basis for the correct and complete data
reprocessing. The granularity of the software version tracking depends on the OSP‟s processing
system. Each program used needs to have a unique software version (e.g. CVS version or by
compilation date). The OSP can bundle software into sub-systems (e.g. InSAR, PS-detection and
PSI) but needs to document these software package versions separately. Software which is likely
to change often (e.g. calibration software, SLC input modules) needs to be tracked separately. The
entry on the non standard processing allows to comment on experiments.
document / protocol / software item version
Quality Control Protocol this doc version e.g. Version 1.0 (11/01/2006)
Service Portfolio Specifications (S5) project’s version e.g. Version 4 (06/21/2006)
Processing Software Version
input reader version for ERS, ASAR, TS-X, ALOS reader
InSAR software version for InSAR package
PSI software version for PSI package
calibration version for ERS, ASAR, TS-X, ALOS calibration

ESA GMES: Terrafirma C5: Service Validation Protocol August 2008: Version 3.4
Copyright NPA and Terrafirma collaborators 2004 65
non standard processing comment on experiments e.g. not applicable
Processing
The following quality checks are on the single processing steps of the InSAR, D-InSAR, PSI
processing, scene calibration and PS- detection.
Missing Lines Check on SLCs
Even though the number of missing lines is reported in the SLC product this feature of the data
should be checked additionally by visual inspection. Therefore, the amplitude of each SLC needs to
be generated (with only little or no multi looking) and the resulting image is displayed (e.g. using
xv). Fig. 7 provides an example for the observed effect caused by missing lines. The scenes
amplitude degrades along a full range line and can even fade to zero. The phase stability, the
calibration and consequently the PS detection is affected by this data feature. Depending on the
location of the data corruption the effect needs to be classified into: severe, risky and insignificant.
The example of Fig. 7 is obviously insignificant because the testsite is not affected. The OSP can
decide what to do with the data but should report it (e.g. discard scene, mask area in scene, keep
scene). The next table provides an according example in the quality control protocol in the
processing section:
check result / comment date signat
ure
SLC missing lines check 0 severe / 0 risky / 87 Ok 11/08/2004 NA
severe: not applicable / deleted
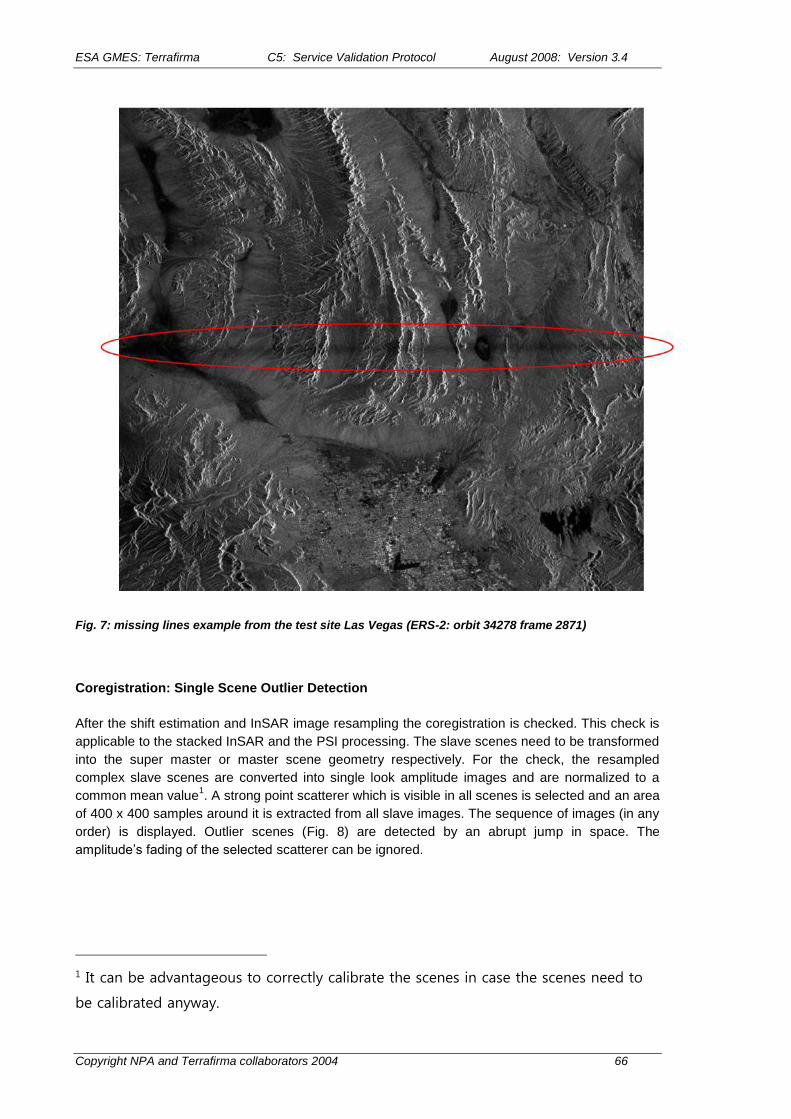
ESA GMES: Terrafirma C5: Service Validation Protocol August 2008: Version 3.4
Copyright NPA and Terrafirma collaborators 2004 66
Fig. 7: missing lines example from the test site Las Vegas (ERS-2: orbit 34278 frame 2871)
Coregistration: Single Scene Outlier Detection
After the shift estimation and InSAR image resampling the coregistration is checked. This check is
applicable to the stacked InSAR and the PSI processing. The slave scenes need to be transformed
into the super master or master scene geometry respectively. For the check, the resampled
complex slave scenes are converted into single look amplitude images and are normalized to a
common mean value1. A strong point scatterer which is visible in all scenes is selected and an area
of 400 x 400 samples around it is extracted from all slave images. The sequence of images (in any
order) is displayed. Outlier scenes (Fig. 8) are detected by an abrupt jump in space. The
amplitude‟s fading of the selected scatterer can be ignored.
1 It can be advantageous to correctly calibrate the scenes in case the scenes need to
be calibrated anyway.

ESA GMES: Terrafirma C5: Service Validation Protocol August 2008: Version 3.4
Copyright NPA and Terrafirma collaborators 2004 67
Fig. 8: left: correctly coregistered slave; right: severe example for a single scene outlier in coregistration. The
operator used invalid DEM data and caused the geometric shift estimation to fail. The outlier detection can detect
much more subtle misregistrations compared to this example.
There are different options to implement this check. The most simple is to use the UNIX image
viewer xview:
> xv -crop 800 3200 400 400 */AMPL_CAL.ras
The command above displays the 400 x 400 samples area around x0=1000 and y0=3000 of all
files AMPL_CAL.ras which are in the subdirectories below the current working directory. The
coordinate x0=1000 and y0=3000 is the expected position of the selected strong point scatterer. To
step through the images the operator needs to press the space key.
Another helpful option is to generate an MPEG animation from the extracted slave image chips.
The required UNIX tools (e.g. makempeg) are freely available. The order of the chips in time can be
easily build into the more automatic quality check. But the animation images need to be marked
with an identifier for the current scene (e.g. using IDL).
The next table entry provides an example for this quality check:
coregistration single scene
outlier
Ok 11/08/2004 NA
Coregistration: Systematic Error Detection
Interferometry requires sub-pixel accurate coregistration. This quality check detects systematic
offsets on the sub-pixel accuracy level. Outlier scenes need to be detected before this test (section
above). It is assumed that misregistered scenes are not removed from the processing. Instead they
are reprocessed with adapted coregistration parameters which can handle the scene‟s difficulties.
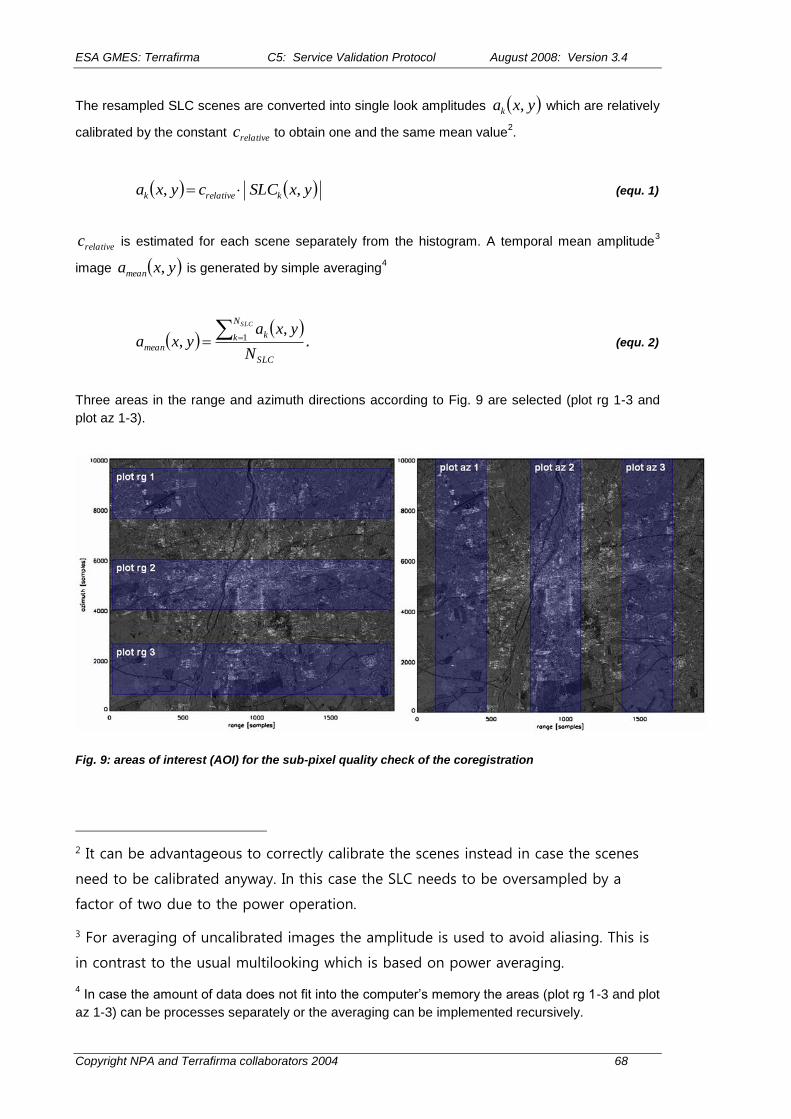
ESA GMES: Terrafirma C5: Service Validation Protocol August 2008: Version 3.4
Copyright NPA and Terrafirma collaborators 2004 68
The resampled SLC scenes are converted into single look amplitudes yxak , which are relatively
calibrated by the constant relativec to obtain one and the same mean value2.
yxSLCcyxa krelativek ,, (equ. 1)
relativec is estimated for each scene separately from the histogram. A temporal mean amplitude3
image yxamean , is generated by simple averaging4
SLC
N
k k
meanN
yxayxa
SLC
1,
, . (equ. 2)
Three areas in the range and azimuth directions according to Fig. 9 are selected (plot rg 1-3 and
plot az 1-3).
Fig. 9: areas of interest (AOI) for the sub-pixel quality check of the coregistration
2 It can be advantageous to correctly calibrate the scenes instead in case the scenes
need to be calibrated anyway. In this case the SLC needs to be oversampled by a
factor of two due to the power operation.
3 For averaging of uncalibrated images the amplitude is used to avoid aliasing. This is
in contrast to the usual multilooking which is based on power averaging.
4 In case the amount of data does not fit into the computer‟s memory the areas (plot rg 1-3 and plot
az 1-3) can be processes separately or the averaging can be implemented recursively.

ESA GMES: Terrafirma C5: Service Validation Protocol August 2008: Version 3.4
Copyright NPA and Terrafirma collaborators 2004 69
The areas should cover the project‟s area of interest. In each of these areas the point scatterers
are detected by the SCR or by a similar value yxSCRcrude , applying a spatial SCR estimation
(CEOS-method) based on the mean amplitude5.
dx dyN
dx
N
dy
mean
dydxmean
crude
dyydxxa
NNyxayxSCR
,
,, (equ. 3)
The sums in the denominator are on the blue areas shown in Fig. 10 which are traversed by the
indexes dx and dy . dxN and dyN are the number of samples which are integrated in each
direction.
Fig. 10: areas defined by CEOS to estimate the signal power of the dominant scatterer (inside the
green cross) and the clutter power (blue areas). The data are oversampled by a factor of four.
An oversampling is not necessary for this crude scatterer detection. The resulting image is similar
to Fig. 11. The coordinates integer, scattereryx of the area‟s point scatters are obtained by thresholding
the yxSCRcrude , or the yxSCR , .
thresholdscatterer yxSCRyx
,,
integer (equ. 4)
5 This SCR-value is used for detection only. Therefore, the crude estimation is possible
and allows an effective implementation and fast processing. Some misdetections do
not cause problems. Of course a standard SCR estimation can be applied just as well
and is more accurate.

ESA GMES: Terrafirma C5: Service Validation Protocol August 2008: Version 3.4
Copyright NPA and Terrafirma collaborators 2004 70
Fig. 11: SCR of the area ‘plot rg 1’. The point scatters are detected by simple thesholding. Bright dots
correspond to point scatterers which are visible in all SLCs.
Fig. 12: Green dots are the detected point scatterers in the area ‘plot rg 1’. The corresponding integer positions
are the starting points for the sub-pixel accurate peak determination of the scatterer’s point response. The peak
location provides the expected (true) scatterer location mean
scattereryx, and is compared with the sub-pixel
accurate peak location kscattereryx, of the same scatterer in each of the single SLCs (k is the SLC index).
These integer coordinates integer
scattereryx, are the starting points for the peak localisation in the mean
amplitude image yxamean , which is supported by a point target analysis (PTA).
integer
scatterermeanlocal
mean
scatterer yxayx ,maxarg, (equ. 5)

ESA GMES: Terrafirma C5: Service Validation Protocol August 2008: Version 3.4
Copyright NPA and Terrafirma collaborators 2004 71
Fig. 13: peak localisation by a routine which finds the local peak starting from integer coordinates
eger
scattereryxint
, and providing the sub-pixel accurate peak coordinate mean
scattereryx, . The red line is the path of the
algorithm to find the local peak (steepest ascent).
The same peak localisation is performed for each single SLC amplitude image yxak , with
SLCNk 1
integer
scattererklocal
k
scatterer yxayx ,maxarg, . (equ. 6)
The coregistration error of the SLC with index k in range x and azimuth y can be assessed
by
kscatterer
mean
scatterer
kyxyxyx ,,, . (equ. 7)
The radial error is:
22 yxr . (equ. 8)

ESA GMES: Terrafirma C5: Service Validation Protocol August 2008: Version 3.4
Copyright NPA and Terrafirma collaborators 2004 72
These shift errors x , y and r are plotted with respect to the range coordinate x for the areas
„plot rg 1-3‟ and with respect to the azimuth coordinate y for the areas „plot az 1-3‟. Fig. 14 and
Fig. 15 show the estimated errors for the „plot rg 1‟ area. The green line indicates the ideal case for
the error. The red line is the mean coregistration error in units of SLC pixels. The example shows a
coregistration accuracy of 0.2 samples and better for this area. These plots need to be created and
permanently stored on disk. The path to and the filenames of the plot images are reported in the
quality protocol.
Fig. 14: coregistration error in range in units of one sample depending on the range position.

ESA GMES: Terrafirma C5: Service Validation Protocol August 2008: Version 3.4
Copyright NPA and Terrafirma collaborators 2004 73
Fig. 15: coregistration error in azimuth in units of one sample depending on the range position.
Fig. 16: detectable coregistration error by the described method which is visible in the coherence images
above.
The following table entry reports on the described check of the systematic coregistration error. It
provides the location on the disk of the generated error plots for each SLC scene.
coregistration systematic /SANexport/tvsp02/InSAR/MUNICH/QC 11/08/2004 NA
ESA GMES: Terrafirma C5: Service Validation Protocol August 2008: Version 3.4
Copyright NPA and Terrafirma collaborators 2004 74
error plot_orbit_rg_[1-3].tif; plot_orbit_az_[1-3].tif
Orbit Trend and APS Check
After the D-InSAR processing only displacement, atmosphere, orbit and noise contribute
dominantly to the interferometric phase. This check is a visual inspection of the single
interferograms and can be applied in the course of the PSI and stacked InSAR processing.
Each differential interferogram is displayed on screen by the operator. Fig. 17 provides examples
for the different effects which can typically be observed. The operator checks for the dominant
phase contribution and reports it. The created list can be a simple text file (e.g. contributions.txt)
and is not a delivery. But the number of scenes which have been assigned to the different types of
contributions is part of the quality control protocol.
It can be an indicator for the not optimal master scene selection if nearly every scene is affected by
the same strong effect. It does not matter if it is atmosphere, noise, an orbit phase ramp or a large
missing data area. In such a case the master scene selection should be verified and changed
accordingly.
A delivery item in the Quality Control protocol is an overview of all differential interferograms which
are sorted according to the distance of the absolute baseline. Fig. 18 provides an example for such
a quicklook image (deliverable: dinsar_quicklook.tif). The directory and the filename of the image
need to be noted in the APS and orbit trend check comment field. In case the interferograms are
generated without spectral shift filtering (which is the standard in the PS processing) the coherence
should decrease with the absolute baseline. Exceptions are possible due to high Doppler
frequencies and heavy weather conditions during the acquisitions and should be checked.
It follows an example entry in the Quality Control protocol for this APS and orbit trend check:
APS and orbit trend check /SANexport/tvsp02/InSAR/MUNICH/QC
contributions.txt dinsar_quicklook.tif
11/08/2004 NA

ESA GMES: Terrafirma C5: Service Validation Protocol August 2008: Version 3.4
Copyright NPA and Terrafirma collaborators 2004 75
Fig. 17: examples for different dominant contributions to the interferometric phase

ESA GMES: Terrafirma C5: Service Validation Protocol August 2008: Version 3.4
Copyright NPA and Terrafirma collaborators 2004 76
Fig. 18: D-InSAR quicklooks sorted with respect to absolute effective baseline. The coherence should
decrease from top left to the lower right. Exceptions are possible due to high Doppler frequencies and
heavy weather conditions during the acquisitions and should be checked. (deliverable:
dinsar_quicklook.tif)
Coherence Images
ESA GMES: Terrafirma C5: Service Validation Protocol August 2008: Version 3.4
Copyright NPA and Terrafirma collaborators 2004 77
For stacked InSAR processing the coherence map has a meaning and is related to the
interferometric phase accuracy. For the point scatterer based techniques this entry is not applicable
because the phase stability needs to be estimated by the SCR. The coherence images are a
delivery for each interferogram (coherence_orbit.tif). The estimation window size needs to be
reported and should provide enough samples in order to reduce the underestimation and the
variance of the coherence. Details are reported in [R8]. An example for the coherence image
section in the Quality Control protocol follows:
coherence images estimation window (az x rg): 20 x 4 samples
/SANexport/tvsp02/InSAR/MUNICH/QC
coherence_orbit.tif
11/08/2004 NA
Single Scene Phase Unwrapping
Depending on the applied phase unwrapping method an error is propagated differently over the
image. Branch Cut Methods can have large areas affected whereas Least Squares Methods may
cause local spikes and a global phase bias (missing fringes). The phase inconsistencies in the
interferograms can be reported by the residues. Therefore the residues are calculated and plotted
into the relative phase image. The charge of the residue is indicated by coloured dots (e.g. green
and red). This residue visualisation does not show the error of the phase unwrapping but the
difficulty of the actual interferogram. In case a Branch Cut Method is used the branch cuts need to
be plotted into the residue image. Fig. 19 provides an example for the scene phase unwrapping
delivery if applicable.
The entry for the scene phase unwrapping can have the following form for the PSI technique:
scene phase unwrapping not applicable 11/08/2004 NA
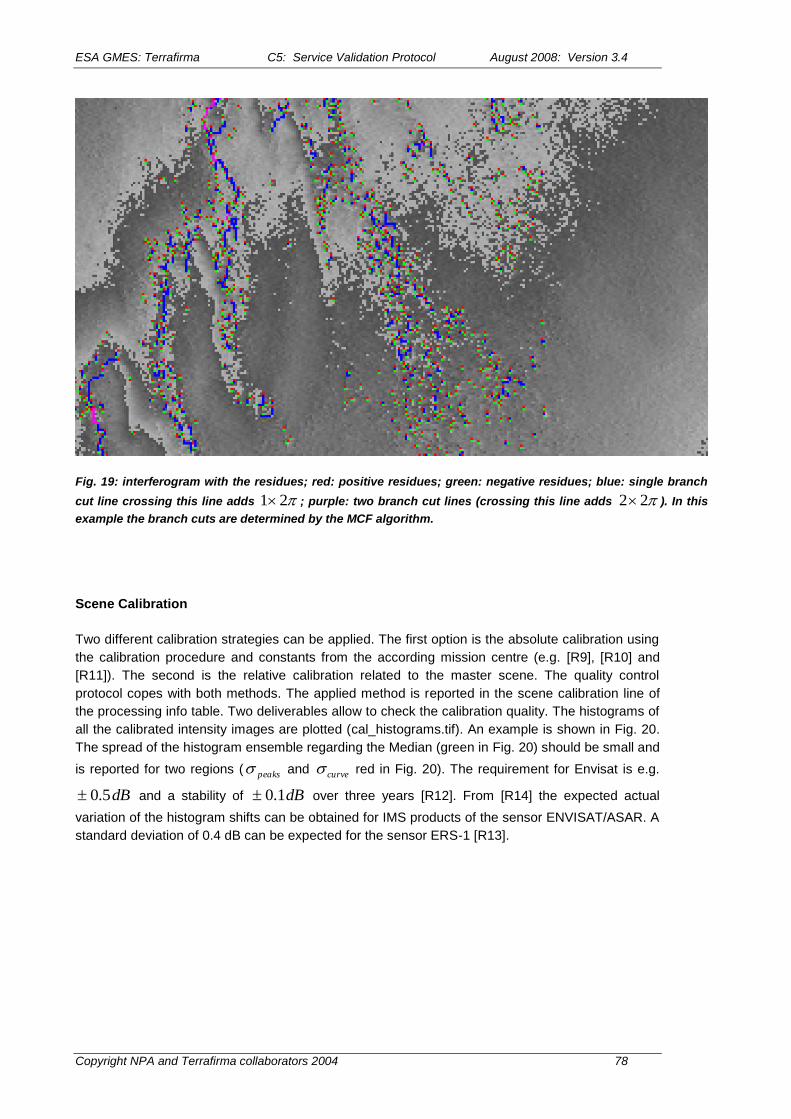
ESA GMES: Terrafirma C5: Service Validation Protocol August 2008: Version 3.4
Copyright NPA and Terrafirma collaborators 2004 78
Fig. 19: interferogram with the residues; red: positive residues; green: negative residues; blue: single branch
cut line crossing this line adds 21 ; purple: two branch cut lines (crossing this line adds 22 ). In this
example the branch cuts are determined by the MCF algorithm.
Scene Calibration
Two different calibration strategies can be applied. The first option is the absolute calibration using
the calibration procedure and constants from the according mission centre (e.g. [R9], [R10] and
[R11]). The second is the relative calibration related to the master scene. The quality control
protocol copes with both methods. The applied method is reported in the scene calibration line of
the processing info table. Two deliverables allow to check the calibration quality. The histograms of
all the calibrated intensity images are plotted (cal_histograms.tif). An example is shown in Fig. 20.
The spread of the histogram ensemble regarding the Median (green in Fig. 20) should be small and
is reported for two regions ( peaks and curve red in Fig. 20). The requirement for Envisat is e.g.
dB5.0 and a stability of dB1.0 over three years [R12]. From [R14] the expected actual
variation of the histogram shifts can be obtained for IMS products of the sensor ENVISAT/ASAR. A
standard deviation of 0.4 dB can be expected for the sensor ERS-1 [R13].
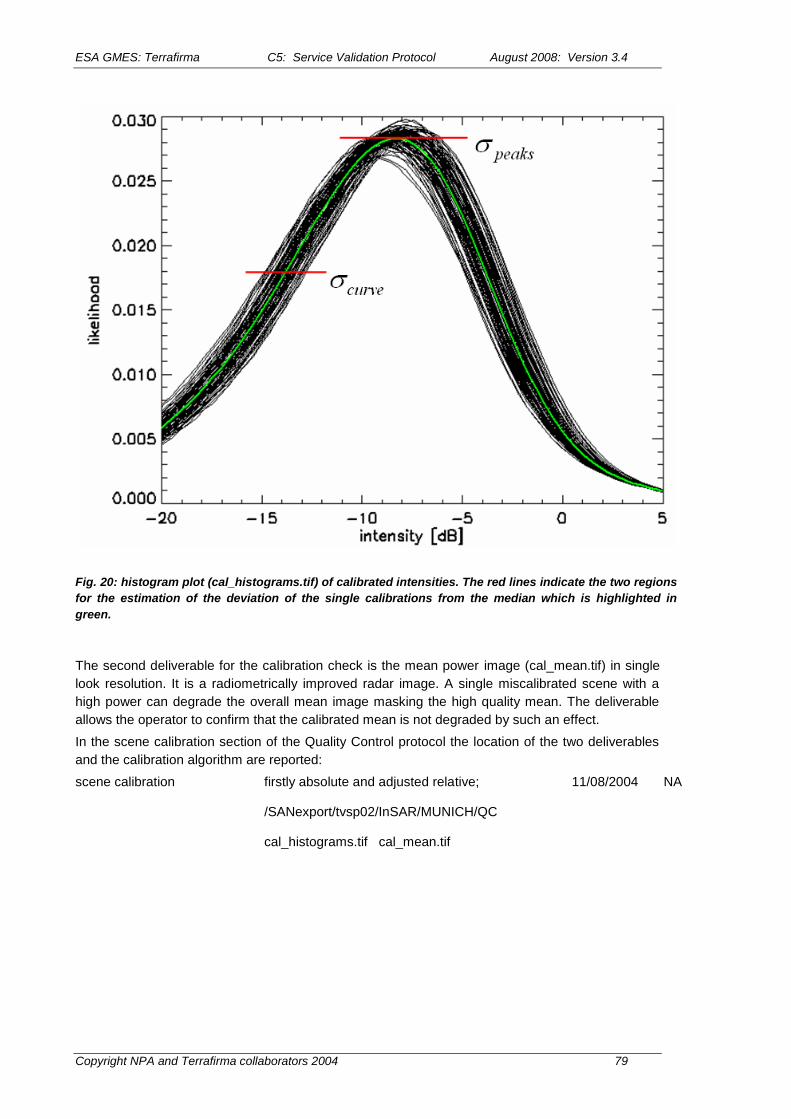
ESA GMES: Terrafirma C5: Service Validation Protocol August 2008: Version 3.4
Copyright NPA and Terrafirma collaborators 2004 79
Fig. 20: histogram plot (cal_histograms.tif) of calibrated intensities. The red lines indicate the two regions
for the estimation of the deviation of the single calibrations from the median which is highlighted in
green.
The second deliverable for the calibration check is the mean power image (cal_mean.tif) in single
look resolution. It is a radiometrically improved radar image. A single miscalibrated scene with a
high power can degrade the overall mean image masking the high quality mean. The deliverable
allows the operator to confirm that the calibrated mean is not degraded by such an effect.
In the scene calibration section of the Quality Control protocol the location of the two deliverables
and the calibration algorithm are reported:
scene calibration firstly absolute and adjusted relative;
/SANexport/tvsp02/InSAR/MUNICH/QC
cal_histograms.tif cal_mean.tif
11/08/2004 NA

ESA GMES: Terrafirma C5: Service Validation Protocol August 2008: Version 3.4
Copyright NPA and Terrafirma collaborators 2004 80
Fig. 21: left: one look high quality calibrated mean power (cropped of the deliverable cal_mean.tif); right:
single calibrated scene (same croped area);
PS Detection
The PS detection should be based on the SCR. This is the reason the Quality Protocol assumes an
estimated SCR is available regardless of the used method ([R6], [R7]). Consequently, an estimated
phase stability of the detected scatterers can be reported. The SCR is transformed into the
expected phase standard deviation by the approximation
SCR
2
1 . (equ. 9)
The histogram showing the frequency of the detected PS‟s expected phase error is a
deliverable. Fig. 22 shows an example (psc_histogram.tif).
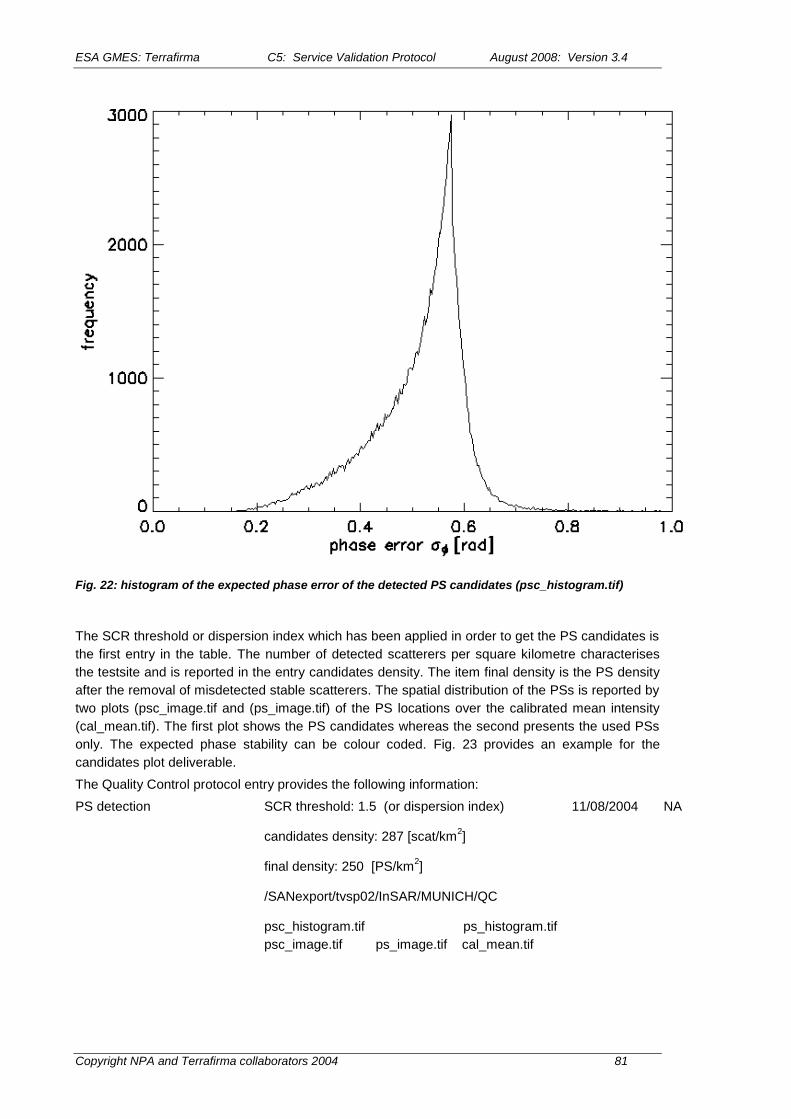
ESA GMES: Terrafirma C5: Service Validation Protocol August 2008: Version 3.4
Copyright NPA and Terrafirma collaborators 2004 81
Fig. 22: histogram of the expected phase error of the detected PS candidates (psc_histogram.tif)
The SCR threshold or dispersion index which has been applied in order to get the PS candidates is
the first entry in the table. The number of detected scatterers per square kilometre characterises
the testsite and is reported in the entry candidates density. The item final density is the PS density
after the removal of misdetected stable scatterers. The spatial distribution of the PSs is reported by
two plots (psc_image.tif and (ps_image.tif) of the PS locations over the calibrated mean intensity
(cal_mean.tif). The first plot shows the PS candidates whereas the second presents the used PSs
only. The expected phase stability can be colour coded. Fig. 23 provides an example for the
candidates plot deliverable.
The Quality Control protocol entry provides the following information:
PS detection SCR threshold: 1.5 (or dispersion index)
candidates density: 287 [scat/km2]
final density: 250 [PS/km2]
/SANexport/tvsp02/InSAR/MUNICH/QC
psc_histogram.tif ps_histogram.tif
psc_image.tif ps_image.tif cal_mean.tif
11/08/2004 NA

ESA GMES: Terrafirma C5: Service Validation Protocol August 2008: Version 3.4
Copyright NPA and Terrafirma collaborators 2004 82
Fig. 23: example (small area) for the PS candidates plot (psc_image.tif).
DEM Update Unwrapping Test
The measurements of the DEM update are relative estimates between two PSs only. These
estimates are performed in a network and consequently the absolute DEM update can be obtained
by integration. This network is irregularly sampled in space and should be redundant in order to
minimise the error propagation. But similar to conventional InSAR phase unwrapping the smallest
meshes need to be free of residuals. Integration errors would be the consequence and a global
under estimation can result in case of noticeable residues. In case of this irregular sampling the
smallest meshes are triangle loops. Due to the redundant network these smallest triangles need to
be determined e.g. by a simple triangulation (the different resolution in range and azimuth should
be considered). But the triangle arcs should still represent available relative estimates. In the
obtained triangle loops the residuals are calculated by directed adding of the three single relative
estimates. These residuals should be small and can be plotted similar to Fig. 24 (colour scale -1.5
m to +1.5 m). The residues plot image is considered a deliverable even in case the DEM update
estimates are not integrated in the course of the processing. It provides useful information on the
relative estimation outlier.
The entry of the DEM Update Unwrapping provides the location of the residues image:
DEM Update Unwrapping /SANexport/tvsp02/InSAR/MUNICH/QC
topo_residuals.tif
11/08/2004 NA
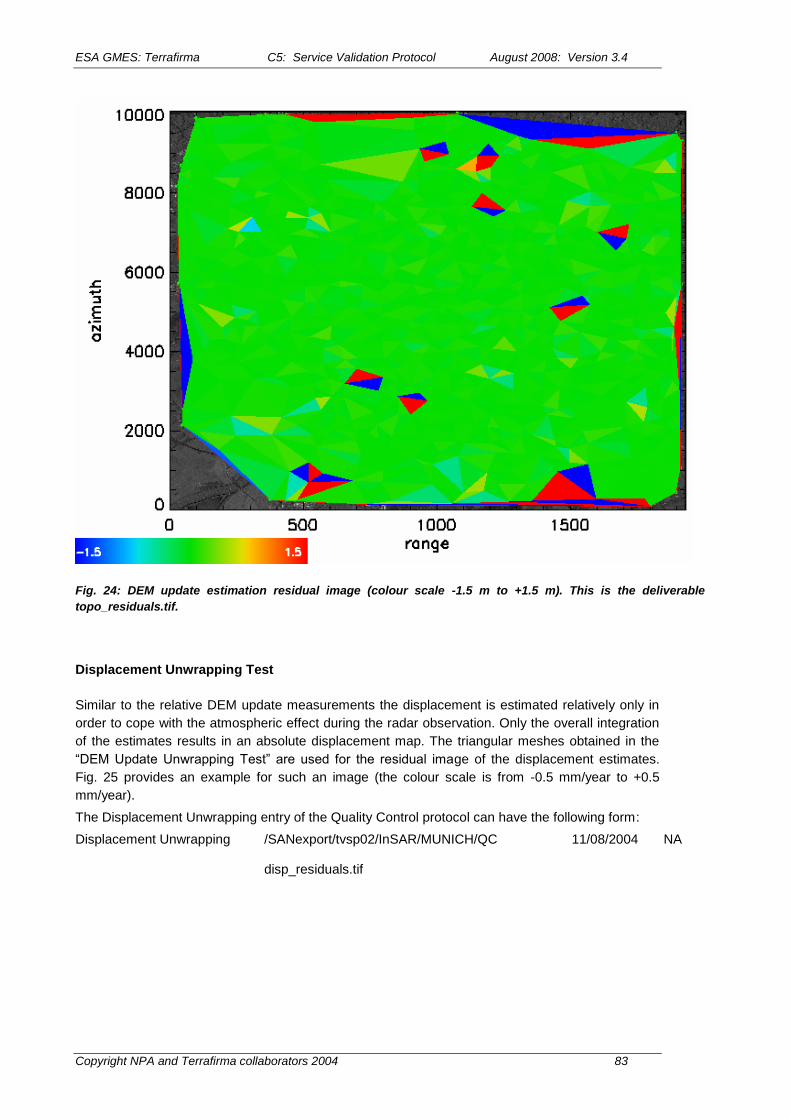
ESA GMES: Terrafirma C5: Service Validation Protocol August 2008: Version 3.4
Copyright NPA and Terrafirma collaborators 2004 83
Fig. 24: DEM update estimation residual image (colour scale -1.5 m to +1.5 m). This is the deliverable
topo_residuals.tif.
Displacement Unwrapping Test
Similar to the relative DEM update measurements the displacement is estimated relatively only in
order to cope with the atmospheric effect during the radar observation. Only the overall integration
of the estimates results in an absolute displacement map. The triangular meshes obtained in the
“DEM Update Unwrapping Test” are used for the residual image of the displacement estimates.
Fig. 25 provides an example for such an image (the colour scale is from -0.5 mm/year to +0.5
mm/year).
The Displacement Unwrapping entry of the Quality Control protocol can have the following form:
Displacement Unwrapping /SANexport/tvsp02/InSAR/MUNICH/QC
disp_residuals.tif
11/08/2004 NA

ESA GMES: Terrafirma C5: Service Validation Protocol August 2008: Version 3.4
Copyright NPA and Terrafirma collaborators 2004 84
Fig. 25: displacement estimation residual image (colour scale -0.5 mm/year to +0.5 mm/year). This is the
deliverable disp_residuals.tif.
Visualisations
The visualisation of the estimated parameters e.g. the “raster of interpolated average annual
displacement rates“ is a deliverable according to [R1]. For the visualisation the estimates can be
filtered regarding outliers on the expense of spatial resolution and density of measurements. The
visualisation filtering and its parameters should be reported in the section Visualisation of the
Quality Control Protocol:
check result / comment date signat
ure
displacement map triangulation interpolation no extra filter
/SANexport/tvsp02/InSAR/MUNICH/DELIVERABLES
displ_map_1995.tif .. displ_map_2001.tif
11/08/2004 NA

ESA GMES: Terrafirma C5: Service Validation Protocol August 2008: Version 3.4
Copyright NPA and Terrafirma collaborators 2004 85
Fig. 26: two different displacement visualisations of one and the same estimation. left: no visualisation filter
results in high PS density but some outliers. right: visualization of the best estimate in an area of 100 m x 100
m only which reduces the PS density but removes the noise.
Expected Accuracy
This section adds an overview on the overall quality of the estimated displacement, height and
geolocation. The table entry coherence map provides the location of the coherence image. This is
an overlay of the full resolution radiometrically improved intensity and the coherence of each single
estimation. The coherence is defined as:
N
i
j iifgrmie
N 1
mod1
. (equ.
10)

ESA GMES: Terrafirma C5: Service Validation Protocol August 2008: Version 3.4
Copyright NPA and Terrafirma collaborators 2004 86
N is the number of interferograms, ifgrm
i and
mod
i are the phase of the i-th interferogram and the
respective modelled phase. The modelled phase is the sum of the respective estimated DEM-
update phase topo
i , the displacement phase defo
i and APS phase atmo
i :
atmo
i
topo
i
defo
ii mod. (equ.
11)
Fig. 27 provides an example for the coherence map deliverable.
The next entry provides the geolocation accuracy which can be obtained from the available Ground
Control Points (GCP). The accuracy and number of the GCPs and the ability to connect this point
to the used permanent scatterers as well as the accuracy of the absolute height estimation
influence this parameter. The table line correction due to GCP(s) provides the applied shift of the
scene to match the reference points.
The absolute height accuracy provides the expected error on the total height measurement. It
depends similarly to the previous table entry on the accuracy and number of the GCPs and the
ability to connect this point to the used permanent scatterers.
The ambiguities entry informs on the ambiguities which can remain in the data in the case of a
simple D-InSAR processing. E.g. the displacement ambiguity of 2.8 cm per fringe can be reported
or the ambiguity between a vertical and horizontal displacement if it is relevant.
The displ. estimation accuracy provides the expected error on the final displacement estimates. It
can be assumed that the applied model describes the data. Therefore it can be derived from the
temporal coherence.
The following Quality Control Protocol segment provides an example for the Expected Accuracy
section:
check result / comment date signat
ure
coherence map /SANexport/tvsp02/InSAR/MUNICH/QC
coh_map.tif
11/08/2004 NA
geolocation accuracy 25 m 11/08/2004 NA
correction due to GCP(s) azimuth: -13.05 m
range: 60.91 m
11/08/2004 NA
absolute height accuracy 10 m 11/08/2004 NA
ambiguities not applicable 11/08/2004 NA
displ. estimation accuracy +/-1 mm/year assuming linear displacement 11/08/2004 NA
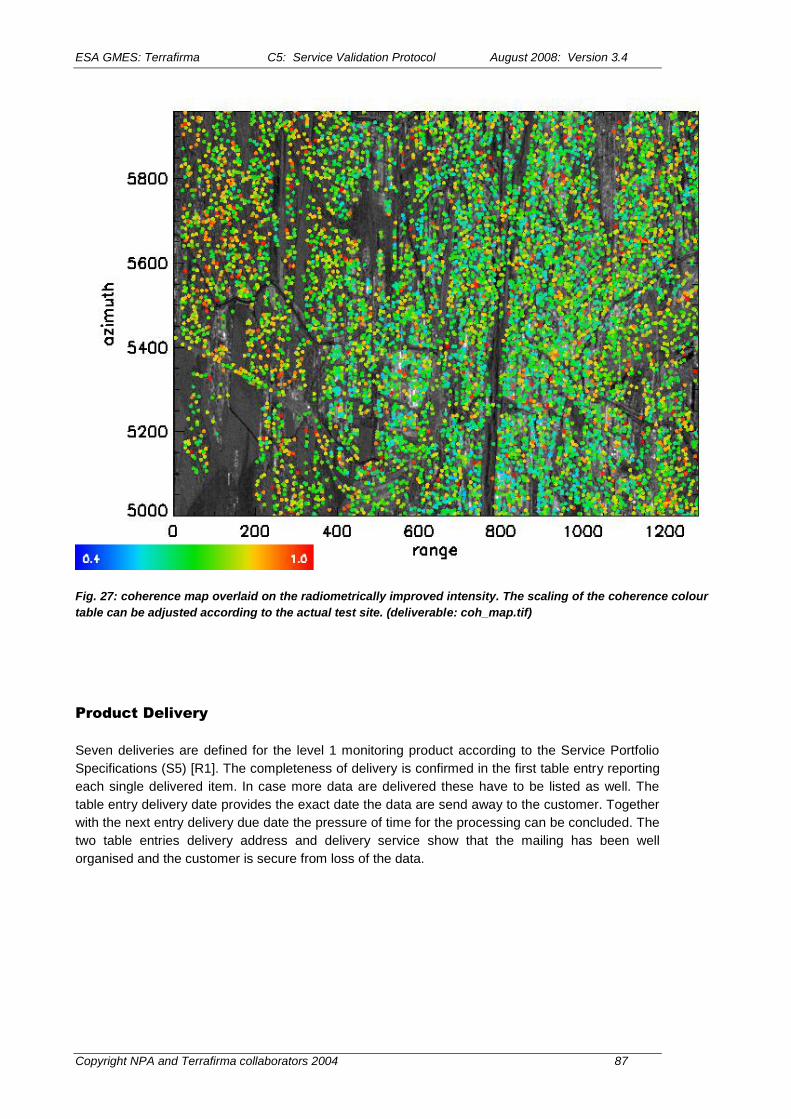
ESA GMES: Terrafirma C5: Service Validation Protocol August 2008: Version 3.4
Copyright NPA and Terrafirma collaborators 2004 87
Fig. 27: coherence map overlaid on the radiometrically improved intensity. The scaling of the coherence colour
table can be adjusted according to the actual test site. (deliverable: coh_map.tif)
Product Delivery
Seven deliveries are defined for the level 1 monitoring product according to the Service Portfolio
Specifications (S5) [R1]. The completeness of delivery is confirmed in the first table entry reporting
each single delivered item. In case more data are delivered these have to be listed as well. The
table entry delivery date provides the exact date the data are send away to the customer. Together
with the next entry delivery due date the pressure of time for the processing can be concluded. The
two table entries delivery address and delivery service show that the mailing has been well
organised and the customer is secure from loss of the data.

ESA GMES: Terrafirma C5: Service Validation Protocol August 2008: Version 3.4
Copyright NPA and Terrafirma collaborators 2004 88
check result / comment date signat
ure
completeness of delivery 1. Database of PSI average annual displ. rates
2. Database of PSI time-series
3. Reference point table
4. Processing report (metadata)
5. Background reference image
6. Img of interpolated average annual displ. rates
7. Quality control sign-off
12/08/2004 NA
delivery date not applicable (could be 14/08/2004) 12/08/2004 NA
delivery due date not applicable (could be T0 + 2 months) 12/08/2004 NA
delivery address not applicable (could be post or ftp address) 12/08/2004 NA
delivery service not applicable (could be DHL or ftp)
ESA GMES: Terrafirma C5: Service Validation Protocol August 2008: Version 3.4
Copyright NPA and Terrafirma collaborators 2004 89
FEEDBACK OF OSPS
This section lists the concerns and question of the OSPs regarding the quality control protocol. For
clarity the main issues are extracted merely and an answer or an explanatory statement is provided
to each single concern. Excerpts from the feedback documents are indicated by blue coloured
paragraphs. The subsequent general comment applies to all feedbacks: The entry not applicable is
explicitly allowed in the QCP table. In case alternative information is available it is recommended to
provide it.
Feedback by TRE
This section is related to the feedback document from the 4th of December 2007.
“The TRE display programs output in 8-bit jpeg format, which must be converted to 8-bit TIFF.”
The output image can be provided in any standard, publicly accepted and available image format
(e.g. PNG, JPEG and TIFF). It is recommended that
the images should be displayable with freely available tools independent from the used hardware and operating system and
one and the same image format is used throughout the QCP of one delivery.
The end user should not be confronted with file format conversion or license problems. I.e. LZH
compression is to be avoided. Using the jpeg-format is fine. I recommend to provide high quality
images reducing the compression.
“We produce a jpeg image for each differential.”
This is perfect. I recommend to add a line in the respective QCP table which refers to the names of
the files or at least provides the naming convention and the location (i.e. the subdirectory on disk)
of the files.
Feedback by Altamira
This section is related to the feedback document from the 30th of November 2007 by David Alboil
and Geraint Cooksley.
“PS detection is not made by SCR, but used thresholds and ps densities recorded.”
A not relevant entry is foreseen to be visible as to be not applicable. The SCR threshold for the PS
detection has been chosen due to its known and usable relation to the expected phase precision.
The reporting of alternative information e.g. applied thresholds is a good idea. However, the end
user finally needs to understand or at least needs to get a good impression how the used threshold
is related to the expected phase stability of a single PS. At the moment, the algorithmic basis for
your PS detection is unfortunately not disclosed. I.e. key information is missing and the provided
values could be of no use to the end user. You could provide the relation between the actual values
(on which a threshold is applied in a later step) and the finally estimated phase stability e.g. given
by the coherence. This missing relation can be derived from theory or alternatively you can create
a scatter plot between your predicted phase stability and the finally estimated values. Fig. 28
provides an example from DLR‟s PSI-GENESIS system. The scatter plot shows the relation
between the predicted coherence (i.e. phase stability) and the finally achieved coherence for each
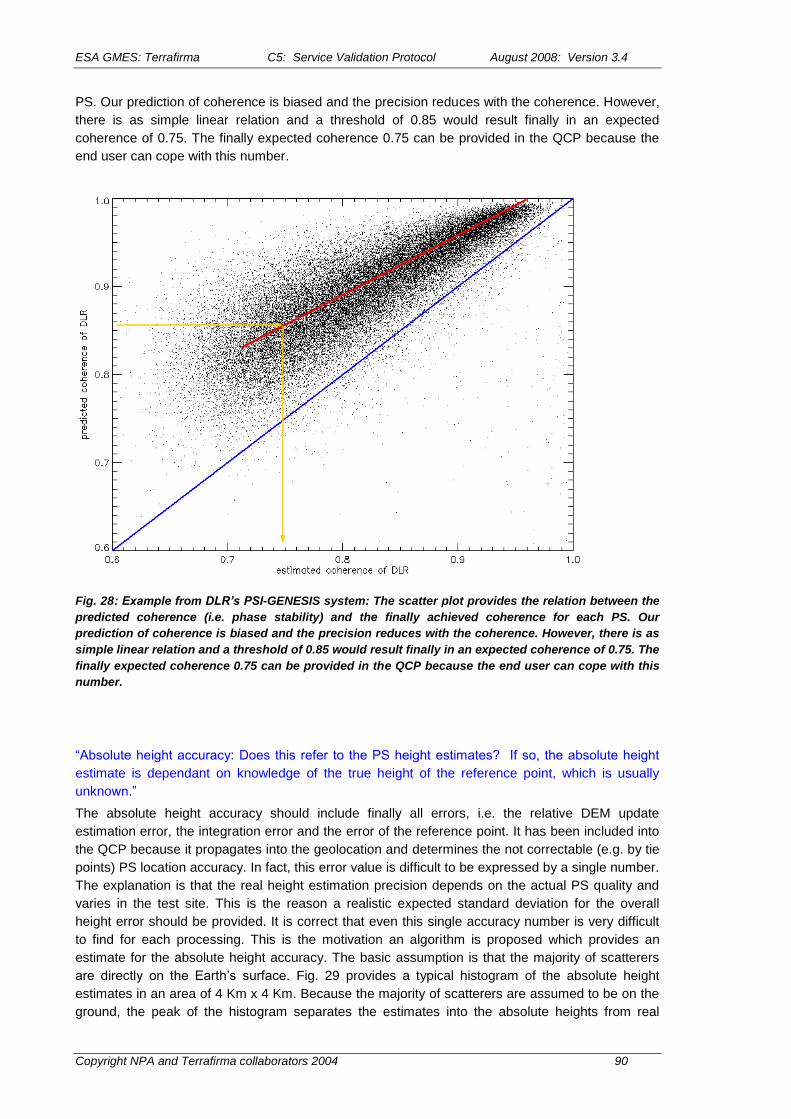
ESA GMES: Terrafirma C5: Service Validation Protocol August 2008: Version 3.4
Copyright NPA and Terrafirma collaborators 2004 90
PS. Our prediction of coherence is biased and the precision reduces with the coherence. However,
there is as simple linear relation and a threshold of 0.85 would result finally in an expected
coherence of 0.75. The finally expected coherence 0.75 can be provided in the QCP because the
end user can cope with this number.
Fig. 28: Example from DLR’s PSI-GENESIS system: The scatter plot provides the relation between the
predicted coherence (i.e. phase stability) and the finally achieved coherence for each PS. Our
prediction of coherence is biased and the precision reduces with the coherence. However, there is as
simple linear relation and a threshold of 0.85 would result finally in an expected coherence of 0.75. The
finally expected coherence 0.75 can be provided in the QCP because the end user can cope with this
number.
“Absolute height accuracy: Does this refer to the PS height estimates? If so, the absolute height
estimate is dependant on knowledge of the true height of the reference point, which is usually
unknown.”
The absolute height accuracy should include finally all errors, i.e. the relative DEM update
estimation error, the integration error and the error of the reference point. It has been included into
the QCP because it propagates into the geolocation and determines the not correctable (e.g. by tie
points) PS location accuracy. In fact, this error value is difficult to be expressed by a single number.
The explanation is that the real height estimation precision depends on the actual PS quality and
varies in the test site. This is the reason a realistic expected standard deviation for the overall
height error should be provided. It is correct that even this single accuracy number is very difficult
to find for each processing. This is the motivation an algorithm is proposed which provides an
estimate for the absolute height accuracy. The basic assumption is that the majority of scatterers
are directly on the Earth‟s surface. Fig. 29 provides a typical histogram of the absolute height
estimates in an area of 4 Km x 4 Km. Because the majority of scatterers are assumed to be on the
ground, the peak of the histogram separates the estimates into the absolute heights from real

ESA GMES: Terrafirma C5: Service Validation Protocol August 2008: Version 3.4
Copyright NPA and Terrafirma collaborators 2004 91
scatterers above the Earth and results which are caused by errors and result from the scatterers
directly on ground. Finally, it is the left (not causal) part of the histogram which is used to derive an
estimate for the absolute height error. The algorithm is in principle the following: For each PS the
likelihood function is estimated from a histogram generated in an appropriate area (in the
Amsterdam and Alkmaar test site 4 Km x 4 Km are suitable because the area is flat). I.e. the
histogram of absolute height estimates similar to Fig. 29 is calculated. The peak in this function is
determined and the histogram is converted into a likelihood function of the height error. For this
reason the measurements on the right hand side of the peak are removed and the total number of
remaining measurements on the left leftN is determined. The height axis is converted into a high
error axis by setting the height value at the peak to zero. i.e. the axis of abscissae is added by
groundh . Assuming a typical Gaussian error distribution the likelihood function needs to be
symmetric and the left half errleft hp of the wanted likelihood function is obtained by normalising
the histogram with the twice the number of total measurements.
left
groundabs
errleftN
hhhistogramhp
2
The standard deviation results from the integration (practically the summation)
err
m
m
errlefterrh hdhpherr
][0
][20
22
The un-symmetric integration is possible due to the normalization of the likelihood function to an
area of 0.5, the factor of two and the symmetry assumption.
The proposed algorithm has been implemented and tested on the data provided in the course of
the Terrafirma process validation project. Results are shown subsequently.

ESA GMES: Terrafirma C5: Service Validation Protocol August 2008: Version 3.4
Copyright NPA and Terrafirma collaborators 2004 92
Fig. 29: typical likelihood function (histogram) of the absolute height estimates in an area of 4 Km x 4
Km.
Fig. 30 shows the estimated likelihood functions for the Amsterdam ASAR test site from the
Terrafirma validation project. An estimation area of 4000m x 4000m is used around each PS. The
following table lists the estimated height error standard deviations for the different OSPs:
height error variance height error standard deviation
DLR 3.93 m2 1.98 m
OSP A 8.08 m2 2.84 m
OSP B 4.02 m2 2.01 m
OSP C 15.85 m2 3.98 m
OSP D 16.96 m2 4.12 m
The estimated standard deviations from these likelihood functions correlate well with the relative
DEM update precisions found in the validation.
ground
estimates by scatterers above ground estimates by scatterers
on ground
abs. height error 0 [m]
hground

ESA GMES: Terrafirma C5: Service Validation Protocol August 2008: Version 3.4
Copyright NPA and Terrafirma collaborators 2004 93
Fig. 30: estimated error likelihood functions for the Amsterdam ASAR test site from the Terrafirma
validation project. green: DLR, red: OSP A, black: OSP B, dark blue: OSP C, light blue: OSP D. The
estimated standard deviations from these likelihood functions correlate well with the precisions found
in the validation.
Fig. 31 shows the estimated likelihood functions for the Alkmaar ASAR test site from the Terrafirma
validation project. An estimation area of 4000m x 4000m is used around each PS. The following
table lists the estimated height error standard deviations for the different OSPs:
height error variance height error standard deviation
DLR 4.19 m2 2.04 m
OSP A 7.22 m2 2.69 m
OSP B 3.77 m2 1.94 m
OSP C 15.20 m2 3.90 m
OSP D 19.93 m2 4.46 m

ESA GMES: Terrafirma C5: Service Validation Protocol August 2008: Version 3.4
Copyright NPA and Terrafirma collaborators 2004 94
Fig. 31: estimated error likelihood functions for the Alkmaar ASAR test site from the Terrafirma
validation project. green: DLR, red: OSP A, black: OSP B, dark blue: OSP C, light blue: OSP D. The
estimated standard deviations from these likelihood functions correlate well with the precisions found in
the validation.
The derived precisions are also confirmed by the Terrafirma process validation. Integration errors
are included as long as these are significantly smaller in dimension compared to the estimation
window size for the likelihood function. This is typically a given condition for least squares
integration errors. In case of global integration errors (e.g. resulting from straightforward path
following algorithms) the height offset error is eliminated by the ground height estimation. The
absolute height error is underestimated in this particular case. However, a global integration error
should be detected by the QC and removed. For this reason, a new algorithm for the detection of
integration errors caused by path following algorithms is proposed in another section.
“Displ. estimation accuracy: Should be called Expected error / confidence interval of the
measurement; accuracy implies ground truth.”
Ground truth data can be avoided. Similar to the estimation of the absolute height error the
absolute deformation estimation precision can be measured from the data. The likelihood function
of the deformation error is estimated in a zero deformation area. Such zero deformation areas can
often be found by visual inspection of the final estimate‟s deformation map. The error estimation is
ESA GMES: Terrafirma C5: Service Validation Protocol August 2008: Version 3.4
Copyright NPA and Terrafirma collaborators 2004 95
simplified compared to the described algorithm above by the fact that the complete error likelihood
function can be estimated.
Feedback by Gamma RS
This section is related to the feedback document from 5th of December 2007 by Urs Wegmüller.
“To better suite the different processing chains of the OSP it is, in my opinion, important to use a
more hierarchic structure for the QCP. The QCP element 4.4 should be better structured. At
present it is a list of some quite detailed tests (e.g. missing line detection). Such tests are very
often only relevant for one Processing chain but not for another.
The missing line check is a good example for a test which is applicable to each processing system.
The missing information can not be recovered and a phase quality degrading results also in case of
a self implemented focussing. Not relevant tests can get the entry not applicable in the QCP.
The modified structure should identify the relevant larger QC elements. For the early processing it
is quite clear how this can be done, e.g.:
- input data QC
- SLC co-registration QC
For the main part of the processing this is much more difficult to do as the steps used by the OSP
differ, the order differ, and critical aspects which would be good to be checked are different. One
possible solution could be to keep this part very general and leave most of the responsibility with
the OSP.QCP element 4.4 should be better structured .. One possible solution could be to keep
this part very general and leave most of the responsibility with the OSP.”
The order to finalize the QCP is not important however the completeness is. The actually
developed QCP provides a practical tradeoff between complexity and comprehensiveness (i.e.
implementation effort on the OSP side) and the end user requirements. The comparability of the
QC outputs is key for the end user in order to get a good feeling on the quality of the delivered
data. To keep the QCP more general and leave the responsibility with the OSP is not an option.
This is clearly in contrast to the Terrafirma validation result.
“coherence” or “phase standard deviation” is not clear enough because it depends very much from
what phases it is estimated (e.g. before or after atmosphere removal?).
Equation 10 defines the coherence. It is in this form generally applicable. All estimated parameters
can be included and it is expected that the different OSPs can apply different models. In case the
APS is estimated it needs to be included into the model.
The coherence is also intended to be a relative quality measure. I.e. the PSs within a test site can
be ordered according to their quality.
Pages 20-27, 4.4.2, 4.4.2: we map the entire offset field to check the registration which is a
different (but likely better) approach. Our approach for this is not based on point scatterers. The co-
registration accuracy is characterized in our case by the standard deviation of the offset estimates

ESA GMES: Terrafirma C5: Service Validation Protocol August 2008: Version 3.4
Copyright NPA and Terrafirma collaborators 2004 96
from the polynomial function used in the refinement. Offset fields and the offset regression
determined for the already co-registered SLCs are typically also available.
Unfortunately, the section on the theoretical basis had to be removed from the QCP document. It
included the equations for the precision on the estimation of mutual shifts. They are derived in:
Bamler R., Interferometric Stereo Radargrammetry: Absolute Height Determination from ERS-
ENVISAT Interferograms. Proceedings IGARSS, Hamburg, 2000.
The theory and the Terrafirma validation confirm my experience on coregistration and suggest to
update the coregistration algorithm and the quality reporting. However, in case you can not accept
the effort to implement the proposed quality check you can provide your approach. I suggest to add
a brief explanation how to interpret this quality information.
Page 28-30, 4.4.4 no DINSAR processing is done in our case therefore not applicable. The
differential interferograms are only produced at the PS points, not at every pixel. Quicklooks of
point differential interferograms could be calculated (but this is probably best done after correcting
the point heights, the baselines, and considering at least linear deformation rates, and possibly also
the atmospheric correction – which should then be separately displayed)
It can be advantageous to generate quicklooks of the interferometric data in an early stage of the
processing. It can help to check for an optimal master scene selection or to remove unsuitable
interferograms from the estimation. Quicklooks of differential interferograms sampled at the
detected PSs can be an alternative delivery for the item 4.4.4.
Page 39, 4.6: chapter should be called “statistical accuracy” The focus should then be on statistical
estimates of the precision of the heights and deformations. While in the proposed version this is
done for the deformation rate the height accuracy and the geocoding accuracy are determined in
“validation experiments” which should probably not be part of the QCP or which should at least be
optional, as such information is often not available and its use seems not to be part of the OSP
service. The statistical measures that can be calculated need to be precisely defined and also how
they are applied (for each point, for filtered results, with/without APS etc.)
The entries absolute height and displacement accuracies were intended to be completed based on
the OSPs experience on the used algorithms, the available data, the understanding on the error
propagation and the difficulties during the actual data processing. No validation experiments are
required. However, the experiences from former validation experiments and projects could be
helpful and should be included. In the update of the QCP algorithms for the estimation of the
absolute height and deformation estimation precision are proposed.
Feedback by NPA
This section is related to the feedback document from 27th of November by Jessica Hole and Becky
Stokes.
The Gamma display programs output in 8-bit sunraster or bitmap format, which have been
converted to 8-bit TIFF using the Imagemagick Convert program.

ESA GMES: Terrafirma C5: Service Validation Protocol August 2008: Version 3.4
Copyright NPA and Terrafirma collaborators 2004 97
The file format for visualisations is not important. However, sunraster images can not be easily
displayed on a PC windows computer. A related recommendation is given in section 5.1.
4.2 Data Availability and Feasibility
Expected effect - Is this entry a description of the expected deformation phenomena?
Yes, you are right. This entry should provide a priory available information on any displacement
effect. I suggest to provide any spatial and temporal information. The end user can compare this
with the measurement and should be especially attentive in case of a discrepancy.
4.4.4 Orbit trend and APS check
The differential interferograms are only produced at the PS points, not at every pixel.
This seems to me a shortcoming in the actual implementation. It can be advantageous to generate
quicklooks of the interferometric data in an early stage of the processing. It can help to check for an
optimal master scene selection or to remove unsuitable interferograms from the estimation.
Quicklooks of differential interferograms sampled at the detected PSs can be an alternative
delivery for the item 4.4.4. The quicklooks provide very useful quality information at nearly no cost.
4.4.8 PS detection
A program/script for measuring the SCR of the PS and producing psc_histogram.tif and
ps_histogram.tif would need to be created in order to carry out this step.
PS are selected by a combination of two methods
1. Temporal coherence (MSR threshold)
2. Spectral phase diversity (threshold)
I suggest to provide the applied thresholds of the used methods of your actual processing.
Additionally, you should add the information how these thresholds limit the (expected) phase noise.
The end user needs this information.
The 1) temporal coherence and 2) the spectral phase diversity are implemented to be predictors for
the phase stability which can finally be expressed by the phase standard deviation of the single
radar observation. Consequently there should be a relation between the expected phase noise
standard deviation and your estimated prediction. It can be derived from theory or by scatter plots
of the prediction versus the final coherence (or the respective phase standard deviation). An
example is provided in Fig. 28.
4.4.8 PS detection
Should psc_image.tif and ps_image.tif be single look images?
In DLR‟s PSI-GENESIS system these visualizations are based even on the oversampled scenes.
From my practical experience, a better sampling improves the information provided by these
images.
4.4.9 DEM update unwrapping test & 4.4.10 Displacement unwrapping test
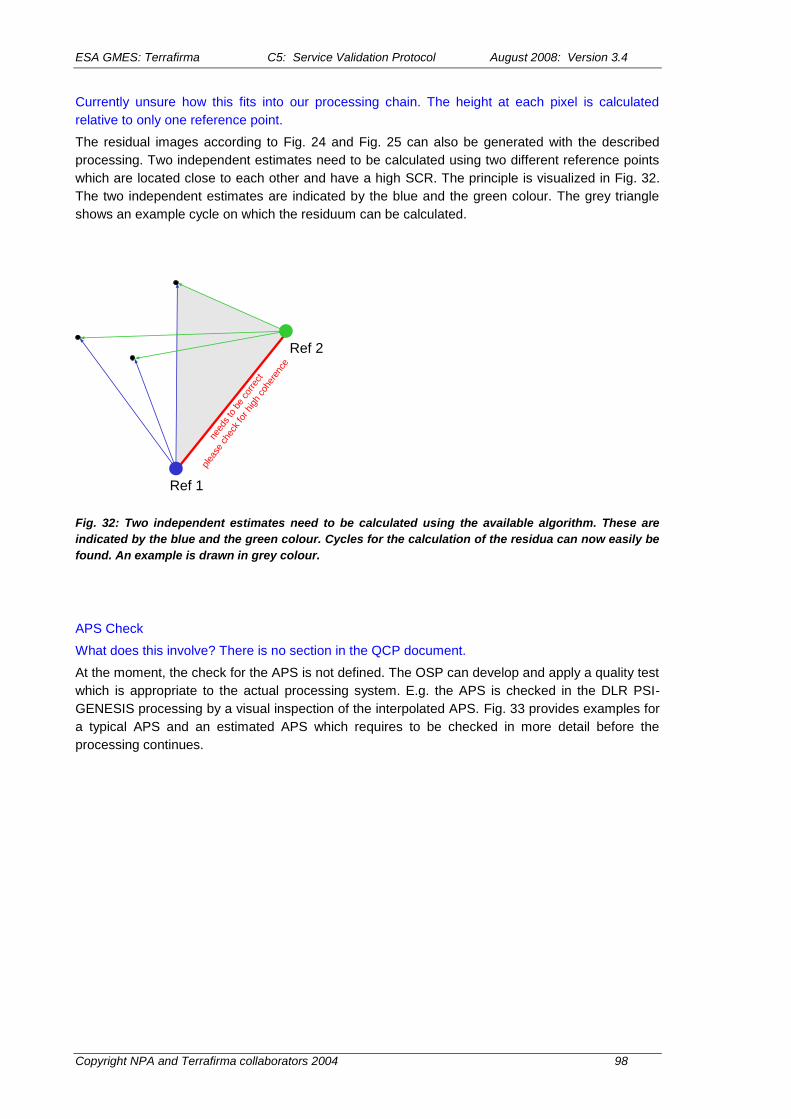
ESA GMES: Terrafirma C5: Service Validation Protocol August 2008: Version 3.4
Copyright NPA and Terrafirma collaborators 2004 98
Currently unsure how this fits into our processing chain. The height at each pixel is calculated
relative to only one reference point.
The residual images according to Fig. 24 and Fig. 25 can also be generated with the described
processing. Two independent estimates need to be calculated using two different reference points
which are located close to each other and have a high SCR. The principle is visualized in Fig. 32.
The two independent estimates are indicated by the blue and the green colour. The grey triangle
shows an example cycle on which the residuum can be calculated.
Ref 1
Ref 2
need
s to
be
correc
t
plea
se c
heck
for hi
gh c
oher
ence
Fig. 32: Two independent estimates need to be calculated using the available algorithm. These are
indicated by the blue and the green colour. Cycles for the calculation of the residua can now easily be
found. An example is drawn in grey colour.
APS Check
What does this involve? There is no section in the QCP document.
At the moment, the check for the APS is not defined. The OSP can develop and apply a quality test
which is appropriate to the actual processing system. E.g. the APS is checked in the DLR PSI-
GENESIS processing by a visual inspection of the interpolated APS. Fig. 33 provides examples for
a typical APS and an estimated APS which requires to be checked in more detail before the
processing continues.

ESA GMES: Terrafirma C5: Service Validation Protocol August 2008: Version 3.4
Copyright NPA and Terrafirma collaborators 2004 99
Fig. 33: The APS is checked in the DLR processing by a visual inspection of the interpolated APS. left image:
The APS looks cloudy i.e. as expected. right image: The ramp and the visible dipoles indicate the need for a
more detailed inspection of this APS estimate.
4.6 Expected Accuracy
Coherence map - Is interpolation acceptable in coh_map.tif?
The defined coherence is physically given point-wise i.e. per PS. Moreover, there is no correlation
of the coherence values of points close together. Consequently, there is no advantage for an
additional interpolation and even sub-sampling should be avoided. The coherence range which is
visualized can be adapted according to the actual data.
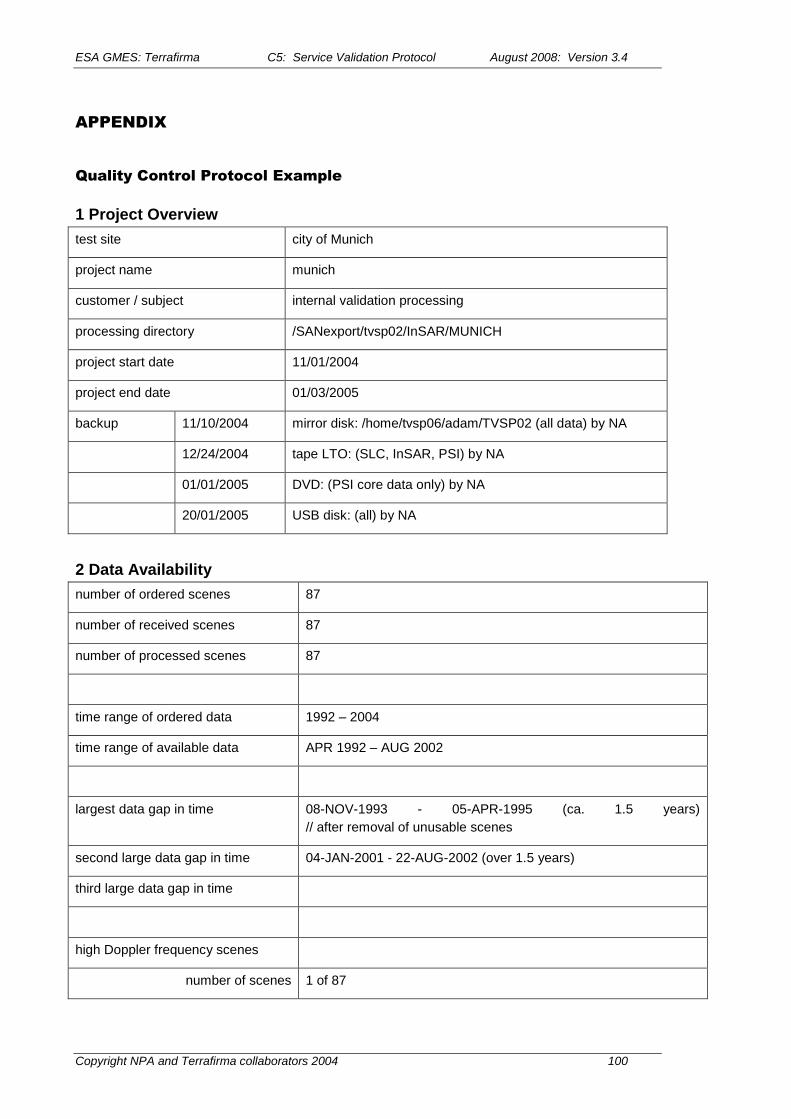
ESA GMES: Terrafirma C5: Service Validation Protocol August 2008: Version 3.4
Copyright NPA and Terrafirma collaborators 2004 100
APPENDIX
Quality Control Protocol Example
1 Project Overview
test site city of Munich
project name munich
customer / subject internal validation processing
processing directory /SANexport/tvsp02/InSAR/MUNICH
project start date 11/01/2004
project end date 01/03/2005
backup 11/10/2004 mirror disk: /home/tvsp06/adam/TVSP02 (all data) by NA
12/24/2004 tape LTO: (SLC, InSAR, PSI) by NA
01/01/2005 DVD: (PSI core data only) by NA
20/01/2005 USB disk: (all) by NA
2 Data Availability
number of ordered scenes 87
number of received scenes 87
number of processed scenes 87
time range of ordered data 1992 – 2004
time range of available data APR 1992 – AUG 2002
largest data gap in time 08-NOV-1993 - 05-APR-1995 (ca. 1.5 years)
// after removal of unusable scenes
second large data gap in time 04-JAN-2001 - 22-AUG-2002 (over 1.5 years)
third large data gap in time
high Doppler frequency scenes
number of scenes 1 of 87

ESA GMES: Terrafirma C5: Service Validation Protocol August 2008: Version 3.4
Copyright NPA and Terrafirma collaborators 2004 101
time / time range AUG 2002
action 1 scene removed
time – baseline – plot image /SANexport/tvsp02/InSAR/MUNICH/QC/baselineplot.jpg
(super) master scene orbit 20460, acquired March 20, 1999
SLA signed not applicable
expected effect unknown
feasibility of test site for
PSI (D-InSAR / stacked InSAR)
yes
3 Relevant Versions
document / protocol / software item version
Quality Control Protocol Version 1.0 (11/01/2006)
Service Portfolio Specifications (S5) Version 4 (06/21/2006)
Processing Software Version
input reader ERS: 1.23 ASAR: - TS-X: - ALOS: - (CVS)
InSAR 1.8 (CVS)
PSI 2.12 (CVS)
calibration ERS: 1.1 ASAR: TS-X: ALOS:
non standard processing not applicable
4 Processing
check result / comment date signat
ure
SLC missing lines check 0 severe / 0 risky / 87 Ok 11/08/2004 NA
severe: not applicable / deleted
coregistration single scene
outlier
None 11/08/2004 NA
coregistration systematic
error
/SANexport/tvsp02/InSAR/MUNICH/QC
plot_orbit_rg_[1-3].tif; plot_orbit_az_[1-3].tif
error smaller 0.2 samples
11/08/2004 NA

ESA GMES: Terrafirma C5: Service Validation Protocol August 2008: Version 3.4
Copyright NPA and Terrafirma collaborators 2004 102
APS and orbit trend check /SANexport/tvsp02/InSAR/MUNICH/QC
contributions.txt dinsar_quicklook.tif
11/08/2004 NA
coherence images estimation window (az x rg): 20 x 4 samples
/SANexport/tvsp02/InSAR/MUNICH/QC
coherence_orbit.tif
11/08/2004 NA
scene phase unwrapping not applicable 11/08/2004 NA
scene calibration firstly absolute and adjusted relative;
/SANexport/tvsp02/InSAR/MUNICH/QC
cal_histograms.tif cal_mean.tif
11/08/2004 NA
PS detection SCR threshold: 1.5 (or dispersion index)
candidates density: 287 [scat/km2]
final density: 250 [PS/km2]
/SANexport/tvsp02/InSAR/MUNICH/QC
psc_histogram.tif ps_histogram.tif
psc_image.tif ps_image.tif cal_mean.tif
11/08/2004 NA
DEM Update Unwrapping /SANexport/tvsp02/InSAR/MUNICH/QC
topo_residuals.tif
11/08/2004 NA
Displacement Unwrapping /SANexport/tvsp02/InSAR/MUNICH/QC
disp_residuals.tif
11/08/2004 NA
APS Check 11/08/2004 NA
5 Visualisation
check result / comment date signat

ESA GMES: Terrafirma C5: Service Validation Protocol August 2008: Version 3.4
Copyright NPA and Terrafirma collaborators 2004 103
ure
displacement map triangulation interpolation no extra filter
/SANexport/tvsp02/InSAR/MUNICH/DELIVERABLES
displ_map_1995.tif .. displ_map_2001.tif
11/08/2004 NA
needs to be continued for
other visualisations
6 Expected Accuracy
check result / comment date signat
ure
coherence map /SANexport/tvsp02/InSAR/MUNICH/QC
coh_map.tif
11/08/2004 NA
geolocation accuracy 25 m 11/08/2004 NA
correction due to GCP(s) azimuth: -13.05 m
range: 60.91 m
11/08/2004 NA
absolute height accuracy 10 m 11/08/2004 NA
ambiguities not applicable 11/08/2004 NA
displ. estimation accuracy +/-1 mm/year assuming linear displacement 11/08/2004 NA
7 Product Delivery
check result / comment date signat
ure
completeness of delivery 1. Database of PSI average annual displ. rates
2. Database of PSI time-series
3. Reference point table
4. Processing report (metadata)
5. Background reference image
6. Img of interpolated average annual displ. rates
7. Quality control sign-off
12/08/2004 NA
delivery date not applicable (could be 14/08/2004) 12/08/2004 NA
delivery due date not applicable (could be T0 + 2 months) 12/08/2004 NA
delivery address not applicable (could be post or ftp address) 12/08/2004 NA
delivery service not applicable (could be DHL or ftp) 12/08/2004 NA

ESA GMES: Terrafirma C5: Service Validation Protocol August 2008: Version 3.4
Copyright NPA and Terrafirma collaborators 2004 104
Quality Control Protocol Template
The template starts on the next page in order to provide it without interfering document‟s text

ESA GMES: Terrafirma C5: Service Validation Protocol August 2008: Version 3.4
Copyright NPA and Terrafirma collaborators 2004 105
Quality Control Protocol
1 Project Overview
test site
project name
customer / subject
processing directory
project start date
project end date
backup

ESA GMES: Terrafirma C5: Service Validation Protocol August 2008: Version 3.4
Copyright NPA and Terrafirma collaborators 2004 106
2 Data Availability
number of ordered scenes
number of received scenes
number of processed scenes
time range of ordered data
time range of available data
largest data gap in time
second large data gap in time
third large data gap in time
high Doppler frequency scenes
number of scenes
time / time range
action
time – baseline – plot image
(super) master scene
SLA signed
expected effect
feasibility of test site for
PSI (D-InSAR / stacked InSAR)
3 Relevant Versions
document / protocol / software item version
Quality Control Protocol
Service Portfolio Specifications (S5)
Processing Software Version
input reader
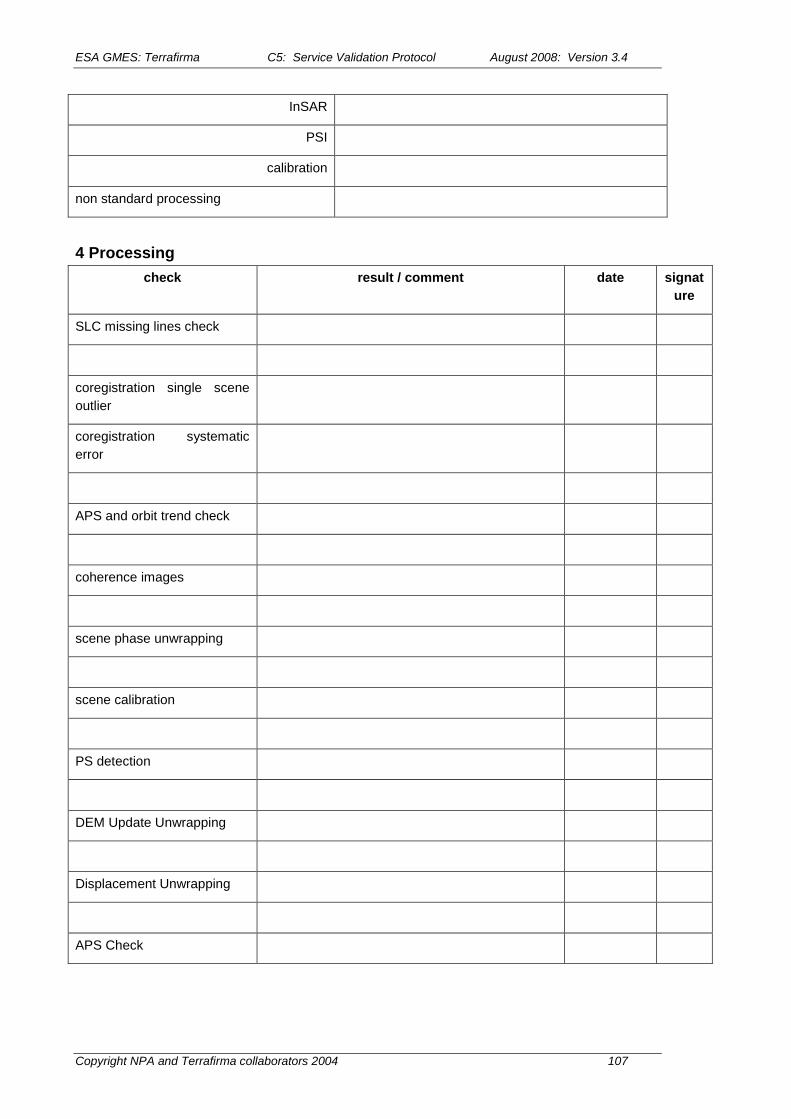
ESA GMES: Terrafirma C5: Service Validation Protocol August 2008: Version 3.4
Copyright NPA and Terrafirma collaborators 2004 107
InSAR
PSI
calibration
non standard processing
4 Processing
check result / comment date signat
ure
SLC missing lines check
coregistration single scene
outlier
coregistration systematic
error
APS and orbit trend check
coherence images
scene phase unwrapping
scene calibration
PS detection
DEM Update Unwrapping
Displacement Unwrapping
APS Check

ESA GMES: Terrafirma C5: Service Validation Protocol August 2008: Version 3.4
Copyright NPA and Terrafirma collaborators 2004 108
5 Visualisation
check result / comment date signat
ure
displacement map
needs to be continued for
other visualisations
6 Expected Accuracy
check result / comment date signat
ure
coherence map
geolocation accuracy
correction due to GCP(s)
absolute height accuracy
ambiguities
displ. estimation accuracy
7 Product Delivery
check result / comment date signat
ure
completeness of delivery
delivery date
delivery due date
delivery address
delivery service
-- End of document --