session 6 – china the reality: currency, trade, investment & steel a u.s. minimill perspective...
TRANSCRIPT

Session 6 – China the Reality: Currency, Trade, Investment & Steel
A U.S. Minimill Perspective
Thomas A. Danjczek, PresidentSteel Manufacturers AssociationMarch 11, 2008
SBB Steel Markets North America 2008

• The Steel Manufacturers Association (SMA)– 36 North American companies:
30 U.S., 4 Canadian, and 2 Mexican– 125 Associate members:– Suppliers of goods and services to the steel industry– Operate 125 steel recycling plants in North America– Electric Arc Furnace (EAF) steelmakers using recycled steel– EAF steel producers accounted for over 60% of U.S. steel production in
2007– SMA represents over 70% of all U.S. steel production, with similar
numbers in Canada and Mexico
SBB – A U.S. Minimill Perspective SMA
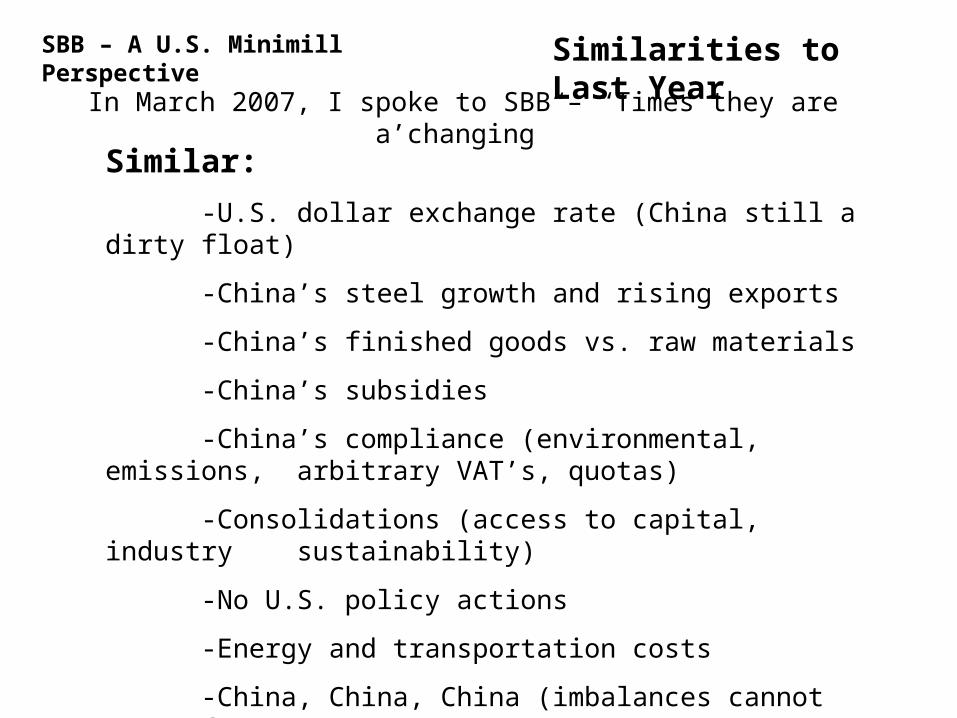
SBB – A U.S. Minimill Perspective Similarities to Last Year
Similar:
-U.S. dollar exchange rate (China still a dirty float)
-China’s steel growth and rising exports
-China’s finished goods vs. raw materials
-China’s subsidies
-China’s compliance (environmental, emissions, arbitrary VAT’s, quotas)
-Consolidations (access to capital, industry sustainability)
-No U.S. policy actions
-Energy and transportation costs
-China, China, China (imbalances cannot go on forever)
In March 2007, I spoke to SBB – “Times they are a’changing”

SBB – A U.S. Minimill Perspective Different & Unknown
Different
-Recession impact?
-Raw material price squeeze
-Weaker dollar
-Lower steel imports
-China’s steel exports to E.U.
Unknown
-JCCT Dialogue
-E.U. trade cases
-Impact of sovereign wealth funds
-Changing freight rates
-VAT rebate changes
-China’s rate of steel closures

Steel Consolidating, But Still Fragmented
Top 15 Global Steel Producers - September 2007Based on 2006 Production: 1240 Million MT
Baosteel (26 mt)
Tata (incl. Corus) (24 mt)
USS (incl. Stelco) (26 mt)
POSCO (31 mt)
JFE (32 mt)
Anben (23 mt)
Shandong (22 mt)
Nucor (20 mt)
Wuhan (19 mt)
Tangshan (19 mt)
Evraz (19 mt)
Riva (18 mt)
Severstal (18 mt)
Nippon (34 mt)
Rest of World 64%
(794 mt)Arcelor Mittal - 9.5%
(118 mt)
Automotive OEM Global Market Share(Based on 2006 Production)
Top 1068%
All Others32%
Iron Ore Supplier Market Share
Top 375%
All Others25%
TOP 15 Represent 36% of Global Production
Source: IISB
SBB – A U.S. Minimill Perspective

New Capacity Outpaces Consumption Growth
Capacity – Multiple Sources; Nucor Analysis
Demand – IISI projections thru ’08; 6% increase “09 – ‘10
EU-251%
India23%
NAFTA2%Other Asia
15%
Other Europe3%
CIS6%
Africa & Middle East5%
Central & South America
12%
China33%
Announced Steel Capacity Increases By Region
(2006 – 2012)
Announced Steel Capacity Vs. Projected Consumption 2007 – 2010
(Million Metric Tonnes)
Compound Annual Growth Rates:Capacity: 6.83% Demand: 4.65%
SBB – A U.S. Minimill Perspective

China: World’s No. 1 Is Government Directed
Privately OwnedGovernment Owned or
Controlled
191 million tonnes
19 million tonnes
Source: Money for Metal (2007)
Top 20 Chinese Steel Producers:Government Control Vs. Private Ownership
Top 20 Capacity: 210 Million Tons
-
100,000
200,000
300,000
400,000
500,000
600,000
China Asia other thanChina
European Union(25)
North America C.I.S. (6) South America Other Europe Africa Middle East Oceania
Metr
ic t
on
s p
rod
uced
(in
'000s)
Source: World crude production through 9/07 annualized; IISI
2007 Projected Global Production
Australian Government Predicting China Will Reach 1B Tons by 2015,
CISA says 2020.
SBB – A U.S. Minimill Perspective

China Is the World’s Largest Exporter
China Finished Steel
Exports By Destination
2005 – 2007 (000 MT)
Country / Region 2005 2006 2007E
EU 25/27 1,367 7,393 12,650
S. Korea 5,526 8,817 11,844
NAFTA 3,092 7,047 5,970
Iran 185 5,180 3,096
Vietnam 865 1,721 2,994
United Arab Emirates 211 885 2,773
India 417 1,574 2,447
Others 8,861 15,052 25,848
TOTAL 20,524 43,007 67,622
Source: CISA, 2007 Data Annualized
SBB – A U.S. Minimill Perspective

SBB – A U.S. Minimill Perspective China Comments
-China has NOT become the world’s largest steel producer by accident, or by operation of free markets, or comparative advantage
-China is NOT a low-cost steel producer
-China has reached its position through a combination of subsidies, mandates, and planned intervention
-In finished goods containing steel, China’s exports are expanding by approximately 30 percent per year
-Chinese steel market is still reliant on exports to absorb overproduction
-Chinese steel industry is overbuilt and underdemolished

SBB – A U.S. Minimill Perspective China’s Trade Surplus
Year China’s Trade Surplus
2001 $22 billion(year China joined WTO)
2006 $177 billion
2007 $262 billion (up 47.7%)
The U.S. has lost 3.3 million manufacturing jobs The U.S. has lost 3.3 million manufacturing jobs since 2000… imbalances cannot go on forever.since 2000… imbalances cannot go on forever.

SBB – A U.S. Minimill Perspective Impact of AD/CVD
Percent of the value of Chinese imports covered by US
AD/CVD duties?
2004 – 0.13%
2006 – 0.10%
What protectionism?
International Trade Commission, based on U.S. DOC and Customs official statistics

SBB – A U.S. Minimill Perspective Competitiveness
U.S. - China Steel Future Competitiveness Drivers
Driver U.S. China Comment1. Metallics •Weak $ •1/2 imported •Technological
(Availability/Price) •Scrap exports •Freight developments
+ to U.S.
2. Energy •Gas/electricity + to China •Climate change
(Availability/Price) constraints policy
•Limited nuclear
3. Labor •Lack of technical + to China
•Health care costs
4. Transportation + to U.S.
5. Trade + to China •Growth of steel-
intensive goods
6. Environment + to U.S. •Enforcement?
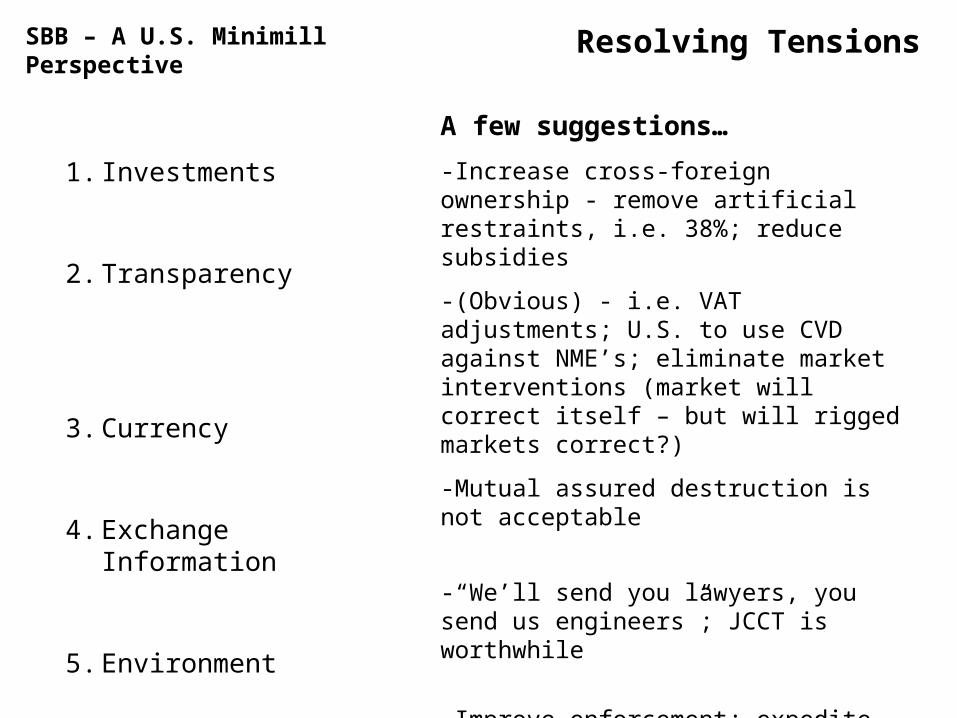
SBB – A U.S. Minimill Perspective Resolving Tensions
1. Investments
2. Transparency
3. Currency
4. Exchange Information
5. Environment
6. Savings
A few suggestions…
-Increase cross-foreign ownership - remove artificial restraints, i.e. 38%; reduce subsidies
-(Obvious) - i.e. VAT adjustments; U.S. to use CVD against NME’s; eliminate market interventions (market will correct itself – but will rigged markets correct?)
-Mutual assured destruction is not acceptable
-“We’ll send you lawyers, you send us engineers”; JCCT is worthwhile
-Improve enforcement; expedite shutdown rate
-China’s saving rates maybe too high, U.S. needs to save more

SBB – A U.S. Minimill Perspective Conclusions
-Trade distortion still a problem
-Consolidations helping, but overcapacity still a risk
-Finished goods containing steel are a major concern
-China, China, China… everything else is still only an embellishment
-Unknowns (recession, imports, interest rates, costs)
-Resolve tensions by investments, transparency, currency correction, etc.
-Still reasons for meaningful optimism, due to North American steel industry resiliency; North American steel facilities, for the most part, are technologically advanced, cost competitive, environmentally acceptable, and are a key component of the North American infrastructure.