shaking energy landscape - applied physics laboratory · shaking energy landscape ... 1990 1995...
TRANSCRIPT
JHS/APL Rethinking Seminar Series:
Rethinking U.S. Enduring Strengths, Challenges, and Opportunities
December 17, 2014
Shaking Energy Landscape Edward C. Chow
Senior Fellow

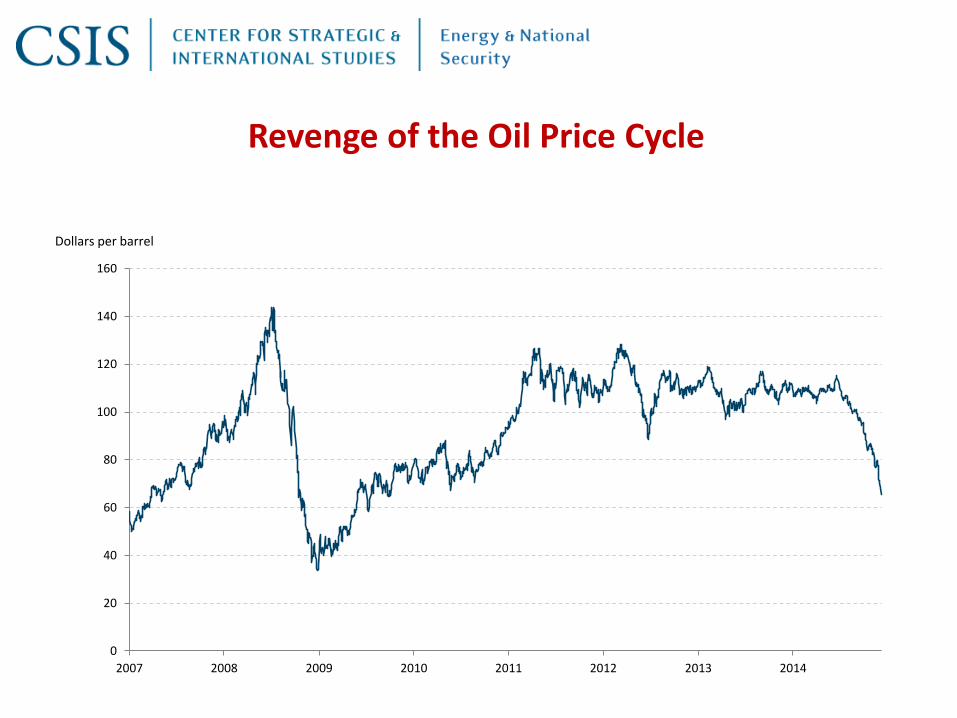
Dollars per barrel
Revenge of the Oil Price Cycle
0
20
40
60
80
100
120
140
160
2007 2008 2009 2010 2011 2012 2013 2014

American Innovation: R&D and Entrepreneurship

3
4
5
6
7
8
9
2008 2014M
mb
/d
0.6
0.7
0.8
0.9
1
1.1
1.2
1.3
1.4
1.5
1.6
2008 2014
Mm
b/d
45
50
55
60
65
70
75
2008 2014
Bcf
/d
Source: Source: U.S. Energy Information Administration; LPG = Propane and Butane; Crude oil includes lease condensate
Back to the
level of 1985
+29% +90% +67%
50% of
Worldwide
LNG Market
50% of
International
LPG Market
Dry gas production LPG production Crude oil production
US Production and Global Market
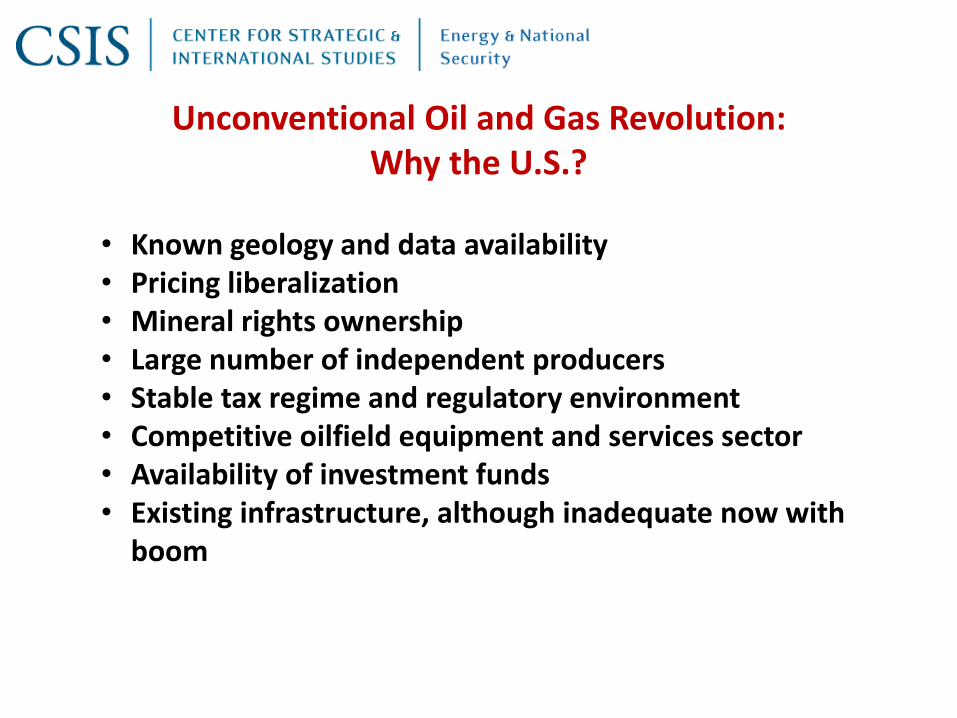
Unconventional Oil and Gas Revolution:Why the U.S.?
• Known geology and data availability• Pricing liberalization• Mineral rights ownership• Large number of independent producers• Stable tax regime and regulatory environment• Competitive oilfield equipment and services sector• Availability of investment funds• Existing infrastructure, although inadequate now with
boom
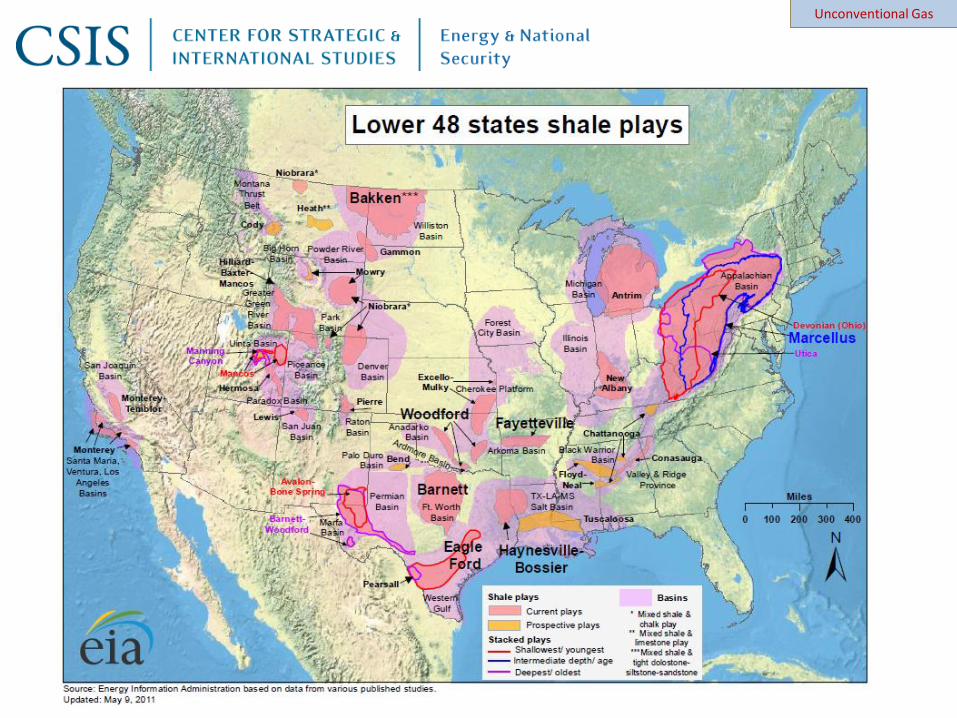
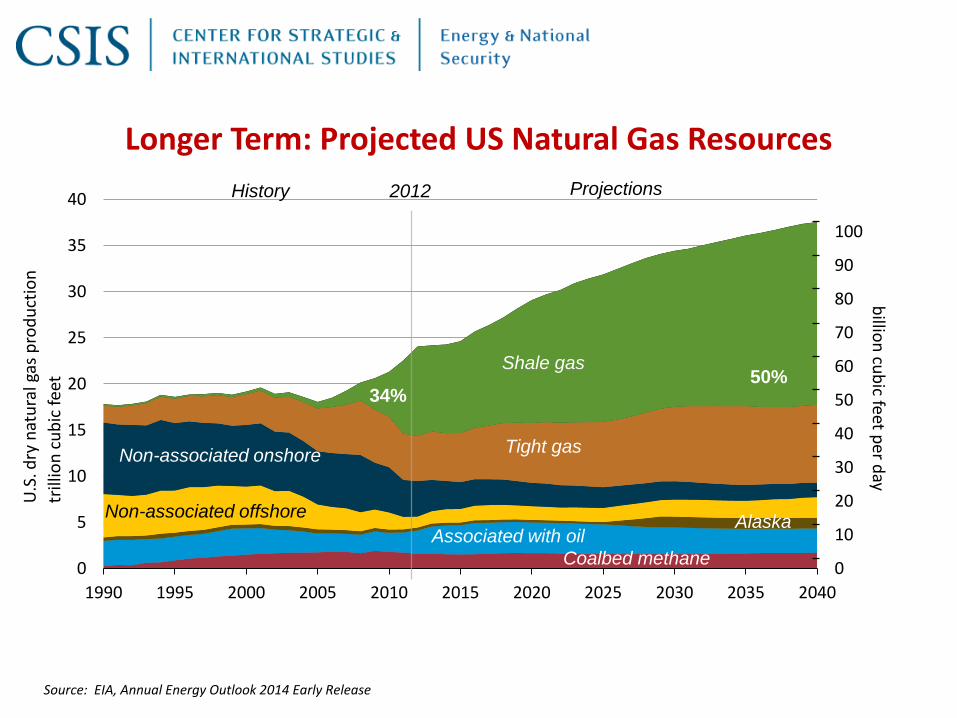
U.S. Shale Gas Resources
Unconventional Gas

These seven regions accounted for 95% of U.S. oil production growth and all U.S. natural gas production growth from 2011-2013
Source: EIA, Drilling Productivity Report
U.S
. dry
nat
ura
l gas
pro
du
ctio
n
trill
ion
cu
bic
fee
t
Source: EIA, Annual Energy Outlook 2014 Early Release
0
10
20
30
40
50
60
70
80
90
100
0
5
10
15
20
25
30
35
40
1990 1995 2000 2005 2010 2015 2020 2025 2030 2035 2040
Associated with oil
Coalbed methane
Tight gas
Shale gas
AlaskaNon-associated offshore
Non-associated onshore
ProjectionsHistory 2012
billio
n cu
bic feet p
er day
Longer Term: Projected US Natural Gas Resources
34%50%
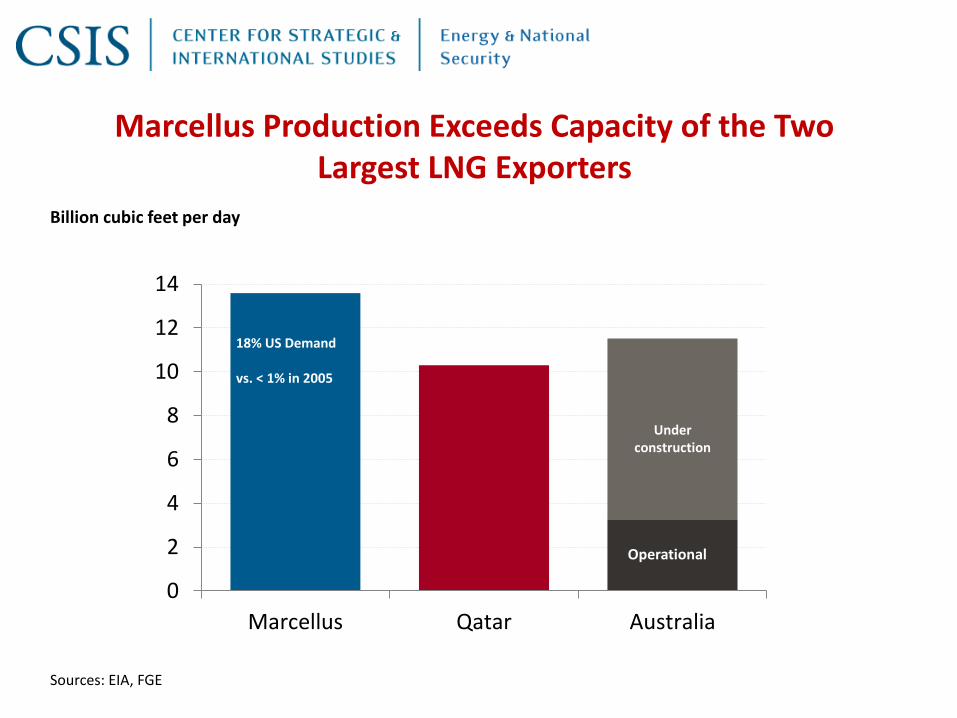
Operational
Underconstruction
Billion cubic feet per day
Sources: EIA, FGE
Marcellus Production Exceeds Capacity of the Two Largest LNG Exporters
0
2
4
6
8
10
12
14
Marcellus Qatar Australia
Operational
Underconstruction
18% US Demand
vs. < 1% in 2005

Source: U.S. Energy Information Administration, Annual Energy Outlook 2014, May 7, 2014
Henry Hub spot Prices (2012 dollars per million Btu)
Increased production allows U.S. to transition from net importer to net exporter of natural gas
U.S. dry gas production, trillion cubic feet per year
0
5
10
15
20
25
30
0.0
10.0
20.0
30.0
40.0
50.0
60.0
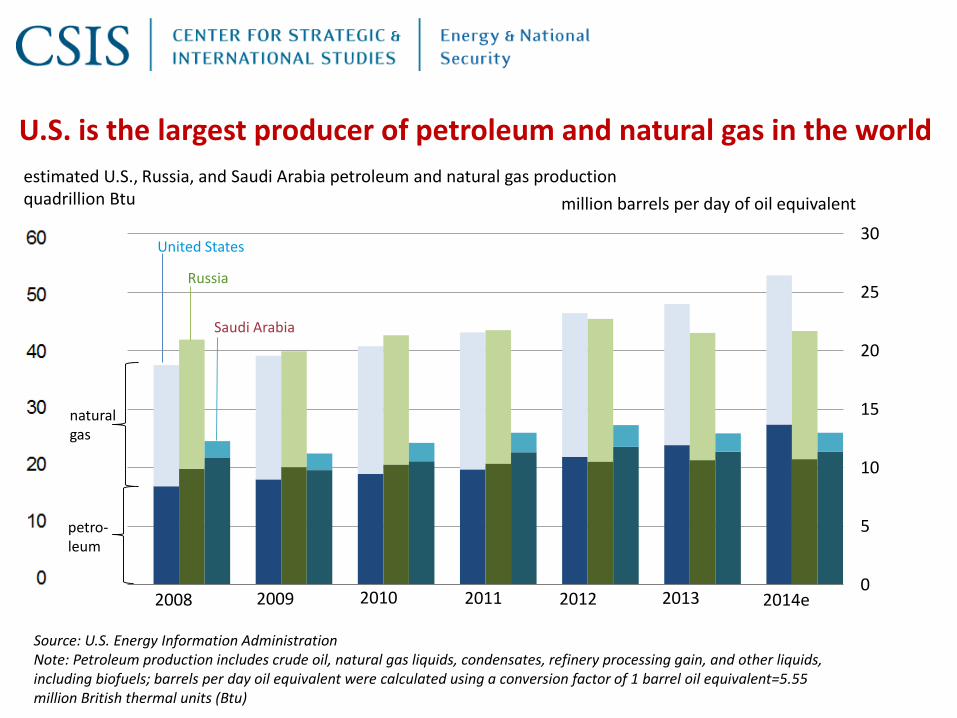
U.S. is the largest producer of petroleum and natural gas in the world
estimated U.S., Russia, and Saudi Arabia petroleum and natural gas productionquadrillion Btu million barrels per day of oil equivalent
United States
Russia
Saudi Arabia
petro-leum
naturalgas
2008 2009 2010 2011 2012 2013 2014e
Source: U.S. Energy Information AdministrationNote: Petroleum production includes crude oil, natural gas liquids, condensates, refinery processing gain, and other liquids,including biofuels; barrels per day oil equivalent were calculated using a conversion factor of 1 barrel oil equivalent=5.55 million British thermal units (Btu)
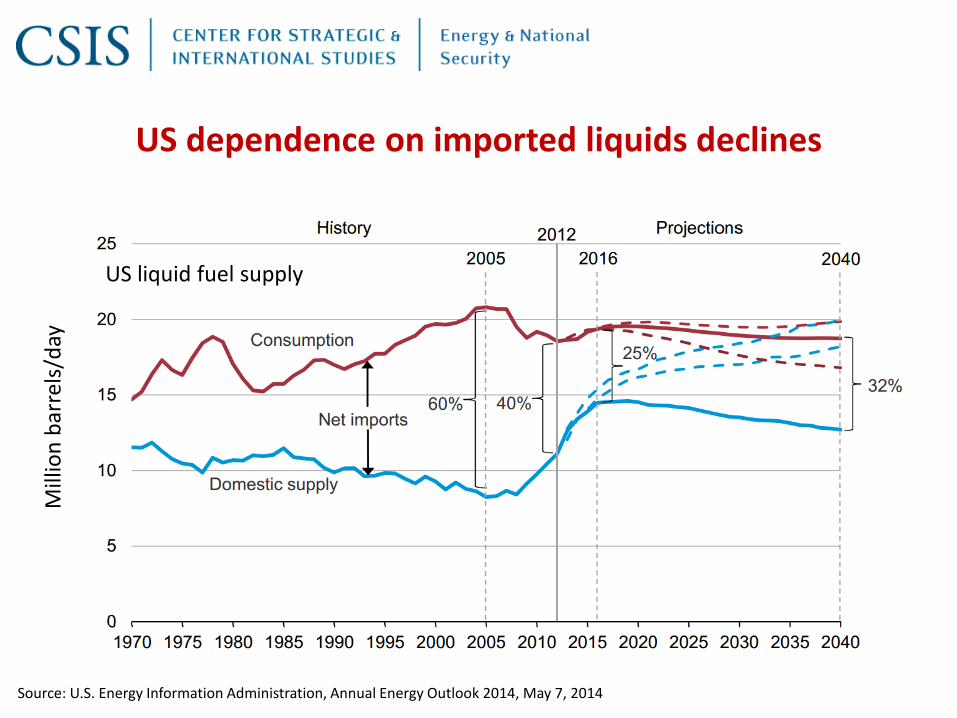
US dependence on imported liquids declines
US liquid fuel supply
Mill
ion
bar
rels
/day
Source: U.S. Energy Information Administration, Annual Energy Outlook 2014, May 7, 2014
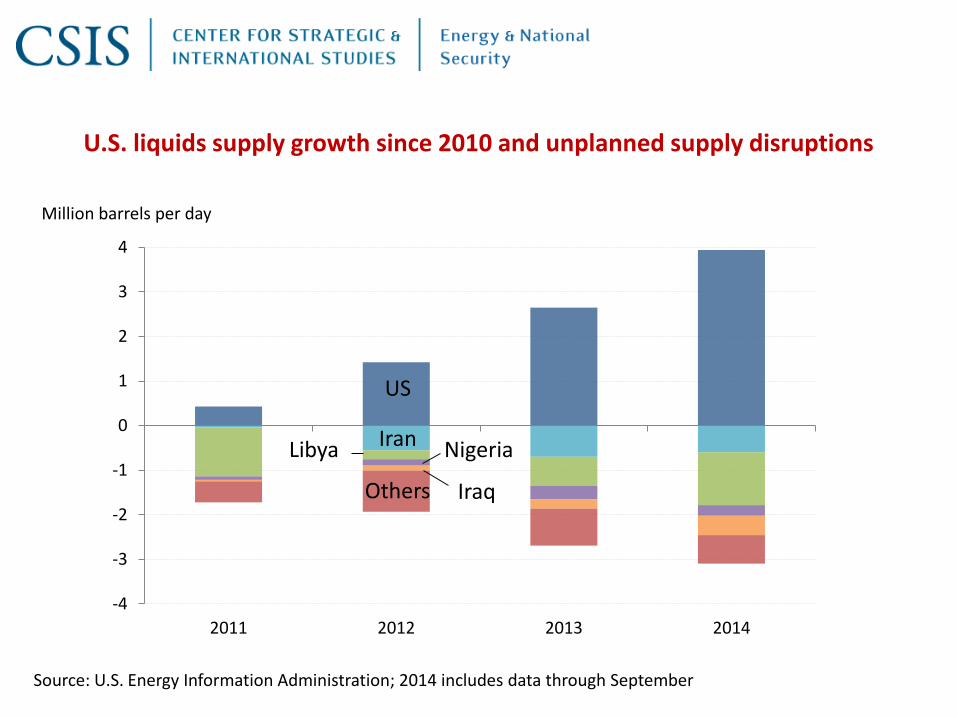
Million barrels per day
Source: U.S. Energy Information Administration; 2014 includes data through September
U.S. liquids supply growth since 2010 and unplanned supply disruptions
-4
-3
-2
-1
0
1
2
3
4
2011 2012 2013 2014
US
IranLibya Nigeria
IraqOthers
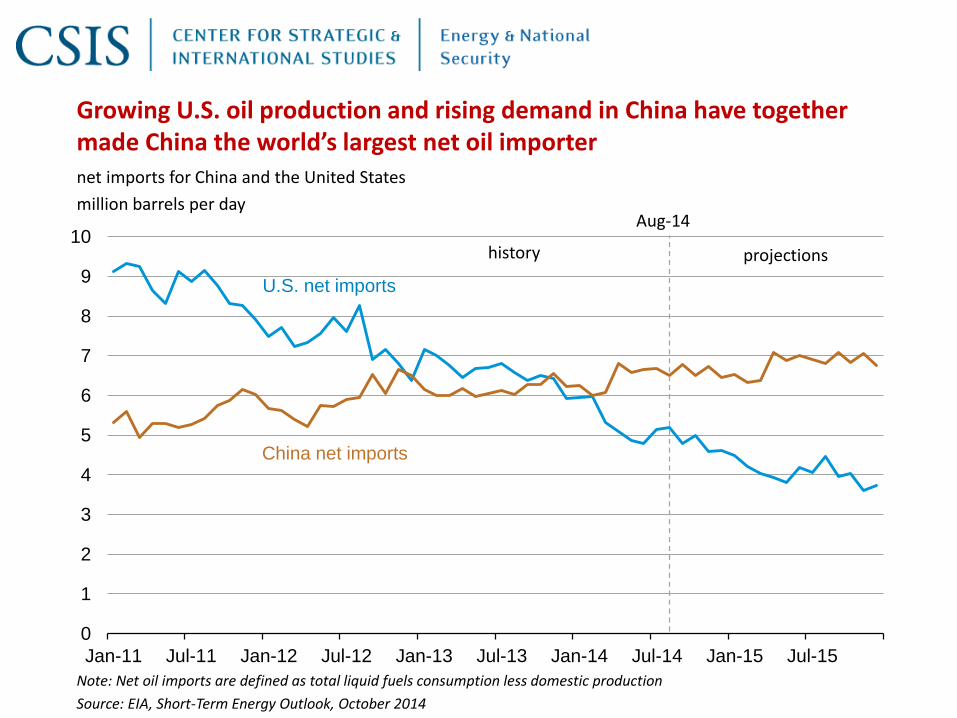
Growing U.S. oil production and rising demand in China have together made China the world’s largest net oil importer
0
1
2
3
4
5
6
7
8
9
10
Jan-11 Jul-11 Jan-12 Jul-12 Jan-13 Jul-13 Jan-14 Jul-14 Jan-15 Jul-15
U.S. net imports
China net imports
net imports for China and the United States
million barrels per day
Note: Net oil imports are defined as total liquid fuels consumption less domestic production
Source: EIA, Short-Term Energy Outlook, October 2014
projectionshistory
Aug-14

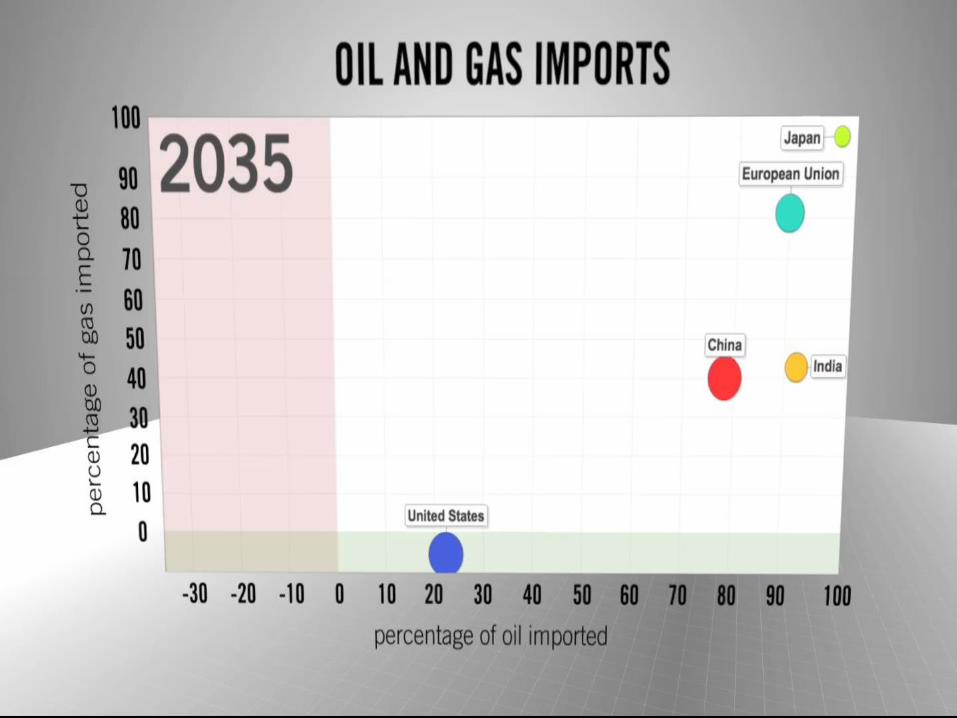
Natural gas demand outlook by region
The main regions pushing global gas demand higher are China – which overtakes the EU as a gas consumer around 2035 – and the Middle East
200
400
600
800
1 000bcm0.7%
2.0%5.5 %
0.6%0.2%
3.2%
4.6%
Additionalto 2040
2012
% = CAAGR 2012-2040
UnitedStates
MiddleEast
China EuropeanUnion
Russia Africa IndiaLatin America
2.4%
Source: IEA World Energy Outlook 2014
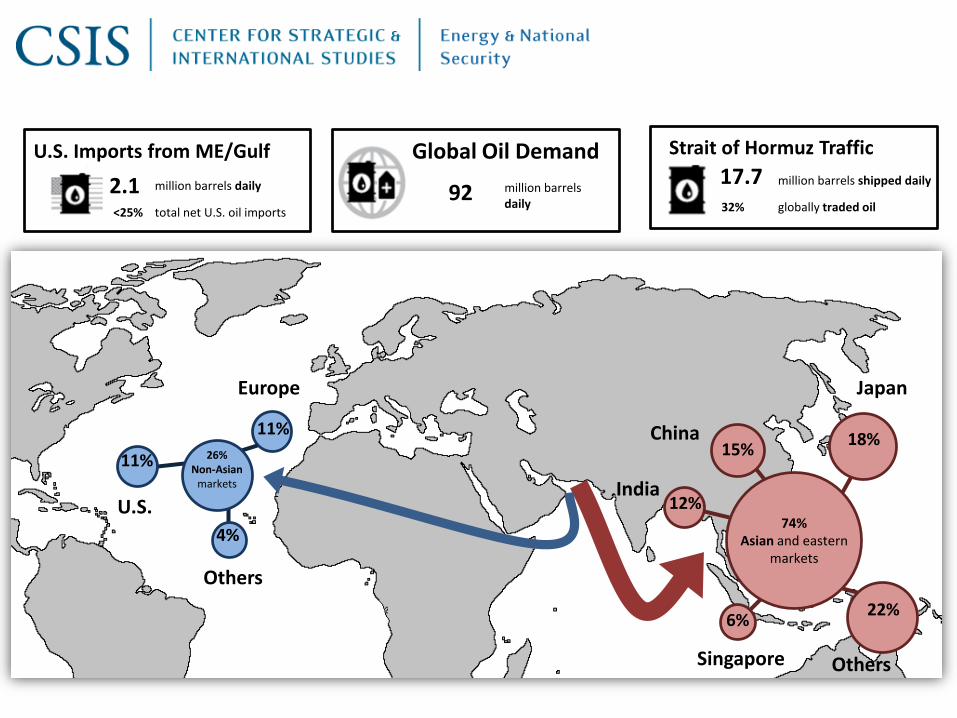
74%Asian and eastern
markets
12%
18%15%
22%6%
4%
11%
11%
26%Non-Asian
markets
U.S.
Others
OthersSingapore
India
China
JapanEurope
2.1<25%
million barrels daily
total net U.S. oil imports
U.S. Imports from ME/Gulf
globally traded oil
Strait of Hormuz Traffic
17.732%
million barrels shipped daily92 million barrels
daily
Global Oil Demand
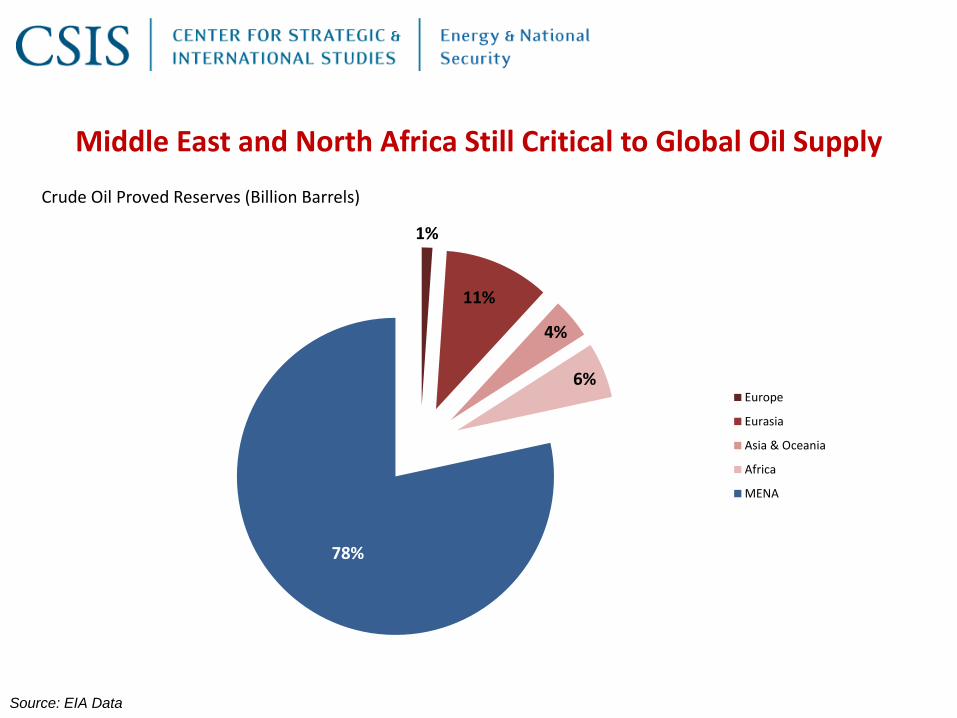
Middle East and North Africa Still Critical to Global Oil Supply
Source: EIA Data
1%
11%
4%
6%
78%
Europe
Eurasia
Asia & Oceania
Africa
MENA
Crude Oil Proved Reserves (Billion Barrels)
2013 2020 2030 20402015
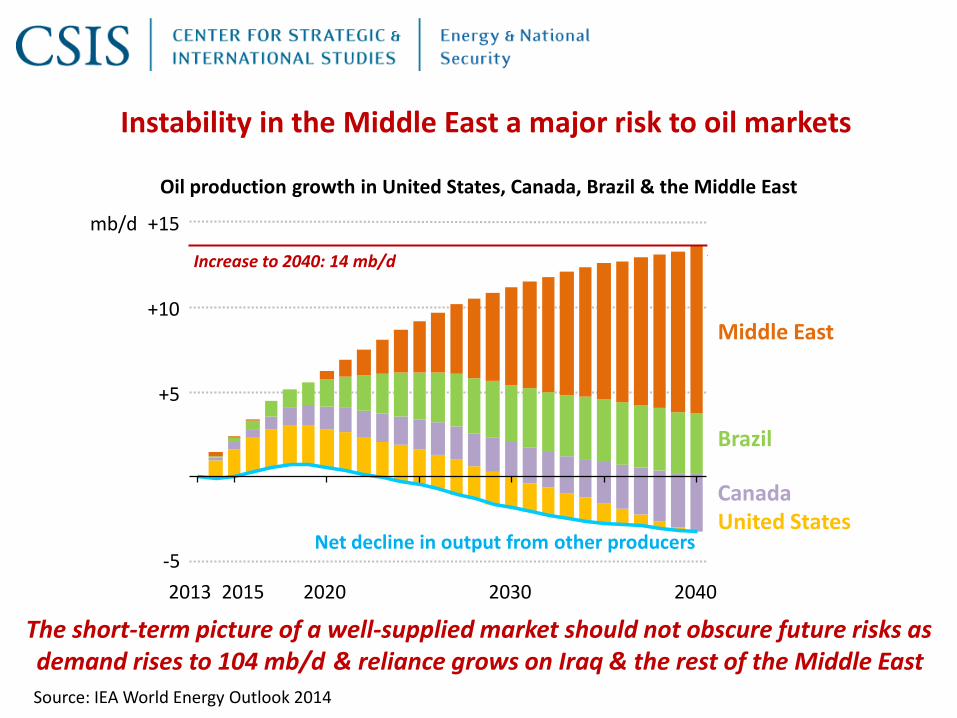
Instability in the Middle East a major risk to oil markets
Oil production growth in United States, Canada, Brazil & the Middle East
The short-term picture of a well-supplied market should not obscure future risks as demand rises to 104 mb/d & reliance grows on Iraq & the rest of the Middle East
+5
+10
+15
-5
2013 2020 2030 20402015
Net decline in output from other producers
Increase to 2040: 14 mb/d
mb/d
Increase to 2040:14 mb/d
Middle East
Brazil
CanadaUnited States
& reliance grows on Iraq & the rest of the Middle East
Source: IEA World Energy Outlook 2014
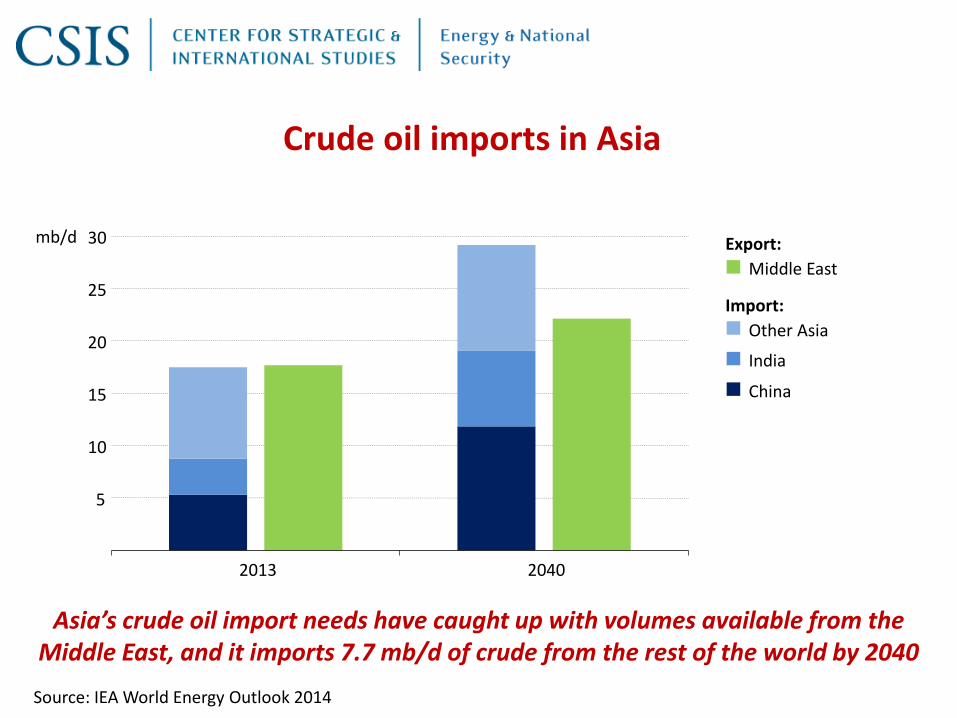
Crude oil imports in Asia
Asia’s crude oil import needs have caught up with volumes available from the Middle East, and it imports 7.7 mb/d of crude from the rest of the world by 2040
5
10
15
20
25
30mb/d
2013 2040
Middle East
Other Asia
India
China
Export:
Import:
Source: IEA World Energy Outlook 2014
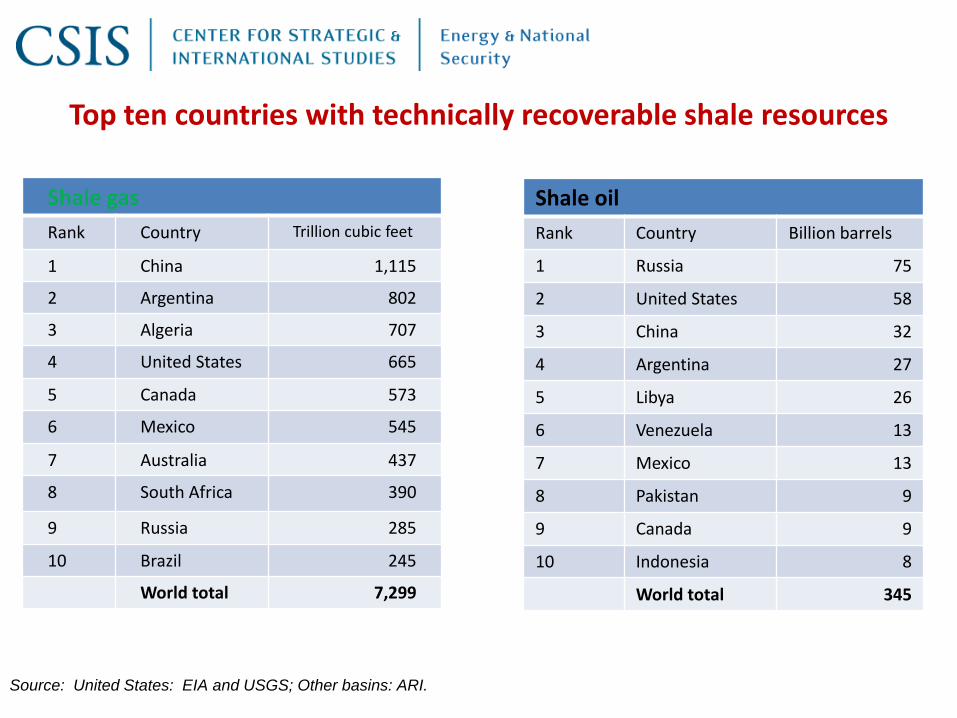
Top ten countries with technically recoverable shale resources
Shale gas
Rank Country Trillion cubic feet
1 China 1,115
2 Argentina 802
3 Algeria 707
4 United States 665
5 Canada 573
6 Mexico 545
7 Australia 437
8 South Africa 390
9 Russia 285
10 Brazil 245
World total 7,299
Shale oil
Rank Country Billion barrels
1 Russia 75
2 United States 58
3 China 32
4 Argentina 27
5 Libya 26
6 Venezuela 13
7 Mexico 13
8 Pakistan 9
9 Canada 9
10 Indonesia 8
World total 345
Source: United States: EIA and USGS; Other basins: ARI.
•Source: United States basins from EIA and United States Geological Survey, other basins from ARI based on data from various published studies
EIA / ARI assessed shale oil and shale gas resources 2013
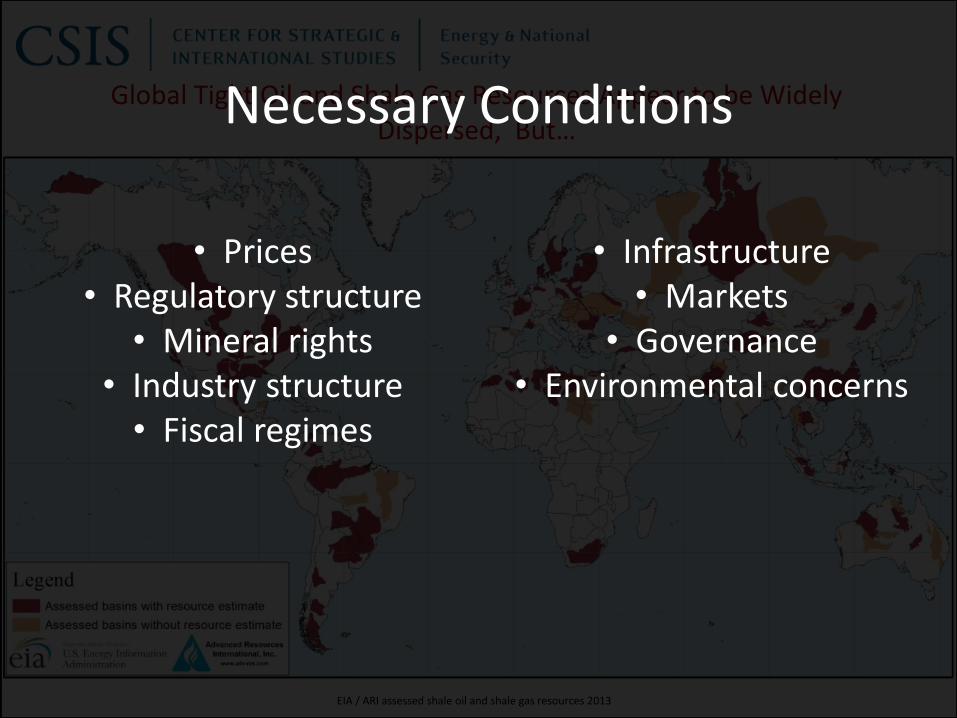
Global Tight Oil and Shale Gas Resources Appear to be Widely Dispersed, But…
• Prices• Regulatory structure
• Mineral rights• Industry structure• Fiscal regimes
• Infrastructure• Markets
• Governance• Environmental concerns
Necessary Conditions
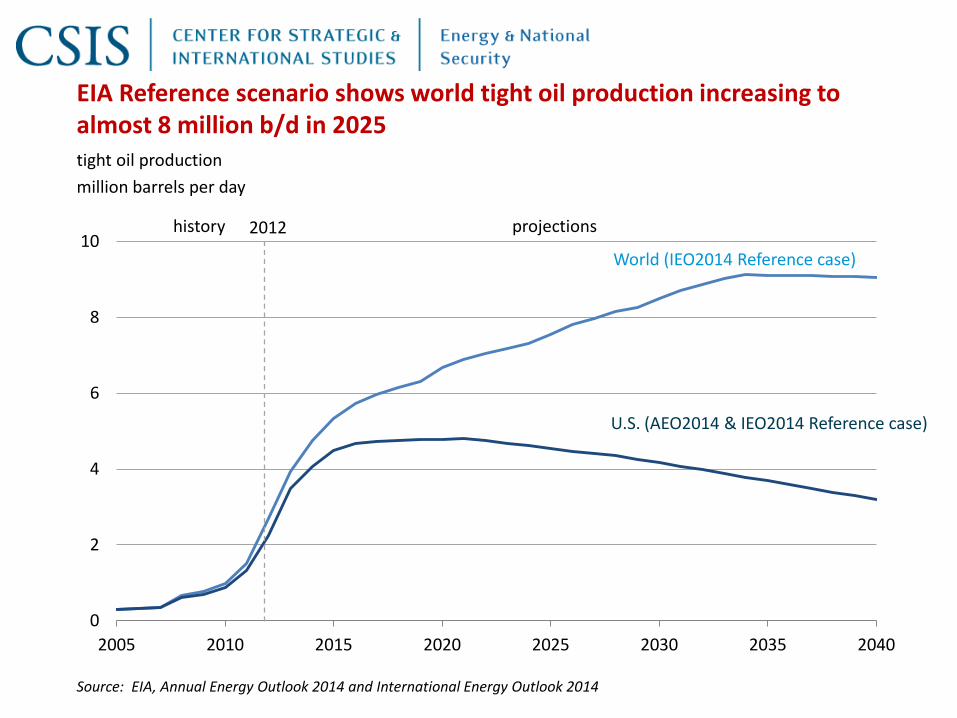
EIA Reference scenario shows world tight oil production increasing to almost 8 million b/d in 2025
0
2
4
6
8
10
2005 2010 2015 2020 2025 2030 2035 2040
tight oil production
million barrels per day
Source: EIA, Annual Energy Outlook 2014 and International Energy Outlook 2014
projectionshistory 2012
U.S. (AEO2014 & IEO2014 Reference case)
World (IEO2014 Reference case)

Outlook for tight oil
Tight oil production remains focused in the United States, but is joined increasingly by other players
1 2 3 4 5 6 7
2013
2025
2040
mb/d
United States Russia Argentina Mexico China Canada Rest of world
Source: IEA World Energy Outlook 2014
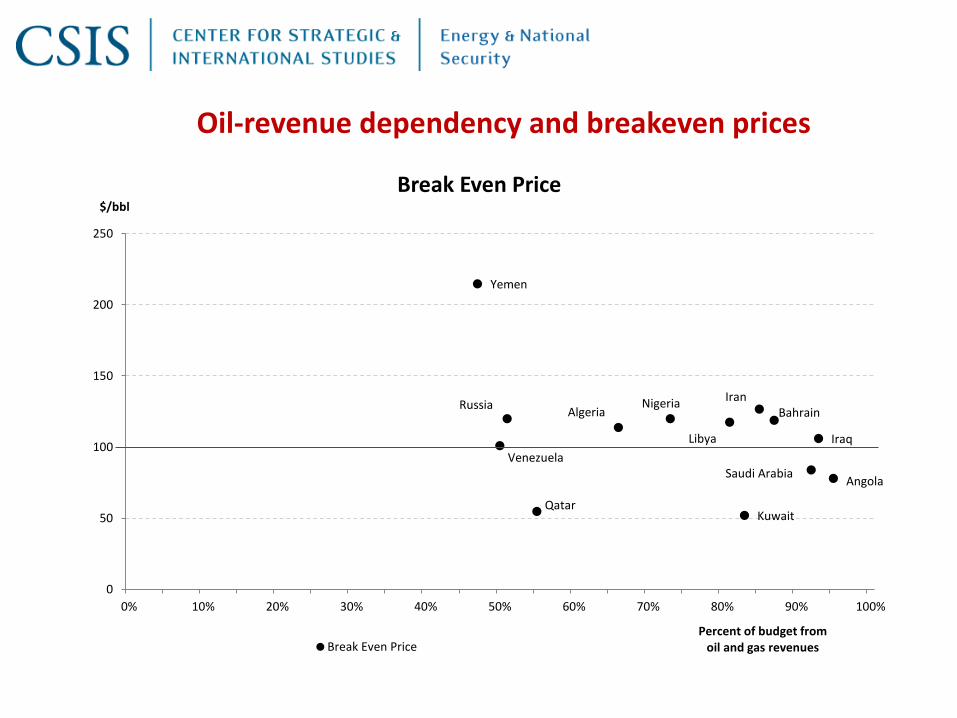
Yemen
Venezuela
Qatar
AlgeriaNigeria
Libya
Kuwait
IranBahrain
Saudi Arabia
Iraq
Angola
0
50
100
150
200
250
0% 10% 20% 30% 40% 50% 60% 70% 80% 90% 100%
$/bbl
Percent of budget from oil and gas revenues
Break Even Price
Break Even Price
Russia
Oil-revenue dependency and breakeven prices
Russia is more of a
petro-state than
the Soviet Union.
Oil and gas equal
more than 50% of
budget revenue
and 70% of export
earnings.


31
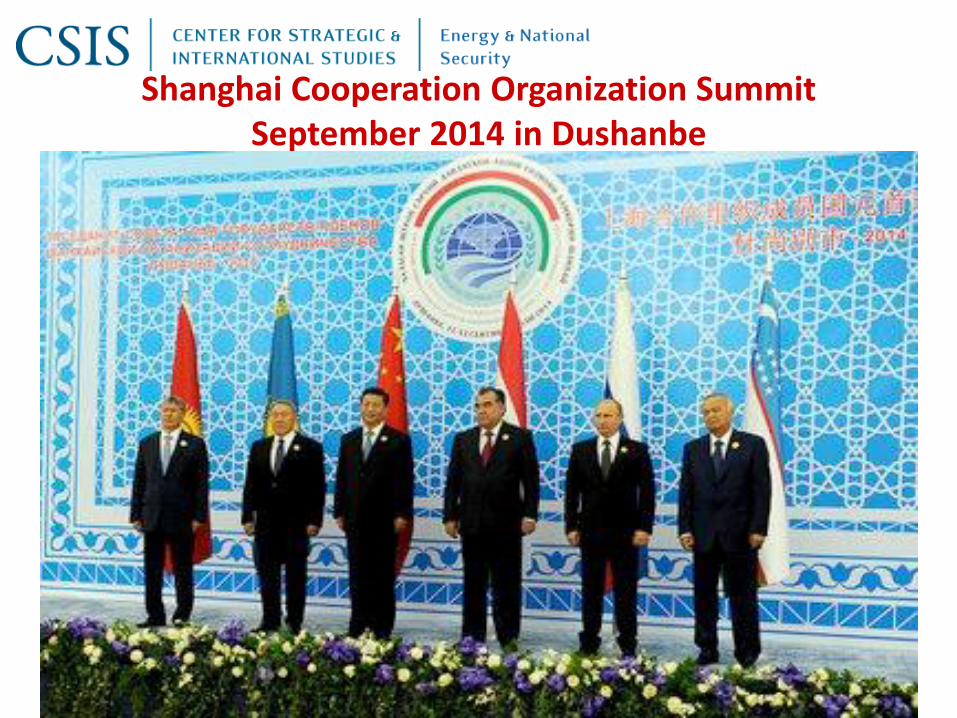
Shanghai Cooperation Organization SummitSeptember 2014 in Dushanbe
32
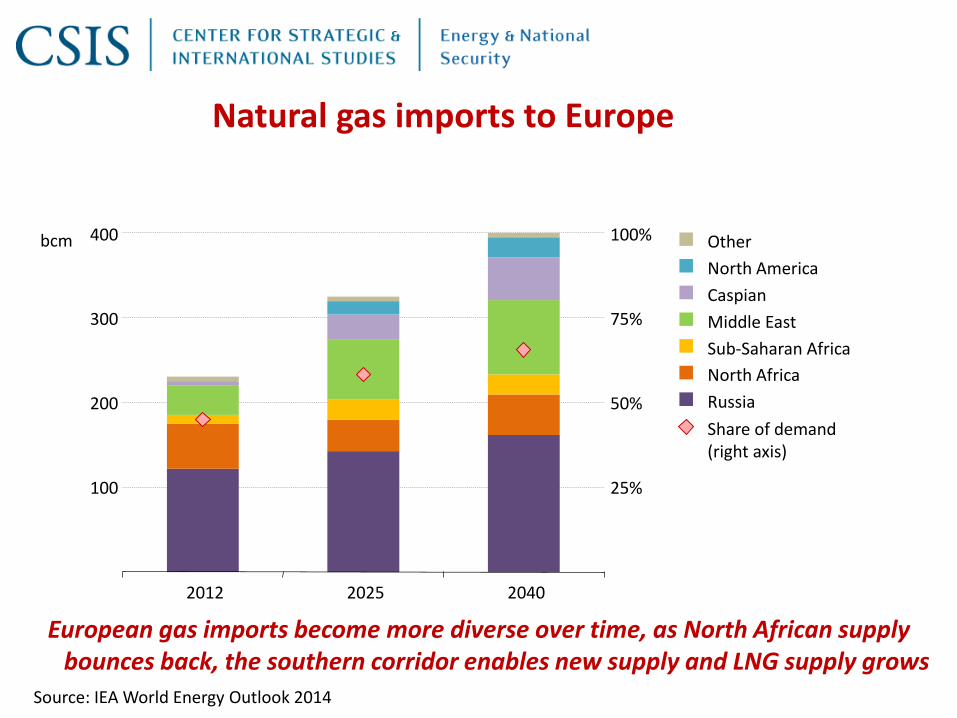
Natural gas imports to Europe
European gas imports become more diverse over time, as North African supply bounces back, the southern corridor enables new supply and LNG supply grows
100
200
300
400
2012 2025 2040
bcm
25%
50%
75%
100% Other
North America
Caspian
Middle East
Sub-Saharan Africa
North Africa
Russia
Share of demand(right axis)
Source: IEA World Energy Outlook 2014
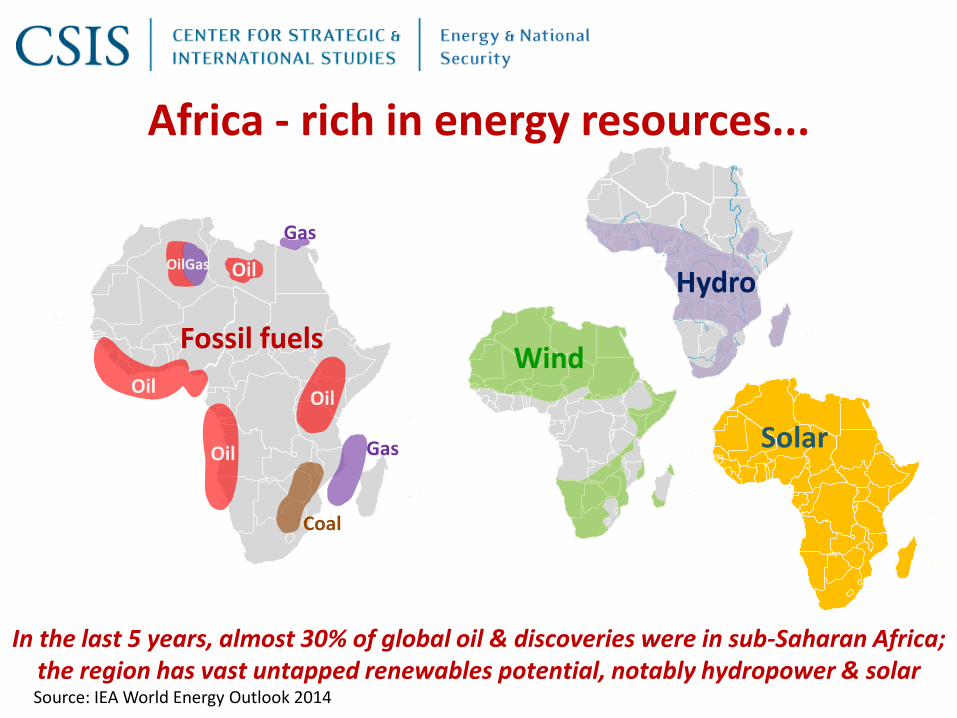
Africa - rich in energy resources...
In the last 5 years, almost 30% of global oil & discoveries were in sub-Saharan Africa;
Hydro
WindOil
Oil
Oil
OilGas
Gas
Oil
Coal
Gas
Fossil fuels
Solar
the region has vast untapped renewables potential, notably hydropower & solar Source: IEA World Energy Outlook 2014

In sub-Saharan Africa, 620 million people – two-thirds of the population – live without electricity. Only a handful of countries have electrification rates above 50%
Less than 50%
More than 50%
Share of population withaccess to electricity:
...but poor in energy supply
Source: IEA World Energy Outlook 2014

A changing balance to oil production
Oil production in sub-Saharan Africa
The region remains a major global supplier, although regulatory uncertainty, unrest & oil theft in Nigeria make Angola the main producer of crude oil until the 2020s
Other
Angola
Nigeria
Production:
1
2
3
4
5
6
7
2000 2013 2020 2030 2040
mb/d
Source: IEA World Energy Outlook 2014
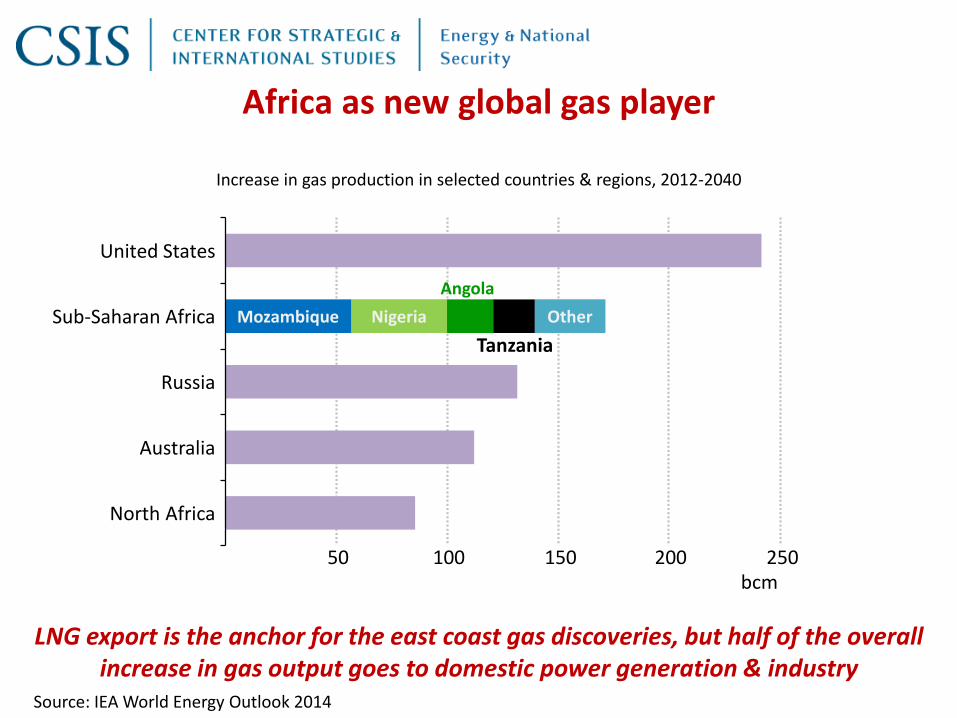
Africa as new global gas player
Increase in gas production in selected countries & regions, 2012-2040
LNG export is the anchor for the east coast gas discoveries, but half of the overall increase in gas output goes to domestic power generation & industry
50 100 150 200 250
North Africa
Australia
Russia
Sub-Saharan Africa
United States
bcm
Mozambique Nigeria Other
Angola
Tanzania
Source: IEA World Energy Outlook 2014
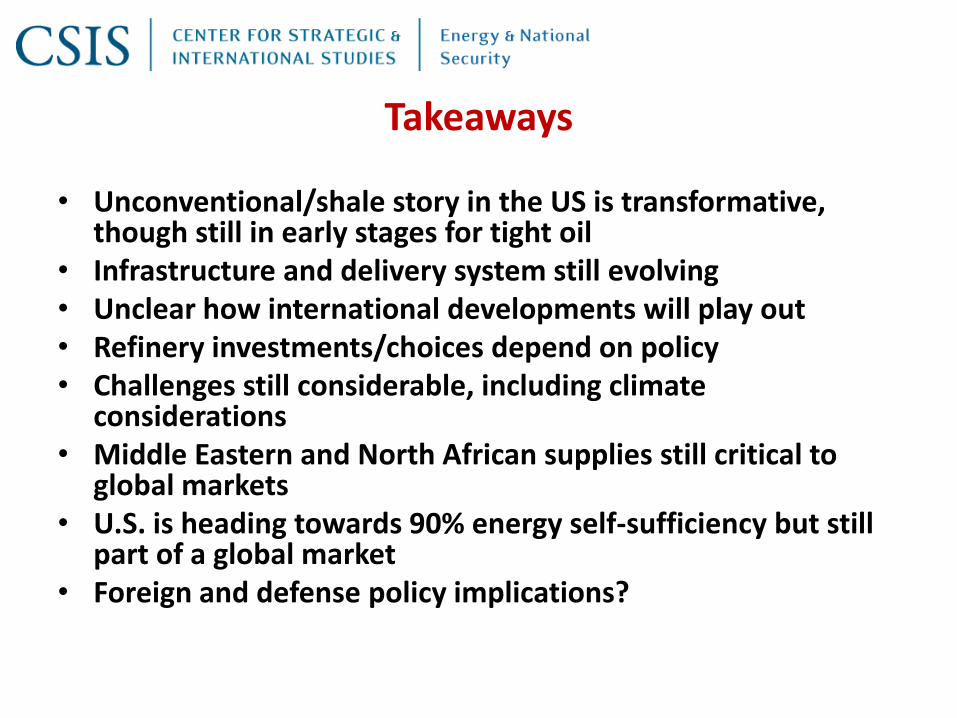
Takeaways
• Unconventional/shale story in the US is transformative, though still in early stages for tight oil
• Infrastructure and delivery system still evolving• Unclear how international developments will play out• Refinery investments/choices depend on policy• Challenges still considerable, including climate
considerations• Middle Eastern and North African supplies still critical to
global markets• U.S. is heading towards 90% energy self-sufficiency but still
part of a global market• Foreign and defense policy implications?