shortest path to graph technologies - download.oracle.com · graph capabilities in oracle big data...
TRANSCRIPT
Copyright © 2017, Oracle and/or its affiliates. All rights reserved. |
A Shortest Path to Using Graph Technologies Best Practices in Graph Construction, Indexing, Analytics and Visualization
Hans Viehmann Product Manager EMEA
Zhe Wu Architect
Redwood Shores, January 31, 2017
Copyright © 2017, Oracle and/or its affiliates. All rights reserved. |
Safe Harbor Statement The following is intended to outline our general product direction. It is intended for information purposes only, and may not be incorporated into any contract. It is not a commitment to deliver any material, code, or functionality, and should not be relied upon in making purchasing decisions. The development, release, and timing of any features or functionality described for Oracle’s products remains at the sole discretion of Oracle.
3
Copyright © 2017, Oracle and/or its affiliates. All rights reserved. | 4
Copyright © 2017, Oracle and/or its affiliates. All rights reserved. |
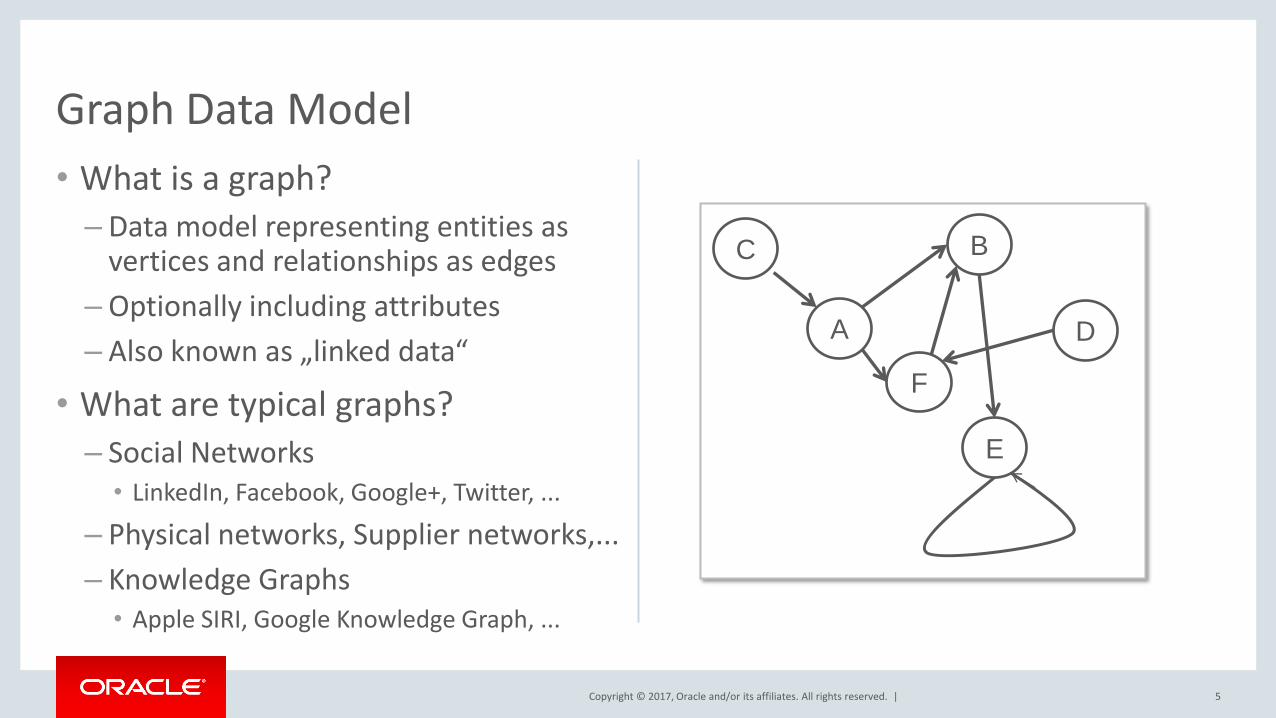
• What is a graph? – Data model representing entities as
vertices and relationships as edges – Optionally including attributes – Also known as „linked data“
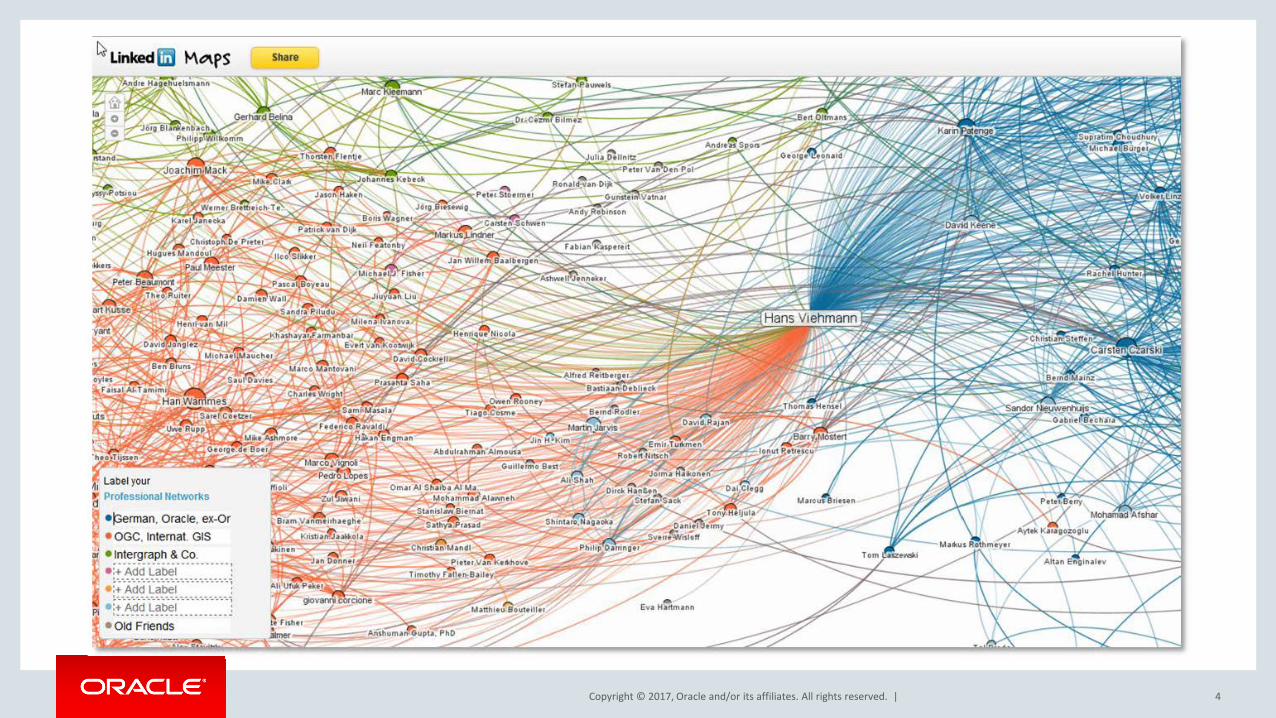
• What are typical graphs? – Social Networks
• LinkedIn, Facebook, Google+, Twitter, ... – Physical networks, Supplier networks,... – Knowledge Graphs
• Apple SIRI, Google Knowledge Graph, ...
Graph Data Model
E
A D
C B
F
5
Copyright © 2017, Oracle and/or its affiliates. All rights reserved. |
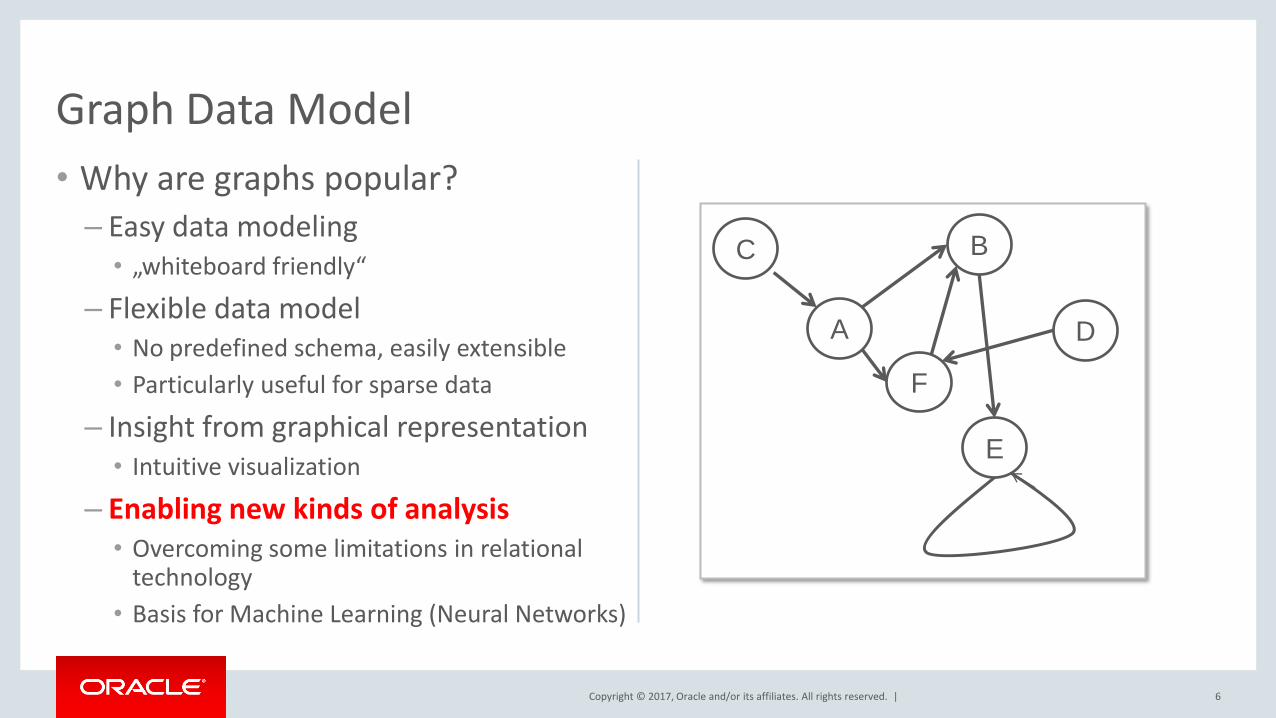
• Why are graphs popular? – Easy data modeling
• „whiteboard friendly“ – Flexible data model
• No predefined schema, easily extensible • Particularly useful for sparse data
– Insight from graphical representation • Intuitive visualization
– Enabling new kinds of analysis • Overcoming some limitations in relational
technology • Basis for Machine Learning (Neural Networks)
Graph Data Model
E
A D
C B
F
6
Copyright © 2017, Oracle and/or its affiliates. All rights reserved. |
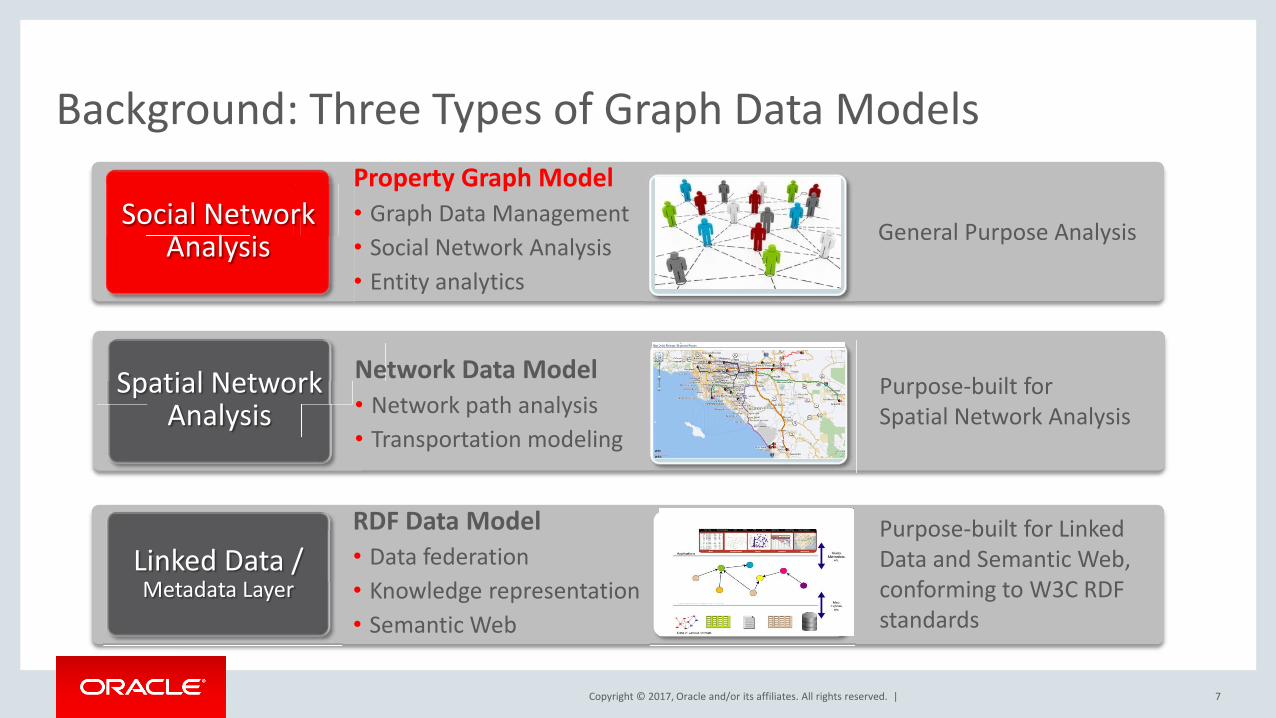
Background: Three Types of Graph Data Models
RDF Data Model • Data federation • Knowledge representation • Semantic Web
Social Network Analysis General Purpose Analysis
Linked Data / Metadata Layer
Property Graph Model • Graph Data Management • Social Network Analysis • Entity analytics
Purpose-built for Linked Data and Semantic Web, conforming to W3C RDF standards
Spatial Network Analysis
Purpose-built for Spatial Network Analysis
Network Data Model • Network path analysis • Transportation modeling
7
Copyright © 2017, Oracle and/or its affiliates. All rights reserved. |
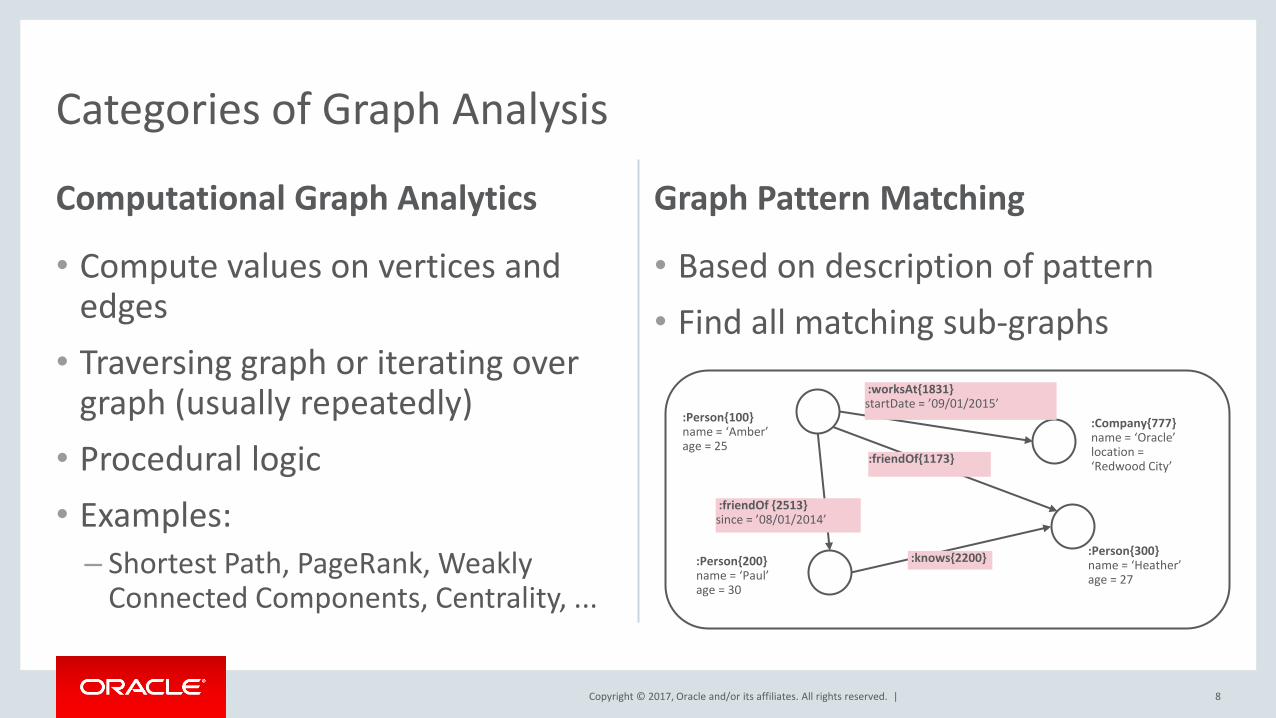
Computational Graph Analytics
• Compute values on vertices and edges
• Traversing graph or iterating over graph (usually repeatedly)
• Procedural logic • Examples:
– Shortest Path, PageRank, Weakly Connected Components, Centrality, ...
Graph Pattern Matching
• Based on description of pattern • Find all matching sub-graphs
Categories of Graph Analysis
:Person{100} name = ‘Amber’ age = 25
:Person{200} name = ‘Paul’ age = 30
:Person{300} name = ‘Heather’ age = 27
:Company{777} name = ‘Oracle’ location = ‘Redwood City’
:worksAt{1831} startDate = ’09/01/2015’
:friendOf{1173}
:knows{2200}
:friendOf {2513} since = ’08/01/2014’
8
Copyright © 2017, Oracle and/or its affiliates. All rights reserved. |
Examples for Graph Analysis • Community detection and influencer analysis
– Churn risk analysis/targeted marketing, HR Turnover analysis
• Product recommendation – Collaborative filtering, clustering
• Anomaly detection – Social Network Analysis (spam detection), fraud detection in healthcare
• Path analysis and reachability – Outage analysis in utilities networks, vulnerability analysis in IP networks, „Panama Papers“
• Pattern matching – Tax fraud detection, data extraction
9
Copyright © 2017, Oracle and/or its affiliates. All rights reserved. |
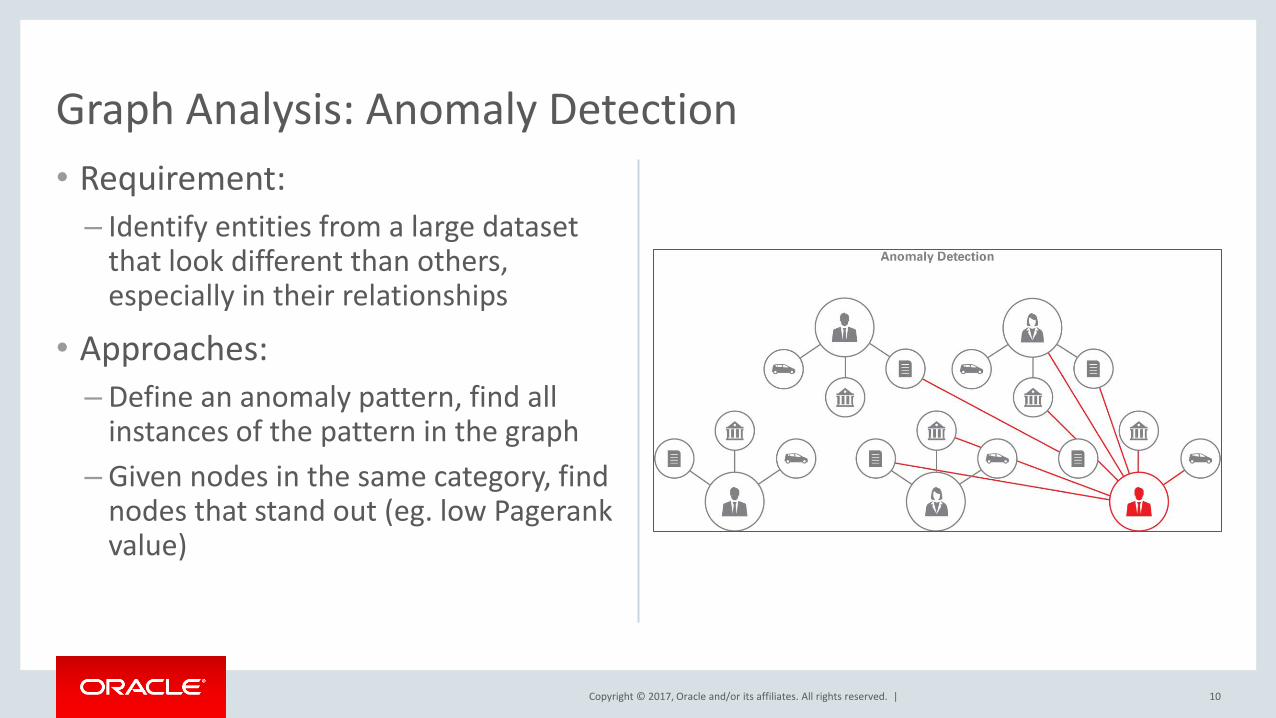
• Requirement: – Identify entities from a large dataset
that look different than others, especially in their relationships
• Approaches: – Define an anomaly pattern, find all
instances of the pattern in the graph – Given nodes in the same category, find
nodes that stand out (eg. low Pagerank value)
Graph Analysis: Anomaly Detection
10
Copyright © 2017, Oracle and/or its affiliates. All rights reserved. |
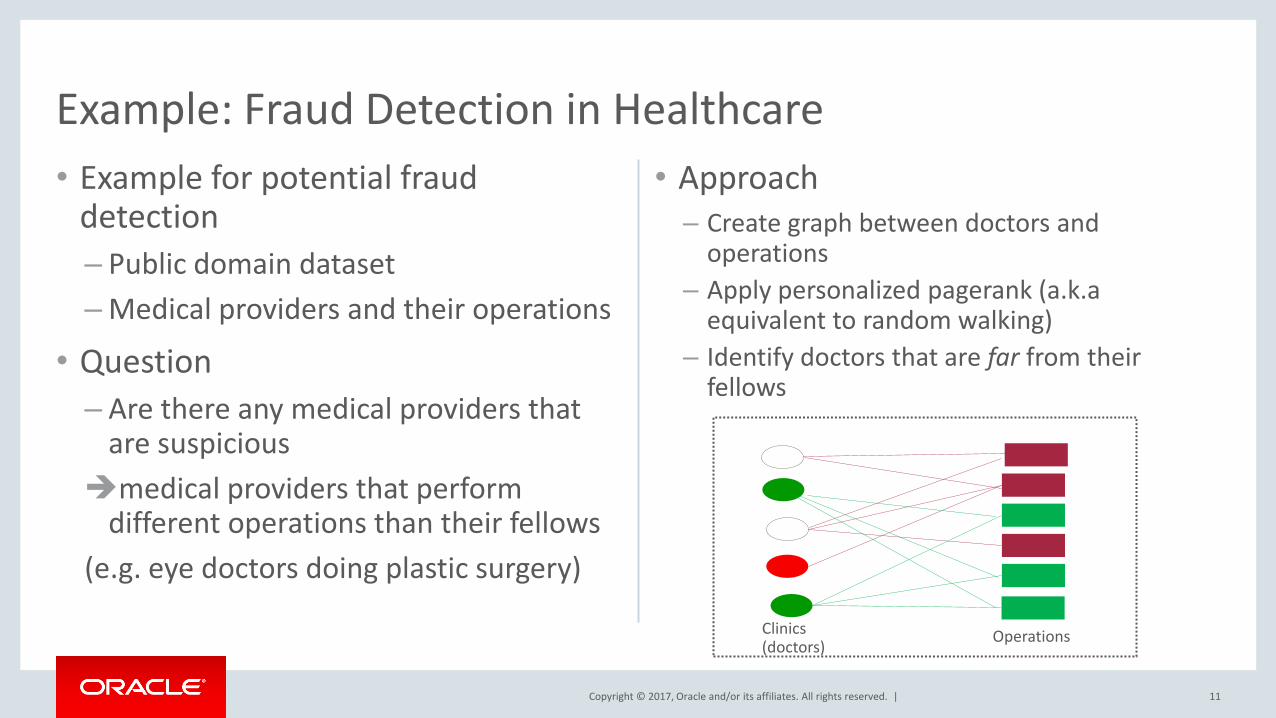
• Example for potential fraud detection – Public domain dataset – Medical providers and their operations
• Question – Are there any medical providers that
are suspicious medical providers that perform
different operations than their fellows (e.g. eye doctors doing plastic surgery)
• Approach – Create graph between doctors and
operations – Apply personalized pagerank (a.k.a
equivalent to random walking) – Identify doctors that are far from their
fellows
Example: Fraud Detection in Healthcare
Clinics (doctors) Operations
11
Copyright © 2017, Oracle and/or its affiliates. All rights reserved. |
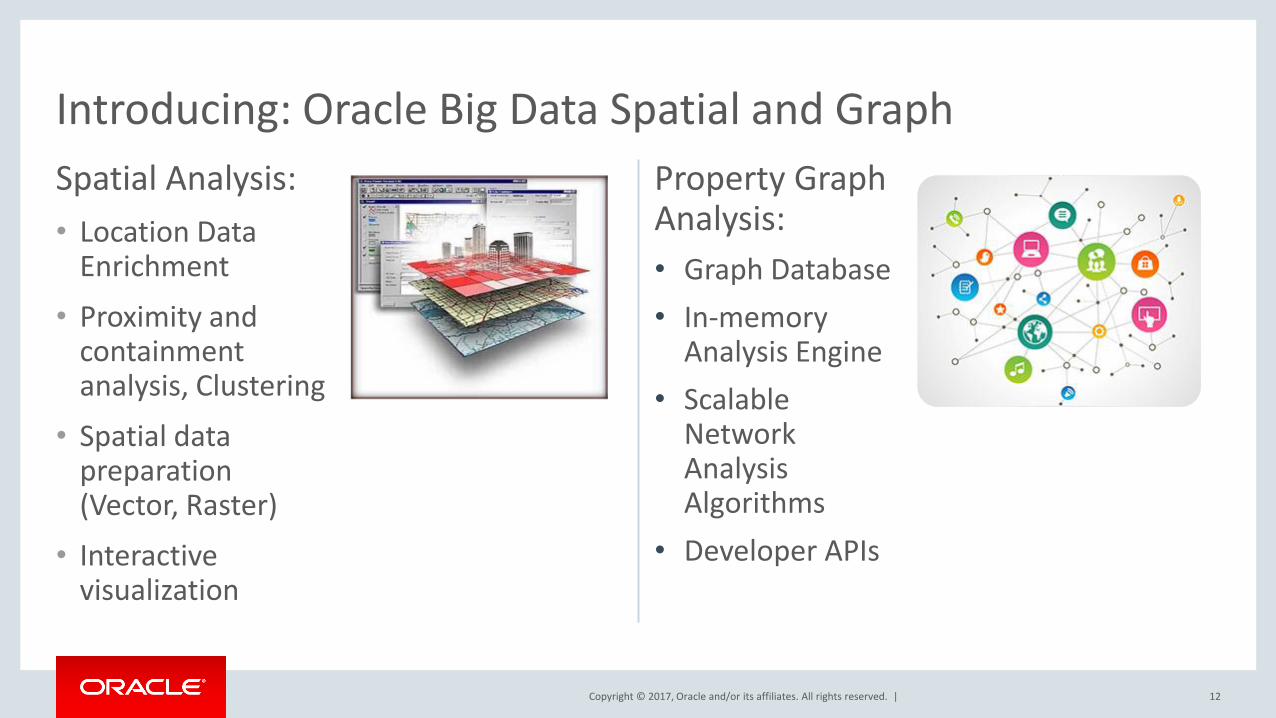
Introducing: Oracle Big Data Spatial and Graph Spatial Analysis: • Location Data
Enrichment • Proximity and
containment analysis, Clustering
• Spatial data preparation (Vector, Raster)
• Interactive visualization
Property Graph Analysis: • Graph Database • In-memory
Analysis Engine • Scalable
Network Analysis Algorithms
• Developer APIs
12
Copyright © 2017, Oracle and/or its affiliates. All rights reserved. |
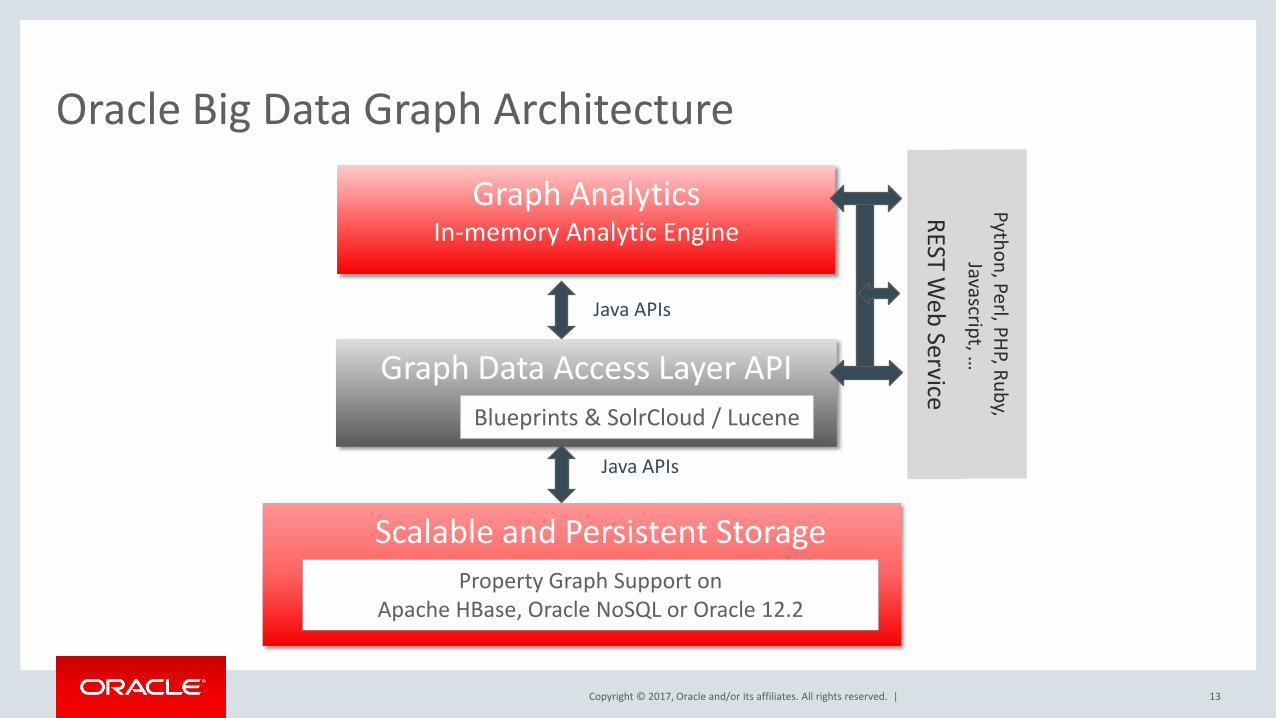
Oracle Big Data Graph Architecture
Scalable and Persistent Storage
Graph Data Access Layer API
Graph Analytics In-memory Analytic Engine
REST Web Service Blueprints & SolrCloud / Lucene
Property Graph Support on Apache HBase, Oracle NoSQL or Oracle 12.2
Python, Perl, PHP, Ruby, Javascript, …
Java APIs
Java APIs
13
Copyright © 2017, Oracle and/or its affiliates. All rights reserved. |
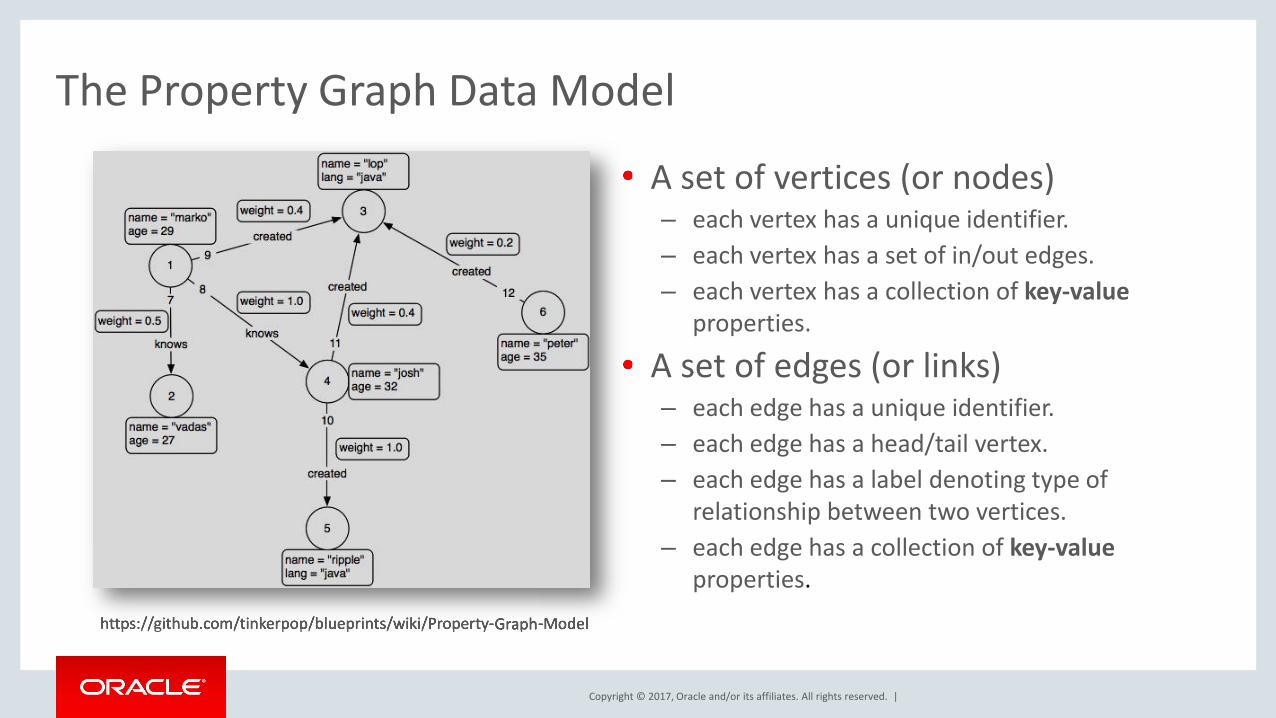
The Property Graph Data Model
• A set of vertices (or nodes) – each vertex has a unique identifier. – each vertex has a set of in/out edges. – each vertex has a collection of key-value
properties.
• A set of edges (or links) – each edge has a unique identifier. – each edge has a head/tail vertex. – each edge has a label denoting type of
relationship between two vertices. – each edge has a collection of key-value
properties.
https://github.com/tinkerpop/blueprints/wiki/Property-Graph-Model
•
•
https://github.com/tinkerpop/blueprints/wiki/Property-Graph-Model
Copyright © 2017, Oracle and/or its affiliates. All rights reserved. |
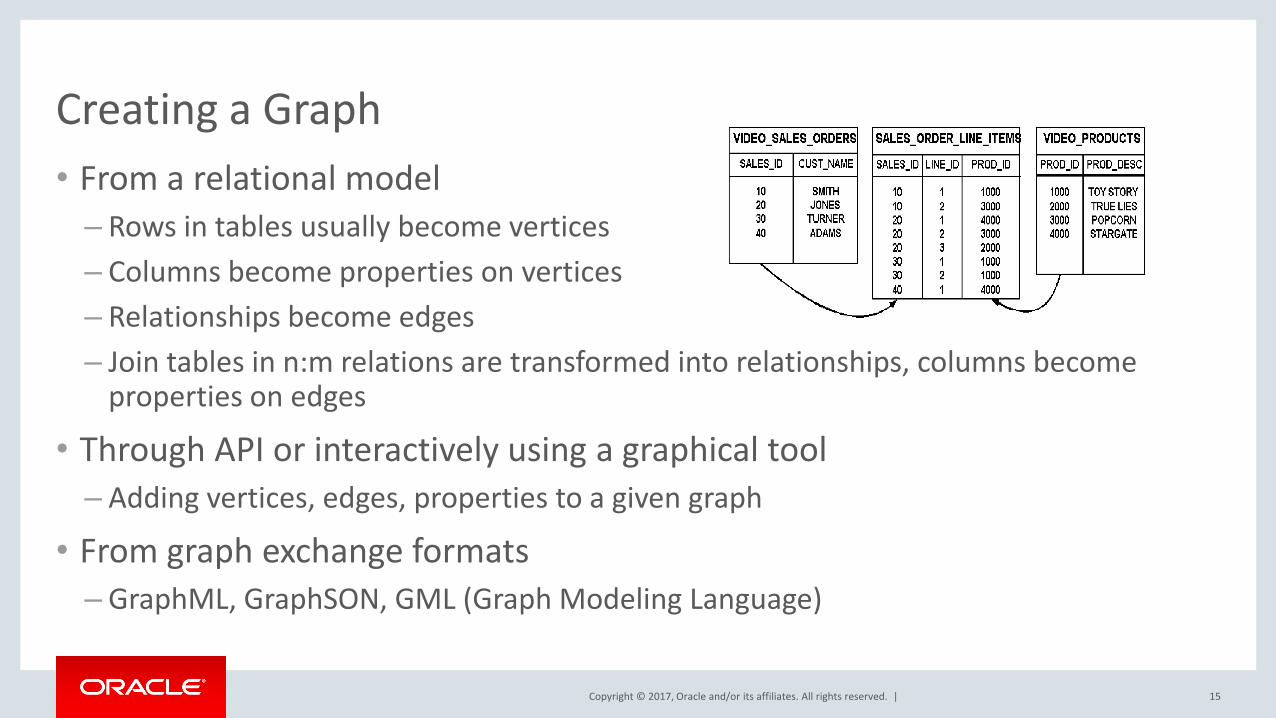
Creating a Graph • From a relational model
– Rows in tables usually become vertices – Columns become properties on vertices – Relationships become edges – Join tables in n:m relations are transformed into relationships, columns become
properties on edges
• Through API or interactively using a graphical tool – Adding vertices, edges, properties to a given graph
• From graph exchange formats – GraphML, GraphSON, GML (Graph Modeling Language)
15
Copyright © 2017, Oracle and/or its affiliates. All rights reserved. |
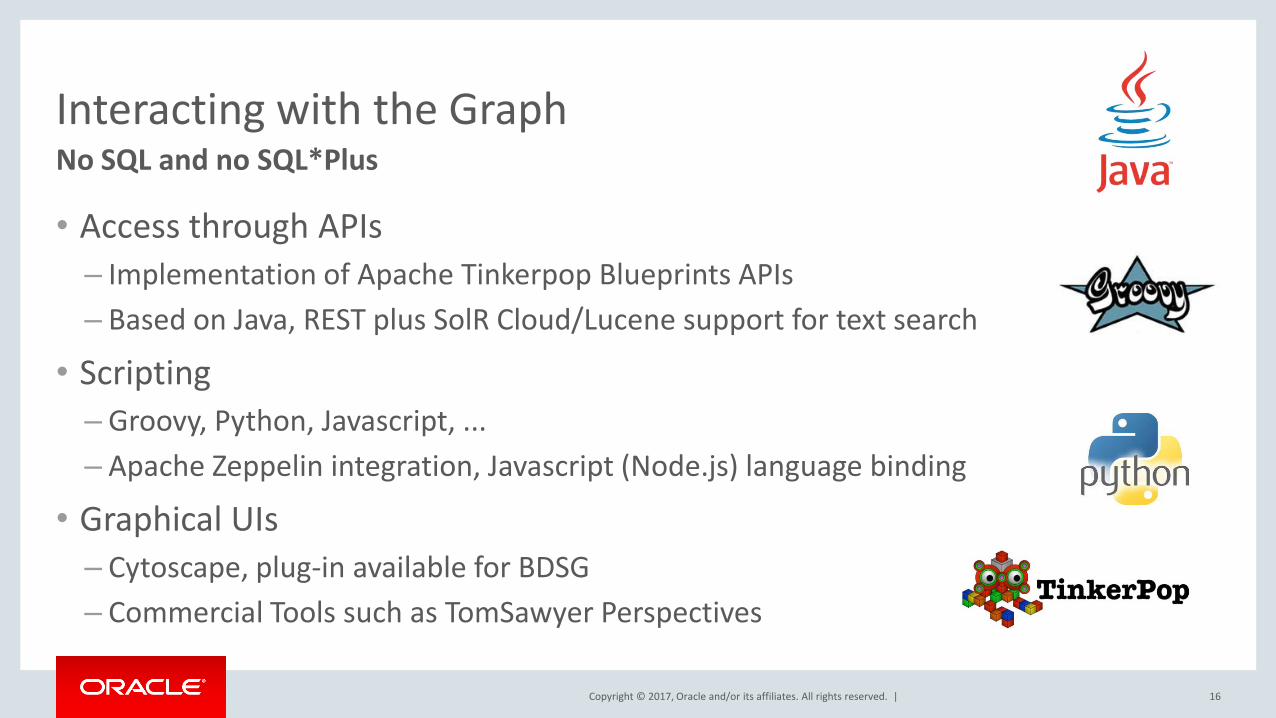
Interacting with the Graph
• Access through APIs – Implementation of Apache Tinkerpop Blueprints APIs – Based on Java, REST plus SolR Cloud/Lucene support for text search
• Scripting – Groovy, Python, Javascript, ... – Apache Zeppelin integration, Javascript (Node.js) language binding
• Graphical UIs – Cytoscape, plug-in available for BDSG – Commercial Tools such as TomSawyer Perspectives
No SQL and no SQL*Plus
16
Copyright © 2017, Oracle and/or its affiliates. All rights reserved. |
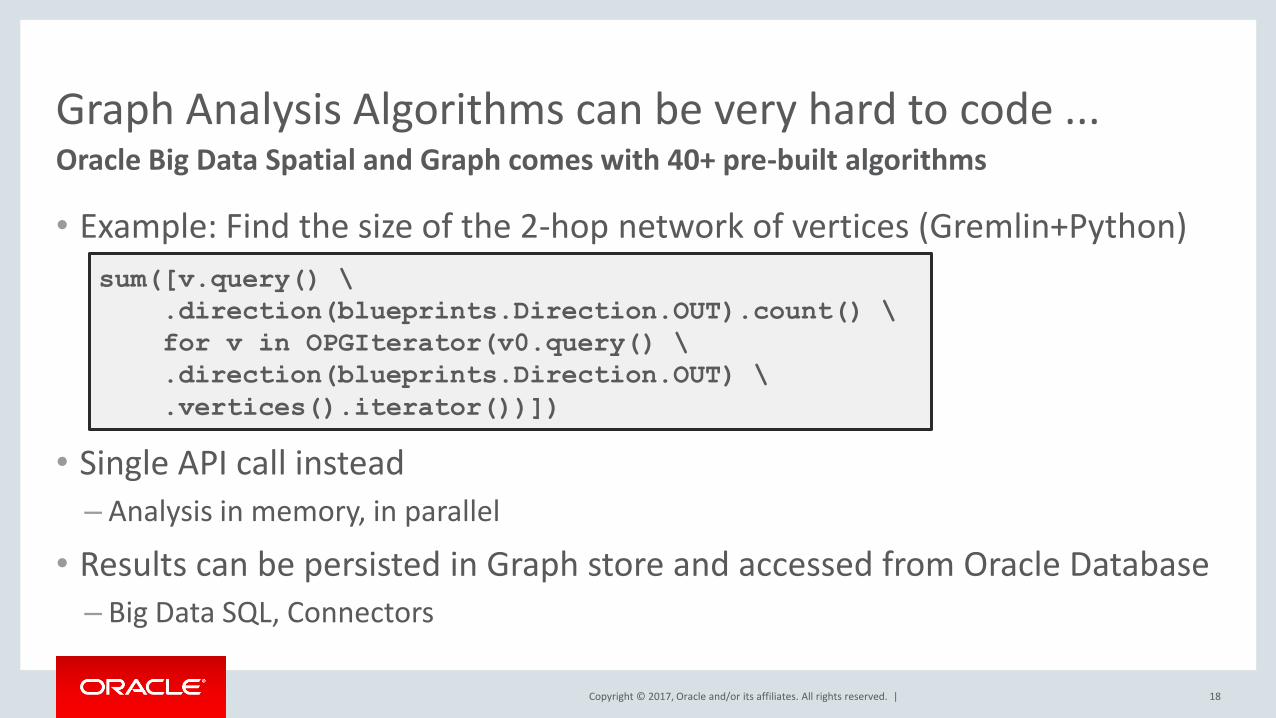
Graph Analysis Algorithms can be very hard to code ...
• Example: Find the size of the 2-hop network of vertices (Gremlin+Python)
• Single API call instead – Analysis in memory, in parallel
• Results can be persisted in Graph store and accessed from Oracle Database – Big Data SQL, Connectors
Oracle Big Data Spatial and Graph comes with 40+ pre-built algorithms
sum([v.query() \
.direction(blueprints.Direction.OUT).count() \
for v in OPGIterator(v0.query() \
.direction(blueprints.Direction.OUT) \
.vertices().iterator())])
18
Copyright © 2017, Oracle and/or its affiliates. All rights reserved. |
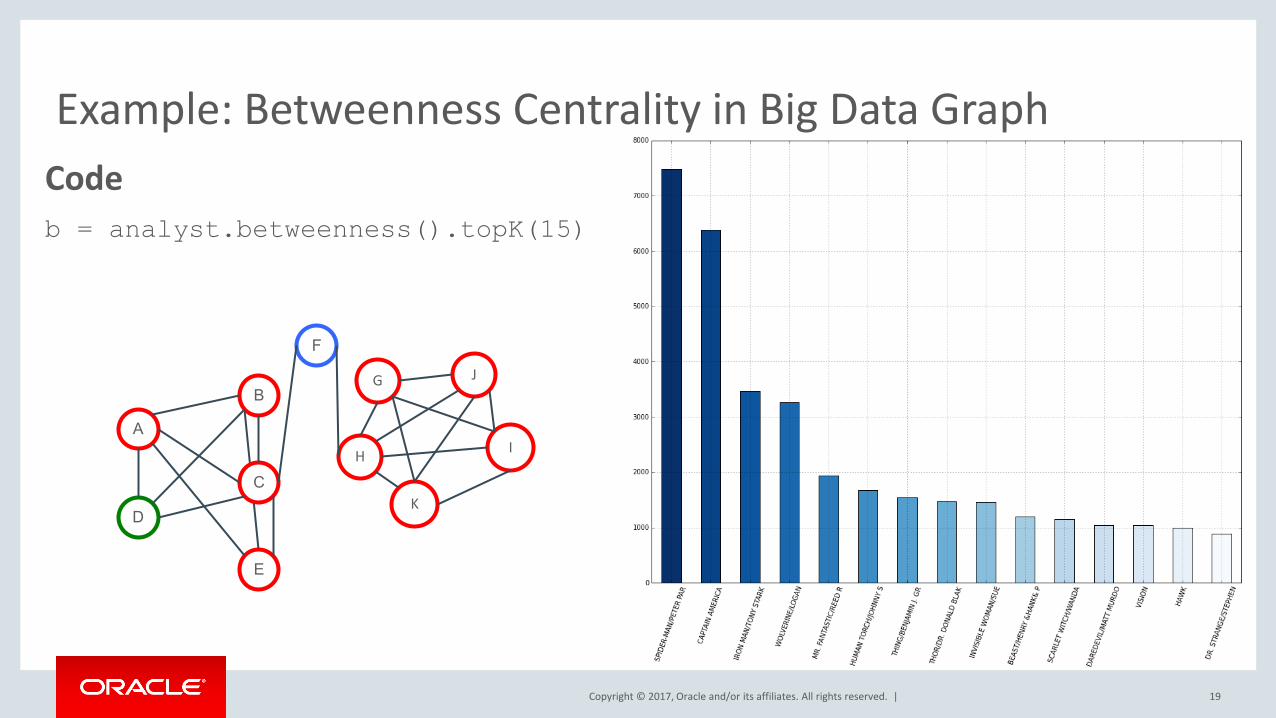
Example: Betweenness Centrality in Big Data Graph Code b = analyst.betweenness().topK(15)
19
D
A
C
E
B
F
I
J
H
K
G
Copyright © 2017, Oracle and/or its affiliates. All rights reserved. |
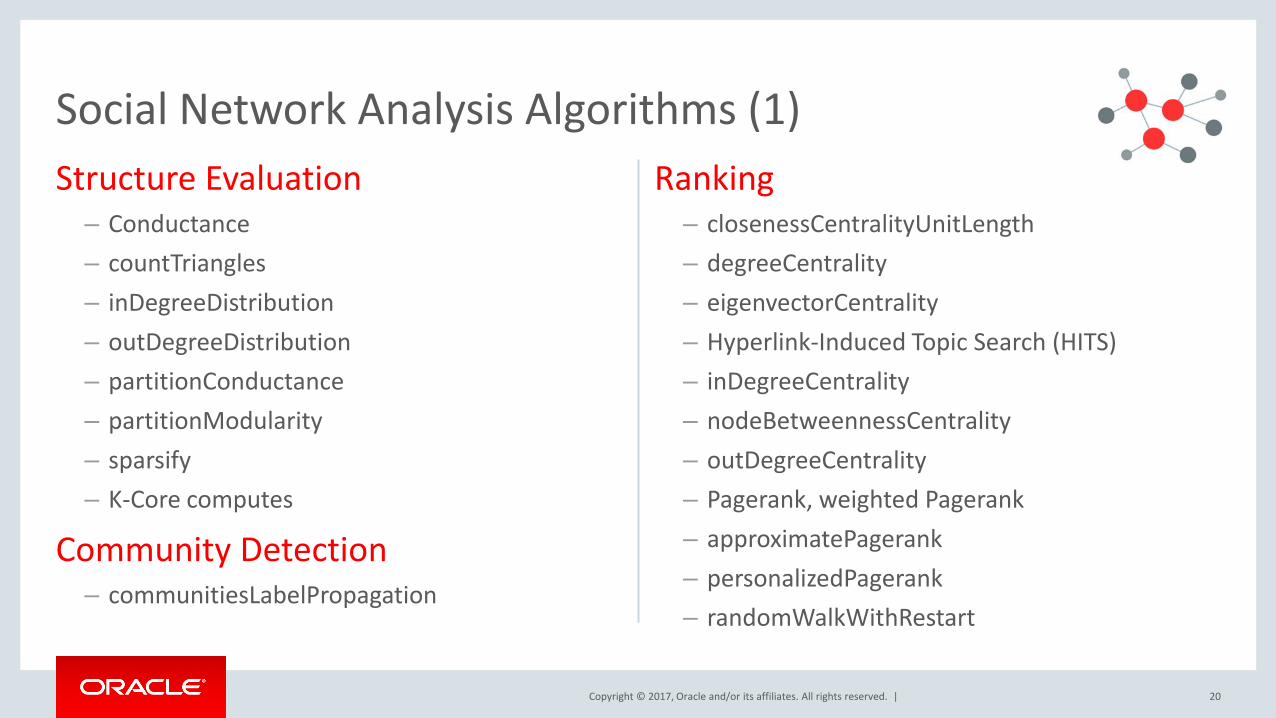
Structure Evaluation – Conductance – countTriangles – inDegreeDistribution – outDegreeDistribution – partitionConductance – partitionModularity – sparsify – K-Core computes
Community Detection – communitiesLabelPropagation
Ranking – closenessCentralityUnitLength – degreeCentrality – eigenvectorCentrality – Hyperlink-Induced Topic Search (HITS) – inDegreeCentrality – nodeBetweennessCentrality – outDegreeCentrality – Pagerank, weighted Pagerank – approximatePagerank – personalizedPagerank – randomWalkWithRestart
20
Social Network Analysis Algorithms (1)
Copyright © 2017, Oracle and/or its affiliates. All rights reserved. |
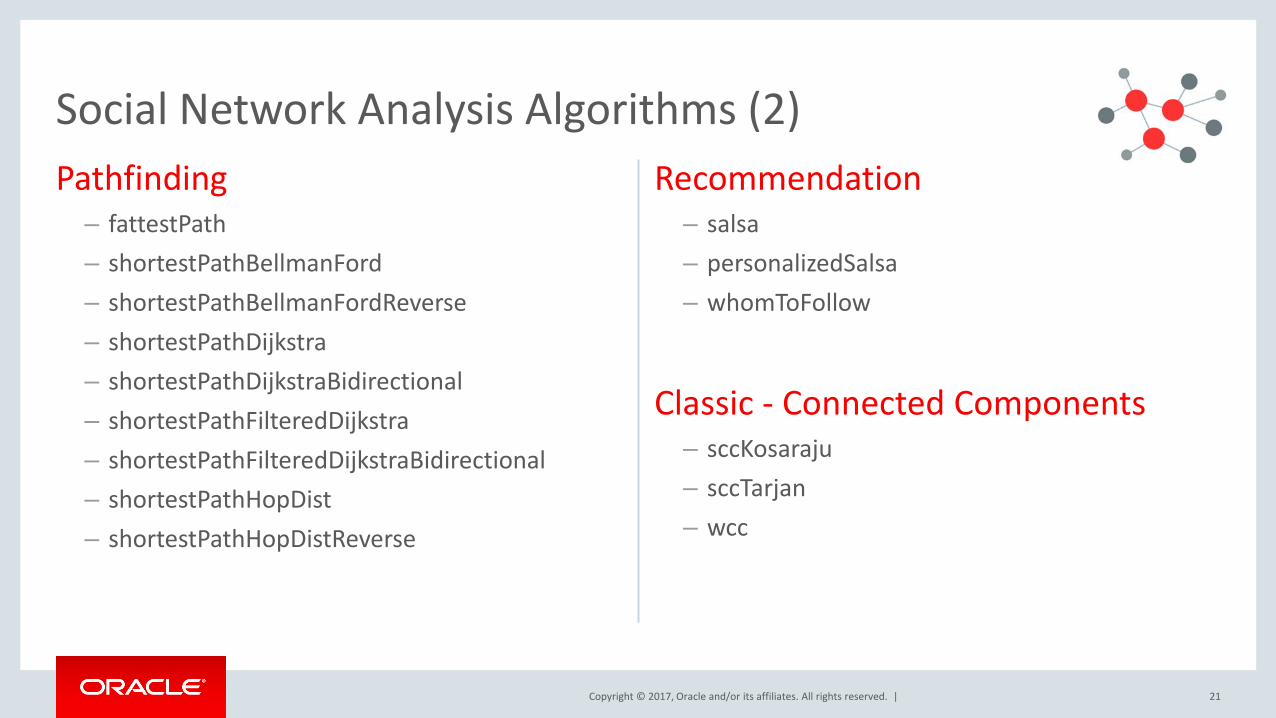
Pathfinding – fattestPath – shortestPathBellmanFord – shortestPathBellmanFordReverse – shortestPathDijkstra – shortestPathDijkstraBidirectional – shortestPathFilteredDijkstra – shortestPathFilteredDijkstraBidirectional – shortestPathHopDist – shortestPathHopDistReverse
Recommendation – salsa – personalizedSalsa – whomToFollow
Classic - Connected Components – sccKosaraju – sccTarjan – wcc
21
Social Network Analysis Algorithms (2)
Copyright © 2017, Oracle and/or its affiliates. All rights reserved. |
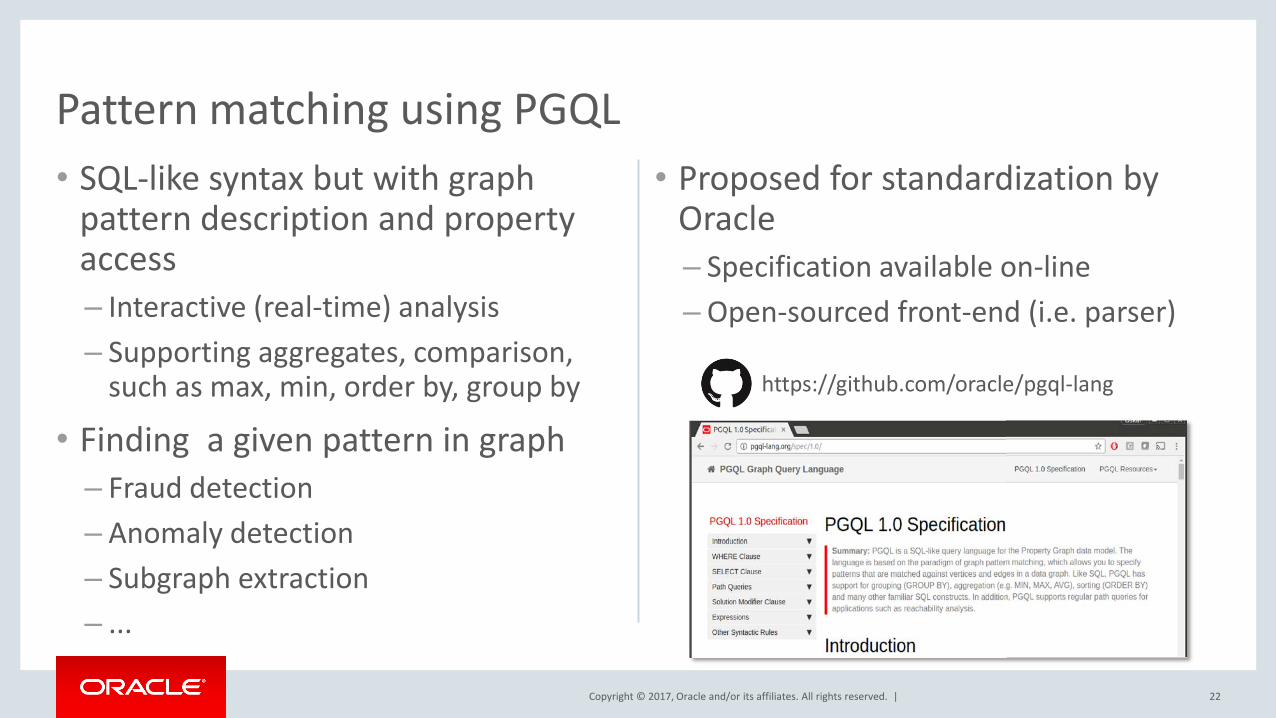
• SQL-like syntax but with graph pattern description and property access – Interactive (real-time) analysis – Supporting aggregates, comparison,
such as max, min, order by, group by
• Finding a given pattern in graph – Fraud detection – Anomaly detection – Subgraph extraction – ...
• Proposed for standardization by Oracle – Specification available on-line – Open-sourced front-end (i.e. parser)
Pattern matching using PGQL
https://github.com/oracle/pgql-lang
22
Copyright © 2017, Oracle and/or its affiliates. All rights reserved. |
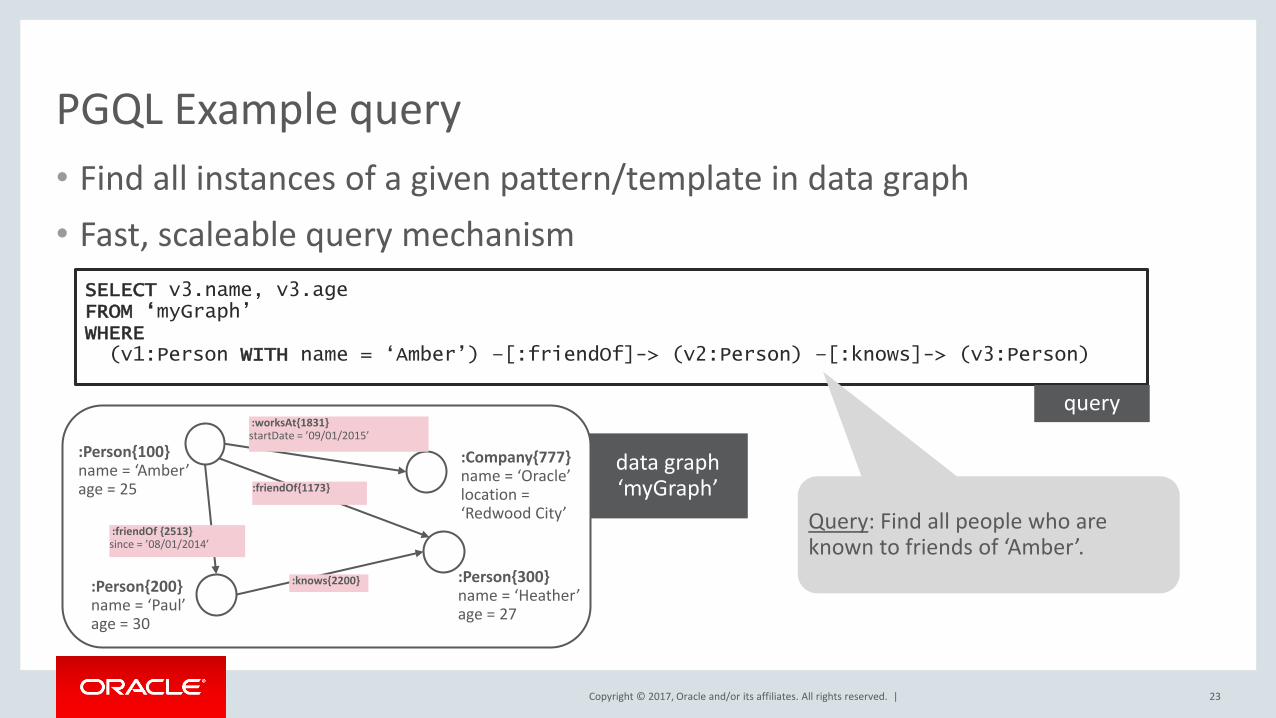
PGQL Example query • Find all instances of a given pattern/template in data graph • Fast, scaleable query mechanism
SELECT v3.name, v3.age FROM ‘myGraph’ WHERE (v1:Person WITH name = ‘Amber’) –[:friendOf]-> (v2:Person) –[:knows]-> (v3:Person)
query
Query: Find all people who are known to friends of ‘Amber’.
data graph ‘myGraph’
:Person{100} name = ‘Amber’ age = 25
:Person{200} name = ‘Paul’ age = 30
:Person{300} name = ‘Heather’ age = 27
:Company{777} name = ‘Oracle’ location = ‘Redwood City’
:worksAt{1831} startDate = ’09/01/2015’
:friendOf{1173}
:knows{2200}
:friendOf {2513} since = ’08/01/2014’
23

Copyright © 2017, Oracle and/or its affiliates. All rights reserved. |
Text Search through Apache Lucene/Solr • Use text indexing to access vertices or edges
– Eg. find person with given name as starting point for reachability analysis – oraclePropertyGraph.createKeyIndex(“name”, Vertex.class); – oraclePropertyGraph.getVertices(“name”, “*Obama*”, true);
• Based on Apache Solr/Solr Cloud – Highly scaleable through sharding and replication
• Uses Apache Lucene under the covers – open source text search engine library – inverted index, ranked searching, fuzzy matching …
• Supports manual and auto indexing of Graph elements
24
Copyright © 2017, Oracle and/or its affiliates. All rights reserved. |
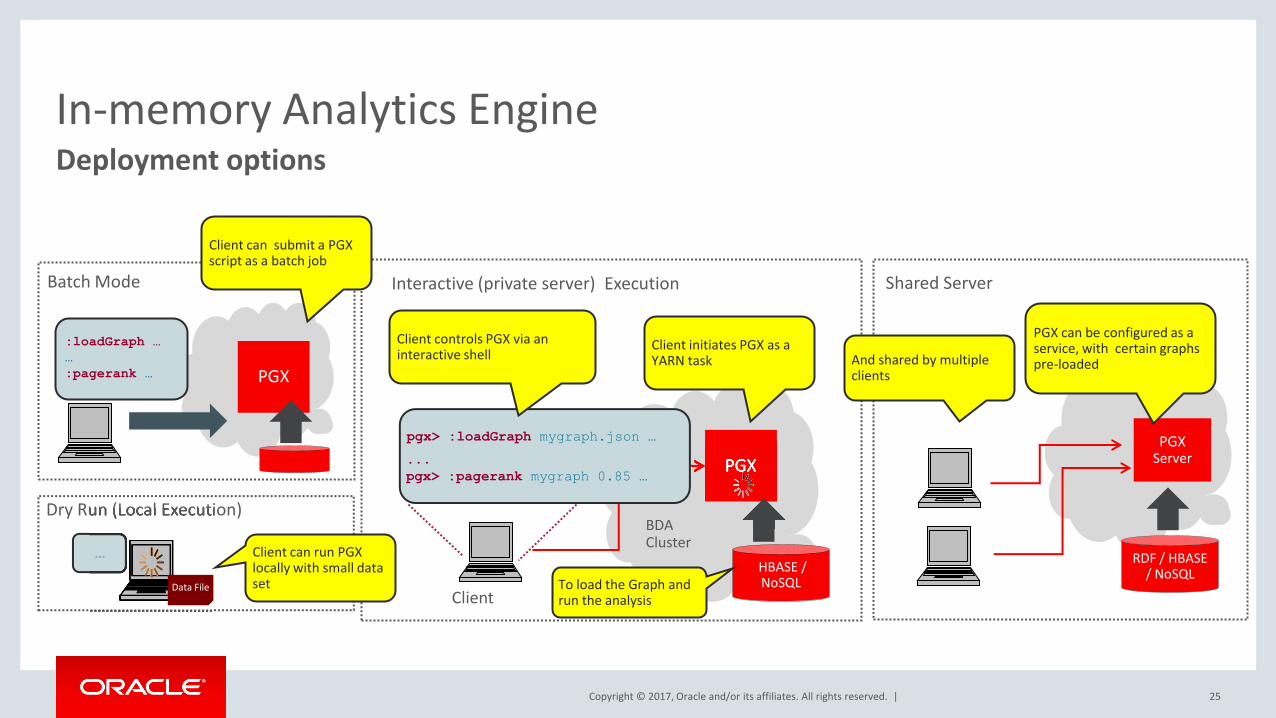
In-memory Analytics Engine Deployment options
PGX
HBASE / NoSQL
Client initiates PGX as a YARN task
Interactive (private server) Execution
pgx> :loadGraph mygraph.json …
BDA Cluster
Client
Client controls PGX via an interactive shell
... pgx> :pagerank mygraph 0.85 …
To load the Graph and run the analysis
PGX
Shared Server
PGX Server
RDF / HBASE / NoSQL
PGX can be configured as a service, with certain graphs pre-loaded And shared by multiple
clients
Batch Mode
:loadGraph … … :pagerank …
Client can submit a PGX script as a batch job
PGX
Dry Run (Local Execution)
…
Dry Run (Local Execution)
… Client can run PGX locally with small data set Data File
25
Copyright © 2017, Oracle and/or its affiliates. All rights reserved. |
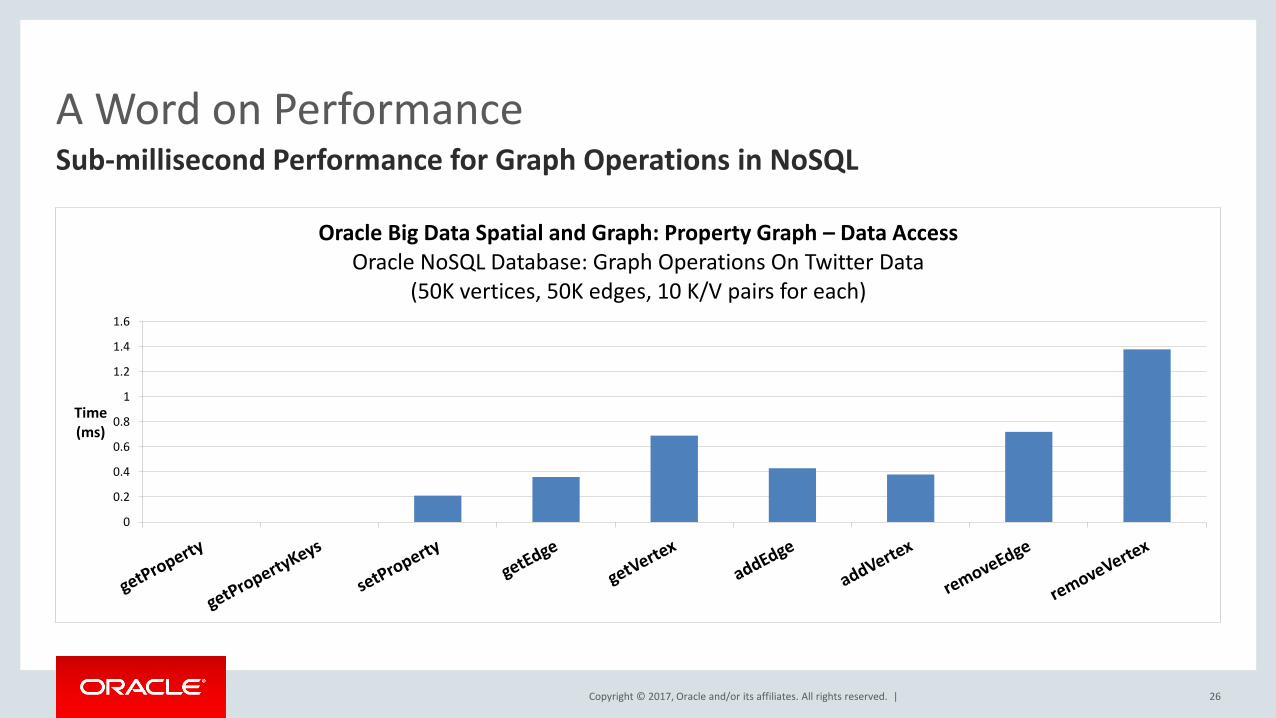
A Word on Performance Sub-millisecond Performance for Graph Operations in NoSQL
0
0.2
0.4
0.6
0.8
1
1.2
1.4
1.6
Time (ms)
Oracle Big Data Spatial and Graph: Property Graph – Data Access Oracle NoSQL Database: Graph Operations On Twitter Data
(50K vertices, 50K edges, 10 K/V pairs for each)
26

Copyright © 2017, Oracle and/or its affiliates. All rights reserved. |
Graph Analysis: Performance Compared with Neo4J
0.01
0.1
1
10
100
1000
10000
100000
Q1 Q2 Q3 Q4 Q5 Q6 Q7 Q8
Tim
e (m
s)
Linux Kernel analysis on X86PGX Neo4j
210x 276x 285x 276x 225x 909x
11987x
525x
Basic graph pattern Path queries Path queries Path queries Path queries Single
shortest path Bulk shortest
path
X86 Server
Xeon E5-2660 2.2Ghz
2 socket
x 8 cores
x 2HT
256GB DRAM
Neo4J: 2.2.1
Data:
- Linux kernel code as a
graph
- Program analysis queries
Path queries of Linux kernel source code
Huge performance advantage over Neo4J graph DB
(2~4 orders of magnitude)
27
Copyright © 2017, Oracle and/or its affiliates. All rights reserved. |
Distributed Graph Analysis Engine
• Oracle Big Data Spatial and Graph uses very compact graph representation – Can fit graph with ~23bn edges into one BDA node
• Distributed implementation scales beyond this – Processing even larger graphs with several machines in a cluster (scale-out) – Interconnected through fast network (Ethernet or, ideally, Infiniband)
• Integrated with YARN for resource management – Same client interface, but not all APIs implemented yet
• Again, much faster than other implementations – Comprehensive performance comparison with GraphX, GraphLab
Handling extremely large graphs
28
Copyright © 2017, Oracle and/or its affiliates. All rights reserved. |
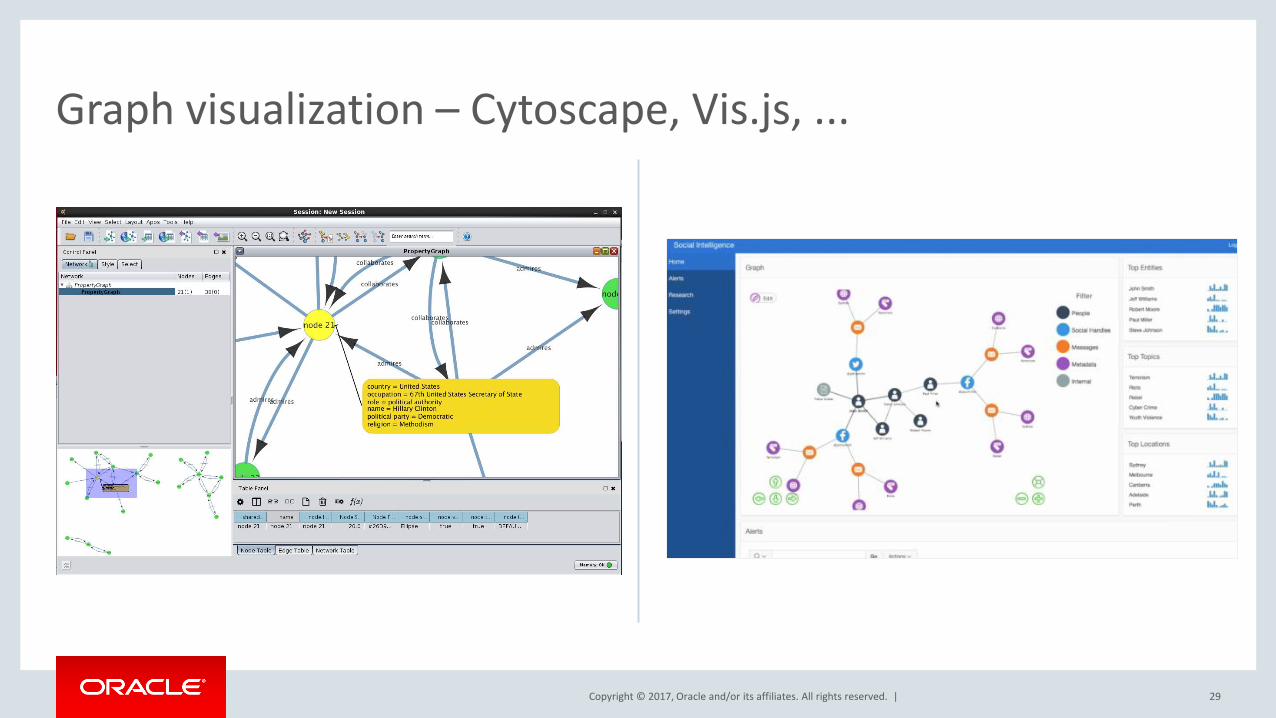
Graph visualization – Cytoscape, Vis.js, ...
29
Copyright © 2017, Oracle and/or its affiliates. All rights reserved. |
Summary Graph capabilities in Oracle Big Data Spatial and Graph
• Graph databases are powerful tools, complementing relational databases – Especially strong for analysis of graph topology and multi-hop relationships
• Graph analytics offer new insight – Especially relationships, dependencies and behavioural patterns
• Oracle Big Data Spatial and Graph offers – Comprehensive analytics through various APIs, integration with relational database – Scaleable, parallel in-memory processing – Secure and scaleable graph storage on Hadoop using Oracle NoSQL or HBase
• Runs on commodity hardware or BDA, both on-premise or in the Cloud
30
Copyright © 2017, Oracle and/or its affiliates. All rights reserved. |
BIWA Sessions on Graph Analysis • Robin Moffat, RittmanMead – Analysing the Panama Papers • Mark Rittman, MJR Associates – Understanding how a Tweet goes Viral • Ugur Demiyurek, USC – Context Aware Geosocial Graph Mining • Hassan Chafi & Mark Hornick, Oracle – Graph and Machine Learning using R • Kevin Madden, TomSawyer – Visualizing Graph Data with Geospatial Information • Jean Villedieu, Linkurious – Fighting Financial Crime • Wojciech Wcisło, Oracle – Tax Fraud Detection • Chris Nicholson, Skymind & Charlie Berger/Zhe Wu, Oracle – Recommender Systems,
Network Intrusion and Deep Learning • plus a Hands-On Workshop with Gabriela Moreno & Oskar van Rest, Oracle
31
Copyright © 2017, Oracle and/or its affiliates. All rights reserved. |
Q&A 32
Copyright © 2017, Oracle and/or its affiliates. All rights reserved. |
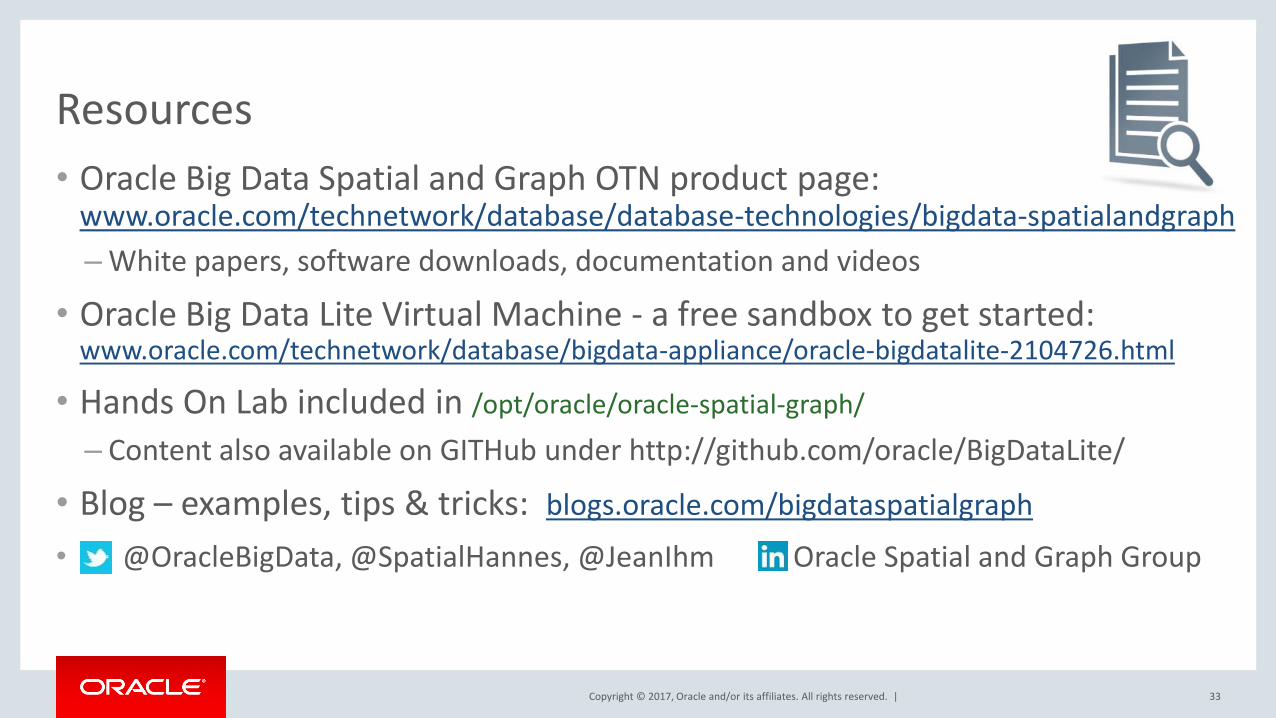
Resources • Oracle Big Data Spatial and Graph OTN product page:
www.oracle.com/technetwork/database/database-technologies/bigdata-spatialandgraph – White papers, software downloads, documentation and videos
• Oracle Big Data Lite Virtual Machine - a free sandbox to get started: www.oracle.com/technetwork/database/bigdata-appliance/oracle-bigdatalite-2104726.html
• Hands On Lab included in /opt/oracle/oracle-spatial-graph/ – Content also available on GITHub under http://github.com/oracle/BigDataLite/
• Blog – examples, tips & tricks: blogs.oracle.com/bigdataspatialgraph • @OracleBigData, @SpatialHannes, @JeanIhm Oracle Spatial and Graph Group
33
Copyright © 2017, Oracle and/or its affiliates. All rights reserved. | 34
