simulation driven design improvement of … driven design improvement of the marshall multispread...
TRANSCRIPT

Presented at 2013 Society for Engineering in Agriculture (SEAg) Conference
Sept. 22-25, 2013, Mandurah, West Australia
SIMULATION DRIVEN DESIGN IMPROVEMENT OF THE MARSHALL MULTISPREAD FERTILISER SPREADER
Dr Ross Waring1, Dr Andrei Horvat2, Matthew Roesner3
1. Proxima Consulting, Suite 37 Chelsea Village 145 Stirling Highway, Nedlands 6009 WA Australia 2. MMI Engineering, Suite 7 Corum 2 Corum Office Park Crown Way Warmley Bristol BS30 8FJ UK
3. Roesner Pty Ltd, Lot 101 Turnbull St, Harvey 6220 WA Australia
ABSTRACT
With the rising cost of nitrogen based fertilisers caused by global energy price increases, and concerns surrounding the depletion of global phosphorus resources, efficient use of fertiliser is a major concern for modern Agriculture. Equipment used to apply fertiliser should be accurate and precisely calibrated as variations in the distribution of fertilisers can lead to reductions in crop yield, soil damage and environmental run-off which ultimately lead to loss of income to the farmer.
In a competitive environment, a simulation driven design process can significantly reduce development time of agricultural machinery. This paper looks at the development of a numerical model that was used to improve the design of the Marshall Multispread fertiliser spreader. The model tracks fertiliser particles as they are loaded onto the spinner disc, are captured by the spinner vanes and then subsequently ejected over the field.
Key design parameters such as spinner speed; particle loading position on the disc; the number of spinner vanes and their angle relative to the centre of the disc; particle drag coefficient and breakage thresholds and prevailing wind speed and direction are used as model inputs. Using particle motion and ballistic equations, the model outputs a map of the fertiliser distribution for a given paddock area which can be used as a comparison against industry based performance standards.
A number of techniques were used to validate the model outputs including high speed photography, a bespoke collector device for measurement of angular distribution of particles as they leave the spinner disc and field based spread testing under controlled conditions.
The sensitivity of the spreader’s performance to changes in wind speed and direction, fertiliser consistency and machine setup was analysed. Prototyping and Simulation of different spinner vane and chute designs was undertaken until the optimum machine configuration was achieved.
As a result of this study a spinner design that is tolerant of variations that occur under real life spreading conditions was developed. The new Type D spinner design was placed into production in early 2012, achieving a 25% improvement in spread width over the previous configurations, allowing farmers to spread fertilisers at wider widths in the paddock, reducing labour and fuel costs, whilst maintaining accurate placement of fertilisers.
The successfully completed design improvement demonstrates the value of numerical simulation techniques in the Agricultural Equipment design process.
Keywords: Fertiliser, Centrifugal Spreader, Numerical Modelling, Urea, Nitrogen
1. INTRODUCTION
The Marshall Multispread provides farmers with a cost effective method of spreading a range of granulated and non-granulated fertilisers with a single machine. Traditionally the Marshall Multispread could achieve fertiliser spreading widths of up to 28m for granulated materials such as Urea and Superphosphate and 10m for non-granulated materials such as Lime and Gypsum. The machine has required very minimal operator setup with its robust construction designed for fertiliser application rates from 15 to 8000 kg/ha.
The advent of larger agricultural equipment designed for automated single pass Controlled Traffic Farming and Variable Rate Technology (VRT) situations has seen farmers demand wider operating widths from fertiliser spreading equipment. Wider widths are beneficial to the farmer as they reduce the time in the paddock applying fertilisers which leads to a reduction in labour and energy costs, and a reduction in the number of passes in the paddock minimises compaction caused by the often heavy equipment travelling over the soil. Examples of the use of wider equipment being used in Australian broadacre Agriculture include 36m boom sprays and 24m airseeders.
The wider spreading widths must also be accurate in order to maintain even application of nutrients to the crop. A variation in fertiliser application can lead to uneven crop growth rates which affects crop yields and the financial viability of a farming enterprise. Uneven distribution can also lead to nutrient run-off into local water courses which have detrimental effects on the surrounding environment.
Standards for evaluating the performance of fertiliser spreader distribution have been developed across the world. Each standard uses a similar testing methodology of driving the machine across a set of collection trays, however the detail of the experimental procedure varies between the different standards. Typically, a set of collection trays aligned in transverse rows perpendicular to the direction of travel of the spreader are used to catch fertiliser as the spreader passes. Fig. 1 shows the test setup, with the spreader passing over the collection tray array, in Fig. 2 the tray array is illustrated. The material captured in each tray is weighed and input into a computer program that determines the optimum bout width in the field against a pre-determined Coefficient of Variation (COV) which is deemed to be a measure of the ‘evenness’ of a particular spread. A typical spread distribution and COV curve is shown in Fig. 3.
In Australia the Accu-Spread Standard is used, which prescribes an allowable COV value of 15% for granulated fertilisers such as Superphosphate and Urea and as such a maximum variation in fertiliser application rate of 15% across the spread width is permitted. For non-granulated materials a COV value of 25% is permitted.
Traditionally, incremental improvements in the Marshall Multispread operating performance were derived from a large number physical tests carried out according to the Accu-Spread standard with incremental changes to key machine parameters. However physical testing is labour intensive, uses considerable amounts of fertiliser and also introduces complex variables such as wind speed anddirection and particle breakage which are difficult to isolate and understand in a physical environment. As a result a Numerical model that could carry out “virtual” spread tests was developed and then validated against physical test data and high speed photography.
The numerical model was used as a design tool to test different design iterations and to carry out sensitivity analyses prior to physical prototyping and validation. Use of the numerical model allowed for a better understanding of the parameters that affect spreading performance and decreased the time required to test and validate new spinner designs.
As Nitrogen has the biggest impact on crop nutrition, this paper exclusively details numerical simulation and physical testing with Urea (N=46%) only.

Figure 1 : Physical testing to determine spread distribution and Co-efficient of Variation (COV) according to Accu-spread standard. Figure 2 : Collection Tray Array. Figure 3 : Urea Spread Distribution and COV Curve,
Marshall Multispread Type C Spinner System, February 2011
0%
5%
10%
15%
20%
25%
30%
35%
5 10 15 20 25 30 35
Co-
effic
ient
of V
aria
tion
Bout width (m)
CoV -vs- Bout width
5.0
10.0
15.0
20.0
25.0
30.0
35.0
-40 -35 -30 -25 -20 -15 -10 -5 0 5 10 15 20 25 30 35 40
Mas
s Col
lect
ed (g
)
Distance from centre (m)
Mass Distribution
1 2
3

2.0 NUMERICAL MODEL
Since the 1960’s, research and development activities related to the numerical modelling of centrifugal fertiliser spreaders have been undertaken [1]. The main drivers have been economic costs and the environmental impact of fertilisers. Fertiliser particles are spread due to centrifugal force, which is a well-defined mathematical system. In general, particle analysis can be divided into two stages [2]: calculation of particle motion as they are loaded on the spinner, captured by the spinner vane and accelerated toward the disc periphery, and prediction of particle trajectory as they travel through the air with subsequent determination of their landing position on the ground relative to the spreader centreline.
Particle motion on the spinner disc is governed by centrifugal acceleration, where the angular velocity and the radial position relative to the spinner centreline determine the total kinetic energy available to the fertiliser particle [3]. On the spinner disc, the motion of a particle in the form of sliding and rolling is further influenced by friction and Coriolis forces [2 & 4].
Travelling through the air, the particle motion is subjected to aerodynamic drag and gravity forces. Buoyancy and lift forces are considered small in this case and have therefore been neglected.
2.1 Particle Motion on the Spinner Disc
Centrifugal acceleration is the main driving force that moves particles across the spinner disc and along the vanes [3]. Particle motion on the disc can be characterised as bouncing, rolling and sliding. However, in the present embodiment the model has not been configured to capture the effects of particle bouncing. A free body diagram in Fig. 4 describes balance of forces for a particle on a rotating disc.
Figure 4: Free body diagram for a particle on a spinner disc The developed numerical model includes the following force components:
Centrifugal force 2prkprkcn rmF ω=
Coriolis force trmF prkprkco ∂∂
−= ω2
Gravity force gmF prkg = (1)
Friction force nf FF µ=
Normal force ( ) ( ) cngn FFF αα sincos +=
Fn
Ff
Fg
Fcn Fco
α
r
ξ
Fcn Fco
Ff ζ
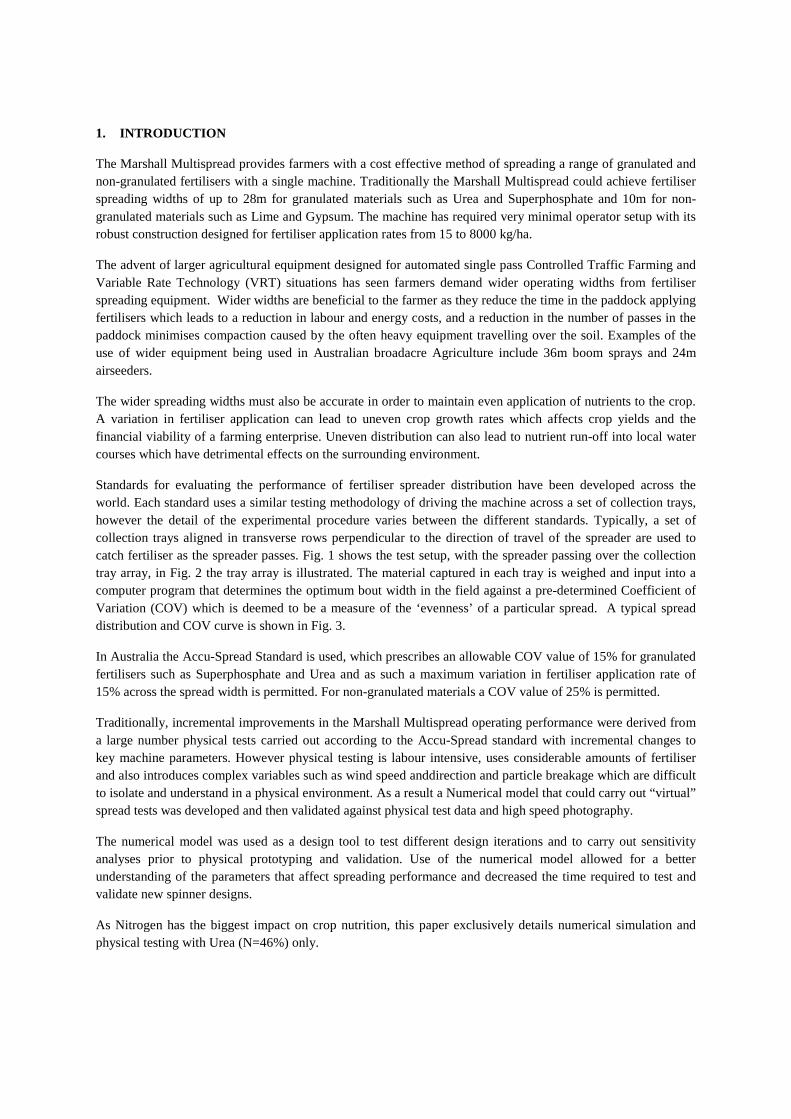
The equation of motion for a particle in the radial direction is then written as
( ) ( ) ( ) ( )relngcnttprk FFFm ϕµααξ cossincos −−=∂∂
( ) ξα tt r ∂=∂ cos (2)
and in the tangential direction as
( ) ( )prkncottprk FFm ϕµζ sin+=∂∂ where ϑζ r=
( ) rtt ζϑ ∂=∂ (3)
Fig. 4 also explains the nomenclature used in the transport equations.
When the radius of a particle trajectory exceeds the internal radius of guide vanes, and a guide vane reaches the particle, the particle equation of motion in the radial direction becomes:
( ) ( ) ( ) ( ) ( )
( )( ) ( ) ( ) ( )( ) corelrelrelgcnn
relgrelcnttprk
FFFF
FFm
ββµβαµµ
αβαβξ
sincossinsin
sincoscoscos
++−−−
−=∂∂
( ) ( )( ) ( ) ( ) ξ
βββαβ
trelvanevane
vanet r ∂
−=∂
tansincoscoscos
00
(4)
The particle tangential motion is calculated from the vane location vaneprk ϑϑ = . In the vertical direction, the
particle location is simply
( )αsin)( 0discdisc rrzz −+= (5)
Empirical values taken from reviewed cases [2, 4 & 5] were used in particle transport equations (2-4). Co-efficient of Friction µ was treated as constant. Particle and spinner disc mechanical and surface properties (i.e. impact strength and particle breakage) were also taken into account.
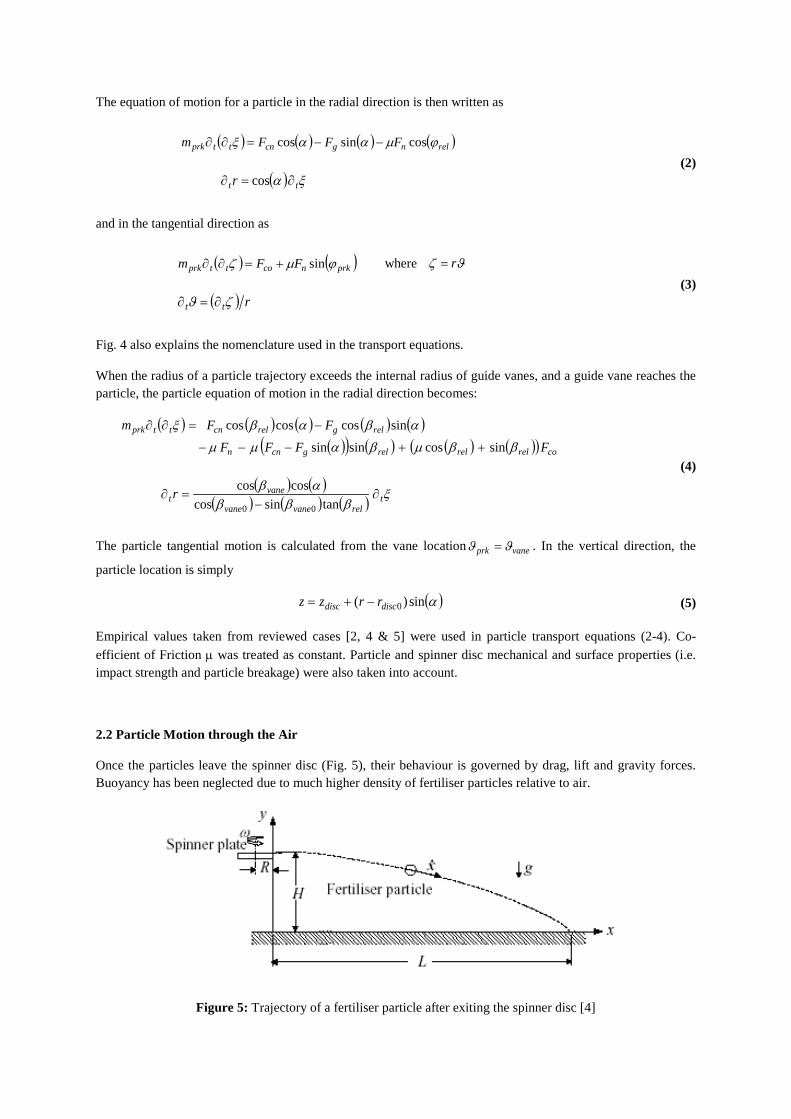
2.2 Particle Motion through the Air
Once the particles leave the spinner disc (Fig. 5), their behaviour is governed by drag, lift and gravity forces. Buoyancy has been neglected due to much higher density of fertiliser particles relative to air.
Figure 5: Trajectory of a fertiliser particle after exiting the spinner disc [4]
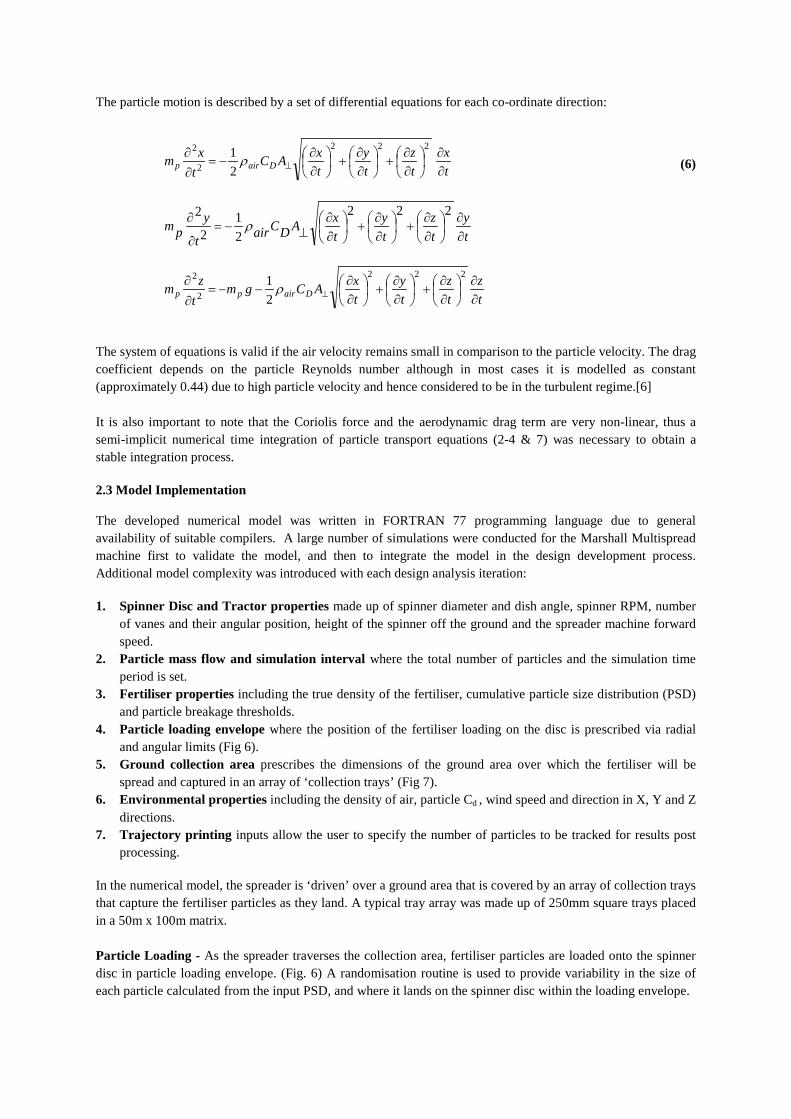
The particle motion is described by a set of differential equations for each co-ordinate direction:
tx
tz
ty
txAC
txm Dairp ∂
∂
∂∂
+
∂∂
+
∂∂
−=∂∂
⊥
222
2
2
21 ρ
ty
tz
ty
txADCairt
ypm
∂∂
∂∂
+
∂∂
+
∂∂
⊥−=∂
∂ 222
21
2
2ρ
tz
tz
ty
txACgm
tzm Dairpp ∂
∂
∂∂
+
∂∂
+
∂∂
−−=∂∂
⊥
222
2
2
21 ρ
(6)
The system of equations is valid if the air velocity remains small in comparison to the particle velocity. The drag coefficient depends on the particle Reynolds number although in most cases it is modelled as constant (approximately 0.44) due to high particle velocity and hence considered to be in the turbulent regime.[6] It is also important to note that the Coriolis force and the aerodynamic drag term are very non-linear, thus a semi-implicit numerical time integration of particle transport equations (2-4 & 7) was necessary to obtain a stable integration process. 2.3 Model Implementation The developed numerical model was written in FORTRAN 77 programming language due to general availability of suitable compilers. A large number of simulations were conducted for the Marshall Multispread machine first to validate the model, and then to integrate the model in the design development process. Additional model complexity was introduced with each design analysis iteration: 1. Spinner Disc and Tractor properties made up of spinner diameter and dish angle, spinner RPM, number
of vanes and their angular position, height of the spinner off the ground and the spreader machine forward speed.
2. Particle mass flow and simulation interval where the total number of particles and the simulation time period is set.
3. Fertiliser properties including the true density of the fertiliser, cumulative particle size distribution (PSD) and particle breakage thresholds.
4. Particle loading envelope where the position of the fertiliser loading on the disc is prescribed via radial and angular limits (Fig 6).
5. Ground collection area prescribes the dimensions of the ground area over which the fertiliser will be spread and captured in an array of ‘collection trays’ (Fig 7).
6. Environmental properties including the density of air, particle Cd , wind speed and direction in X, Y and Z directions.
7. Trajectory printing inputs allow the user to specify the number of particles to be tracked for results post processing.
In the numerical model, the spreader is ‘driven’ over a ground area that is covered by an array of collection trays that capture the fertiliser particles as they land. A typical tray array was made up of 250mm square trays placed in a 50m x 100m matrix. Particle Loading - As the spreader traverses the collection area, fertiliser particles are loaded onto the spinner disc in particle loading envelope. (Fig. 6) A randomisation routine is used to provide variability in the size of each particle calculated from the input PSD, and where it lands on the spinner disc within the loading envelope.

It was assumed that a particle have very small tangential or radial velocity components when it initially lands on the spinner disc in the loading envelope. Due to friction between the particle and the spinner disc, the particle starts to accelerate in the radial and tangential directions. The code keeps track of the absolute vane positions in time, and when the closest vane reaches the particle, the particle assumes the vane angular velocity at the collision radius. Particle Motion on the Vanes – The particle motion on the vane surface is calculated in accordance with the equations outlined in Section 2.1 Based on experimental observations, up to 35% of all particles are broken into smaller fragments when they are impacted by the spinner vane. Particle breakage affects the actual spread distribution since the smaller particles have lower mass and the cross-sectional area. Consequently, a routine was implemented in the numerical model that compares particle impact energy with an empirical threshold value. When the threshold is exceeded, it is assumed that the particle breaks into a number of smaller spherical fragments based on a proportional relationship between the breakage threshold value and the calculated impact energy. The implemented fragmentation model preserves the total mass and kinetic energy of the particle population. Particle Ballistic Trajectory - When a particle reaches the vane tip, the particle ballistic equations (6) are used to calculate the particle motion. The time integration was conducted until the vertical location of the particle was larger than zero, i.e. the particle collision with the ground. At that point, the X and Y location of the particle was recorded and the particle’s mass added to the collection array (Fig. 7). In this manner, each particle contributed to the overall spread pattern when collected in the collection array.
Figure 6: Definition of particle initial location (hatching) on a spreader disc –loading envelope and Figure 7:
Arrangement of collection trays around the spreader
It is well known that prevailing wind speed and direction can have an adverse effect on fertiliser distribution. The wind speed and its directional effects were included in the particle transport model. It is recognised that the simulation model described above does have limitations, which will affect the accuracy of the prediction of the overall spreader performance. For example, Particle-to-Particle and Particle-to-Structure interaction models have not been included in the current version of the code. Also, all particles including the broken fragments are modelled as spheres, which is not the case in a real situation. Namely, the broken Urea fragments tend to range from shard-like slivers through to elliptical shapes, which would affect the particle drag coefficient.
6 7

2.4 Numerical Model Outputs The numerical simulations created a number of data files, which were subsequently post-processed in TecPlot and MathCAD software. Particle trajectory plots were used to determine how the loading position on the disc affects the angle at which the particles leave the spinner disc. A typical particle trajectory plot is shown in Fig. 8 for different particle initial positions.
Figure 8: Particle tracks based on initial radial loading position (0.02 m < r < 0.2m, Urea).
Fig. 9 shows the distribution of the normalised mass fraction of the particles that land in a collection tray array. In this case, the spreader commenced at the top of the graph, and travelled in the -Y direction for a 10-second period. The motion and subsequent landing position of 200,000 individual particles were used to create the plot. It is important to mention that a typical calculation time is approximately a few minutes long.
Figure 9: Typical spread distribution plot - fertiliser: Urea.

A key model output was a cross-sectional plot of fertiliser mass fraction distribution across the spread width. Such linear distribution is usually used for a comparison against physical test data. In order to create the distribution plot, a row of collection trays is selected. These trays must be away from the start and finish of the spread where the particle distribution is not always uniform. The collected mass is then averaged and normalised to smooth out the variability in the spread pattern. A typical distribution curve is shown in Fig. 10.
Figure 10: Typical transverse average mass fraction distribution - Fertiliser: Urea
In addition to the basic mass contribution, the developed simulation model also outputs the size of the particles landing in each tray (Fig. 11) and the number of generated fragments. This information can be used to quantify how input parameters such as vane angles or spinner RPM affect the fertiliser behaviour in more detail and how particle sizes contribute to the overall spread pattern.
Figure 11: Particle Sizing compared to tray position.
0
0.001
0.002
0.003
0.004
0.005
0.006
0.007
0.008
-30 -20 -10 0 10 20 30
0
0.0005
0.001
0.0015
0.002
0.0025
0.003
0.0035
0.004
0.0045
0.005
-30 -20 -10 0 10 20 30
1.4
2.0
2.8
3.35
4
Distance from centre (m)
Mas
s Fra
ctio
n (%
)
Distance from centre (m)
Sieve Size (mm)

3.0 MODEL VALIDATION TECHNIQUES
In order to validate the model outputs a number of physical tests were carried out using experimental apparatus and high speed photography. The position at which particles are loaded onto the disc has a direct influence on the position and exit trajectory of the fertiliser particles, which in turn affects the width and evenness of the spread mass distribution. To examine this more closely under controlled conditions, a collection device was manufactured to observe the exit angle of fertiliser particles based on the initial loading position. The collection device (Fig. 12 & 13) consisted of a single spinner disc enclosed by a segmented shroud that was filled with foam and rubber dampening material. A loading funnel was positioned at various points along the disc radius. Deflectors made of soft rubber and spaced at 10 degree increments around the spinner, deflect particles into a series of collection cups around the disc circumference. For a known mass of particles loaded into the device, the contents of each cup was weighed and the resulting angular distribution plotted.
Figure 12 : Upper View of Collection Device Figure 13 : Underside view Collection Device
Figure 14 : Histogram showing Angular Distribution of Urea based on r=250mm loading position
The histogram shown in Fig. 14 was used to validate particle exit angles output from the model as shown in Fig. 8. Adjustments in the co-efficient of friction between the particles and the spinner disc were made within the numerical model to correlate the findings.
0.0
5.0
10.0
15.0
20.0
25.0
30.0
0.0%
2.5%
5.0%
7.5%
10.0%
12.5%
15.0%
0 20 40 60 80 100
120
140
160
180
200
220
240
260
280
300
320
340
Mas
s (g)
(Cor
rect
ed)
Mas
s Fra
ctio
n (%
)
Angle (Degrees)
Mass Fraction (%)
Mass (g) (Corrected)
9 Maximum Material Collected in Cup No.
12 13

Whilst the focused loading position of the particles on the disc is valuable in validating the particle trajectory across the spinner disc, in real life the fertiliser is loaded onto the spinner across a broad envelope. Analysis of the loading envelope was carried out using high speed photography at up to 8000 frames per second (Fig. 15) and the collection device with adjustments made to the input parameters until the particle exit angles output by the model matched physical results.
Figure 15 : High Speed Photography of Top View of Spinner showing the fertiliser loading zone in the upper left. Figure 16 : Particle Breakage at r=200mm
To determine the empirical particle breakage threshold, particle breakage caused by the fertiliser being impacted by the spinner vane was studied using high speed photography, (Fig 16). As the radius increases, the tangential velocity of the vanes increases which in turn has a direct relationship on particle breakage.
During physical testing of the spreader the total particle breakage was determine by sieving the material collected in the tray array and comparing it against the initial PSD of the fertiliser being spread. This data was used to test the sensitivity of the particle breakage parameter within the numerical model until a correlation between the physical and model total particle breakage values was achieved.
Distribution curves output by the model were compared against physical testing carried out under controlled conditions to the Accu-spread standard. Comparison curves were plotted and alterations made to input parameters until the numerical model provided a good approximation of the actual spread distribution. (Fig 17)
Figure 17: Comparison of Physical and Simulated Distribution Curves for Urea (Red : Simulation, Green : Physical Test)
0
0.005
0.01
0.015
0.02
0.025
0.03
0.035
0.04
0.045
0.05
-30 -20 -10 0 10 20 30
Distance from centre (m)
15 16
Mas
s Fra
ctio
n (%
)

4.0 MULTISPREAD DESIGN STAGE
During the design stage the Numerical model was used to run a number of different design scenarios to compare how changes to the spreader design impact performance. The key areas of the design that were considered were the number of vanes and their angle relative to the centre of the spinner disc, the spinner diameter and dish angle and the fertiliser loading envelope.
Experimental vanes shapes and fertiliser loading chutes were tested in the collection device and in the field using the Accu-spread procedure. Over 200 physical tests were carried out under controlled conditions to validate prototypes and the final design.
As a result of the design process, a new spinner disc, vane shape and position and chute design was developed for the Marshall Spreader. (Type D System) Spread widths for Urea were improved from 28m to 36m. (Fig. 18) To improve the margin for error when spreading in real-life conditions, adjustment in vane positions flatten the COV curve and improve spread pattern evenness.
Figure 18 : Urea Spreading Curves based on the Marshall Multispread Type D Design Improvement (Blue : Offset Vane Configuration, Red : Radial Vane Configuration)
0%
5%
10%
15%
20%
25%
30%
35%
5 10 15 20 25 30 35 40
Co-
effic
ient
of V
aria
tion
Bout width (m)
CoV -vs- Bout width
0
1
2
3
4
5
6
7
8
9
10
-40 -35 -30 -25 -20 -15 -10 -5 0 5 10 15 20 25 30 35 40
Mas
s Col
lect
ed (g
)
Distance from centre (m)
Mass Distribution
18

5.0 SENSITIVITY ANALYSIS
It is well known that external influences such as wind speed and direction and fertiliser properties such as bulk density and Particle Size Distribution (PSD) affect the performance of centrifugal fertiliser spreaders. [6] Whilst physical testing was carried out under controlled conditions it is important to understand how the machine performs under realistic operating conditions. Using physical tests to determine the how external factors affect spread distribution is expensive both in term of labour and materials, and it is also difficult to achieve repeatable results given that wind conditions and fertiliser properties (PSD and density, fracture toughness) can be highly variable.
Using the Numerical Model a Sensitivity analysis was performed to estimate how wind speed and direction and fertiliser PSD affect spread distribution and to determine how tolerant the new spinner design would be to these external factors.
5.1 Wind Speed and Direction
The size and density of fertiliser particles makes them susceptible to the effect of wind leading to reduction in both the accuracy and width of spread. As particle velocity decreases wind effects take over reducing the particle trajectories. Whilst the Accu-Spread standard specifies a maximum wind speed of 15km/h during a field test, it is common for farmers to spread in wind speeds up to 25km/h to maintain spreading productivity.
When spreading into a headwind particles tend to be pushed away from the machine centreline skewing the distribution directly behind the spreader. This is illustrated in Fig 19 which details how a 15km/h head wind influences the distribution and COV curves, reducing effective bout width by 50%.
Cross wind effects also skew the distribution across the spread pattern, leading to uneven application of fertiliser on one side of the machine. Fig. 20 illustrates the effect of a 15 km/h cross wind on the distribution and COV curve. The effect on overall bout width is minimal as subsequent passes fill in the total distribution.
In order to maintain spread accuracy bout widths should be reduced in windy conditions to ensure consistent overlap between spreader passes.
Figure 19 : Head wind Analysis Material : Urea (Blue = 0 km/h, Red = 15 km/h)
0%
10%
20%
30%
40%
50%
60%
5 15 25 35Co-
effic
ient
of V
aria
tion
Bout width (m)
CoV -vs- Bout width
0
0.01
0.02
0.03
0.04
0.05
0.06
-40-35-30-25-20-15-10-5 0 5 10 15 20 25 30 35 40
Mas
s Fra
ctio
n
Distance from centre (m)
Mass Distribution
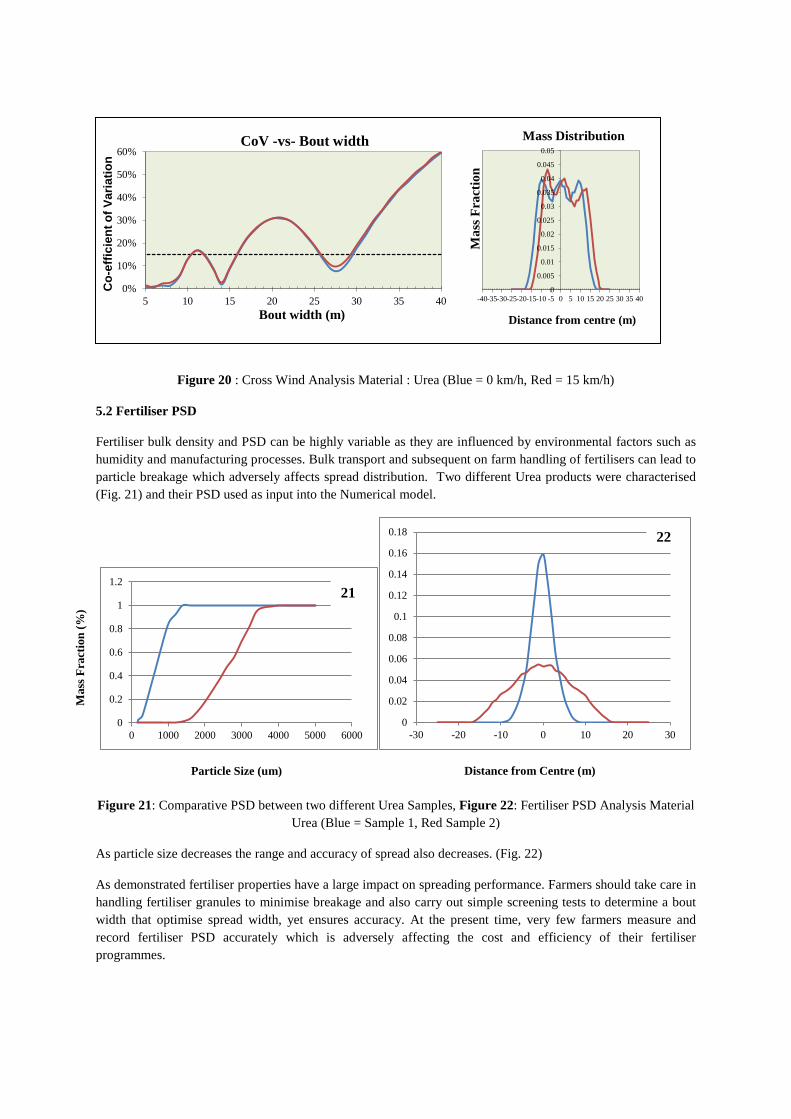
Figure 20 : Cross Wind Analysis Material : Urea (Blue = 0 km/h, Red = 15 km/h)
5.2 Fertiliser PSD
Fertiliser bulk density and PSD can be highly variable as they are influenced by environmental factors such as humidity and manufacturing processes. Bulk transport and subsequent on farm handling of fertilisers can lead to particle breakage which adversely affects spread distribution. Two different Urea products were characterised (Fig. 21) and their PSD used as input into the Numerical model.
Figure 21: Comparative PSD between two different Urea Samples, Figure 22: Fertiliser PSD Analysis Material Urea (Blue = Sample 1, Red Sample 2)
As particle size decreases the range and accuracy of spread also decreases. (Fig. 22)
As demonstrated fertiliser properties have a large impact on spreading performance. Farmers should take care in handling fertiliser granules to minimise breakage and also carry out simple screening tests to determine a bout width that optimise spread width, yet ensures accuracy. At the present time, very few farmers measure and record fertiliser PSD accurately which is adversely affecting the cost and efficiency of their fertiliser programmes.
0
0.2
0.4
0.6
0.8
1
1.2
0 1000 2000 3000 4000 5000 60000
0.02
0.04
0.06
0.08
0.1
0.12
0.14
0.16
0.18
-30 -20 -10 0 10 20 30
0%
10%
20%
30%
40%
50%
60%
5 10 15 20 25 30 35 40
Co-
effic
ient
of V
aria
tion
Bout width (m)
CoV -vs- Bout width
0
0.005
0.01
0.015
0.02
0.025
0.03
0.035
0.04
0.045
0.05
-40-35-30-25-20-15-10 -5 0 5 10 15 20 25 30 35 40
Mas
s Fra
ctio
n
Distance from centre (m)
Mass Distribution
Particle Size (um)
Mas
s Fra
ctio
n (%
)
Distance from Centre (m)
21
22
6.0 CONCLUSION
Through the use of Numerical modelling techniques a more detailed understanding of the factors that influence Urea spreading performance with the Marshall Spreader was gathered. By using numerical techniques a number of design scenarios could be quickly investigated, which considerably improved design and development timescales and costs. The new spinner, vane and chute design achieved a 25% increase in spreading width for Urea, which reduces on-farm labour and fuel costs whilst minimising soil compaction.
Despite the numerical model’s current limitations due to simplification of the physical performance, the model’s outputs were seen to provide a good approximation of the observed spreading performance. Future improvements to the handling of particle shape factor and Cd along with the inclusion of boundaries to simulate the structural elements of the machine will improve the performance of the model.
The model will be applied to future studies of Superphosphate, NPK and DAP fertilisers.
Aside from leading to a new design solution the numerical model allows for simulation of complex variables such as wind speed and direction and fertiliser PSD, the results of which can be used to help guide decision making by farmers leading to better control of inputs, reduction in fertiliser costs and improved yields.
7.0 REFERENCES
[1] D. E. Patterson, A. R. Reece, The Theory of the Centrifugal Distributor, I: Motion on the Disc, Near-Centre Feed. Journal of Agricultural Engineering Research, 1962, vol. 7, pp. 232-240. [2] J. W. Hofstee, W. Huisan, Handing and Spreading of Fertilizers, Part 1: Physical Properties of Fertilizer in Relation to Particle Motion, Journal of Agricultural Engineering Research, 1990, vol. 47, pp. 213-234. [3] T. E. Grift, G. Kweon, J. W. Hofstee, E. Piron, S. Villette, Dynamic Friction Coefficient Measurement of Granular Fertiliser Particles, Biosystems Engineering, 2006, vol. 95, no. 4, pp. 507-515. [4] A. Aphale, N. Bolander, J. Park, L. Shaw, J. Svec, C. Wassgren, Granular Fertiliser Particle Dynamics on and off a Spinning Spreader, Biosystems Engineering, 2005, vol. 85, no. 3, pp. 319-329. [5] S. Villette, F. Cointault, E. Piron, B. Chopinet, Centrifugal Spreading: an Analytical Model for the Motion of Fertiliser Particles on a Spinning Disc, Biosystems Engineering, 2005, vol. 92, no. 2, pp. 157-164. [6] Olieslagers, R., Ramon, H., & De Baerrdemaeker, J. Calculation of fertilizer distribution patterns from a spinning disc spreader by means of a simulation model. Journal of Agricultural Engineering Research, 63, 137e152. (1996). [7] H.T Sogaard, P. Kirekegaard, Yield Reduction Resulting for Uneven Fertiliser Distribution, Transactions of the ASAE, 37(6), pp. 1749-1752.