singapore energy statistics - energy market · pdf fileenergy market authority ... and...
TRANSCRIPT
ENERGY MARKETAUTHORITYThe Energy Market Authority (EMA) is a statutory board under the Ministry of Trade and Industry. Our main goals are to ensure a reliable and secure energy supply, promote effective competition in the energy market and develop a dynamic energy sector in Singapore. Through our work, EMA seeks to forge a progressive energy landscape for sustained growth. ISSN 2251-2624 ©Research and Statistics Unit, Energy Market Authority All rights reserved. No part of this publication may be reproduced in any material form (including photocopy or storing it in any medium by electronic means and whether or not transiently or incidentally to some other use of this publication) without prior written permission of the copyright owner except in accordance with the provision of the Copyright Act (Cap. 63). Applications for the copyright owner’s written permission to reproduce any part of this publication should be addressed to:
Energy Market Authority991G Alexandra Road #02-29Singapore 119975Republic of Singapore
DIREC TOR RESE A RCH & STATISTIC S UNITENERGY TECHNOLOGY & DATA DEPA RTMENT
BERN A RD NEEDeputy Chief ExecutiveEnergy Planning & Development DivisionEnergy Market AuthoritySingapore
July 2017
P R E F A C E
The Singapore Energy Statistics (SES) is the Energy Market Authority’s annual flagship publication of key energy data of Singapore. Inaugurated in 2011, I am happy to present to you our seventh edition of the SES this year. The comprehensiveness of data has been expanded in this edition, covering 46 data tables across seven energy-related topics. Notable new inclusions comprise the Uniform Singapore Energy Prices (USEP) and breakdown of Singapore’s solar statistics by different user type. I am confident the expanded coverage will provide you with an in-depth understanding of Singapore’s energy landscape. This publication starts with an overview of the supply of energy into Singapore (Chapter 1, Energy Supply), followed by its uses in the Transformation sector (Chapter 2, Energy Transformation). Subsequently, consumption of different end users (Chapter 3, Energy Consumption) is analysed before deep-diving into the commodity balance tables (Chapter 4, Energy Balances). Prices of energy products (Chapter 5, Energy Prices) and the growth of Solar Photovoltaic (PVs) in Singapore (Chapter 6, Solar) will also be covered. The publication concludes with key energy-related statistics such as the grid emission factor and power sector manpower data (Chapter 7, Other Energy-Related Statistics). Technical notes and a glossary accompany this publication to provide a background on the key definitions and concepts used. The SES 2017 can also be accessed via a dedicated micro-site*. Additional energy-related statistics not covered in the SES 2017 can also be found online^. This publication is made possible through the co-operation and support of many organisations, government ministries and statutory boards that have provided information. I would like to express my gratitude to all who have contributed towards this new milestone. We look forward to your continued support.
* http://www.ema.gov.sg/Singapore_Energy_Statistics.aspx^ https://www.ema.gov.sg/Statistics.aspx
TA B L E O F C O N T E N T STA B L E O F C O N T E N T S
ENERGY SUPPLY ENERGY PRICES
ENERGY BALANCES
ENERGY TRANSFORMATION
ENERGY CONSUMPTION0 3
0 4
0 2
0 1 0 5
1.11.21.2.11.2.21.3
4.14.2
2.12.22.2.12.32.3.12.42.52.6
3.13.23.2.13.2.23.33.43.53.63.73.83.93.10
3.113.12
Imports of Energy ProductsExports of Energy ProductsDomestic Exports of Energy ProductsRe-Exports of Energy ProductsStock Change
Electricity Balance TableNatural Gas Balance Table
Energy Flows for Electricity GeneratorsAnnual Fuel Mix for Electricity Generation by Energy ProductsMonthly Fuel Mix for Electricity Generation by Energy ProductsRegistered Generation Capacity by Technology TypeRegistered Generation Capacity by Generation CompanyPlant Technology Share of Electricity GenerationMarket Share for Electricity GenerationEnergy Flows in the Oil Refining Sector
Market Share for Electricity RetailElectricity Consumption by Sub-Sector (Total)Electricity Consumption by Sub-Sector (Contestable Consumers)Electricity Consumption by Sub-Sector (Non-Contestable Consumers)Total Household Electricity Consumption by Dwelling TypeAverage Monthly Household Electricity Consumption by Dwelling TypeAverage Monthly Electricity Consumption by Planning Area & Dwelling Type (Annual)Market Share for Natural Gas RetailNatural Gas Consumption by Sub-SectorTotal Household Town Gas Consumption by Dwelling TypeAverage Monthly Household Town Gas Consumption by Dwelling TypeAverage Monthly Household Town Gas Consumption by Planning Area & Dwelling Type (Annual)Total Oil Consumption by SectorTotal Final Energy Consumption
1516171819
8485
2930313233343535
464748495054586363646872
7778
5.15.25.35.45.55.65.7
Electricity and Gas TariffsQuarterly Electricity Tariffs (Low Tension Tariffs)Annual Electricity Tariffs by Components (Low Tension Tariffs)Average Monthly Uniform Singapore Energy Prices (USEP)Town Gas Tariffs by QuarterConsumer Price Index for Selected Energy Products (Base index of 100 at 2014)Producer and International Trade Price Indices of Mineral Fuels, Lubricants and Related Materials (Base index of 100 at 2012)
90909191929393
7.17.27.37.47.5
Electricity Grid Emission Factors and Upstream Fugitive Methane Emission FactorPeak System DemandNumber of Power Sector Employees by OccupationNumber of Power Sector Employees by Residency StatusNumber of Licensed Electrical, Gas Service and Cable Detection Workers
108108109109109
Technical NotesGlossary
110116
Notes:a. This publication contains statistics that are the most recently available at the time of its preparation.b. Numbers may not add up to the totals due to rounding.c. Some statistics, particularly for the most recent time periods, are provisional and may be subject to revision in later issues.d. All statistical tables above are available in machine-readable format on http://www.ema.gov.sg/singapore_energy_statistics.aspx.
Notations:- nil, negligible or not applicable“s” – suppressed to avoid disclosure of individual data
6.16.26.36.46.5
Installed Capacity of Grid-Connected Solar Photovoltaic (PV) Systems by User TypeInstalled Capacity of Grid-Connected Solar Photovoltaic (PV) Systems by ContestabilityNumber of Grid-Connected Solar PV Installations by User TypeNumber of Grid-Connected Solar PV Installations by ContestabilitySolar PV Installations by URA Planning Region as at end of period
989999
100 100
SOLAR0 6
OTHER ENERGY-RELATED STATISTICS0 7
EXECUTIVE SUMMARY
ENERGY FLOWS
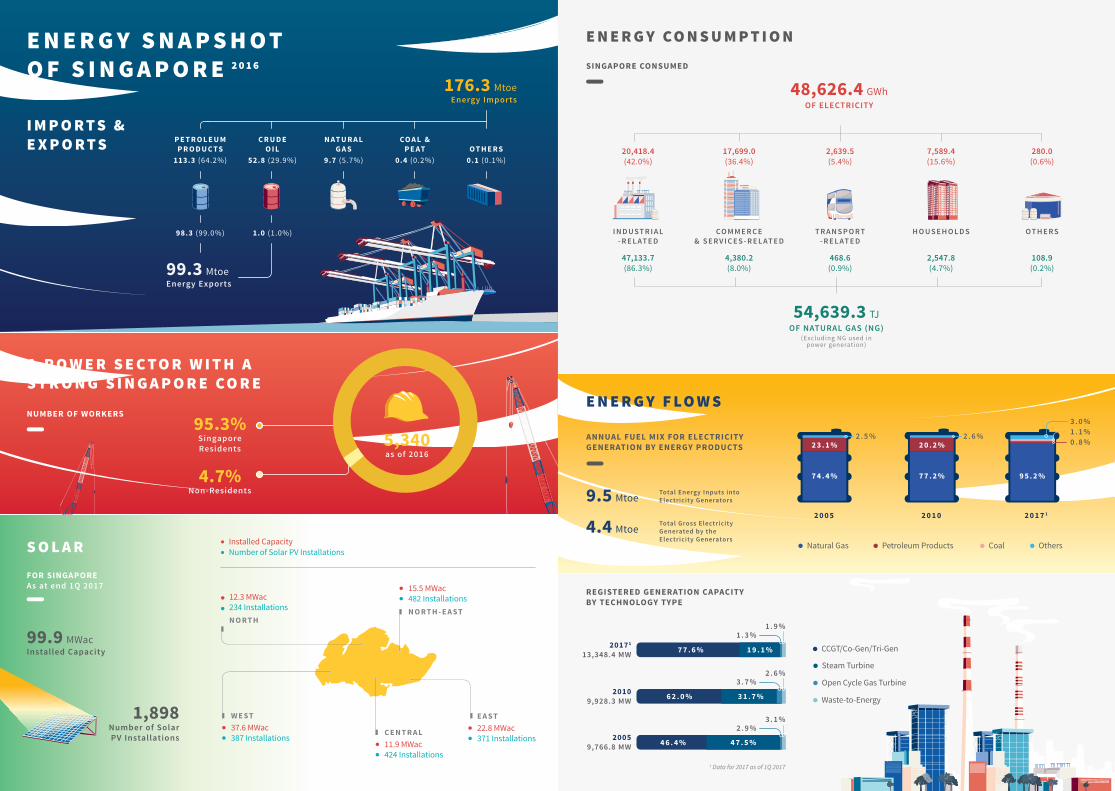
• Singapore’s import of energy products grew by 2.0% from 172.8 Mtoe in 2015 to 176.3 Mtoe in 2016. The exports of energy products also registered an 8.0% increase, growing from 92.0 Mtoe in 2015 to 99.3 Mtoe in 2016. The bulk of energy imports and exports were Petroleum Products.
• Imports of Natural Gas (NG) increased by 2.4% from 9.5 Mtoe in 2015 to 9.7 Mtoe in 2016, with Liquefied Natural Gas (LNG) accounting for 23.4% of these imports.
• Electricity generation increased by 2.6% from 50.3 TWh in 2015 to 51.6 TWh in 2016. In 2016, NG accounted for 95.2% of fuel mix, maintaining this record high since 2014. Main Power Producers in Singapore accounted for 93.2% of total electricity generated. The remaining 6.8% was generated by Autoproducers.
• Total registered generation capacity in Singapore was 13,348.4 MW as of end March 2017. More than three quarters (10,355.5 MW or 77.6%) was attributed to Combined Cycle Gas Turbines, Co-Generation Plants and/or Tri-Generation Plants.
• Electricity consumption rose by 2.3% from 47.5 TWh in 2015 to 48.6 TWh in 2016. Industrial-related, and Commerce & Services-related sectors comprised 42.0% and 36.4% of total consumption respectively. Around 15.6% of total consumption was accounted for by Households.
• End-users consumption of NG declined 2.6% from 59,096.1 TJ in 2015 to 54,639.3 TJ in 2016, due to weaker demand by the Industrial-related sector. In 2016, Industrial-related consumption of NG was 47,133.7 TJ. This was 4.2% lower than that a year ago.
SOL A R A ND OTHER ENERGY STATISTIC S
• The adoption of solar photovoltaic (PV) systems in Singapore accelerated in the last three years. Grid-connected installed capacity of solar PV systems sharply increased from 25.5 MWac in 2014, to 46.0 MWac in 2015, and subsequently to 99.9 MWac by the end of 1Q 2017. This increase was driven by 955 new installations in 2016 and the first quarter of 2017. By end 1Q 2017, there were a total of 1,898 solar PV installations across Singapore.
• By end-2016, the west region of Singapore had the highest concentration of solar PV, with a total capacity of 37.6 MWac (37.6%) distributed across 387 installations.
• Singapore’s Grid Emission Factor (GEF), which measures emissions per unit of electricity generated, remained relatively consistent at 0.4244 kg CO2/kWh in 2016.

012 013S I N G A P O R E E N E R G Y S TAT I S T I C S 2 0 1 7E N E R G Y S U P P LY
IMPORTS & EXPORTS OF ENERGY PRODUCTS
40,000
0
80,000
120,000
160,000
200,000
2005 2010 2014 2015 2016
Unit: ktoe
8.7
81.1 116.4
0.3
0.60.15,571.1
9,453.5 9,680.5406.5 426.6
819.7
1,026.3
1,064.2
49,2
93.9
63,6
12.8
90,9
28.2
98,2
84.1
59,6
73.6
49,4
37.7
52,7
75.8
113,
432.
9
113,
348.
1
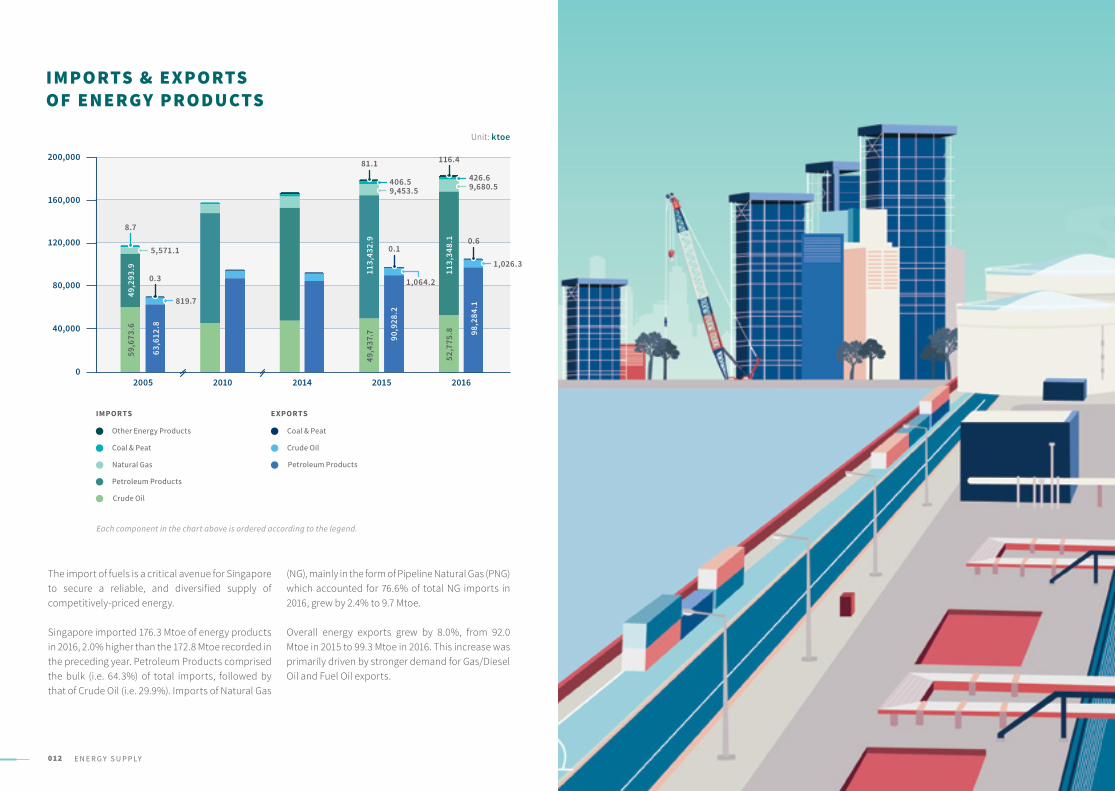
The import of fuels is a critical avenue for Singapore to secure a reliable, and diversified supply of competitively-priced energy.
Singapore imported 176.3 Mtoe of energy products in 2016, 2.0% higher than the 172.8 Mtoe recorded in the preceding year. Petroleum Products comprised the bulk (i.e. 64.3%) of total imports, followed by that of Crude Oil (i.e. 29.9%). Imports of Natural Gas
(NG), mainly in the form of Pipeline Natural Gas (PNG) which accounted for 76.6% of total NG imports in 2016, grew by 2.4% to 9.7 Mtoe.
Overall energy exports grew by 8.0%, from 92.0 Mtoe in 2015 to 99.3 Mtoe in 2016. This increase was primarily driven by stronger demand for Gas/Diesel Oil and Fuel Oil exports.
Crude Oil
IMPORTS
Petroleum Products
Natural Gas
Coal & Peat
Other Energy Products
EXPORTS
Crude Oil
Coal & Peat
Petroleum Products
Each component in the chart above is ordered according to the legend.
014 015S I N G A P O R E E N E R G Y S TAT I S T I C S 2 0 1 7E N E R G Y S U P P LY
TA BLE 1 .1: IMPORTS OF ENERGY PRODUC TS
STOCK CHANGE
500.0
0
1,000.0
2010 2011 2012 2013 2014 2015
509.8
-142.7
-1,498.9
Unit: ktoe
Unit: ktoe
2005 2010 2013 2014 2015 2016
Total 114,547.3 153,679.1 158,583.8 161,139.8 172,811.7 176,347.4
Coal & Peat 8.7 7.9 266.4 396.2 406.5 426.6
Crude Oil 59,673.6 45,396.1 47,214.7 47,479.9 49,437.7 52,775.8
Crude Oil 58,884.6 44,332.2 46,920.5 47,147.8 48,089.0 51,645.4
Other Crude Oil 789.0 1,063.9 294.2 332.1 1,348.6 1,130.4
Petroleum Products 49,293.9 101,060.6 102,180.0 103,801.5 113,432.9 113,348.1
Fuel Oil 29,551.2 58,020.0 63,691.9 62,279.9 69,902.8 68,560.6
Gas / Diesel Oil 3,999.7 17,459.2 12,930.3 14,322.8 14,809.2 15,896.1
Gasoline 7,619.5 14,858.7 13,895.5 14,774.5 15,614.9 16,891.2
Jet Fuel Kerosene 2,180.7 3,602.7 1,673.0 2,041.2 2,007.7 3,131.1
Naphtha 4,095.0 5,970.2 7,693.4 8,981.5 9,684.5 7,221.5
Other Petroleum Products 1,847.7 1,149.6 2,295.9 1,401.6 1,413.8 1,647.5
Natural Gas (NG) 5,571.1 7,214.5 8,896.0 9,417.8 9,453.5 9,680.5
Pipeline NG 5,571.1 7,214.5 7,947.8 7,384.5 7,133.6 7,418.6
Liquefied NG - - 948.3 2,033.3 2,319.9 2,261.9
Other Energy Products - - 26.7 44.4 81.1 116.4
Sources: International Enterprise (IE) Singapore and Energy Market Authority (EMA)
Notes:a. Numbers may not add up to the totals due to rounding.b. All data were compiled from IE’s trade statistics except Natural Gas and Other Energy Products (including Biomass) which
were compiled from EMA’s administrative returns.c. IE releases trade data in mass units. EMA releases similar data in energy units (ktoe).d. The product classification of energy products differs from that used by IE for trade statistics. e. Biomass trade recorded is for energy use only.
Notations:- nil, negligible or not applicable
StockDraw
StockBuild
-500.0
-1,000.0
-1,500.0
-2,000.0
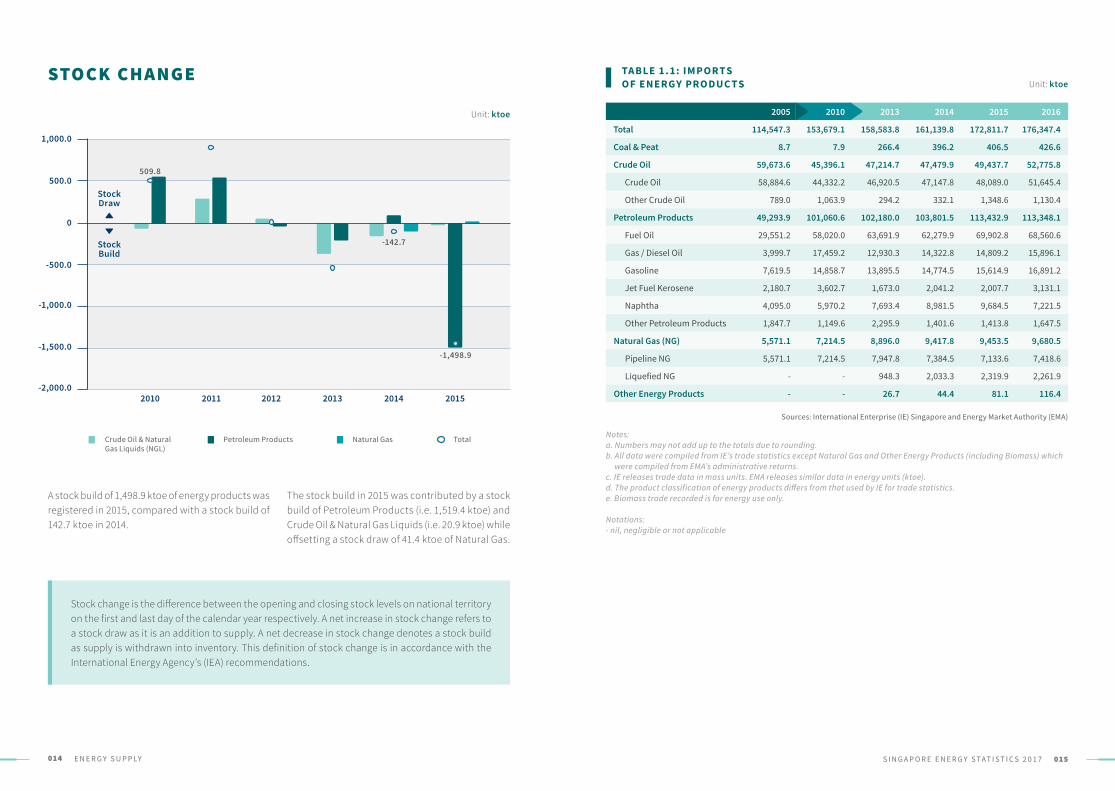
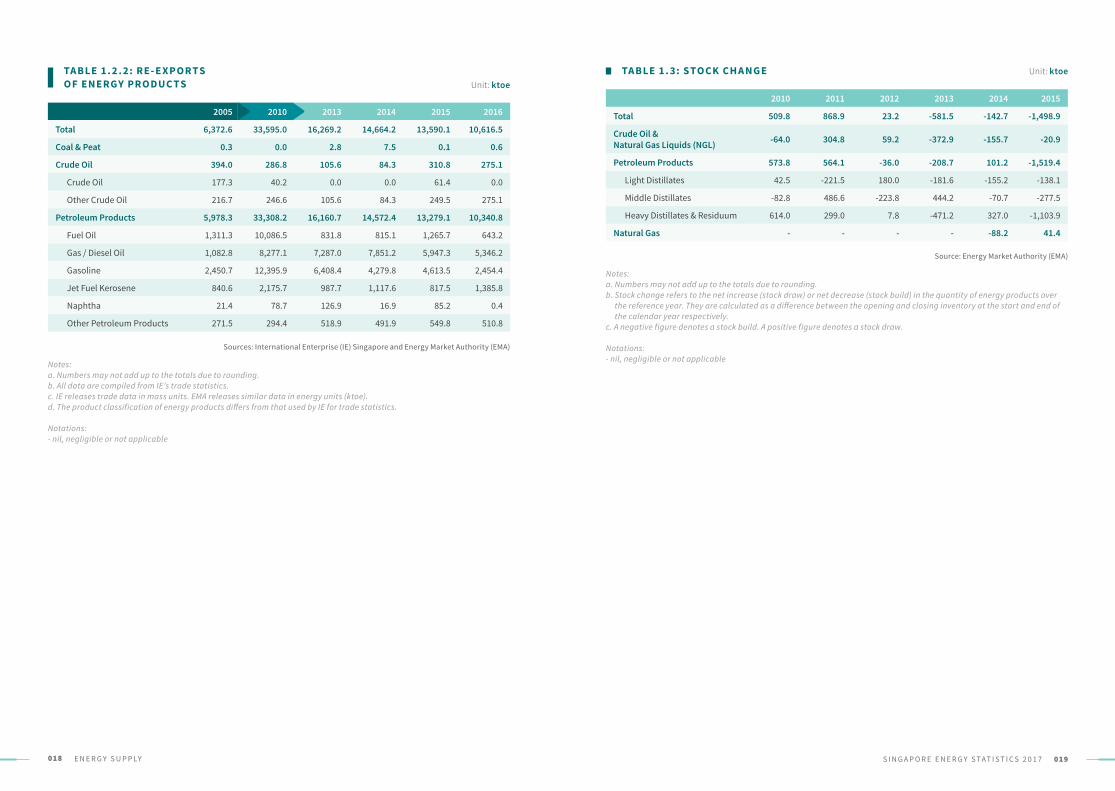
A stock build of 1,498.9 ktoe of energy products was registered in 2015, compared with a stock build of 142.7 ktoe in 2014.
The stock build in 2015 was contributed by a stock build of Petroleum Products (i.e. 1,519.4 ktoe) and Crude Oil & Natural Gas Liquids (i.e. 20.9 ktoe) while offsetting a stock draw of 41.4 ktoe of Natural Gas.
Stock change is the difference between the opening and closing stock levels on national territory on the first and last day of the calendar year respectively. A net increase in stock change refers to a stock draw as it is an addition to supply. A net decrease in stock change denotes a stock build as supply is withdrawn into inventory. This definition of stock change is in accordance with the International Energy Agency’s (IEA) recommendations.
Crude Oil & Natural Gas Liquids (NGL)
Petroleum Products Natural Gas Total
016 017S I N G A P O R E E N E R G Y S TAT I S T I C S 2 0 1 7E N E R G Y S U P P LY
TA BLE 1 . 2: E XPORTS OF ENERGY PRODUC TS
TA BLE 1 . 2 .1: DOMESTIC E XPORTS OF ENERGY PRODUC TS
2005 2010 2013 2014 2015 2016
Total 64,432.8 88,897.5 84,842.2 86,180.7 91,992.7 99,311.0
Coal & Peat 0.3 0.1 2.9 7.7 0.1 0.6
Crude Oil 819.7 766.6 671.8 668.5 1,064.2 1,026.3
Crude Oil 177.3 40.3 0.1 0.1 62.1 0.0
Other Crude Oil 642.4 726.2 671.8 668.5 1,002.2 1,026.3
Petroleum Products 63,612.8 88,130.8 84,167.5 85,504.5 90,928.2 98,284.1
Fuel Oil 16,066.7 21,802.3 26,314.0 24,688.2 28,927.5 30,696.2
Gas / Diesel Oil 15,208.8 27,376.4 21,966.2 22,679.9 23,428.2 25,527.0
Gasoline 15,183.0 24,037.6 23,499.6 25,234.0 25,330.0 26,082.2
Jet Fuel Kerosene 6,955.3 7,208.9 5,015.8 5,050.3 4,953.6 6,155.0
Naphtha 2,470.2 990.4 463.6 453.4 788.3 1,106.2
Other Petroleum Products 7,728.7 6,715.2 6,908.2 7,398.6 7,500.5 8,717.5
2005 2010 2013 2014 2015 2016
Total 58,060.2 55,302.4 68,573.0 71,516.5 78,402.6 88,694.6
Coal & Peat 0.0 0.0 0.0 0.2 0.0 0.0
Crude Oil 425.7 479.8 566.2 584.2 753.4 751.2
Crude Oil - 0.1 0.0 - 0.7 0.0
Other Crude Oil 425.7 479.7 566.2 584.2 752.7 751.2
Petroleum Products 57,634.5 54,822.6 68,006.8 70,932.0 77,649.1 87,943.4
Fuel Oil 14,755.4 11,715.8 25,482.2 23,873.1 27,661.8 30,053.0
Gas / Diesel Oil 14,126.0 19,099.3 14,679.2 14,828.7 17,480.9 20,180.8
Gasoline 12,732.2 11,641.7 17,091.2 20,954.3 20,716.5 23,627.9
Jet Fuel Kerosene 6,114.7 5,033.3 4,028.1 3,932.7 4,136.1 4,769.2
Naphtha 2,448.9 911.7 336.8 436.6 703.1 1,105.8
Other Petroleum Products 7,457.2 6,420.8 6,389.3 6,906.7 6,950.7 8,206.7
Sources: International Enterprise (IE) Singapore and Energy Market Authority (EMA) Sources: International Enterprise (IE) Singapore and Energy Market Authority (EMA)
Notes:a. Numbers may not add up to the totals due to rounding.b. All data are compiled from IE’s trade statistics.c. IE releases trade data in mass units. EMA releases similar data in energy units (ktoe).d. The product classification of energy products differs from that used by IE for trade statistics.
Notations:- nil, negligible or not applicable
Unit: ktoe Unit: ktoe
018 019S I N G A P O R E E N E R G Y S TAT I S T I C S 2 0 1 7E N E R G Y S U P P LY
TA BLE 1 . 2 . 2: RE- E XPORTS OF ENERGY PRODUC TS
TA BLE 1 . 3: STOCK CH A NGE
2005 2010 2013 2014 2015 2016
Total 6,372.6 33,595.0 16,269.2 14,664.2 13,590.1 10,616.5
Coal & Peat 0.3 0.0 2.8 7.5 0.1 0.6
Crude Oil 394.0 286.8 105.6 84.3 310.8 275.1
Crude Oil 177.3 40.2 0.0 0.0 61.4 0.0
Other Crude Oil 216.7 246.6 105.6 84.3 249.5 275.1
Petroleum Products 5,978.3 33,308.2 16,160.7 14,572.4 13,279.1 10,340.8
Fuel Oil 1,311.3 10,086.5 831.8 815.1 1,265.7 643.2
Gas / Diesel Oil 1,082.8 8,277.1 7,287.0 7,851.2 5,947.3 5,346.2
Gasoline 2,450.7 12,395.9 6,408.4 4,279.8 4,613.5 2,454.4
Jet Fuel Kerosene 840.6 2,175.7 987.7 1,117.6 817.5 1,385.8
Naphtha 21.4 78.7 126.9 16.9 85.2 0.4
Other Petroleum Products 271.5 294.4 518.9 491.9 549.8 510.8
Sources: International Enterprise (IE) Singapore and Energy Market Authority (EMA)
Source: Energy Market Authority (EMA)
Notes:a. Numbers may not add up to the totals due to rounding.b. All data are compiled from IE’s trade statistics.c. IE releases trade data in mass units. EMA releases similar data in energy units (ktoe).d. The product classification of energy products differs from that used by IE for trade statistics.
Notations:- nil, negligible or not applicable
Notes:a. Numbers may not add up to the totals due to rounding.b. Stock change refers to the net increase (stock draw) or net decrease (stock build) in the quantity of energy products over
the reference year. They are calculated as a difference between the opening and closing inventory at the start and end of the calendar year respectively.
c. A negative figure denotes a stock build. A positive figure denotes a stock draw.
Notations:- nil, negligible or not applicable
Unit: ktoeUnit: ktoe
2010 2011 2012 2013 2014 2015
Total 509.8 868.9 23.2 -581.5 -142.7 -1,498.9
Crude Oil & Natural Gas Liquids (NGL) -64.0 304.8 59.2 -372.9 -155.7 -20.9
Petroleum Products 573.8 564.1 -36.0 -208.7 101.2 -1,519.4
Light Distillates 42.5 -221.5 180.0 -181.6 -155.2 -138.1
Middle Distillates -82.8 486.6 -223.8 444.2 -70.7 -277.5
Heavy Distillates & Residuum 614.0 299.0 7.8 -471.2 327.0 -1,103.9
Natural Gas - - - - -88.2 41.4
020 E N E R G Y T R A N S F O R M AT I O N 021S I N G A P O R E E N E R G Y S TAT I S T I C S 2 0 1 7
022 E N E R G Y T R A N S F O R M AT I O N 023S I N G A P O R E E N E R G Y S TAT I S T I C S 2 0 1 7
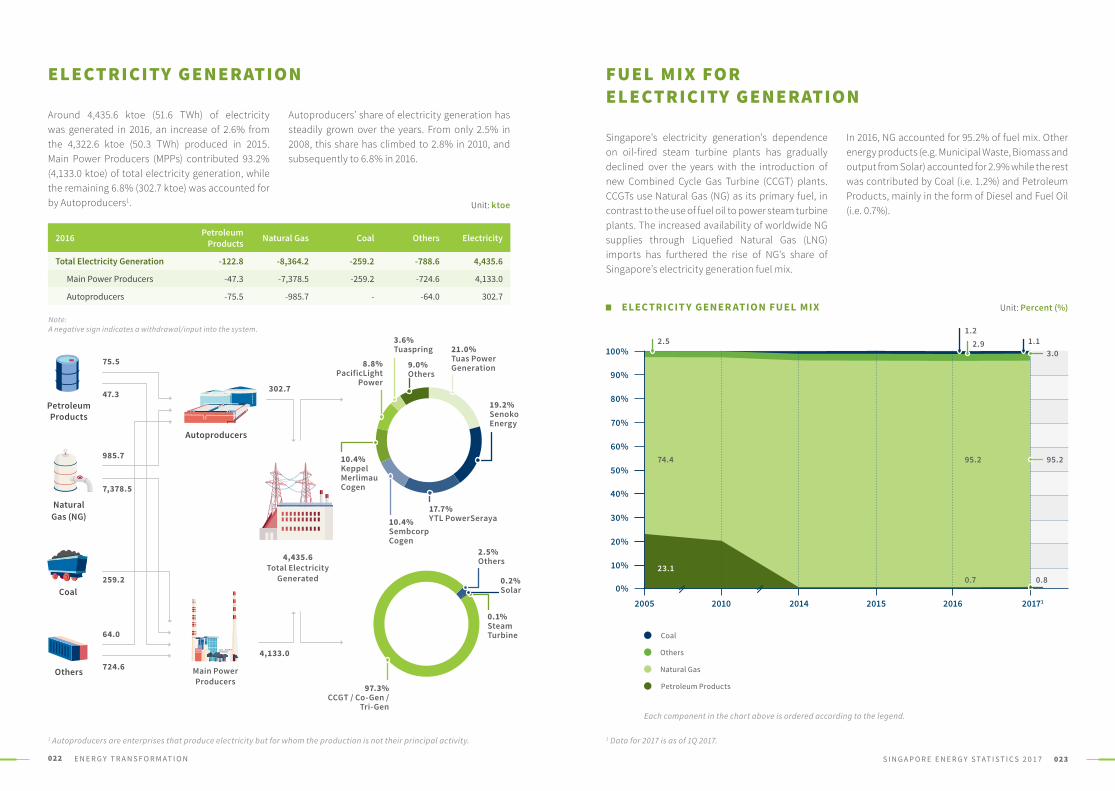
Around 4,435.6 ktoe (51.6 TWh) of electricity was generated in 2016, an increase of 2.6% from the 4,322.6 ktoe (50.3 TWh) produced in 2015. Main Power Producers (MPPs) contributed 93.2% (4,133.0 ktoe) of total electricity generation, while the remaining 6.8% (302.7 ktoe) was accounted for by Autoproducers1.
ELECTRICITY GENERATION
Autoproducers’ share of electricity generation has steadily grown over the years. From only 2.5% in 2008, this share has climbed to 2.8% in 2010, and subsequently to 6.8% in 2016.
1 Autoproducers are enterprises that produce electricity but for whom the production is not their principal activity. 1 Data for 2017 is as of 1Q 2017.
Unit: ktoe
FUEL MIX FOR ELECTRICITY GENERATION
ELEC TRICIT Y GENER ATION FUEL MIX
2016 Petroleum Products Natural Gas Coal Others Electricity
Total Electricity Generation -122.8 -8,364.2 -259.2 -788.6 4,435.6
Main Power Producers -47.3 -7,378.5 -259.2 -724.6 4,133.0
Autoproducers -75.5 -985.7 - -64.0 302.7
17.7% YTL PowerSeraya10.4%
Sembcorp Cogen
97.3%CCGT / Co-Gen /
Tri-Gen
21.0% Tuas Power Generation
19.2% Senoko Energy
9.0% Others
3.6%Tuaspring
8.8% PacificLight
Power
PetroleumProducts
Natural Gas (NG)
Coal
Others
Autoproducers
4,435.6Total Electricity
Generated
75.5
985.7
64.0
47.3
7,378.5
302.7
4,133.0
259.2
724.6
2.5% Others
0.1% Steam Turbine
0.2% Solar
10.4%Keppel Merlimau Cogen
Petroleum Products
Natural Gas
Others
Coal
2005 2010 2014 2015 2016 20171
95.2
0.7
74.4
2.5 2.93.0
95.2
0.823.1
0%
10%
30%
40%
50%
60%
20%
70%
80%
90%
100%
Unit: Percent (%)
1.21.1
Main PowerProducers
Singapore’s electricity generation’s dependence on oil-fired steam turbine plants has gradually declined over the years with the introduction of new Combined Cycle Gas Turbine (CCGT) plants. CCGTs use Natural Gas (NG) as its primary fuel, in contrast to the use of fuel oil to power steam turbine plants. The increased availability of worldwide NG supplies through Liquefied Natural Gas (LNG) imports has furthered the rise of NG’s share of Singapore’s electricity generation fuel mix.
In 2016, NG accounted for 95.2% of fuel mix. Other energy products (e.g. Municipal Waste, Biomass and output from Solar) accounted for 2.9% while the rest was contributed by Coal (i.e. 1.2%) and Petroleum Products, mainly in the form of Diesel and Fuel Oil (i.e. 0.7%).
Note: A negative sign indicates a withdrawal/input into the system.
Each component in the chart above is ordered according to the legend.
024 E N E R G Y T R A N S F O R M AT I O N 025S I N G A P O R E E N E R G Y S TAT I S T I C S 2 0 1 7
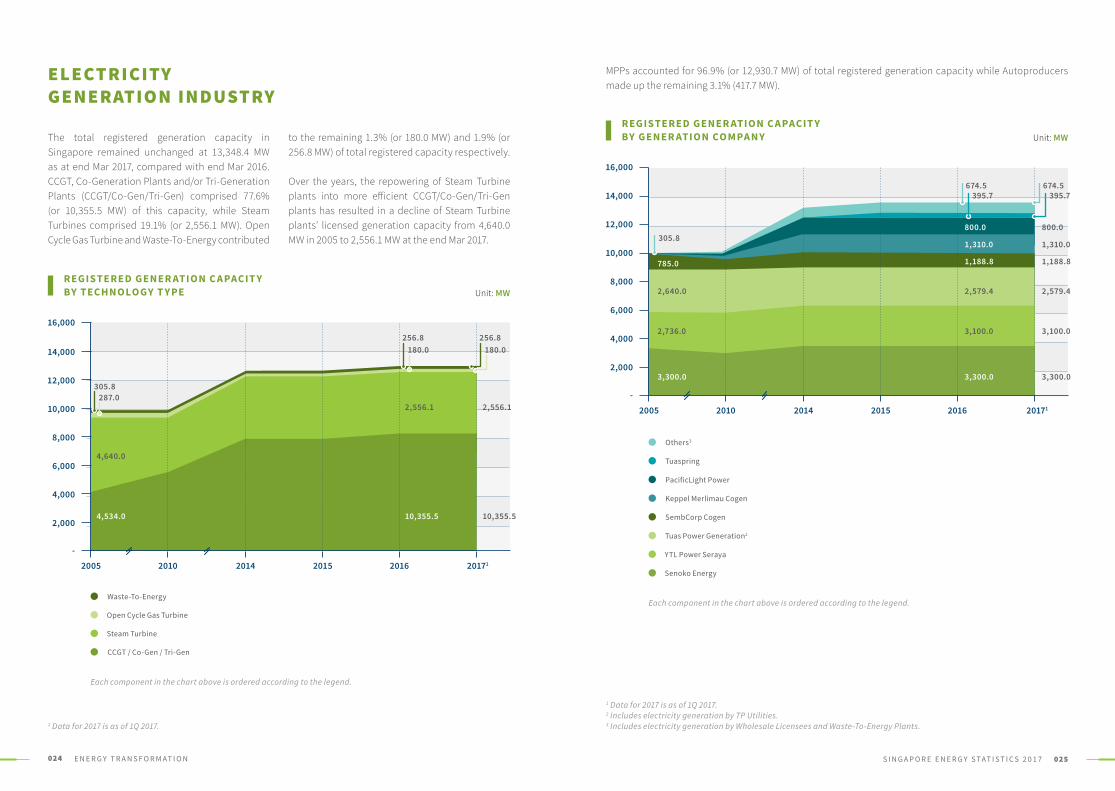
ELECTRICITY GENERATION INDUSTRY
REGISTERED GENER ATION C A PACIT Y BY TECHNOLOGY T Y PE
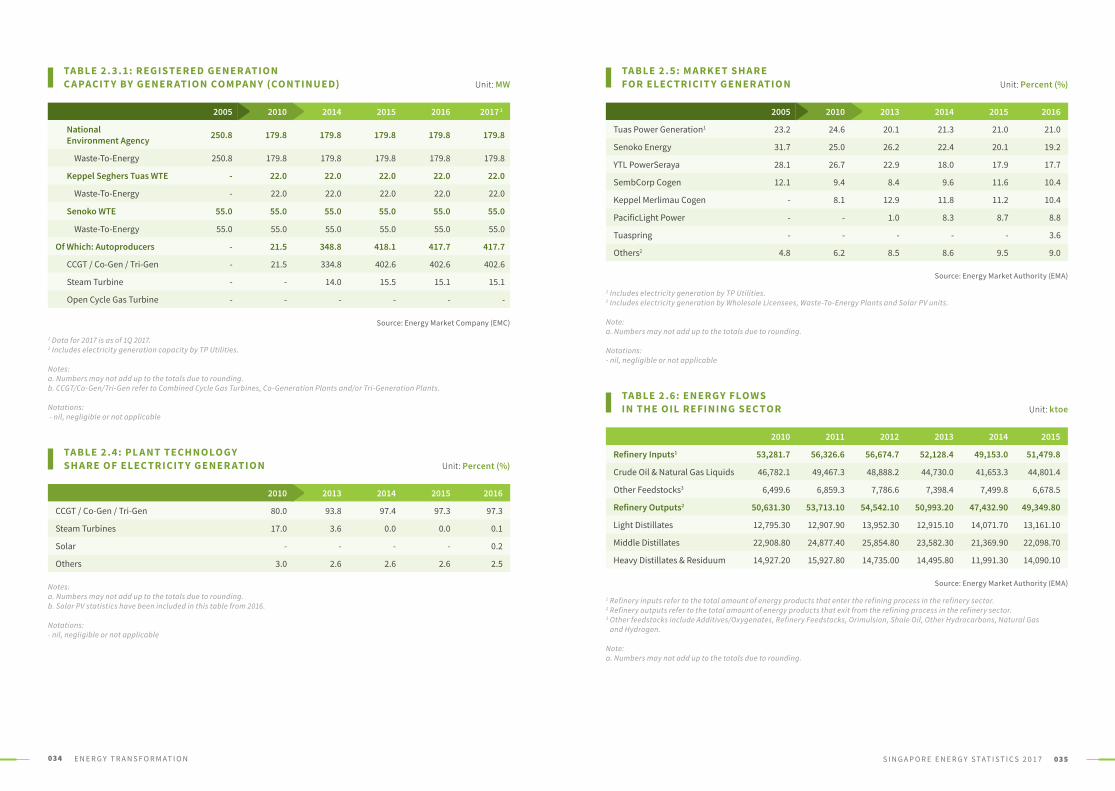
MPPs accounted for 96.9% (or 12,930.7 MW) of total registered generation capacity while Autoproducers made up the remaining 3.1% (417.7 MW).
REGISTERED GENER ATION C A PACIT Y BY GENER ATION COMPA N Y
Unit: MW
Unit: MW
CCGT / Co-Gen / Tri-Gen
Steam Turbine
Open Cycle Gas Turbine
Waste-To-Energy
2,000
-
4,000
8,000
10,000
12,000
14,000
6,000
16,000
2005 2010 2014 2015 2016 20171
4,534.0
4,640.0
305.8
256.8 256.8
287.0
180.0 180.0
2,000
-
4,000
8,000
10,000
12,000
14,000
6,000
16,000
2005 2010 2014 2015 2016 20171
3,300.0
2,736.0
2,640.0
785.0
305.8
3,100.0 3,100.0
2,579.4 2,579.4
1,188.8 1,188.8
674.5 674.5
3,300.0 3,300.0
800.0 800.0
395.7 395.7
1,310.0 1,310.0
1 Data for 2017 is as of 1Q 2017. 2 Includes electricity generation by TP Utilities. 3 Includes electricity generation by Wholesale Licensees and Waste-To-Energy Plants.1 Data for 2017 is as of 1Q 2017.
10,355.5 10,355.5
2,556.1 2,556.1
The total registered generation capacity in Singapore remained unchanged at 13,348.4 MW as at end Mar 2017, compared with end Mar 2016. CCGT, Co-Generation Plants and/or Tri-Generation Plants (CCGT/Co-Gen/Tri-Gen) comprised 77.6% (or 10,355.5 MW) of this capacity, while Steam Turbines comprised 19.1% (or 2,556.1 MW). Open Cycle Gas Turbine and Waste-To-Energy contributed
to the remaining 1.3% (or 180.0 MW) and 1.9% (or 256.8 MW) of total registered capacity respectively. Over the years, the repowering of Steam Turbine plants into more efficient CCGT/Co-Gen/Tri-Gen plants has resulted in a decline of Steam Turbine plants’ licensed generation capacity from 4,640.0 MW in 2005 to 2,556.1 MW at the end Mar 2017.
Senoko Energy
YTL Power Seraya
Tuas Power Generation2
SembCorp Cogen
PacificLight Power
Tuaspring
Others3
Keppel Merlimau Cogen
Each component in the chart above is ordered according to the legend.
Each component in the chart above is ordered according to the legend.
026 E N E R G Y T R A N S F O R M AT I O N 027S I N G A P O R E E N E R G Y S TAT I S T I C S 2 0 1 7
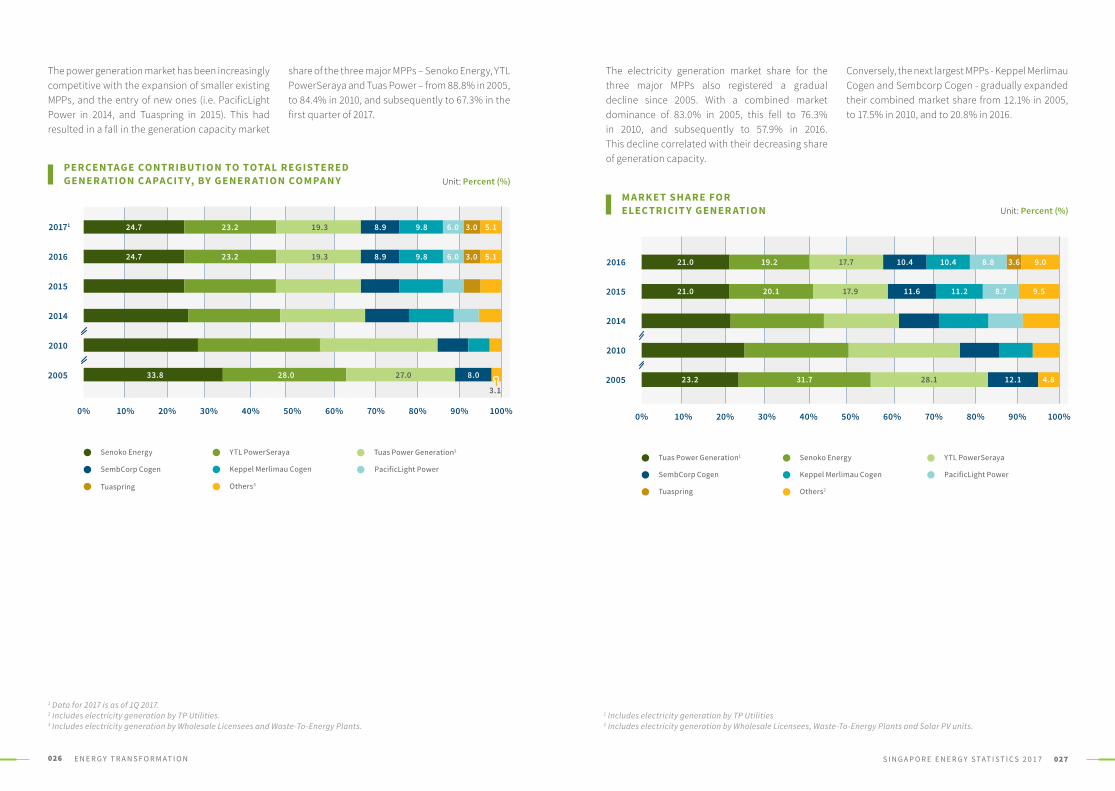
PERCENTAGE CONTRIBUTION TO TOTA L REGISTERED GENER ATION C A PACIT Y, BY GENER ATION COMPA N Y Unit: Percent (%)
Unit: Percent (%)
1 Data for 2017 is as of 1Q 2017. 2 Includes electricity generation by TP Utilities. 3 Includes electricity generation by Wholesale Licensees and Waste-To-Energy Plants.
M A RK ET SH A RE FOR ELEC TRICIT Y GENER ATION
The electricity generation market share for the three major MPPs also registered a gradual decline since 2005. With a combined market dominance of 83.0% in 2005, this fell to 76.3% in 2010, and subsequently to 57.9% in 2016. This decline correlated with their decreasing share of generation capacity.
Conversely, the next largest MPPs - Keppel Merlimau Cogen and Sembcorp Cogen - gradually expanded their combined market share from 12.1% in 2005, to 17.5% in 2010, and to 20.8% in 2016.
1 Includes electricity generation by TP Utilities2 Includes electricity generation by Wholesale Licensees, Waste-To-Energy Plants and Solar PV units.
0%
2010
2005
2014
2015
2016
10% 20% 30% 70%40% 80%50% 90%60% 100%
21.0
21.0
23.2
20.1
19.2
17.9
17.7
31.7
11.6
10.4 10.4 8.8 3.6 9.0
11.2
28.1
8.7
12.1
9.5
4.8
Tuas Power Generation1
Keppel Merlimau Cogen
Others2
PacificLight Power
Tuaspring
Senoko Energy YTL PowerSeraya
SembCorp Cogen
Senoko Energy YTL PowerSeraya
Keppel Merlimau Cogen
Others3
Tuas Power Generation2
PacificLight PowerSembCorp Cogen
Tuaspring
0%
2010
2005
2014
2015
2016
20171
10% 20% 30% 70%40% 80%50% 90%60% 100%
33.8 28.0 27.0 8.0
24.7 23.2 19.3 8.9 9.8 6.0 3.0 5.1
24.7 23.2 19.3 8.9 9.8 6.0 3.0 5.1
3.1
The power generation market has been increasingly competitive with the expansion of smaller existing MPPs, and the entry of new ones (i.e. PacificLight Power in 2014, and Tuaspring in 2015). This had resulted in a fall in the generation capacity market
share of the three major MPPs – Senoko Energy, YTL PowerSeraya and Tuas Power – from 88.8% in 2005, to 84.4% in 2010, and subsequently to 67.3% in the first quarter of 2017.
028 E N E R G Y T R A N S F O R M AT I O N 029S I N G A P O R E E N E R G Y S TAT I S T I C S 2 0 1 7
Refinery Inputs Light Distillates Middle DistillatesHeavy Distillates& Residuum
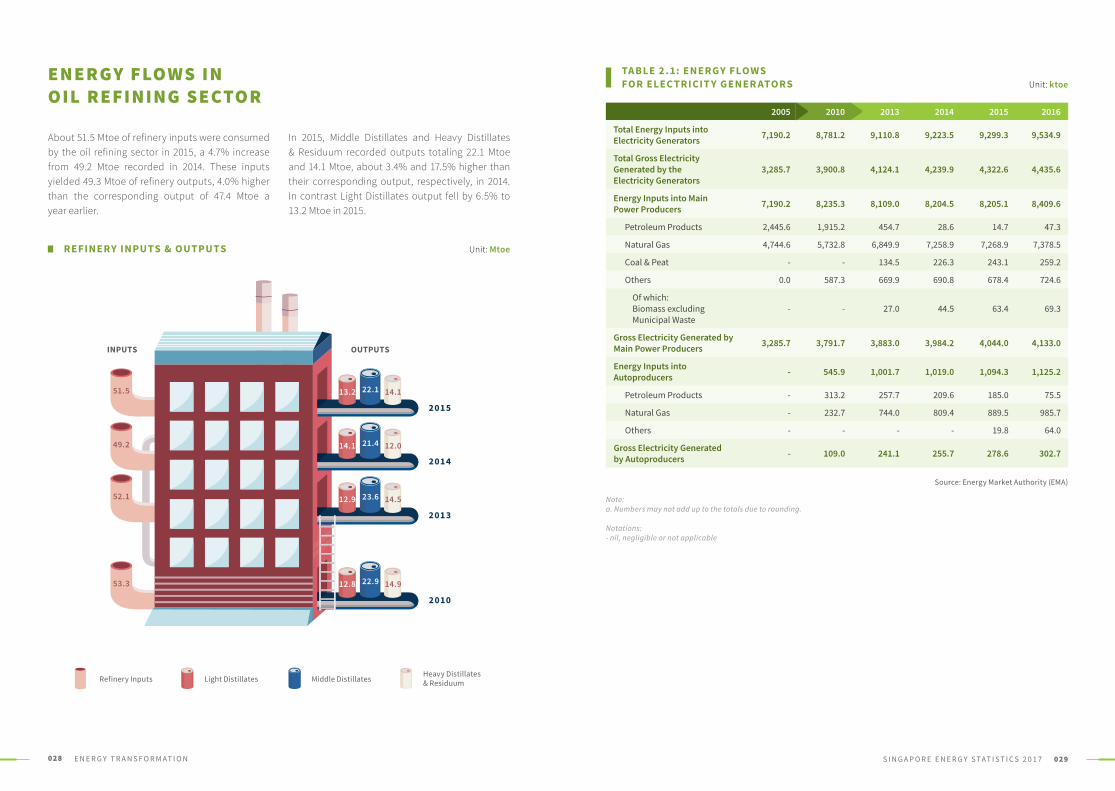
ENERGY FLOWS IN OIL REFINING SECTOR
REFINERY INPUTS & OUTPUTS
About 51.5 Mtoe of refinery inputs were consumed by the oil refining sector in 2015, a 4.7% increase from 49.2 Mtoe recorded in 2014. These inputs yielded 49.3 Mtoe of refinery outputs, 4.0% higher than the corresponding output of 47.4 Mtoe a year earlier.
TA BLE 2 .1: ENERGY FLOWS FOR ELEC TRICIT Y GENER ATORS Unit: ktoe
2005 2010 2013 2014 2015 2016
Total Energy Inputs into Electricity Generators 7,190.2 8,781.2 9,110.8 9,223.5 9,299.3 9,534.9
Total Gross Electricity Generated by the Electricity Generators
3,285.7 3,900.8 4,124.1 4,239.9 4,322.6 4,435.6
Energy Inputs into Main Power Producers 7,190.2 8,235.3 8,109.0 8,204.5 8,205.1 8,409.6
Petroleum Products 2,445.6 1,915.2 454.7 28.6 14.7 47.3
Natural Gas 4,744.6 5,732.8 6,849.9 7,258.9 7,268.9 7,378.5
Coal & Peat - - 134.5 226.3 243.1 259.2
Others 0.0 587.3 669.9 690.8 678.4 724.6
Of which: Biomass excluding Municipal Waste
- - 27.0 44.5 63.4 69.3
Gross Electricity Generated by Main Power Producers 3,285.7 3,791.7 3,883.0 3,984.2 4,044.0 4,133.0
Energy Inputs into Autoproducers - 545.9 1,001.7 1,019.0 1,094.3 1,125.2
Petroleum Products - 313.2 257.7 209.6 185.0 75.5
Natural Gas - 232.7 744.0 809.4 889.5 985.7
Others - - - - 19.8 64.0
Gross Electricity Generated by Autoproducers - 109.0 241.1 255.7 278.6 302.7
Source: Energy Market Authority (EMA)
Note:a. Numbers may not add up to the totals due to rounding.
Notations:- nil, negligible or not applicable
Unit: Mtoe
In 2015, Middle Distillates and Heavy Distillates & Residuum recorded outputs totaling 22.1 Mtoe and 14.1 Mtoe, about 3.4% and 17.5% higher than their corresponding output, respectively, in 2014. In contrast Light Distillates output fell by 6.5% to 13.2 Mtoe in 2015.
51.5
49.2
52.1
53.3
2010
12.8 22.9 14.9
201 3
12.9 23.6 14.5
2014
14.1 21.4 12.0
201 5
13.2 22.1 14.1
INPUTS OUTPUTS
030 E N E R G Y T R A N S F O R M AT I O N 031S I N G A P O R E E N E R G Y S TAT I S T I C S 2 0 1 7
TA BLE 2 . 2: A NNUA L FUEL MIX FOR ELEC TRICIT Y GENER ATION BY ENERGY PRODUC TS Unit: Percent (%) Unit: Percent (%)
2014
Jan Feb Mar Apr May Jun Jul Aug Sep Oct Nov Dec
Petroleum Products 0.5 0.4 0.5 1.4 0.8 1.5 0.9 0.8 0.3 0.5 0.4 0.3
Natural Gas 95.3 96.0 96.0 94.7 95.3 94.4 95.1 95.5 95.7 95.4 95.7 95.6
Coal 1.1 0.9 0.7 1.1 1.2 1.3 1.3 1.2 1.3 1.2 1.2 1.2
Others 3.1 2.7 2.8 2.8 2.7 2.8 2.7 2.6 2.8 2.9 2.8 2.8
2015
Jan Feb Mar Apr May Jun Jul Aug Sep Oct Nov Dec
Petroleum Products 0.4 0.7 0.5 0.5 0.7 0.5 0.9 1.1 0.9 0.7 0.3 0.3
Natural Gas 95.9 95.4 95.2 95.4 95.1 95.3 94.8 94.5 95.2 95.3 95.8 95.4
Coal 0.7 0.9 1.3 1.2 1.3 1.3 1.3 1.4 1.2 1.2 1.0 1.2
Others 2.6 3.1 3.0 2.9 3.0 2.9 3.0 3.1 2.7 2.9 2.8 3.1
2016
Jan Feb Mar Apr May Jun Jul Aug Sep Oct Nov Dec
Petroleum Products 0.1 0.3 0.2 0.2 0.2 0.1 0.4 0.5 1.0 0.2 3.9 1.0
Natural Gas 95.7 95.3 95.5 95.7 95.5 95.8 95.6 96.2 94.4 95.6 92.0 94.8
Coal 1.0 1.1 1.3 1.3 1.4 1.4 1.3 0.7 1.4 1.4 1.3 1.3
Others 3.2 3.4 3.0 2.8 2.9 2.8 2.7 2.6 3.3 2.9 2.7 3.0
2005 2010 2014 2015 2016 20171
Petroleum Products 23.1 20.2 0.7 0.7 0.7 0.8
Natural Gas 74.4 77.2 95.4 95.3 95.2 95.2
Coal - - 1.1 1.2 1.2 1.1
Others 2.5 2.6 2.8 2.9 2.9 3.0
Source: Energy Market Authority (EMA)
1Data for 2017 is as of 1Q 2017.
Notes:a. Numbers may not add up to the totals due to rounding.b. The Fuel Mix presented in this table is calculated using the Output Method. The Output Method uses the amount of electricity
generated and the corresponding type of fuel used to calculate the fuel mix for the generation of electricity. It takes into account the domestic fuel-to-electricity conversion efficiency of the generating plants and the plant technology.
c. From 2016, the category “Others” includes solar.
TA BLE 2 . 2 .1: MONTHLY FUEL MIX FOR ELEC TRICIT Y GENER ATION BY ENERGY PRODUC TS
Source: Energy Market Authority (EMA)
Notes:a. Numbers may not add up to the totals due to rounding.b. The Fuel Mix presented in this table is calculated using the Output Method. The Output Method uses the amount of electricity
generated and the corresponding type of fuel used to calculate the fuel mix for the generation of electricity. It takes into account the domestic fuel-to-electricity conversion efficiency of the generating plants and the plant technology.
c. From 2016, the category “Others” includes solar.
2017
Jan Feb Mar
Petroleum Products 0.6 0.9 0.9
Natural Gas 95.0 95.1 95.5
Coal 1.3 1.1 0.8
Others 3.1 2.9 2.9
032 E N E R G Y T R A N S F O R M AT I O N 033S I N G A P O R E E N E R G Y S TAT I S T I C S 2 0 1 7
TA BLE 2 . 3: REGISTERED GENER ATION C A PACIT Y BY TECHNOLOGY T Y PE
TA BLE 2 . 3.1: REGISTERED GENER ATION C A PACIT Y BY GENER ATION COMPA N Y
Source: Energy Market Company (EMC)
1 Data for 2017 is as of end-March 2017.
Notes:a. Numbers may not add up to the totals due to rounding.b. CCGT/Co-Gen/Tri-Gen refer to Combined Cycle Gas Turbines, Co-Generation Plants and/or Tri-Generation Plants.
Notations:- nil, negligible or not applicable
2005 2010 2014 2015 2016 20171
Total Registered Generation Capacity 9,766.8 9,928.3 12,883.8 13,348.8 13,348.4 13,348.4
CCGT / Co-Gen / Tri-Gen 4,534.0 6,153.5 9,892.0 10,355.5 10,355.5 10,355.5
Steam Turbine 4,640.0 3,148.0 2,555.0 2,556.5 2,556.1 2,556.1
Open Cycle Gas Turbine 287.0 370.0 180.0 180.0 180.0 180.0
Waste-To-Energy 305.8 256.8 256.8 256.8 256.8 256.8
Of Which: Main Power Producers 9,766.8 9,906.8 12,535.0 12,930.7 12,930.7 12,930.7
CCGT / Co-Gen / Tri-Gen 4,534.0 6,132.0 9,557.2 9,952.9 9,952.9 9,952.9
Steam Turbine 4,640.0 3,148.0 2,541.0 2,541.0 2,541.0 2,541.0
Open Cycle Gas Turbine 287.0 370.0 180.0 180.0 180.0 180.0
Waste-To-Energy 305.8 256.8 256.8 256.8 256.8 256.8
Of Which: Autoproducers - 21.5 348.8 418.1 417.7 417.7
CCGT / Co-Gen / Tri-Gen - 21.5 334.8 402.6 402.6 402.6
Steam Turbine - - 14.0 15.5 15.1 15.1
Open Cycle Gas Turbine - - - - - -
2005 2010 2014 2015 2016 20171
Total Registered Generation Capacity 9,766.8 9,928.3 12,883.8 13,348.8 13,348.4 13,348.4
Of Which: Main Power Producers
Senoko Energy 3,300.0 2,635.0 3,300.0 3,300.0 3,300.0 3,300.0
CCGT / Co-Gen / Tri-Gen 1,945.0 1,945.0 2,807.0 2,807.0 2,807.0 2,807.0
Steam Turbine 1,250.0 500.0 493.0 493.0 493.0 493.0
Open Cycle Gas Turbine 105.0 190.0 - - - -
YTL PowerSeraya 2,736.0 3,100.0 3,100.0 3,100.0 3,100.0 3,100.0
CCGT / Co-Gen / Tri-Gen 364.0 1,472.0 1,472.0 1,472.0 1,472.0 1,472.0
Steam Turbine 2,190.0 1,448.0 1,448.0 1,448.0 1,448.0 1,448.0
Open Cycle Gas Turbine 182.0 180.0 180.0 180.0 180.0 180.0
Tuas Power Generation2 2,640.0 2,640.0 2,579.4 2,579.4 2,579.4 2,579.4
CCGT / Co-Gen / Tri-Gen 1,440.0 1,440.0 1,979.4 1,979.4 1,979.4 1,979.4
Steam Turbine 1,200.0 1,200.0 600.0 600.0 600.0 600.0
Open Cycle Gas Turbine - - - - - -
SembCorp Cogen 785.0 785.0 1,188.8 1,188.8 1,188.8 1,188.8
CCGT / Co-Gen / Tri-Gen 785.0 785.0 1,188.8 1,188.8 1,188.8 1,188.8
Steam Turbine - - - - - -
Open Cycle Gas Turbine - - - - - -
Keppel Merlimau Cogen - 490.0 1,310.0 1,310.0 1,310.0 1,310.0
CCGT / Co-Gen / Tri-Gen - 490.0 1,310.0 1,310.0 1,310.0 1,310.0
Steam Turbine - - - - - -
Open Cycle Gas Turbine - - - - - -
PacificLight Power - - 800.0 800.0 800.0 800.0
CCGT / Co-Gen / Tri-Gen - - 800.0 800.0 800.0 800.0
Steam Turbine - - - - - -
Open Cycle Gas Turbine - - - - - -
Tuaspring - - - - 395.7 395.7
CCGT / Co-Gen / Tri-Gen - - - - 395.7 395.7
Steam Turbine - - - - - -
Open Cycle Gas Turbine - - - - - -
Unit: MW Unit: MW
034 E N E R G Y T R A N S F O R M AT I O N 035S I N G A P O R E E N E R G Y S TAT I S T I C S 2 0 1 7
2005 2010 2014 2015 2016 20171
National Environment Agency 250.8 179.8 179.8 179.8 179.8 179.8
Waste-To-Energy 250.8 179.8 179.8 179.8 179.8 179.8
Keppel Seghers Tuas WTE - 22.0 22.0 22.0 22.0 22.0
Waste-To-Energy - 22.0 22.0 22.0 22.0 22.0
Senoko WTE 55.0 55.0 55.0 55.0 55.0 55.0
Waste-To-Energy 55.0 55.0 55.0 55.0 55.0 55.0
Of Which: Autoproducers - 21.5 348.8 418.1 417.7 417.7
CCGT / Co-Gen / Tri-Gen - 21.5 334.8 402.6 402.6 402.6
Steam Turbine - - 14.0 15.5 15.1 15.1
Open Cycle Gas Turbine - - - - - -
Source: Energy Market Company (EMC)
1 Data for 2017 is as of 1Q 2017.2 Includes electricity generation capacity by TP Utilities.
Notes:a. Numbers may not add up to the totals due to rounding.b. CCGT/Co-Gen/Tri-Gen refer to Combined Cycle Gas Turbines, Co-Generation Plants and/or Tri-Generation Plants.
Notations: - nil, negligible or not applicable
TA BLE 2 .4: PL A NT TECHNOLOGY SH A RE OF ELEC TRICIT Y GENER ATION Unit: Percent (%)
2010 2013 2014 2015 2016
CCGT / Co-Gen / Tri-Gen 80.0 93.8 97.4 97.3 97.3
Steam Turbines 17.0 3.6 0.0 0.0 0.1
Solar - - - - 0.2
Others 3.0 2.6 2.6 2.6 2.5
TA BLE 2 . 5: M A RK ET SH A RE FOR ELEC TRICIT Y GENER ATION
TA BLE 2 .6: ENERGY FLOWS IN THE OIL REFINING SEC TOR
Unit: Percent (%)
Unit: ktoe
2005 2010 2013 2014 2015 2016
Tuas Power Generation1 23.2 24.6 20.1 21.3 21.0 21.0
Senoko Energy 31.7 25.0 26.2 22.4 20.1 19.2
YTL PowerSeraya 28.1 26.7 22.9 18.0 17.9 17.7
SembCorp Cogen 12.1 9.4 8.4 9.6 11.6 10.4
Keppel Merlimau Cogen - 8.1 12.9 11.8 11.2 10.4
PacificLight Power - - 1.0 8.3 8.7 8.8
Tuaspring - - - - - 3.6
Others2 4.8 6.2 8.5 8.6 9.5 9.0
2010 2011 2012 2013 2014 2015
Refinery Inputs1 53,281.7 56,326.6 56,674.7 52,128.4 49,153.0 51,479.8
Crude Oil & Natural Gas Liquids 46,782.1 49,467.3 48,888.2 44,730.0 41,653.3 44,801.4
Other Feedstocks3 6,499.6 6,859.3 7,786.6 7,398.4 7,499.8 6,678.5
Refinery Outputs2 50,631.30 53,713.10 54,542.10 50,993.20 47,432.90 49,349.80
Light Distillates 12,795.30 12,907.90 13,952.30 12,915.10 14,071.70 13,161.10
Middle Distillates 22,908.80 24,877.40 25,854.80 23,582.30 21,369.90 22,098.70
Heavy Distillates & Residuum 14,927.20 15,927.80 14,735.00 14,495.80 11,991.30 14,090.10
Source: Energy Market Authority (EMA)
Source: Energy Market Authority (EMA)
1 Includes electricity generation by TP Utilities.2 Includes electricity generation by Wholesale Licensees, Waste-To-Energy Plants and Solar PV units.
Note:a. Numbers may not add up to the totals due to rounding.
Notations:- nil, negligible or not applicable
1 Refinery inputs refer to the total amount of energy products that enter the refining process in the refinery sector.2 Refinery outputs refer to the total amount of energy products that exit from the refining process in the refinery sector.3 Other feedstocks include Additives/Oxygenates, Refinery Feedstocks, Orimulsion, Shale Oil, Other Hydrocarbons, Natural Gas
and Hydrogen.
Note:a. Numbers may not add up to the totals due to rounding.
TA BLE 2 . 3.1: REGISTERED GENER ATION C A PACIT Y BY GENER ATION COMPA N Y (CONTINUED) Unit: MW
Notes:a. Numbers may not add up to the totals due to rounding.b. Solar PV statistics have been included in this table from 2016. Notations:- nil, negligible or not applicable

036 E N E R G Y C O N S U M P T I O N 037S I N G A P O R E E N E R G Y S TAT I S T I C S 2 0 1 7
038 E N E R G Y C O N S U M P T I O N 039S I N G A P O R E E N E R G Y S TAT I S T I C S 2 0 1 7
MARKET SHARE FOR ELECTRICITY RETAIL
M A RK ET SH A RE FOR ELEC TRICIT Y RETA IL
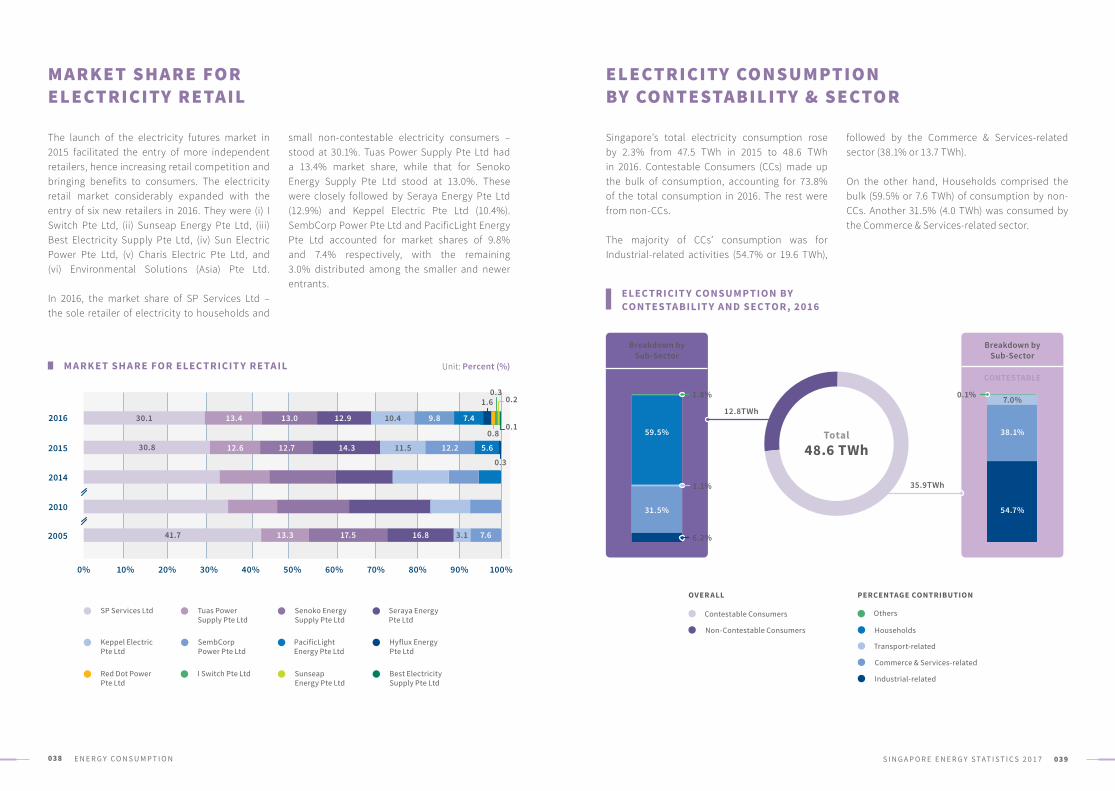
The launch of the electricity futures market in 2015 facilitated the entry of more independent retailers, hence increasing retail competition and bringing benefits to consumers. The electricity retail market considerably expanded with the entry of six new retailers in 2016. They were (i) I Switch Pte Ltd, (ii) Sunseap Energy Pte Ltd, (iii) Best Electricity Supply Pte Ltd, (iv) Sun Electric Power Pte Ltd, (v) Charis Electric Pte Ltd, and (vi) Environmental Solutions (Asia) Pte Ltd.
In 2016, the market share of SP Services Ltd – the sole retailer of electricity to households and
ELECTRICITY CONSUMPTION BY CONTESTABILITY & SECTOR
ELEC TRICIT Y CONSUMP TION BY CONTESTA BILIT Y A ND SEC TOR, 2016
Unit: Percent (%)
0%
2010
2005
2014
2015
2016
10% 20% 30% 70%40% 80%50% 90%60% 100%
13.430.1
30.8
13.0 12.9
12.6 12.7 14.3
3.1 7.6
11.5
10.4
13.341.7 17.5 16.8
0.3
1.60.3
0.2
0.10.8
SP Services Ltd Tuas Power Supply Pte Ltd
Keppel Electric Pte Ltd
Hyflux Energy Pte Ltd
Red Dot Power Pte Ltd
Best Electricity Supply Pte Ltd
Senoko Energy Supply Pte Ltd
SembCorp Power Pte Ltd
Seraya Energy Pte Ltd
PacificLight Energy Pte Ltd
I Switch Pte Ltd Sunseap Energy Pte Ltd
9.8 7.4
12.2 5.6
Households
Industrial-related
Transport-related
Commerce & Services-related
Non-Contestable Consumers
OthersContestable Consumers
PERCENTAGE CONTRIBUTIONOVER ALL
Breakdown by Sub-Sector
NON-CONTESTABLE CONTESTABLE
Breakdown by Sub-Sector
12.8TWh
35.9TWh
48.6 TWhTotal59.5%
31.5% 54.7%
38.1%
7.0%1.8%
1.1%
6.2%
0.1%
small non-contestable electricity consumers – stood at 30.1%. Tuas Power Supply Pte Ltd had a 13.4% market share, while that for Senoko Energy Supply Pte Ltd stood at 13.0%. These were closely followed by Seraya Energy Pte Ltd (12.9%) and Keppel Electric Pte Ltd (10.4%). SembCorp Power Pte Ltd and PacificLight Energy Pte Ltd accounted for market shares of 9.8% and 7.4% respectively, with the remaining 3.0% distributed among the smaller and newer entrants.
Singapore’s total electricity consumption rose by 2.3% from 47.5 TWh in 2015 to 48.6 TWh in 2016. Contestable Consumers (CCs) made up the bulk of consumption, accounting for 73.8% of the total consumption in 2016. The rest were from non-CCs. The majority of CCs’ consumption was for Industrial-related activities (54.7% or 19.6 TWh),
followed by the Commerce & Services-related sector (38.1% or 13.7 TWh). On the other hand, Households comprised the bulk (59.5% or 7.6 TWh) of consumption by non-CCs. Another 31.5% (4.0 TWh) was consumed by the Commerce & Services-related sector.
040 E N E R G Y C O N S U M P T I O N 041S I N G A P O R E E N E R G Y S TAT I S T I C S 2 0 1 7
Jan Feb Mar Apr May Jun Jul Aug Sep Oct Nov Dec
Private HousingPublic Housing Average Consumption Average Consumption
Unit: kWh
725.0
383.9
TOTA L ELEC TRICIT Y CONSUMP TION OF HOUSEHOLDS, 2016
HOUSEHOLD ELECTRICITY CONSUMPTION
AV ER AGE MONTHLY ELEC TRICIT Y CONSUMP TION BY PUBLIC HOUSING DWELLING T Y PE , 2016
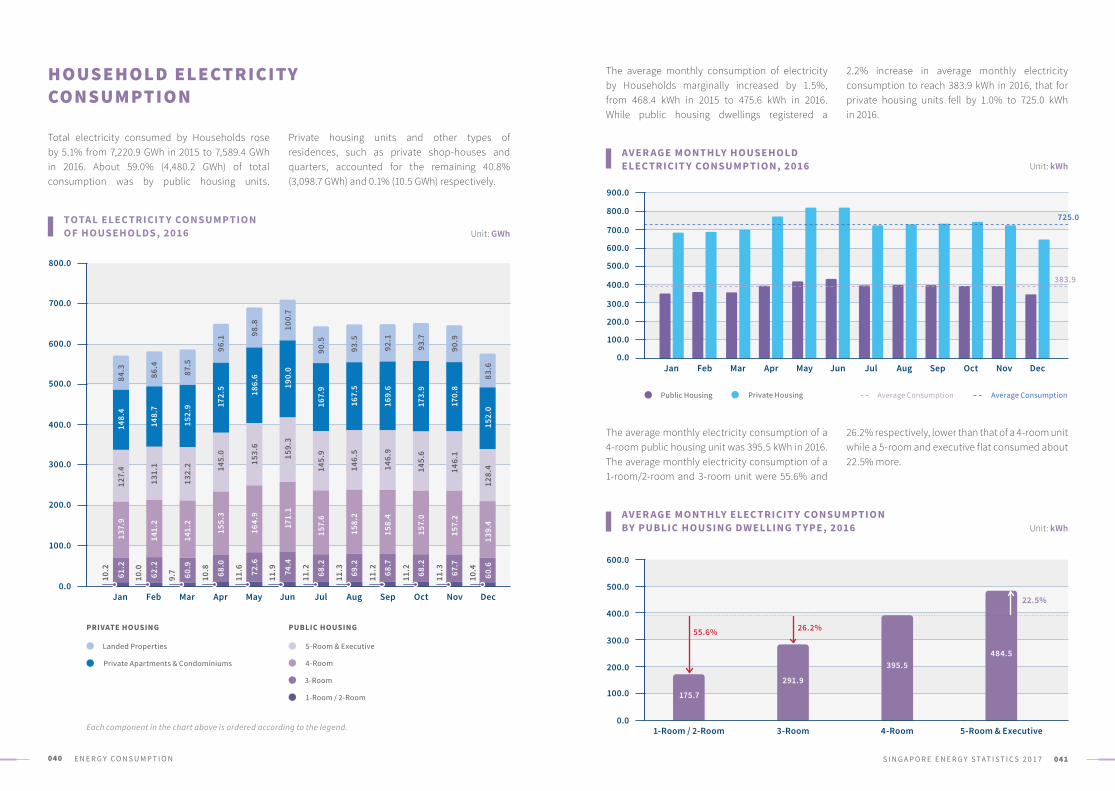
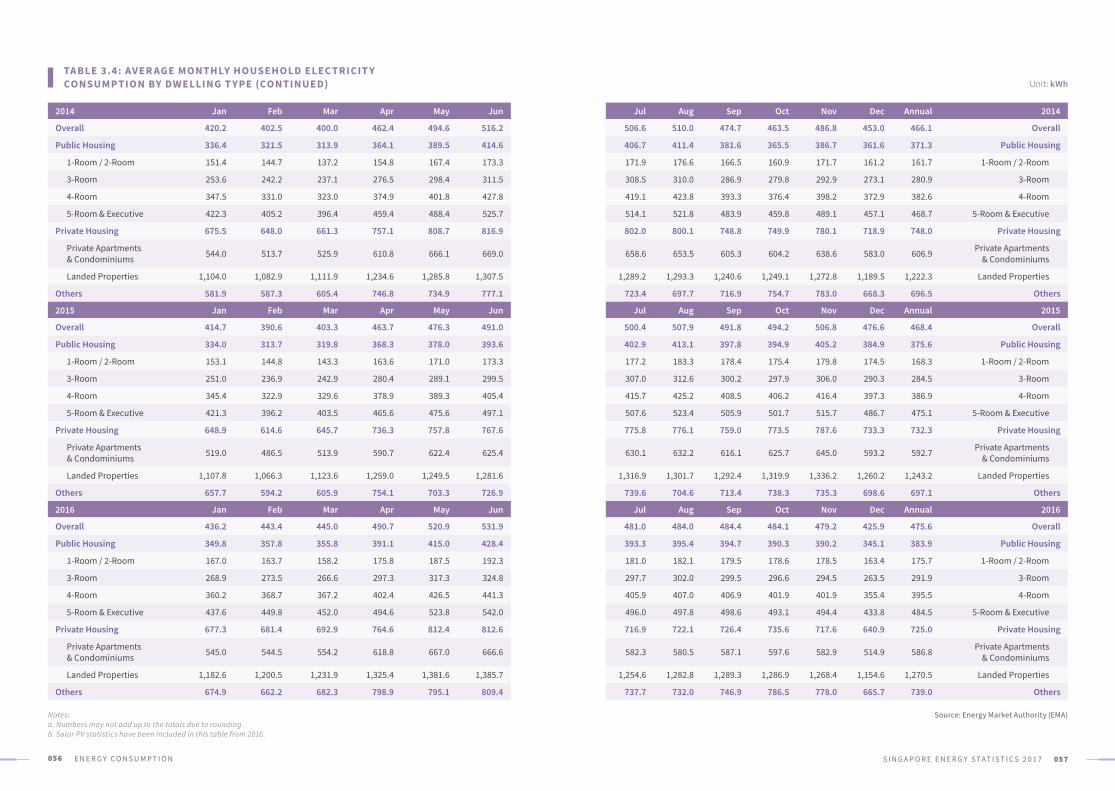
The average monthly consumption of electricity by Households marginally increased by 1.5%, from 468.4 kWh in 2015 to 475.6 kWh in 2016. While public housing dwellings registered a
2.2% increase in average monthly electricity consumption to reach 383.9 kWh in 2016, that for private housing units fell by 1.0% to 725.0 kWh in 2016.
The average monthly electricity consumption of a 4-room public housing unit was 395.5 kWh in 2016. The average monthly electricity consumption of a 1-room/2-room and 3-room unit were 55.6% and
100.0
0.0
200.0
300.0
400.0
500.0
600.0
700.0
800.0
Jan Feb Mar Apr May Jun Jul Aug Sep Oct Nov Dec
10.2
10.0
148.
412
7.4
137.
961
.2
62.2
141.
213
1.1
148.
7
60.9
141.
213
2.2
152.
9
68.0
155.
314
5.0
172.
5
72.6
164.
915
3.6
186.
6
74.4
171.
115
9.3
190.
0
68.2
157.
614
5.9
167.
9
69.2
158.
214
6.5
167.
5
68.7
158.
414
6.9
169.
6
68.2
157.
014
5.6
173.
9
67.7
157.
214
6.1
170.
8
60.6
139.
412
8.4
152.
0
84.3
86.4
87.5
96.1
98.8 10
0.7
90.5
93.5
92.1
93.7
90.9
83.6
0.01-Room / 2-Room 3-Room 4-Room 5-Room & Executive
100.0
400.0
200.0
500.0
300.0
600.0
Unit: GWh
Unit: kWh
55.6% 26.2%
22.5%
5-Room & Executive
1-Room / 2-Room
4-Room
3-Room
Private Apartments & Condominiums
Landed Properties
PRIVATE HOUSING PUBLIC HOUSING
175.7
291.9
395.5484.5
9.7
10.8
11.6
11.9
11.2
11.3
11.2
11.2
11.3
10.4
26.2% respectively, lower than that of a 4-room unit while a 5-room and executive flat consumed about 22.5% more.
AV ER AGE MONTHLY HOUSEHOLD ELEC TRICIT Y CONSUMP TION, 2016
0.0
100.0
400.0
200.0
500.0
300.0
600.0
700.0
800.0
900.0
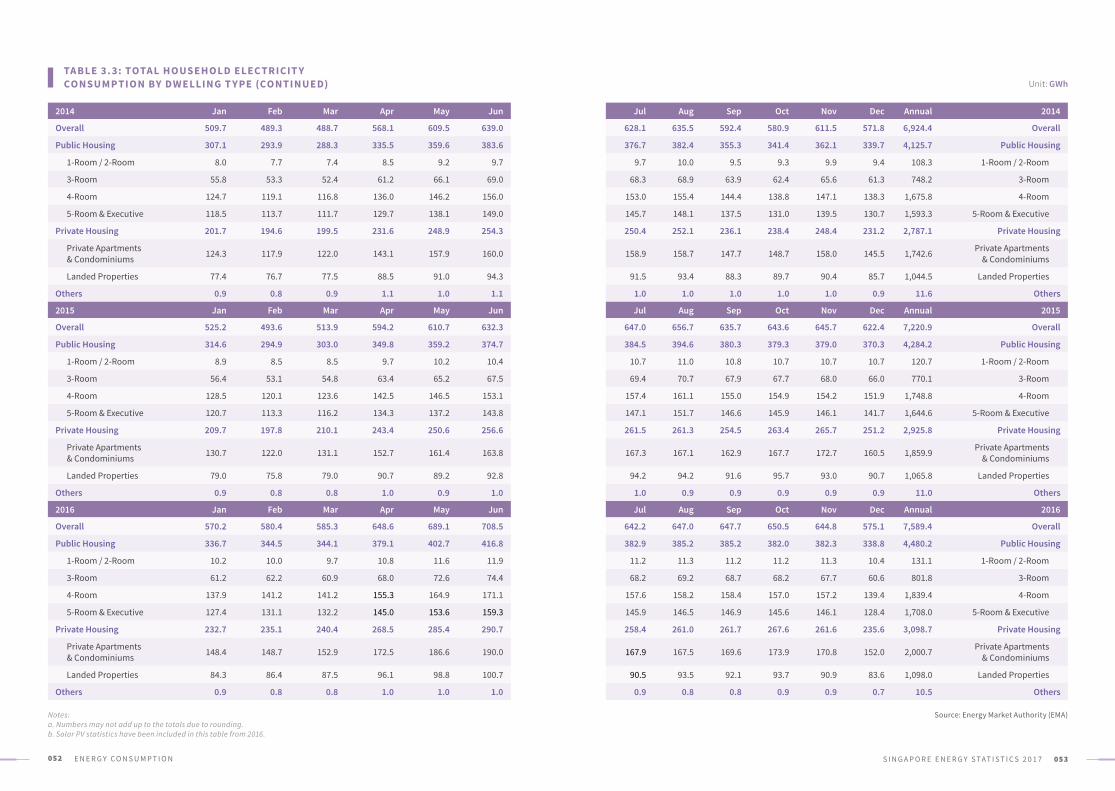
Total electricity consumed by Households rose by 5.1% from 7,220.9 GWh in 2015 to 7,589.4 GWh in 2016. About 59.0% (4,480.2 GWh) of total consumption was by public housing units.
Private housing units and other types of residences, such as private shop-houses and quarters, accounted for the remaining 40.8% (3,098.7 GWh) and 0.1% (10.5 GWh) respectively.
Each component in the chart above is ordered according to the legend.
042 E N E R G Y C O N S U M P T I O N 043S I N G A P O R E E N E R G Y S TAT I S T I C S 2 0 1 7
FINAL NATURAL GAS CONSUMPTION
FIN A L N ATUR A L G A S CONSUMP TION BY SEC TOR
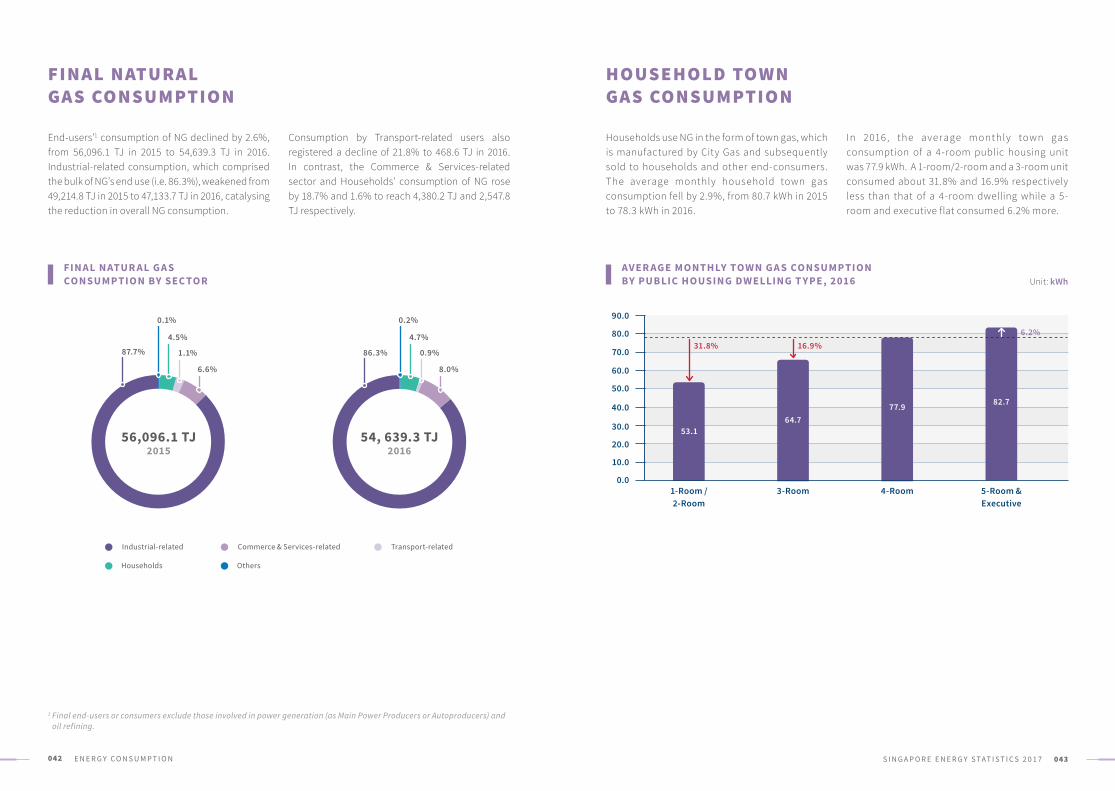
End-users’1 consumption of NG declined by 2.6%, from 56,096.1 TJ in 2015 to 54,639.3 TJ in 2016. Industrial-related consumption, which comprised the bulk of NG’s end use (i.e. 86.3%), weakened from 49,214.8 TJ in 2015 to 47,133.7 TJ in 2016, catalysing the reduction in overall NG consumption.
Consumption by Transport-related users also registered a decline of 21.8% to 468.6 TJ in 2016. In contrast, the Commerce & Services-related sector and Households’ consumption of NG rose by 18.7% and 1.6% to reach 4,380.2 TJ and 2,547.8 TJ respectively.
HOUSEHOLD TOWN GAS CONSUMPTION
AV ER AGE MONTHLY TOWN G A S CONSUMP TION BY PUBLIC HOUSING DWELLING T Y PE , 2016
In 2016 , the aver age monthly town gas consumption of a 4-room public housing unit was 77.9 kWh. A 1-room/2-room and a 3-room unit consumed about 31.8% and 16.9% respectively less than that of a 4-room dwelling while a 5- room and executive flat consumed 6.2% more.
Households use NG in the form of town gas, which is manufactured by City Gas and subsequently sold to households and other end-consumers. The average monthly household town gas consumption fell by 2.9%, from 80.7 kWh in 2015 to 78.3 kWh in 2016.
56,096.1 TJ2015
Industrial-related Transport-relatedCommerce & Services-related
OthersHouseholds
Unit: kWh
0.01-Room / 2-Room
3-Room 4-Room 5-Room &Executive
10.0
40.0
20.0
50.0
30.0
60.0
70.0
80.0
90.0
16.9%31.8%6.2%
1 Final end-users or consumers exclude those involved in power generation (as Main Power Producers or Autoproducers) and oil refining.
53.164.7
77.9 82.7
54, 639.3 TJ2016
0.2%
86.3%
4.7%
0.9%
8.0%
0.1%
4.5%
1.1%
6.6%
87.7%
044 E N E R G Y C O N S U M P T I O N 045S I N G A P O R E E N E R G Y S TAT I S T I C S 2 0 1 7
-Industrial -related
Commerce & Services-related
Transport -related
OthersHouseholds
2,000
8,000
4,000
10,000
6,000
12,000
OIL CONSUMPTION
TOTA L OIL CONSUMP TION BY SEC TOR
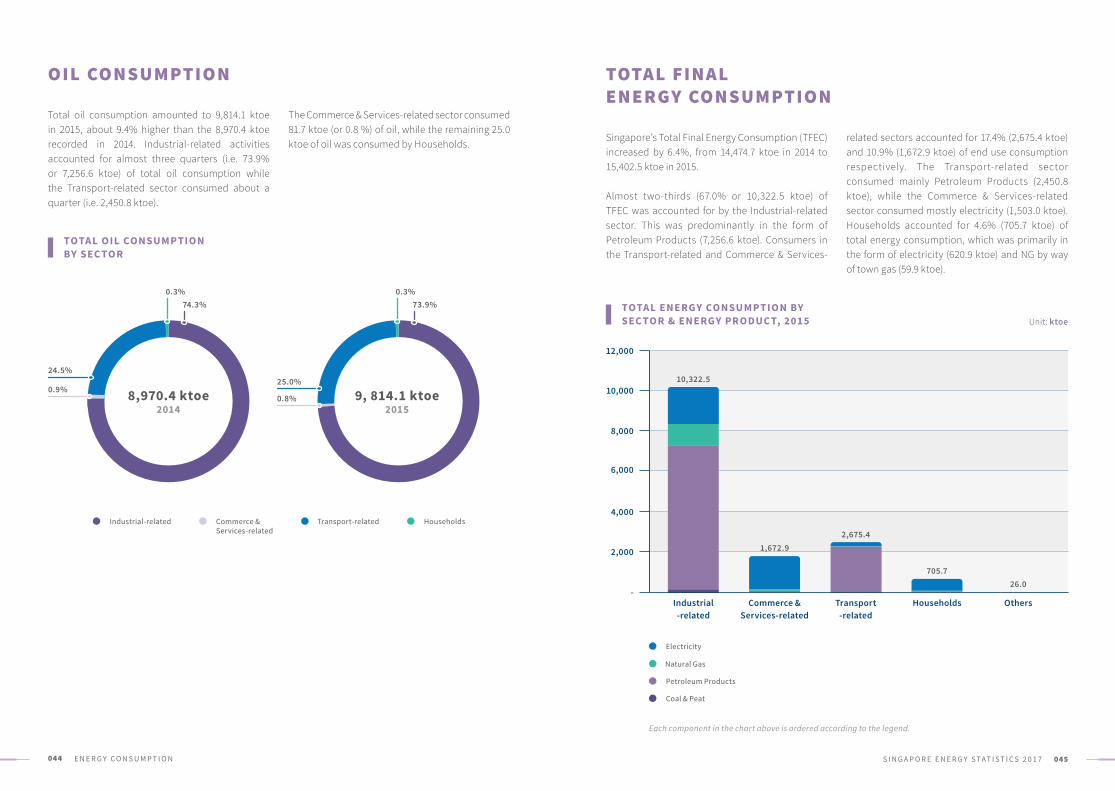
Total oil consumption amounted to 9,814.1 ktoe in 2015, about 9.4% higher than the 8,970.4 ktoe recorded in 2014. Industrial-related activities accounted for almost three quarters (i.e. 73.9% or 7,256.6 ktoe) of total oil consumption while the Transport-related sector consumed about a quarter (i.e. 2,450.8 ktoe).
The Commerce & Services-related sector consumed 81.7 ktoe (or 0.8 %) of oil, while the remaining 25.0 ktoe of oil was consumed by Households.
TOTAL FINAL ENERGY CONSUMPTION
TOTA L ENERGY CONSUMP TION BY SEC TOR & ENERGY PRODUC T, 2015
related sectors accounted for 17.4% (2,675.4 ktoe) and 10.9% (1,672.9 ktoe) of end use consumption respectively. The Transport-related sector consumed mainly Petroleum Products (2,450.8 ktoe), while the Commerce & Services-related sector consumed mostly electricity (1,503.0 ktoe). Households accounted for 4.6% (705.7 ktoe) of total energy consumption, which was primarily in the form of electricity (620.9 ktoe) and NG by way of town gas (59.9 ktoe).
Singapore’s Total Final Energy Consumption (TFEC) increased by 6.4%, from 14,474.7 ktoe in 2014 to 15,402.5 ktoe in 2015.
Almost two-thirds (67.0% or 10,322.5 ktoe) of TFEC was accounted for by the Industrial-related sector. This was predominantly in the form of Petroleum Products (7,256.6 ktoe). Consumers in the Transport-related and Commerce & Services-
Industrial-related Commerce & Services-related
HouseholdsTransport-related
0.3% 0.3%
25.0%
0.8%
74.3% 73.9%
Unit: ktoe
26.0705.7
2,675.41,672.9
10,322.5
8,970.4 ktoe 9, 814.1 ktoe2014 2015
Coal & Peat
Petroleum Products
Electricity
Natural Gas
24.5%
0.9%
Each component in the chart above is ordered according to the legend.
046 E N E R G Y C O N S U M P T I O N 047S I N G A P O R E E N E R G Y S TAT I S T I C S 2 0 1 7
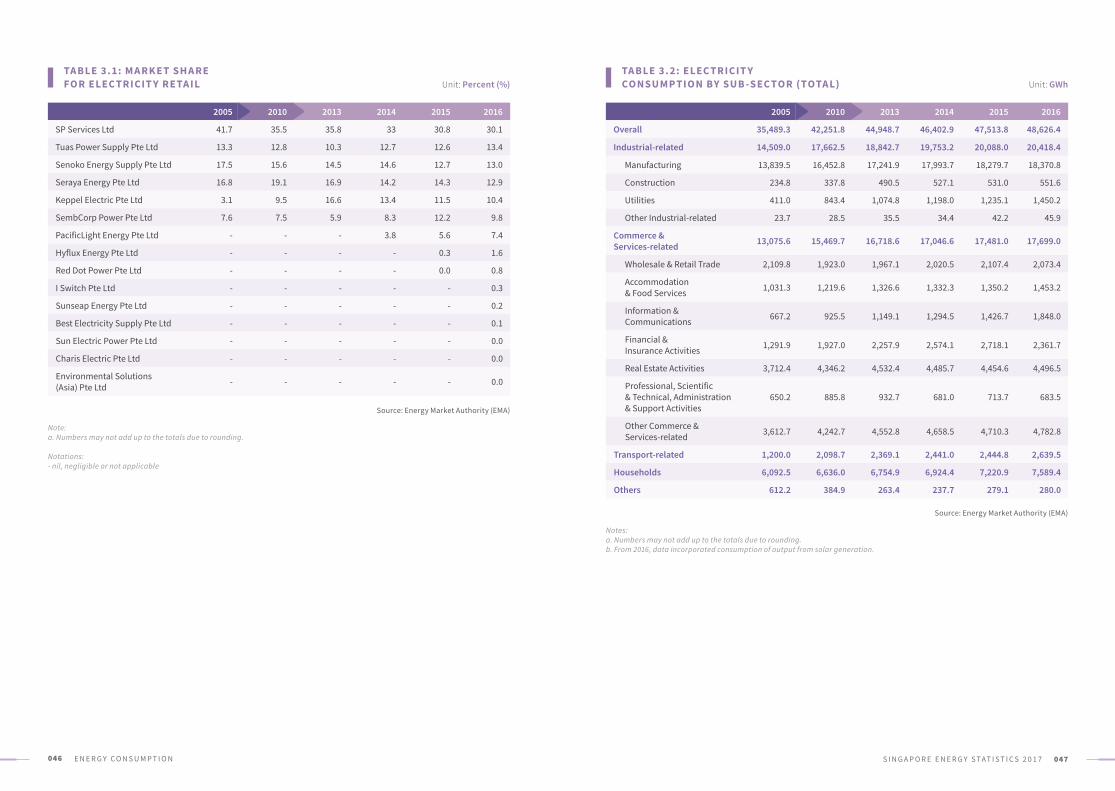
TA BLE 3.1: M A RK ET SH A RE FOR ELEC TRICIT Y RETA IL
TA BLE 3. 2: ELEC TRICIT Y CONSUMP TION BY SUB -SEC TOR (TOTA L)
2005 2010 2013 2014 2015 2016
SP Services Ltd 41.7 35.5 35.8 33 30.8 30.1
Tuas Power Supply Pte Ltd 13.3 12.8 10.3 12.7 12.6 13.4
Senoko Energy Supply Pte Ltd 17.5 15.6 14.5 14.6 12.7 13.0
Seraya Energy Pte Ltd 16.8 19.1 16.9 14.2 14.3 12.9
Keppel Electric Pte Ltd 3.1 9.5 16.6 13.4 11.5 10.4
SembCorp Power Pte Ltd 7.6 7.5 5.9 8.3 12.2 9.8
PacificLight Energy Pte Ltd - - - 3.8 5.6 7.4
Hyflux Energy Pte Ltd - - - - 0.3 1.6
Red Dot Power Pte Ltd - - - - 0.0 0.8
I Switch Pte Ltd - - - - - 0.3
Sunseap Energy Pte Ltd - - - - - 0.2
Best Electricity Supply Pte Ltd - - - - - 0.1
Sun Electric Power Pte Ltd - - - - - 0.0
Charis Electric Pte Ltd - - - - - 0.0
Environmental Solutions (Asia) Pte Ltd - - - - - 0.0
2005 2010 2013 2014 2015 2016
Overall 35,489.3 42,251.8 44,948.7 46,402.9 47,513.8 48,626.4
Industrial-related 14,509.0 17,662.5 18,842.7 19,753.2 20,088.0 20,418.4
Manufacturing 13,839.5 16,452.8 17,241.9 17,993.7 18,279.7 18,370.8
Construction 234.8 337.8 490.5 527.1 531.0 551.6
Utilities 411.0 843.4 1,074.8 1,198.0 1,235.1 1,450.2
Other Industrial-related 23.7 28.5 35.5 34.4 42.2 45.9
Commerce & Services-related 13,075.6 15,469.7 16,718.6 17,046.6 17,481.0 17,699.0
Wholesale & Retail Trade 2,109.8 1,923.0 1,967.1 2,020.5 2,107.4 2,073.4
Accommodation & Food Services 1,031.3 1,219.6 1,326.6 1,332.3 1,350.2 1,453.2
Information & Communications 667.2 925.5 1,149.1 1,294.5 1,426.7 1,848.0
Financial & Insurance Activities 1,291.9 1,927.0 2,257.9 2,574.1 2,718.1 2,361.7
Real Estate Activities 3,712.4 4,346.2 4,532.4 4,485.7 4,454.6 4,496.5
Professional, Scientific & Technical, Administration & Support Activities
650.2 885.8 932.7 681.0 713.7 683.5
Other Commerce & Services-related 3,612.7 4,242.7 4,552.8 4,658.5 4,710.3 4,782.8
Transport-related 1,200.0 2,098.7 2,369.1 2,441.0 2,444.8 2,639.5
Households 6,092.5 6,636.0 6,754.9 6,924.4 7,220.9 7,589.4
Others 612.2 384.9 263.4 237.7 279.1 280.0
Source: Energy Market Authority (EMA)
Source: Energy Market Authority (EMA)
Note:a. Numbers may not add up to the totals due to rounding.
Notations:- nil, negligible or not applicable
Notes:a. Numbers may not add up to the totals due to rounding.b. From 2016, data incorporated consumption of output from solar generation.
Unit: Percent (%) Unit: GWh
048 E N E R G Y C O N S U M P T I O N 049S I N G A P O R E E N E R G Y S TAT I S T I C S 2 0 1 7
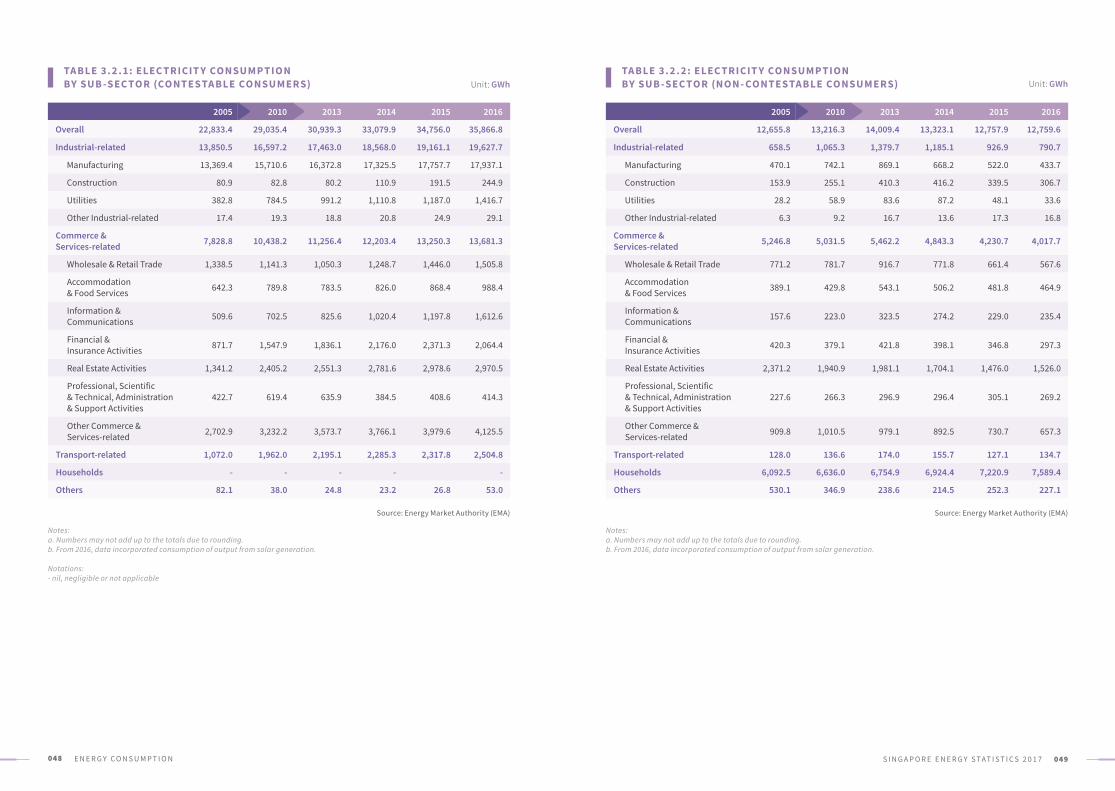
TA BLE 3. 2 .1: ELEC TRICIT Y CONSUMP TION BY SUB -SEC TOR (CONTESTA BLE CONSUMERS)
TA BLE 3. 2 . 2: ELEC TRICIT Y CONSUMP TION BY SUB -SEC TOR (NON - CONTESTA BLE CONSUMERS)
2005 2010 2013 2014 2015 2016
Overall 22,833.4 29,035.4 30,939.3 33,079.9 34,756.0 35,866.8
Industrial-related 13,850.5 16,597.2 17,463.0 18,568.0 19,161.1 19,627.7
Manufacturing 13,369.4 15,710.6 16,372.8 17,325.5 17,757.7 17,937.1
Construction 80.9 82.8 80.2 110.9 191.5 244.9
Utilities 382.8 784.5 991.2 1,110.8 1,187.0 1,416.7
Other Industrial-related 17.4 19.3 18.8 20.8 24.9 29.1
Commerce & Services-related 7,828.8 10,438.2 11,256.4 12,203.4 13,250.3 13,681.3
Wholesale & Retail Trade 1,338.5 1,141.3 1,050.3 1,248.7 1,446.0 1,505.8
Accommodation & Food Services 642.3 789.8 783.5 826.0 868.4 988.4
Information & Communications 509.6 702.5 825.6 1,020.4 1,197.8 1,612.6
Financial & Insurance Activities 871.7 1,547.9 1,836.1 2,176.0 2,371.3 2,064.4
Real Estate Activities 1,341.2 2,405.2 2,551.3 2,781.6 2,978.6 2,970.5
Professional, Scientific & Technical, Administration & Support Activities
422.7 619.4 635.9 384.5 408.6 414.3
Other Commerce & Services-related 2,702.9 3,232.2 3,573.7 3,766.1 3,979.6 4,125.5
Transport-related 1,072.0 1,962.0 2,195.1 2,285.3 2,317.8 2,504.8
Households - - - - -
Others 82.1 38.0 24.8 23.2 26.8 53.0
2005 2010 2013 2014 2015 2016
Overall 12,655.8 13,216.3 14,009.4 13,323.1 12,757.9 12,759.6
Industrial-related 658.5 1,065.3 1,379.7 1,185.1 926.9 790.7
Manufacturing 470.1 742.1 869.1 668.2 522.0 433.7
Construction 153.9 255.1 410.3 416.2 339.5 306.7
Utilities 28.2 58.9 83.6 87.2 48.1 33.6
Other Industrial-related 6.3 9.2 16.7 13.6 17.3 16.8
Commerce & Services-related 5,246.8 5,031.5 5,462.2 4,843.3 4,230.7 4,017.7
Wholesale & Retail Trade 771.2 781.7 916.7 771.8 661.4 567.6
Accommodation & Food Services 389.1 429.8 543.1 506.2 481.8 464.9
Information & Communications 157.6 223.0 323.5 274.2 229.0 235.4
Financial & Insurance Activities 420.3 379.1 421.8 398.1 346.8 297.3
Real Estate Activities 2,371.2 1,940.9 1,981.1 1,704.1 1,476.0 1,526.0
Professional, Scientific & Technical, Administration & Support Activities
227.6 266.3 296.9 296.4 305.1 269.2
Other Commerce & Services-related 909.8 1,010.5 979.1 892.5 730.7 657.3
Transport-related 128.0 136.6 174.0 155.7 127.1 134.7
Households 6,092.5 6,636.0 6,754.9 6,924.4 7,220.9 7,589.4
Others 530.1 346.9 238.6 214.5 252.3 227.1
Source: Energy Market Authority (EMA) Source: Energy Market Authority (EMA)
Notes:a. Numbers may not add up to the totals due to rounding.b. From 2016, data incorporated consumption of output from solar generation.
Notations:- nil, negligible or not applicable
Notes:a. Numbers may not add up to the totals due to rounding.b. From 2016, data incorporated consumption of output from solar generation.
Unit: GWh Unit: GWh
050 E N E R G Y C O N S U M P T I O N 051S I N G A P O R E E N E R G Y S TAT I S T I C S 2 0 1 7
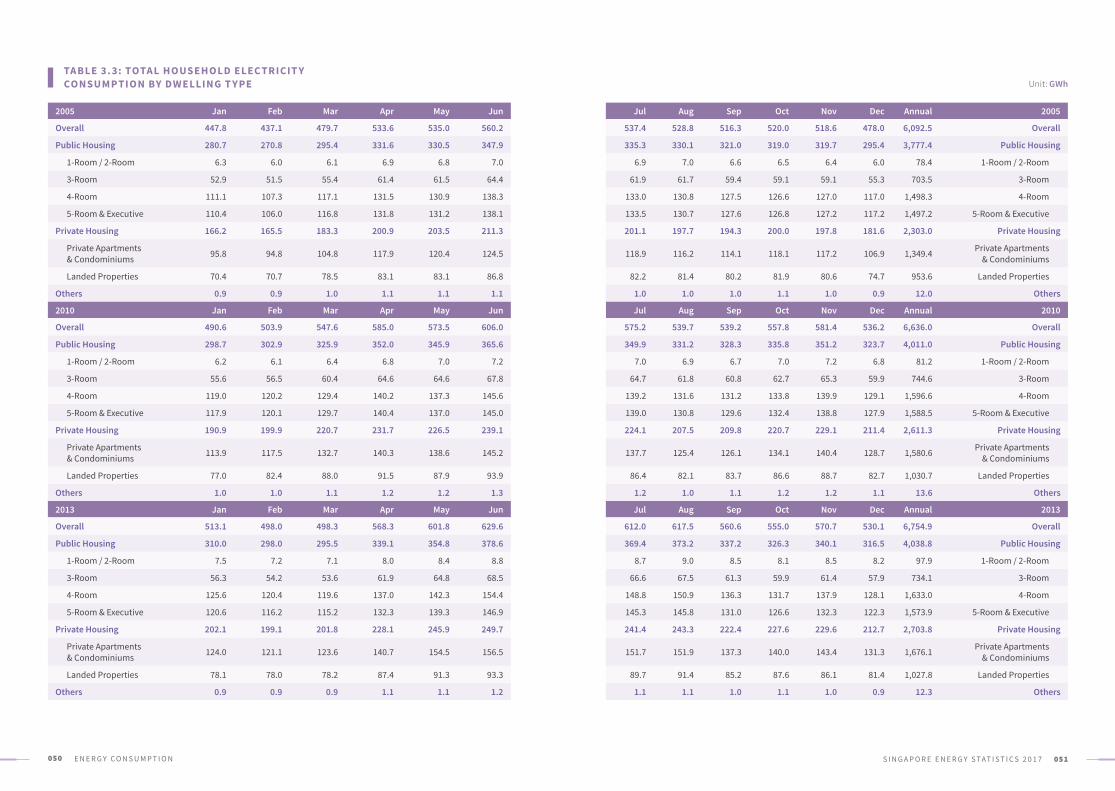
2005 Jan Feb Mar Apr May Jun
Overall 447.8 437.1 479.7 533.6 535.0 560.2
Public Housing 280.7 270.8 295.4 331.6 330.5 347.9
1-Room / 2-Room 6.3 6.0 6.1 6.9 6.8 7.0
3-Room 52.9 51.5 55.4 61.4 61.5 64.4
4-Room 111.1 107.3 117.1 131.5 130.9 138.3
5-Room & Executive 110.4 106.0 116.8 131.8 131.2 138.1
Private Housing 166.2 165.5 183.3 200.9 203.5 211.3
Private Apartments & Condominiums 95.8 94.8 104.8 117.9 120.4 124.5
Landed Properties 70.4 70.7 78.5 83.1 83.1 86.8
Others 0.9 0.9 1.0 1.1 1.1 1.1
2010 Jan Feb Mar Apr May Jun
Overall 490.6 503.9 547.6 585.0 573.5 606.0
Public Housing 298.7 302.9 325.9 352.0 345.9 365.6
1-Room / 2-Room 6.2 6.1 6.4 6.8 7.0 7.2
3-Room 55.6 56.5 60.4 64.6 64.6 67.8
4-Room 119.0 120.2 129.4 140.2 137.3 145.6
5-Room & Executive 117.9 120.1 129.7 140.4 137.0 145.0
Private Housing 190.9 199.9 220.7 231.7 226.5 239.1
Private Apartments & Condominiums 113.9 117.5 132.7 140.3 138.6 145.2
Landed Properties 77.0 82.4 88.0 91.5 87.9 93.9
Others 1.0 1.0 1.1 1.2 1.2 1.3
2013 Jan Feb Mar Apr May Jun
Overall 513.1 498.0 498.3 568.3 601.8 629.6
Public Housing 310.0 298.0 295.5 339.1 354.8 378.6
1-Room / 2-Room 7.5 7.2 7.1 8.0 8.4 8.8
3-Room 56.3 54.2 53.6 61.9 64.8 68.5
4-Room 125.6 120.4 119.6 137.0 142.3 154.4
5-Room & Executive 120.6 116.2 115.2 132.3 139.3 146.9
Private Housing 202.1 199.1 201.8 228.1 245.9 249.7
Private Apartments & Condominiums 124.0 121.1 123.6 140.7 154.5 156.5
Landed Properties 78.1 78.0 78.2 87.4 91.3 93.3
Others 0.9 0.9 0.9 1.1 1.1 1.2
Jul Aug Sep Oct Nov Dec Annual 2005
537.4 528.8 516.3 520.0 518.6 478.0 6,092.5 Overall
335.3 330.1 321.0 319.0 319.7 295.4 3,777.4 Public Housing
6.9 7.0 6.6 6.5 6.4 6.0 78.4 1-Room / 2-Room
61.9 61.7 59.4 59.1 59.1 55.3 703.5 3-Room
133.0 130.8 127.5 126.6 127.0 117.0 1,498.3 4-Room
133.5 130.7 127.6 126.8 127.2 117.2 1,497.2 5-Room & Executive
201.1 197.7 194.3 200.0 197.8 181.6 2,303.0 Private Housing
118.9 116.2 114.1 118.1 117.2 106.9 1,349.4 Private Apartments & Condominiums
82.2 81.4 80.2 81.9 80.6 74.7 953.6 Landed Properties
1.0 1.0 1.0 1.1 1.0 0.9 12.0 Others
Jul Aug Sep Oct Nov Dec Annual 2010
575.2 539.7 539.2 557.8 581.4 536.2 6,636.0 Overall
349.9 331.2 328.3 335.8 351.2 323.7 4,011.0 Public Housing
7.0 6.9 6.7 7.0 7.2 6.8 81.2 1-Room / 2-Room
64.7 61.8 60.8 62.7 65.3 59.9 744.6 3-Room
139.2 131.6 131.2 133.8 139.9 129.1 1,596.6 4-Room
139.0 130.8 129.6 132.4 138.8 127.9 1,588.5 5-Room & Executive
224.1 207.5 209.8 220.7 229.1 211.4 2,611.3 Private Housing
137.7 125.4 126.1 134.1 140.4 128.7 1,580.6 Private Apartments & Condominiums
86.4 82.1 83.7 86.6 88.7 82.7 1,030.7 Landed Properties
1.2 1.0 1.1 1.2 1.2 1.1 13.6 Others
Jul Aug Sep Oct Nov Dec Annual 2013
612.0 617.5 560.6 555.0 570.7 530.1 6,754.9 Overall
369.4 373.2 337.2 326.3 340.1 316.5 4,038.8 Public Housing
8.7 9.0 8.5 8.1 8.5 8.2 97.9 1-Room / 2-Room
66.6 67.5 61.3 59.9 61.4 57.9 734.1 3-Room
148.8 150.9 136.3 131.7 137.9 128.1 1,633.0 4-Room
145.3 145.8 131.0 126.6 132.3 122.3 1,573.9 5-Room & Executive
241.4 243.3 222.4 227.6 229.6 212.7 2,703.8 Private Housing
151.7 151.9 137.3 140.0 143.4 131.3 1,676.1 Private Apartments & Condominiums
89.7 91.4 85.2 87.6 86.1 81.4 1,027.8 Landed Properties
1.1 1.1 1.0 1.1 1.0 0.9 12.3 Others
TA BLE 3. 3: TOTA L HOUSEHOLD ELEC TRICIT Y CONSUMP TION BY DWELLING T Y PE Unit: GWh
052 E N E R G Y C O N S U M P T I O N 053S I N G A P O R E E N E R G Y S TAT I S T I C S 2 0 1 7
2014 Jan Feb Mar Apr May Jun
Overall 509.7 489.3 488.7 568.1 609.5 639.0
Public Housing 307.1 293.9 288.3 335.5 359.6 383.6
1-Room / 2-Room 8.0 7.7 7.4 8.5 9.2 9.7
3-Room 55.8 53.3 52.4 61.2 66.1 69.0
4-Room 124.7 119.1 116.8 136.0 146.2 156.0
5-Room & Executive 118.5 113.7 111.7 129.7 138.1 149.0
Private Housing 201.7 194.6 199.5 231.6 248.9 254.3
Private Apartments & Condominiums 124.3 117.9 122.0 143.1 157.9 160.0
Landed Properties 77.4 76.7 77.5 88.5 91.0 94.3
Others 0.9 0.8 0.9 1.1 1.0 1.1
2015 Jan Feb Mar Apr May Jun
Overall 525.2 493.6 513.9 594.2 610.7 632.3
Public Housing 314.6 294.9 303.0 349.8 359.2 374.7
1-Room / 2-Room 8.9 8.5 8.5 9.7 10.2 10.4
3-Room 56.4 53.1 54.8 63.4 65.2 67.5
4-Room 128.5 120.1 123.6 142.5 146.5 153.1
5-Room & Executive 120.7 113.3 116.2 134.3 137.2 143.8
Private Housing 209.7 197.8 210.1 243.4 250.6 256.6
Private Apartments & Condominiums 130.7 122.0 131.1 152.7 161.4 163.8
Landed Properties 79.0 75.8 79.0 90.7 89.2 92.8
Others 0.9 0.8 0.8 1.0 0.9 1.0
2016 Jan Feb Mar Apr May Jun
Overall 570.2 580.4 585.3 648.6 689.1 708.5
Public Housing 336.7 344.5 344.1 379.1 402.7 416.8
1-Room / 2-Room 10.2 10.0 9.7 10.8 11.6 11.9
3-Room 61.2 62.2 60.9 68.0 72.6 74.4
4-Room 137.9 141.2 141.2 155.3 164.9 171.1
5-Room & Executive 127.4 131.1 132.2 145.0 153.6 159.3
Private Housing 232.7 235.1 240.4 268.5 285.4 290.7
Private Apartments & Condominiums 148.4 148.7 152.9 172.5 186.6 190.0
Landed Properties 84.3 86.4 87.5 96.1 98.8 100.7
Others 0.9 0.8 0.8 1.0 1.0 1.0
Jul Aug Sep Oct Nov Dec Annual 2014
628.1 635.5 592.4 580.9 611.5 571.8 6,924.4 Overall
376.7 382.4 355.3 341.4 362.1 339.7 4,125.7 Public Housing
9.7 10.0 9.5 9.3 9.9 9.4 108.3 1-Room / 2-Room
68.3 68.9 63.9 62.4 65.6 61.3 748.2 3-Room
153.0 155.4 144.4 138.8 147.1 138.3 1,675.8 4-Room
145.7 148.1 137.5 131.0 139.5 130.7 1,593.3 5-Room & Executive
250.4 252.1 236.1 238.4 248.4 231.2 2,787.1 Private Housing
158.9 158.7 147.7 148.7 158.0 145.5 1,742.6 Private Apartments & Condominiums
91.5 93.4 88.3 89.7 90.4 85.7 1,044.5 Landed Properties
1.0 1.0 1.0 1.0 1.0 0.9 11.6 Others
Jul Aug Sep Oct Nov Dec Annual 2015
647.0 656.7 635.7 643.6 645.7 622.4 7,220.9 Overall
384.5 394.6 380.3 379.3 379.0 370.3 4,284.2 Public Housing
10.7 11.0 10.8 10.7 10.7 10.7 120.7 1-Room / 2-Room
69.4 70.7 67.9 67.7 68.0 66.0 770.1 3-Room
157.4 161.1 155.0 154.9 154.2 151.9 1,748.8 4-Room
147.1 151.7 146.6 145.9 146.1 141.7 1,644.6 5-Room & Executive
261.5 261.3 254.5 263.4 265.7 251.2 2,925.8 Private Housing
167.3 167.1 162.9 167.7 172.7 160.5 1,859.9 Private Apartments & Condominiums
94.2 94.2 91.6 95.7 93.0 90.7 1,065.8 Landed Properties
1.0 0.9 0.9 0.9 0.9 0.9 11.0 Others
Jul Aug Sep Oct Nov Dec Annual 2016
642.2 647.0 647.7 650.5 644.8 575.1 7,589.4 Overall
382.9 385.2 385.2 382.0 382.3 338.8 4,480.2 Public Housing
11.2 11.3 11.2 11.2 11.3 10.4 131.1 1-Room / 2-Room
68.2 69.2 68.7 68.2 67.7 60.6 801.8 3-Room
157.6 158.2 158.4 157.0 157.2 139.4 1,839.4 4-Room
145.9 146.5 146.9 145.6 146.1 128.4 1,708.0 5-Room & Executive
258.4 261.0 261.7 267.6 261.6 235.6 3,098.7 Private Housing
167.9 167.5 169.6 173.9 170.8 152.0 2,000.7 Private Apartments & Condominiums
90.5 93.5 92.1 93.7 90.9 83.6 1,098.0 Landed Properties
0.9 0.8 0.8 0.9 0.9 0.7 10.5 Others
TA BLE 3. 3: TOTA L HOUSEHOLD ELEC TRICIT Y CONSUMP TION BY DWELLING T Y PE (CONTINUED)
Source: Energy Market Authority (EMA)
Unit: GWh
Notes:a. Numbers may not add up to the totals due to rounding.b. Solar PV statistics have been included in this table from 2016.
054 E N E R G Y C O N S U M P T I O N 055S I N G A P O R E E N E R G Y S TAT I S T I C S 2 0 1 7
2005 Jan Feb Mar Apr May Jun
Overall 418.1 408.3 446.9 496.2 496.8 519.7
Public Housing 330.9 319.1 347.6 389.7 388.0 408.2
1-Room / 2-Room 135.2 129.0 131.5 148.0 147.0 151.1
3-Room 241.7 235.2 253.1 280.3 281.0 294.7
4-Room 345.6 333.6 363.4 407.4 404.9 427.4
5-Room & Executive 422.0 405.1 445.4 501.9 498.9 524.4
Private Housing 751.4 749.8 825.2 900.8 909.9 941.9
Private Apartments & Condominiums 624.8 619.2 679.3 759.2 772.9 796.0
Landed Properties 1,037.7 1,044.8 1,157.1 1,224.8 1,224.2 1,277.9
Others 594.2 572.7 637.1 723.3 693.5 711.8
2010 Jan Feb Mar Apr May Jun
Overall 433.4 446.1 482.1 513.5 505.4 531.5
Public Housing 343.2 348.4 373.2 402.6 396.8 418.5
1-Room / 2-Room 143.2 142.7 146.6 156.0 159.5 163.3
3-Room 255.8 260.1 277.1 296.0 296.8 311.2
4-Room 354.8 358.4 384.3 415.2 408.1 431.5
5-Room & Executive 429.8 438.5 471.8 510.9 500.1 528.4
Private Housing 734.7 773.4 845.7 880.6 866.5 903.2
Private Apartments & Condominiums 598.9 622.4 693.8 728.3 721.5 747.2
Landed Properties 1,105.4 1,182.4 1,262.0 1,296.4 1,268.6 1,333.7
Others 607.0 617.5 621.8 719.0 671.9 743.9
2013 Jan Feb Mar Apr May Jun
Overall 430.2 418.9 417.4 473.9 508.1 525.1
Public Housing 343.7 331.4 327.4 374.8 398.0 418.7
1-Room / 2-Room 149.6 143.2 139.0 154.8 164.4 171.8
3-Room 258.7 249.5 245.7 282.9 299.8 313.2
4-Room 354.7 341.2 338.0 386.3 410.1 434.8
5-Room & Executive 430.9 416.7 411.9 472.3 502.4 526.0
Private Housing 699.2 691.3 697.8 779.7 844.8 852.7
Private Apartments & Condominiums 567.2 557.0 563.8 636.7 700.1 705.5
Landed Properties 1,108.9 1,105.6 1,117.6 1,221.6 1,299.2 1,312.1
Others 550.6 544.2 546.3 651.5 647.1 702.4
Jul Aug Sep Oct Nov Dec Annual 2005
497.7 489.3 477.7 480.8 479.7 441.6 471.1 Overall
393.3 387.2 376.7 374.4 375.5 347.0 369.9 Public Housing
147.8 148.8 141.2 139.7 140.4 132.7 141.1 1-Room / 2-Room
283.8 283.3 272.9 272.1 272.0 254.4 268.7 3-Room
410.7 403.8 393.6 390.9 392.2 361.3 386.3 4-Room
506.2 495.0 482.8 479.1 480.5 441.8 473.7 5-Room & Executive
890.6 872.3 856.0 877.9 866.8 791.2 853.0 Private Housing
754.1 733.1 717.7 739.5 732.1 662.8 716.2 Private Apartments & Condominiums
1,206.7 1,196.3 1,178.9 1,202.2 1,183.5 1,094.4 1,169.1 Landed Properties
622.7 604.5 605.1 644.3 640.7 569.7 634.2 Others
Jul Aug Sep Oct Nov Dec Annual 2010
502.4 471.9 472.0 486.9 509.6 466.3 485.1 Overall
399.3 378.3 375.3 383.0 401.4 368.2 382.4 Public Housing
158.1 154.9 150.4 156.8 160.8 149.6 153.5 1-Room / 2-Room
295.6 282.7 277.9 286.2 298.9 272.8 284.3 3-Room
411.8 389.7 388.7 395.2 414.2 380.2 394.4 4-Room
505.4 476.5 473.2 482.0 506.6 465.4 482.4 5-Room & Executive
839.5 778.7 789.4 826.6 866.6 785.9 824.3 Private Housing
699.5 639.6 642.4 681.7 717.6 648.4 678.6 Private Apartments & Condominiums
1,232.1 1,166.3 1,204.8 1,232.4 1,291.3 1,173.1 1,229.0 Landed Properties
689.9 582.4 642.1 699.4 667.6 629.1 657.8 Others
Jul Aug Sep Oct Nov Dec Annual 2013
508.6 513.0 465.9 459.0 471.1 436.8 469.0 Overall
407.1 411.3 371.1 358.3 372.6 346.7 371.7 Public Housing
167.0 173.3 161.6 154.9 161.1 154.9 158.0 1-Room / 2-Room
303.8 307.7 279.4 272.3 278.7 263.1 279.6 3-Room
417.8 423.6 382.2 368.0 384.2 356.8 383.1 4-Room
518.9 521.0 467.9 451.3 471.1 435.7 468.8 5-Room & Executive
821.0 825.1 759.2 767.5 772.5 710.5 768.6 Private Housing
679.1 678.8 615.8 620.8 632.5 576.0 627.9 Private Apartments & Condominiums
1,269.6 1,285.2 1,215.6 1,233.0 1,223.5 1,139.7 1,211.1 Landed Properties
666.0 634.1 612.8 647.0 635.9 598.8 619.8 Others
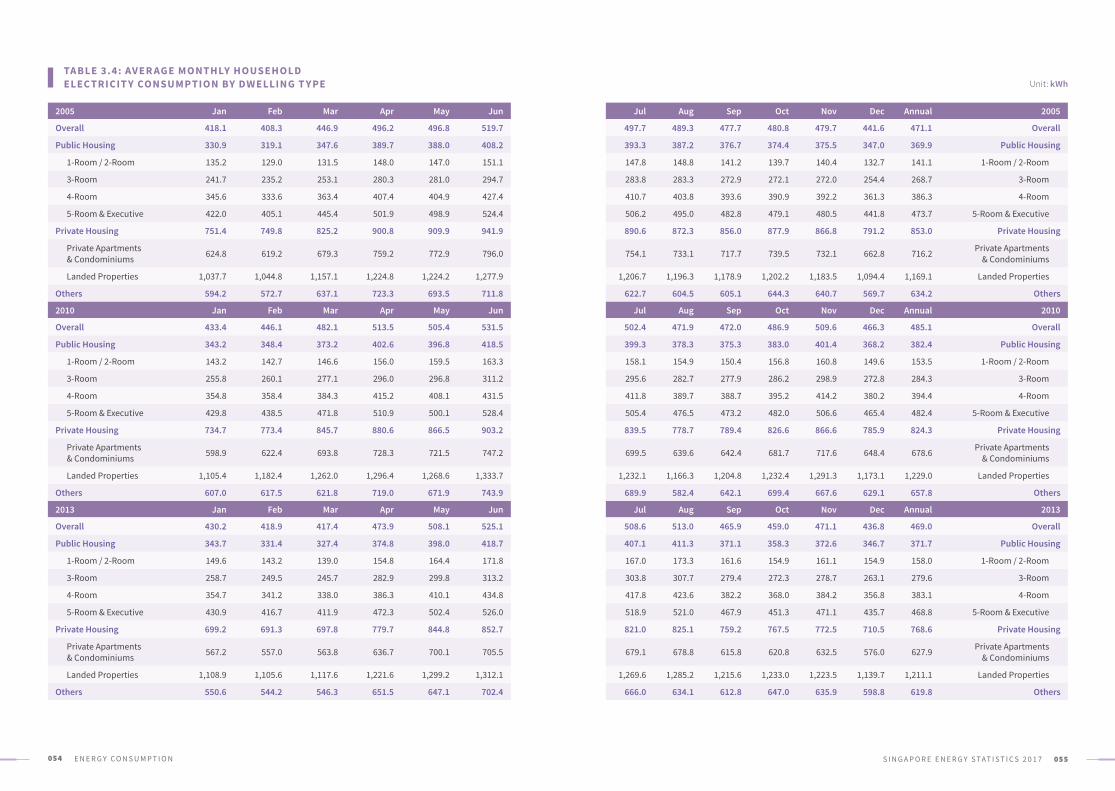
TA BLE 3.4: AV ER AGE MONTHLY HOUSEHOLD ELEC TRICIT Y CONSUMP TION BY DWELLING T Y PE Unit: kWh
056 E N E R G Y C O N S U M P T I O N 057S I N G A P O R E E N E R G Y S TAT I S T I C S 2 0 1 7
2014 Jan Feb Mar Apr May Jun
Overall 420.2 402.5 400.0 462.4 494.6 516.2
Public Housing 336.4 321.5 313.9 364.1 389.5 414.6
1-Room / 2-Room 151.4 144.7 137.2 154.8 167.4 173.3
3-Room 253.6 242.2 237.1 276.5 298.4 311.5
4-Room 347.5 331.0 323.0 374.9 401.8 427.8
5-Room & Executive 422.3 405.2 396.4 459.4 488.4 525.7
Private Housing 675.5 648.0 661.3 757.1 808.7 816.9
Private Apartments & Condominiums 544.0 513.7 525.9 610.8 666.1 669.0
Landed Properties 1,104.0 1,082.9 1,111.9 1,234.6 1,285.8 1,307.5
Others 581.9 587.3 605.4 746.8 734.9 777.1
2015 Jan Feb Mar Apr May Jun
Overall 414.7 390.6 403.3 463.7 476.3 491.0
Public Housing 334.0 313.7 319.8 368.3 378.0 393.6
1-Room / 2-Room 153.1 144.8 143.3 163.6 171.0 173.3
3-Room 251.0 236.9 242.9 280.4 289.1 299.5
4-Room 345.4 322.9 329.6 378.9 389.3 405.4
5-Room & Executive 421.3 396.2 403.5 465.6 475.6 497.1
Private Housing 648.9 614.6 645.7 736.3 757.8 767.6
Private Apartments & Condominiums 519.0 486.5 513.9 590.7 622.4 625.4
Landed Properties 1,107.8 1,066.3 1,123.6 1,259.0 1,249.5 1,281.6
Others 657.7 594.2 605.9 754.1 703.3 726.9
2016 Jan Feb Mar Apr May Jun
Overall 436.2 443.4 445.0 490.7 520.9 531.9
Public Housing 349.8 357.8 355.8 391.1 415.0 428.4
1-Room / 2-Room 167.0 163.7 158.2 175.8 187.5 192.3
3-Room 268.9 273.5 266.6 297.3 317.3 324.8
4-Room 360.2 368.7 367.2 402.4 426.5 441.3
5-Room & Executive 437.6 449.8 452.0 494.6 523.8 542.0
Private Housing 677.3 681.4 692.9 764.6 812.4 812.6
Private Apartments & Condominiums 545.0 544.5 554.2 618.8 667.0 666.6
Landed Properties 1,182.6 1,200.5 1,231.9 1,325.4 1,381.6 1,385.7
Others 674.9 662.2 682.3 798.9 795.1 809.4
Jul Aug Sep Oct Nov Dec Annual 2014
506.6 510.0 474.7 463.5 486.8 453.0 466.1 Overall
406.7 411.4 381.6 365.5 386.7 361.6 371.3 Public Housing
171.9 176.6 166.5 160.9 171.7 161.2 161.7 1-Room / 2-Room
308.5 310.0 286.9 279.8 292.9 273.1 280.9 3-Room
419.1 423.8 393.3 376.4 398.2 372.9 382.6 4-Room
514.1 521.8 483.9 459.8 489.1 457.1 468.7 5-Room & Executive
802.0 800.1 748.8 749.9 780.1 718.9 748.0 Private Housing
658.6 653.5 605.3 604.2 638.6 583.0 606.9 Private Apartments & Condominiums
1,289.2 1,293.3 1,240.6 1,249.1 1,272.8 1,189.5 1,222.3 Landed Properties
723.4 697.7 716.9 754.7 783.0 668.3 696.5 Others
Jul Aug Sep Oct Nov Dec Annual 2015
500.4 507.9 491.8 494.2 506.8 476.6 468.4 Overall
402.9 413.1 397.8 394.9 405.2 384.9 375.6 Public Housing
177.2 183.3 178.4 175.4 179.8 174.5 168.3 1-Room / 2-Room
307.0 312.6 300.2 297.9 306.0 290.3 284.5 3-Room
415.7 425.2 408.5 406.2 416.4 397.3 386.9 4-Room
507.6 523.4 505.9 501.7 515.7 486.7 475.1 5-Room & Executive
775.8 776.1 759.0 773.5 787.6 733.3 732.3 Private Housing
630.1 632.2 616.1 625.7 645.0 593.2 592.7 Private Apartments & Condominiums
1,316.9 1,301.7 1,292.4 1,319.9 1,336.2 1,260.2 1,243.2 Landed Properties
739.6 704.6 713.4 738.3 735.3 698.6 697.1 Others
Jul Aug Sep Oct Nov Dec Annual 2016
481.0 484.0 484.4 484.1 479.2 425.9 475.6 Overall
393.3 395.4 394.7 390.3 390.2 345.1 383.9 Public Housing
181.0 182.1 179.5 178.6 178.5 163.4 175.7 1-Room / 2-Room
297.7 302.0 299.5 296.6 294.5 263.5 291.9 3-Room
405.9 407.0 406.9 401.9 401.9 355.4 395.5 4-Room
496.0 497.8 498.6 493.1 494.4 433.8 484.5 5-Room & Executive
716.9 722.1 726.4 735.6 717.6 640.9 725.0 Private Housing
582.3 580.5 587.1 597.6 582.9 514.9 586.8 Private Apartments & Condominiums
1,254.6 1,282.8 1,289.3 1,286.9 1,268.4 1,154.6 1,270.5 Landed Properties
737.7 732.0 746.9 786.5 778.0 665.7 739.0 Others
Source: Energy Market Authority (EMA)
TA BLE 3.4: AV ER AGE MONTHLY HOUSEHOLD ELEC TRICIT Y CONSUMP TION BY DWELLING T Y PE (CONTINUED) Unit: kWh
Notes:a. Numbers may not add up to the totals due to rounding.b. Solar PV statistics have been included in this table from 2016.
058 E N E R G Y C O N S U M P T I O N 059S I N G A P O R E E N E R G Y S TAT I S T I C S 2 0 1 7
Overall Public Housing2005 2010 2013 2014 2015 2016
Overall 370.1 382.4 371.7 371.3 375.6 383.9
Central Region 319.4 333.0 328.4 331.2 334.8 342.7
Bishan 417.4 423.7 403.9 405.7 410.9 416.6
Bukit Merah 302.4 324.0 319.3 321.6 323.4 334.0
Bukit Timah 409.1 405.9 395.2 395.9 399.6 399.2
Geylang 332.4 345.0 341.8 344.6 348.5 356.3
Kallang 301.8 316.6 316.2 317.5 324.4 329.4
Marine Parade 309.5 323.3 324.4 318.7 321.0 331.1
Novena 339.1 356.9 350.4 351.8 359.4 363.3
Outram 228.7 230.6 270.7 273.9 280.4 289.9
Queenstown 289.8 303.7 298.4 304.2 303.8 312.6
Rochor 312.7 333.3 329.6 331.7 339.8 352.5
Tanglin 448.8 448.4 415.9 416.8 413.1 411.6
Toa Payoh 319.5 336.0 326.3 331.1 336.1 343.8
East Region 410.6 415.6 404.3 403.5 406.8 415.6
Bedok 348.7 358.6 349.6 351.7 357.6 363.5
Pasir Ris 490.3 493.1 481.0 478.0 475.1 490.9
Tampines 434.2 435.9 422.0 419.0 421.2 429.7
North East Region 375.0 391.8 372.4 371.7 372.5 382.3
Ang Mo Kio 310.1 323.3 318.1 321.6 324.3 331.2
Hougang 405.9 417.1 397.2 394.8 397.4 405.6
Punggol 389.6 420.9 363.8 368.8 358.8 371.5
Sengkang 398.2 417.6 395.0 386.5 386.6 399.5
Serangoon 401.7 410.1 397.1 398.2 406.6 410.6
North Region 386.5 403.8 397.7 388.2 400.5 408.6
Sembawang 386.2 411.7 408.9 397.4 411.8 424.7
Woodlands 397.3 413.4 402.5 402.6 412.7 425.5
Yishun 373.3 388.8 387.2 368.0 382.5 384.1
West Region 378.9 389.7 377.9 378.8 382.7 389.4
Bukit Batok 361.1 372.1 362.2 364.1 373.3 376.1
Bukit Panjang 379.4 395.8 380.9 377.1 371.4 383.6
Choa Chu Kang 412.9 419.9 406.5 407.7 407.6 400.6
Clementi 318.1 328.8 318.2 320.3 322.5 329.8
Jurong East 377.1 377.1 361.5 363.6 368.9 378.6
Jurong West 390.1 403.5 393.9 394.8 403.4 415.9
1-room / 2-room2005 2010 2013 2014 2015 2016
Overall 141.5 153.5 158.0 161.7 168.3 175.7
Central Region 140.5 152.6 156.1 159.9 164.5 171.0
Bishan 108.2 112.4 135.6 139.4 144.1 149.8
Bukit Merah 138.3 150.6 154.3 158.8 163.0 171.8
Bukit Timah - - - - - -
Geylang 154.4 164.8 168.1 173.5 178.9 178.7
Kallang 120.8 137.9 141.0 143.8 149.9 156.1
Marine Parade 170.1 188.5 192.8 195.5 199.4 208.2
Novena 149.9 171.5 187.7 190.3 200.7 198.1
Outram 123.3 135.5 139.8 144.0 148.9 156.7
Queenstown 153.5 164.0 164.1 168.6 172.4 179.3
Rochor 161.1 177.6 186.6 183.3 188.9 205.1
Tanglin - - - - - -
Toa Payoh 147.9 157.3 158.8 161.6 165.0 172.1
East Region 141.3 156.0 159.9 162.2 168.4 175.3
Bedok 139.7 156.9 156.3 159.6 161.7 166.1
Pasir Ris 224.5 276.3 147.2 148.1 184.7 200.4
Tampines 151.4 145.8 171.2 171.2 176.8 186.6
North East Region 150.2 158.9 161.9 169.3 175.7 184.0
Ang Mo Kio 150.0 162.1 164.6 168.7 170.9 176.2
Hougang 147.1 151.9 155.5 174.1 182.3 188.6
Punggol - 96.5 155.5 167.3 181.2 191.3
Sengkang - 149.7 165.9 168.9 175.9 189.2
Serangoon 162.2 166.3 157.9 167.9 177.3 177.9
North Region 131.0 137.6 157.6 152.2 167.2 177.4
Sembawang - 134.1 163.8 152.5 163.4 185.4
Woodlands 125.2 135.6 147.7 145.7 160.3 171.7
Yishun 165.1 146.9 174.7 163.3 180.7 182.7
West Region 142.5 162.7 162.7 165.5 175.1 182.3
Bukit Batok 140.8 140.8 148.0 143.2 158.4 166.9
Bukit Panjang - - 158.4 159.2 159.8 177.5
Choa Chu Kang 145.4 138.9 160.4 170.1 175.1 175.6
Clementi 132.2 140.6 135.3 144.4 158.4 165.8
Jurong East 141.4 142.9 150.6 157.8 172.8 178.5
Jurong West 159.3 189.5 188.7 183.2 192.9 200.3
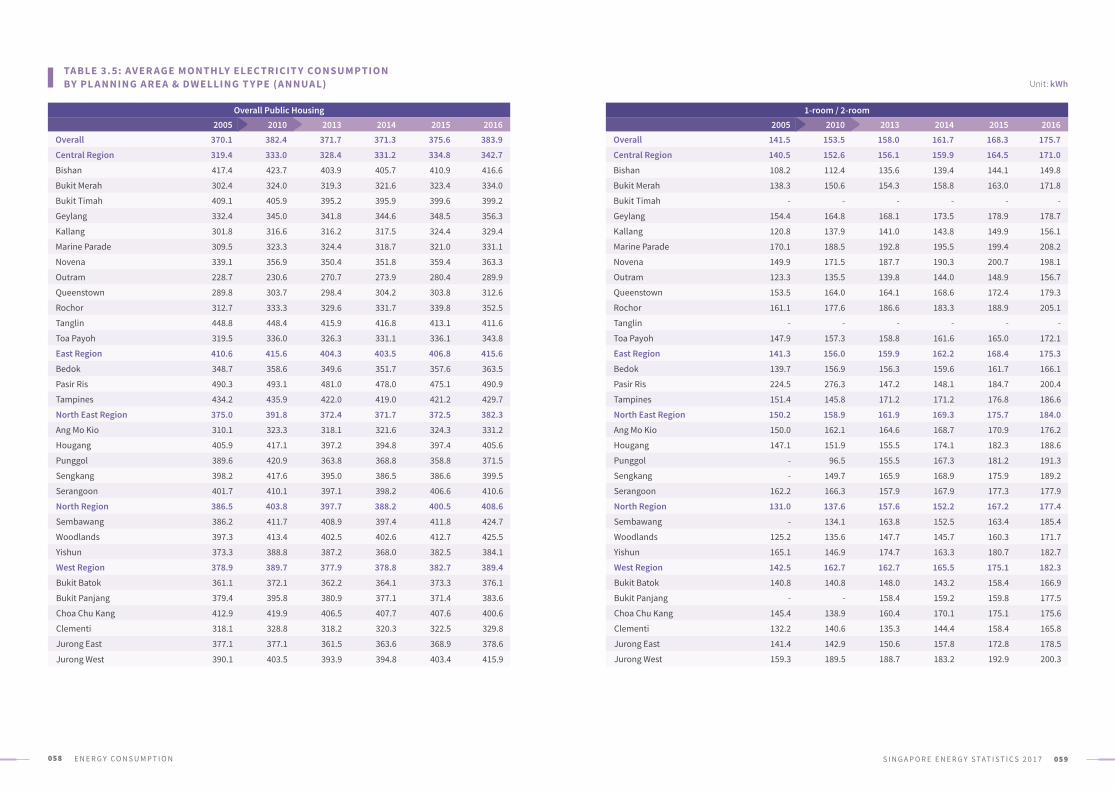
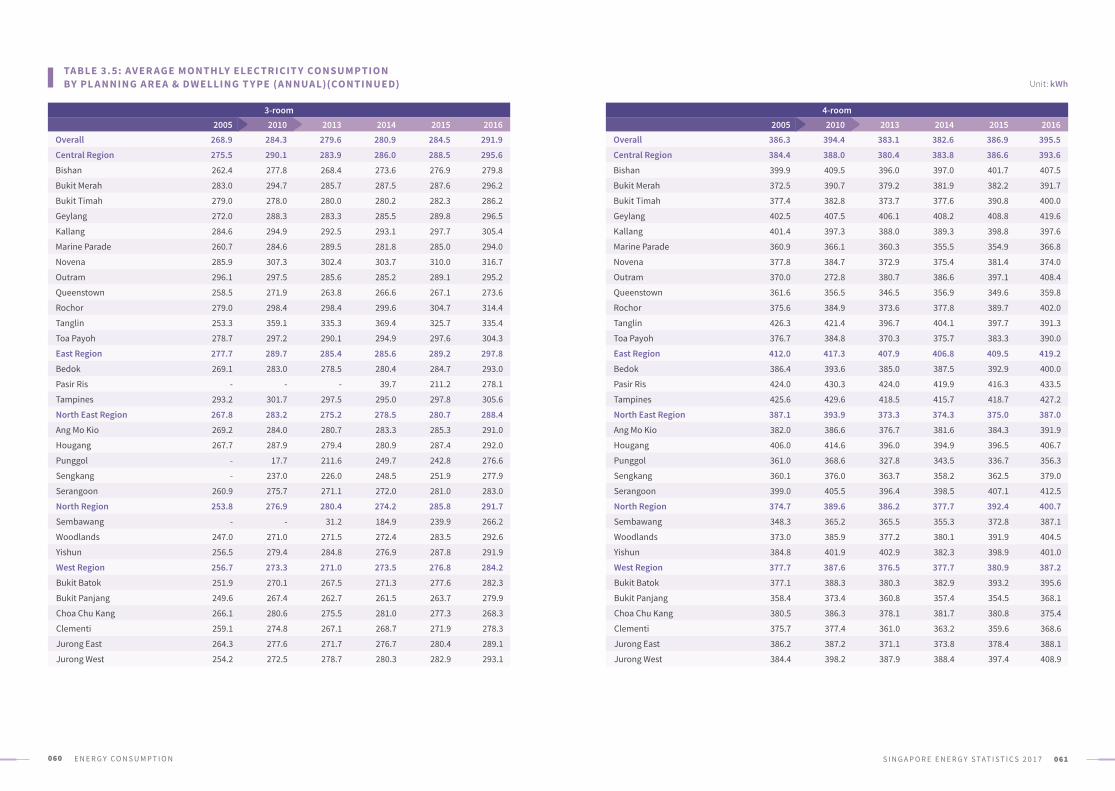
TA BLE 3. 5: AV ER AGE MONTHLY ELEC TRICIT Y CONSUMP TION BY PL A NNING A RE A & DWELLING T Y PE (A NNUA L) Unit: kWh
060 E N E R G Y C O N S U M P T I O N 061S I N G A P O R E E N E R G Y S TAT I S T I C S 2 0 1 7
3-room2005 2010 2013 2014 2015 2016
Overall 268.9 284.3 279.6 280.9 284.5 291.9
Central Region 275.5 290.1 283.9 286.0 288.5 295.6
Bishan 262.4 277.8 268.4 273.6 276.9 279.8
Bukit Merah 283.0 294.7 285.7 287.5 287.6 296.2
Bukit Timah 279.0 278.0 280.0 280.2 282.3 286.2
Geylang 272.0 288.3 283.3 285.5 289.8 296.5
Kallang 284.6 294.9 292.5 293.1 297.7 305.4
Marine Parade 260.7 284.6 289.5 281.8 285.0 294.0
Novena 285.9 307.3 302.4 303.7 310.0 316.7
Outram 296.1 297.5 285.6 285.2 289.1 295.2
Queenstown 258.5 271.9 263.8 266.6 267.1 273.6
Rochor 279.0 298.4 298.4 299.6 304.7 314.4
Tanglin 253.3 359.1 335.3 369.4 325.7 335.4
Toa Payoh 278.7 297.2 290.1 294.9 297.6 304.3
East Region 277.7 289.7 285.4 285.6 289.2 297.8
Bedok 269.1 283.0 278.5 280.4 284.7 293.0
Pasir Ris - - - 39.7 211.2 278.1
Tampines 293.2 301.7 297.5 295.0 297.8 305.6
North East Region 267.8 283.2 275.2 278.5 280.7 288.4
Ang Mo Kio 269.2 284.0 280.7 283.3 285.3 291.0
Hougang 267.7 287.9 279.4 280.9 287.4 292.0
Punggol - 17.7 211.6 249.7 242.8 276.6
Sengkang - 237.0 226.0 248.5 251.9 277.9
Serangoon 260.9 275.7 271.1 272.0 281.0 283.0
North Region 253.8 276.9 280.4 274.2 285.8 291.7
Sembawang - - 31.2 184.9 239.9 266.2
Woodlands 247.0 271.0 271.5 272.4 283.5 292.6
Yishun 256.5 279.4 284.8 276.9 287.8 291.9
West Region 256.7 273.3 271.0 273.5 276.8 284.2
Bukit Batok 251.9 270.1 267.5 271.3 277.6 282.3
Bukit Panjang 249.6 267.4 262.7 261.5 263.7 279.9
Choa Chu Kang 266.1 280.6 275.5 281.0 277.3 268.3
Clementi 259.1 274.8 267.1 268.7 271.9 278.3
Jurong East 264.3 277.6 271.7 276.7 280.4 289.1
Jurong West 254.2 272.5 278.7 280.3 282.9 293.1
4-room2005 2010 2013 2014 2015 2016
Overall 386.3 394.4 383.1 382.6 386.9 395.5
Central Region 384.4 388.0 380.4 383.8 386.6 393.6
Bishan 399.9 409.5 396.0 397.0 401.7 407.5
Bukit Merah 372.5 390.7 379.2 381.9 382.2 391.7
Bukit Timah 377.4 382.8 373.7 377.6 390.8 400.0
Geylang 402.5 407.5 406.1 408.2 408.8 419.6
Kallang 401.4 397.3 388.0 389.3 398.8 397.6
Marine Parade 360.9 366.1 360.3 355.5 354.9 366.8
Novena 377.8 384.7 372.9 375.4 381.4 374.0
Outram 370.0 272.8 380.7 386.6 397.1 408.4
Queenstown 361.6 356.5 346.5 356.9 349.6 359.8
Rochor 375.6 384.9 373.6 377.8 389.7 402.0
Tanglin 426.3 421.4 396.7 404.1 397.7 391.3
Toa Payoh 376.7 384.8 370.3 375.7 383.3 390.0
East Region 412.0 417.3 407.9 406.8 409.5 419.2
Bedok 386.4 393.6 385.0 387.5 392.9 400.0
Pasir Ris 424.0 430.3 424.0 419.9 416.3 433.5
Tampines 425.6 429.6 418.5 415.7 418.7 427.2
North East Region 387.1 393.9 373.3 374.3 375.0 387.0
Ang Mo Kio 382.0 386.6 376.7 381.6 384.3 391.9
Hougang 406.0 414.6 396.0 394.9 396.5 406.7
Punggol 361.0 368.6 327.8 343.5 336.7 356.3
Sengkang 360.1 376.0 363.7 358.2 362.5 379.0
Serangoon 399.0 405.5 396.4 398.5 407.1 412.5
North Region 374.7 389.6 386.2 377.7 392.4 400.7
Sembawang 348.3 365.2 365.5 355.3 372.8 387.1
Woodlands 373.0 385.9 377.2 380.1 391.9 404.5
Yishun 384.8 401.9 402.9 382.3 398.9 401.0
West Region 377.7 387.6 376.5 377.7 380.9 387.2
Bukit Batok 377.1 388.3 380.3 382.9 393.2 395.6
Bukit Panjang 358.4 373.4 360.8 357.4 354.5 368.1
Choa Chu Kang 380.5 386.3 378.1 381.7 380.8 375.4
Clementi 375.7 377.4 361.0 363.2 359.6 368.6
Jurong East 386.2 387.2 371.1 373.8 378.4 388.1
Jurong West 384.4 398.2 387.9 388.4 397.4 408.9
Unit: kWhTA BLE 3. 5: AV ER AGE MONTHLY ELEC TRICIT Y CONSUMP TION BY PL A NNING A RE A & DWELLING T Y PE (A NNUA L)(CONTINUED)
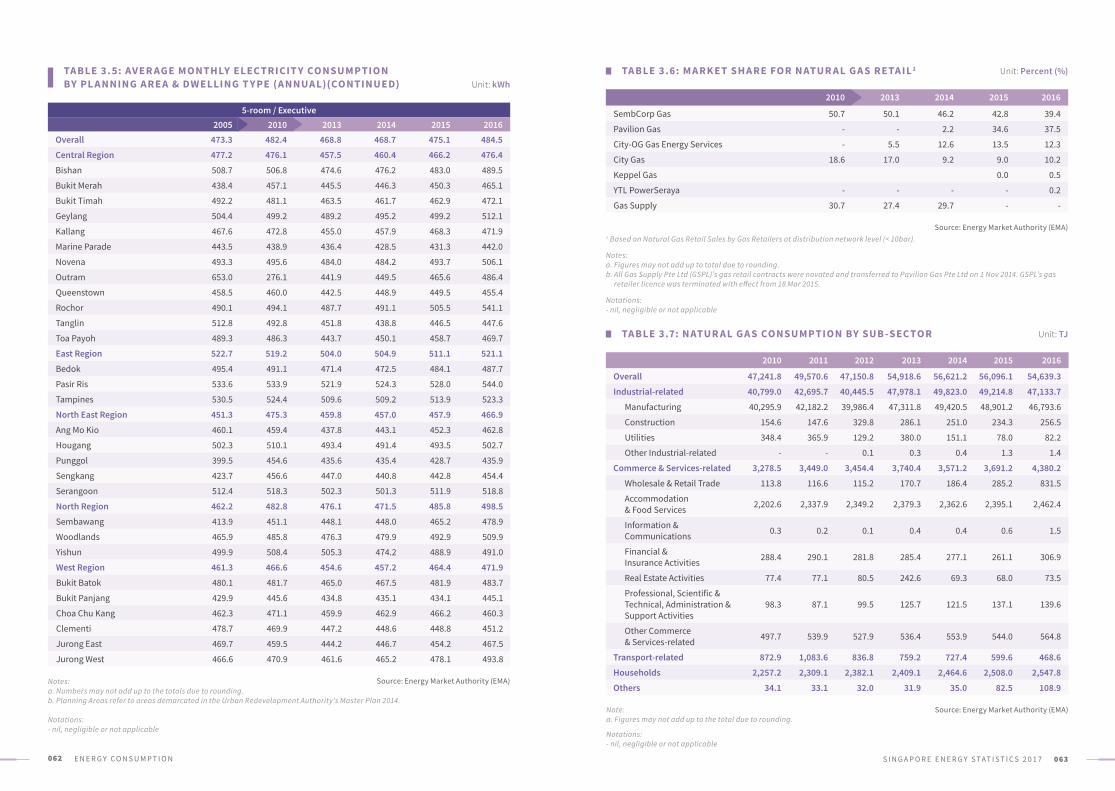
062 E N E R G Y C O N S U M P T I O N 063S I N G A P O R E E N E R G Y S TAT I S T I C S 2 0 1 7
Note: a. Figures may not add up to the total due to rounding.
Notations:- nil, negligible or not applicable
5-room / Executive2005 2010 2013 2014 2015 2016
Overall 473.3 482.4 468.8 468.7 475.1 484.5
Central Region 477.2 476.1 457.5 460.4 466.2 476.4
Bishan 508.7 506.8 474.6 476.2 483.0 489.5
Bukit Merah 438.4 457.1 445.5 446.3 450.3 465.1
Bukit Timah 492.2 481.1 463.5 461.7 462.9 472.1
Geylang 504.4 499.2 489.2 495.2 499.2 512.1
Kallang 467.6 472.8 455.0 457.9 468.3 471.9
Marine Parade 443.5 438.9 436.4 428.5 431.3 442.0
Novena 493.3 495.6 484.0 484.2 493.7 506.1
Outram 653.0 276.1 441.9 449.5 465.6 486.4
Queenstown 458.5 460.0 442.5 448.9 449.5 455.4
Rochor 490.1 494.1 487.7 491.1 505.5 541.1
Tanglin 512.8 492.8 451.8 438.8 446.5 447.6
Toa Payoh 489.3 486.3 443.7 450.1 458.7 469.7
East Region 522.7 519.2 504.0 504.9 511.1 521.1
Bedok 495.4 491.1 471.4 472.5 484.1 487.7
Pasir Ris 533.6 533.9 521.9 524.3 528.0 544.0
Tampines 530.5 524.4 509.6 509.2 513.9 523.3
North East Region 451.3 475.3 459.8 457.0 457.9 466.9
Ang Mo Kio 460.1 459.4 437.8 443.1 452.3 462.8
Hougang 502.3 510.1 493.4 491.4 493.5 502.7
Punggol 399.5 454.6 435.6 435.4 428.7 435.9
Sengkang 423.7 456.6 447.0 440.8 442.8 454.4
Serangoon 512.4 518.3 502.3 501.3 511.9 518.8
North Region 462.2 482.8 476.1 471.5 485.8 498.5
Sembawang 413.9 451.1 448.1 448.0 465.2 478.9
Woodlands 465.9 485.8 476.3 479.9 492.9 509.9
Yishun 499.9 508.4 505.3 474.2 488.9 491.0
West Region 461.3 466.6 454.6 457.2 464.4 471.9
Bukit Batok 480.1 481.7 465.0 467.5 481.9 483.7
Bukit Panjang 429.9 445.6 434.8 435.1 434.1 445.1
Choa Chu Kang 462.3 471.1 459.9 462.9 466.2 460.3
Clementi 478.7 469.9 447.2 448.6 448.8 451.2
Jurong East 469.7 459.5 444.2 446.7 454.2 467.5
Jurong West 466.6 470.9 461.6 465.2 478.1 493.8
Source: Energy Market Authority (EMA)
TA BLE 3.6: M A RK ET SH A RE FOR N ATUR A L G A S RETA IL 1
TA BLE 3.7: N ATUR A L G A S CONSUMP TION BY SUB -SEC TOR
Unit: Percent (%)
Unit: TJ
2010 2013 2014 2015 2016
SembCorp Gas 50.7 50.1 46.2 42.8 39.4
Pavilion Gas - - 2.2 34.6 37.5
City-OG Gas Energy Services - 5.5 12.6 13.5 12.3
City Gas 18.6 17.0 9.2 9.0 10.2
Keppel Gas 0.0 0.5
YTL PowerSeraya - - - - 0.2
Gas Supply 30.7 27.4 29.7 - -
Source: Energy Market Authority (EMA)1 Based on Natural Gas Retail Sales by Gas Retailers at distribution network level (< 10bar).
Notes:a. Figures may not add up to total due to rounding.b. All Gas Supply Pte Ltd (GSPL)’s gas retail contracts were novated and transferred to Pavilion Gas Pte Ltd on 1 Nov 2014. GSPL’s gas
retailer licence was terminated with effect from 18 Mar 2015.
Notations:- nil, negligible or not applicable
Source: Energy Market Authority (EMA)
Unit: kWhTA BLE 3. 5: AV ER AGE MONTHLY ELEC TRICIT Y CONSUMP TION BY PL A NNING A RE A & DWELLING T Y PE (A NNUA L)(CONTINUED)
Notes:a. Numbers may not add up to the totals due to rounding.b. Planning Areas refer to areas demarcated in the Urban Redevelopment Authority’s Master Plan 2014.
Notations:- nil, negligible or not applicable
2010 2011 2012 2013 2014 2015 2016
Overall 47,241.8 49,570.6 47,150.8 54,918.6 56,621.2 56,096.1 54,639.3
Industrial-related 40,799.0 42,695.7 40,445.5 47,978.1 49,823.0 49,214.8 47,133.7
Manufacturing 40,295.9 42,182.2 39,986.4 47,311.8 49,420.5 48,901.2 46,793.6
Construction 154.6 147.6 329.8 286.1 251.0 234.3 256.5
Utilities 348.4 365.9 129.2 380.0 151.1 78.0 82.2
Other Industrial-related - - 0.1 0.3 0.4 1.3 1.4
Commerce & Services-related 3,278.5 3,449.0 3,454.4 3,740.4 3,571.2 3,691.2 4,380.2
Wholesale & Retail Trade 113.8 116.6 115.2 170.7 186.4 285.2 831.5
Accommodation & Food Services 2,202.6 2,337.9 2,349.2 2,379.3 2,362.6 2,395.1 2,462.4
Information & Communications 0.3 0.2 0.1 0.4 0.4 0.6 1.5
Financial & Insurance Activities 288.4 290.1 281.8 285.4 277.1 261.1 306.9
Real Estate Activities 77.4 77.1 80.5 242.6 69.3 68.0 73.5
Professional, Scientific & Technical, Administration & Support Activities
98.3 87.1 99.5 125.7 121.5 137.1 139.6
Other Commerce & Services-related 497.7 539.9 527.9 536.4 553.9 544.0 564.8
Transport-related 872.9 1,083.6 836.8 759.2 727.4 599.6 468.6
Households 2,257.2 2,309.1 2,382.1 2,409.1 2,464.6 2,508.0 2,547.8
Others 34.1 33.1 32.0 31.9 35.0 82.5 108.9
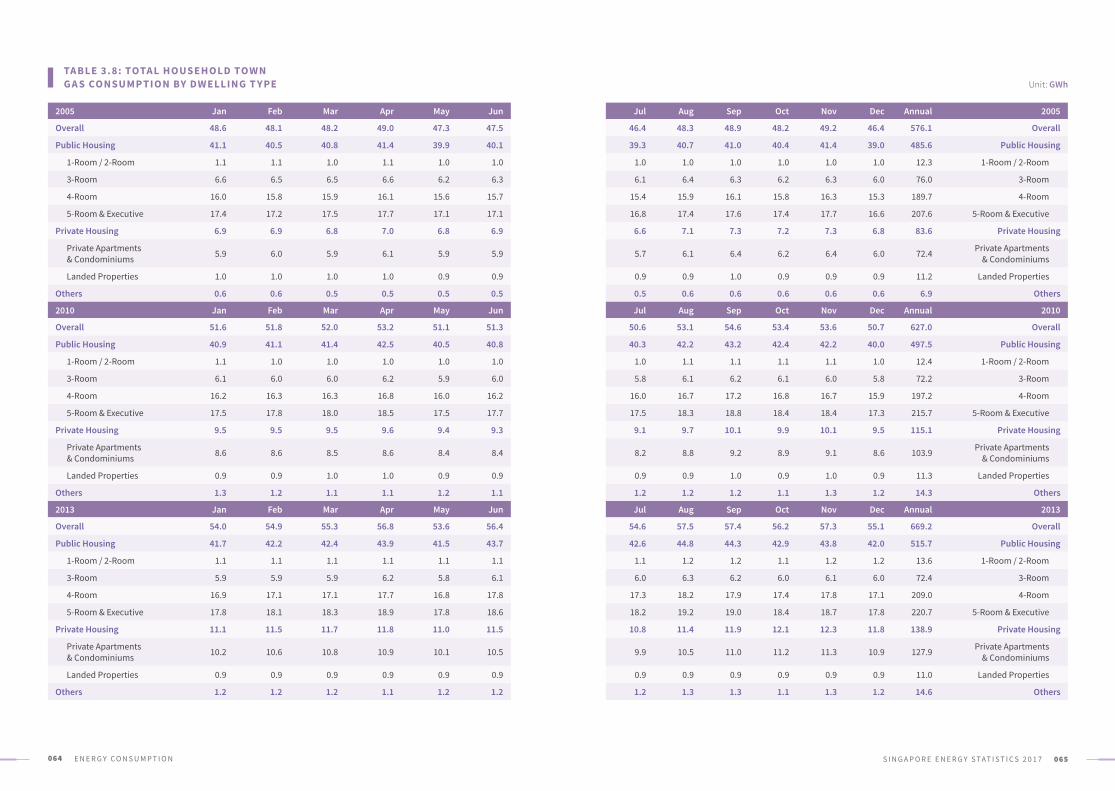
064 E N E R G Y C O N S U M P T I O N 065S I N G A P O R E E N E R G Y S TAT I S T I C S 2 0 1 7
TA BLE 3.8: TOTA L HOUSEHOLD TOWN G A S CONSUMP TION BY DWELLING T Y PE Unit: GWh
2005 Jan Feb Mar Apr May Jun
Overall 48.6 48.1 48.2 49.0 47.3 47.5
Public Housing 41.1 40.5 40.8 41.4 39.9 40.1
1-Room / 2-Room 1.1 1.1 1.0 1.1 1.0 1.0
3-Room 6.6 6.5 6.5 6.6 6.2 6.3
4-Room 16.0 15.8 15.9 16.1 15.6 15.7
5-Room & Executive 17.4 17.2 17.5 17.7 17.1 17.1
Private Housing 6.9 6.9 6.8 7.0 6.8 6.9
Private Apartments & Condominiums 5.9 6.0 5.9 6.1 5.9 5.9
Landed Properties 1.0 1.0 1.0 1.0 0.9 0.9
Others 0.6 0.6 0.5 0.5 0.5 0.5
2010 Jan Feb Mar Apr May Jun
Overall 51.6 51.8 52.0 53.2 51.1 51.3
Public Housing 40.9 41.1 41.4 42.5 40.5 40.8
1-Room / 2-Room 1.1 1.0 1.0 1.0 1.0 1.0
3-Room 6.1 6.0 6.0 6.2 5.9 6.0
4-Room 16.2 16.3 16.3 16.8 16.0 16.2
5-Room & Executive 17.5 17.8 18.0 18.5 17.5 17.7
Private Housing 9.5 9.5 9.5 9.6 9.4 9.3
Private Apartments & Condominiums 8.6 8.6 8.5 8.6 8.4 8.4
Landed Properties 0.9 0.9 1.0 1.0 0.9 0.9
Others 1.3 1.2 1.1 1.1 1.2 1.1
2013 Jan Feb Mar Apr May Jun
Overall 54.0 54.9 55.3 56.8 53.6 56.4
Public Housing 41.7 42.2 42.4 43.9 41.5 43.7
1-Room / 2-Room 1.1 1.1 1.1 1.1 1.1 1.1
3-Room 5.9 5.9 5.9 6.2 5.8 6.1
4-Room 16.9 17.1 17.1 17.7 16.8 17.8
5-Room & Executive 17.8 18.1 18.3 18.9 17.8 18.6
Private Housing 11.1 11.5 11.7 11.8 11.0 11.5
Private Apartments & Condominiums 10.2 10.6 10.8 10.9 10.1 10.5
Landed Properties 0.9 0.9 0.9 0.9 0.9 0.9
Others 1.2 1.2 1.2 1.1 1.2 1.2
Jul Aug Sep Oct Nov Dec Annual 2005
46.4 48.3 48.9 48.2 49.2 46.4 576.1 Overall
39.3 40.7 41.0 40.4 41.4 39.0 485.6 Public Housing
1.0 1.0 1.0 1.0 1.0 1.0 12.3 1-Room / 2-Room
6.1 6.4 6.3 6.2 6.3 6.0 76.0 3-Room
15.4 15.9 16.1 15.8 16.3 15.3 189.7 4-Room
16.8 17.4 17.6 17.4 17.7 16.6 207.6 5-Room & Executive
6.6 7.1 7.3 7.2 7.3 6.8 83.6 Private Housing
5.7 6.1 6.4 6.2 6.4 6.0 72.4 Private Apartments & Condominiums
0.9 0.9 1.0 0.9 0.9 0.9 11.2 Landed Properties
0.5 0.6 0.6 0.6 0.6 0.6 6.9 Others
Jul Aug Sep Oct Nov Dec Annual 2010
50.6 53.1 54.6 53.4 53.6 50.7 627.0 Overall
40.3 42.2 43.2 42.4 42.2 40.0 497.5 Public Housing
1.0 1.1 1.1 1.1 1.1 1.0 12.4 1-Room / 2-Room
5.8 6.1 6.2 6.1 6.0 5.8 72.2 3-Room
16.0 16.7 17.2 16.8 16.7 15.9 197.2 4-Room
17.5 18.3 18.8 18.4 18.4 17.3 215.7 5-Room & Executive
9.1 9.7 10.1 9.9 10.1 9.5 115.1 Private Housing
8.2 8.8 9.2 8.9 9.1 8.6 103.9 Private Apartments & Condominiums
0.9 0.9 1.0 0.9 1.0 0.9 11.3 Landed Properties
1.2 1.2 1.2 1.1 1.3 1.2 14.3 Others
Jul Aug Sep Oct Nov Dec Annual 2013
54.6 57.5 57.4 56.2 57.3 55.1 669.2 Overall
42.6 44.8 44.3 42.9 43.8 42.0 515.7 Public Housing
1.1 1.2 1.2 1.1 1.2 1.2 13.6 1-Room / 2-Room
6.0 6.3 6.2 6.0 6.1 6.0 72.4 3-Room
17.3 18.2 17.9 17.4 17.8 17.1 209.0 4-Room
18.2 19.2 19.0 18.4 18.7 17.8 220.7 5-Room & Executive
10.8 11.4 11.9 12.1 12.3 11.8 138.9 Private Housing
9.9 10.5 11.0 11.2 11.3 10.9 127.9 Private Apartments & Condominiums
0.9 0.9 0.9 0.9 0.9 0.9 11.0 Landed Properties
1.2 1.3 1.3 1.1 1.3 1.2 14.6 Others
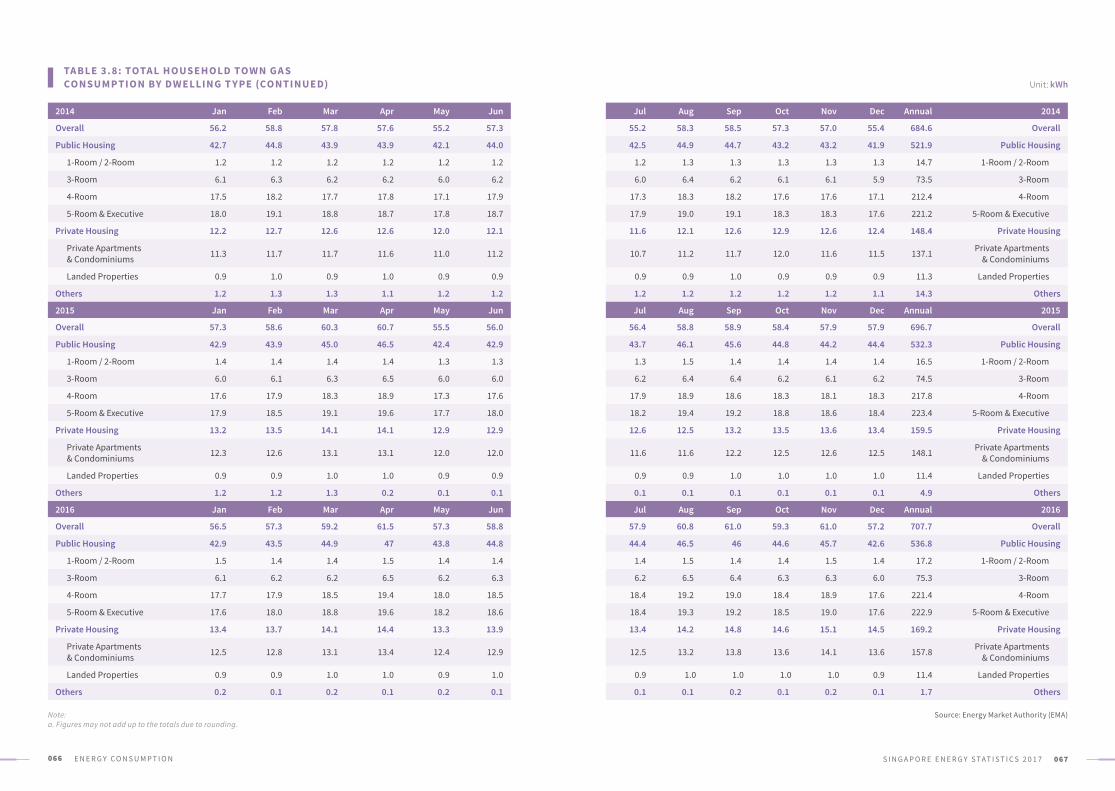
066 E N E R G Y C O N S U M P T I O N 067S I N G A P O R E E N E R G Y S TAT I S T I C S 2 0 1 7
Unit: kWh
2014 Jan Feb Mar Apr May Jun
Overall 56.2 58.8 57.8 57.6 55.2 57.3
Public Housing 42.7 44.8 43.9 43.9 42.1 44.0
1-Room / 2-Room 1.2 1.2 1.2 1.2 1.2 1.2
3-Room 6.1 6.3 6.2 6.2 6.0 6.2
4-Room 17.5 18.2 17.7 17.8 17.1 17.9
5-Room & Executive 18.0 19.1 18.8 18.7 17.8 18.7
Private Housing 12.2 12.7 12.6 12.6 12.0 12.1
Private Apartments & Condominiums 11.3 11.7 11.7 11.6 11.0 11.2
Landed Properties 0.9 1.0 0.9 1.0 0.9 0.9
Others 1.2 1.3 1.3 1.1 1.2 1.2
2015 Jan Feb Mar Apr May Jun
Overall 57.3 58.6 60.3 60.7 55.5 56.0
Public Housing 42.9 43.9 45.0 46.5 42.4 42.9
1-Room / 2-Room 1.4 1.4 1.4 1.4 1.3 1.3
3-Room 6.0 6.1 6.3 6.5 6.0 6.0
4-Room 17.6 17.9 18.3 18.9 17.3 17.6
5-Room & Executive 17.9 18.5 19.1 19.6 17.7 18.0
Private Housing 13.2 13.5 14.1 14.1 12.9 12.9
Private Apartments & Condominiums 12.3 12.6 13.1 13.1 12.0 12.0
Landed Properties 0.9 0.9 1.0 1.0 0.9 0.9
Others 1.2 1.2 1.3 0.2 0.1 0.1
2016 Jan Feb Mar Apr May Jun
Overall 56.5 57.3 59.2 61.5 57.3 58.8
Public Housing 42.9 43.5 44.9 47 43.8 44.8
1-Room / 2-Room 1.5 1.4 1.4 1.5 1.4 1.4
3-Room 6.1 6.2 6.2 6.5 6.2 6.3
4-Room 17.7 17.9 18.5 19.4 18.0 18.5
5-Room & Executive 17.6 18.0 18.8 19.6 18.2 18.6
Private Housing 13.4 13.7 14.1 14.4 13.3 13.9
Private Apartments & Condominiums 12.5 12.8 13.1 13.4 12.4 12.9
Landed Properties 0.9 0.9 1.0 1.0 0.9 1.0
Others 0.2 0.1 0.2 0.1 0.2 0.1
Jul Aug Sep Oct Nov Dec Annual 2014
55.2 58.3 58.5 57.3 57.0 55.4 684.6 Overall
42.5 44.9 44.7 43.2 43.2 41.9 521.9 Public Housing
1.2 1.3 1.3 1.3 1.3 1.3 14.7 1-Room / 2-Room
6.0 6.4 6.2 6.1 6.1 5.9 73.5 3-Room
17.3 18.3 18.2 17.6 17.6 17.1 212.4 4-Room
17.9 19.0 19.1 18.3 18.3 17.6 221.2 5-Room & Executive
11.6 12.1 12.6 12.9 12.6 12.4 148.4 Private Housing
10.7 11.2 11.7 12.0 11.6 11.5 137.1 Private Apartments & Condominiums
0.9 0.9 1.0 0.9 0.9 0.9 11.3 Landed Properties
1.2 1.2 1.2 1.2 1.2 1.1 14.3 Others
Jul Aug Sep Oct Nov Dec Annual 2015
56.4 58.8 58.9 58.4 57.9 57.9 696.7 Overall
43.7 46.1 45.6 44.8 44.2 44.4 532.3 Public Housing
1.3 1.5 1.4 1.4 1.4 1.4 16.5 1-Room / 2-Room
6.2 6.4 6.4 6.2 6.1 6.2 74.5 3-Room
17.9 18.9 18.6 18.3 18.1 18.3 217.8 4-Room
18.2 19.4 19.2 18.8 18.6 18.4 223.4 5-Room & Executive
12.6 12.5 13.2 13.5 13.6 13.4 159.5 Private Housing
11.6 11.6 12.2 12.5 12.6 12.5 148.1 Private Apartments & Condominiums
0.9 0.9 1.0 1.0 1.0 1.0 11.4 Landed Properties
0.1 0.1 0.1 0.1 0.1 0.1 4.9 Others
Jul Aug Sep Oct Nov Dec Annual 2016
57.9 60.8 61.0 59.3 61.0 57.2 707.7 Overall
44.4 46.5 46 44.6 45.7 42.6 536.8 Public Housing
1.4 1.5 1.4 1.4 1.5 1.4 17.2 1-Room / 2-Room
6.2 6.5 6.4 6.3 6.3 6.0 75.3 3-Room
18.4 19.2 19.0 18.4 18.9 17.6 221.4 4-Room
18.4 19.3 19.2 18.5 19.0 17.6 222.9 5-Room & Executive
13.4 14.2 14.8 14.6 15.1 14.5 169.2 Private Housing
12.5 13.2 13.8 13.6 14.1 13.6 157.8 Private Apartments & Condominiums
0.9 1.0 1.0 1.0 1.0 0.9 11.4 Landed Properties
0.1 0.1 0.2 0.1 0.2 0.1 1.7 Others
TA BLE 3.8: TOTA L HOUSEHOLD TOWN G A S CONSUMP TION BY DWELLING T Y PE (CONTINUED)
Source: Energy Market Authority (EMA)Note:a. Figures may not add up to the totals due to rounding.
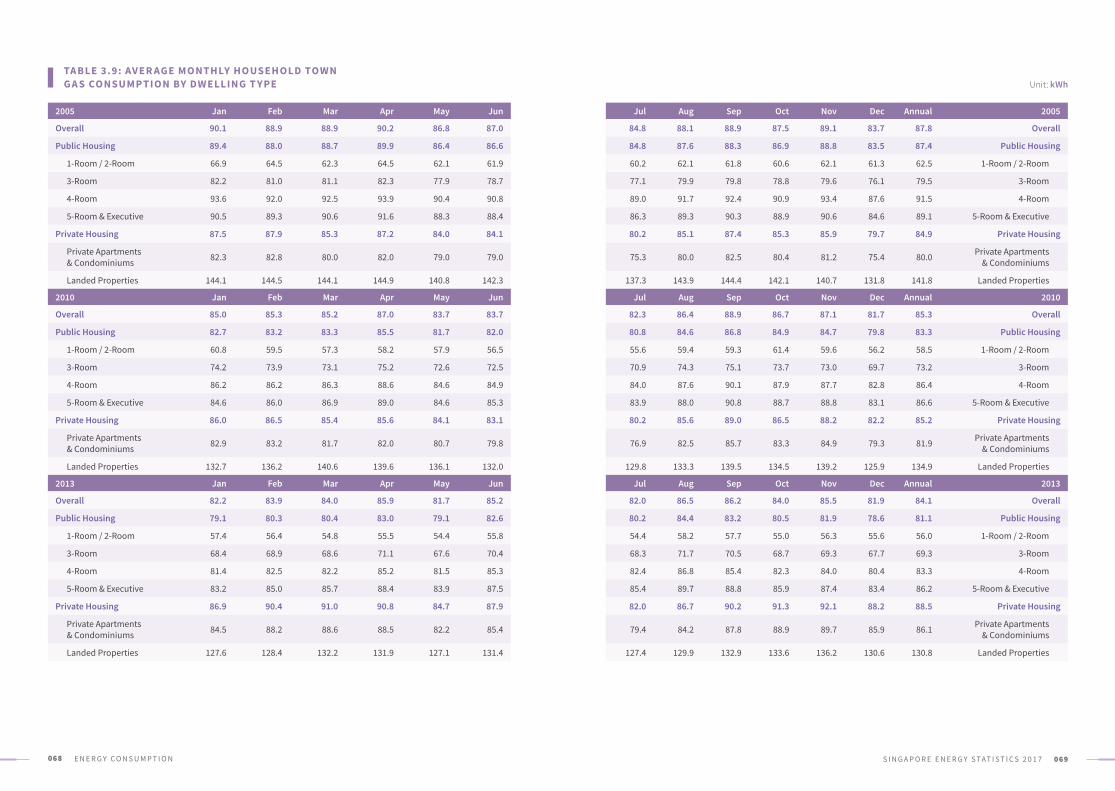
068 E N E R G Y C O N S U M P T I O N 069S I N G A P O R E E N E R G Y S TAT I S T I C S 2 0 1 7
Unit: kWh
2005 Jan Feb Mar Apr May Jun
Overall 90.1 88.9 88.9 90.2 86.8 87.0
Public Housing 89.4 88.0 88.7 89.9 86.4 86.6
1-Room / 2-Room 66.9 64.5 62.3 64.5 62.1 61.9
3-Room 82.2 81.0 81.1 82.3 77.9 78.7
4-Room 93.6 92.0 92.5 93.9 90.4 90.8
5-Room & Executive 90.5 89.3 90.6 91.6 88.3 88.4
Private Housing 87.5 87.9 85.3 87.2 84.0 84.1
Private Apartments & Condominiums 82.3 82.8 80.0 82.0 79.0 79.0
Landed Properties 144.1 144.5 144.1 144.9 140.8 142.3
2010 Jan Feb Mar Apr May Jun
Overall 85.0 85.3 85.2 87.0 83.7 83.7
Public Housing 82.7 83.2 83.3 85.5 81.7 82.0
1-Room / 2-Room 60.8 59.5 57.3 58.2 57.9 56.5
3-Room 74.2 73.9 73.1 75.2 72.6 72.5
4-Room 86.2 86.2 86.3 88.6 84.6 84.9
5-Room & Executive 84.6 86.0 86.9 89.0 84.6 85.3
Private Housing 86.0 86.5 85.4 85.6 84.1 83.1
Private Apartments & Condominiums 82.9 83.2 81.7 82.0 80.7 79.8
Landed Properties 132.7 136.2 140.6 139.6 136.1 132.0
2013 Jan Feb Mar Apr May Jun
Overall 82.2 83.9 84.0 85.9 81.7 85.2
Public Housing 79.1 80.3 80.4 83.0 79.1 82.6
1-Room / 2-Room 57.4 56.4 54.8 55.5 54.4 55.8
3-Room 68.4 68.9 68.6 71.1 67.6 70.4
4-Room 81.4 82.5 82.2 85.2 81.5 85.3
5-Room & Executive 83.2 85.0 85.7 88.4 83.9 87.5
Private Housing 86.9 90.4 91.0 90.8 84.7 87.9
Private Apartments & Condominiums 84.5 88.2 88.6 88.5 82.2 85.4
Landed Properties 127.6 128.4 132.2 131.9 127.1 131.4
Jul Aug Sep Oct Nov Dec Annual 2005
84.8 88.1 88.9 87.5 89.1 83.7 87.8 Overall
84.8 87.6 88.3 86.9 88.8 83.5 87.4 Public Housing
60.2 62.1 61.8 60.6 62.1 61.3 62.5 1-Room / 2-Room
77.1 79.9 79.8 78.8 79.6 76.1 79.5 3-Room
89.0 91.7 92.4 90.9 93.4 87.6 91.5 4-Room
86.3 89.3 90.3 88.9 90.6 84.6 89.1 5-Room & Executive
80.2 85.1 87.4 85.3 85.9 79.7 84.9 Private Housing
75.3 80.0 82.5 80.4 81.2 75.4 80.0 Private Apartments & Condominiums
137.3 143.9 144.4 142.1 140.7 131.8 141.8 Landed Properties
Jul Aug Sep Oct Nov Dec Annual 2010
82.3 86.4 88.9 86.7 87.1 81.7 85.3 Overall
80.8 84.6 86.8 84.9 84.7 79.8 83.3 Public Housing
55.6 59.4 59.3 61.4 59.6 56.2 58.5 1-Room / 2-Room
70.9 74.3 75.1 73.7 73.0 69.7 73.2 3-Room
84.0 87.6 90.1 87.9 87.7 82.8 86.4 4-Room
83.9 88.0 90.8 88.7 88.8 83.1 86.6 5-Room & Executive
80.2 85.6 89.0 86.5 88.2 82.2 85.2 Private Housing
76.9 82.5 85.7 83.3 84.9 79.3 81.9 Private Apartments & Condominiums
129.8 133.3 139.5 134.5 139.2 125.9 134.9 Landed Properties
Jul Aug Sep Oct Nov Dec Annual 2013
82.0 86.5 86.2 84.0 85.5 81.9 84.1 Overall
80.2 84.4 83.2 80.5 81.9 78.6 81.1 Public Housing
54.4 58.2 57.7 55.0 56.3 55.6 56.0 1-Room / 2-Room
68.3 71.7 70.5 68.7 69.3 67.7 69.3 3-Room
82.4 86.8 85.4 82.3 84.0 80.4 83.3 4-Room
85.4 89.7 88.8 85.9 87.4 83.4 86.2 5-Room & Executive
82.0 86.7 90.2 91.3 92.1 88.2 88.5 Private Housing
79.4 84.2 87.8 88.9 89.7 85.9 86.1 Private Apartments & Condominiums
127.4 129.9 132.9 133.6 136.2 130.6 130.8 Landed Properties
TA BLE 3.9: AV ER AGE MONTHLY HOUSEHOLD TOWN G A S CONSUMP TION BY DWELLING T Y PE
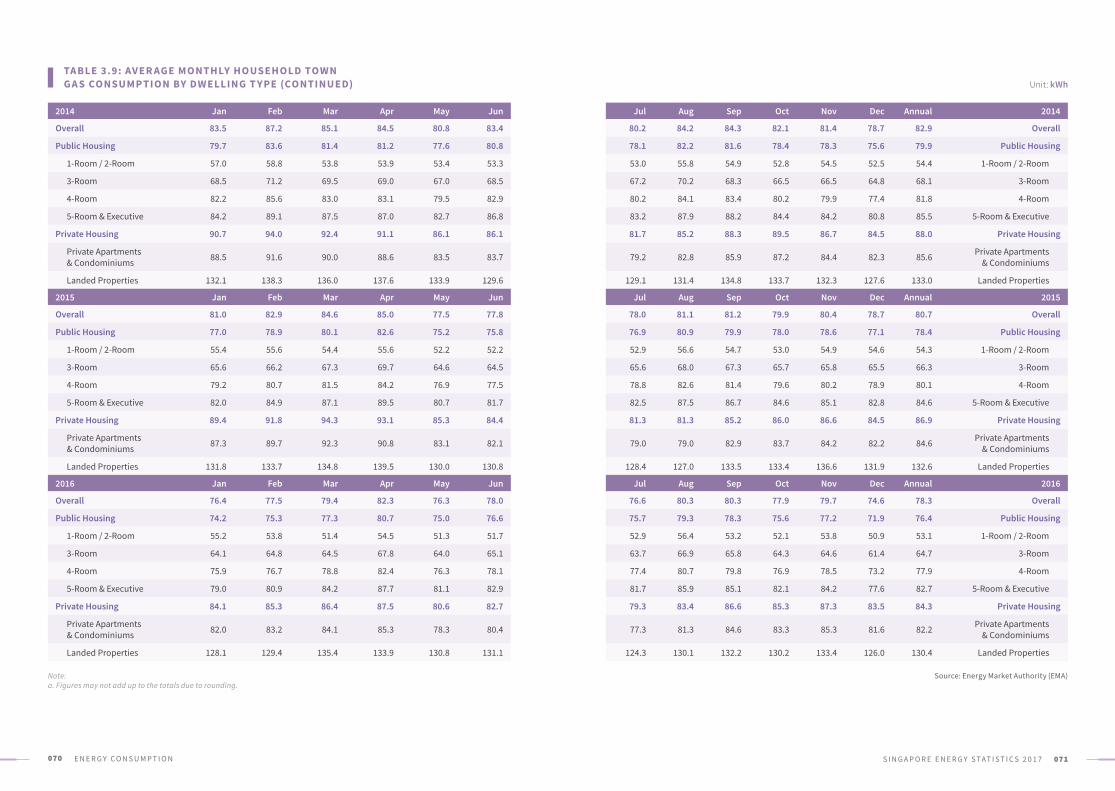
070 E N E R G Y C O N S U M P T I O N 071S I N G A P O R E E N E R G Y S TAT I S T I C S 2 0 1 7
Unit: kWh
Source: Energy Market Authority (EMA)Note:a. Figures may not add up to the totals due to rounding.
2014 Jan Feb Mar Apr May Jun
Overall 83.5 87.2 85.1 84.5 80.8 83.4
Public Housing 79.7 83.6 81.4 81.2 77.6 80.8
1-Room / 2-Room 57.0 58.8 53.8 53.9 53.4 53.3
3-Room 68.5 71.2 69.5 69.0 67.0 68.5
4-Room 82.2 85.6 83.0 83.1 79.5 82.9
5-Room & Executive 84.2 89.1 87.5 87.0 82.7 86.8
Private Housing 90.7 94.0 92.4 91.1 86.1 86.1
Private Apartments & Condominiums 88.5 91.6 90.0 88.6 83.5 83.7
Landed Properties 132.1 138.3 136.0 137.6 133.9 129.6
2015 Jan Feb Mar Apr May Jun
Overall 81.0 82.9 84.6 85.0 77.5 77.8
Public Housing 77.0 78.9 80.1 82.6 75.2 75.8
1-Room / 2-Room 55.4 55.6 54.4 55.6 52.2 52.2
3-Room 65.6 66.2 67.3 69.7 64.6 64.5
4-Room 79.2 80.7 81.5 84.2 76.9 77.5
5-Room & Executive 82.0 84.9 87.1 89.5 80.7 81.7
Private Housing 89.4 91.8 94.3 93.1 85.3 84.4
Private Apartments & Condominiums 87.3 89.7 92.3 90.8 83.1 82.1
Landed Properties 131.8 133.7 134.8 139.5 130.0 130.8
2016 Jan Feb Mar Apr May Jun
Overall 76.4 77.5 79.4 82.3 76.3 78.0
Public Housing 74.2 75.3 77.3 80.7 75.0 76.6
1-Room / 2-Room 55.2 53.8 51.4 54.5 51.3 51.7
3-Room 64.1 64.8 64.5 67.8 64.0 65.1
4-Room 75.9 76.7 78.8 82.4 76.3 78.1
5-Room & Executive 79.0 80.9 84.2 87.7 81.1 82.9
Private Housing 84.1 85.3 86.4 87.5 80.6 82.7
Private Apartments & Condominiums 82.0 83.2 84.1 85.3 78.3 80.4
Landed Properties 128.1 129.4 135.4 133.9 130.8 131.1
Jul Aug Sep Oct Nov Dec Annual 2014
80.2 84.2 84.3 82.1 81.4 78.7 82.9 Overall
78.1 82.2 81.6 78.4 78.3 75.6 79.9 Public Housing
53.0 55.8 54.9 52.8 54.5 52.5 54.4 1-Room / 2-Room
67.2 70.2 68.3 66.5 66.5 64.8 68.1 3-Room
80.2 84.1 83.4 80.2 79.9 77.4 81.8 4-Room
83.2 87.9 88.2 84.4 84.2 80.8 85.5 5-Room & Executive
81.7 85.2 88.3 89.5 86.7 84.5 88.0 Private Housing
79.2 82.8 85.9 87.2 84.4 82.3 85.6 Private Apartments & Condominiums
129.1 131.4 134.8 133.7 132.3 127.6 133.0 Landed Properties
Jul Aug Sep Oct Nov Dec Annual 2015
78.0 81.1 81.2 79.9 80.4 78.7 80.7 Overall
76.9 80.9 79.9 78.0 78.6 77.1 78.4 Public Housing
52.9 56.6 54.7 53.0 54.9 54.6 54.3 1-Room / 2-Room
65.6 68.0 67.3 65.7 65.8 65.5 66.3 3-Room
78.8 82.6 81.4 79.6 80.2 78.9 80.1 4-Room
82.5 87.5 86.7 84.6 85.1 82.8 84.6 5-Room & Executive
81.3 81.3 85.2 86.0 86.6 84.5 86.9 Private Housing
79.0 79.0 82.9 83.7 84.2 82.2 84.6 Private Apartments & Condominiums
128.4 127.0 133.5 133.4 136.6 131.9 132.6 Landed Properties
Jul Aug Sep Oct Nov Dec Annual 2016
76.6 80.3 80.3 77.9 79.7 74.6 78.3 Overall
75.7 79.3 78.3 75.6 77.2 71.9 76.4 Public Housing
52.9 56.4 53.2 52.1 53.8 50.9 53.1 1-Room / 2-Room
63.7 66.9 65.8 64.3 64.6 61.4 64.7 3-Room
77.4 80.7 79.8 76.9 78.5 73.2 77.9 4-Room
81.7 85.9 85.1 82.1 84.2 77.6 82.7 5-Room & Executive
79.3 83.4 86.6 85.3 87.3 83.5 84.3 Private Housing
77.3 81.3 84.6 83.3 85.3 81.6 82.2 Private Apartments & Condominiums
124.3 130.1 132.2 130.2 133.4 126.0 130.4 Landed Properties
TA BLE 3.9: AV ER AGE MONTHLY HOUSEHOLD TOWN G A S CONSUMP TION BY DWELLING T Y PE (CONTINUED)
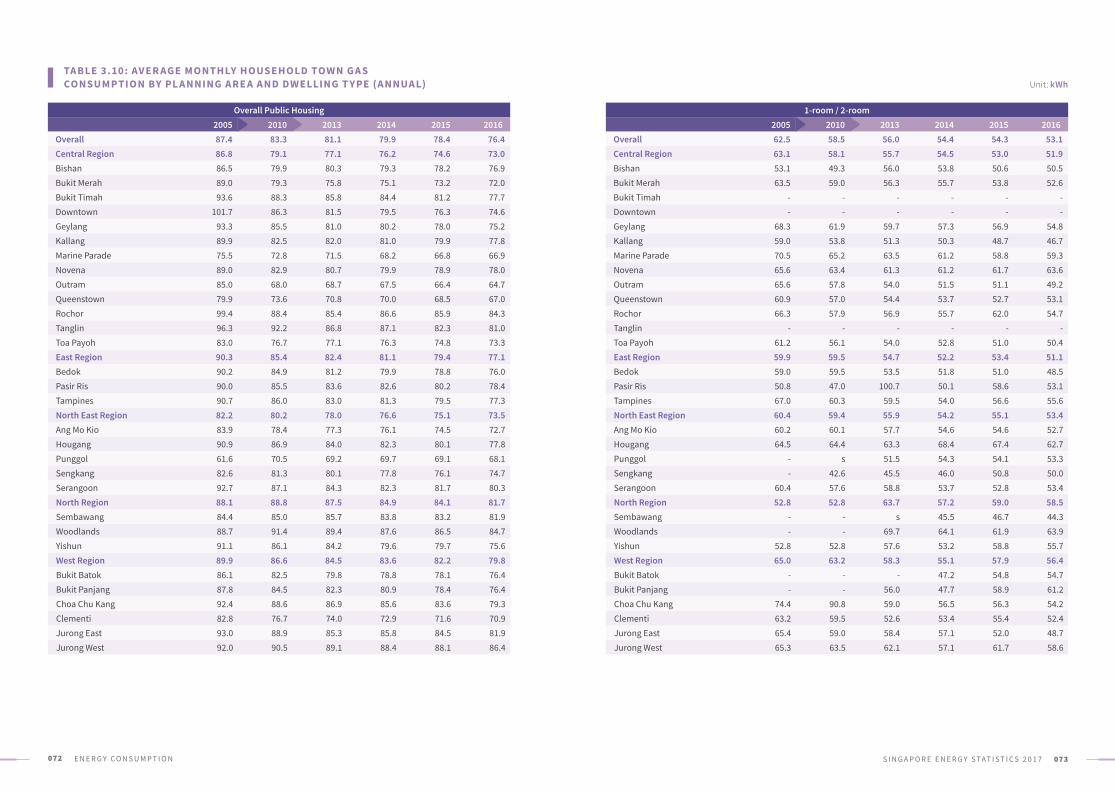
072 E N E R G Y C O N S U M P T I O N 073S I N G A P O R E E N E R G Y S TAT I S T I C S 2 0 1 7
Overall Public Housing2005 2010 2013 2014 2015 2016
Overall 87.4 83.3 81.1 79.9 78.4 76.4Central Region 86.8 79.1 77.1 76.2 74.6 73.0Bishan 86.5 79.9 80.3 79.3 78.2 76.9Bukit Merah 89.0 79.3 75.8 75.1 73.2 72.0Bukit Timah 93.6 88.3 85.8 84.4 81.2 77.7Downtown 101.7 86.3 81.5 79.5 76.3 74.6Geylang 93.3 85.5 81.0 80.2 78.0 75.2Kallang 89.9 82.5 82.0 81.0 79.9 77.8Marine Parade 75.5 72.8 71.5 68.2 66.8 66.9Novena 89.0 82.9 80.7 79.9 78.9 78.0Outram 85.0 68.0 68.7 67.5 66.4 64.7Queenstown 79.9 73.6 70.8 70.0 68.5 67.0Rochor 99.4 88.4 85.4 86.6 85.9 84.3Tanglin 96.3 92.2 86.8 87.1 82.3 81.0Toa Payoh 83.0 76.7 77.1 76.3 74.8 73.3East Region 90.3 85.4 82.4 81.1 79.4 77.1Bedok 90.2 84.9 81.2 79.9 78.8 76.0Pasir Ris 90.0 85.5 83.6 82.6 80.2 78.4Tampines 90.7 86.0 83.0 81.3 79.5 77.3North East Region 82.2 80.2 78.0 76.6 75.1 73.5Ang Mo Kio 83.9 78.4 77.3 76.1 74.5 72.7Hougang 90.9 86.9 84.0 82.3 80.1 77.8Punggol 61.6 70.5 69.2 69.7 69.1 68.1Sengkang 82.6 81.3 80.1 77.8 76.1 74.7Serangoon 92.7 87.1 84.3 82.3 81.7 80.3North Region 88.1 88.8 87.5 84.9 84.1 81.7Sembawang 84.4 85.0 85.7 83.8 83.2 81.9Woodlands 88.7 91.4 89.4 87.6 86.5 84.7Yishun 91.1 86.1 84.2 79.6 79.7 75.6West Region 89.9 86.6 84.5 83.6 82.2 79.8Bukit Batok 86.1 82.5 79.8 78.8 78.1 76.4Bukit Panjang 87.8 84.5 82.3 80.9 78.4 76.4Choa Chu Kang 92.4 88.6 86.9 85.6 83.6 79.3Clementi 82.8 76.7 74.0 72.9 71.6 70.9Jurong East 93.0 88.9 85.3 85.8 84.5 81.9Jurong West 92.0 90.5 89.1 88.4 88.1 86.4
1-room / 2-room2005 2010 2013 2014 2015 2016
Overall 62.5 58.5 56.0 54.4 54.3 53.1Central Region 63.1 58.1 55.7 54.5 53.0 51.9Bishan 53.1 49.3 56.0 53.8 50.6 50.5Bukit Merah 63.5 59.0 56.3 55.7 53.8 52.6Bukit Timah - - - - - -Downtown - - - - - -Geylang 68.3 61.9 59.7 57.3 56.9 54.8Kallang 59.0 53.8 51.3 50.3 48.7 46.7Marine Parade 70.5 65.2 63.5 61.2 58.8 59.3Novena 65.6 63.4 61.3 61.2 61.7 63.6Outram 65.6 57.8 54.0 51.5 51.1 49.2Queenstown 60.9 57.0 54.4 53.7 52.7 53.1Rochor 66.3 57.9 56.9 55.7 62.0 54.7Tanglin - - - - - -Toa Payoh 61.2 56.1 54.0 52.8 51.0 50.4East Region 59.9 59.5 54.7 52.2 53.4 51.1Bedok 59.0 59.5 53.5 51.8 51.0 48.5Pasir Ris 50.8 47.0 100.7 50.1 58.6 53.1Tampines 67.0 60.3 59.5 54.0 56.6 55.6North East Region 60.4 59.4 55.9 54.2 55.1 53.4Ang Mo Kio 60.2 60.1 57.7 54.6 54.6 52.7Hougang 64.5 64.4 63.3 68.4 67.4 62.7Punggol - s 51.5 54.3 54.1 53.3Sengkang - 42.6 45.5 46.0 50.8 50.0Serangoon 60.4 57.6 58.8 53.7 52.8 53.4North Region 52.8 52.8 63.7 57.2 59.0 58.5Sembawang - - s 45.5 46.7 44.3Woodlands - - 69.7 64.1 61.9 63.9Yishun 52.8 52.8 57.6 53.2 58.8 55.7West Region 65.0 63.2 58.3 55.1 57.9 56.4Bukit Batok - - - 47.2 54.8 54.7Bukit Panjang - - 56.0 47.7 58.9 61.2Choa Chu Kang 74.4 90.8 59.0 56.5 56.3 54.2Clementi 63.2 59.5 52.6 53.4 55.4 52.4Jurong East 65.4 59.0 58.4 57.1 52.0 48.7Jurong West 65.3 63.5 62.1 57.1 61.7 58.6
TA BLE 3.10: AV ER AGE MONTHLY HOUSEHOLD TOWN G A S CONSUMP TION BY PL A NNING A RE A A ND DWELLING T Y PE (A NNUA L) Unit: kWh
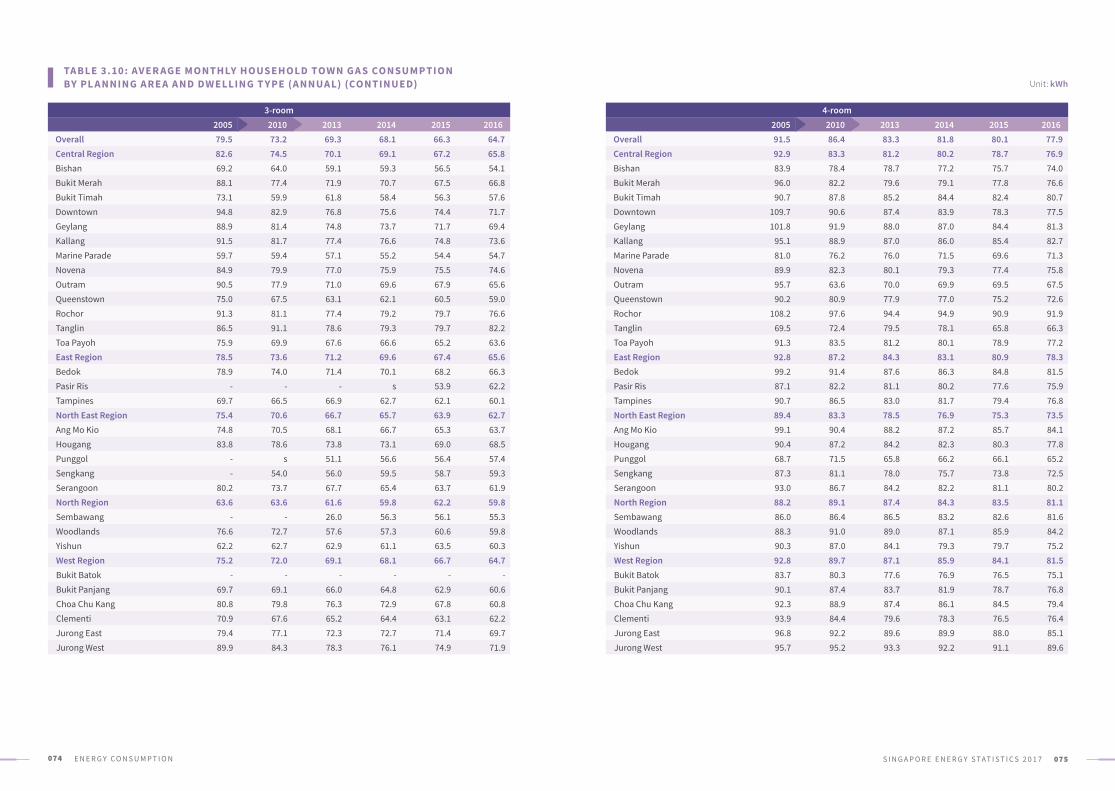
074 E N E R G Y C O N S U M P T I O N 075S I N G A P O R E E N E R G Y S TAT I S T I C S 2 0 1 7
TA BLE 3.10: AV ER AGE MONTHLY HOUSEHOLD TOWN G A S CONSUMP TION BY PL A NNING A RE A A ND DWELLING T Y PE (A NNUA L) (CONTINUED) Unit: kWh
3-room2005 2010 2013 2014 2015 2016
Overall 79.5 73.2 69.3 68.1 66.3 64.7Central Region 82.6 74.5 70.1 69.1 67.2 65.8Bishan 69.2 64.0 59.1 59.3 56.5 54.1Bukit Merah 88.1 77.4 71.9 70.7 67.5 66.8Bukit Timah 73.1 59.9 61.8 58.4 56.3 57.6Downtown 94.8 82.9 76.8 75.6 74.4 71.7Geylang 88.9 81.4 74.8 73.7 71.7 69.4Kallang 91.5 81.7 77.4 76.6 74.8 73.6Marine Parade 59.7 59.4 57.1 55.2 54.4 54.7Novena 84.9 79.9 77.0 75.9 75.5 74.6Outram 90.5 77.9 71.0 69.6 67.9 65.6Queenstown 75.0 67.5 63.1 62.1 60.5 59.0Rochor 91.3 81.1 77.4 79.2 79.7 76.6Tanglin 86.5 91.1 78.6 79.3 79.7 82.2Toa Payoh 75.9 69.9 67.6 66.6 65.2 63.6East Region 78.5 73.6 71.2 69.6 67.4 65.6Bedok 78.9 74.0 71.4 70.1 68.2 66.3Pasir Ris - - - s 53.9 62.2Tampines 69.7 66.5 66.9 62.7 62.1 60.1North East Region 75.4 70.6 66.7 65.7 63.9 62.7Ang Mo Kio 74.8 70.5 68.1 66.7 65.3 63.7Hougang 83.8 78.6 73.8 73.1 69.0 68.5Punggol - s 51.1 56.6 56.4 57.4Sengkang - 54.0 56.0 59.5 58.7 59.3Serangoon 80.2 73.7 67.7 65.4 63.7 61.9North Region 63.6 63.6 61.6 59.8 62.2 59.8Sembawang - - 26.0 56.3 56.1 55.3Woodlands 76.6 72.7 57.6 57.3 60.6 59.8Yishun 62.2 62.7 62.9 61.1 63.5 60.3West Region 75.2 72.0 69.1 68.1 66.7 64.7Bukit Batok - - - - - -Bukit Panjang 69.7 69.1 66.0 64.8 62.9 60.6Choa Chu Kang 80.8 79.8 76.3 72.9 67.8 60.8Clementi 70.9 67.6 65.2 64.4 63.1 62.2Jurong East 79.4 77.1 72.3 72.7 71.4 69.7Jurong West 89.9 84.3 78.3 76.1 74.9 71.9
4-room2005 2010 2013 2014 2015 2016
Overall 91.5 86.4 83.3 81.8 80.1 77.9Central Region 92.9 83.3 81.2 80.2 78.7 76.9Bishan 83.9 78.4 78.7 77.2 75.7 74.0Bukit Merah 96.0 82.2 79.6 79.1 77.8 76.6Bukit Timah 90.7 87.8 85.2 84.4 82.4 80.7Downtown 109.7 90.6 87.4 83.9 78.3 77.5Geylang 101.8 91.9 88.0 87.0 84.4 81.3Kallang 95.1 88.9 87.0 86.0 85.4 82.7Marine Parade 81.0 76.2 76.0 71.5 69.6 71.3Novena 89.9 82.3 80.1 79.3 77.4 75.8Outram 95.7 63.6 70.0 69.9 69.5 67.5Queenstown 90.2 80.9 77.9 77.0 75.2 72.6Rochor 108.2 97.6 94.4 94.9 90.9 91.9Tanglin 69.5 72.4 79.5 78.1 65.8 66.3Toa Payoh 91.3 83.5 81.2 80.1 78.9 77.2East Region 92.8 87.2 84.3 83.1 80.9 78.3Bedok 99.2 91.4 87.6 86.3 84.8 81.5Pasir Ris 87.1 82.2 81.1 80.2 77.6 75.9Tampines 90.7 86.5 83.0 81.7 79.4 76.8North East Region 89.4 83.3 78.5 76.9 75.3 73.5Ang Mo Kio 99.1 90.4 88.2 87.2 85.7 84.1Hougang 90.4 87.2 84.2 82.3 80.3 77.8Punggol 68.7 71.5 65.8 66.2 66.1 65.2Sengkang 87.3 81.1 78.0 75.7 73.8 72.5Serangoon 93.0 86.7 84.2 82.2 81.1 80.2North Region 88.2 89.1 87.4 84.3 83.5 81.1Sembawang 86.0 86.4 86.5 83.2 82.6 81.6Woodlands 88.3 91.0 89.0 87.1 85.9 84.2Yishun 90.3 87.0 84.1 79.3 79.7 75.2West Region 92.8 89.7 87.1 85.9 84.1 81.5Bukit Batok 83.7 80.3 77.6 76.9 76.5 75.1Bukit Panjang 90.1 87.4 83.7 81.9 78.7 76.8Choa Chu Kang 92.3 88.9 87.4 86.1 84.5 79.4Clementi 93.9 84.4 79.6 78.3 76.5 76.4Jurong East 96.8 92.2 89.6 89.9 88.0 85.1Jurong West 95.7 95.2 93.3 92.2 91.1 89.6
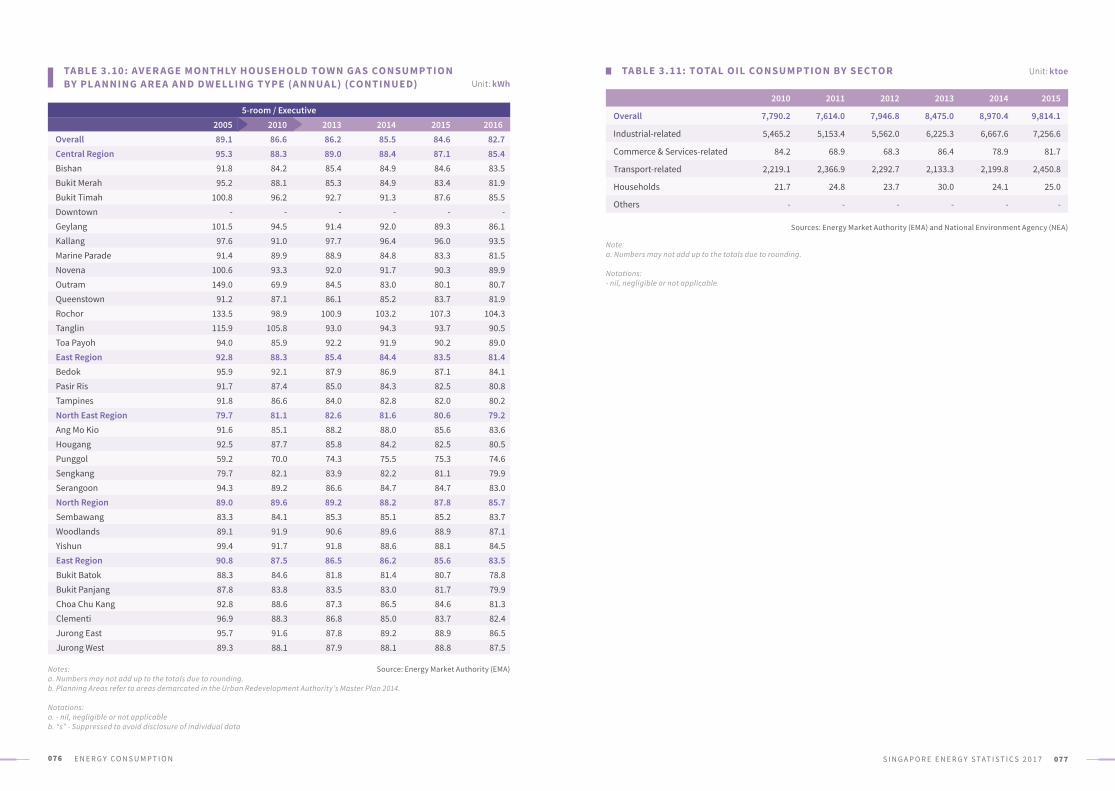
076 E N E R G Y C O N S U M P T I O N 077S I N G A P O R E E N E R G Y S TAT I S T I C S 2 0 1 7
5-room / Executive2005 2010 2013 2014 2015 2016
Overall 89.1 86.6 86.2 85.5 84.6 82.7Central Region 95.3 88.3 89.0 88.4 87.1 85.4Bishan 91.8 84.2 85.4 84.9 84.6 83.5Bukit Merah 95.2 88.1 85.3 84.9 83.4 81.9Bukit Timah 100.8 96.2 92.7 91.3 87.6 85.5Downtown - - - - - -Geylang 101.5 94.5 91.4 92.0 89.3 86.1Kallang 97.6 91.0 97.7 96.4 96.0 93.5Marine Parade 91.4 89.9 88.9 84.8 83.3 81.5Novena 100.6 93.3 92.0 91.7 90.3 89.9Outram 149.0 69.9 84.5 83.0 80.1 80.7Queenstown 91.2 87.1 86.1 85.2 83.7 81.9Rochor 133.5 98.9 100.9 103.2 107.3 104.3Tanglin 115.9 105.8 93.0 94.3 93.7 90.5Toa Payoh 94.0 85.9 92.2 91.9 90.2 89.0East Region 92.8 88.3 85.4 84.4 83.5 81.4Bedok 95.9 92.1 87.9 86.9 87.1 84.1Pasir Ris 91.7 87.4 85.0 84.3 82.5 80.8Tampines 91.8 86.6 84.0 82.8 82.0 80.2North East Region 79.7 81.1 82.6 81.6 80.6 79.2Ang Mo Kio 91.6 85.1 88.2 88.0 85.6 83.6Hougang 92.5 87.7 85.8 84.2 82.5 80.5Punggol 59.2 70.0 74.3 75.5 75.3 74.6Sengkang 79.7 82.1 83.9 82.2 81.1 79.9Serangoon 94.3 89.2 86.6 84.7 84.7 83.0North Region 89.0 89.6 89.2 88.2 87.8 85.7Sembawang 83.3 84.1 85.3 85.1 85.2 83.7Woodlands 89.1 91.9 90.6 89.6 88.9 87.1Yishun 99.4 91.7 91.8 88.6 88.1 84.5East Region 90.8 87.5 86.5 86.2 85.6 83.5Bukit Batok 88.3 84.6 81.8 81.4 80.7 78.8Bukit Panjang 87.8 83.8 83.5 83.0 81.7 79.9Choa Chu Kang 92.8 88.6 87.3 86.5 84.6 81.3Clementi 96.9 88.3 86.8 85.0 83.7 82.4Jurong East 95.7 91.6 87.8 89.2 88.9 86.5Jurong West 89.3 88.1 87.9 88.1 88.8 87.5
Source: Energy Market Authority (EMA)
Unit: kWhTA BLE 3.11: TOTA L OIL CONSUMP TION BY SEC TOR
2010 2011 2012 2013 2014 2015
Overall 7,790.2 7,614.0 7,946.8 8,475.0 8,970.4 9,814.1
Industrial-related 5,465.2 5,153.4 5,562.0 6,225.3 6,667.6 7,256.6
Commerce & Services-related 84.2 68.9 68.3 86.4 78.9 81.7
Transport-related 2,219.1 2,366.9 2,292.7 2,133.3 2,199.8 2,450.8
Households 21.7 24.8 23.7 30.0 24.1 25.0
Others - - - - - -
Sources: Energy Market Authority (EMA) and National Environment Agency (NEA)
Note:a. Numbers may not add up to the totals due to rounding.
Notations:- nil, negligible or not applicable
Unit: ktoeTA BLE 3.10: AV ER AGE MONTHLY HOUSEHOLD TOWN G A S CONSUMP TION BY PL A NNING A RE A A ND DWELLING T Y PE (A NNUA L) (CONTINUED)
Notes:a. Numbers may not add up to the totals due to rounding.b. Planning Areas refer to areas demarcated in the Urban Redevelopment Authority’s Master Plan 2014.
Notations:a. - nil, negligible or not applicable b. “s” - Suppressed to avoid disclosure of individual data

078 E N E R G Y C O N S U M P T I O N 079S I N G A P O R E E N E R G Y S TAT I S T I C S 2 0 1 7
TA BLE 3.12: TOTA L FIN A L ENERGY CONSUMP TION TA BLE 3.12: TOTA L FIN A L ENERGY CONSUMP TION (CONTINUED)Unit: ktoe Unit: ktoe
2010 Coal & Peat
Crude Oil
Petroleum Products
Natural Gas Electricity Others Total
Total Transformation Sector 7.8 - 7,790.2 1,128.3 3,632.8 - 12,559.1
Industrial-related 7.8 - 5,465.2 974.5 1,518.6 - 7,966.1
Commerce & Services-related - - 84.2 78.3 1,330.1 - 1,492.6
Transport-related - - 2,219.1 20.8 180.4 - 2,420.4
Households - - 21.7 53.9 570.6 - 646.2
Others - - - 0.8 33.1 - 33.9
2013 Coal & Peat
Crude Oil
Petroleum Products
Natural Gas Electricity Others Total
Total Transformation Sector 129.0 - 8,475.0 1,311.7 3,864.7 - 13,780.4
Industrial-related 129.0 - 6,225.3 1,145.9 1,620.1 - 9,120.4
Commerce & Services-related - - 86.4 89.3 1,437.5 - 1,613.2
Transport-related - - 2,133.3 18.1 203.7 - 2,355.1
Households - - 30.0 57.5 580.8 - 668.3
Others - - - 0.8 22.6 - 23.4
2011 Coal & Peat
Crude Oil
Petroleum Products
Natural Gas Electricity Others Total
Total Transformation Sector 6.4 - 7,614.0 1,184.0 3,697.8 - 12,502.2
Industrial-related 6.4 - 5,153.4 1,019.8 1,554.3 - 7,733.8
Commerce & Services-related - - 68.9 82.4 1,365.0 - 1,516.4
Transport-related - - 2,366.9 25.9 191.2 - 2,584.1
Households - - 24.8 55.2 557.4 - 637.3
Others - - - 0.8 29.8 - 30.6
2014 Coal & Peat
Crude Oil
Petroleum Products
Natural Gas Electricity Others Total
Total Transformation Sector 162.2 - 8,970.4 1,352.4 3,989.7 - 14,474.7
Industrial-related 162.2 - 6,667.6 1,190.0 1,698.4 - 9,718.2
Commerce & Services-related - - 78.9 85.3 1,465.7 - 1,629.8
Transport-related - - 2,199.8 17.4 209.9 - 2,427.1
Households - - 24.1 58.9 595.4 - 678.3
Others - - - 0.8 20.4 - 21.3
2012 Coal & Peat
Crude Oil
Petroleum Products
Natural Gas Electricity Others Total
Total Transformation Sector 23.0 - 7,946.8 1,126.2 3,800.4 - 12,896.3
Industrial-related 23.0 - 5,562.0 966.0 1,596.9 - 8,147.9
Commerce & Services-related - - 68.3 82.5 1,407.2 - 1,558.0
Transport-related - - 2,292.7 20.0 200.2 - 2,512.9
Households - - 23.7 56.9 570.0 - 650.6
Others - - - 0.8 26.1 - 26.9
2015 Coal & Peat
Crude Oil
Petroleum Products
Natural Gas Electricity Others Total
Total Transformation Sector 163.3 - 9,814.1 1,339.8 4,085.2 - 15,402.5
Industrial-related 163.3 - 7,256.6 1,175.5 1,727.2 - 10,322.5
Commerce & Services-related - - 81.7 88.2 1,503.0 - 1,672.9
Transport-related - - 2,450.8 14.3 210.2 - 2,675.4
Households - - 25.0 59.9 620.9 - 705.7
Others - - - 2.0 24.0 - 26.0
Sources: Energy Market Authority (EMA), Civil Aviation Authority of Singapore (CAAS), International Enterprise (IE) Singapore, Maritime and Port Authority (MPA), National Environment Agency (NEA) and Department of Statistics (DOS)
Note:a. Figures may not add up to the totals due to rounding.
Notations:- nil, negligible or not applicable
080 081E N E R G Y B A L A N C E S S I N G A P O R E E N E R G Y S TAT I S T I C S 2 0 1 7
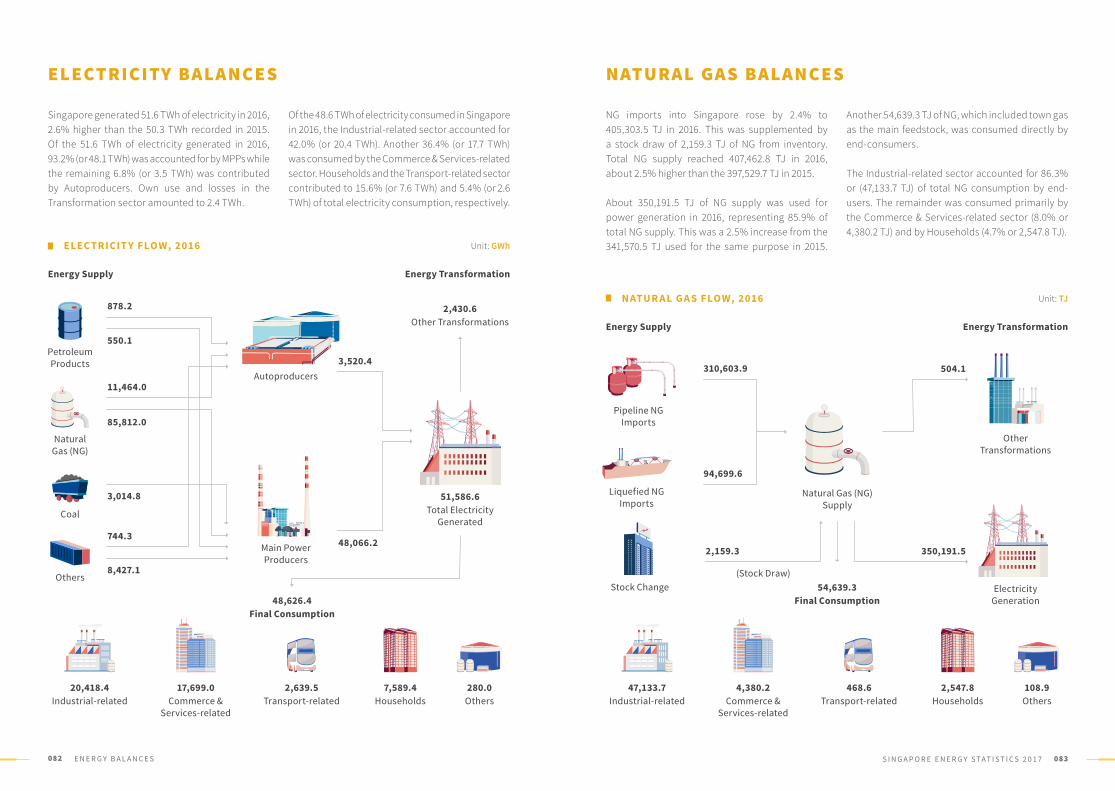
082 083E N E R G Y B A L A N C E S S I N G A P O R E E N E R G Y S TAT I S T I C S 2 0 1 7
ELECTRICITY BALANCES
ELEC TRICIT Y FLOW, 2016
NATUR AL GA S FLOW, 2016
Singapore generated 51.6 TWh of electricity in 2016, 2.6% higher than the 50.3 TWh recorded in 2015. Of the 51.6 TWh of electricity generated in 2016, 93.2% (or 48.1 TWh) was accounted for by MPPs while the remaining 6.8% (or 3.5 TWh) was contributed by Autoproducers. Own use and losses in the Transformation sector amounted to 2.4 TWh.
Of the 48.6 TWh of electricity consumed in Singapore in 2016, the Industrial-related sector accounted for 42.0% (or 20.4 TWh). Another 36.4% (or 17.7 TWh) was consumed by the Commerce & Services-related sector. Households and the Transport-related sector contributed to 15.6% (or 7.6 TWh) and 5.4% (or 2.6 TWh) of total electricity consumption, respectively.
NATURAL GAS BALANCES
Another 54,639.3 TJ of NG, which included town gas as the main feedstock, was consumed directly by end-consumers.
The Industrial-related sector accounted for 86.3% or (47,133.7 TJ) of total NG consumption by end-users. The remainder was consumed primarily by the Commerce & Services-related sector (8.0% or 4,380.2 TJ) and by Households (4.7% or 2,547.8 TJ).
NG imports into Singapore rose by 2.4% to 405,303.5 TJ in 2016. This was supplemented by a stock draw of 2,159.3 TJ of NG from inventory. Total NG supply reached 407,462.8 TJ in 2016, about 2.5% higher than the 397,529.7 TJ in 2015.
About 350,191.5 TJ of NG supply was used for power generation in 2016, representing 85.9% of total NG supply. This was a 2.5% increase from the 341,570.5 TJ used for the same purpose in 2015.
Autoproducers
Petroleum Products
Natural Gas (NG)
Coal
Others
Main PowerProducers
51,586.6Total Electricity
Generated
2,430.6Other Transformations
8,427.1
3,014.8
744.3
85,812.0
550.1
11,464.0
878.2
3,520.4
48,066.2
Unit: GWh
Unit: TJ
Pipeline NG Imports
Liquefied NGImports
Stock Change(Stock Draw)
Energy Supply
Energy Supply
Energy Transformation
Energy Transformation
Natural Gas (NG)Supply
310,603.9
94,699.6
2,159.3 350,191.5
54,639.3 Final Consumption48,626.4
Final Consumption
20,418.4Industrial-related
17,699.0Commerce &
Services-related
2,639.5Transport-related
280.0 Others
7,589.4Households
47,133.7Industrial-related
4,380.2Commerce &
Services-related
468.6Transport-related
108.9 Others
2,547.8Households
ElectricityGeneration
OtherTransformations
504.1
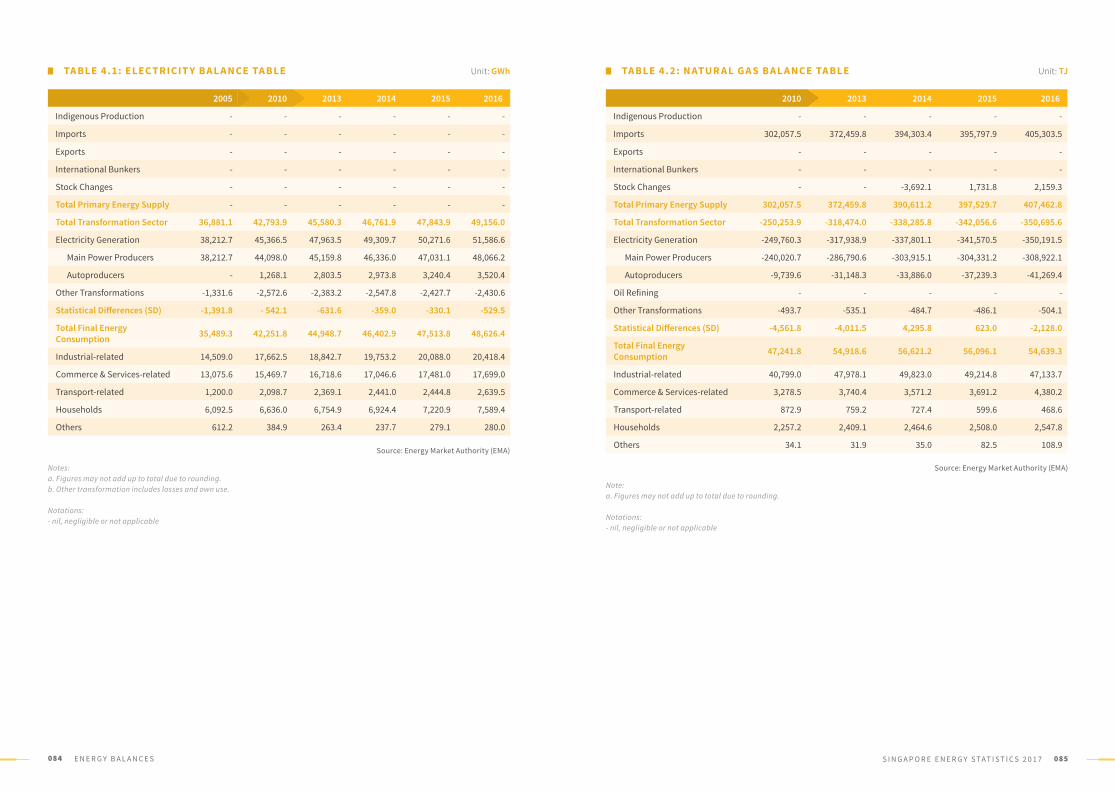
084 085E N E R G Y B A L A N C E S S I N G A P O R E E N E R G Y S TAT I S T I C S 2 0 1 7
TABLE 4.1: ELEC TRICIT Y BAL ANCE TABLE TABLE 4. 2: NATUR AL GA S BAL ANCE TABLEUnit: GWh Unit: TJ
2005 2010 2013 2014 2015 2016
Indigenous Production - - - - - -
Imports - - - - - -
Exports - - - - - -
International Bunkers - - - - - -
Stock Changes - - - - - -
Total Primary Energy Supply - - - - - -
Total Transformation Sector 36,881.1 42,793.9 45,580.3 46,761.9 47,843.9 49,156.0
Electricity Generation 38,212.7 45,366.5 47,963.5 49,309.7 50,271.6 51,586.6
Main Power Producers 38,212.7 44,098.0 45,159.8 46,336.0 47,031.1 48,066.2
Autoproducers - 1,268.1 2,803.5 2,973.8 3,240.4 3,520.4
Other Transformations -1,331.6 -2,572.6 -2,383.2 -2,547.8 -2,427.7 -2,430.6
Statistical Differences (SD) -1,391.8 - 542.1 -631.6 -359.0 -330.1 -529.5
Total Final Energy Consumption 35,489.3 42,251.8 44,948.7 46,402.9 47,513.8 48,626.4
Industrial-related 14,509.0 17,662.5 18,842.7 19,753.2 20,088.0 20,418.4
Commerce & Services-related 13,075.6 15,469.7 16,718.6 17,046.6 17,481.0 17,699.0
Transport-related 1,200.0 2,098.7 2,369.1 2,441.0 2,444.8 2,639.5
Households 6,092.5 6,636.0 6,754.9 6,924.4 7,220.9 7,589.4
Others 612.2 384.9 263.4 237.7 279.1 280.0
2010 2013 2014 2015 2016
Indigenous Production - - - - -
Imports 302,057.5 372,459.8 394,303.4 395,797.9 405,303.5
Exports - - - - -
International Bunkers - - - - -
Stock Changes - - -3,692.1 1,731.8 2,159.3
Total Primary Energy Supply 302,057.5 372,459.8 390,611.2 397,529.7 407,462.8
Total Transformation Sector -250,253.9 -318,474.0 -338,285.8 -342,056.6 -350,695.6
Electricity Generation -249,760.3 -317,938.9 -337,801.1 -341,570.5 -350,191.5
Main Power Producers -240,020.7 -286,790.6 -303,915.1 -304,331.2 -308,922.1
Autoproducers -9,739.6 -31,148.3 -33,886.0 -37,239.3 -41,269.4
Oil Refining - - - - -
Other Transformations -493.7 -535.1 -484.7 -486.1 -504.1
Statistical Differences (SD) -4,561.8 -4,011.5 4,295.8 623.0 -2,128.0
Total Final Energy Consumption 47,241.8 54,918.6 56,621.2 56,096.1 54,639.3
Industrial-related 40,799.0 47,978.1 49,823.0 49,214.8 47,133.7
Commerce & Services-related 3,278.5 3,740.4 3,571.2 3,691.2 4,380.2
Transport-related 872.9 759.2 727.4 599.6 468.6
Households 2,257.2 2,409.1 2,464.6 2,508.0 2,547.8
Others 34.1 31.9 35.0 82.5 108.9 Source: Energy Market Authority (EMA)
Source: Energy Market Authority (EMA)Notes:a. Figures may not add up to total due to rounding. b. Other transformation includes losses and own use.
Notations:- nil, negligible or not applicable
Note:a. Figures may not add up to total due to rounding.
Notations:- nil, negligible or not applicable
086 E N E R G Y P R I C E S 087S I N G A P O R E E N E R G Y S TAT I S T I C S 2 0 1 7
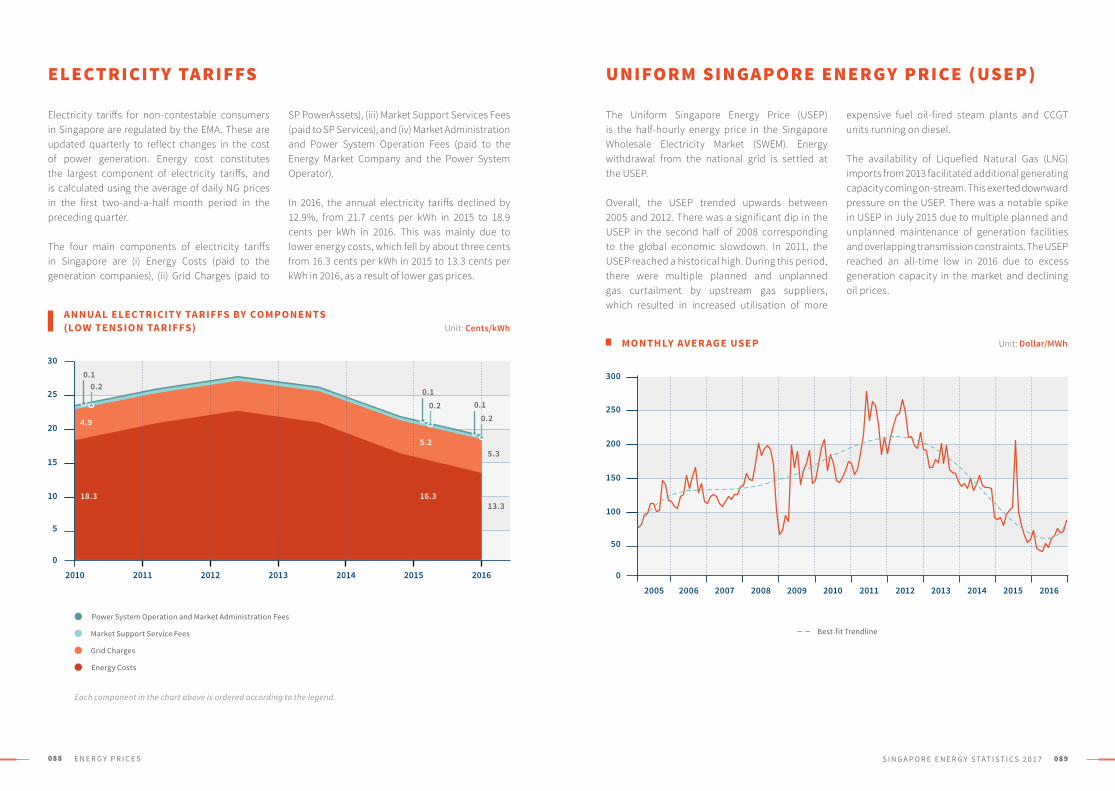
088 E N E R G Y P R I C E S 089S I N G A P O R E E N E R G Y S TAT I S T I C S 2 0 1 7
ELECTRICITY TARIFFS UNIFORM SINGAPORE ENERGY PRICE (USEP)
expensive fuel oil-fired steam plants and CCGT units running on diesel.
The availability of Liquefied Natural Gas (LNG) imports from 2013 facilitated additional generating capacity coming on-stream. This exerted downward pressure on the USEP. There was a notable spike in USEP in July 2015 due to multiple planned and unplanned maintenance of generation facilities and overlapping transmission constraints. The USEP reached an all-time low in 2016 due to excess generation capacity in the market and declining oil prices.
SP PowerAssets), (iii) Market Support Services Fees (paid to SP Services), and (iv) Market Administration and Power System Operation Fees (paid to the Energy Market Company and the Power System Operator).
In 2016, the annual electricity tariffs declined by 12.9%, from 21.7 cents per kWh in 2015 to 18.9 cents per kWh in 2016. This was mainly due to lower energy costs, which fell by about three cents from 16.3 cents per kWh in 2015 to 13.3 cents per kWh in 2016, as a result of lower gas prices.
The Uniform Singapore Energy Price (USEP) is the half-hourly energy price in the Singapore Wholesale Electricity Market (SWEM). Energy withdrawal from the national grid is settled at the USEP.
Overall, the USEP trended upwards between 2005 and 2012. There was a significant dip in the USEP in the second half of 2008 corresponding to the global economic slowdown. In 2011, the USEP reached a historical high. During this period, there were multiple planned and unplanned gas curtailment by upstream gas suppliers, which resulted in increased utilisation of more
Electricity tariffs for non-contestable consumers in Singapore are regulated by the EMA. These are updated quarterly to reflect changes in the cost of power generation. Energy cost constitutes the largest component of electricity tariffs, and is calculated using the average of daily NG prices in the first two-and-a-half month period in the preceding quarter.
The four main components of electricity tariffs in Singapore are (i) Energy Costs (paid to the generation companies), (ii) Grid Charges (paid to
Unit: Cents/kWh
Unit: Dollar/MWh
ANNUAL ELEC TRICIT Y TARIFFS BY COMPONENTS (LOW TENSION TARIFFS)
MONTHLY AVER AGE USEP
5
0
10
20
25
30
15
2010 2011 2012 2013 2014 2015 2016
18.3
4.9
0.1
0.10.2
0.2
16.3
5.2
50
0
100
200
250
300
150
2005 2006 2007 2008 2009 2010 2011 2012 2013 2014 2015 2016
Best-fit Trendline
Power System Operation and Market Administration Fees
Grid Charges
Energy Costs
Market Support Service Fees
0.10.2
13.3
5.3
Each component in the chart above is ordered according to the legend.
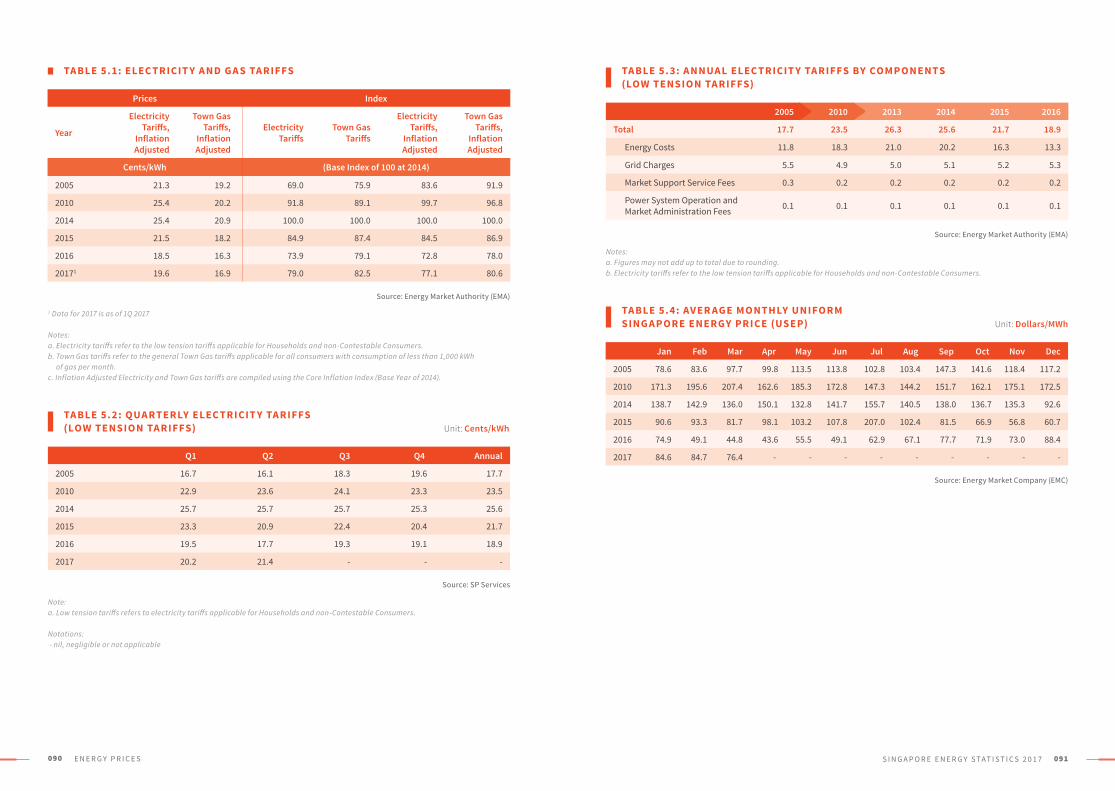
090 E N E R G Y P R I C E S 091S I N G A P O R E E N E R G Y S TAT I S T I C S 2 0 1 7
TABLE 5.1: ELEC TRICIT Y AND GA S TARIFFS TABLE 5. 3: ANNUAL ELEC TRICIT Y TARIFFS BY COMPONENTS (LOW TENSION TARIFFS)
TABLE 5.4: AVER AGE MONTHLY UNIFORM SINGAPORE ENERGY PRICE (USEP)
Prices Index
Year
Electricity Tariffs,
Inflation Adjusted
Town Gas Tariffs,
Inflation Adjusted
Electricity Tariffs
Town Gas Tariffs
Electricity Tariffs,
Inflation Adjusted
Town Gas Tariffs,
Inflation Adjusted
Cents/kWh (Base Index of 100 at 2014)
2005 21.3 19.2 69.0 75.9 83.6 91.9
2010 25.4 20.2 91.8 89.1 99.7 96.8
2014 25.4 20.9 100.0 100.0 100.0 100.0
2015 21.5 18.2 84.9 87.4 84.5 86.9
2016 18.5 16.3 73.9 79.1 72.8 78.0
20171 19.6 16.9 79.0 82.5 77.1 80.6
Source: Energy Market Authority (EMA)
Source: Energy Market Authority (EMA)
Source: Energy Market Company (EMC)
1 Data for 2017 is as of 1Q 2017
Notes:a. Electricity tariffs refer to the low tension tariffs applicable for Households and non-Contestable Consumers. b. Town Gas tariffs refer to the general Town Gas tariffs applicable for all consumers with consumption of less than 1,000 kWh of gas per month. c. Inflation Adjusted Electricity and Town Gas tariffs are compiled using the Core Inflation Index (Base Year of 2014).
Notes:a. Figures may not add up to total due to rounding.b. Electricity tariffs refer to the low tension tariffs applicable for Households and non-Contestable Consumers.
TABLE 5. 2: QUARTERLY ELEC TRICIT Y TARIFFS (LOW TENSION TARIFFS) Unit: Cents/kWh
Unit: Dollars/MWh
Q1 Q2 Q3 Q4 Annual
2005 16.7 16.1 18.3 19.6 17.7
2010 22.9 23.6 24.1 23.3 23.5
2014 25.7 25.7 25.7 25.3 25.6
2015 23.3 20.9 22.4 20.4 21.7
2016 19.5 17.7 19.3 19.1 18.9
2017 20.2 21.4 - - -
Source: SP Services
Note:a. Low tension tariffs refers to electricity tariffs applicable for Households and non-Contestable Consumers. Notations: - nil, negligible or not applicable
2005 2010 2013 2014 2015 2016
Total 17.7 23.5 26.3 25.6 21.7 18.9
Energy Costs 11.8 18.3 21.0 20.2 16.3 13.3
Grid Charges 5.5 4.9 5.0 5.1 5.2 5.3
Market Support Service Fees 0.3 0.2 0.2 0.2 0.2 0.2
Power System Operation and Market Administration Fees 0.1 0.1 0.1 0.1 0.1 0.1
Jan Feb Mar Apr May Jun Jul Aug Sep Oct Nov Dec
2005 78.6 83.6 97.7 99.8 113.5 113.8 102.8 103.4 147.3 141.6 118.4 117.2
2010 171.3 195.6 207.4 162.6 185.3 172.8 147.3 144.2 151.7 162.1 175.1 172.5
2014 138.7 142.9 136.0 150.1 132.8 141.7 155.7 140.5 138.0 136.7 135.3 92.6
2015 90.6 93.3 81.7 98.1 103.2 107.8 207.0 102.4 81.5 66.9 56.8 60.7
2016 74.9 49.1 44.8 43.6 55.5 49.1 62.9 67.1 77.7 71.9 73.0 88.4
2017 84.6 84.7 76.4 - - - - - - - - -
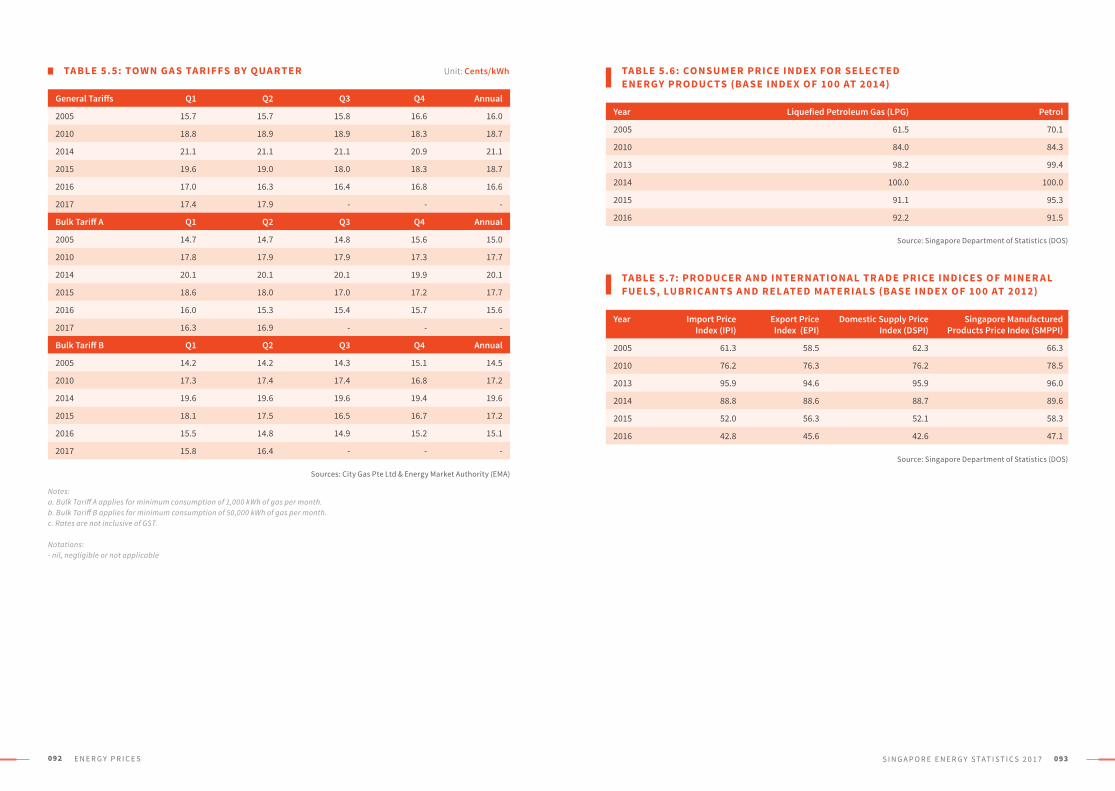
092 E N E R G Y P R I C E S 093S I N G A P O R E E N E R G Y S TAT I S T I C S 2 0 1 7
TABLE 5. 5: TOWN GA S TARIFFS BY QUARTER TABLE 5.6: CONSUMER PRICE INDE X FOR SELEC TED ENERGY PRODUC TS (BA SE INDE X OF 10 0 AT 2014)
TABLE 5.7: PRODUCER AND INTERNATIONAL TR ADE PRICE INDICES OF MINER AL FUELS, LUBRIC ANTS AND REL ATED MATERIALS (BA SE INDE X OF 10 0 AT 2012)
Unit: Cents/kWh
General Tariffs Q1 Q2 Q3 Q4 Annual
2005 15.7 15.7 15.8 16.6 16.0
2010 18.8 18.9 18.9 18.3 18.7
2014 21.1 21.1 21.1 20.9 21.1
2015 19.6 19.0 18.0 18.3 18.7
2016 17.0 16.3 16.4 16.8 16.6
2017 17.4 17.9 - - -
Year Liquefied Petroleum Gas (LPG) Petrol
2005 61.5 70.1
2010 84.0 84.3
2013 98.2 99.4
2014 100.0 100.0
2015 91.1 95.3
2016 92.2 91.5
Year Import Price Index (IPI)
Export Price Index (EPI)
Domestic Supply Price Index (DSPI)
Singapore Manufactured Products Price Index (SMPPI)
2005 61.3 58.5 62.3 66.3
2010 76.2 76.3 76.2 78.5
2013 95.9 94.6 95.9 96.0
2014 88.8 88.6 88.7 89.6
2015 52.0 56.3 52.1 58.3
2016 42.8 45.6 42.6 47.1
Bulk Tariff A Q1 Q2 Q3 Q4 Annual
2005 14.7 14.7 14.8 15.6 15.0
2010 17.8 17.9 17.9 17.3 17.7
2014 20.1 20.1 20.1 19.9 20.1
2015 18.6 18.0 17.0 17.2 17.7
2016 16.0 15.3 15.4 15.7 15.6
2017 16.3 16.9 - - -
Bulk Tariff B Q1 Q2 Q3 Q4 Annual
2005 14.2 14.2 14.3 15.1 14.5
2010 17.3 17.4 17.4 16.8 17.2
2014 19.6 19.6 19.6 19.4 19.6
2015 18.1 17.5 16.5 16.7 17.2
2016 15.5 14.8 14.9 15.2 15.1
2017 15.8 16.4 - - -
Sources: City Gas Pte Ltd & Energy Market Authority (EMA)
Source: Singapore Department of Statistics (DOS)
Source: Singapore Department of Statistics (DOS)
Notes:a. Bulk Tariff A applies for minimum consumption of 1,000 kWh of gas per month. b. Bulk Tariff B applies for minimum consumption of 50,000 kWh of gas per month. c. Rates are not inclusive of GST. Notations:- nil, negligible or not applicable
094 S O L A R 095S I N G A P O R E E N E R G Y S TAT I S T I C S 2 0 1 7

096 S O L A R 097S I N G A P O R E E N E R G Y S TAT I S T I C S 2 0 1 7
INSTALLED CAPACITY & NUMBER OF GRID-CONNECTED SOLAR PHOTOVOLTAIC (PV) SYSTEMS
The majority of solar PV capacity were accounted for by non-residential private sector installations (45.9% of total installed capacity or 45.9 MWac) and town councils & grassroots units (44.7% or 44.7 MWac). Residential installations (4.7 MWac) and installations by public service agencies (4.6 MWac) contributed to the remaining solar PV capacity.
The adoption of solar PV systems in Singapore accelerated in the last three years. Grid-connected installed capacity of solar PV systems sharply increased from 25.5 MWac in 2014 to 46.0 MWac in 2015, and subsequently to 99.9 MWac by the end of 1Q 2017.
SOLAR PV INSTALLATIONS BY PLANNING REGION
A considerable proportion (42.9%) of PV systems in the north-east region were residential installations, which were significantly smaller in capacity. Hence, the installed capacity from this region (15.5 MWac or 15.5% of total capacity) was disproportionately smaller compared to its corresponding share of installed system (25.4%).
At the end of 1Q 2017, the west region of Singapore had the highest solar PV capacity totalling 37.6 MWac from 387 installations. This was 37.6% of the total installed capacity of 99.9 MWac as at the same period. However, most solar PV systems were located in the north-east region (482 installations).
SOL AR PV C APACIT Y (A S AT END PERIOD)
NUMBER OF GRID - CONNEC TED SOL AR PV INSTALL ATIONS
Installed Capacity Unit: MWac
20
0
40
80
100
60
Town Councils & Grassroots Units Private Sector ResidentialPublic Service Agencies
20092008 2010 2011 2012 2013 2014 2015 1Q 20172016
DISTRIBUTION OF SOL AR INSTALL ATIONS IN SINGAPORE, 1Q 2017
22.8 MWacEast
11.9 MWacCentral
37.6 MWacWest
15.5 MWacNorth-east
12.3 MWacNorth
387 Installations
234 Installations
424 Installations
482 Installations
371 Installations
There were 1,898 systems installations as at the end of 1Q 2017. Town councils & grassroots units accounted for 50.9% (or 966 installations) of total installations, followed by the residential (31.0% or
589 installations) and private sectors (13.2% or 251 installations). Public service agencies constituted the remaining 4.8% (or 92 installations) of total installations.
97.1 99.9
4.02.9 4.6
4.3
3.1
4.7
43.8
11.6
44.7
45.1
28.4
45.9
46.0
0.3
500
0
1000
2000
1500
Town Councils & Grassroots Units Private Sector ResidentialPublic Service Agencies
20092008 2010 2011 2012 2013 2014 2015 1Q 20172016
943
1,836
943
1,898
309085
288209361
92
550 589
946 966
250 251
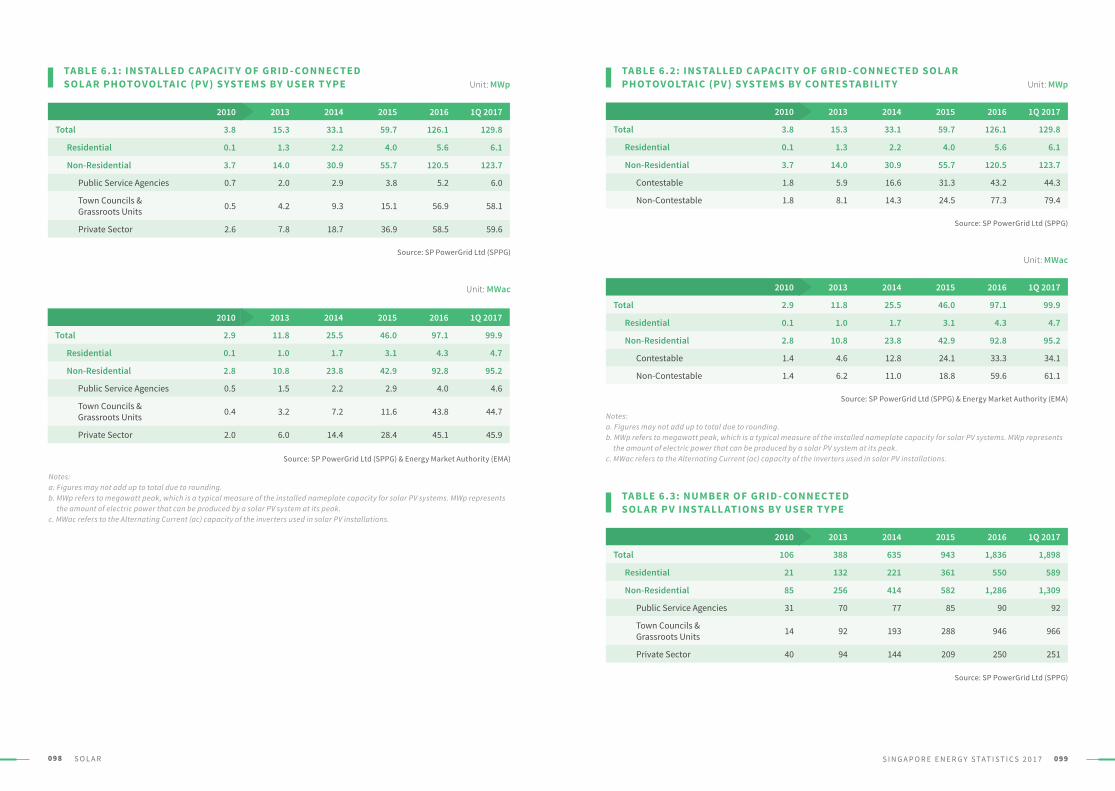
098 S O L A R 099S I N G A P O R E E N E R G Y S TAT I S T I C S 2 0 1 7
TABLE 6. 2: INSTALLED C APACIT Y OF GRID - CONNEC TED SOL AR PHOTOVOLTAIC (PV ) SYSTEMS BY CONTESTABILIT Y
TABLE 6. 3: NUMBER OF GRID - CONNEC TED SOL AR PV INSTALL ATIONS BY USER T YPE
Source: SP PowerGrid Ltd (SPPG)
Source: SP PowerGrid Ltd (SPPG)
Source: SP PowerGrid Ltd (SPPG) & Energy Market Authority (EMA)
Unit: MWp
Unit: MWac
2010 2013 2014 2015 2016 1Q 2017
Total 3.8 15.3 33.1 59.7 126.1 129.8
Residential 0.1 1.3 2.2 4.0 5.6 6.1
Non-Residential 3.7 14.0 30.9 55.7 120.5 123.7
Contestable 1.8 5.9 16.6 31.3 43.2 44.3
Non-Contestable 1.8 8.1 14.3 24.5 77.3 79.4
2010 2013 2014 2015 2016 1Q 2017
Total 106 388 635 943 1,836 1,898
Residential 21 132 221 361 550 589
Non-Residential 85 256 414 582 1,286 1,309
Public Service Agencies 31 70 77 85 90 92
Town Councils & Grassroots Units 14 92 193 288 946 966
Private Sector 40 94 144 209 250 251
2010 2013 2014 2015 2016 1Q 2017
Total 2.9 11.8 25.5 46.0 97.1 99.9
Residential 0.1 1.0 1.7 3.1 4.3 4.7
Non-Residential 2.8 10.8 23.8 42.9 92.8 95.2
Contestable 1.4 4.6 12.8 24.1 33.3 34.1
Non-Contestable 1.4 6.2 11.0 18.8 59.6 61.1
Notes:a. Figures may not add up to total due to rounding. b. MWp refers to megawatt peak, which is a typical measure of the installed nameplate capacity for solar PV systems. MWp represents the amount of electric power that can be produced by a solar PV system at its peak. c. MWac refers to the Alternating Current (ac) capacity of the inverters used in solar PV installations.
2010 2013 2014 2015 2016 1Q 2017
Total 3.8 15.3 33.1 59.7 126.1 129.8
Residential 0.1 1.3 2.2 4.0 5.6 6.1
Non-Residential 3.7 14.0 30.9 55.7 120.5 123.7
Public Service Agencies 0.7 2.0 2.9 3.8 5.2 6.0
Town Councils & Grassroots Units 0.5 4.2 9.3 15.1 56.9 58.1
Private Sector 2.6 7.8 18.7 36.9 58.5 59.6
2010 2013 2014 2015 2016 1Q 2017
Total 2.9 11.8 25.5 46.0 97.1 99.9
Residential 0.1 1.0 1.7 3.1 4.3 4.7
Non-Residential 2.8 10.8 23.8 42.9 92.8 95.2
Public Service Agencies 0.5 1.5 2.2 2.9 4.0 4.6
Town Councils & Grassroots Units 0.4 3.2 7.2 11.6 43.8 44.7
Private Sector 2.0 6.0 14.4 28.4 45.1 45.9
TABLE 6.1: INSTALLED C APACIT Y OF GRID - CONNEC TED SOL AR PHOTOVOLTAIC (PV ) SYSTEMS BY USER T YPE Unit: MWp
Source: SP PowerGrid Ltd (SPPG)
Unit: MWac
Source: SP PowerGrid Ltd (SPPG) & Energy Market Authority (EMA)
Notes:a. Figures may not add up to total due to rounding. b. MWp refers to megawatt peak, which is a typical measure of the installed nameplate capacity for solar PV systems. MWp represents the amount of electric power that can be produced by a solar PV system at its peak. c. MWac refers to the Alternating Current (ac) capacity of the inverters used in solar PV installations.
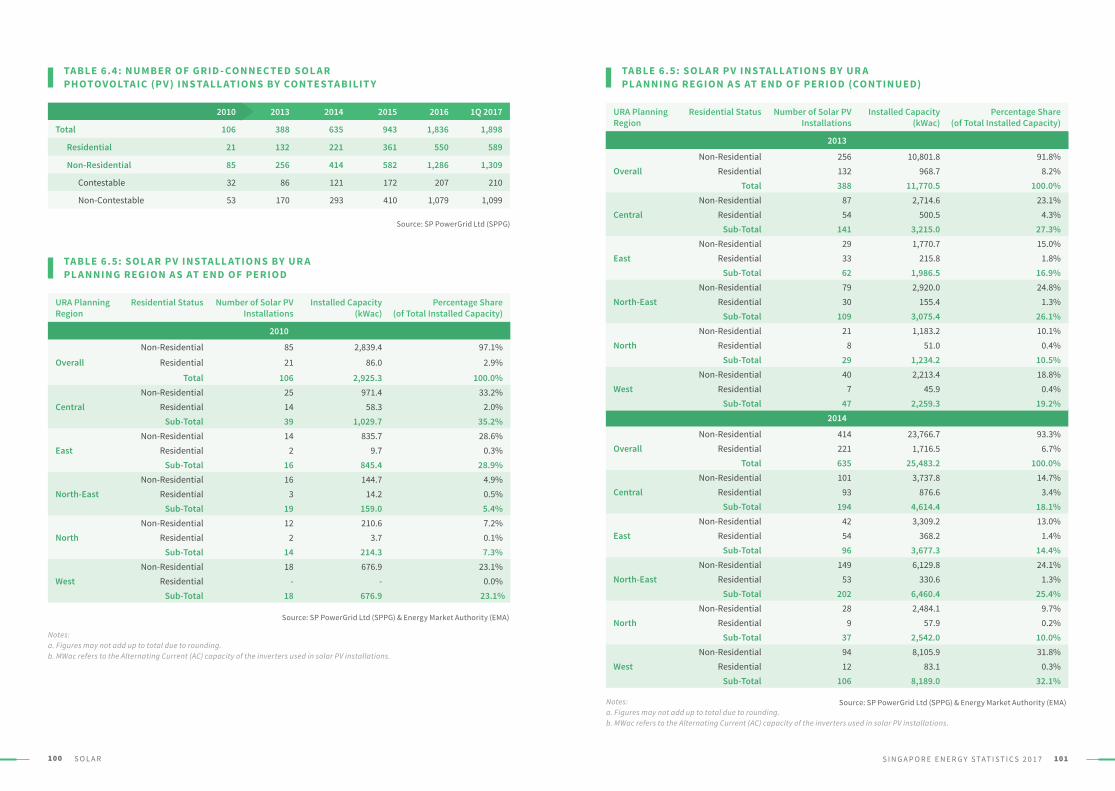
100 S O L A R 101S I N G A P O R E E N E R G Y S TAT I S T I C S 2 0 1 7
URA Planning Region
Residential Status Number of Solar PV Installations
Installed Capacity (kWac)
Percentage Share (of Total Installed Capacity)
2014
Non-Residential 414 23,766.7 93.3%Overall Residential 221 1,716.5 6.7%
Total 635 25,483.2 100.0%Non-Residential 101 3,737.8 14.7%
Central Residential 93 876.6 3.4%Sub-Total 194 4,614.4 18.1%
Non-Residential 42 3,309.2 13.0%East Residential 54 368.2 1.4%
Sub-Total 96 3,677.3 14.4%Non-Residential 149 6,129.8 24.1%
North-East Residential 53 330.6 1.3%Sub-Total 202 6,460.4 25.4%
Non-Residential 28 2,484.1 9.7%North Residential 9 57.9 0.2%
Sub-Total 37 2,542.0 10.0%Non-Residential 94 8,105.9 31.8%
West Residential 12 83.1 0.3%Sub-Total 106 8,189.0 32.1%
URA Planning Region
Residential Status Number of Solar PV Installations
Installed Capacity (kWac)
Percentage Share (of Total Installed Capacity)
2010
Non-Residential 85 2,839.4 97.1%Overall Residential 21 86.0 2.9%
Total 106 2,925.3 100.0%Non-Residential 25 971.4 33.2%
Central Residential 14 58.4 2.0%Sub-Total 39 1,029.7 35.2%
Non-Residential 14 835.7 28.6%East Residential 2 9.7 0.3%
Sub-Total 16 845.4 28.9%Non-Residential 16 144.7 4.9%
North-East Residential 3 14.2 0.5%Sub-Total 19 159.0 5.4%
Non-Residential 12 210.6 7.2%North Residential 2 3.7 0.1%
Sub-Total 14 214.3 7.3%Non-Residential 18 676.9 23.1%
West Residential - - 0.0%Sub-Total 18 676.9 23.1%
TABLE 6. 5: SOL AR PV INSTALL ATIONS BY UR A PL ANNING REGION A S AT END OF PERIOD
Source: SP PowerGrid Ltd (SPPG) & Energy Market Authority (EMA)
Source: SP PowerGrid Ltd (SPPG) & Energy Market Authority (EMA)
URA Planning Region
Residential Status Number of Solar PV Installations
Installed Capacity (kWac)
Percentage Share (of Total Installed Capacity)
2010
Non-Residential 85 2,839.4 97.1%
Overall Residential 21 86.0 2.9%
Total 106 2,925.3 100.0%Non-Residential 25 971.4 33.2%
Central Residential 14 58.3 2.0%Sub-Total 39 1,029.7 35.2%
Non-Residential 14 835.7 28.6%East Residential 2 9.7 0.3%
Sub-Total 16 845.4 28.9%Non-Residential 16 144.7 4.9%
North-East Residential 3 14.2 0.5%Sub-Total 19 159.0 5.4%
Non-Residential 12 210.6 7.2%North Residential 2 3.7 0.1%
Sub-Total 14 214.3 7.3%Non-Residential 18 676.9 23.1%
West Residential - - 0.0%Sub-Total 18 676.9 23.1%
Notes:a. Figures may not add up to total due to rounding. b. MWac refers to the Alternating Current (AC) capacity of the inverters used in solar PV installations.
Notes:a. Figures may not add up to total due to rounding. b. MWac refers to the Alternating Current (AC) capacity of the inverters used in solar PV installations.
TABLE 6.4: NUMBER OF GRID - CONNEC TED SOL AR PHOTOVOLTAIC (PV ) INSTALL ATIONS BY CONTESTABILIT Y
Source: SP PowerGrid Ltd (SPPG)
2010 2013 2014 2015 2016 1Q 2017
Total 106 388 635 943 1,836 1,898
Residential 21 132 221 361 550 589
Non-Residential 85 256 414 582 1,286 1,309
Contestable 32 86 121 172 207 210
Non-Contestable 53 170 293 410 1,079 1,099
TABLE 6. 5: SOL AR PV INSTALL ATIONS BY UR A PL ANNING REGION A S AT END OF PERIOD (CONTINUED)
2013
Non-Residential 256 10,801.8 91.8%Overall Residential 132 968.7 8.2%
Total 388 11,770.5 100.0%Non-Residential 87 2,714.6 23.1%
Central Residential 54 500.5 4.3%Sub-Total 141 3,215.0 27.3%
Non-Residential 29 1,770.7 15.0%East Residential 33 215.8 1.8%
Sub-Total 62 1,986.5 16.9%Non-Residential 79 2,920.0 24.8%
North-East Residential 30 155.4 1.3%Sub-Total 109 3,075.4 26.1%
Non-Residential 21 1,183.2 10.1%North Residential 8 51.0 0.4%
Sub-Total 29 1,234.2 10.5%Non-Residential 40 2,213.4 18.8%
West Residential 7 45.9 0.4%Sub-Total 47 2,259.3 19.2%
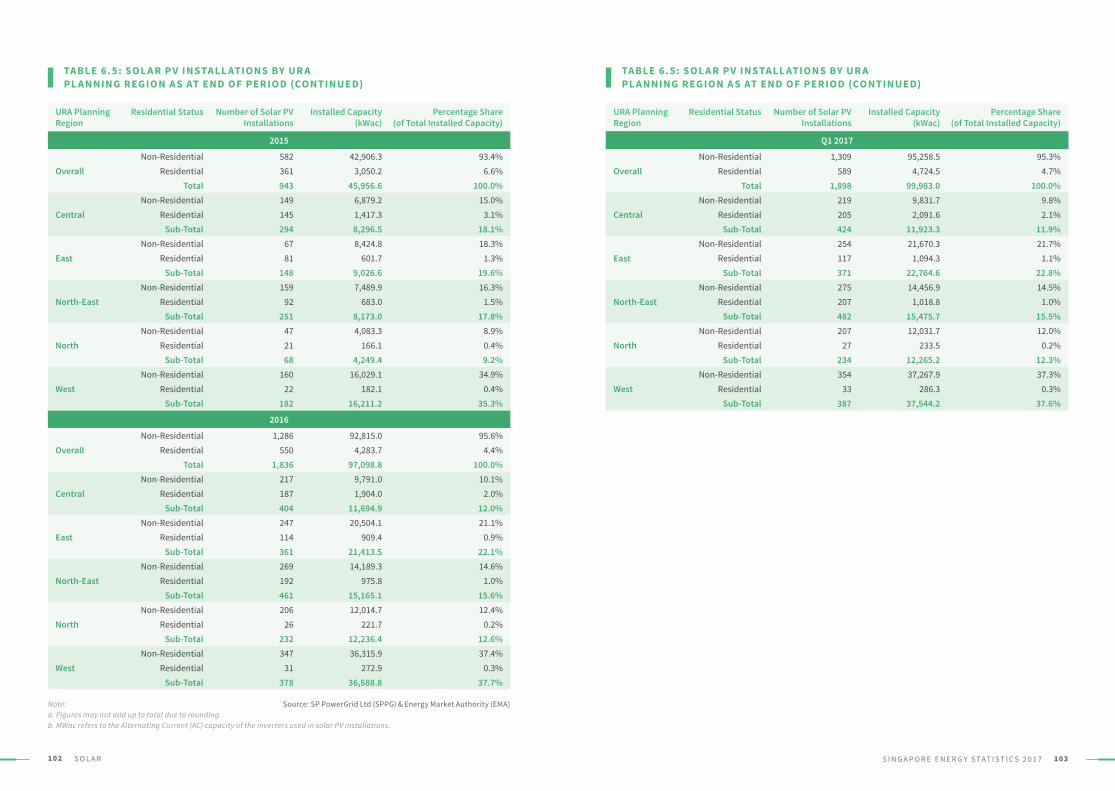
102 S O L A R 103S I N G A P O R E E N E R G Y S TAT I S T I C S 2 0 1 7
2016
Non-Residential 1,286 92,815.0 95.6%Overall Residential 550 4,283.7 4.4%
Total 1,836 97,098.8 100.0%Non-Residential 217 9,791.0 10.1%
Central Residential 187 1,904.0 2.0%Sub-Total 404 11,694.9 12.0%
Non-Residential 247 20,504.1 21.1%East Residential 114 909.4 0.9%
Sub-Total 361 21,413.5 22.1%Non-Residential 269 14,189.3 14.6%
North-East Residential 192 975.8 1.0%Sub-Total 461 15,165.1 15.6%
Non-Residential 206 12,014.7 12.4%North Residential 26 221.7 0.2%
Sub-Total 232 12,236.4 12.6%Non-Residential 347 36,315.9 37.4%
West Residential 31 272.9 0.3%Sub-Total 378 36,588.8 37.7%
TABLE 6. 5: SOL AR PV INSTALL ATIONS BY UR A PL ANNING REGION A S AT END OF PERIOD (CONTINUED)
Source: SP PowerGrid Ltd (SPPG) & Energy Market Authority (EMA)
URA Planning Region
Residential Status Number of Solar PV Installations
Installed Capacity (kWac)
Percentage Share (of Total Installed Capacity)
2015
Non-Residential 582 42,906.3 93.4%Overall Residential 361 3,050.2 6.6%
Total 943 45,956.6 100.0%Non-Residential 149 6,879.2 15.0%
Central Residential 145 1,417.3 3.1%Sub-Total 294 8,296.5 18.1%
Non-Residential 67 8,424.8 18.3%East Residential 81 601.7 1.3%
Sub-Total 148 9,026.6 19.6%Non-Residential 159 7,489.9 16.3%
North-East Residential 92 683.0 1.5%Sub-Total 251 8,173.0 17.8%
Non-Residential 47 4,083.3 8.9%North Residential 21 166.1 0.4%
Sub-Total 68 4,249.4 9.2%Non-Residential 160 16,029.1 34.9%
West Residential 22 182.1 0.4%Sub-Total 182 16,211.2 35.3%
Note:a. Figures may not add up to total due to rounding. b. MWac refers to the Alternating Current (AC) capacity of the inverters used in solar PV installations.
URA Planning Region
Residential Status Number of Solar PV Installations
Installed Capacity (kWac)
Percentage Share (of Total Installed Capacity)
2010
Non-Residential 85 2,839.4 97.1%Overall Residential 21 86.0 2.9%
Total 106 2,925.3 100.0%Non-Residential 25 971.4 33.2%
Central Residential 14 58.4 2.0%Sub-Total 39 1,029.7 35.2%
Non-Residential 14 835.7 28.6%East Residential 2 9.7 0.3%
Sub-Total 16 845.4 28.9%Non-Residential 16 144.7 4.9%
North-East Residential 3 14.2 0.5%Sub-Total 19 159.0 5.4%
Non-Residential 12 210.6 7.2%North Residential 2 3.7 0.1%
Sub-Total 14 214.3 7.3%Non-Residential 18 676.9 23.1%
West Residential - - 0.0%Sub-Total 18 676.9 23.1%
TABLE 6. 5: SOL AR PV INSTALL ATIONS BY UR A PL ANNING REGION A S AT END OF PERIOD (CONTINUED)
Q1 2017
Non-Residential 1,309 95,258.5 95.3%Overall Residential 589 4,724.5 4.7%
Total 1,898 99,983.0 100.0%Non-Residential 219 9,831.7 9.8%
Central Residential 205 2,091.6 2.1%Sub-Total 424 11,923.3 11.9%
Non-Residential 254 21,670.3 21.7%East Residential 117 1,094.3 1.1%
Sub-Total 371 22,764.6 22.8%Non-Residential 275 14,456.9 14.5%
North-East Residential 207 1,018.8 1.0%Sub-Total 482 15,475.7 15.5%
Non-Residential 207 12,031.7 12.0%North Residential 27 233.5 0.2%
Sub-Total 234 12,265.2 12.3%Non-Residential 354 37,267.9 37.3%
West Residential 33 286.3 0.3%Sub-Total 387 37,544.2 37.6%
104 O T H E R E N E R G Y- R E L AT E D S TAT I S T I C S 105S I N G A P O R E E N E R G Y S TAT I S T I C S 2 0 1 7
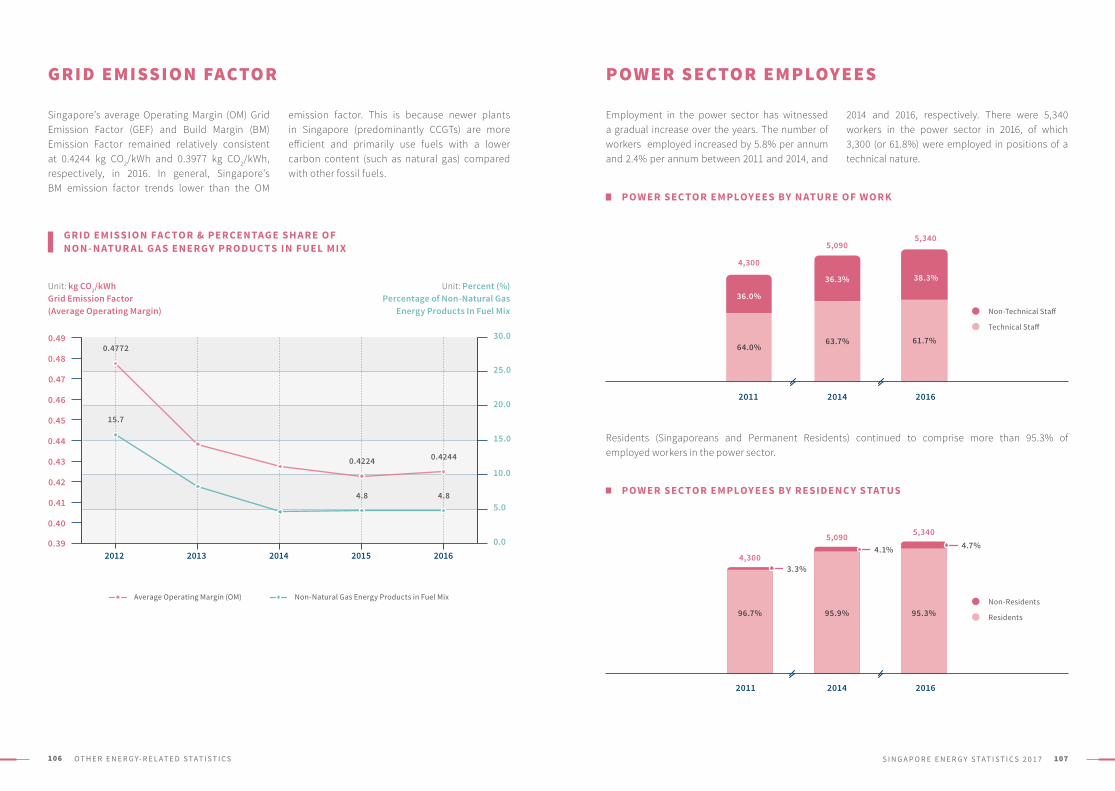
106 O T H E R E N E R G Y- R E L AT E D S TAT I S T I C S 107S I N G A P O R E E N E R G Y S TAT I S T I C S 2 0 1 7
GRID EMISSION FACTOR
emission factor. This is because newer plants in Singapore (predominantly CCGTs) are more efficient and primarily use fuels with a lower carbon content (such as natural gas) compared with other fossil fuels.
Singapore’s average Operating Margin (OM) Grid Emission Factor (GEF) and Build Margin (BM) Emission Factor remained relatively consistent at 0.4244 kg CO2/kWh and 0.3977 kg CO2/kWh, respectively, in 2016. In general, Singapore’s BM emission factor trends lower than the OM
GRID EMISSION FAC TOR & PERCENTAGE SHARE OFNON - NATUR AL GA S ENERGY PRODUC TS IN FUEL MIX
POWER SECTOR EMPLOYEES
Employment in the power sector has witnessed a gradual increase over the years. The number of workers employed increased by 5.8% per annum and 2.4% per annum between 2011 and 2014, and
Residents (Singaporeans and Permanent Residents) continued to comprise more than 95.3% of employed workers in the power sector.
POWER SEC TOR EMPLOYEES BY NATURE OF WORK
POWER SEC TOR EMPLOYEES BY RESIDENC Y STATUS
Non-Technical Staff
Non-Residents
Technical Staff
Residents
5,3405,090
4,300
95.9% 95.3%96.7%
4.7%4.1%
3.3%
0.40
0.41
0.39
0.42
0.43
0.45
0.46
0.47
0.48
0.49
0.44
20.0
0.0
25.0
5.0
30.0
10.0
15.0
2012 2013 2014 2015 2016
Non-Natural Gas Energy Products in Fuel MixAverage Operating Margin (OM)
4,300
36.0%
64.0%63.7% 61.7%
36.3%
5,340
38.3%
5,090
2011 2014 2016
2011 2014 2016
Unit: kg CO2/kWhGrid Emission Factor(Average Operating Margin)
Unit: Percent (%)Percentage of Non-Natural Gas
Energy Products In Fuel Mix
4.8 4.8
15.7
0.4772
0.4224 0.4244
2014 and 2016, respectively. There were 5,340 workers in the power sector in 2016, of which 3,300 (or 61.8%) were employed in positions of a technical nature.
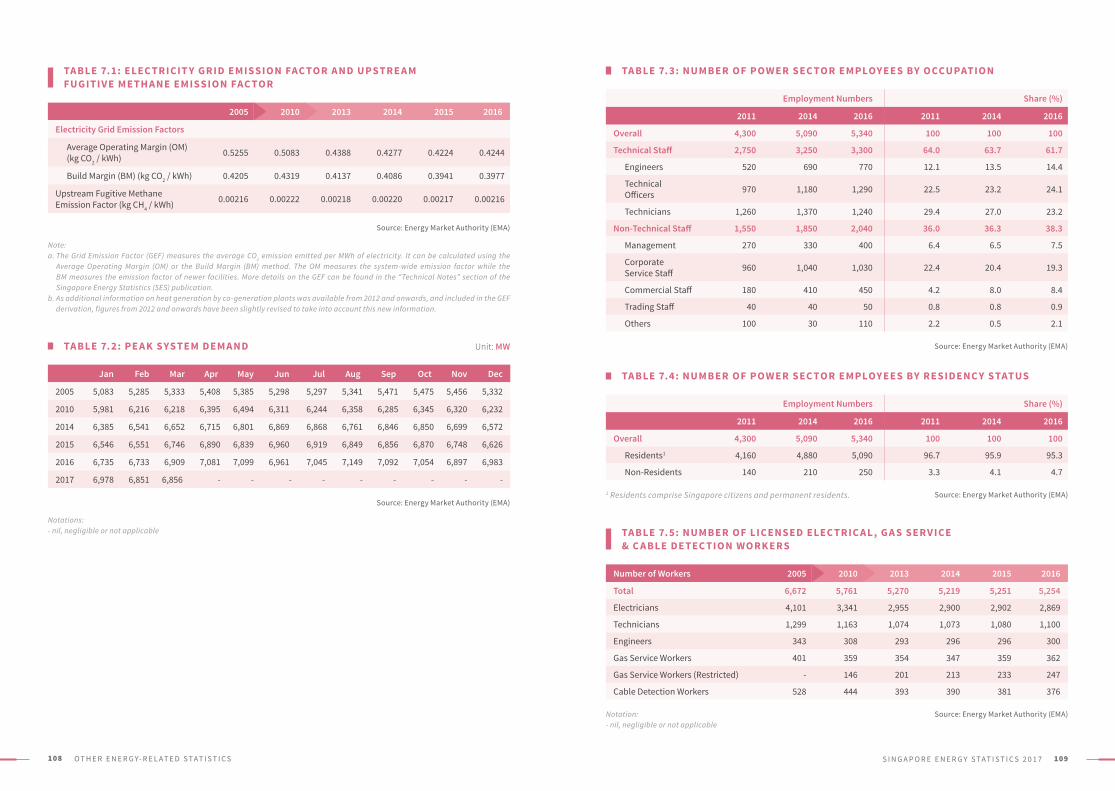
108 O T H E R E N E R G Y- R E L AT E D S TAT I S T I C S 109S I N G A P O R E E N E R G Y S TAT I S T I C S 2 0 1 7
TABLE 7.1: ELEC TRICIT Y GRID EMISSION FAC TOR AND UPSTRE AM FUGITIVE METHANE EMISSION FAC TOR
2005 2010 2013 2014 2015 2016
Electricity Grid Emission Factors
Average Operating Margin (OM) (kg CO2 / kWh) 0.5255 0.5083 0.4388 0.4277 0.4224 0.4244
Build Margin (BM) (kg CO2 / kWh) 0.4205 0.4319 0.4137 0.4086 0.3941 0.3977
Upstream Fugitive Methane Emission Factor (kg CH4 / kWh) 0.00216 0.00222 0.00218 0.00220 0.00217 0.00216
Source: Energy Market Authority (EMA)
Source: Energy Market Authority (EMA)
Note:a. The Grid Emission Factor (GEF) measures the average CO2 emission emitted per MWh of electricity. It can be calculated using the
Average Operating Margin (OM) or the Build Margin (BM) method. The OM measures the system-wide emission factor while the BM measures the emission factor of newer facilities. More details on the GEF can be found in the “Technical Notes” section of the Singapore Energy Statistics (SES) publication.
b. As additional information on heat generation by co-generation plants was available from 2012 and onwards, and included in the GEF derivation, figures from 2012 and onwards have been slightly revised to take into account this new information.
Notations:- nil, negligible or not applicable
TABLE 7. 2: PE AK SYSTEM DEMAND Unit: MW
Jan Feb Mar Apr May Jun Jul Aug Sep Oct Nov Dec
2005 5,083 5,285 5,333 5,408 5,385 5,298 5,297 5,341 5,471 5,475 5,456 5,332
2010 5,981 6,216 6,218 6,395 6,494 6,311 6,244 6,358 6,285 6,345 6,320 6,232
2014 6,385 6,541 6,652 6,715 6,801 6,869 6,868 6,761 6,846 6,850 6,699 6,572
2015 6,546 6,551 6,746 6,890 6,839 6,960 6,919 6,849 6,856 6,870 6,748 6,626
2016 6,735 6,733 6,909 7,081 7,099 6,961 7,045 7,149 7,092 7,054 6,897 6,983
2017 6,978 6,851 6,856 - - - - - - - - -
Number of Workers 2005 2010 2013 2014 2015 2016
Total 6,672 5,761 5,270 5,219 5,251 5,254
Electricians 4,101 3,341 2,955 2,900 2,902 2,869
Technicians 1,299 1,163 1,074 1,073 1,080 1,100
Engineers 343 308 293 296 296 300
Gas Service Workers 401 359 354 347 359 362
Gas Service Workers (Restricted) - 146 201 213 233 247
Cable Detection Workers 528 444 393 390 381 376
Source: Energy Market Authority (EMA)Notation: - nil, negligible or not applicable
1 Residents comprise Singapore citizens and permanent residents.
Source: Energy Market Authority (EMA)
Source: Energy Market Authority (EMA)
TABLE 7. 3: NUMBER OF POWER SEC TOR EMPLOYEES BY OCCUPATION
TABLE 7.4: NUMBER OF POWER SEC TOR EMPLOYEES BY RESIDENC Y STATUS
TABLE 7. 5: NUMBER OF LICENSED ELEC TRIC AL , GA S SERVICE & C ABLE DETEC TION WORKERS
Employment Numbers Share (%)
2011 2014 2016 2011 2014 2016
Overall 4,300 5,090 5,340 100 100 100
Technical Staff 2,750 3,250 3,300 64.0 63.7 61.7
Engineers 520 690 770 12.1 13.5 14.4
Technical Officers 970 1,180 1,290 22.5 23.2 24.1
Technicians 1,260 1,370 1,240 29.4 27.0 23.2
Non-Technical Staff 1,550 1,850 2,040 36.0 36.3 38.3
Management 270 330 400 6.4 6.5 7.5
Corporate Service Staff 960 1,040 1,030 22.4 20.4 19.3
Commercial Staff 180 410 450 4.2 8.0 8.4
Trading Staff 40 40 50 0.8 0.8 0.9
Others 100 30 110 2.2 0.5 2.1
Employment Numbers Share (%)
2011 2014 2016 2011 2014 2016
Overall 4,300 5,090 5,340 100 100 100
Residents1 4,160 4,880 5,090 96.7 95.9 95.3
Non-Residents 140 210 250 3.3 4.1 4.7

110 T E C H N I C A L N O T E S 111S I N G A P O R E E N E R G Y S TAT I S T I C S 2 0 1 7
112 T E C H N I C A L N O T E S 113S I N G A P O R E E N E R G Y S TAT I S T I C S 2 0 1 7
Objectives
Singapore Energy Statistics 2017 provides users with findings and statistics relating to Singapore’s energy supply, transformation and demand.
Sources of Data
The data used in the publication were mainly obtained through administrative returns from licensees and through surveys. EMA licensees are required to submit regulatory returns under the Electricity and Gas Acts. Energy statistics collected through the Joint Energy and Emissions Statistics Survey were also used in this publication. This survey is conducted by EMA Research and Statistics Unit (RSU) together with those of the Economic Development Board (EDB) and the National Environment Agency (NEA) under the Statistics Act.
Other sources of data featured in this publication include energy products trade statistics from the International Enterprise (IE) Singapore, energy consumption statistics from the NEA and prices statistics from the Singapore Department of Statistics (DOS).
Compilation Framework & Methodology
In compiling the energy statistics, EMA closely follows the recommended principles and methodologies set out in the International Energy Agency (IEA)’s Energy Statistics Manual. For the computation of the electricity grid emission factors and upstream fugitive methane emission factor, methodologies recommended by the Intergovernmental Panel on Climate Change (IPCC) are adopted.
Units of Measurement
Energy products are recorded in their original units of measure. As these units of measure vary, quantities of energy products need to be converted into a common unit to allow for comparison and aggregation. The common unit of measurement used to measure energy products in this publication is the tonne of oil equivalent (toe). According to the IEA, the tonne of oil equivalent is defined as follows:
= 41.868 gigajoules (GJ)= 11,630 kilowatt hours (kWh)
The tonne of oil equivalent should be regarded as a measure of energy content rather than a physical quantity. One tonne of oil is not equal to one tonne of oil equivalent.
1 tonne of oil equivalent
The following prefixes are used for multiples of the various units of measure:
= 1,000 or 103
= 1,000,000 or 106
= 1,000,000,000 or 109
= 1,000,000,000,000 or 1012
kilo (k)mega (M)giga (G)tera (T)
The top block (Energy Supply). This shows the flow representing energy entering and leaving the national territory. It also includes stock changes to provide information on total energy supply on the national territory during the reference period;
The middle block (Energy Transformation). This shows how energy is transformed, transferred, and used by energy industries for their own use and losses in distribution and transmission; and
The bottom block (Final Consumption). This shows final energy consumption by energy consumers.
a)
b)
c)
All prices and tariffs are presented in Singapore dollars.
Calorific Values
EMA uses Net Calorific Values (NCV) to convert all fuels from their original units to tonnes of oil equivalent (toe), unless otherwise stated. This change seeks to standardise the conversion practice for all fuel types, as natural gas, notably in the derivation of import values and electricity generated, was previously derived using the Gross Calorific Values (GCV).
Energy Balance
An energy balance is an accounting framework for compilation and reconciliation of data on all energy products entering, exiting, and used within the national territory of a given country during a reference period.
It expresses all forms of energy in a common accounting unit, and shows the relationships between the inputs to, and the outputs from the energy transformation industries.
The balance is divided into three main blocks:
114 T E C H N I C A L N O T E S 115S I N G A P O R E E N E R G Y S TAT I S T I C S 2 0 1 7
Fuel Mix for Electricity Generation
The fuel mix for electricity generation can be calculated using either the input or output method. This publication presents fuel mix data compiled by the output method.
The input method calculates the fuel mix for electricity generation based on the ratio of volume of fuel input to generation units. It does not take into account variations in energy content of fuel used by different companies for electricity generation, nor variations in fuel-to-electricity conversion efficiency of the generating plants.
The output method uses the amount of electricity generated and the corresponding type of fuel used to calculate the fuel mix for electricity generation. It takes the domestic fuel-to-electricity conversion efficiency of the generating plants and the type of plants used into account.
Electricity & Gas Tariffs
Annual and quarterly electricity and gas tariffs refer to the weighted average of tariffs for the specific periods as they may be adjusted at various periods throughout the year.
Re-referencing Price Indices
To allow comparisons between the movements of different prices, price indices series are pegged to a reference year. This is because of the shift from expressing the price indices in relation to a specific base year, to expressing the price indices in relation to a reference year common across all price indices.
Grid Emission Factor & Methane Emission Factor
The methodologies for the compilation of Grid Emission Factor (GEF) are based on the United Nations Framework Convention on Climate Change (UNFCCC) Clean Development Mechanism (CDM) Methodological Tool. This is the “Tool to calculate the emission factor for an electricity system” and the UNFCCC CDM Approved Baseline Methodology (AM) 0029 Baseline Methodology for grid connected electricity generation plants using natural gas.
GEF measures average CO2 emissions emitted per unit net electricity generated. It is calculated using the Average Operating Margin (OM) method. This is the generation-weighted average CO2 emission per unit net electricity generation of all generating power plants serving the electricity grid. GEF by Build Margin (BM) method refers to the generation-weighted average CO2 emission per unit net electricity generation of the five most recently built power units and/or the set of power capacity additions that comprise at least 20% of the total system electricity generation.
Upstream fugitive Methane Emission Factor (MEF) from electricity generation measures the average CH4 emission per unit net electricity generated. The methodology is similar to the BM method. However, it is based on the five most recently built power units that run on natural gas. These five plants should also generate at least 20% of total system electricity generation.
CLASSIFICATION
Energy Products
Energy products refer to products exclusively or mainly used as a source of energy. They include energy in forms suitable for direct use (for instance, electricity and heat) and energy products that release energy while undergoing some chemical or other process (such as combustion). The classification of energy products is based on the Singapore Trade Classification, Customs & Excise Duties 2012 (STCCED 2012 or HS 2012). STCCED classification adopts the ASEAN Harmonised Tariff Nomenclature 2012 (AHTN 2012). This is based on the 6-digit Harmonised Commodity Description and Coding System developed by the World Customs Organisation (WCO) for the classification of goods.
Industrial Activity
Industrial activity refers to the principal activity undertaken by the enterprise. This is where the enterprise devotes most of its resources; or from which it derives most of its income. The classification of the principal activity of the enterprise in the SES 2016 is based on the Singapore Standard Industrial Classification, 2015 (SSIC 2015). SSIC 2015 adopts the basic framework and principles of the International Standard Industrial Classification of all Economic Activities (ISIC).
Planning Region/Area
Planning Region/Area refers to those demarcated in the Urban Redevelopment Authority’s Master Plan 2014.

116 G L O S S A R Y 117S I N G A P O R E E N E R G Y S TAT I S T I C S 2 0 1 7
E N E R G Y T R A N S F O R M AT I O N
118 G L O S S A R Y 119S I N G A P O R E E N E R G Y S TAT I S T I C S 2 0 1 7
ENERGY PRODUCTS
Coal & Peat Products
Coal and Peat products include all coals, both primary (including Hard Coal and Lignite/Brown Coal) and derived fuels (including Patent Fuel, Coke over Coke, Gas Coke, BKB, Coke Oven Gas, Blast Furnace Gas and Oxygen Steel Furnace Gas). Peat is also included in this category. The energy products and their corresponding HS 2012 codes under this category are:
27021000, 27022000
27060000
27011100
27040010, 27040020, 27040030
27050000
27011210, 27011290, 27011900
27030010, 27030020
27012000
Anthracite
Coke Oven Coke
Gas Works Gas
Hard Coal
Peat
BKB/PB6
Lignite
Coal Tar
Crude Oil Products
Crude Oil products include Crude Oil, Natural Gas Liquids, Refinery Feedstocks and Additives as well as other Hydrocarbons. The energy products and their corresponding HS 2012 codes under this category are:
27101920, 27109100, 27109900
27111410, 27111490, 27112900
27090010, 27090020, 27090090
29091100, 29091900, 29092000, 29093000, 29094100, 29094300, 29094400, 29094900, 29095000, 29096000, 38112110, 38112190, 38112900, 38119090, 22072011, 22072019, 22072090, 29051100
Natural Gas Liquids
Crude Oil
Additives/Oxygenates
Refinery Feedstocks
Petroleum Products
Petroleum Products include Ethane, LPG, Aviation Gasoline, Motor Gasoline, Jet Fuel, Kerosene, Gas/ Diesel Oil, Fuel Oil, Naphtha, White Spirit, Lubricants, Bitumen, Paraffin Waxes, Petroleum Coke and other Petroleum Products. The energy products and their corresponding HS 2012 codes under this category are:
27101211, 27101212, 27101213, 27101214, 27101215, 27101216
27101220Gasoline (Aviation)
Light Distillates
Gasoline (Motor)
27111200, 27111300, 27111900Liquefied Petroleum Gas (LPG)
27101230, 27101240, 27101250, 27101260, 27101280, 27101290
27101270
White Spirit SBP
Naphtha
Natural Gas
Others (Energy Products)
27101981, 27101982
27101983
27101979
27131100, 27131200
27101971, 27101972
27112190
27111100
27132000, 27139000, 27141000, 27149000, 27150000
27121000, 27122000, 27129010, 27129090
27101941, 27101942, 27101943, 27101944, 27101950
27071000, 27072000, 27073000, 27074000, 27075000, 27079100, 27079910, 27079990, 27081000, 27082000, 27101930, 27101960,27101989, 27101990, 27102000
Gas/Diesel Oil
Natural Gas
Liquefied Natural Gas
Other Kerosenes
Bitumen
Paraffin Waxes
Lubricants
Other Petroleum Products
Middle Distillates
Natural Gas includes Natural Gas (excluding Natural Gas Liquids) and Town Gas. The energy products and their corresponding HS 2012 codes under this category are:
Others’ refer to other energy products that are not classified. These include Solar, Biomass, and Waste (such as Municipal Waste and Biogas). Municipal Waste is waste produced by residential, commercial and public services that is collected by local authorities for disposal in a central location for the production of electricity and/or heat.
Heavy Distillates & Residuum
Fuel Oil
Petroleum Coke
Jet Fuel Kerosene
120 G L O S S A R Y 121S I N G A P O R E E N E R G Y S TAT I S T I C S 2 0 1 7
Main Power Producers
Autoproducers
Own Use
Registered Generation Capacity
Co-Generation (Co-Gen) Plant
Tri-Generation (Tri-Gen) Plant
Open Cycle Gas Turbine (OCGT) Plant
Combined Cycle Gas Turbine (CCGT) Plant
These are enterprises that produce electricity as their principal activity.
Own use in electricity generation refers to the part of electricity generated which is consumed by the auxiliary equipment of the generation plant (such as pumps, fans and motors) under normal operations.
The registered generation capacity of a generation facility is the maximum generation capacity approved by Power System Operator (PSO), and registered with Energy Market Company (EMC) to provide one or more of the following products in the Singapore Wholesale Electricity Market (SWEM):
1. Energy;2. Reserve (Primary, Secondary or Contingency); and/or3. Regulation.
Co-generation plants (also known as combined heat plants) are plants which simultaneously generate electricity and useful heat from a common fuel source. This, improves overall thermodynamical efficiency.
Tri-generation plants are those which simultaneously generate electricity, useful heat and cooling from a common fuel source. This improves overall thermodynamical efficiency.
An Open Cycle Gas Turbine plant is a gas turbine power plant which discards the heat content of the exhaust gases exiting the turbine. This is as opposed to using a heat exchanger or recovered in a heat recovery steam generator (HRSG) as in a CCGT.
Combined Cycle Gas Turbines are a form of highly-efficient energy generation technology that combines a gas-fired turbine with a steam turbine.
The design uses a gas turbine to create electricity. It then captures the resulting waste heat to create steam which, in turn, drives a steam turbine to significantly increase the system’s power output without any increase in fuel.
ELECTRICITY GENERATION
ELECTRICITY & NATURAL GAS CONSUMPTION
Electricity Consumption
Contestable Consumers
Final Energy Consumption
Final Natural Gas Consumption
This refers to total electricity consumption by end users, including (embedded) consumption by Autoproducers.
Contestable Consumers are large, non-residential consumers with an average monthly consumption of 2,000 kWh or more. They have a monthly electricity bill of at least $450. Consumers can add up their electricity usage across different locations in Singapore to meet the prevailing threshold. Consumers eligible for contestability can choose to buy electricity from electricity retailers or the wholesale electricity market at half-hourly spot prices. They can also choose to remain with SP Services to buy electricity at regulated tariffs. The contestability threshold was last lowered on 1 July 2015 by EMA.
Final energy consumption covers all energy supplied to the final consumer for all energy uses. It is usually disaggregated into the final end-use sectors such as Industrial, Commerce & Services, Transport, Households, and Others.
This refers to total natural gas consumption by end-users, excluding consumption for electricity generation.
These are enterprises that produce electricity but for whom the production is not their principal activity.
Steam Turbine Plant
Waste-To-Energy (WTE) Plant
A steam turbine is a turbine that is driven by the pressure of steam discharged at high velocity against the turbine vanes.
A Waste-To-Energy plant is a power plant which generates power from the incineration of waste.
122 G L O S S A R Y 123S I N G A P O R E E N E R G Y S TAT I S T I C S 2 0 1 7
Commerce & Services-related
Commerce & Services-related consumption is defined by the following sub-sectors. This is in accordance to the Singapore Standard Industrial Classification 2015 (SSIC 2015).
SSIC Section J, Division 58-63
SSIC Section N, Division 77-82
SSIC Section R, Division 90-93
SSIC Section T, Division 97
SSIC Section I, Division 55 - 56
SSIC Section M, Division 69-75
SSIC Section Q, Division 86-88
SSIC Section G, Division 46-47
SSIC Section L, Division 68
SSIC Section P, Division 85
SSIC Section K, Division 64-66
SSIC Section O, Division 84
SSIC Section S, Division 94-96
SSIC Section U, Division 99
Accommodation and Food Services Activities
Professional, Scientific and Technical Activities
Health and Social Services
Wholesale and Retail Trade
Real Estate Activities
Education
Financial and Insurance Activities
Public Administration and Defence
Other Service Activities
Activities of Extra-Territorial Organisations and Bodies
Information and Communications
Administrative and Support Services Activities
Arts, Entertainment and Recreation
Activities of Households as Employers of Domestic Personnel
SECTORAL ACTIVITIES
Central Region
Others
East Region
North-East Region
North Region
West Region
Transport-related
Bishan, Bukit Merah, Bukit Timah, Downtown Core, Geylang, Kallang, Marine Parade, Marina East, Marina South, Museum, Newton, Novena, Orchard, Outram, Queenstown, River Valley, Rochor, Singapore River, Southern Islands, Straits View, Tanglin, Toa Payoh
“Others” refer to sectors or activities not adequately defined in SSIC 2015.
Bedok, Changi, Changi Bay, Paya Lebar, Pasir Ris, Tampines
Ang Mo Kio, Hougang, Punggol, North Eastern Islands, Seletar, Sengkang, Serangoon
Central Water Catchment, Lim Chu Kang, Mandai, Simpang, Sembawang, Sungei Kadut, Woodlands, Yishun
Boon Lay, Bukit Batok, Bukit Panjang, Choa Chu Kang, Clementi, Jurong East, Jurong West, Jurong Island, Pioneer, Tengah, Tuas, Western Islands, Western Water Catchment
Transport-related consumption is defined by the following subsectors. This is in accordance to the Singapore Standard Industrial Classification 2015 (SSIC 2015).
SSIC Division 50
SSIC Division 49
SSIC Division 52
SSIC Section H, Division 49-53
SSIC Division 51
SSIC Division 53
Land Transport
Warehousing and Support Activities for Transportation
Transport and Storage
Air Transport
Postal and Courier Activities
Water Transport
PLANNING AREA
Industrial-related
SSIC Section C, Division 10-32
SSIC Section B, Division 8-9
SSIC Section F, Division 41-43
SSIC Section A, Division 1-3
SSIC Section D, Division 35, andSection E, Division 36-38
Mining and Quarrying
Construction
Agriculture and Fishing
Utilities
Manufacturing
Industrial-related consumption is defined by the following sub-sectors. This is in accordance to the Singapore Standard Industrial Classification 2015 (SSIC 2015).
Households The scope of the Households sector includes all households in their capacity as final consumers.
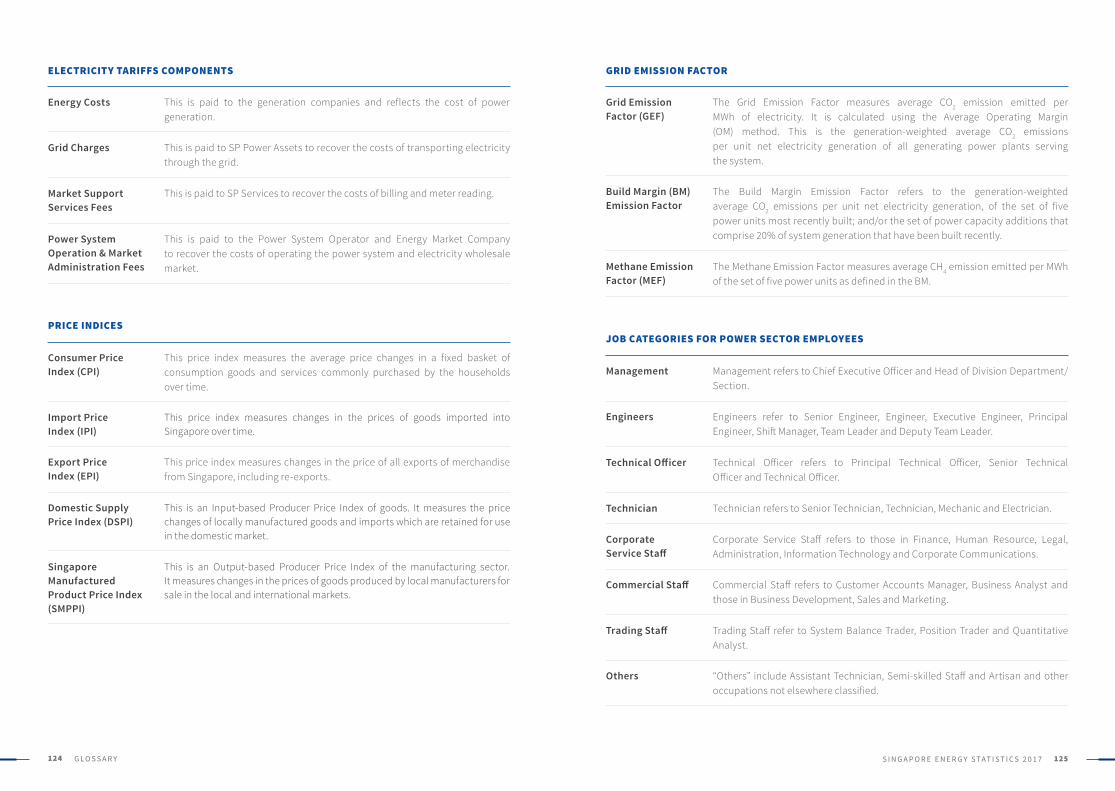
124 G L O S S A R Y 125S I N G A P O R E E N E R G Y S TAT I S T I C S 2 0 1 7
Energy Costs
Consumer Price Index (CPI)
Grid Charges
Market Support Services Fees
Power System Operation & Market Administration Fees
Import Price Index (IPI)
Export Price Index (EPI)
Domestic Supply Price Index (DSPI)
Singapore Manufactured Product Price Index (SMPPI)
This is paid to the generation companies and reflects the cost of power generation.
This price index measures the average price changes in a fixed basket of consumption goods and services commonly purchased by the households over time.
This is paid to SP Power Assets to recover the costs of transporting electricity through the grid.
This is paid to SP Services to recover the costs of billing and meter reading.
This is paid to the Power System Operator and Energy Market Company to recover the costs of operating the power system and electricity wholesale market.
This price index measures changes in the prices of goods imported into Singapore over time.
This price index measures changes in the price of all exports of merchandise from Singapore, including re-exports.
This is an Input-based Producer Price Index of goods. It measures the price changes of locally manufactured goods and imports which are retained for use in the domestic market.
This is an Output-based Producer Price Index of the manufacturing sector. It measures changes in the prices of goods produced by local manufacturers for sale in the local and international markets.
ELECTRICITY TARIFFS COMPONENTS
PRICE INDICES
GRID EMISSION FACTOR
Grid Emission Factor (GEF)
Management
Technician
Build Margin (BM) Emission Factor
Engineers
Corporate Service Staff
Others
Methane Emission Factor (MEF)
Technical Officer
Trading Staff
Commercial Staff
The Grid Emission Factor measures average CO2 emission emitted per MWh of electricity. It is calculated using the Average Operating Margin (OM) method. This is the generation-weighted average CO2 emissions per unit net electricity generation of all generating power plants serving the system.
Management refers to Chief Executive Officer and Head of Division Department/Section.
Technician refers to Senior Technician, Technician, Mechanic and Electrician.
The Build Margin Emission Factor refers to the generation-weighted average CO2 emissions per unit net electricity generation, of the set of five power units most recently built; and/or the set of power capacity additions that comprise 20% of system generation that have been built recently.
Engineers refer to Senior Engineer, Engineer, Executive Engineer, Principal Engineer, Shift Manager, Team Leader and Deputy Team Leader.
Corporate Service Staff refers to those in Finance, Human Resource, Legal, Administration, Information Technology and Corporate Communications.
“Others” include Assistant Technician, Semi-skilled Staff and Artisan and other occupations not elsewhere classified.
The Methane Emission Factor measures average CH4 emission emitted per MWh of the set of five power units as defined in the BM.
Technical Officer refers to Principal Technical Officer, Senior Technical Officer and Technical Officer.
Trading Staff refer to System Balance Trader, Position Trader and Quantitative Analyst.
Commercial Staff refers to Customer Accounts Manager, Business Analyst and those in Business Development, Sales and Marketing.
JOB CATEGORIES FOR POWER SECTOR EMPLOYEES
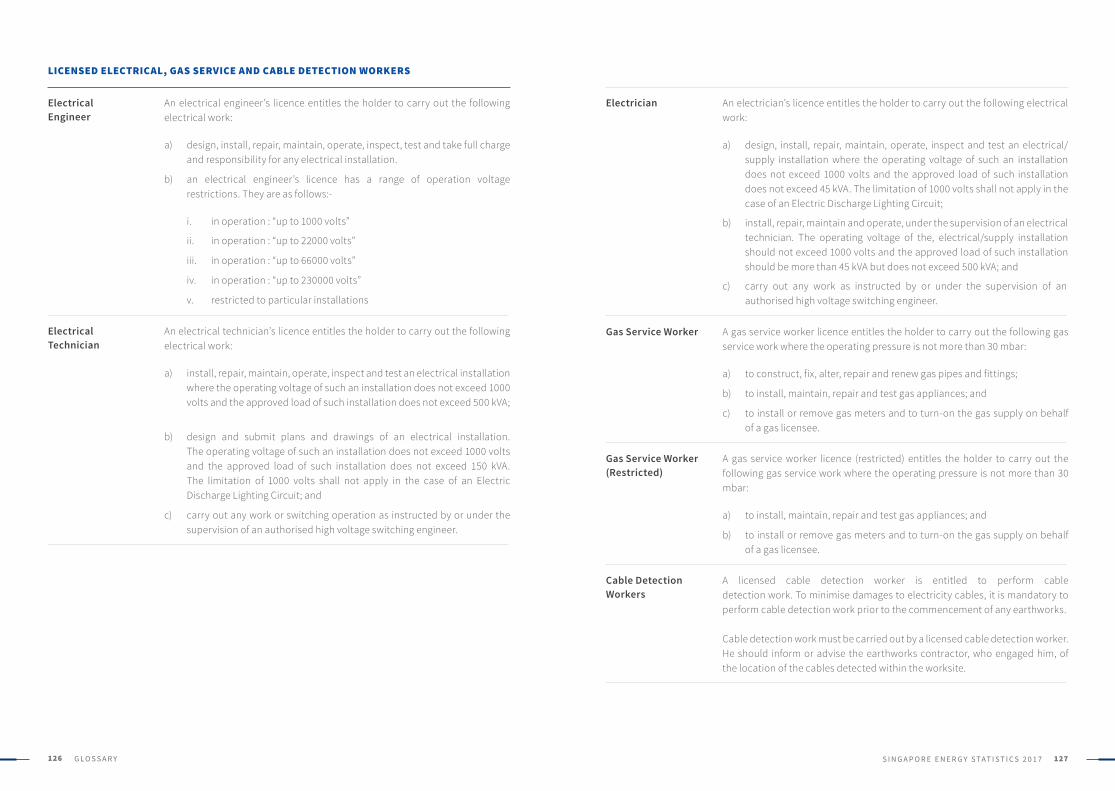
126 G L O S S A R Y 127S I N G A P O R E E N E R G Y S TAT I S T I C S 2 0 1 7
Electrical Technician
An electrical technician’s licence entitles the holder to carry out the following electrical work:
design, install, repair, maintain, operate, inspect, test and take full charge and responsibility for any electrical installation.
install, repair, maintain, operate, inspect and test an electrical installation where the operating voltage of such an installation does not exceed 1000 volts and the approved load of such installation does not exceed 500 kVA;
an electrical engineer’s licence has a range of operation voltage restrictions. They are as follows:-
design and submit plans and drawings of an electrical installation. The operating voltage of such an installation does not exceed 1000 volts and the approved load of such installation does not exceed 150 kVA. The limitation of 1000 volts shall not apply in the case of an Electric Discharge Lighting Circuit; and
carry out any work or switching operation as instructed by or under the supervision of an authorised high voltage switching engineer.
in operation : “up to 1000 volts”
a)
a)
b)
b)
c)
i.
in operation : “up to 22000 volts”ii.
in operation : “up to 66000 volts”iii.
in operation : “up to 230000 volts”iv.
restricted to particular installationsv.
An electrical engineer’s licence entitles the holder to carry out the following electrical work:
LICENSED ELECTRICAL, GAS SERVICE AND CABLE DETECTION WORKERS
Electrical Engineer
Cable Detection Workers
A licensed cable detection worker is entitled to perform cable detection work. To minimise damages to electricity cables, it is mandatory to perform cable detection work prior to the commencement of any earthworks.
Cable detection work must be carried out by a licensed cable detection worker. He should inform or advise the earthworks contractor, who engaged him, of the location of the cables detected within the worksite.
Gas Service Worker (Restricted)
A gas service worker licence (restricted) entitles the holder to carry out the following gas service work where the operating pressure is not more than 30 mbar:
to install, maintain, repair and test gas appliances; and
to install or remove gas meters and to turn-on the gas supply on behalf of a gas licensee.
a)
b)
Electrician An electrician’s licence entitles the holder to carry out the following electrical work:
design, install, repair, maintain, operate, inspect and test an electrical/ supply installation where the operating voltage of such an installation does not exceed 1000 volts and the approved load of such installation does not exceed 45 kVA. The limitation of 1000 volts shall not apply in the case of an Electric Discharge Lighting Circuit;
install, repair, maintain and operate, under the supervision of an electrical technician. The operating voltage of the, electrical/supply installation should not exceed 1000 volts and the approved load of such installation should be more than 45 kVA but does not exceed 500 kVA; and
carry out any work as instructed by or under the supervision of an authorised high voltage switching engineer.
a)
b)
c)
Gas Service Worker A gas service worker licence entitles the holder to carry out the following gas service work where the operating pressure is not more than 30 mbar:
to construct, fix, alter, repair and renew gas pipes and fittings;
to install, maintain, repair and test gas appliances; and
to install or remove gas meters and to turn-on the gas supply on behalf of a gas licensee.
a)
b)
c)

128 G L O S S A R Y 129S I N G A P O R E E N E R G Y S TAT I S T I C S 2 0 1 7
130 G L O S S A R Y 131S I N G A P O R E E N E R G Y S TAT I S T I C S 2 0 1 7
N O T E S
Comments on this publication and suggestions for further issues of SES are welcome. Please write to:
Research & Statistics UnitEnergy Technology & Data Department
Energy Planning & Development DivisionEnergy Market Authority
991G Alexandra Road #01/02-29, Singapore 119975
Republic of Singapore
e [email protected] +65 6835 8000f +65 6835 8020