energy market simulations under climate stabilization ... · pdf fileenergy market simulations...
TRANSCRIPT

Energy Market Simulations Under Climate Stabilization Transitions
Donald Hanson, Economist, ANLJon Marano, Energy ConsultantTito Homem-de-Mello, Northwestern UniversityInternational Association for Energy EconomicsJune 21-24, 2009
2
Energy/Climate Transitions Analysis
Modeling Important Joint Production Technologies– Pricing joint-production products– Conventional and unconventional crude oil refining; biomass- and
coal-to-liquids coproduction plants: MARS – coauthor JJMarano– Vehicle choice model (AMIGA), price effects, and modeling CAFE
standards– Biomass supply and allocation: FASOM
Importance of moving quickly on CCS demonstrations-Coal gasification projects with CO2 capture-Retrofitting existing coal-fired power plants
3
What We Learned from the EMF-22 Climate Transition Scenario Runs for the U.S.
The current baseline outlook appears consistent with the U.S. holding its CO2-eq emissions from 2012 to 2050 at a constant allowance path at 2008 levels (with flexible banking and borrowing). This represents 287bmt CO2-eq cumulative emissions.A 50% reduction by 2050 (203 bmt CO2-eq cumulative from 2012 to 2050) is doable with advanced technology deploymentAn 80% reduction by 2050 (167 bmt CO2-eq cumulative) is extremely difficult. Large amounts of new nuclear capacity and renewables have to be phased in by 2030 to reduce emissions accumulations from existing coal plant and to provide electricity for PHEVs to reduce petroleum useWhat can be done to reduce demand for motor gasoline blends, and especially faster growing diesel/jet fuel will be very importantDetailed technology modeling is necessary to formulate a balanced, complementary set of actions for energy/climate security

4
General Equilibrium in Fuels Markets and Product Pricing
Joint product prices are based on both costs and demand elasticities in the different product marketsIn AEO 2009, motor gasoline blends decrease 0.8% per year from 2007 to 2030, whereas distillate demand (jet fuel, diesel, DFO) grows at 1.0% per year.This gives rise to an increasing distillate to gasoline ratio, whereas refineries are limited in capability to change this production ratio.Diesel prices will rise relative to gasoline. Biodiesel and CTL will sell at a premium. Gasoline substitutes (ethanol) will be relatively less economic to produce.There will be major implications for crude oil imports and petroleum products imports and exportsDelayed participation of non-Annex1 countries in a climate agreement will affect location of future refining capacity away from the U.S. with a CO2 emission cap
5
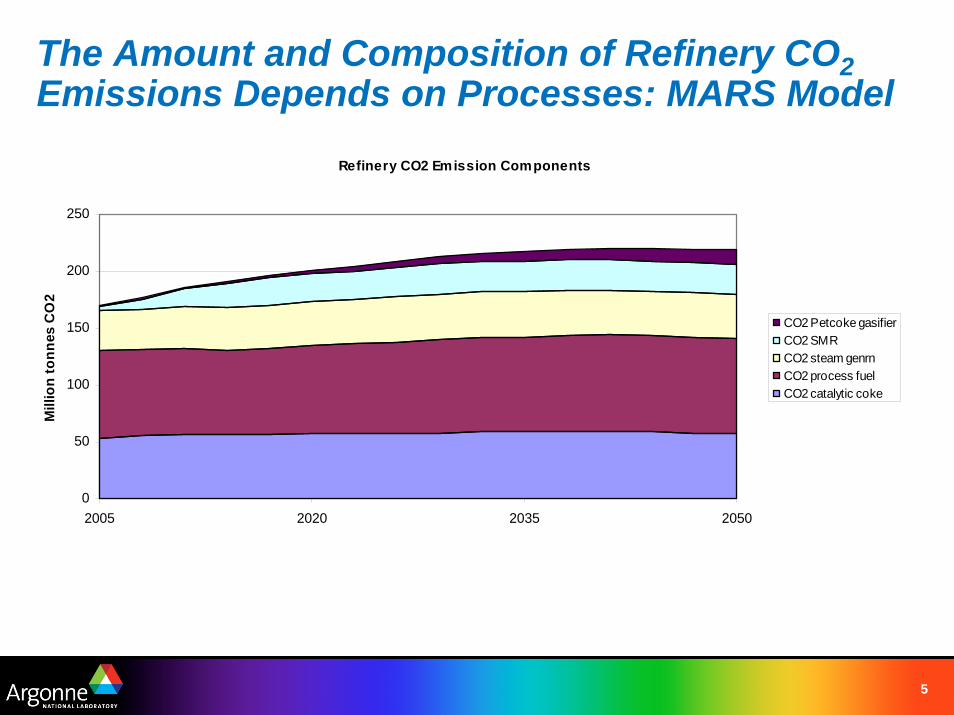
The Amount and Composition of Refinery CO2Emissions Depends on Processes: MARS Model
Refinery CO2 Emission Components
0
50
100
150
200
250
2005 2020 2035 2050
Mill
ion
tonn
es C
O2
CO2 Petcoke gasifierCO2 SMRCO2 steam genrnCO2 process fuelCO2 catalytic coke

6
Some Features of Our SystemU.S. focus and rest-of-world global focus
Bottom-up investment requirement calculations (capital scarce)– Energy technology capacity expansion– Transportation technologies– End use buildings and industry investments in energy efficiency
Average energy prices must be sufficient to sustain investment –economic condition for entry and investment by firms
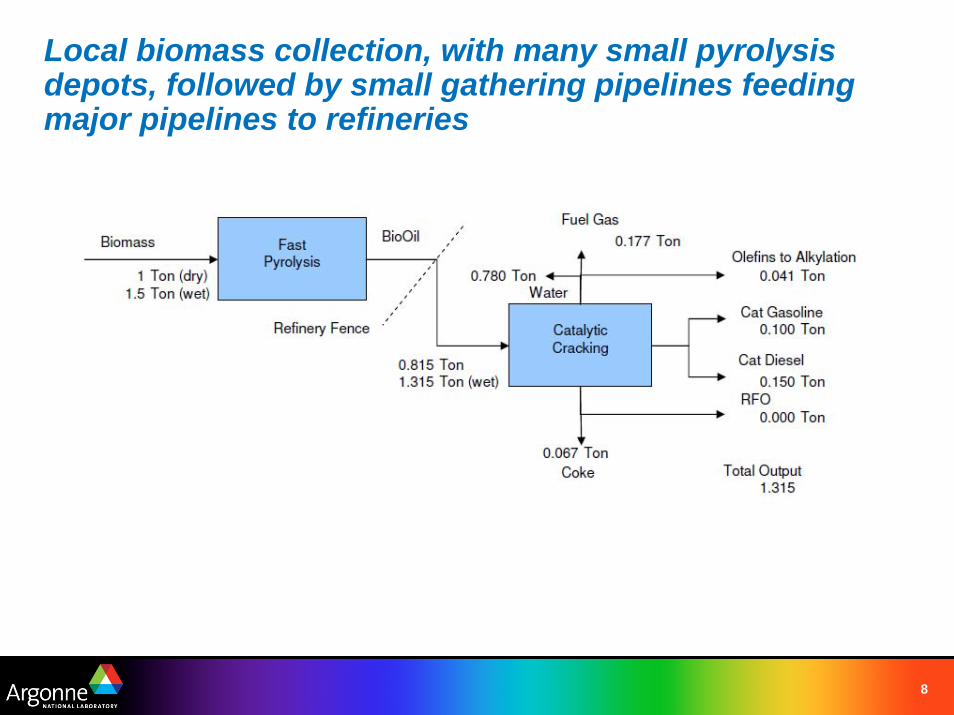
John Marano’s work with NREL and EIA in characterizing current, next generation, and mature cellulosic biomass technologies, including pyrolysis
7
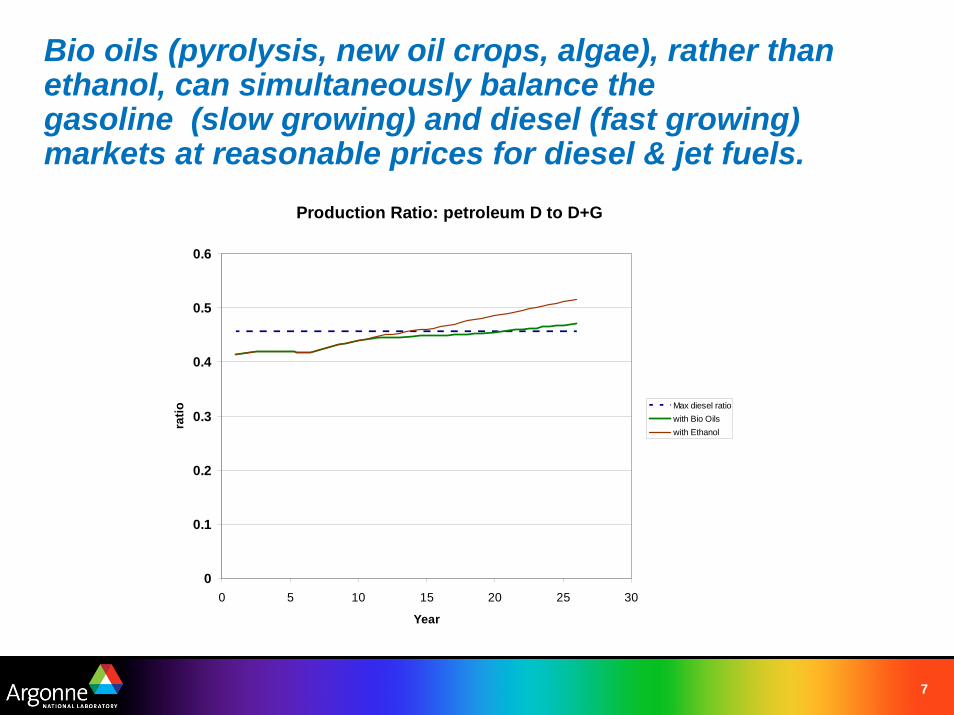
Bio oils (pyrolysis, new oil crops, algae), rather than ethanol, can simultaneously balance the gasoline (slow growing) and diesel (fast growing) markets at reasonable prices for diesel & jet fuels.
Production Ratio: petroleum D to D+G
0
0.1
0.2
0.3
0.4
0.5
0.6
0 5 10 15 20 25 30
Year
ratio
Max diesel ratiowith Bio Oilswith Ethanol
8
Local biomass collection, with many small pyrolysis depots, followed by small gathering pipelines feeding major pipelines to refineries

9
Energy Resource System Integration
Resource Supply Functions:US and Rest of World
Price ElasticityDepletion effectTechnological progressPrice enhancement of recoverable resources
FASOM model (B. McCarl)Forest & Ag GHG emissionsCrop prices & exportsEnergy feedstocks Switch grass & MiscanthusBiodieselEnergy & water useLand use change
Mature cellulosic technology
2nd generation cellulosic technology
Corn & cellulosic hybrid plant
Demonstration cellulosic
Existing corn ethanol
Air travel demand
Freight demand
Passenger travel demandTen vehicle types
New Hydrocracker Refinery
Existing Petroleum Refineries
Minemouth plants
Integrated refinery plants
Coal(biomass)-to-Liquids with CCS
tech
pro
g
Residential, Commercial, Industry end-use energy demand
Existing Power Plants
Dispatched by rank order depending on CO2 emissions, price, and other variable costs Retrofits for CCSNew capacity
Nuclear
tech
pro
g
Renewables
tech
pro
g
price & incomeeffects
activity & priceeffects
price & incomeeffects
E10, E85, other fuels
Blend ethanol to add octane & BTUs to motor gasoline
grid electricityfor PHEV
Crude Oil
Liquidsfrom Coal
DieselJet Fuel
Ethanol
Electricity
tech prog = evolutionary technical progress
Data flows to industry growth, income, and expenditures in economy
Gas & Liquids
Coal & Gas
tech
pro
g
tech
pro
g
RefineryProducts
Gasoline
Coal / Biomass
Economy interaction Material flows
energy prices, investments, variable costs,and service industry demands
other resourcedemands

10
Dimensions along which Vehicle Markets Adjust. These Are Responses that we Model.
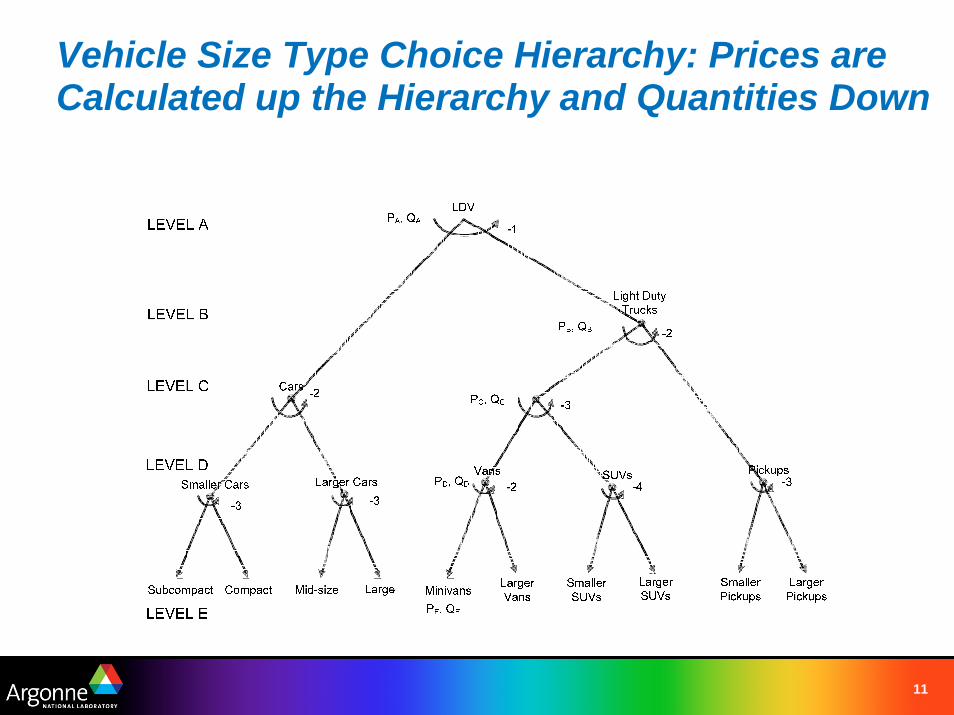
Substitution of capital (first cost of vehicle) for energy efficiency technologies (our data is based on Effectiveness and Impact of Corporate Average Fuel Economy Standards by David Greene et.al., NRC, 2002)Choice of more or less vehicle performance (income and price effects)Substitution among vehicle sizes (we model ten size types)Shift in household budget shares to other goods, services, and transportation modes away from personal vehicle-related expenditures (price effects)General changes in economic conditions (income effects)Driving existing vehicles more or less (price effects)Accelerating the rate of turnover to newer efficient vehicles
11
Vehicle Size Type Choice Hierarchy: Prices are Calculated up the Hierarchy and Quantities Down

12
Change in size categories for a doubling in gasoline price.
Pvehj = Cvehj + lambda*(GPMvehj – GPMavg)
13
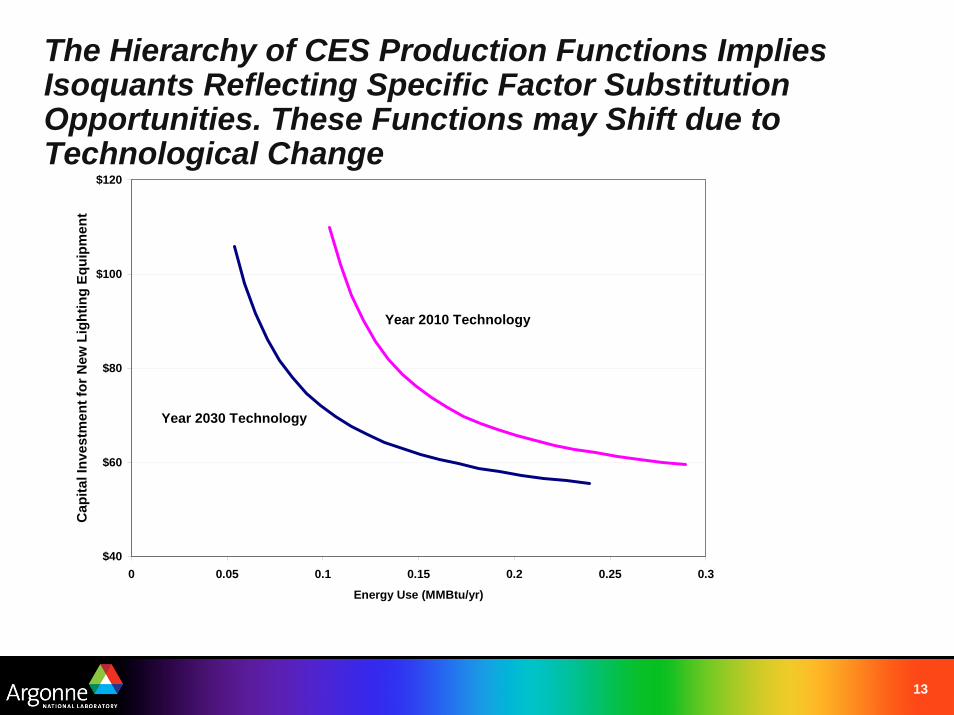
The Hierarchy of CES Production Functions Implies Isoquants Reflecting Specific Factor Substitution Opportunities. These Functions may Shift due to Technological Change
$40
$60
$80
$100
$120
0 0.05 0.1 0.15 0.2 0.25 0.3
Energy Use (MMBtu/yr)
Cap
ital I
nves
tmen
t for
New
Lig
htin
g Eq
uipm
ent
Year 2010 Technology
Year 2030 Technology

14
According to the National Academy’s Report, There Are Opportunities to Improve Both/Either Vehicle Efficiency and Performance (with strong price and income effects)
)/1,(0 yzeeffcyzyzyz MPGVehpricfPerform κ=
⎟⎟⎠
⎞⎜⎜⎝
⎛⋅⎟⎟⎠
⎞⎜⎜⎝
⎛=⎟⎟
⎠
⎞⎜⎜⎝
⎛hyz
hyz
he
tE
K
E
NVVMT
rP
ff
0
0,'
'
ζζζ
τω
1
/1−
−−
⎥⎥
⎦
⎤
⎢⎢
⎣
⎡
⎟⎟⎠
⎞⎜⎜⎝
⎛Φ+⎟
⎟⎠
⎞⎜⎜⎝
⎛Θ=
yz
yzyz
yz
eeffcyz
yzyz
MPGVehpricf
Isoquants move out with higher performance
ςς
ωτ
+
⎟⎟⎠
⎞⎜⎜⎝
⎛⋅⎟
⎟⎠
⎞⎜⎜⎝
⎛⋅⎟⎟⎠
⎞⎜⎜⎝
⎛
Θ
Φ=
1
'
'
/1 MPGVehpric
ff eeffc
yz
yz
yz
yz
yz
K
E
Mathematically the functions and optimal choice are described as follows:

15
Phasing-in Carbon prices
The optimal carbon price path is one which balances the risk of rapid or “built in” climate change with the cost advantage of postponing emission reduction measures. Environmental damages may be worsened by delay in mitigation.It can be shown that necessary conditions in optimal control theory imply that the efficient carbon price will grow at the difference in rates between the environmental time preference, “a,” for earlier emission reductions and the money time preference, “r”: dλ/dt = (r - a)λIf (r - a) were smaller, the Carbon Price path would be flatter.This might make sense from a technology cost/adoption perspective.Therefore, it is my conclusion that the phasing-in of an initial carbon price will be dictated by adjustment costs and political feasibility considerations, but should be ramped up as soon as is feasible.Future work: Monte Carlo sampling over uncertain parameters

16
Appendices
The AMIGA/MARS Integrated System

17
The Modeling System Integrates Energy Supply Systems and Environmental Emissions Within an Economy-wide Model

1818
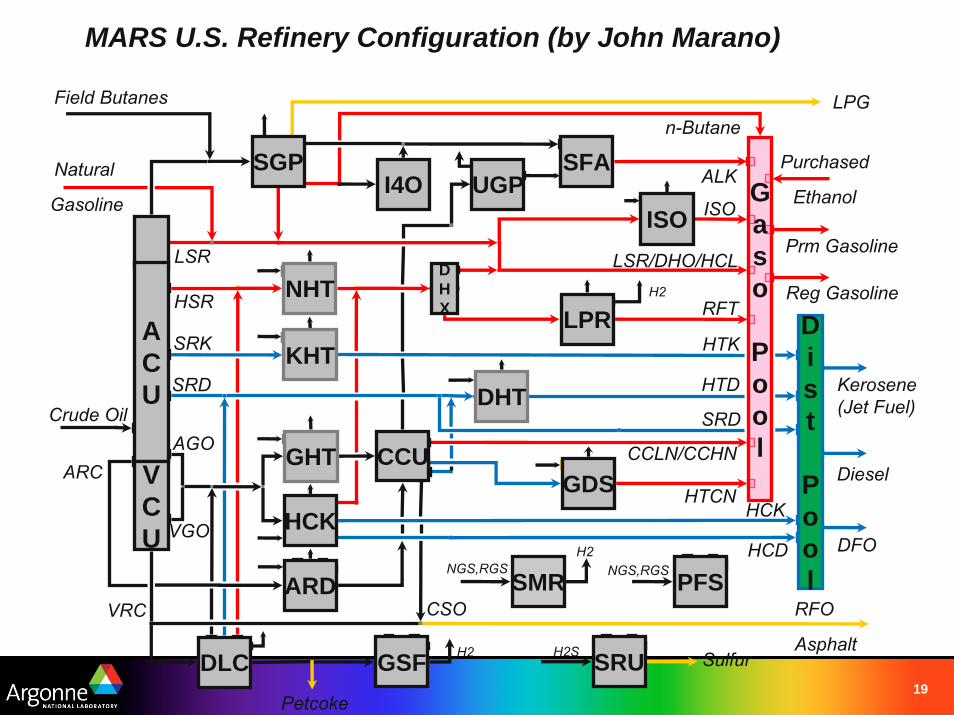
MARS: Representation of Joint Production TechnologiesUS Coking RefineriesAtmospheric DistillationVacuum DistillationAtmospheric DesulfurizationDelayed CokerFischer-Tropsch liquids
upgradingGasoil HydrotreatingFluidized Catalytic CrackerGasoline DesulfurizationLo/Hi Severity Distillate HTKerosene hydrotreaterNaphtha hydrotreaterDehexanizerLow pressure reformerC6 isomerizationAlkylationC4 isomerizationsteam methane reformingSteam generation & CHP
Future US Hydrocracking RefineriesAtmospheric DistillationVacuum DistillationResid hydrocrackerGasoil hydrocrackerLo/Hi severity distillate HTKerosene hydrotreaterNaptha hydrotreaterDehexanizerLow pressure reformerC6 isomerizationSteam methane reformingSteam generation & CHP
Chemical processesGasifiactionPyrolysisFermentation
Biomass – current techBiomass – next generationBiomass – mature tech
LPGMotor GasolineJet FuelDiesel FuelDist. FOResid. FOPetro CokeAsphaltNathpha feedstockKerosene feedstockLubricants
Power Plant Biomass Co-firingConventional Markets
Rest of World - ExistingCracking Refineries
Rest of World - FutureHydrocracking Refineries
Ethanol and Biodiesel production from sugar, starch, and oil crops
US & Rest of World demand for products
Biomass & Coal based
Conventional & Unconventional Crude OilsProduct Imports/Exports
Future hydrocracking refinery locations
US Rest of World
Biomass Allocation
19
SMR
MARS U.S. Refinery Configuration (by John Marano)
Crude Oil
DLC
Prm Gasoline
Reg Gasoline
Field Butanes
Natural
Gasoline
Purchased
EthanolI4O
GSF
LPG
Kerosene(Jet Fuel)
DFO
Petcoke
RFO
Asphalt
Diesel
SRU
PFS
Sulfur
SGPUGP
SFA
Dist
Pool
ISO
NHTDHX
KHTACU
VCU
LPR
DHT
GHT
HCK
CCU
ARD
GDS
HSR
LSR
SRK
SRD
AGO
VGO
VRC
n-Butane
LSR/DHO/HCL
RFT
ISO
ALK
CCLN/CCHN
CSO
HTCN
HTK
SRD
HTD
HCK
HCD
H2
H2
H2
NGS,RGS
H2S
NGS,RGS
ARC
Gaso
Pool