site index model for natural stands of rebollo … · ci. fl., v. 20, n. 1, jan.-mar., 2010 57 site...
TRANSCRIPT
____________________________________________________Ci. Fl., v. 20, n. 1, jan.-mar., 2010
57
SITE INDEX MODEL FOR NATURAL STANDS OF REBOLLO OAK (Quercus pyrenaica Willd.)IN GALICIA, NW IBERIAN PENINSULA
MODELO DE ÍNDICE DE SITIO EM POVOAMENTOS NATURAIS DE CARVALHO NEGRO(Quercus pyrenaica Willd.) DA GALICIA, NW DA PENÍNSULA IBÉRICA
Ignacio Javier Díaz-Maroto1 José Fernández-Parajes2 Pablo Vila-Lameiro2 Eva Barcala-Pérez3
ABSTRACT
Data from stem analysis of 56 dominant trees of Quercus pyrenaica Willd., in natural stands in Galicia (NWIberian Peninsula), were used to evaluate four dynamic site equations derived with the Generalized AlgebraicDifference Approach (GADA). All the equations are base-age invariant and directly estimate height and siteindex from any height and age. The fittings were made using a data structure involving all possible growthintervals. The GADA formulation derived on the basis of the Bertalanffy-Richards model by considering theasymptote and the initial pattern parameters as related to site productivity. It is therefore recommended forheight growth prediction and site classification for natural stands of rebollo oak in Galicia. The autocorrelationwas analyzed with a test of residuals using Durbin’s t-test without reaching a manifest result of autocorrelationbetween managed data.Keywords: Quercus pyrenaica; site index model; height growth; Generalized Algebraic Difference Approach.
RESUMO
Dados da análise de tronco de 56 árvores dominantes de Quercus pyrenaica Willd. de florestasnaturais da Galicia (NW Península Ibérica) foram utilizados para avaliar quatro equações dinamicasde índice de sitio obtidas com a Abordagem Generalizada de Diferença Algébrica (GADA). Todas asequações são baseadas na idade invariante e diretamente estimam a altura e o índice de sitio. Osajustes foram feitos utilizando uma estrutura de dados que incluiam todos os possíveis intervalos decrescimento. A formulação GADA teve base no modelo Bertalanffy-Richards, considerando a assíntotae do padrão inicial como parâmetros relacionados à produtividade do sitio. Assim, recomenda-se omodelo na previsão do crescimento em altura e classificação de sitios para povoamentos naturais decarvalho negro na Galicia. A autocorrelação foi analisada com um teste de resíduos utilizando Durbin’st-teste, sem chegar a um resultado significativo de autocorrelação entre os dados.Palavras-chave: Quercus pyrenaica; modelo de índice de sitio; crescimento em altura; Abordagem
das Diferenças Algébricas Generalizadas.
1. Author for correspondence: Dr. Forestry Engineer, University of Santiago de Compostela, Department ofAgroforestry Engineering, Campus Universitario s/n. E – 27002, Lugo, Spain. [email protected]
2. Forestry Engineer, Dr., University of Santiago de Compostela, Department of Agroforestry Engineering, CampusUniversitario s/n. E – 27002, Lugo, Spain.
3. Forestry Engineer, University of Santiago de Compostela, Department of Agroforestry Engineering, CampusUniversitario s/n. E – 27002, Lugo, Spain.
Recebido para publicação em 19/05/2008 e aceito em 8/09/2009.
Ciência Florestal, Santa Maria, v. 20, n. 1, p. 57-68, jan.-mar., 2010ISSN 0103-9954
58
____________________________________________________Ci. Fl., v. 20, n. 1, jan.-mar., 2010
INTRODUCTION
Rebollo oak (Quercus pyrenaica Willd.) isdistributed throughout the Iberian Peninsula, it isprobably found all over Spanish territory, although itis sometimes only present in small stands orrepresented by few individuals (MESON, 1983;CARVALHO et al., 2005). In Galicia, the climaxvegetation in large areas of the south of Lugo provinceand inland areas of Pontevedra and Ourense provincesis comprised of rebollo natural oaks (DÍAZ-MAROTO et al., 2006) and, in other areas, it is rathermore disperse and often mixed with Quercus roburL. (DÍAZ-MAROTO et al., 2005). Rebollo oak isthe dominant tree species in Galician native forest(NW Spain) with an oceanic climate andMediterranean influence, where at present, covers100,504 ha, in pure stands (DGCONA, 2001). Up tonow, no studies have been carried out to determinethe site quality of Quercus pyrenaica stands in thearea being studied. Nevertheless, during recentdecades, there has been increasing interest in themanagement of broadleaved tree species, due to thecurrent emphasis on sustainable production of stands(DÍAZ-MAROTO et al., 2007). In this sense, sitequality is of primary concern in making forestmanagement decisions (BARRIO and DIÉGUEZ-ARANDA, 2005).
An index which expresses site productivityis a required variable for the modelling of presentand future growth and yield, and it can also be usedfor forest land stratification for purposes of forestinventory, and for forest exploitation on a sustainableyield basis (GARCÍA, 1983). Site quality should bemeasured directly in terms of volume yield.Nevertheless, the stand history affects the volume oftimber in an area at any time, and we almost neverknow this history (BAILEY and CLUTTER, 1974;CLUTTER et al., 1983). Stand density atestablishment, past cutting, diseases, plagues, andweather can all affect the standing volume, as can thelength of forest stand rotation (DAVIS et al., 2001;KURINOBU et al., 2007). Therefore, site quality isfrequently made in terms of stand height, because,for many species, areas having good site quality arealso where height growth is high (BAILEY andCLUTTER, 1974; CLUTTER et al., 1983). Takinginto account that the average height of the stand maybe affected by certain types of thinning, but that withina wide range of stand densities the height growth doesnot seem to be affected – especially when the
comparison is restricted to dominant trees (BAILEYand CLUTTER, 1974; CLUTTER et al., 1983) –,the most common approach in determining siteproductivity involves the use of a site index. This maybe defined as the dominant height of the stand at aspecific base age (BARRIO and DIÉGUEZ-ARANDA, 2005; ADAME et al., 2006).
The aim of this work was to develop a sitequality system (both for height growth and site indexestimation) for single-species Quercus pyrenaicanatural stands in Galicia (NW Iberian Peninsula).
MATERIAL AND METHODS
Description of sampling and data recording
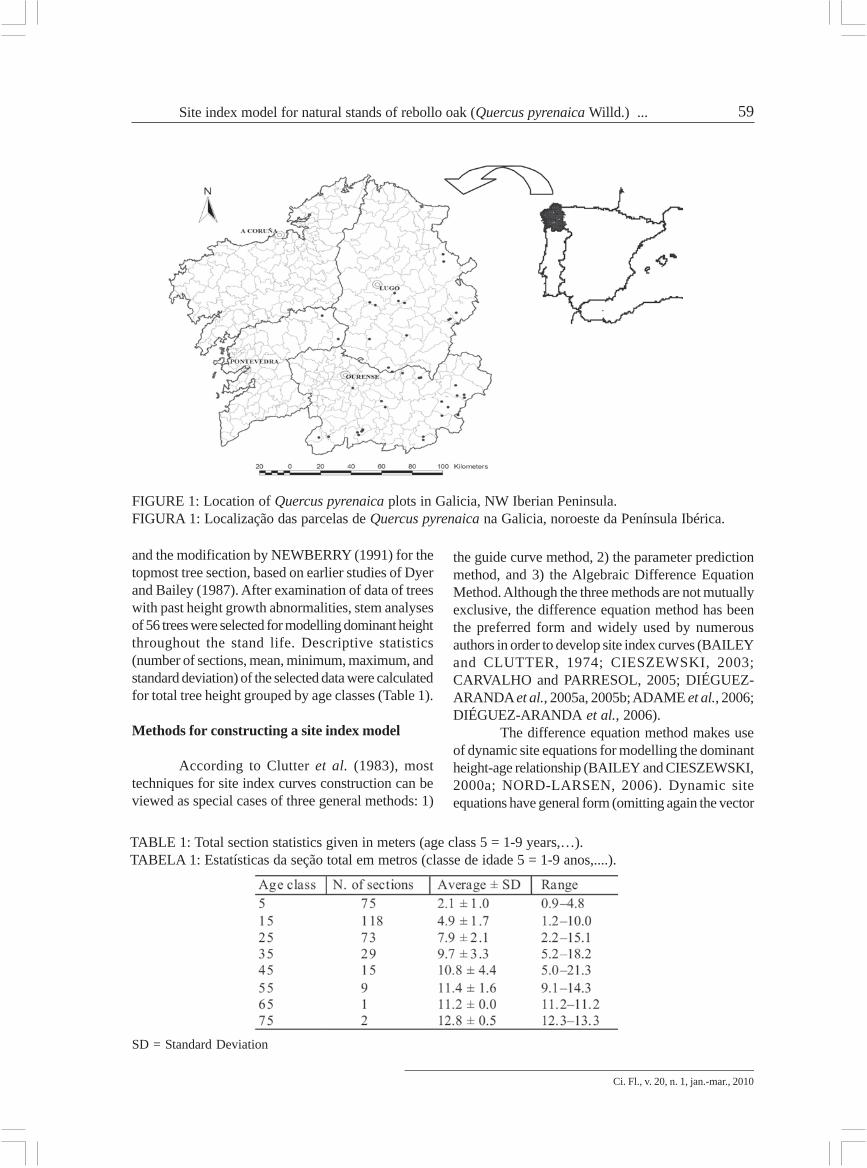
In the winter of 2003-2004, a network of 40permanent rectangular plots was established in even-aged of rebollo oak in Galicia (Figure 1). The plotswere located throughout the area of distribution ofthis species in Galician territory, and were subjectivelyselected to represent the existing range of ages, standdensities and sites (DÍAZ-MAROTO et al., 2006;KURINOBU et al., 2007). The plot size ranged from130 to 2,120 m2, depending on stand density, in orderto achieve a minimum of 50 trees per plot. Twodominant trees were destructively sampled at 28locations; in the rest of plots it was not possible tofell no dominant tree, due to several reasons: 1) standdensity was extreme, thus, the height growth ofdominant trees was affected, 2) silvicultural treatmentsaffected the upper canopy (e.g., pollarding and fellingof trees to provide firewood and food for livestock)(CARVALHO et al., 2005), and 3) the topography ofsome stands and the impossibility to locate to theirowners. These trees were selected as the first twodominant trees found outside the plots but in the samestands within ± 5% of the mean diameter at breastheight (dbh) and mean height of the dominant trees(considered as the 100 largest-diameter trees perhectare) (HUMMEL et al., 1959).
The trees were felled leaving stumps ofaverage height of 0.12 m; total stem length wasmeasured to the nearest 0.01 m. The logs were cut at1 m intervals except the first, which was cut at 1.3 m(dbh). Number of rings was counted at each cross-sectioned point and then converted to stump age. Ascross-section lengths did not coincide with periodicheight growth (NIGH, 1995), there was adjusted theheight/age data from stem analysis to account for thisbias using Carmean’s method (CARMEAN, 1972),
Díaz-Maroto, I. J. et al.
____________________________________________________Ci. Fl., v. 20, n. 1, jan.-mar., 2010
59
and the modification by NEWBERRY (1991) for thetopmost tree section, based on earlier studies of Dyerand Bailey (1987). After examination of data of treeswith past height growth abnormalities, stem analysesof 56 trees were selected for modelling dominant heightthroughout the stand life. Descriptive statistics(number of sections, mean, minimum, maximum, andstandard deviation) of the selected data were calculatedfor total tree height grouped by age classes (Table 1).
Methods for constructing a site index model
According to Clutter et al. (1983), mosttechniques for site index curves construction can beviewed as special cases of three general methods: 1)
FIGURE 1: Location of Quercus pyrenaica plots in Galicia, NW Iberian Peninsula.FIGURA 1: Localização das parcelas de Quercus pyrenaica na Galicia, noroeste da Península Ibérica.
TABLE 1: Total section statistics given in meters (age class 5 = 1-9 years,…).TABELA 1: Estatísticas da seção total em metros (classe de idade 5 = 1-9 anos,....).
SD = Standard Deviation
the guide curve method, 2) the parameter predictionmethod, and 3) the Algebraic Difference EquationMethod. Although the three methods are not mutuallyexclusive, the difference equation method has beenthe preferred form and widely used by numerousauthors in order to develop site index curves (BAILEYand CLUTTER, 1974; CIESZEWSKI, 2003;CARVALHO and PARRESOL, 2005; DIÉGUEZ-ARANDA et al., 2005a, 2005b; ADAME et al., 2006;DIÉGUEZ-ARANDA et al., 2006).
The difference equation method makes useof dynamic site equations for modelling the dominantheight-age relationship (BAILEY and CIESZEWSKI,2000a; NORD-LARSEN, 2006). Dynamic siteequations have general form (omitting again the vector
Site index model for natural stands of rebollo oak (Quercus pyrenaica Willd.) ...
60
____________________________________________________Ci. Fl., v. 20, n. 1, jan.-mar., 2010
of model parameters): , where Y is thefunction’s value at age t, and Y0 is the referencevariable defined as the function’s value at age t0.Advantages of dynamic site equations have beenpointed out in several studies (e.g., CIESZEWSKI,2003): they are base-age-invariant, and they defineheight-growth and site index models as special casesof the same equation, two desirable properties in mostapplications. The invariant or unchanging propertyof dynamic equations refers to predicted heights: any
number of points on a specific site curve canbe used to make predictions for a given age t and thepredicted height Y will always be the same. Thisincludes forward and backward predictions, and thepath invariance property that ensures the result ofprojecting first from t0 to t1, and then from t1 to t2,being the same as that of the one-step projection fromt0 to t2. Nord-Larsen (2006) noted that some modelshave been called “base-age or reference-ageinvariant”, since do not have these comprehensiveinvariance properties.
Bailey and Clutter (1974) formalized thebase-age invariance property and presented atechnique for dynamic equation derivation which isknown in forestry as the Algebraic DifferenceApproach (ADA), and that essentially consists ofreplacing a base-model’s site-specific parameter withits initial-condition solution.
Cieszewski and Bailey (2000b) introduced ageneralization of the ADA, the Generalized AlgebraicDifference Approach (GADA), which can be used toderive the same models derived by the ADA. The mainadvantage of the GADA is that one can expand thebase equations according to various theories aboutgrowth characteristics (e.g., asymptote, growth rate),allowing more than one parameter to be site-specific,and letting the derivation of more flexible dynamicequations (see CIESZEWSKI, 2002 and 2003;CIESZEWSKI et al., 2007). It includes the ability tosimulate concurrent polymorphism and multipleasymptotes, an important property of site equations(CIESZEWSKI, 2002; KURINOBU et al., 2007).
Models considered
A large number of researchers have pointedto desirable attributes for site equations (BAILEYand CLUTTER, 1974; BAILEY and CIESZEWSKI,2000a; CIESZEWSKI, 2002 and 2003; NORD-LARSEN, 2006). The most frequently listed criteria
are: polymorphism, sigmoid growth pattern with aninflexion point, horizontal asymptote at old ages,logical behaviour (height should be zero at age zeroand equal to site index at reference age; the curveshould never decrease), base-age invariance, and pathinvariance (KURINOBU et al., 2007). The fulfilmentof these attributes depends on both the modelconstruction method and statistical procedures used,and it cannot always be achieved (BARRIO andDIÉGUEZ-ARANDA, 2005). Multiple asymptotesis also a desirable attribute (CIESZEWSKI, 2002),although some of the functions generally used have asingle asymptote. This may not be an importantproblem whether the behaviour of curves is suitablefor the range of ages that would be used in practice,and whether the single asymptote is achieved at veryold ages (CIESZEWSKI, 2004).
With these criteria in mind, there wereexamined different base models and tested severalvariants for each one which were developed using theGADA. Both one and two parameters were consideredto be site-specific. Finally, the efforts were focusedefforts on four dynamic equations. As generalnotational convention, a1, a2… an, were used todenote parameters in base models, while b1, b2…b m, were used for g lobal parameters insubsequent GADA formulations. All the GADAbased models have the general implicit form the
equation:.Two models were tested on the basis of the
function proposed by Bartalanffy (1949 and 1957)and formulated by Richards (1959), whose form canbe, for simplicity, represented as:
(1)Where: a1 is an asymptote or limiting value,
a2 is often called a “rate parameter”, and a3 is oftenreferred to as “an initial pattern parameter”. Thismodel is very flexible and has been frequently usedfor site-index curve development, including with theGADA approach (e.g., GARCÍA, 1983; BIGING,1985; CARVALHO and PARRESOL, 2005;DIÉGUEZ-ARANDA et al., 2005b).
The first model derived by applying theGADA to equation (1) considers only the shapeparameter a2 to be site-specific (in this case GADA isequivalent to the ADA). Its GADA formulation resultsare:
(2)The solution for X in equation (2) with initial
Díaz-Maroto, I. J. et al.
____________________________________________________Ci. Fl., v. 20, n. 1, jan.-mar., 2010
61
condition values t0 and Y0 for t andY, respectively, is:
(3)
Substituting X into equation (2) results in thefollowing dynamic equation that provides polymorphiccurves with a single asymptote:
(4)
To derive models with both polymorphismand variable asymptotes from equation (1), more thanone parameter has to be a function of site productivity.When the parameter a2 varies with site productivitynone of the other two parameters a1 or a3 can be used(together with a2) to model the site productivityresponses because, when a1 or a3 is a function of Xand the parameter a2 is also a function of X, the modelcannot be solved for X in a closed-form solution(CIESZEWSKI, 2004). Thus, in the second modelderived from equation (1) using the GADA both theasymptote a1 and the shape parameter a3 are assumedto be dependent on X. To facilitate such derivationthe base equation is re-parameterized into a form moresuitable for manipulation of these two parameters(using instead of a1 and taking the log of thefunction) as follows:
The site parameters can be conditioned to beconsistently proportional to each other’s inverse overthe site productivity dimension by the followingdefinitions:
(5)Which defines the following GADA
formulation:
(6)For this base equation, the solution for X
involves finding roots of a quadratic equation andselection of the most appropriate root to substituteinto the dynamic equation. The selection of the mostappropriate expression for X may depend on theequation parameters that in turn depend on the dataand the domain of the applicable ages (NORD-
LARSEN, 2006). The solution for X in equation (4)with initial condition values t0 and Y0 is:
Where:
Selecting the root more likely to be real and
positive (i.e., the one involving addition rather thansubtraction of the square root), and substituting it intoequation (4) results in the following dynamic equationthat provides polymorphic curves with variableasymptotes:
(7)
The subsequent models may be viewed asspecial cases of the log-logistic class of models, whichare equivalent to Hossfeld models (BAILEY andCIESZEWSKI, 2000a; NORD-LARSEN, 2006) andhave a long history in describing a wide variety ofpopulation dynamics. Monserud (1984) applied a log-logistic model to describe the height growth of inlandDouglas-fir in the northern Rocky Mountains basedon data from stem analysis of dominant trees.Cieszewski (2002; 2003) examined several GADAformulations utilizing the log-logistic model, whichcan be expressed generally as:
(8)
Where: a1 is the asymptote parameter, a2 isthe half-saturation parameter that defines the valueof at which, and u is alinear combination of log-transformations of theindependent variable(s) (MONSERUD, 1984;CIESZEWSKI, 2002).
Within the different forms investigated, theGADA based formulation by Cieszewski (2002) wasfound to perform particularly well. It considers theabove-mentioned u as a logarithmically transformed
function of age, such as . Therefore,equation (6) can be simplified as the Hossfeld model:
(9)
Cieszewski (2002) replaced a1 with a constantplus the unobserved site variable X, and a2 by,
Site index model for natural stands of rebollo oak (Quercus pyrenaica Willd.) ...
62
____________________________________________________Ci. Fl., v. 20, n. 1, jan.-mar., 2010
becoming the GADA formulation:
(10)
The solution for X involves again findingroots of a quadratic equation. With initial conditionvalues t0 and Y0 it is:
Selecting the root more likely to be real andpositive (i.e., the one involving addition rather thansubtraction of the square root), and substituting itinto equation (8) results in the following dynamicequation that provides polymorphic curves withvariable asymptotes:
(11)
The fourth model is the dynamic equationproposed by KcDill and Amateis (1992). It is basedon considering parameter a2 in equation (7) as site-specific. After applying the GADA, solving for X andsubstituting for initial condition values t0 and Y0 resultsin the following dynamic equation that providespolymorphic curves with a single asymptote:
(12)
Data structure and model fitting
The data structure used for fitting the fourmodels was arranged with all the possiblecombinations among height/age pairs for each tree,including descending growth intervals. All possiblegrowth intervals typically produce fitted models witha better predictive performance as compared to, forexample, forward moving first differences (GOELZand BURK, 1992; HUANG, 1999). However, thisdata structure may lead to the rejection of the errorassumptions because it automatically introduces alack of independence among observations (GOELZand BURK, 1992). Although the bibliography on theproper analysis of longitudinal data is available, themore complicated error structure of this type of datahas often been ignored in forestry (GREGOIRE etal., 1995), in part because least squares parameterestimates and resulting predictions are still unbiased
in the presence of this autocorrelation. However, leastsquares parameter estimates are no longer minimumvariance estimators; that is, the model mean squareerror may underestimate the variance of the errorterms, invalidating tests of significance (NETER etal., 1990). Autocorrelation can therefore have anadverse impact where the goal is to identifystatistically significant predictor variables. Becausethe aim of this study was to obtain the best site modelfor predicting height growth and site index estimationfor even-aged, single-species Quercus pyrenaicanatural stands in Galicia, initially we did not take intoaccount the autocorrelation being short ofindependence among observations because of the useof longitudinal data with temporal dependence withineach tree (NETER et al., 1990; BARRIO andDIÉGUEZ-ARANDA, 2005).
Furthermore, non independent observationsimply several disturbances as impartiality ofparameters, skewed standard error estimation... In thiscase, autocorrelation is modelled by expanding theerror term as an autoregressive process according tothis data structure, fitting the model throughgeneralized nonlinear least squares methods using theSAS/STATâ NLIN procedure adjusting data tree bytree (SAS INSTITUTE INC., 2004).
Model comparison
The comparison of the estimates for thedifferent models was based on numerical and graphicalanalyses of the residuals. Two statistical criteria wereexamined: root mean square error (RMSE) andcoefficient of determination for nonlinear models (R2)(RYAN, 1997). Although several shortcomings havebeen stated against the use of the R2 in nonlinearregression, the general usefulness of some globalmeasure of model adequacy would seem to overridesome of those limitations (MYERS, 1990; RYAN,1997). These expressions may be summarized as:
(13)
(12)
Where: is the correlation coefficient
between the measured (Yi) and estimated ( ) values
Díaz-Maroto, I. J. et al.
____________________________________________________Ci. Fl., v. 20, n. 1, jan.-mar., 2010
63
of the dependent variable, n is the total number ofobservations used to fit the model, and p is the numberof model parameters.
That is why the quality of fit does notnecessarily reflect the future prediction quality(MYERS, 1990). Assessment of the validity of themodel with an independent data set would be the mostdesirable (HUANG et al., 2003; KOZAK andKOZAK, 2003). Due to the scarcity of such data,several methods have been proposed (e.g., splittingthe data set or cross-validation and double cross-validation), although they seldom provide anyadditional information compared with the respectivestatistics obtained directly from models built fromentire data sets (KOZAK and KOZAK, 2003). Thelast step in evaluating the different fitted modelsconsisted of examining visually the residuals againstthe estimated values, and the fitted curves for differentsite indices overlaid on trajectories of the heights overtime. Visual inspection is essential for selecting themost accurate model, since curve profiles may differconsiderably, even though goodness-of-fit statisticsare similar (NETER et al., 1990).
Selection of reference age for site quality evaluation
Practical use of the model to estimate sitequality from any given pair of height and age requiresthe selection of a base age to which site index will bereferenced (CLUTTER et al., 1983). Inversely, siteindex and its associated base age could be used toestimate dominant height at any desired age (BAILEYand CLUTTER, 1974). The base age should beselected so that it is a reliable predictor of height atother ages (GOELZ and BURK, 1996), taking intoaccount the erratic height growth at young ages butconsidering that a young base age will help in earlierdecision making of the silvicultural treatments to bestands applied (DAVIS et al., 2001). In order toaddress this consideration, different base ages and theircorresponding observed heights were used to estimateheights at other ages for each tree. The results werecompared with the observed values from tree analyses,and the relative error in predictions (RE%) was thencalculated as follows:
(15)
Where: are the observed,
predicted and average values of the tree height,respectively, n is the total number of observations usedto fit the model, and p is the number of modelparameters.
RESULTS AND DISCUSSION
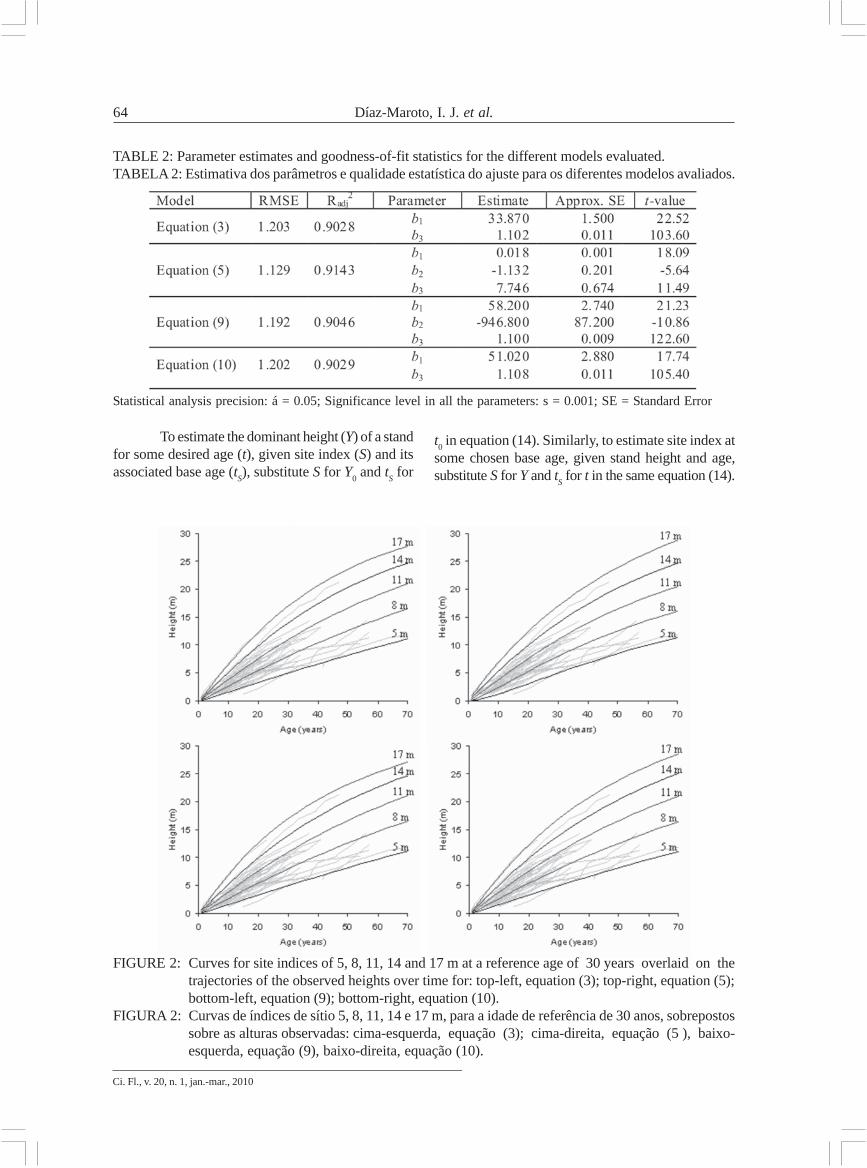
The parameter estimates for each model andtheir corresponding goodness-of-fit statistics areshown in Tables 2 and 3, respectively. The twodynamic equations developed considering only oneparameter to be site-specific, equations (3) and (10),in the base model described the data slightly worsethan the two-site-specific parameter models (Table2), and adjust the resultant model to managed data at90.3% of accuracy. Within the group with two site-specific parameters, equation (5) provided the bestresults, as indicated by the graphs that represent thefitted curves for different site indices (Figure 2) andthe goodness-of-fit statistics. This model explained91.4% of the total variability, and provided a randompattern of residuals around zero with homogeneousvariance and minor significant trends (by theimmaturity stands at reference age of 30 years), bothfor predicted heights and site indices (Figure 3). Theresults suggest that the one site-specific parametermodels could be adequate. Nevertheless, the two site-specific parameter equations fitted allow simulatingconcurrent polymorphism and multiple asymptotes,two desirable characteristics of site (CIESZEWSKI,2002; CIESZEWSKI et al., 2007).
Although this may be of secondaryimportance, equations that possess thesecharacteristics are more flexible, and better describea wide variety of height-age trends (NORD-LARSEN,2006). Thus, among the four dynamic equationsfinally evaluated for height growth prediction and siteclassification of even-aged, single-species rebollo oakin Galicia, equation (5) – the GADA formulationderived from the Bertalanffy-Richards model byconsidering parameters a1 and a3 as related to siteproductivity – was selected:
Where: Y0 and t0 represent the predictor height(meters) and age (years), Y is the predicted height aget, ,
and .
Site index model for natural stands of rebollo oak (Quercus pyrenaica Willd.) ...
64
____________________________________________________Ci. Fl., v. 20, n. 1, jan.-mar., 2010
To estimate the dominant height (Y) of a standfor some desired age (t), given site index (S) and itsassociated base age (tS), substitute S for Y0 and tS for
t0 in equation (14). Similarly, to estimate site index atsome chosen base age, given stand height and age,substitute S for Y and tS for t in the same equation (14).
Díaz-Maroto, I. J. et al.
TABLE 2: Parameter estimates and goodness-of-fit statistics for the different models evaluated.TABELA 2: Estimativa dos parâmetros e qualidade estatística do ajuste para os diferentes modelos avaliados.
Statistical analysis precision: á = 0.05; Significance level in all the parameters: s = 0.001; SE = Standard Error
FIGURE 2: Curves for site indices of 5, 8, 11, 14 and 17 m at a reference age of 30 years overlaid on thetrajectories of the observed heights over time for: top-left, equation (3); top-right, equation (5);bottom-left, equation (9); bottom-right, equation (10).
FIGURA 2: Curvas de índices de sítio 5, 8, 11, 14 e 17 m, para a idade de referência de 30 anos, sobrepostossobre as alturas observadas: cima-esquerda, equação (3); cima-direita, equação (5 ), baixo-esquerda, equação (9), baixo-direita, equação (10).
____________________________________________________Ci. Fl., v. 20, n. 1, jan.-mar., 2010
65Site index model for natural stands of rebollo oak (Quercus pyrenaica Willd.) ...
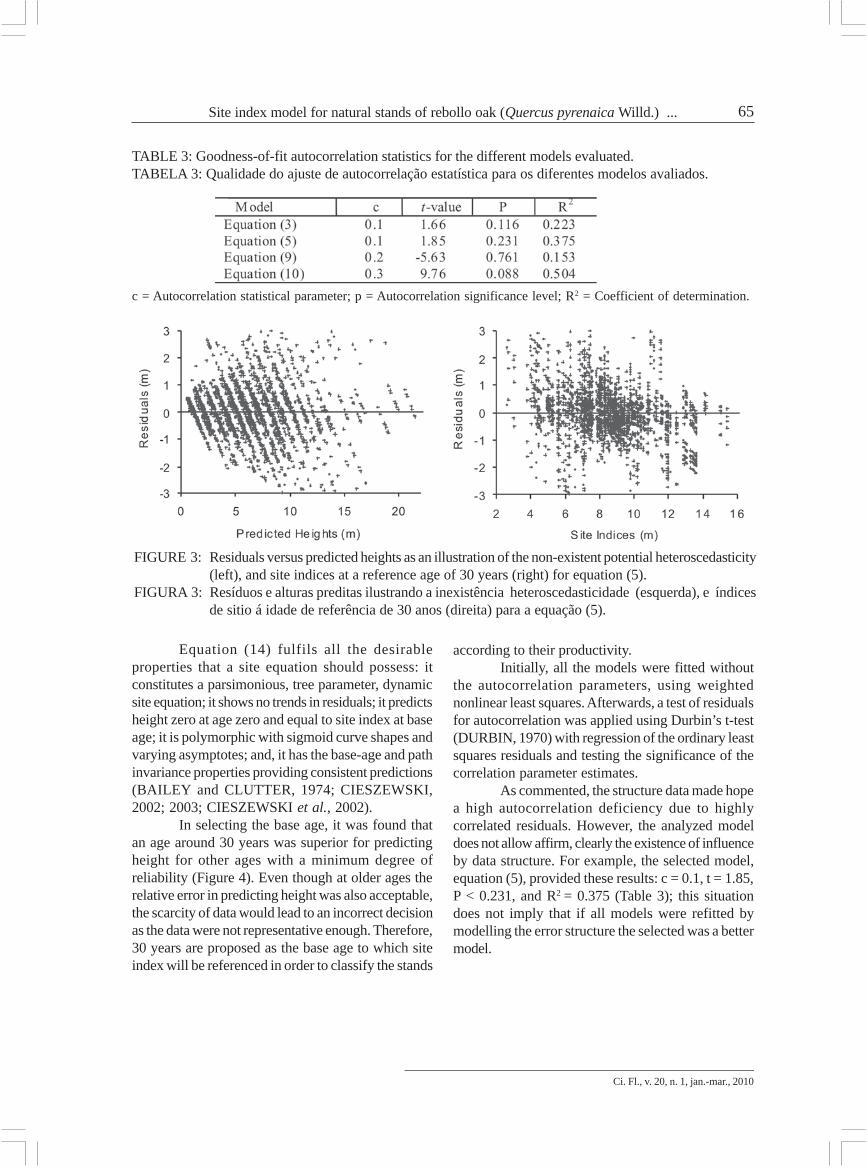
TABLE 3: Goodness-of-fit autocorrelation statistics for the different models evaluated.TABELA 3: Qualidade do ajuste de autocorrelação estatística para os diferentes modelos avaliados.
c = Autocorrelation statistical parameter; p = Autocorrelation significance level; R2 = Coefficient of determination.
FIGURE 3: Residuals versus predicted heights as an illustration of the non-existent potential heteroscedasticity(left), and site indices at a reference age of 30 years (right) for equation (5).
FIGURA 3: Resíduos e alturas preditas ilustrando a inexistência heteroscedasticidade (esquerda), e índicesde sitio á idade de referência de 30 anos (direita) para a equação (5).
Equation (14) fulfils all the desirableproperties that a site equation should possess: itconstitutes a parsimonious, tree parameter, dynamicsite equation; it shows no trends in residuals; it predictsheight zero at age zero and equal to site index at baseage; it is polymorphic with sigmoid curve shapes andvarying asymptotes; and, it has the base-age and pathinvariance properties providing consistent predictions(BAILEY and CLUTTER, 1974; CIESZEWSKI,2002; 2003; CIESZEWSKI et al., 2002).
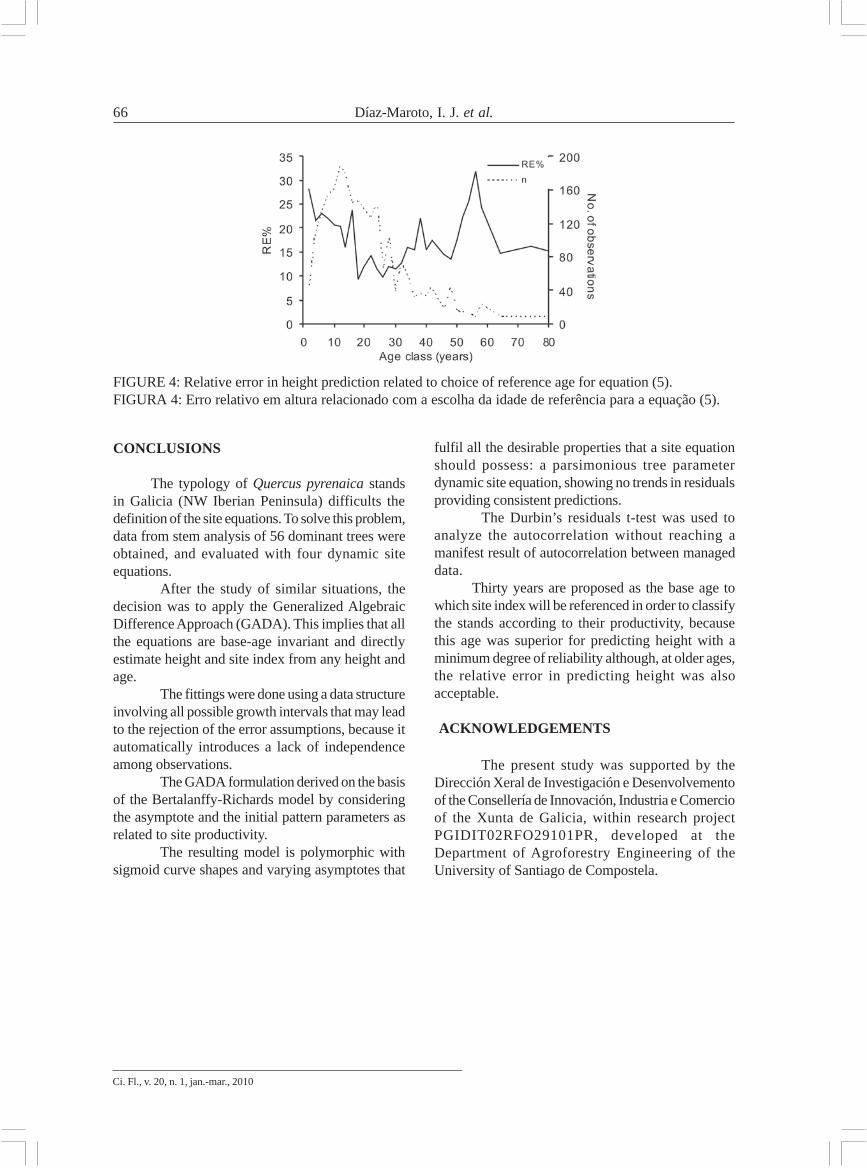
In selecting the base age, it was found thatan age around 30 years was superior for predictingheight for other ages with a minimum degree ofreliability (Figure 4). Even though at older ages therelative error in predicting height was also acceptable,the scarcity of data would lead to an incorrect decisionas the data were not representative enough. Therefore,30 years are proposed as the base age to which siteindex will be referenced in order to classify the stands
according to their productivity.Initially, all the models were fitted without
the autocorrelation parameters, using weightednonlinear least squares. Afterwards, a test of residualsfor autocorrelation was applied using Durbin’s t-test(DURBIN, 1970) with regression of the ordinary leastsquares residuals and testing the significance of thecorrelation parameter estimates.
As commented, the structure data made hopea high autocorrelation deficiency due to highlycorrelated residuals. However, the analyzed modeldoes not allow affirm, clearly the existence of influenceby data structure. For example, the selected model,equation (5), provided these results: c = 0.1, t = 1.85,P < 0.231, and R2 = 0.375 (Table 3); this situationdoes not imply that if all models were refitted bymodelling the error structure the selected was a bettermodel.
66
____________________________________________________Ci. Fl., v. 20, n. 1, jan.-mar., 2010
CONCLUSIONS
The typology of Quercus pyrenaica standsin Galicia (NW Iberian Peninsula) difficults thedefinition of the site equations. To solve this problem,data from stem analysis of 56 dominant trees wereobtained, and evaluated with four dynamic siteequations.
After the study of similar situations, thedecision was to apply the Generalized AlgebraicDifference Approach (GADA). This implies that allthe equations are base-age invariant and directlyestimate height and site index from any height andage.
The fittings were done using a data structureinvolving all possible growth intervals that may leadto the rejection of the error assumptions, because itautomatically introduces a lack of independenceamong observations.
The GADA formulation derived on the basisof the Bertalanffy-Richards model by consideringthe asymptote and the initial pattern parameters asrelated to site productivity.
The resulting model is polymorphic withsigmoid curve shapes and varying asymptotes that
Díaz-Maroto, I. J. et al.
FIGURE 4: Relative error in height prediction related to choice of reference age for equation (5).FIGURA 4: Erro relativo em altura relacionado com a escolha da idade de referência para a equação (5).
fulfil all the desirable properties that a site equationshould possess: a parsimonious tree parameterdynamic site equation, showing no trends in residualsproviding consistent predictions.
The Durbin’s residuals t-test was used toanalyze the autocorrelation without reaching amanifest result of autocorrelation between manageddata.
Thirty years are proposed as the base age towhich site index will be referenced in order to classifythe stands according to their productivity, becausethis age was superior for predicting height with aminimum degree of reliability although, at older ages,the relative error in predicting height was alsoacceptable.
ACKNOWLEDGEMENTS
The present study was supported by theDirección Xeral de Investigación e Desenvolvementoof the Consellería de Innovación, Industria e Comercioof the Xunta de Galicia, within research projectPGIDIT02RFO29101PR, developed at theDepartment of Agroforestry Engineering of theUniversity of Santiago de Compostela.
____________________________________________________Ci. Fl., v. 20, n. 1, jan.-mar., 2010
67
REFERENCES
ADAME, P. et al. Modelling dominant height growthand site index curves for rebollo oak (Quercus pyrenaicaWilld.). Annals of Forest Science, Nancy, v. 63, p. 929-940, dec. 2006. BAILEY, R. L.; CIESZEWSKI, C. J. Development of awell-behaved site-index equation: jack pine in north-central Ontario: comment. Canadian Journal of ForestResearch, Ottawa, v. 30, p. 1667-1668, Oct. 2000a.______. Generalized Algebraic Difference Approach:Theory based derivation of dynamic site equations withpolymorphism and variable asymptotes. Forest Science,Bethesda, v. 46, p. 116-126, Feb. 2000b.BAILEY, R. L.; CLUTTER, J. L. Base-age invariantpolymorphic site curves. Forest Science, Bethesda, v. 20,p. 155-159, June 1974.BARRIO, M.; DIÉGUEZ-ARANDA, U. Site quality ofpedunculate oak (Quercus robur L.) stands in Galicia(northwest of Spain). European Journal of ForestResearch, New York, v. 124, p. 19-28, Apr. 2005.BERTALANFFY, L. V. Problems of organic growth.Nature, London, v. 163, p. 156-158, Jan. 1949.______. Quantitative laws in metabolism and growth. TheQuarterly Review of Biology, Chicago, v. 32, p. 217-231, Sept. 1957.BIGING, G.S. Improved estimates of site index curvesusing a varying-parameter model. Forest Science,Bethesda, v. 31, p. 248-259, Mar. 1985.CARMEAN, W. H. Site index curves for upland oaks inthe Central States. Forest Science, Bethesda, v. 18, p.109-120, June 1972.CARVALHO, J. P. et al. O Carvalho Negral. Vila Real,Portugal: UTAD-CEGE, 2005. 206 p.CARVALHO, J. P.; PARRESOL, B. R. A site model forPyrenean oak (Quercus pyrenaica) stands using a dynamicalgebraic difference equation. Canadian Journal ofForest Research, Ottawa, v. 35, p. 93-99, Jan. 2005.CIESZEWSKI, C. J. Comparing fixed and variable-base-age site equations having single versus multipleasymptotes. Forest Science, Bethesda, v. 48, p. 7-23, Feb.2002.______. Developing a well-behaved dynamic site equationusing a modified Hossfeld IV function Y3 = (axm)/(c + xm-
1), a simplified mixed-model and scant subalpine fir data.Forest Science, Bethesda, v. 49, p. 539-554, AUG. 2003.______. GADA derivation of dynamic site equationswith polymorphism and variable asymptotes fromRichards, Weibull, and other exponential functions.Georgia: University of Georgia PMRC-TR, 2004. 16 p.CIESZEWSKI, C. J.; STRUB, M.; ZASADA, M. Newdynamic site equation that fits best the Schwappach datafor Scots pine (Pinus sylvestris L.) in Central Europe.Forest Ecology and Management, Amsterdam, v. 243,p. 83-93, May 2007.CLUTTER, J. L. et al. Timber management: a
quantitative approach. New York: Wiley & Sons, 1983.333 p.DAVIS, L.S. et al. Forest management: to sustainecological, economic, and social values. New York,EEUU: McGraw-Hill, 2001. 886 p.DGCONA. Tercer Inventario Forestal Nacional,Galicia (A Coruña, Lugo, Ourense y Pontevedra).Madrid, España: Ministerio de Medio Ambiente, 2001.122 p.DÍAZ-MAROTO, I. J.; VILA-LAMEIRO, P.; SILVA-PANDO. F. J. Autoecology of oaks (Quercus robur L.) inGalicia (Spain). Annals of Forest Science, Nancy, v. 62,p. 737-749, Mar. 2005.DÍAZ-MAROTO, I. J.; FERNÁNDEZ-PARAJES, J.;VILA-LAMEIRO, P. Autecology of rebollo oak (Quercuspyrenaica Willd.) in Galicia (Spain). Annals of ForestScience, Nancy, v. 63, p. 157-167, Mar. 2006.DÍAZ-MAROTO, I. J. et al. A comparison of theautecology of Quercus robur L. and Q. pyrenaica Willd.:present habitat in Galicia, NW Spain. Forestry,Edinburgh, v. 80, p. 223-239, July 2007.DIÉGUEZ-ARANDA, U. et al. Site quality equations forPinus sylvestris L. plantations in Galicia (northwesternSpain). Annals of Forest Science, Nancy, v. 62, p. 143-152, Mar. 2005a.DIÉGUEZ-ARANDA, U.; BURKHART, H. E.;RODRÍGUEZ-SOALLEIRO, R. Modelling dominantheight growth of radiata pine (Pinus radiata D. Don)plantations in north-western Spain. Forest EcologyManagement, Amsterdam, v. 215, p. 271-284, Aug.2005b.DIÉGUEZ-ARANDA, U. et al. Site quality curves forbirch stands in north-western Spain. Silva Fennica,Vantaa, v. 40, p. 631-644, Dec. 2006.DURBIN, J. Testing for serial correlation in least-squareregression when some of the regressors are laggeddependent variables. Econometrica, New York, v. 50, p.410-421, Mar. 1970.DYER, M. E.; BAILEY, R. L. A test of six methods forestimating true heights from stem analysis data. ForestScience, Bethesda, v. 33, p. 3-13, Mar. 1987.GARCÍA, O. A stochastic differential equation model forthe height growth of forest stands. Biometrics, New York,v. 39, p. 1059-1072, Dec.1983.GOELZ, J. C. G.; BURK, T. E. Development of a well-behaved site index equation: jack pine in north centralOntario. Canadian Journal of Forest Research, Ottawa,v. 22, p. 776-784, June1992.______. Measurement error causes bias in site indexequations. Canadian Journal of Forest Research,Ottawa, v. 26, p. 1586-1593, Sept. 1996.GREGOIRE, T.G.; SCHABENBERGER, O.; BARRETT,J. P. Linear modelling of irregularly spaced, unbalanced,longitudinal data from permanent-plot measurements.Canadian Journal of Forest Research, Ottawa, v. 25,p. 137-156, Jan. 1995.
Site index model for natural stands of rebollo oak (Quercus pyrenaica Willd.) ...

68
____________________________________________________Ci. Fl., v. 20, n. 1, jan.-mar., 2010
HUANG, S. Development of compatible height and siteindex models for young and mature stands within anecosystem-based management framework. In: AMARO,A.; TOMÉ, M. (Eds.) Empirical and process-basedmodels for forest tree and stand growth simulation.Lisboa, Portugal: Edições Salamandra-NovasTecnologias, 1999, p. 61-98.HUANG, S.; YANG, Y.; WANG, Y. A critical look atprocedures for validating growth and yield models. In:AMARO, A.; REED, D.; SOARES, P. (Eds.) Modellingforest systems. Wallingford, EEUU: CAB International,2003, p. 271-293.HUMMEL, F. C. et al. Code of sample plot procedure.London:, HMSO, 1959. 113 p. (Forestry CommissionBulletin 31).KOZAK, A.; KOZAK, R. Does cross validation provideadditional information in the evaluation of regressionmodels? Canadian Journal of Forest Research, Ottawa,v. 33, p. 976-987, 2003.KURINOBU, S. et al. A provisional growth model witha size-density relationship for a plantation ofParaserianthes falcataria derived from measurementstaken over 2 years in Pare, Indonesia. Journal of ForestResearch, Tokyo, v. 12, p. 230-236, June 2007.McDILL, M. E.; AMATEIS, R. L. Measuring forest sitequality using the parameters of a dimensionallycompatible height growth function. Forest Science,Bethesda, v. 38, p. 409-429, Apr. 1992.MESON, M. Aspectos autoecológicos de Quercuspyrenaica Willd.: distribución y climatología. BoletínEstación Central Ecología, Madrid, v. 12, p. 24-33,
Díaz-Maroto, I. J. et al.
Enero 1983.MONSERUD, R. A. Height growth and site index curvesfor inland Douglas-fir based on stem analysis data andforest habitat type. Forest Science, Bethesda, v. 30, p.943-965, Dec. 1984.MYERS, R. H. Classical and modern regression withapplications. 2 nd ed. Belmont: Duxbury Press, 1990.488 p.NETER, J.; WASSERMAN, W.; KUTNER, M. H.Applied linear statistical models: regression, analysis ofvariance and experimental designs. 3th ed. Boston: Irwin,1990. 842 p.NEWBERRY, J. D. A note on Carmean’s estimate ofheight from stem analysis data. Forest Science, Bethesda,v. 37, p. 368-369, Mar. 1991.NIGH, G. D. Compatibility improvements and biasreduction in height-age models. British Columbia:Forestry Division Services Branch, Ministry of Forest,Victoria, 1995. 10 p.NORD-LARSEN, T. Developing dynamic site indexcurves for European beech (Fagus sylvatica L.) inDenmark. Forest Science, Bethesda, v. 52, p. 173-181,Apr. 2006.RICHARDS, F.J. A flexible growth function for empiricaluse. Journal of Experimental Botany, Oxford, v. 10, p.290-300, June 1959.RYAN, T. P. Modern regression methods. John Wiley &Sons, New York. 1996. 515 p.SAS INSTITUTE INC. SAS/STAT® 9.1. User’s Guide.Cary: SAS Institute Inc. 2004. 128 p.