sixth patient report of the national emergency laparotomy
TRANSCRIPT

Sixth Patient Report of the National Emergency Laparotomy AuditDecember 2018 to November 2019
November 2020
ISBN: 978-1-900936-24-8
Citation for this Report: NELA Project Team. Sixth Patient Report of the National Emergency Laparotomy Audit RCoA London 2020
Cover: photograph taken by Alex Hare
© 2020 Healthcare Quality Improvement Partnership (HQIP)
The National Emergency Laparotomy Audit is commissioned by the Healthcare Quality Improvement Partnership (HQIP) as part of the National Clinical Audit and Patient Outcomes Programme (NCAPOP). HQIP is led by a consortium of the Academy of Medical Royal Colleges, the Royal College of Nursing, and National Voices. Its aim is to promote quality improvement in patient outcomes, and in particular, to increase the impact that clinical audit, outcome review programmes and registries have on healthcare quality in England and Wales. HQIP holds the contract to commission, manage and develop the National Clinical Audit and Patient Outcomes Programme (NCAPOP), comprising around 40 projects covering care provided to people with a wide range of medical, surgical and mental health conditions. The programme is funded by NHS England, the Welsh Government and, with some individual projects, other devolved administrations and crown dependencies: hqip.org.uk/national-programmes.
Whilst the Royal College of Anaesthetists has endeavoured to ensure that this document is as accurate as possible at the time it was published, it can take no responsibility for matters arising from circumstances which may have changed, or information which may become available subsequently.
All enquiries in regard to this document should be addressed to:
The National Emergency Laparotomy Audit, Royal College of Anaesthetists, Churchill House, 35 Red Lion Square, London WC1R 4SG020 7092 1676 [email protected] nela.org.uk
Design and layout by the Royal College of Anaesthetists
Sixth Patient Report of the National Emergency Laparotomy AuditDecember 2018 to November 2019
Sixth Patient Report of the National Emergency Laparotomy Audit 2020 | 1
Contents
Executive Summary 3
The Emergency Laparotomy patient perioperative journey 4
Acknowledgements 5
1 The NELA key messages and recommendations; improving outcomes and reducing complications 6
2 Introduction 8
3 Key findings of the sixth National Emergency Laparotomy Audit 9
4 Preoperative care 14
4.1 Who has emergency laparotomy surgery? 144.2 Timeliness of arrival in theatre 164.3 Radiology 174.4 Consultant input before surgery 184.5 Management of patients with peritonitis and sepsis 194.6 Risk assessment 20
5 Intraoperative care 26
5.1 What are the indications for emergency laparotomy? 265.2 What are the surgical findings at emergency laparotomy? 275.3 What are the procedures performed at emergency laparotomy? 285.4 Laparoscopic emergency bowel surgery 295.5 Consultant presence in theatre 30
6 Postoperative care 33
6.1 Postoperative admission to critical care 33
7 Care of the older patient 35
7.1 Frailty, age and patients having emergency laparotomy 357.2 Patients with learning disabilities (LD) or autism spectrum disorder (ASD) 387.3 Intraoperative deaths and end of life care pathways 39
8 Outcomes 40
8.1 Risk adjusted mortality 408.2 Length of stay (LOS) 438.3 Unplanned returns to theatre 448.4 Unplanned admission to critical care 45
Using NELA; impact beyond quality improvement and audit 46
References 47
Glossary 48
Sixth Patient Report of the National Emergency Laparotomy Audit 2020 | 2

An emergency laparotomy (emergency bowel surgery) is a surgical operation for patients, often with severe abdominal pain, to find the cause of the problem and treat it. General anaesthetic is used and usually an incision made to gain access to the abdomen. Emergency bowel surgery can be carried out to clear a bowel obstruction, close a bowel perforation and stop bleeding in the abdomen, or to treat complications of previous surgery. These conditions could be life-threatening. The National Emergency Laparotomy Audit was started in 2013 because studies showed this is one of the most risky types of emergency operation and lives could be saved and quality of life for survivors enhanced by measuring and improving the care delivered.
Churchill House, 35 Red Lion Square, London WC1R 4SG | 020 7092 1676 [email protected] nela.org.uk @NELANews
1
8
9
11
10
2
3
4
5
6
7Improvements in care have reduced patients’ average hospital stay from 19.2 days in 2013 to 15.4 days in 2019
84% of patients now receive a preoperative assessment of risk (up from 77% last year, and 56% in Year 1)
97% of high-risk patients had consultant surgeon input before surgery(95% in Year 4)
94% of high-risk patients had consultant anaesthetist input before surgery(88% in Year 4)
85% of high-risk patients admitted to critical care(80% in Year 4)
90.5% of patients received a preoperative CT scan
62% of these patients had their scan reported by a consultant radiologist
Both anaesthetic and surgeon consultant presence intraoperatively is at 88.5%, but only 77.4% out of hours
Over 1/4 of patients needing the most urgent of surgery did not get to the operating theatre in the recommended time frame
85% of patients with sepsis reached theatres in the appropriate timeframe
56% of patients are over the age of 65
Only 28.8% of frail patients over 65 had geriatrician input
Time to antibiotics in patients with sepsis remains poor with 79.7% not receiving antibiotics within one hour
Executive SummaryResults from 2018–2019, the sixth year of the National Emergency Laparotomy Audit
Principal performance statistics are available here
24,823 patients had emergency laparotomies in England and Wales
National 30-day mortality rate has fallen to 9.3%(11.8% in Year 1)
19.2 days 15.4 days
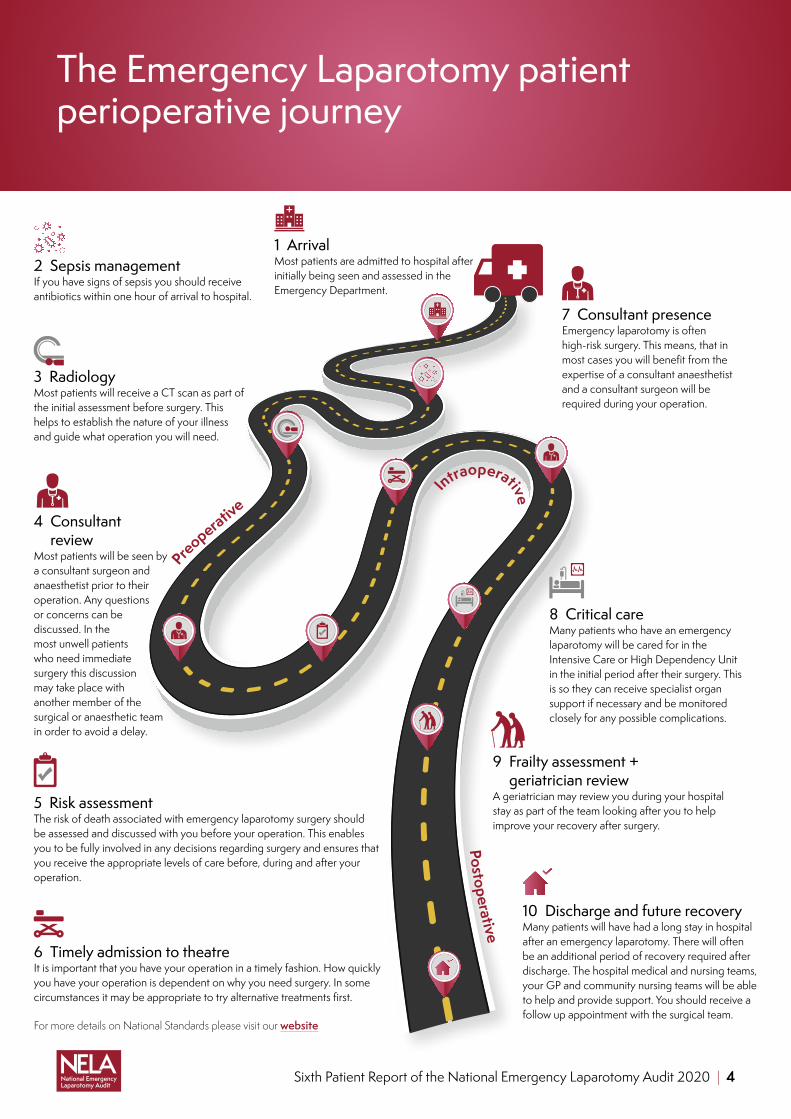
The Emergency Laparotomy patient perioperative journey
For more details on National Standards please visit our website
Sixth Patient Report of the National Emergency Laparotomy Audit 2020 | 4
3 RadiologyMost patients will receive a CT scan as part of the initial assessment before surgery. This helps to establish the nature of your illness and guide what operation you will need.
2 Sepsis managementIf you have signs of sepsis you should receive antibiotics within one hour of arrival to hospital.
4 Consultant review
Most patients will be seen by a consultant surgeon and anaesthetist prior to their operation. Any questions or concerns can be discussed. In the most unwell patients who need immediate surgery this discussion may take place with another member of the surgical or anaesthetic team in order to avoid a delay.
5 Risk assessmentThe risk of death associated with emergency laparotomy surgery should be assessed and discussed with you before your operation. This enables you to be fully involved in any decisions regarding surgery and ensures that you receive the appropriate levels of care before, during and after your operation.
6 Timely admission to theatreIt is important that you have your operation in a timely fashion. How quickly you have your operation is dependent on why you need surgery. In some circumstances it may be appropriate to try alternative treatments first.
7 Consultant presenceEmergency laparotomy is often high-risk surgery. This means, that in most cases you will benefit from the expertise of a consultant anaesthetist and a consultant surgeon will be required during your operation.
8 Critical careMany patients who have an emergency laparotomy will be cared for in the Intensive Care or High Dependency Unit in the initial period after their surgery. This is so they can receive specialist organ support if necessary and be monitored closely for any possible complications.
9 Frailty assessment + geriatrician review
A geriatrician may review you during your hospital stay as part of the team looking after you to help improve your recovery after surgery.
10 Discharge and future recoveryMany patients will have had a long stay in hospital after an emergency laparotomy. There will often be an additional period of recovery required after discharge. The hospital medical and nursing teams, your GP and community nursing teams will be able to help and provide support. You should receive a follow up appointment with the surgical team.
Postoperative
Intraoperative
Preoperative
1 Arrival Most patients are admitted to hospital after initially being seen and assessed in the Emergency Department.
Acknowledgements
This Report was prepared by:
Dr Sarah Hare Ms Sonia Lockwood Ms Cristel Santos
on behalf of members of the National Emergency Laparotomy Audit Project Team on behalf of the Royal College of Anaesthetists. The members of the project team at the time of writing were:
Dr Rachel Aitken Mr Iain AndersonDr Mike Berry Ms Hannah Boyd-Carson Dr Sara-Catrin CookMr Trevor Corrithers Mr Paul CrippsProfessor David Cromwell Ms Sharon DrakeMs Natalie Eugene Mr James Goodwin Ms Emily JasperMs Hannah Javanmard-EmamghissiDr Carolyn Johnston Dr Angela Kuryba Mr Jose LourtieDr Peter MartinProfessor Ramani Moonesinghe Professor Iain MoppettDr Dave Murray Dr Matt Oliver Dr LJ SpurlingDr Emma Stevens Dr Jennifer StewartMs Gillian Tierney Dr Kate WalkerMs Karen Williams
The NELA Project Team and Board would like to express their thanks to all clinical and non-clinical staff at all NHS trusts and Welsh health boards who collected and submitted data. We recognise that many staff are collecting and entering data in their own time and without additional resources. We commend their dedication to improving patient care. In particular we would like to thank the NELA Leads for their hard work, leadership and continued enthusiasm; without this engagement, patients would not have benefited from improved care and NELA would not be the success it has become over the last six years.
The NELA Project Team and Board would also like to thank the members of the NELA Clinical Reference Group for helping to shape the dataset and report.
Sixth Patient Report of the National Emergency Laparotomy Audit 2020 | 5
1 The NELA key messages and recommendations; improving outcomes and reducing complications
Local clinical teams should use the data from quarterly reports, and the contemporaneous webtool, to monitor their performance and patient outcomes. They can also use their benchmarked data to raise concerns or challenge apparent gaps in care pathways.
Commissioners of care, executive teams and senior leadership teams are responsible for providing adequate resources, financial investment and infrastructure targeted to enable the following NELA recommendations to be implemented.
KEY MESSAGE 1High-risk patients undergoing emergency laparotomy do not consistently benefit from perioperative consultant delivered care. Patient groups at risk of missing out on this include those needing surgery out of hours, and older patients (Chapter 4.4, 4.6 and 5.5).
Recommendation 1.1: Clinical teams must assess all patients’ risk of death and morbidity, using validated tools, ensuring other factors such as frailty, nutritional status, are recognised.
Recommendation 1.2: Clinical Directors and Medical Directors should ensure local workforce planning facilitates the consultant presence throughout the perioperative journey 24/7. This should include the wider multidisciplinary team such as geriatricians, radiologists, physicians and emergency department doctors.
KEY MESSAGE 2Since the introduction of the Best Practice Tariff (BPT) there has been an increase in the number of Trusts achieving the thresholds needed to be eligible for the enhanced tariff. The BPT metrics are consultant delivered care and admission to critical care after surgery for high-risk patients (Chapter 3).
Recommendation 2.1: All Trusts should use their local data to effect change; accessing and presenting it regularly to inform improvements in care pathways for many patients.
Recommendation 2.2: Clinical teams, audit teams, should use performance against the key NELA standards of care (via BPT report, excellence and exception reporting toolkit) as part of the structured review of processes of care. Use these and local outcome data to inform mortality reviews for patients who have undergone emergency laparotomy.
KEY MESSAGE 3Patients referred from a non-surgical specialty who need emergency laparotomy should be considered to be high-risk as a matter of course (Chapter 4.1 and Chapter 7).
Recommendation 3.1: Local NELA leads should include the wider multidisciplinary team such as geriatricians, radiologists, physicians and emergency department doctors in the design and delivery of the emergency laparotomy care pathway.
Sixth Patient Report of the National Emergency Laparotomy Audit 2020 | 6

KEY MESSAGE 4Most patients who require emergency laparotomy are admitted via the emergency department (ED). Admission to ED is the start point of the care pathway for many patients (Chapter 4).
Recommendation 4.1: Medical Directors, Clinical Directors and Leads should design and implement NELA pathways of care and improvement work that includes ED teams to ensure the most rapid, seamless management of these high-risk patients.
Recommendation 4.2: Medical Directors should direct Clinical Directors to broaden the local NELA team by appointing ED physicians as NELA clinical leads.
KEY MESSAGE 5Increased frailty is an independent marker of poor outcomes, and frail patients should be considered high-risk regardless of risk score. It is possible assessment of frailty may influence clinical decision making and processes of care. Despite this, consistent geriatrician input at hospital level remains variable with many older frail patients missing out on the care and expertise of geriatric and frailty teams (Chapter 7).
Recommendation 5.1: All clinicians who assess patients over the age of 65 must formally assess and document Frailty. Frailty scoring must be considered an integral part of a formal risk assessment.
Sixth Patient Report of the National Emergency Laparotomy Audit 2020 | 7

2 Introduction
†Some figures may differ from last year’s published RAG tables. This takes into account any updated data subsequently provided by local teams.‡Based on HES and PEDW estimated caseloads between December 2018 and November 2019.
This report is the sixth report of NELA and covers the care received by NHS patients in England and Wales who underwent an emergency laparotomy between 1 December 2018 and 30 November 2019. This reporting period did not include the COVID-19 pandemic: this data will appear in a subsequent report. This data is for clinicians, hospital teams, trust and hospital executive boards, and commissioners to use in order to understand their own processes of care and outcomes, whilst supporting quality improvement work. Patients are also encouraged to review their local hospital performance data.
Emergency laparotomy has one of the highest associated rates of death of all types of surgery performed, almost ten times greater than that of major elective gastrointestinal surgery.1 Despite this, emergency perioperative care pathways often fall short of the clinical standards, organisational structures and care processes that benefit most elective patients.2 NELA investigates processes of care and outcomes, and aims to highlight if there is variation in these for any specific patient group or for different operations performed. For patients, this means that they can be assured that hospitals and teams who actively participate in NELA activities are continually assessing whether they are providing the best quality care possible, and that there is continuous assurance that care is safe, effective, and timely.
In the post-COVID-19 era, as many hospital teams utilise the unique opportunity to re-configure historical estates layouts, care pathways and critical care areas this report is important in highlighting care processes that need improvement and that could be focussed upon. It is important to consider that the mortality and morbidity from emergency general surgery still presents a higher risk to most patients than infection with SARS-COVID 2 and that even during a global pandemic, this group of patients remain a priority for the Multidisciplinary Team.
The RAG tables provide a summary of hospital performance indicators and are available here.†
Number of patients (%) Case ascertainment rate‡
England 23,041 (92.8%) 83.6%
Wales 1,782 (7.2%) 95.9%
Overall 24,823 84.5%
Total number of hospitals included in year 6 report across England and Wales = 176
Sixth Patient Report of the National Emergency Laparotomy Audit 2020 | 8

3 Key findings of the sixth National Emergency Laparotomy Audit
§Full comparative details and individualised hospital level reports are provided online.¶Based on HES and PEDW estimated caseloads between December 2018 and November 2019.
Key process measure§
Final case ascertainment¶
■ 179 hospitals were included in this metric. Overall case ascertainment was 84.5%. Overall 121 hospitals were rated green and 20 were rated red.
Data from Hospital Episode Statistics (HES) and Patient Episode Database for Wales (PEDW) for England and Wales are used to calculate the expected annual number of emergency laparotomies that take place in each hospital. This allows calculation of case ascertainment rates.
Case ascertainment for each hospital are shown in the RAG table. Hospitals with a low case ascertainment may not have provided enough information on enough patients for audit results to accurately reflect the quality of their patient care.
This year NELA has included ‘data completeness’ indicator in the hospital level reports to help local teams assess the quality of their own data. Clinical teams need to have confidence in the quality of their audit data; it needs to be accurate, complete, reliable, timely and ultimately fit for purpose if they are to be able to use it to support changing practice or processes of care.
How to improve data completeness:
■ teams can regularly check the real time data on the NELA webtool for how many, and which cases are ‘locked’ and submitted
■ using the webtool, teams should perform regular benchmarking exercise against local, AHSN and national level data
■ teams can find further details in the NELA quarterly and BPT reports for case ascertainment.
This year we have included Quality Improvement Activity Boxes (TASKS FOR TRUSTS) to help guide future quality improvement work in the key areas that have failed to show significant improvement over the last six years. There are several regional opportunities, such as collaborative improvement events, that focus upon emergency laparotomy for Trusts and Health Boards to report back on completing these tasks and to share their learning.
Sixth Patient Report of the National Emergency Laparotomy Audit 2020 | 9

Table 3.1 Trends in proportions of patients meeting standards nationally, and trends in proportions of hospitals RAG rated green in NELA patient reports for the key standards and supporting process measures (excluded hospitals with less than ten eligible cases)**
Key process measures since Year 4 NELA Audit
Year 4(Dec 16 - Nov 17)
Year 5 (Dec 17 - Nov 18)
Year 6 (Dec 18 - Nov 19)
n = 24383 n = 24718 n = 24823
64.2% 62.4% 62.3% 7 2 5n = 24383 n = 24718 n = 24823
74.5% 77.2% 84.0% 54 66 95n = 24383 n = 24718 n = 24823
82.5% 82.5% 82.8% 76 67 82n = 17471 n = 17932 n = 18324
85.0% 87.7% 91.4% 99 123 152n = 12261 n = 12033 n = 11894
95.0% 95.5% 96.9% 160 163 169n = 12261 n = 12033 n = 11894
88.4% 90.7% 93.9% 126 137 158n = 12261 n = 12033 n = 11894
62.4% 65.8% 71.4% 16 22 35n = 12009 n = 12031 n = 11893
82.3% 83.7% 88.5% 84 100 128n = 12262 n = 12034 n = 11894
91.7% 92.6% 94.8% 146 152 165n = 12262 n = 12034 n = 11894
Proportion of patients with a preoperative risk of death >5% who had input from a consultant intensivist prior to surgery
Proportion of patients with a preoperative risk of death ≥5% who had input from a consultant anaesthetist prior to surgery
Proportion of patients with a preoperative risk of death ≥5% who had input from a consultant surgeon prior to surgery
Proportion of patients with a preoperative risk of death ≥5% who had input from a consultant surgeon and consultant anaesthetist prior to surgery
Proportion of patients with a calculated preoperative risk of death ≥5% for whom a consultant surgeon was present in theatre
Proportion of patients with a preoperative risk of death ≥5% for whom a consultant surgeon and consultant anaesthetist were present in theatre
National figures
Each high-risk case should be reviewed by a consultant surgeon, anaesthetist, intensivist
Each high-risk case should have a consultant surgeon, anaesthetist present in theatre during surgery.
Hospitals which admit patients as emergencies must have access to both conventional radiology and CT scanning 24 hours per day, with immediate reporting
An assessment of mortality risk should be made explicit to the patient and recorded clearly on the consent form and in the medical record
Trusts should ensure theatre access matches need and ensure prioritization of access is given to emergency surgical patients ahead of elective patients whenever necessary
Trend over time
Process measure Percentage of Hospitals achieving RAG standards by NELA audit year
Proportion of patients arriving in theatre within a time appropriate for the urgency of surgery
Proportion of patients in whom a risk assessment was documented preoperatively
Proportion of all emergency laparotomy patients who received a preoperative CT report by an in-house consultant radiologist
Yr4 Yr5 Yr6
Number of Hospitals Green RAG ratedKey standard
0255075
100125150
1 2 3 4 5 6
0255075
100125150
1 2 3 4 5 6
0255075
100125150
1 2 3 4 5 6
0255075
100125150
1 2 3 4 5 6
0255075
100125150175
1 2 3 4 5 6
0255075
100125150175
1 2 3 4 5 6
0255075
100125150175
1 2 3 4 5 6
0255075
100125150175
1 2 3 4 5 6
0255075
100125150175
1 2 3 4 5 6
Sixth Patient Report of the National Emergency Laparotomy Audit 2020 | 10
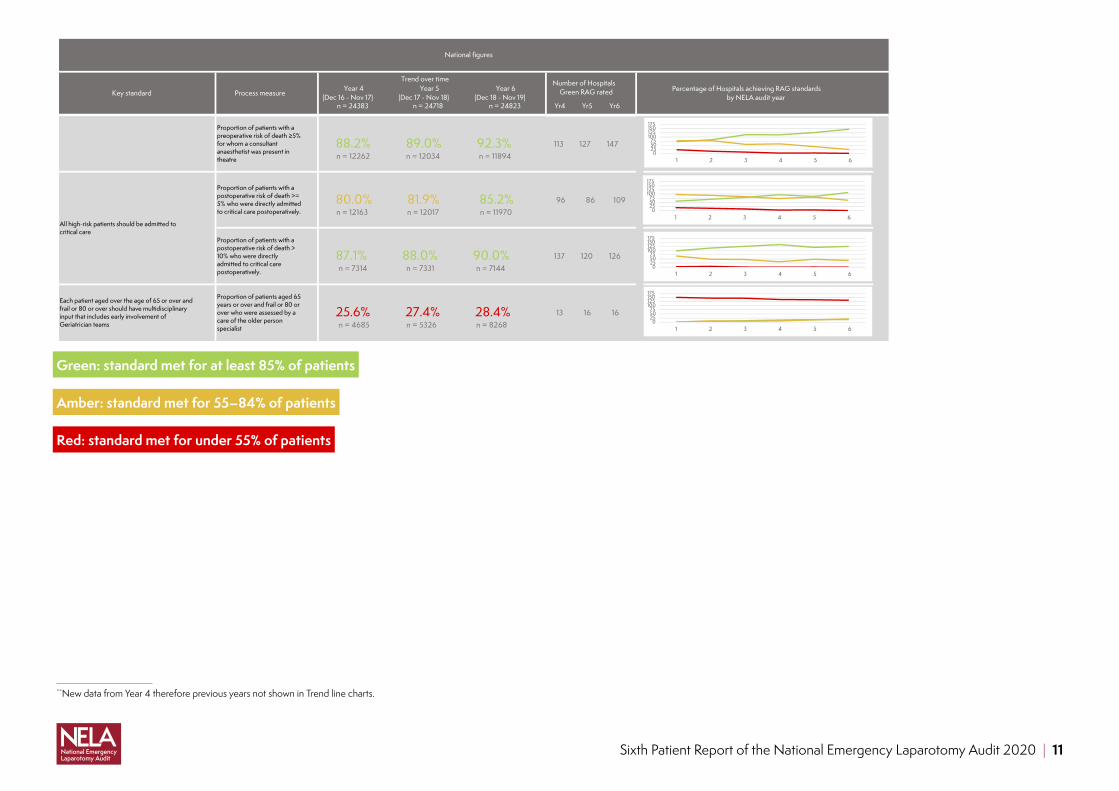
Green: standard met for at least 85% of patients
Amber: standard met for 55–84% of patients
Red: standard met for under 55% of patients
**
**New data from Year 4 therefore previous years not shown in Trend line charts.
Year 4(Dec 16 - Nov 17)
Year 5 (Dec 17 - Nov 18)
Year 6 (Dec 18 - Nov 19)
n = 24383 n = 24718 n = 24823
National figures
Trend over time
Process measure Percentage of Hospitals achieving RAG standards by NELA audit year
Yr4 Yr5 Yr6
Number of Hospitals Green RAG ratedKey standard
88.2% 89.0% 92.3% 113 127 147n = 12262 n = 12034 n = 11894
80.0% 81.9% 85.2% 96 86 109n = 12163 n = 12017 n = 11970
87.1% 88.0% 90.0% 137 120 126n = 7314 n = 7331 n = 7144
25.6% 27.4% 28.4% 13 16 16n = 4685 n = 5326 n = 8268
Proportion of patients aged 65 years or over and frail or 80 or over who were assessed by a care of the older person specialist
Proportion of patients with a postoperative risk of death >= 5% who were directly admitted to critical care postoperatively.
Proportion of patients with a preoperative risk of death ≥5% for whom a consultant anaesthetist was present in theatre
Each patient aged over the age of 65 or over and frail or 80 or over should have multidisciplinary input that includes early involvement of Geriatrician teams
All high-risk patients should be admitted to critical care
Proportion of patients with a postoperative risk of death > 10% who were directly admitted to critical care postoperatively.
0255075
100125150175
1 2 3 4 5 6
0255075
100125150175
1 2 3 4 5 6
0255075
100125150175
1 2 3 4 5 6
0255075
100125150175
1 2 3 4 5 6
Sixth Patient Report of the National Emergency Laparotomy Audit 2020 | 11

Figure 3.1.1 Proportion of all emergency laparotomy patients in Year 6 who had surgery between December 2018 and November 2019, who received key standards of care
62%
84%
91%
97%
94%
71%
83%89%
95%
92%
85%
90%
28%
0
20
40
60
80
100
CT Performed & Reported Pre-op
Risk Documented Pre-op
Pre-op Input by Surgeon & Anaesthetist for High risk
Patients
Pre-op Input by Surgeon for High Risk Patients
Pre-op Input by Anaesthetist for High Risk Patients
Pre-op Input by Intensivist for High Risk Patients
Access to Theatres without DelayPresence of Surgeon & Anaesthetist
in Theatre for High Risk Patients
Presence of Surgeon in Theatre for High Risk Patients
Presence of Anaesthetist in Theatre for High Risk Patients
Admission to Critical Care Post-op for High Risk Patients
Admission to Critical Care Post-op for Highest RiskPatients
Post-op Input from a Care of the Older Person Specialistfor Patients ≥ 65 frail or ≥ 80 yrs
Year 6 Year 5
Impact of Best Practice TariffThis is the first year of reporting NELA data since the introduction of an emergency laparotomy BPT in England. The BPT focussed on two key standards of care: consultant anaesthetist and surgeon presence intraoperatively and direct admission to critical care for high-risk patients after their operation. As the tariff applies to only high-risk patients, assessment of risk was a key process for most sites working to improve their eligibility for the tariff. All Trusts were required to introduce an emergency laparotomy pathway as a precursor to access the BPT.
Improvements in care were also supported by the work undertaken by the Academic Health Science Network (AHSN) national spread programme for the Emergency Laparotomy Collaborative. This brought together regional collaboratives facilitated by each of England’s 15 AHSNs. As the introduction of the BPT was a key change for many providers in England, the AHSN networks undertook much of their collaborative work focusing on the BPT metrics. The impact of this work will be published in a full evaluation of the national spread programme in due course.
Figure 3.1.2 Proportion of eligible Trusts who have achieved the BPT target (80%) (BPT introduced in April 2019)
62 68 71 78
64 56 57 52
0%
25%
50%
75%
100%
Q4 (J an to Mar 2019)
Q1 (Apr to Jun 2019)
Q2 (J ul to Sep 2019)
Q3 (Oct to Dec 2019)
Prop
ortio
n of
elig
ible
Trus
ts
Number of TrustsBPT not met
BPT met
Sixth Patient Report of the National Emergency Laparotomy Audit 2020 | 12

Figure 3.1.3 Proportion of all emergency laparotomy patients who meet the standards for BPT, both before and after its introduction
0
10
20
30
40
50
60
70
80
90
100D
ec 2
016
F eb
2017
Apr
201
7
J un
2017
Aug
2017
Oct
201
7
Dec
201
7
Feb
2018
Apr
201
8
Jun
2018
A ug
2018
Oct
201
8
Dec
201
8
Feb
2019
Apr
201
9
J un
2019
A ug
2019
Oct
201
9
Dec
201
9
Prop
ortio
n of
pat
ient
s
BPT achieved in all High Risk patients
CCU admission for High Risk patients
Consultant presence for High Risk patients
Risk Assessment for High Risk patients
BPT
date
Sixth Patient Report of the National Emergency Laparotomy Audit 2020 | 13

4 Preoperative care
4.1 Who has emergency laparotomy surgery?Patients needing emergency bowel surgery are heterogeneous in their demographics and pathology, but they all need access to the same processes of care to achieve the best possible outcomes.
24,823 patients were entered into the audit, from
176 hospitalsin England and Wales
assessed as high-risk with a NELA
predicted mortality risk of ≥5%
45.8%
required surgery within six hours
50%have emergency laparotomy after an emergency admission
to hospital
94%undergoing emergency
laparotomy are admitted via the Emergency Department
Almost¾ of
patients
52%Female
48%Male
Figure 4.1.1 Number of hours to consultant surgeon review, from admission, by admitting specialty
73hrs68hrs
72hrs
46hrs
11hrs
0
50
100
150
Gastroenterology Elderly Care Other General Medicine General SurgeryAdmitting Specialty
Tim
e in
hou
rs
NOTE: Median time (in hours) and interquartile range (IQR)
Sixth Patient Report of the National Emergency Laparotomy Audit 2020 | 14

Figure 4.1.2 Association between admitting specialty and outcomes for patients undergoing emergency laparotomy
Elde
rly C
are
Gen
eral
Med
icin
e
Oth
er
Gas
troen
tero
logy
Gen
eral
Sur
gery
0
5
10
15
20
25
0
5
10
15
20
2530 day ONS Mortality (%)
Median LOS (days)
ALERT! Patients admitted under non-surgical specialties have a higher predicted risk profile, higher mortality and longer length of stay after their emergency laparotomy than those who are admitted initially under the surgeons. Patients undergoing an emergency laparotomy after admission to a non-surgical speciality should be considered high-risk. NELA does not report the reasons for their initial admission, which may be for a non-surgical reason. However the impact of possible co-existant medical co-morbidities must be recognised by anaesthetic and surgical teams.
Improvement opportunity: Examine the care of patients admitted to non-surgical specialties ensuring they access emergency laparotomy surgery in the same timescale as those admitted to hospital under general surgical teams.
Actions: Use your NELA data to understand the average and spread of time periods between admission and arrival in the operating theatre in your hospital. How do these differ for those admitted under surgical and non-surgical teams? Map out the steps between admission and arrival in the operating theatre for those under surgical and non-surgical teams. Key areas to examine include any delays in detecting an acutely unwell or deteriorating surgical patient on a medical ward, delays in referral and initial surgical assessment, delay in making a decision to operate, due to delays in accessing a senior surgical decision maker and delays in transfer to the operating theatre these cases in detail. Improvements may include training on measurement of early warning scores, making speciality referral pathways clearer and more reliable, changing working patterns or policies to ensure the initial assessment is by a senior surgical decision maker. Are there any delays in surgical assessment, investigations, treatment or accessing theatres that teams can work on to improve outcomes? Do you have a forum to discuss these issues across your teams – nominated a NELA lead/liaison or a scheduled meeting/reporting structure where you can disseminate your data and discuss pathway improvements?
Sixth Patient Report of the National Emergency Laparotomy Audit 2020 | 15
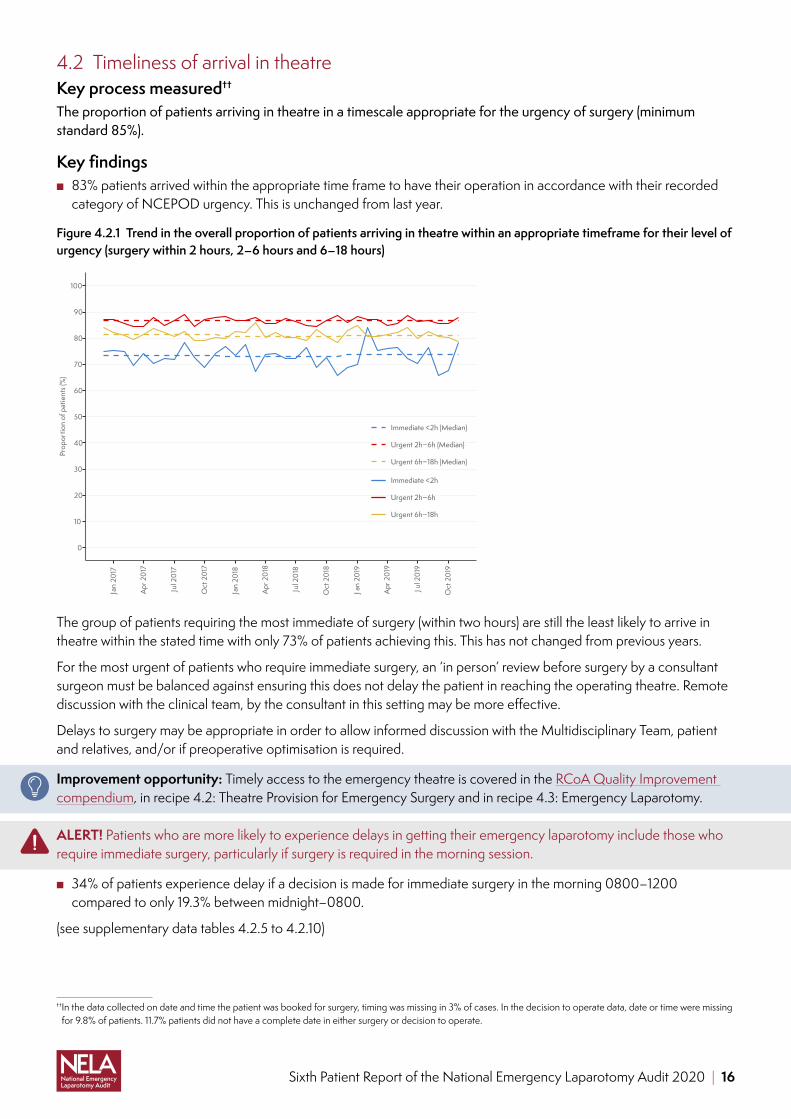
4.2 Timeliness of arrival in theatreKey process measured††
The proportion of patients arriving in theatre in a timescale appropriate for the urgency of surgery (minimum standard 85%).
Key findings ■ 83% patients arrived within the appropriate time frame to have their operation in accordance with their recorded
category of NCEPOD urgency. This is unchanged from last year.
Figure 4.2.1 Trend in the overall proportion of patients arriving in theatre within an appropriate timeframe for their level of urgency (surgery within 2 hours, 2–6 hours and 6–18 hours)
0
10
20
30
40
50
60
70
80
90
100
Jan
2017
Apr
201
7
Jul 2
017
Oct
201
7
Jan
2018
Apr
201
8
Jul 2
018
Oct
201
8
Jan
2019
Apr
201
9
Jul 2
019
Oct
201
9
Prop
ortio
n of
pat
ient
s (%
)
Immediate <2h (Median)
Urgent 2h−6h (Median)
Urgent 6h−18h (Median)
Immediate <2h
Urgent 2h−6h
Urgent 6h−18h
The group of patients requiring the most immediate of surgery (within two hours) are still the least likely to arrive in theatre within the stated time with only 73% of patients achieving this. This has not changed from previous years.
For the most urgent of patients who require immediate surgery, an ‘in person’ review before surgery by a consultant surgeon must be balanced against ensuring this does not delay the patient in reaching the operating theatre. Remote discussion with the clinical team, by the consultant in this setting may be more effective.
Delays to surgery may be appropriate in order to allow informed discussion with the Multidisciplinary Team, patient and relatives, and/or if preoperative optimisation is required.
Improvement opportunity: Timely access to the emergency theatre is covered in the RCoA Quality Improvement compendium, in recipe 4.2: Theatre Provision for Emergency Surgery and in recipe 4.3: Emergency Laparotomy.
ALERT! Patients who are more likely to experience delays in getting their emergency laparotomy include those who require immediate surgery, particularly if surgery is required in the morning session.
■ 34% of patients experience delay if a decision is made for immediate surgery in the morning 0800–1200 compared to only 19.3% between midnight–0800.
(see supplementary data tables 4.2.5 to 4.2.10)
†† In the data collected on date and time the patient was booked for surgery, timing was missing in 3% of cases. In the decision to operate data, date or time were missing for 9.8% of patients. 11.7% patients did not have a complete date in either surgery or decision to operate.
Sixth Patient Report of the National Emergency Laparotomy Audit 2020 | 16

4.3 RadiologyAccurately reported CT scanning is an important diagnostic tool to support timely decision making, appropriate resuscitation and prioritisation of patients during the initial management phase.3 It is now accepted that enhanced access to cross sectional imaging should be considered a minimum standard within an emergency laparotomy pathway.4
Key Process Measure‡‡
The proportion of patients who received a CT scan which was reported by an in-house consultant radiologist before surgery (minimum standard 85%).
■ Key Finding 1: 62% of patients had a CT scan which was reported by an in-house consultant radiologist before surgery (Figure 4.3.1).
■ Key Finding 2: 90.5% of patients had a preoperative CT scan performed, compared with 80% in Year 1.
Figure 4.3.1 Trend in the overall proportion of patients receiving a CT scan preoperatively and CT scans being reported by a consultant radiologist preoperatively (note, this metric only includes in-house consultant for Year 5 and 6, whereas Year 1–3 also included outsourced reports
0
10
20
30
40
50
60
70
80
90
100
Nov
201
3
Feb
2014
May
201
4
Aug
2014
Nov
201
4
Feb
2015
May
201
5
Aug
2015
Nov
201
5
Feb
2016
May
201
6
Aug
2016
Nov
201
6
Feb
2017
May
201
7
Aug
2017
Nov
201
7
Feb
2018
May
201
8
Aug
2018
Nov
201
8
Feb
2019
May
201
9
Aug
2019
Nov
201
9
Feb
2020
Month of Surgery
Prop
ortio
n of
pat
ient
s (%
)
CT performed
CT performed (median)
CT performed and reported
CT performed and reported (median)
Who reports CT scans?Patients are less likely to have a CT scan performed and reported preoperatively by an in-house consultant radiologist if they require immediate surgery (<2hours). NELA data demonstrates that the use of outsourced radiology reporting services has increased to 17.8% (14.8% in year 5 NELA) despite there being a reported increased reporting discrepancy rate in out-sourced reported scans. The accepted discrepancy rate3 is 5% regardless of who reports the CT scan.§§
ALERT! Discrepancy rates between the CT and the surgical findings are higher for those in whom the scan was reported by an outsourced radiology service. This remains unchanged from last year.5
‡‡Data on CT performed was missing in 0.5% of cases (‘unknown’ selected). This decreased from 1.3% in year 1. The method of CT reporting was unknown in 3.3% of cases.§§ The definition of discrepancy was developed in conjunction with the Royal College of Radiologists and refers to a discrepancy between the reported CT and surgical
findings. We are unable to state if discrepancies are related to the initial report or regarding any addendums. Similarly, despite out-sourced reports mainly being done by consultants, in-house consultant reports are defined as the gold standard as per the Royal College of Radiologists recommendations.
Sixth Patient Report of the National Emergency Laparotomy Audit 2020 | 17

What clinical factors affect CT reporting discrepancy rates? Overall discrepancy rates according to person reporting the scans are:
■ In-house consultant discrepancy rate 5.3% ■ In-house registrar discrepancy rate 4.6% ■ Outsourced radiology service discrepancy rate 6.2% ■ The highest discrepancy rate (8%) is seen in patients who are found to have either ischaemia or bleeding at
emergency laparotomy. ■ The more urgent the need for surgery, the higher the discrepancy rate between the CT report and surgical findings.
A discrepancy rate of 6.9% is seen in patients requiring immediate surgery (<2 hours) compared with 4.1% for those who require expedited surgery (>18 hours).
■ The discrepancy rate is higher (7.4%) where there has been a preoperative discussion between consultant surgeon and radiology team compared to a rate of 3.9% where there has been no discussion. This may represent that multi- disciplinary discussions are more likely in complex patients where the diagnosis is unclear.
■ CT discrepancy rate does not appear to be influenced by volume of emergency laparotomies performed. ■ Discrepancy rate ranged between hospitals from 0 and 16.7%.
4.4 Consultant input before surgeryThe advantages of consultant led care throughout the perioperative journey include not only clinical expertise, but also rapid decision making, management and leadership in time critical situations, efficient use of resources, support of junior doctors and improved outcomes.6
Key Process Measures¶¶
The proportion of patients who had preoperative input by a consultant anaesthetist before surgery when the calculated risk of death ≥ 5%
■ Key finding: 94% patients who are high-risk have consultant anaesthetist input before their surgery.
Key Process Measures¶¶
The proportion of patients who had preoperative input by a consultant surgeon before surgery when the calculated risk of death ≥ 5%
■ Key finding: 97% patients who are high-risk have consultant surgeon input before their surgery.
Key Process Measures¶¶
The proportion of patients who had preoperative input by a consultant intensivist before surgery when the calculated risk of death ≥ 5%
■ Key finding: 71% patients who are high-risk have consultant intensivist input before their surgery.
There is no variation according to the time of day, or day of the week (see supplementary data tables 4.4.11 to 4.4.16)
¶¶ In 2.6% of cases, data on consultant surgeon input was missing (‘unknown’ selected). Consultant anaesthetist input was unknown in 4.2% of cases. Intensivist preoperative involvement was not known in 6.9% of cases.
Sixth Patient Report of the National Emergency Laparotomy Audit 2020 | 18

Figure 4.4.1 Proportion of high-risk patients reviewed by both a consultant surgeon and consultant anaesthetist in person or by discussion, by time of day and day of the week of admission
93%
95%
90%
92%
92%
88%
93%
89%
92%
92%
92%
91%
93%
93%
92%
93%
92%
90%
91%
92%
93%
92%
92%
90%
93%
91%
92%
91%
00:00 to 08:00
08:00 to 12:00
12:00 to 18:00
18:00 to 00:00
Mon Tue Wed Thu Fri Sat SunDay of the week
Tim
e of
the
day
85
90
95
100
4.5 Management of patients with peritonitis and sepsisSepsis is one of the most significant causes of deterioration and critical illness.7 Around 25–35,000 patients each year in the UK will have an intra-abdominal source of infection. Whilst not all require emergency laparotomy surgery, it is clear that the rapid administration of antibiotics and definitive source control is crucial in improving outcomes for this cohort of patients.
ALERT! Comparisons with previous NELA reports demonstrated that there was little improvement in the time taken to give antibiotics, or the time to take these patients to theatre for surgery.
Key findings
25% have signs of sepsis
20.5% have signs of peritonitis
92.7% require urgent surgery
85% arrive within timeframe
71% cared for in critical care
15.1% sepsis 30-day mortality
(see supplementary data tables 4.5.1, to 4.5.3 and tables 4.5.6 to 4.5.8).
Improvement opportunity: To ensure reliable and timely antibiotic administration to patients who need an emergency laparotomy with signs of sepsis.
Actions: Use the NELA sepsis dashboards to describe key standards of care in patients with sepsis (prompt administration of antibiotics, measurement of lactate and timely access to operating theatres, shown below). Examine the care of patients who fail to meet the above standards, who are listed within the sepsis dashboard. The care can be examined as case reviews in multidisciplinary morbidity and mortality meetings or linking to your hospital’s surviving sepsis work. Action plans to improve the care for patients with sepsis will cross many departments and include improved cross specialty working, better use of data and improving the reliability of sepsis care bundles.
Sixth Patient Report of the National Emergency Laparotomy Audit 2020 | 19

This is an example of a hospital’s antibiotic administration chart, visible in each hospital’s real time NELA QI dashboard. In this example, in June 2017, all patients with sepsis received antibiotics within 1 hour, however in January 2018, no patients achieved the target time for antibiotic administration.
On the NELA dashboard, the chart is accompanied by a table that links to the patient records of those who didn’t meet the standard of care, to facilitate local case based discussions and work to improve the reliability of patient pathways
4.6 Risk assessmentAll patients should have an assessment of their individual risk of death to allow clinicians to tailor their care and meet their individual needs. This should be clearly documented as having been discussed with the patient in their notes, and also recorded on the consent form. Failure to formally assess risk may result in them not receiving the care that they should. Accurate data not only supports objective decision making but also is used to calculate a hospital’s risk-adjusted mortality.
High-risk is defined as a predicted risk of death within 30 days greater than or equal to 5% when assessed by any means (including clinical judgement and/or risk prediction tools). Any patient within the NELA dataset who has a ‘missing’ value for their preoperative risk score is assumed to be high-risk in view of the findings of previous reports. This definition allows ready identification of a group of patients more liable to experience adverse outcomes however patients undergoing emergency laparotomy who have a predicted mortality <5% should not be viewed as ‘low risk’ and many of this group will benefit from the same recommended interventions. Categorisation of major surgical patients as low risk should be an active decision made by senior clinicians.
Key process measureThe proportion of patients for whom a risk assessment was documented before surgery.
■ Key finding: 84% patients had a documented risk assessment before surgery.
Sixth Patient Report of the National Emergency Laparotomy Audit 2020 | 20

Figure 4.6.1 Trend in the overall proportion of patients whose risk was documented preoperatively
0
10
20
30
40
50
60
70
80
90
100N
o v 2
013
Feb
2014
Ma y
201
4
Aug
2014
No v
201
4
Feb
2015
May
201
5
Aug
2015
No v
201
5
Feb
2016
Ma y
201
6
Aug
2016
No v
201
6
Feb
2017
Ma y
201
7
Aug
2017
No v
201
7
Feb
2018
Ma y
201
8
Aug
2018
No v
201
8
Feb
2019
May
201
9
Aug
2019
No v
201
9
Feb
2020
Month of Surger y
Prop
or tio
n of
pat
ient
s (%
)
Pre−op Documented Risk
Pre−op Documented Risk (Annual Median)
Required Standard
assessed as high- risk of death
≥5% before surgery
44%assessed as risk of death
<5% before surgery
40%assessed by
utilising a formal calculation tool
70%
(see table 4.6.4 below and supplementary data table 4.6.5)
Sixth Patient Report of the National Emergency Laparotomy Audit 2020 | 21

Figure 4.6.2 Trend in the overall proportion of patients who have their risk assessed according to their predicted risk category prior to surgery
0
10
20
30
40
50
60
70
80
90
100N
ov 2
013
Feb
2014
May
201
4
Aug
2014
Nov
201
4
Feb
2015
May
201
5
Aug
2015
Nov
201
5
Feb
2016
May
201
6
Aug
2016
Nov
201
6
Feb
2017
May
201
7
Aug
2017
Nov
201
7
Feb
2018
May
201
8
Aug
2018
Nov
201
8
Feb
2019
May
201
9
Aug
2019
Nov
201
9
Feb
2020
Month of Surgery
Prop
ortio
n of
pat
ient
s (%
)
High risk
Low risk
Not documented
Documented risk assessment is becoming routine regardless of which risk group (high or low) patients fall into.
(see supplementary data tables 4.6.6 to 4.6.8)
Which patients are more likely to have their risk formally documented? Patients are more likely to have their risk formally documented if:
■ over 65 years old ■ higher ASA ■ have had a frailty assessment of any kind ■ need immediate surgery.
(see supplementary data tables 4.6.10 to 4.6.16)
What are the differences in processes of care, according to if a patient has not had an accurate documented risk calculated before surgery?Previous reports have highlighted that patients who do not have a preoperative assessment of risk should be treated as if they are high-risk, or they may miss out on key processes of care. The proportion of patients not having their risk assessed has steadily decreased. This year, we report in more detail on the small group of patients who did not have risk assessment documented before surgery, or who had a risk assessment documented that was different to the calculated NELA risk score.
3,974 (16%) patients did not have their risk documented before their surgery (see table 4.6.1 below).
Patients who are least likely to have an accurate risk assessment documented before surgery are:
■ young, under the age 65 (19% under 65 do not have documented risk assessment) ■ ASA 1 or 2 ■ patients who have been in hospital longer and need the least emergent surgery ■ patients who are older and not frail ■ patients who are older and do not have their frailty assessed.
(see supplementary data tables 4.6.11 to 4.6.14)
Sixth Patient Report of the National Emergency Laparotomy Audit 2020 | 22

ALERT! Patients admitted under a non-surgical specialty are amongst some of the most complex, high-risk patients. They must have careful, accurate assessment of their perioperative risk, and their risk of death and other specialties should be encouraged to use formal risk assessment tools in their assessments even before patients are referred to the surgeons.
1,373 (35%) patients who did not have risk documented, in fact had a calculated NELA risk that was high (see table 4.6.1 below).
Of this group:
■ consultant presence in theatre was 84% ■ 76% were admitted to critical care ■ 30 day ONS mortality was 14.7% ■ length of stay was 13 days.
(see supplementary data tables 4.6.7 to 4.6.10)
2,539 patients who did not have a preoperative documented risk assessment had an actual calculated NELA risk that was low. Their actual 30 day mortality was 1.1%.
Overall, all patients who do not have their risk of death documented before surgery have a 30 day mortality of 6%. This categorises them as a high-risk group (see table 4.6.2 below).
Accuracy of risk assessment9,869 patients are recorded as being ‘low risk’ before their surgery, of whom 1,231 (13%) had a ‘high’ calculated NELA risk (see table 4.6.2). Of this group of patients:
■ consultant presence in theatre was 84% ■ 66% were admitted to critical care ■ 30 day ONS mortality was 5.8%.
ALERT! Accurate risk assessment is crucial for all patients, especially those who may be perceived as being ‘low risk’. These patients may still have a high 30 day mortality. No risk score methodology is perfect, and so a combination of both clinical judgement, and formal risk assessment is required. This may need to utilise assessments of frailty, nutritional status and cognitive function as well as physiological risk assessments such as the NELA risk calculator.
Table 4.6.1 Relative proportions of patients in all risk category when preoperative documented risk is compared to preoperative calculated NELA risk of death
Document risk prior to surgery
Preoperative calculated High NELA Risk n (%)
Preoperative calculated Low NELA Risk n (%)
Preoperative calculated NELA Risk
Missing n (%)
Number of patients in each risk category
(n = 24,823 )
High 8,773 (79.9%) 2,122 (19.3%) 85 (0.8%) 10,980
Low 1,231 (12.5%) 8,554 (86.7%) 84 (0.8%) 9,869
Not documented 1,373 (34.5%) 2,539 (63.9%) 62 (1.6%) 3,974
Table 4.6.2 30-day and 90-day ONS mortality according to preoperative documented risk
Calculated preoperative risk of death
30-day ONS mortality 90-day ONS mortality
High 17.4% 23%
Low 1.7% 3.3%
Not documented 6% 9.3%
Sixth Patient Report of the National Emergency Laparotomy Audit 2020 | 23

Nearly 3000 patients had only a clinical assessment of risk, without the utilisation of a formal risk scoring tool. Generally these assessments appear to be accurate in the context of 30 day mortality.
Table 4.6.3 30-day ONS mortality in patients who had a clinical assessment of risk according to preoperative calculated NELA risk of death
Patients who had clinical assessment of risk only (n= 2,914 )
NELA calculated risk HIGH
NELA calculated risk LOW
NELA calculated risk Missing
30-day ONS mortality
n (%) 30-day Mortality
n (%) 30-day Mortality
n (%) 30-day Mortality
Clinically assessed as HIGH n= 1,185
878 (74.1%) 22.9% 286 (24.1%) 4.2% 21 (1.8)% 19% 18.3%
Clinically assessed as LOW n= 1,729
207 (12%) 4.3% 1488 (86.1%) 0.4% 34 (1.9%) 0% 0.9%
Table 4.6.4 Proportion of patients in each risk category who had their risk assessed using clinical judgement and/or a risk prediction tool
Documented risk before surgery
Clinical judgement only Risk prediction tool only Both clinical and formal assessment
High 1,185 (10.8%) 6,517 (59.4%) 2,923 (26.6%)
Low 1,729 (17.5%) 5,894 (59.7%) 1,938 (19.6%)
Sixth Patient Report of the National Emergency Laparotomy Audit 2020 | 24

What is the distribution of risk each reporting year? Who are we operating on?The number of patients falling into each risk category has not changed.
Figure 4.6.3 Population risk profiles according to preoperative NELA predicted 30 day mortality, by NELA year of reporting
3.2
8.9
17.5
16.1
51.9
2.4
3
9.1
17.6
15.8
53.1
2.7
8.8
17.9
16.5
53.4
0
25
50
75
100
4 5 6NELA Audit Year
Prop
ortio
n of
pat
ient
s (%
)
NELA Risk
≥ 50%
≥ 25%−50%
≥ 10%−25%
≥ 5%−10%
<5%
Missing
(see supplementary data tables 4.6.20; 4.6.21; 4.6.22; 4.6.23; 4.6.24)
Improvement opportunity: Risk assessment is covered in the RCoA Quality Improvement compendium, in recipe 4.1: Risk assessment and preparation for emergency surgery and in recipe 4.3: Emergency Laparotomy.
Sixth Patient Report of the National Emergency Laparotomy Audit 2020 | 25
5 Intraoperative care
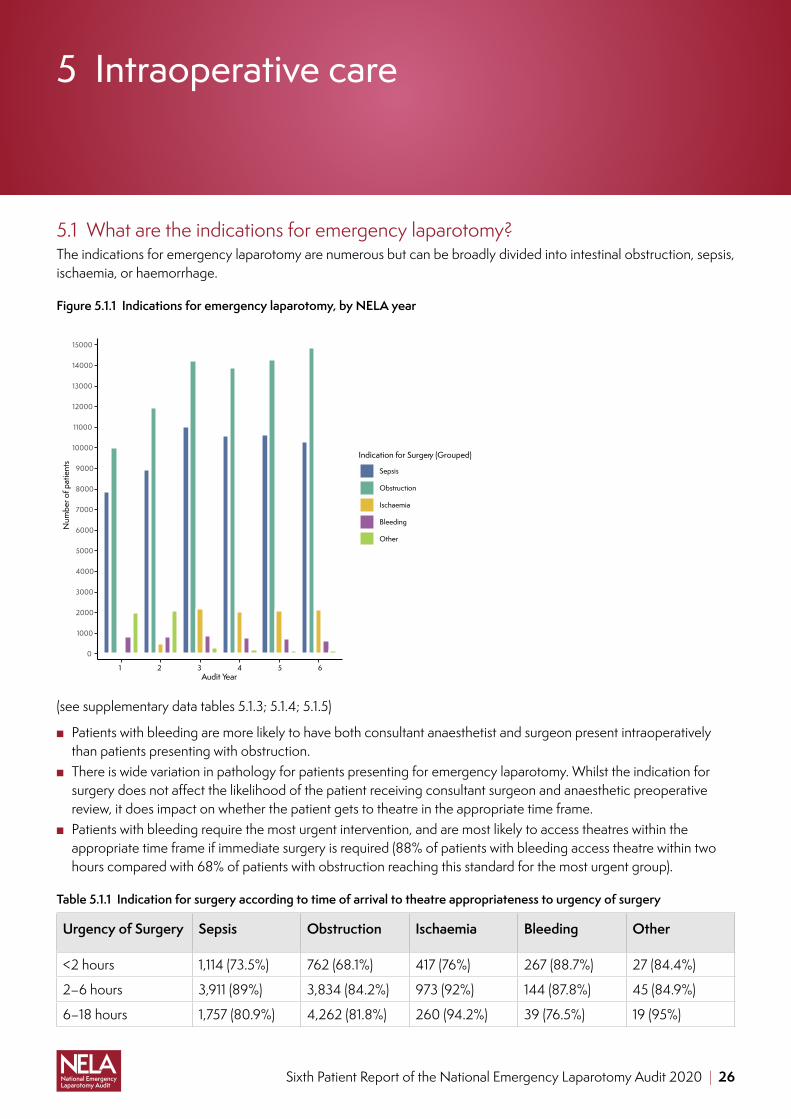
5.1 What are the indications for emergency laparotomy?The indications for emergency laparotomy are numerous but can be broadly divided into intestinal obstruction, sepsis, ischaemia, or haemorrhage.
Figure 5.1.1 Indications for emergency laparotomy, by NELA year
0
1000
2000
3000
4000
5000
6000
7000
8000
9000
10000
11000
12000
13000
14000
15000
1 2 3 4 5 6Audit Year
Num
ber o
f pat
ient
s
Indication for Surgery (Grouped)
Sepsis
Obstruction
Ischaemia
Bleeding
Other
(see supplementary data tables 5.1.3; 5.1.4; 5.1.5)
■ Patients with bleeding are more likely to have both consultant anaesthetist and surgeon present intraoperatively than patients presenting with obstruction.
■ There is wide variation in pathology for patients presenting for emergency laparotomy. Whilst the indication for surgery does not affect the likelihood of the patient receiving consultant surgeon and anaesthetic preoperative review, it does impact on whether the patient gets to theatre in the appropriate time frame.
■ Patients with bleeding require the most urgent intervention, and are most likely to access theatres within the appropriate time frame if immediate surgery is required (88% of patients with bleeding access theatre within two hours compared with 68% of patients with obstruction reaching this standard for the most urgent group).
Table 5.1.1 Indication for surgery according to time of arrival to theatre appropriateness to urgency of surgery
Urgency of Surgery Sepsis Obstruction Ischaemia Bleeding Other
<2 hours 1,114 (73.5%) 762 (68.1%) 417 (76%) 267 (88.7%) 27 (84.4%)
2–6 hours 3,911 (89%) 3,834 (84.2%) 973 (92%) 144 (87.8%) 45 (84.9%)
6–18 hours 1,757 (80.9%) 4,262 (81.8%) 260 (94.2%) 39 (76.5%) 19 (95%)
Sixth Patient Report of the National Emergency Laparotomy Audit 2020 | 26

■ QI activity: Process map the multifactorial reasons for delay to theatre and include patient, anaesthetic, surgical and organisational factors.
5.2 What are the surgical findings at emergency laparotomy?NELA has categorised the findings at laparotomy into the categories of bowel obstruction, intra-abdominal infection, cancer, ischaemia, post-operative complications, and haemorrhage. Data has been analysed in these groups. It is possible that a patient may have more than one surgical finding at surgery.
47.4% of patients have bowel obstruction 12.1% of patients have ischaemic bowel
38.9% of patients have evidence of infection/inflammation at emergency laparotomy
4.9% of patients had evidence of a postoperative complication
18.6% of patients have cancer 1.5% of patients are found to have bleeding
1.4% of patients had a negative laparotomy with normal intra-abdominal findings. This is unchanged since Year 1 meaning that very few patients have unnecessary surgery
Figure 5.2.1 30-day ONS mortality for grouped intra-abdominal surgical findings
9.8%
18.8%20.3%
23.6%
20.1%
24.2%
7.2%
10%
7.3%
9.3%10.3%
13.5%
Cancer Haemorrhage Ischaemia Obstruction Post−op Complications Sepsis
0
5
10
15
20
25
Mor
talit
y ra
te (%
)
30−day Mortality 90−day Mortality
Sixth Patient Report of the National Emergency Laparotomy Audit 2020 | 27
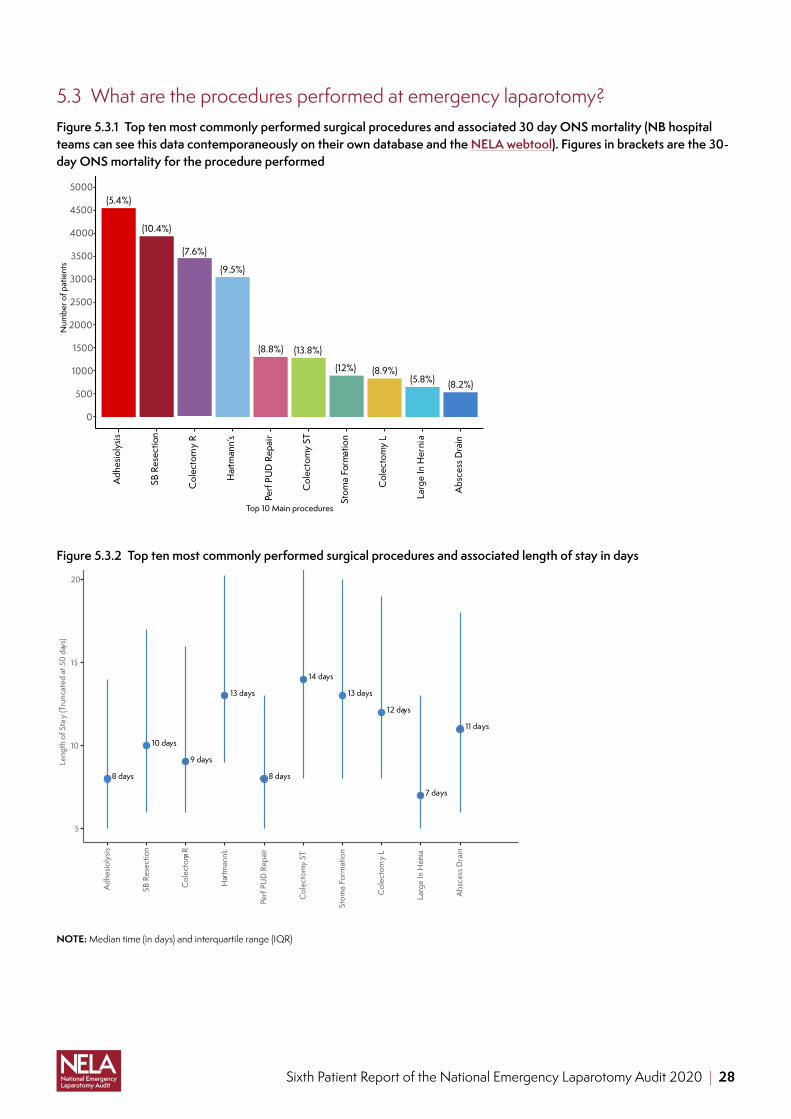
5.3 What are the procedures performed at emergency laparotomy?Figure 5.3.1 Top ten most commonly performed surgical procedures and associated 30 day ONS mortality (NB hospital teams can see this data contemporaneously on their own database and the NELA webtool). Figures in brackets are the 30-day ONS mortality for the procedure performed
(5.4%)
(10.4%)
(7.6%)
(9.5%)
(8.8%) (13.8%)
(12%) (8.9%)(5.8%) (8.2%)
0
500
1000
1500
2000
2500
3000
3500
4000
4500
5000
Adh
esio
lysis
SB R
esec
tion
Col
ecto
my
R
Har
tman
n’s
Perf
PUD
Rep
air
Col
ecto
my
ST
Stom
a Fo
rmat
ion
Col
ecto
my
L
Larg
e In
Her
nia
Abs
cess
Dra
in
Top 10 Main procedures
Num
ber o
f pat
ient
s
Figure 5.3.2 Top ten most commonly performed surgical procedures and associated length of stay in days
11 days
8 days
12 days
9 days
14 days
13 days
7 days
8 days
10 days
13 days
5
10
15
20
Adh
esio
lysis
SB R
esec
tion
Col
ecto
my R
Har
tman
n’s
Perf
PUD
Rep
air
Col
ecto
my
ST
Stom
a Fo
rmat
ion
Col
ecto
my
L
Larg
e In
Hern
ia
Abs
cess
Dra
in
Leng
th o
f Sta
y (T
runc
ated
at 5
0 da
ys)
NOTE: Median time (in days) and interquartile range (IQR)
Sixth Patient Report of the National Emergency Laparotomy Audit 2020 | 28

5.4 Laparoscopic emergency bowel surgeryEmergency laparotomy remains predominantly an open procedure.
■ There is no increase in the laparoscopic rate in Year 6 with 10% of emergency laparotomies being completed laparoscopically.
■ For patients undergoing laparoscopic surgery the 30-day ONS mortality is 3.6% compared to 10.4% if surgery is via an open approach. This likely represents the fact that these patients are less unwell as they have lower preoperatively predicted mortality. (see supplementary data table 5.4.5).
■ Only 24.7% of laparoscopic cases are performed out of hours. 72.1% are performed during the day. ■ The day of the week that the operation takes place does not influence the mode of surgery, patients are almost as
likely to have a laparoscopic approach on weekend compared with a weekday. ■ Patients undergoing laparoscopic surgery are less unwell than those who have an open procedure. ■ Patients are more likely to have a laparoscopic approach the less urgent the surgery.
(see supplementary data tables 5.4.1 to 5.4.7)
Figure 5.4.1 Length of stay in days, by operative approach
11 days
9 days
6 days
7 days
4
8
12
16
Open Laparoscopic conver ted to open Laparoscopic Laparoscopic assisted
Operative approach
Leng
th o
f sta
y −
trunc
ated
at 5
0 da
ys
NOTE: Median time (in days) and interquartile range (IQR)
Sixth Patient Report of the National Emergency Laparotomy Audit 2020 | 29

Figure 5.4.2 30-day and 90-day ONS mortality by operative approach
3.6%
6.3% 6.8%
9.2%10.4%
14.4%
2.9%
5.2%
0
5
10
15
20
25
Laparoscopic Laparoscopic converted to open
Open Laparoscopic assisted
Operative approach
Mor
talit
y ra
te (%
)
30−day Mortality
90−day Mortality
The mode of surgery is unaffected by the presence of a consultant surgeon. Patients undergoing open surgery are just as likely to have a consultant surgeon present as those patients who have a laparoscopic approach. However, a consultant anaesthetist is less likely to be present in theatre if laparoscopic surgery is performed (see supplementary table 5.4.8).
5.5 Consultant presence in theatreThe intraoperative management of patients undergoing emergency laparotomy surgery can be challenging reflecting both the often-complex underlying pathology and physiological derangement of the patient. Clinical situations may change rapidly and safe, effective team work, led by consultants, is crucial.
Key process measuresThe proportion of patients who had BOTH a consultant surgeon and anaesthetist present in theatre when risk of death ≥5%.
■ Key findings: 88.5% of patients had BOTH a consultant surgeon and anaesthetist present in theatre when risk of death ≥5%.
■ 79.3% of patients had BOTH a consultant surgeon and anaesthetist present in theatre when risk of death <5%
If risk is not documented patients are significantly less likely to have both a consultant surgeon and anaesthetist present in theatre
Sixth Patient Report of the National Emergency Laparotomy Audit 2020 | 30

Figure 5.5.1 Proportion of patients who had both a consultant surgeon and anaesthetist present in theatre, by age group and calculated NELA risk score
75%
95%
89%
85%
74%
90%
95%
89%
85%
75%
93%
87%
88%
86%
75%
89%
91%
86%
84%
78%
88%
89%
86%
80%
77%
91%
87%
82%
77%
78%
77%
87%
82%
69%
100%<5%
≥5%−10%
≥10%−25%
≥25%−50%
≥50%
18_39 40_49 50_59 60_69 70_79 80_89 ≥90
Pre−
oper
ative
NEL
A ri
sk
Year 5
100%
95%
92%
90%
79%
96%
88%
90%
94%
78%
100%
94%
93%
89%
80%
92%
92%
89%
89%
81%
92%
92%
89%
86%
79%
94%
90%
88%
85%
79%
93%
87%
88%
82%
71%
18_39 40_49 50_59 60_69 70_79 80_89 ≥90
Age Group
70
80
90
100
Year 6
ALERT! The heatmap above shows that high-risk older patients are less likely to get consultant delivered care, even if they are very high-risk (Figure 5.5.1)
Figure 5.5.2 Proportion of high-risk patients who had a consultant surgeon and anaesthetist present in theatre, by time of day and day of the week
70%
91%
89%
84%
70%
91%
88%
82%
74%
89%
88%
83%
66%
89%
91%
79%
71%
87%
90%
81%
63%
87%
82%
76%
79%
82%
82%
80%
00:00 to 08:00
08:00 to 12:00
12:00 to 18:00
18:00 to 00:00
Mon Tue Wed Thu Fri Sat Sun
Tim
e of
the
day
Year 5
74%
92%
92%
88%
78%
90%
93%
84%
77%
92%
92%
88%
79%
94%
92%
89%
76%
93%
91%
89%
81%
87%
92%
85%
77%
89%
88%
84%
Mon Tue Wed Thu Fri Sat SunDay of the week
70
80
90
100
Year 6
Sixth Patient Report of the National Emergency Laparotomy Audit 2020 | 31

Figure 5.5.3 Proportion of patients who had a consultant surgeon and anaesthetist present by intraoperative findings and NELA calculated risk score
76%
86%
75%
81%
74%
84%
87%
91%
83%
86%
80%
86%
Low
High
Cancer
Haemorrhage
Ischaemia
Obstructio
n
Post−
op
Complications
Sepsis
Pre−
oper
ative
NEL
A ri
sk
Year 5
80%
90%
78%
87%
74%
88%
86%
91%
85%
90%
83%
90%
Cancer
Haemorrhage
Ischaemia
Obstructio
n
Post−
op
Complications
Sepsis
Findings Group
70
80
90
100
Year 6
Sixth Patient Report of the National Emergency Laparotomy Audit 2020 | 32
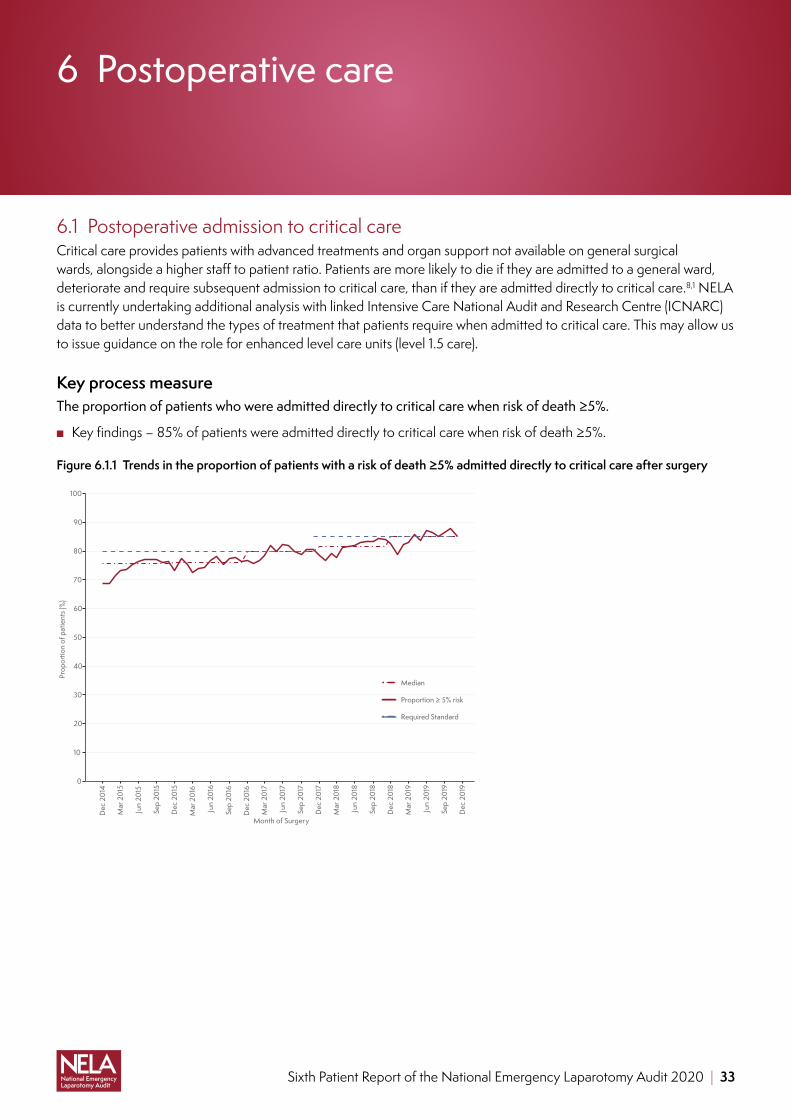
6 Postoperative care
6.1 Postoperative admission to critical careCritical care provides patients with advanced treatments and organ support not available on general surgical wards, alongside a higher staff to patient ratio. Patients are more likely to die if they are admitted to a general ward, deteriorate and require subsequent admission to critical care, than if they are admitted directly to critical care.8,1 NELA is currently undertaking additional analysis with linked Intensive Care National Audit and Research Centre (ICNARC) data to better understand the types of treatment that patients require when admitted to critical care. This may allow us to issue guidance on the role for enhanced level care units (level 1.5 care).
Key process measureThe proportion of patients who were admitted directly to critical care when risk of death ≥5%.
■ Key findings – 85% of patients were admitted directly to critical care when risk of death ≥5%.
Figure 6.1.1 Trends in the proportion of patients with a risk of death ≥5% admitted directly to critical care after surgery
0
10
20
30
40
50
60
70
80
90
100
Dec
201
4
Mar
201
5
Jun
2015
Sep
2015
Dec
201
5
Mar
201
6
Jun
2016
Sep
2016
Dec
201
6
Mar
201
7
Jun
2017
Sep
2017
Dec
201
7
Mar
201
8
Jun
2018
Sep
2018
Dec
201
8
Mar
201
9
Jun
2019
Sep
2019
Dec
201
9
Month of Surgery
Prop
ortio
n of
pat
ient
s (%
)
Median
Proportion ≥ 5% risk
Required Standard
Sixth Patient Report of the National Emergency Laparotomy Audit 2020 | 33

Where were patients admitted to after their surgery? ■ 63% of all patients undergoing emergency laparotomy were admitted directly to critical care unit (CCU). ■ 34% of the 15,630 patients admitted to critical care had a risk <5% ■ 5.5% were admitted to another ‘enhanced care area.’ ■ 31% were admitted onto the general surgical ward. ■ Patients were more likely to be admitted to a critical care unit directly if older, frail, high ASA, or documented as
high-risk preoperatively. ■ 79% of patients assessed to be frail were admitted to critical care. ■ 51.7% of patients who did not have their risk documented went to critical care. ■ 72% of patients aged ≥ 65 years were admitted directly to critical care compared with 51% of patients
<65 years old.
63% admitted to critical care
31% admitted to general surgical ward
5.5% admitted to enhanced care
79% of frail patients admitted to critical care
51.7% of undocumented risk patients went to critical care
admitted directly to critical care
51%Vs
34% had a risk of <5%
72%
(see supplementary data tables 6.1.1 to 6.1.6)
All high-risk patients who are not admitted to critical care are listed on a NELA BPT (England only) report.
Improvement opportunity: Admission to critical care after emergency laparotomy is covered in the RCoA Quality Improvement compendium, in recipe 4.11: Admission to high dependency and intensive care after emergency surgery.
Sixth Patient Report of the National Emergency Laparotomy Audit 2020 | 34

7 Care of the older patient
*** Frailty scoring is defined according to the Clinical Frailty Scale (CFS). CFS considers patients with CFS =4 as ‘vulnerable’ and CFS ≥5 as frail. NELA classified patients with a score between 1 and 3 as not frail and frail where the CFS ≥ 4.
7.1 Frailty,*** age and patients having emergency laparotomy
4,695 (19%)of patients were aged over 80
13,919 (56%)of patients were
aged over 65
6,689 (27%)of patients were aged 65 and frail (CFS ≥ 4)
Key process measureThe proportion of patients aged 80 and over OR aged 65 or over and frail (CFS ≥ 4) who were assessed by a geriatrician.
■ Key finding: 30% of patients aged 80 were assessed by a geriatrician. ■ 28.8% aged 65 or over and frail (CFS ≥ 4) who were assessed by a geriatrician.
Key Process measureThe proportion of patients aged over 65 who had frailty assessed
■ Key finding: 87% patients over 65 had frailty assessed (NB this can not be compared with previous years data as the question was changed).
■ Length of stay aged over 80 was 14 days. ■ Length of stay aged over 65 and frail (CFS ≥ 4) was 15 days. ■ 30 day mortality aged over 80 was 16%. ■ 30 day mortality over 65 and frail (CFS ≥ 4) was 18%.
Older patients may suffer from multi-morbidity and may be frail. Frailty is defined as being a syndrome of physiological decline in older people which makes them particularly vulnerable to adverse outcomes and deterioration in physical health after major stressors (such as emergency laparotomy). Frailty is a known risk factor for postoperative morbidity and mortality, and is independent of age. It is important to note however that while frailty incidence increases with age, it is not an inevitable part of the ageing process and can also occur in younger cohorts.9 NELA has previously reported on the risk of increased adverse outcomes and complications after surgery for older patients. The use of comprehensive geriatric assessment methodology facilitates targeted patient-centred interventions that has shown to result in improved patient outcomes.10 The High-Risk General Surgical Patient4 states that all patients over the age of 65 should have frailty assessed, and if found to be frail the patient should be considered to be high-risk. The findings of the ELF study demonstrate that those patients with a CFS ≥ 4 are vulnerable to complications and adverse outcomes and they should be reviewed by geriatricians.
Sixth Patient Report of the National Emergency Laparotomy Audit 2020 | 35

ALERT! There has been minimal improvement in the proportion of older patients benefiting from geriatric specialist input (22.5% in year 5 compared to 25% year 6)
(see supplementary data tables 7.1.3 and 7.1.4)
Figure 7.1.1 Comparison of 30-day mortality in two groups of patients over time; patients over the age of 65 years and patients under the age of 65 years
0
5
10
15
20
25
Nov
201
3
Feb
2014
May
201
4
Aug
2014
Nov
201
4
Feb
2015
May
201
5
Aug
2015
Nov
201
5
Feb
2016
May
201
6
Aug
2016
Nov
201
6
Feb
2017
May
201
7
Aug
2017
Nov
201
7
Feb
2018
May
201
8
Aug
2018
Nov
201
8
Feb
2019
May
201
9
Aug
2019
Nov
201
9
Feb
2020
Month of Surgery
30−d
ay M
orta
lity
rate
(%)
<65
≥65
Table 7.1.1 Proportion of patients by age assessed by a geriatrician
Age (years) Total number of patients in age group (n)
Proportion of patients assessed by a geriatrician
65–69 2,701 17.5%
70–74 3,417 22.7%
75–79 3,106 24.7%
80–84 2,691 29.4%
85–90 1,479 30.2%
≥ 90 525 35.2%
Overall 13,919 24.7%
Sixth Patient Report of the National Emergency Laparotomy Audit 2020 | 36

Figure 7.1.2 Proportion of patients aged over 65 who were assessed by a geriatrician according to frailty score
21.9% 16.3%
27.1% 21.4%
26.5% 24.3%
31.4% 28.9%
31.6% 26.4%
38.2% 27.1%
[65−69]
[70−74]
[75−79]
[80−84]
[85−90]
≥90
Frail (CFS ≥ 4) Not FrailFrailty
Age
Gro
up (≥
65
yrs)
15
20
25
30
35
Outcomes of the frail patient after emergency laparotomy surgeryFigure 7.1.3 30-day and 90-day ONS mortality, by age and frailty assessment
Frail (CFS ≥ 4) Not Frail Unknown/Missing
18−2425−34
35−4445−54
55−64 ≥
6518−24
25−3435−44
45−5455−64
≥ 65
18−2425−34
35−4445−54
55−64 ≥
650
5
10
15
20
25
Age Group
Mor
talit
y ra
te (%
)
30−day ONS mortality (%) 90−day ONS mortality (%)
Sixth Patient Report of the National Emergency Laparotomy Audit 2020 | 37

Figure 7.1.4 Postoperative length of stay in patients surviving to hospital discharge, by patient age and frailty assessment
Frail (CFS ≥ 4) Not Frail Unknown/Missing
18−2425−34
35−4445−54
55−64 ≥
6518−24
25−3435−44
45−5455−64
≥ 65
18−2425−34
35−4445−54
55−64 ≥
65
0
5
10
15
20
25
30
Age Group
Leng
th o
f sta
y (tr
unca
ted
at 5
0 da
ys)
NOTE: Median time (in days) and interquartile range (IQR)
ALERT! Frailty was associated with increased mortality, and a longer length of stay, regardless of patients age. The data shows that any patient who is frail should be regarded as high-risk, regardless of age or formal risk calculation.
Frailty and risk assessmentOf the patients who had their frailty assessed, the majority (68.8%) were also documented as being in the high-risk group. However, 20% of frail patients were documented pre-operatively as being low-risk, however published data would suggest this to be unlikely because increasing frailty scores are independently associated with a higher mortality.9 The NELA risk score only accounts for physiological and biochemical markers and population level data. It does not account for individual risk factors or co-morbidity.
A combination of being high-risk AND frail results in a twofold increase above the average mortality for patients undergoing emergency laparotomy.
Improvement opportunity: Care of frail and older patients is covered in the RCoA Quality Improvement compendium, in recipe 4.4: Emergency anaesthesia in the older patient, recipe 1.8 Managing frailty in the perioperative period, 1.11 Perioperative neurocognitive disorders.
7.2 Patients with learning disabilities (LD) or autism spectrum disorder (ASD)†††
Patients with learning disabilities or autism, who present for major emergency surgery are a vulnerable group,11 and almost all will have one or more long term health condition.12 This group of patients when presenting for emergency laparotomy surgery need to be recognised and appropriate care and support provided throughout their hospital admission; including liaison with hospital learning disability specialist nurses and an understanding of the Mental Capacity Act.
††† NELA acknowledges that people with LD and ASD are distinct groups of individuals with multiple individual diagnoses. However, NELA data is not granular enough to be able to analyse in more detail at present.
Sixth Patient Report of the National Emergency Laparotomy Audit 2020 | 38

307 patients having emergency laparotomy surgery were identified as having either learning disabilities, or autism. (502 cases were marked as unknown).
There was no difference in the preoperative documentation of risk, timeliness in access to theatre or in consultant presence in theatres for these patients. 87% (regardless of risk category) having consultant delivered intraoperative care, and 90% of high-risk.
(see supplementary data tables 7.2.4 and 7.2.6)
Patients with learning disabilities were more likely to be admitted to critical care postoperatively.
■ 68% of all patients with LD/ASD were admitted to critical care (compared to 62.9% admission rate overall for all patients).
■ Length of stay was longer for patients in this group with a mean duration of admission of 20 days (compared to 15 days).
■ 30-day mortality was 11.7%.
(see supplementary data tables 7.2.7; 7.2.8 and 7.2.9)
7.3 Intraoperative deaths and end of life care pathways ■ 46 patients (0.19%) died in theatre, nearly half of whom had sepsis and 80% of whom were aged over 65 years old. ■ Of those patients who died in theatre, 93.5% had both a consultant anaesthetist and surgeon present. ■ Patients undergoing emergency laparotomy out of hours are no more likely to die in the operating theatre. ■ 353 patients were placed on an end of life pathway after their surgery, which was more likely in older patients.
Patients with cancer or ischaemia found at laparotomy were more likely to be placed on an end of life pathway.
(see supplementary data tables 7.3.2 to 7.3.7)
Figure 7.3.1 Number of patients placed on End of Life Pathway (EoL) by findings
0
50
100
150
200
250
300
350
Total Patients on EoL pathway Cancer Sepsis
Ischaemia Haemorrhage Obstruction
Postop . complications
Sixth Patient Report of the National Emergency Laparotomy Audit 2020 | 39

8 Outcomes
‡‡‡NELA receives quarterly updates to ONS mortality data which has a small impact on previously published figures. An analysis is underway to assess how this impacts on previously published mortality data.
As the world’s largest database of prospectively identified patients undergoing emergency laparotomy we are able to reliably report upon risk adjusted death within 30 days, length of stay, and longer term outcomes. Understanding these outcomes, for example, the frequency of prolonged durations of hospital stay after emergency laparotomy, is important not only from a health economics perspective but as an indicator of care quality.
This knowledge, including the likelihood of needing to return to theatre for further surgery helps patients and their clinical teams to have informed discussions about the risks and benefits of surgery.
8.1 Risk adjusted mortalityPreviously published figures demonstrate that all cause 30-day mortality‡‡‡ after surgery fell for the first four years of reporting, but did not improve in year 5. However, in year 6 30-day mortality has fallen to 9.3%, and 90-day mortality to 13%.
Figure 8.1.1 Trend in the overall unadjusted 30-day and 90-day ONS mortality rates by NELA dataset year
0
5
10
15
20
25
Nov 2013
Feb 2014
May 2014
Aug 2014
Nov 2014
Feb 2015
May 2015
Aug 2015
Nov 2015
Feb 2016
May 2016
Aug 2016
Nov 2016
Feb 2017
May 2017
Aug 2017
Nov 2017
Feb 2018
May 2018
Aug 2018
Nov 2018
Feb 2019
May 2019
Aug 2019
Nov 2019
Feb 2020
Month of Surgery
Prop
ortio
n of
pat
ient
s (%
)
30−day Mortality 30−day Mortality (Mean) 90−day Mortality 90−day Mortality (Mean)
Sixth Patient Report of the National Emergency Laparotomy Audit 2020 | 40
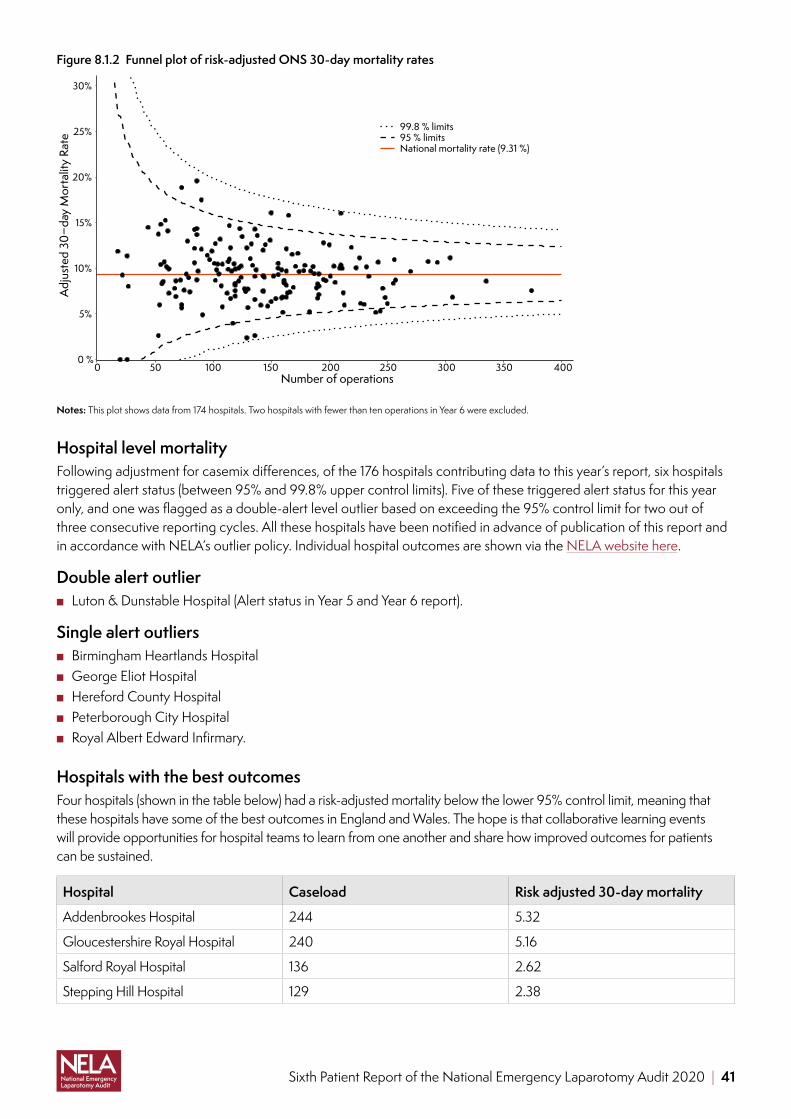
Figure 8.1.2 Funnel plot of risk-adjusted ONS 30-day mortality rates
0 %
5%
10%
15%
20%
25%
30%
0 50 100 150 200 250 300 350 400Number of operations
Adj
uste
d 30
−day
Mor
talit
y Ra
te
99.8 % limits95 % limitsNational mortality rate (9.31 %)
Notes: This plot shows data from 174 hospitals. Two hospitals with fewer than ten operations in Year 6 were excluded.
Hospital level mortalityFollowing adjustment for casemix differences, of the 176 hospitals contributing data to this year’s report, six hospitals triggered alert status (between 95% and 99.8% upper control limits). Five of these triggered alert status for this year only, and one was flagged as a double-alert level outlier based on exceeding the 95% control limit for two out of three consecutive reporting cycles. All these hospitals have been notified in advance of publication of this report and in accordance with NELA’s outlier policy. Individual hospital outcomes are shown via the NELA website here.
Double alert outlier ■ Luton & Dunstable Hospital (Alert status in Year 5 and Year 6 report).
Single alert outliers ■ Birmingham Heartlands Hospital ■ George Eliot Hospital ■ Hereford County Hospital ■ Peterborough City Hospital ■ Royal Albert Edward Infirmary.
Hospitals with the best outcomesFour hospitals (shown in the table below) had a risk-adjusted mortality below the lower 95% control limit, meaning that these hospitals have some of the best outcomes in England and Wales. The hope is that collaborative learning events will provide opportunities for hospital teams to learn from one another and share how improved outcomes for patients can be sustained.
Hospital Caseload Risk adjusted 30-day mortality
Addenbrookes Hospital 244 5.32
Gloucestershire Royal Hospital 240 5.16
Salford Royal Hospital 136 2.62
Stepping Hill Hospital 129 2.38
Sixth Patient Report of the National Emergency Laparotomy Audit 2020 | 41

Table 8.1.1 Mortality rate by operative finding
Operative findings Total patients ONS 30-day mortality ONS 90-day mortality
Adhesions 7,211 7 9.8
Perforation Small Bowel Colonic 5,021 13.8 17.4
Intestinal Ischaemia 3,006 20.1 24.2
Abscess 2,618 7.6 10.8
Colorectal Cancer 2,246 9.5 15.3
Malignancy Localised 2,058 6.9 12.2
Incarcerated Hernia 1,857 8.6 11.3
Diverticulitis 1,527 8 10.3
Perforation Peptic Ulcer 1,516 10 13.4
Internal Hernia 1,469 7.3 9.8
Malignancy Disseminated 1,409 15.7 34.1
Stricture 1,223 5.8 8.3
Volvulus 1,101 7.5 10.3
Crohns Disease 746 2 2.9
AnastomoticLeak 602 7 8.5
Intestinal Fistula 425 7.3 12.2
Ulcerative Colitis 418 4.5 5.5
Normal Findings 351 13.7 15.7
Stoma Complications 290 6.2 9
Colitis 279 11.8 13.3
Gallstone Ileus 278 5.4 9
Haemorrhage Post-Op 246 10.2 11.8
Meckels Diverticulum 233 1.7 2.1
Haemorrhage Intestinal 224 18.3 20.1
Intussusception 217 3.2 5.5
Foreign Body 204 3.4 5.4
PseudoObstruction 203 11.8 16.3
Haemorrhage Peptic Ulcer 144 25 30.6
Wound Dehiscence 96 2.1 3.1
Gastric Cancer 68 5.9 20.6
Necrotising Fasciitis 39 15.4 28.2
AbdoCompartment Synd 39 25.6 30.8
Improvement opportunity: Guidance to help teams review perioperative mortality is available in the RCoA Quality Improvement Compendium, as recipe 4.12: Structured morbidity and mortality reviews and recipe 11.5 Sharing, improving and learning from critical incidents.
Sixth Patient Report of the National Emergency Laparotomy Audit 2020 | 42

8.2 Length of stay (LOS)Prolonged hospital stays are a significant burden for both patients and their families. A shorter length of stay may not only indicate good care processes and an uncomplicated recovery, but is also more desirable for patients who wish to return to their own home. National work streams highlight the detrimental impact of a long length of stay on patients and their families.
Mean length of stay in 2019 was 15.4. This has fallen from 19.2 since NELA’s inception in 2013. This represents a cost saving to acute Trusts of £38.4 million.§§§
Figure 8.2.1 Trend in the mean length of stay over time in patients surviving to hospital discharge
0
5
10
15
20
25
Feb
2014
Aug
2014
Feb
2015
Aug
2015
Feb
2016
Aug
2016
Feb
2017
Aug
2017
Feb
2018
Aug
2018
Feb
2019
Aug
2019
Feb
2020
Month of Surgery
Leng
th o
f sta
y (d
ays)
Annual Mean Length of Sta y
Mean Length of Stay
Length of stay¶¶¶ increases with:
Increasing age: <40 years LOS = 8 days (IQR 5–13), ≥90 median LOS = 15 days (9–23)
Higher risk profiles: high preoperative documented risk LOS = 15 days (9–25), low-risk = 8 days (6–13).
More co-morbidities: ASA 1 = 7 days, ASA 4 = 18 days.
An unplanned return to theatre which more than doubles the median LOS from 10 up to 27 days.
An unplanned admission to critical care which is associated with a significantly prolonged LOS with around an extra 14 days in hospital (unplanned admission median LOS = 24 days (15–38) v no unplanned admission LOS = 10 days (6–18).
(see supplementary data tables 8.2.1 to 8.2.8)
§§§ Based on 30,000 emergency laparotomy cases per year which represents a saving of 114,000 bed-days. The cost saving was estimated based on the excess non-elective bed day cost for 2017/18 of £33713 per day.
¶¶¶ We only report on patients who survive to discharge in this section and all are median LOS reported alongside the interquartile range. LOS calculations for survivors do not include patients who were still in hospital at 60 days as their outcome is not yet known.
Sixth Patient Report of the National Emergency Laparotomy Audit 2020 | 43

Improvement opportunity
The NELA length of stay QI dashboard indicates monthly average figures, as well as individual patient’s length of stay.
Local leads can easily find cases with a long length of stay, allowing for case based discussions looking for opportunities to reduce length of stay.
8.3 Unplanned returns to theatre
1,246 patients (5%)had an unplanned return
to theatre
2,149 patients (8.7%)needed to return
to theatre for further operative intervention
783 patients (3.2%)are as a planned return, usually
following initial ‘damage control’ surgery
(see supplementary data tables 8.3.2 and 8.3.3)
It is important to try and identify which patients are at risk of an unplanned return to theatre and to have appropriate pathways in place to ensure these patients are managed promptly with appropriate consultant level input.
■ Unplanned return to theatre is: ● more likely if the patient is predicted high-risk (≥ 5%) (6.4% v 3.6%) ● 1.7 times more likely if the patient required immediate (most urgent) surgery.
■ Patients requiring an unplanned return to theatre are just as likely to have a consultant surgeon present and anaesthetist present at their initial laparotomy as those who do not require a return to theatre.
■ Outcomes are worse for patients who have an unplanned return to theatre: ● average length of stay increases from 10 days to 27 days ● ONS 30 day mortality is 16.2%.
(see supplementary data tables 8.3.4 to 8.3.10)
Sixth Patient Report of the National Emergency Laparotomy Audit 2020 | 44

8.4 Unplanned admission to critical careUnplanned admission to critical care is associated with significantly higher 30 day mortality and a longer length of stay. Importantly, three-quarters of this group of patients were admitted to critical care directly after their emergency laparotomy, and, once discharged, subsequently required re-admission to critical care.
730 (2.9%) patients had an unplanned admission to critical care
The rate of unplanned admission varied between 0% and 14.7% between hospitals
Unplanned admission to critical care resulted in a longer median duration of stay of 24 days (IQR 15–38) compared with 10 days if there was no unplanned admission
Mortality was 20.8% if an unplanned admission to critical care occurred
The preoperative predicted mortality of the patients who went to the ward postoperatively and then were admitted to critical care was 4.1%
Table 8.4.1 Original postoperative discharge destination of patients after emergency laparotomy who required a subsequent unplanned admission to critical care
Postoperative destination following original laparotomy for patients with an unplanned admission to critical care
Total number of patients [n (%)]
Critical care 558 (76.4%)
Enhanced care area 30 (4.1%)
Ward 142 (19.5%)
Table 8.4.2 Number of patients who had an unplanned admission to critical care and 30 day mortality (excluding patients who died in theatre or where there was a decision for palliative care)
Number of cases (% of total) ONS 30-day mortality
No unplanned admission to critical care 23,939 (96.6%) 8.8%
Unplanned admission to critical care 730 (2.9%) 20.8%
Unknown 108 (0.4%) 11.1%
Missing 15 (0.1%)
ALERT! NELA data cannot define the reasons behind why unplanned re-admissions to critical care may occur, however patients who suffer a ‘failed discharge’ from critical care after emergency laparotomy have a significantly higher mortality overall.
Sixth Patient Report of the National Emergency Laparotomy Audit 2020 | 45

Using NELA; impact beyond quality improvement and audit
NELA is more than ‘just an audit’. As the world’s largest data set, holding information on over 140,000 patients who have emergency laparotomy surgery, it is a powerful and important resource that can be used to support improvement work, assurance work and research that enhances the care of patients undergoing emergency laparotomy.
NELA was one of the national audit projects recommended to continue collecting data during the COVID-19 global pandemic. Teams across the UK have continued to enter data into the NELA dataset therefore capturing the impact of COVID-19 on patients needing emergency laparotomy throughout this period.
Nine peer reviewed publications based upon
detailed analysis of NELA data
There are 13 ongoing research projects using
the NELA dataset
NELA data has been presented at over 59 conferences and meetings across the world
NELA is cited in over 48 papers
Sixth Patient Report of the National Emergency Laparotomy Audit 2020 | 46

References
1 Pearse RM et al. Mortality after surgery in Europe: a 7-day cohort study. Lancet 2012;380:1059–1065.
2 Third Patient Report of the National Emergency Laparotomy Audit. NELA Project Team. RCoA, 2017.
3 Howlett DC et al. The Accuracy of interpretation of emergency abdominal CT in adult patients who present with non-traumatic abdominal pain: results of a UK national audit. Clin Radiol 2017;72(1):41–51.
4 The High-Risk General Surgical Patient: Raising the Standard. RCS Engl, 2018.
5 Fourth Patient Report of the National Emergency Laparotomy Audit. NELA Project Team. RCoA, 2018.
6 The benefits of consultant delivered care. AoMRC, 2012.
7 Sepsis: recognition, diagnosis and early management (NG51). NICE, 2016 (updated 2017).
8 Vester-Andersen M et Al. The Danish Anaesthesia Database. Mortality and postoperative care pathways after emergency gastrointestinal surgery in 2,904 patients: a population-based cohort study. Br J Anaesth 2014;112(5):860–870.
9 Parmar K et al. Frailty in older patients undergoing emergency laparotomy, results from the UK observational emergency laparotomy and frailty (ELF) Study. Age and Ageing 2019;48(2):ii28–ii29.
10 Eamer G et al. Comprehensive geriatric assessment for older people admitted to a surgical service. Cochrane Database Syst Rev 2018;1:CD012485. doi: 10.1002/14651858.CD012485.pub2 (published Online First: 2018/02/01).
11 Death by indifference. Following up the Treat me right! report. MENCAP, 2007.
12 Confidential inquiry into the premature deaths of people with learning disabilities. Final Report. CIPOLD, 2013.
13 2017/18 Reference costs and guidance – National schedule of reference costs NHS Improvement 2017 (https://bit.ly/3gHEFqM).
Sixth Patient Report of the National Emergency Laparotomy Audit 2020 | 47

Glossary
Glossary
AAA Age Anaesthesia Association
AAGBI Association of Anaesthetists of Great Britain and Ireland
Abdomen/Abdominal Anatomical area between chest and pelvis, which contains numerous organs, including the bowel
Adhesiolysis Surgical procedure to remove intra-abdominal adhesions that often cause bowel obstruction
ALPINE Adoption of lung protective ventilation in patients undergoing emergency laparotomy
Anastomotic Leak Leak from a join in the bowel
APP Association for Perioperative Practice
ARCP Annual Review of Competence Progression the annual assessment of doctors in training
ASA American Society of Anesthesiologists Physical Status score (ASA-PS)
ASGBI Association of Surgeons of Great Britain and Ireland
Average A number to describe a series of observations. Depending on the pattern of these observations, the median/or mean will better describe the series
BGS British Geriatric Society
Bowel Part of the continuous tube starting at the mouth and finishing at the anus. It includes the stomach, small intestine, large intestine and rectum
CEU Clinical Effectiveness Unit of the Royal College of Surgeons of England
Colitis Inflammation of the colon
Colon Part of the large intestine
Colorectal Resection Surgical procedure to remove part of the bowel
Colostomy Surgical procedure to divert one end of the large intestine (colon) through an opening in the abdominal wall (tummy). A colostomy bag is used to collect bowel contents
CRG Clinical Reference Group. Consists of representatives from partner organisations, stakeholders and patients, acting in an advisory capacity to the NELA Project Team
CT Computed tomography – a very advanced form of X-ray used in diagnosis and treatment
DARG Data access request group
EGS Emergency General Surgery. Often refers to the group of patients admitted to hospital with conditions that require the expertise of general surgeons. 10% require emergency bowel surgery
Elective In this Report, refers to both to mode of hospital admission and to urgency of surgery. The timing of elective care can usually be planned to suit both patient and hospital (can be weeks to months). In contrast, urgent/ emergency care usually has to take place within very short timescales (hours)
ELN Emergency Laparotomy Network
ELPQuIC Emergency Laparotomy Pathway Quality Improvement Care Bundle
Emergency laparotomy Bowel surgery that, due to underlying conditions, must be carried out without undue delay
EPOCH Enhanced perioperative care for high risk patients
FICM Faculty of Intensive Care Medicine.
FLOELA Fluid Optimsaion in Emergency Laparotomy Trial
GCS/Glasgow Coma Scale An assessment tool that is used to objectively measure a patient’s conscious state
GI Gastrointestinal
GIRFT Getting it Right First Time programme
Hartmann’s Procedure Surgical procedure to remove part of the large bowel resulting in the formation of an end colostomy, and leaving part of the rectum in-situ
HES Hospital Episode Statistics
HQIP Healthcare Quality Improvement Partnership
HSRC Health Services Research Centre
ICS Intensive Care Society
Ileostomy Surgical procedure to divert one end (or two ends in a loop colostomy) of the small intestine (small bowel) through an opening in the abdomen (tummy). An ileostomy bag is used to collect bowel contents
Sixth Patient Report of the National Emergency Laparotomy Audit 2020 | 48

Intestine Part of the bowel
Intra-abdominal Inside the abdomen/tummy
Intraoperative During surgery
IQR Interquartile range – the middle 50% of observations either side of the median
IR Interventional Radiology
Ischaemia Loss of, or insufficient blood supply to an affected area or organ
Laparoscopic Keyhole surgery
Mean Mathematical average
Median Midpoint of all observations when ranked in order from smallest to largest (see average)
NCAAG National Clinical Audit Advisory Group
NCEPOD National Confidential Enquiry into Patient Outcome and Deaths
NELA National Emergency Laparotomy Audit
NIAA National Institute of Academic Anaesthesia
NIGB National Information Governance Board
NQB National Quality Board
OJEU Official Journal of the European Union
Non-operative Treatment options that do not require surgery
Obstruction Blockage of the bowel. It can be caused by a variety of conditions and can cause the bowel to burst (perforate). It has the potential to make people very unwell and can be life threatening
ONS Office for National Statistics
PEDW Patient Episode Database of Wales
Perforation One or more holes in the wall of the bowel. It can be caused by a variety of conditions. It has the potential to make people very unwell very quickly and can be life threatening
Perioperative Around the time of surgery (incorporating preoperative, intraoperative and postoperative)
Peritonitis Infection or inflammation within the abdomen, causing severe pain. It has the potential to make people very unwell very quickly and can be life threatening
Postoperative After surgery
P-POSSUM A tool that has been validated for estimating an individual patient’s risk of death within 30 days of emergency general surgery4
Preoperative Before surgery
Radiological imaging Diagnostic techniques including X-ray and CT
RCN Royal College of Nursing
RCoA Royal College of Anaesthetists
RCR Royal College of Radiologists
RCS Royal College of Surgeons of England
Rectum The final section of the large intestine
Sepsis Widespread, severe inflammation in the body resulting from infection
Section 8 The final data entry section on the NELA webtool which can be adapted by local teams to collect relevant data of their specific design
SIRS Systemic Inflammatory Response Syndrome
Small Bowel Resection Surgical procedure to remove part of the small bowel (small intestine)
Stoma Surgical opening in the abdominal wall for the bowel to terminate. See also colostomy and ileostomy
STP Sustainability and Transformation Plan
Subtotal Colectomy Surgical procedure to remove part of the large bowel except the very lowest part or ‘rectum’ of the large bowel
Sixth Patient Report of the National Emergency Laparotomy Audit 2020 | 49

National Emergency Laparotomy Audit (NELA) Royal College of Anaesthetists, Churchill House, 35 Red Lion Square, London WC1R 4SG020 7092 1676 | [email protected]
nela.org.uk
Information correct as at November 2020