slides 2015 for contact 2
TRANSCRIPT


Note on the use of these slides
• These slides provide the basic theory that I would like you to know. There are many more techniques on the slides that came with the textbook, which are also available on eFundi. As I talk you through this slide show, please stop where you don't understand, go to either the textbook (Heizer and Render) or the Heizer & Render slides and make sure you understand them. If you still do not understand, on the first page that you have to submit is space for you to tell me what you do not understand so that I can cover it in class.
• Once you have gone through the slides, go to the template on eFundiand prepare your submissions for the next contact session.

Operations &
productivity (1)
Topics covered: Contact 2
Global envi-
ronment &
strategy (2)
Managing
projects (3)
Forecasting
demand (4)
Product
design (5)
Quality
management
(6)
Process
design (7)
Location
decisions (8)
Layout
decisions(9)
Job design &
work mea-
surement (10)
Supply chain
management
(11)
Inventory
management
(12)
Scheduling
(13 & 15)
MRP & ERP
(14)
JIT & Lean
operations
(16)
Maintenance
& reliability
(17)
Study school
Contact 1
Contact 2
Contact 3
Contact 4
Contact 5
Contact 6
Contact 7

Outcomes for today's contact
OUTCOMES OF THEME E
• Analyse the product design process for a specific product or service
• Distinguish between the design process for products and services
• Demonstrate a thorough understanding of the concepts by applying the theory to a real-life organisation
OUTCOMES OF THEME F
• Critically distinguish between final product quality and total quality.
• Effectively demonstrate their understanding of the principles of total quality in a case study
• Comprehensively analyse variation in production or service processes through statistical techniques such as Six Sigma
• Demonstrate a thorough understanding of the concepts by applying the theory to a real-life organisation.

Chapter 5 Theory
Product and Service Design

Why? - Product Life Cycle
Time
Sale
s vo
lum
e
Growth
Maturity
Decline
Introduction
Revive cycle

60
20
4.32.0 1.0
0
10
20
30
40
50
60
70
1990 1995 2000 2005 2010
Average time between new cell phone innovations 1992-2009 (in months)
Year
Ave time between
innovations1991 60.01992 20.01993 15.01994 20.01995 20.01996 10.01997 15.01998 12.01999 5.52000 4.32001 3.52002 2.62003 2.12004 2.12005 2.02006 1.82007 1.52008 1.22009 1.0
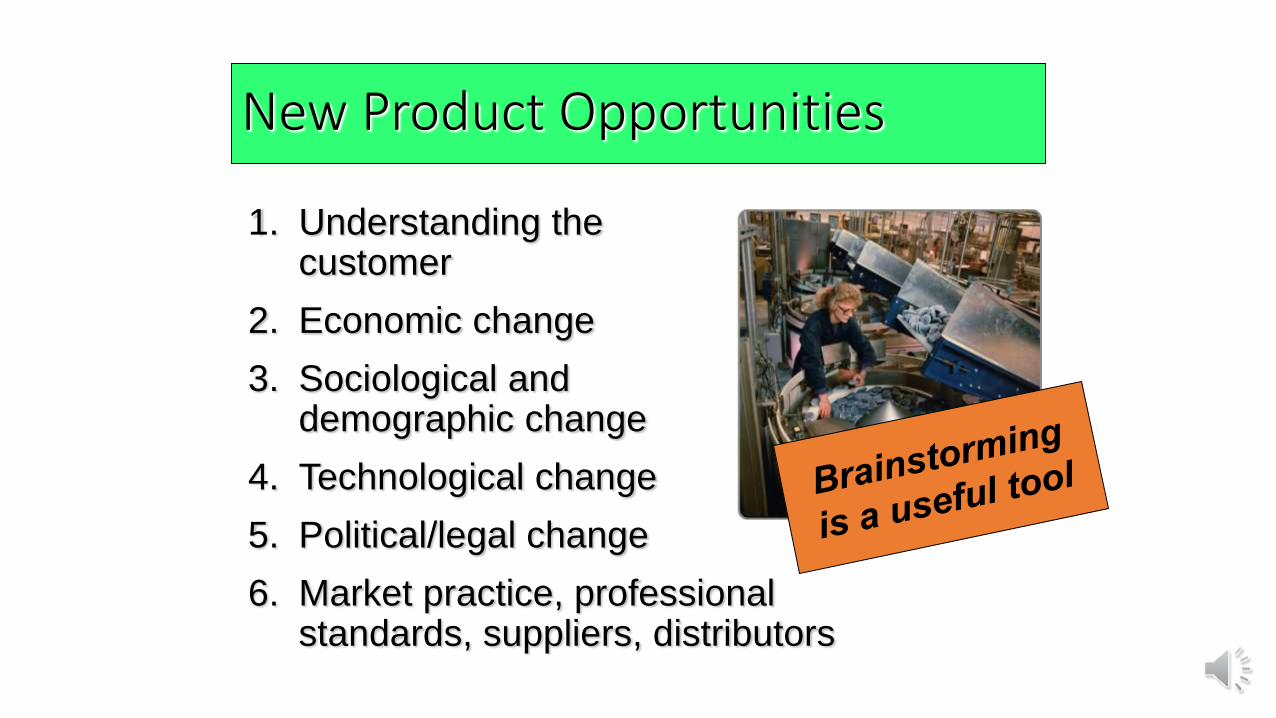
New Product Opportunities
1. Understanding the customer
2. Economic change
3. Sociological and demographic change
4. Technological change
5. Political/legal change
6. Market practice, professional standards, suppliers, distributors

Scope of
product
development
team
Product Development Stages
Scope for design and engineering
teams
Evaluation
Introduction
Test Market
Functional Specifications
Design Review
Product Specifications
Customer Requirements
Feasibility
Concept

The challenges of new product design
• Does it really fulfil customer need?
• Can I build quality in at the design step?
• How can I "idiot-proof" the product design process?
• Trade-offs: time, cost, quality, etc.
• Capacity issues

Quality Function
Deployment
Value Analysis/
Value Engineering
Ideal Customer Product
House of Quality
Designing for the Customer
• Does the item have any design features that are not necessary?
• Can two or more parts be combined into one?
• How can we cut down the weight?• Are there nonstandard parts that
can be eliminated?

QFD House of Quality
Relationshipmatrix
How to satisfycustomer wants
Interrelationships
Co
mp
eti
tive
assessm
en
t
Technicalevaluation
Target values
What the customer
wants
Customer importance
ratings
Weighted rating

House of Quality Example: Camera
Completed House of Quality
Lightweight 3
Easy to use 4
Reliable 5
Easy to hold steady 2
Color correction 1
Our importance ratings
Lo
w e
lectr
icit
y r
eq
uir
em
en
ts
Alu
min
um
co
mp
on
en
ts
Au
to f
ocu
s
Au
to e
xp
osu
re
Pain
t p
allet
Erg
on
om
ic d
esig
n
Co
mp
an
y A
Co
mp
an
y B
G P
G P
F G
G P
P P
Target values(Technical attributes)
Technical evaluation
Company A 0.7 60% yes 1 ok G
Company B 0.6 50% yes 2 ok F
Us 0.5 75% yes 2 ok G
0.5
A
75
%
2’to
∞
2c
irc
uit
s
Fa
ilu
re 1
pe
r 1
0,0
00
Pa
ne
l ra
nk
ing
22 9 27 27 32 25

Designing Service Products
• Service products are very different
• Direct customer involvement introduces significant variability in the process
• Questions to address:• How will this variability be addressed?
• What are the implications for operational cost and the customer service experience?
3-14

Moments of Truth
Concept created by Jan Carlzon of Scandinavian Airways
Critical moments between the customer and the organization that determine customer satisfaction
There may be many of these moments
These are opportunities to gain or lose business

Chapter 6 Theory
Total quality management
Total quality management is defined as managing the entire organization so
that it excels on all dimensions of products and services that are
important to the customer

Quality Specifications
• Design quality: Inherent value of the product in the marketplace
• Dimensions include: Performance, Features, Reliability/Durability, Serviceability, Aesthetics, and Perceived Quality.
• Conformance quality: Degree to which the product or service design specifications are met

Quality makes business sense
Improved
quality
Improved response/
reputation / flexible
pricing
(higher price)
Reduced cost of
failure/rework/ warranty
Higher profit

Costs of Quality
External FailureCosts
Appraisal Costs
Prevention Costs
Internal FailureCosts
Costs of
Quality
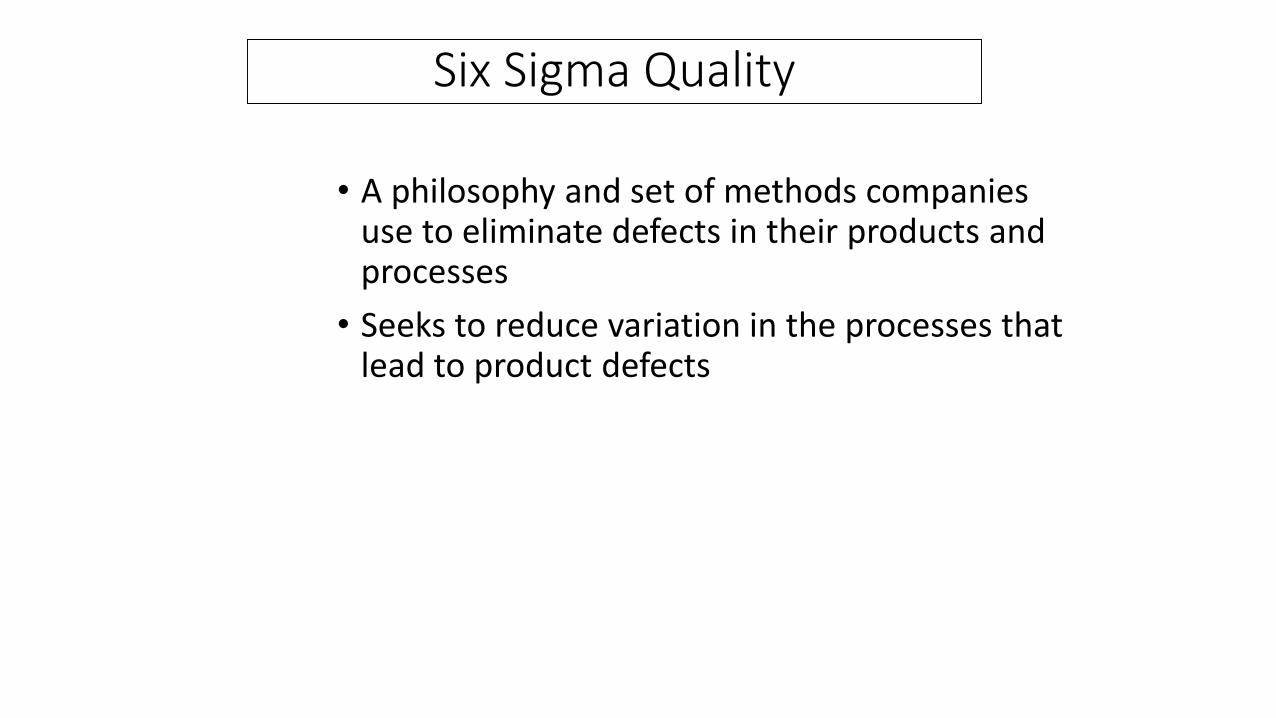
Six Sigma Quality
• A philosophy and set of methods companies use to eliminate defects in their products and processes
• Seeks to reduce variation in the processes that lead to product defects

Two meanings
Statistical definition of a process that is 99.9997% capable, 3.4 defects per million opportunities (DPMO)
A program designed to reduce defects, lower costs, and improve customer satisfaction
Six Sigma
Mean
Lower limits Upper limits
3.4 defects/million
±6
2,700 defects/million
±3
Figure 6.4

Six Sigma Quality: DMAIC Cycle
1. Define (D)
2. Measure (M)
3. Analyze (A)
4. Improve (I)
5. Control (C)
Customers and their priorities
Process and its performance
Causes of defects
Remove causes of defects
Maintain quality

Analytical Tools for Six Sigma and Continuous Improvement
• Flow Chart
• Run Chart
• Pareto Analysis
• Checksheet
• Histogram
• Cause & Effect Diagram (fishbone)
• Control Charts

Benchmarking
Selecting best practices to use as a standard for performance
Determine what to benchmark
Form a benchmark team
Identify benchmarking partners
Collect and analyze benchmarking information
Take action to match or exceed the benchmark

ISO 9000 and ISO 14000
• Series of standards agreed upon by the International Organization for Standardization (ISO)
• Adopted in 1987
• More than 160 countries
• A prerequisite for global competition (?)
• ISO 9000: international reference for quality, ISO 14000 concerned with environmental management

Determinants of Service Quality
Reliability
Responsiveness
Competence
Access
Courtesy
Communication
Credibility
Security
Understanding/ knowing the customer
Tangibles

Service Quality
The Operations Manager must recognize:
1. The tangible component of services is important
2. The service process is important
3. The service is judged against the customer’s expectations
4. Exceptions will occur

Your assignment• Step 1: Make sure you understand the concepts that are covered in this slide show. If
necessary, go through it again or study the textbook. The slides by Heizer & Render (available on eFundi) also give valuable extra information.
• Step 2: Prepare a one-page summary of the theory. Make sure it fits into the template in the study guide. Remember to make a note of those issues that you want explained in class.
• Step 3: Find out how new product development and quality management takes place in your organisation. Give a one-page summary on the template.
• Step 4: Critique the way quality management takes place in your organisation. Where necessary, suggest improvements. Give a one-page summary on the template. (If there are diagrams, you are allowed a fourth page for them).
• Step 5: Submit your three-page report on efundi before Thursday night 23:59. This counts towards your individual assignment and your final pass mark!
• Step 6: For your group assignment, prepare a three-slide PowerPoint show: Slide 1: Briefly present the essence of quality management to your community organisation. (If it is important to them, you could do new product development instead. Slide 2: Explain whether/how they presently do quality management. Slide 3: Give them advice on how to improve their quality management process. Use the template that is on eFundi. One group member must submit on efundi before Thursday night 23:59 as well!
• Names of both documents must be as indicated in your study guide.