slippery road detection and evaluation
TRANSCRIPT

Slippery Road Detection and Evaluation
Project Final Report
May 31, 2012
Prepared by:
Ralph Robinson Steven J. Cook, P.E. Principle Investigator Program Manager University of Michigan Michigan Department Transportation Research Institute of Transportation 2901 Baxter Road Lansing, MI Ann Arbor, MI 48109

May 31, 2012 Page 1 of 63
Technical Report Documentation Page
1. Report No. RC-1573
2. Government Accession No. N/A
3. MDOT Project Manager Steven J. Cook, P.E.
4. Title and Subtitle Slippery Road Detection and Evaluation
5. Report Date May 31, 2012 6. Performing Organization Code N/A
7. Author(s) Ralph Robinson
8. Performing Org. Report No. N/A
9. Performing Organization Name and Address The Regents of the University of Michigan
10. Work Unit No. (TRAIS) N/A
11. Contract No. 2009-0747 11(a). Authorization No. Z1 / R1
12. Sponsoring Agency Name and Address Michigan Department of Transportation Research Administration 425 West Ottawa Street Lansing MI 48933
13. Type of Report & Period Covered Final Report 10/20/2009 to 5/31/2012 14. Sponsoring Agency Code N/A
15. Supplementary Notes 16. Abstract The key project objectives were: 1) the demonstration and evaluation of a low cost data acquisition system that would provide a rich data set accumulated from multiple vehicles, and 2) establish how this data, coupled with situational data from other sources, might be used to detect slippery road conditions, rough road conditions and potentially other beneficial uses by the Michigan DOT. This work is part of an on-going research initiative to identify how state DOTS will use and benefit from the large quantities of data to be generated by future connected vehicle programs and to assist in refining connected vehicle system requirements. This Slippery Road Detection (SRD) project is a focused effort on a specific set of uses but may nevertheless fit under the larger umbrella project called Data Use and Analysis Processing (DUAP) which is similarly identifying Michigan DOT functional requirements for each of the larger operational departments in MDOT. 17. Key Words CAN bus, PASER, GPS, CSV, DataProbe, surface patrol, accelerometer
18. Distribution Statement No restrictions. This document is available to the public through the Michigan Department of Transportation.
19. Security Classification - report Unclassified
20. Security Classification - page Unclassified
21. No. of Pages
22. Price N/A

May 31, 2012 Page 2 of 63
Slippery Road Detection Project
Table of Contents Executive Summary ..................................................................................................................... 5
Introduction ..................................................................................................................................... 7
Scope ............................................................................................................................................... 8
Smartphone as a Platform ............................................................................................................... 9
Smartphone Benefits ................................................................................................................... 9
Smartphone Limitations .............................................................................................................. 9
DataProbe System Description ...................................................................................................... 10
System Overview ....................................................................................................................... 10
Data Sources .............................................................................................................................. 11
Internal Sensors ..................................................................................................................... 11
CAN Network Interface.......................................................................................................... 12
Surface Patrol Subsystem ...................................................................................................... 12
Configuration ............................................................................................................................. 12
Data Logging .............................................................................................................................. 12
UMTRI/MDOT Data Server ........................................................................................................ 13
Additional System Functionality ................................................................................................ 13
Data structures, analysis and organization ................................................................................... 15
Post collection tool box ................................................................................................................. 19
Daily mileage accumulation report (Scan9AutoDate.m) – ........................................................ 20
Visualizing Data Files – DPNCx7.m ............................................................................................ 21
Finding specific segment locations (PASER_two_points.m)...................................................... 26
Possible New Tools .................................................................................................................... 26
Applications ................................................................................................................................... 26
Slippery Road application .......................................................................................................... 27
Event Detection Example ...................................................................................................... 29
Road Roughness application ..................................................................................................... 30
DataProbe as a road roughness sensor ................................................................................. 31

May 31, 2012 Page 3 of 63
PASER measurements using DataProbe ................................................................................ 31
DataProbe Roughness Measurements .................................................................................. 32
Initial DataProbe Calibration process .................................................................................... 34
Lessons Learned ............................................................................................................................ 37
Conclusion ..................................................................................................................................... 37
Recommendations......................................................................................................................... 38
Appendix ........................................................................................................................................ 39
1. Droid Smartphone comparison chart ................................................................................ 39
2. Timeline by Quarters ......................................................................................................... 40
3. Vehicle Data Collection System Functional Requirements ............................................... 45
4. Users Guide for the Droid Phone and DataProbe Application .......................................... 56
5. DataProbe Installation Guide ............................................................................................ 59
6. Surface Patrol Data Sheet .................................................................................................. 61

May 31, 2012 Page 4 of 63
Table of Figures
Figure 1 - The Droid DataProbe System ........................................................................................ 11 Figure 2 - New Construction on M-14 ........................................................................................... 14 Figure 3 - Data Flow Organization ................................................................................................. 15 Figure 4 - DataProbe Signal List ..................................................................................................... 16 Figure 6 - Data File Example .......................................................................................................... 17 Figure 7 - Summary File Format Conventions ............................................................................... 18 Figure 8 - The Summary File .......................................................................................................... 18 Figure 9 - Daily Mileage Report ..................................................................................................... 20 Figure 10 - Menu Selection............................................................................................................ 22 Figure 11 - Vehicle Dynamics example .......................................................................................... 23 Figure 12 - PASER Graphics Example ............................................................................................. 24 Figure 13 - Histograms ................................................................................................................... 25 Figure 14 - Plotting Paths .............................................................................................................. 25 Figure 15 - Output of PASER_two_points.m ................................................................................. 26 Figure 16 - Inferring Slippery Conditions ....................................................................................... 29 Figure 17 - Event Detection Example ............................................................................................ 30 Figure 18 - Droid Orientation ........................................................................................................ 32 Figure 19 - Variation around the force of one gravity ................................................................... 33 Figure 20 - Asphalt - roughness variance = 1.7313 ....................................................................... 33 Figure 21 - Diamondale Test Loop ................................................................................................. 34 Figure 22 - Initial PASER Calibration Curve .................................................................................... 34 Figure 23 - Results of Initial Calibration ........................................................................................ 35 Figure 24 - Subjective versus Measured PASER data .................................................................... 36 Figure 25 - Droid Smartphone comparison table .......................................................................... 39 Figure 26 - User Guide 1 ................................................................................................................ 58 Figure 27 - User Guide 2 ................................................................................................................ 58 Figure 28 - Droid in place on instrument panel ............................................................................. 59

May 31, 2012 Page 5 of 63
Executive Summary The key project objectives were: 1) the demonstration and evaluation of a low cost data acquisition system that would provide a rich data set accumulated from multiple vehicles, and 2) establish how this data, coupled with situational data from other sources, might be used to detect slippery road conditions, rough road conditions and potentially other beneficial uses by the Michigan DOT. This work is part of an on-going research initiative to identify how state DOTS will use and benefit from the large quantities of data to be generated by future connected vehicle programs and to assist in refining connected vehicle system requirements. This Slippery Road Detection (SRD) project is a focused effort on a specific set of uses but may nevertheless fit under the larger umbrella project called Data Use and Analysis Processing (DUAP) which is similarly identifying Michigan DOT functional requirements for each of the larger operational departments in MDOT.
An analysis of the data requirements for the desired applications along with a survey of existing systems that could provide this type of data resulted in a data list of 31 parameters. Fourteen data items of this list can be sourced from the embedded OEM’s Controller Area Network (CAN) network. Six can be obtained from a variety of personal devices and two specialty data parameters come from dedicated sensors (road surface temp and humidity). While CAN provide a rich vehicle performance set, many of the specific parameters needed by Slippery Road Detection (SRD) are considered proprietary by vehicle manufacturers and not available. Further, vehicle CAN message sets vary by OEM, model, and year, making each potential instantiation of the SRD system unique. This is why the Connected Vehicle (aka VII) program worked with SAE to standardize those specific messages needed for safety and mobility systems. Unfortunately, at this time, no manufacturer is supporting the standard J-2735 message set. Limited CAN information from current production systems that are available to this project have been negotiated with Ford Motor Company, therefore only Ford vehicles are currently compatible with the SRD system. Efforts are on-going in negotiating non-disclosure agreements with other manufacturers through joint efforts of the national Safety Pilot program at UMTRI.
Of the available systems surveyed, a Droid smartphone was adopted to meet the overall requirements where the balance between data set richness, cost and ease of deployment were critical. The availability of the internal 3-axis accelerometer provided the capability to monitor vehicle dynamics along with road roughness. The smartphone also provided the combined use of the device for vehicle monitoring when driving and business use by employees when not driving. This works well where smartphones are already provided to employees for their business use.
The Droid smartphone application developed for this project is called DataProbe. It uses a Bluetooth wireless link as the primary interface method between the device and an external sensor module and a CAN device. The Droid can work independently, however the data set is limited to on-board data sources (GPS, time, and accelerometer). Adding the CAN devices adds CAN signals and adding the Surface Patrol subsystem adds surface temp and humidity sensing.

May 31, 2012 Page 6 of 63
The easily installed system is now deployed on MDOT vehicles. Over 13 G bytes of data have been accumulated over 30,000 miles. Most of the data was collected using the base system configuration. Only one vehicle is currently outfitted with the road surface temperature and humidity sensing, and two have the CAN interface.
A number of Matlab visualization tools were developed to assist in evaluating vehicle performance, algorithm development and data reporting. The initial focus on vibration data coming from the Droid 3-axis accelerometer resulted in the development of a roughness measuring tool calibrated to measure Pavement Surface and Evaluation Rating System (PASER) ratings. This has promise in assisting the MDOT in the continuous monitoring of road surface quality which is impossible to do using other methods. Other evaluations of vehicle performance data look at brake lockup, throttle position, vehicle speed, surface temperature and other parameters to assess whether a slippery condition can definitively be determined. Due to the limited amount of CAN data available to date, no conclusions can be drawn.
The DUAP 2 program was launched in January 2012. DUAP 2 will start by interviewing MDOT organizations to determine their operational needs. From these needs, system requirements and specifications will be developed for data collection system designs. It is expected that the DataProbe system will be an integral part of the final system and can be easily modified to accommodate additional data inputs that may be required.

May 31, 2012 Page 7 of 63
Introduction MDOT is continuing to be a leader in the application and development of Connected Vehicle systems. Connected Vehicle systems have been determined to increase safety from a vehicular and infrastructure standpoint. MDOT in various locations is working to collect infrastructure data to provide better management of the Departments assets. In addition to the work MDOT is currently doing, it is important to continue moving the initiative forward which means expanding our infrastructure and using existing infrastructure to demonstrate additional Connected Vehicle applications both for motorist and Department assets. The project’s focus is on the bigger picture that establishes alignment with MDOT's strategic plan goals of safety, mobility, asset management and planning using data transfer from existing assets providing near real-time data retrieval, analysis, and display for value added results using tomorrow’s technology. By developing these technologies and researching the uses of vehicle probe data, applications can be expanded throughout the state for future improvements to safety, mobility and planning that could improve the quality of life for all citizens. (Steve Cook, 2009)
A number of approaches are being tried to assess the most beneficial use of data from a variety of sources. For example, data can be purchased from data sources such as Navteq and Inrix traffic, or data can be obtained from OEMs under license (such as OnStar), or data can be obtained under partnership with existing fleet services (fleet operators, taxis, etc.), or data can be generated internally (own fleet). Each approach has its own benefits and limitations as to quality of data, richness of the data set and appropriateness of the data to the applications of interest. As a research effort, this Slippery Road Detection project investigates a low cost method to generate data using captive MDOT fleet vehicles. The approach takes advantage of the MDOT policy to provide personal smartphones to MDOT employees but prohibits them from using the phone while driving. Therefore, the phone can serve double duty and gather vehicle data when the employee is driving. The system can be used as a real-time data source by transmitting data wirelessly to office backend servers, or non-real-time by collecting data on an internal SD card that would be manually transferred at preset regular intervals. This smartphone-based system is the platform upon which this project is based. From data collected wirelessly, the assessment of slippery road detection and road roughness monitoring applications have been developed and assessed in this project report.

May 31, 2012 Page 8 of 63
Scope This Slippery Road research project will identify how MDOT might obtain and use probe vehicle data from a fleet of vehicles for useful applications such as detecting slippery roads and reporting rough road conditions.
A low cost system will be demonstrated and a proposal for a larger fleet rollout will be provided. This project will include, but is not limited to, the following:
• Complete the design and development of the system • Implement and deploy the system on vehicles including sensor equipment as needed • Develop a backend data collection server • Support data monitoring, analysis, and vehicle interactions as needed • Provide recommendations and cost-benefit analysis regarding a potential large-scale
application deployment • Coordinate delivery of data from the vehicles with the Data Use Analysis Processing
project

May 31, 2012 Page 9 of 63
Smartphone as a Platform Choosing a smartphone for the basic data collection platform is an obvious choice that takes great advantage in doing double duty as a business device for employee while serving as a vehicle data collection device while driving. Several device types were examined before the Android based Droid was adopted. The Android’s state-of-the-art multitasking operating system has matured since its introduction and now supports an open platform software development environment that is adopted by thousands of software developers who deliver applications to the Market Place, an on-line software store that has thousands of competitive applications available. The Droid device itself, is manufactured by Motorola who is now owned by Google, inc.
This project was begun using the original Droid in 2009. Since then, a migration to Droid 2 has occurred and recently Droid X2. While each device is backward compatible, each generation bring more features and more importantly, faster microprocessors. The latest Droid X2 uses a Nvidia Tegra 2, 1 Ghz dual core processor with 8 GB memory expandable to 32 GB.
While smartphones have few physical interfacing connections, the Droids do have a USB port, WiFi and Bluetooth wireless ports. In this project, Bluetooth is used as the primary ports for data collection of CAN and external sensor data.
Available accessories for smartphones include car mounting brackets that mount on the instrument panel or on the windshield. The Droid car mount contains a magnet that is sensed by the Droid when it is mounted and triggers the activation of the Car Mode application. From this state, the addition of turning the power on causes DataProbe, to load and start data collection. This is easy to use by just installing the device in the mount, starting the vehicle and driving away. The initial installation of the mounting bracket does require some care to assure the bracket and the subsequent mounting of the Droid is square with the axis of the vehicle. Within a few degrees error, the software can correct the data.
Smartphone Benefits • Low cost devices • Powerful computers • Dual use: Supports business applications and proprietary applications • Multitasking • All core system resources automatically updated and maintained • Built-in camera with geo-tags
Smartphone Limitations • Fragile USB connectors • Start-up processes not robust • Accelerometer calibration sensitive to mounting • Poor tolerance to high temperature operation • Limited battery life

May 31, 2012 Page 10 of 63
DataProbe System Description The slippery road evaluations will be conducted using two vehicles equipped with instrumentation enabling them to provide wireless transmission of vehicle status to backend servers. The vehicles will be equipped with an off-the-shelf handheld that interfaces with the vehicle’s on-board CAN data bus and additional sensors to measure local road surface and weather conditions. The handheld is mounted in a position on the instrument panel such that the driver has visibility of the display.
The handheld device will provide integrated sensors, functions and services including a GPS receiver, 3-axis accelerometer, compass, camera, Bluetooth, WiFi and cellular communications. A suitable mount will be provided to easily install the device on the instrument panel or windshield. Power will be supplied to the device from a vehicle accessory power port which will be shut off when the ignition switch is not active.
To allow capture of desired CAN messages, a CAN interface such as the OBD Key plugs into the vehicle’s On Board Diagnostic (OBD) connector and broadcasts CAN messages via Bluetooth. These messages are received by the handheld device which acts as a data logger.
Additional sensors such as road surface temperature and ambient humidity are mounted outside the vehicle at appropriate locations. These sensors will likely have an interface module providing conditioning and a USB output port which will also connect to the handheld through a Bluetooth transceiver.
System Overview The basic functionality of the system uses a Motorola Droid handheld device in the test vehicle running a data logger application called DataProbe. Upon first entering the vehicle, the driver puts the hand-held phone into a mount on the instrument panel. Magnetic switches located in the mount are sensed by magnetic switches in the Droid which causes the Droid to switch to a “Car Mode” application. When power is applied either manually or though ignition switch activation, the DataProbe application is launched.
The Droid first connects with the two Bluetooth sensor devices. It then scans operational data, once per second, from several internal Droid sensors, an external Bluetooth sensor module and a Bluetooth CAN network interface. The data from these three sources are formed into a snapshot data frame and time-stamped. The snapshots are then accumulated in a memory buffer SD card capable of holding many days of data. The snapshots are organized into conveniently sized data files.
These data files accumulate until a request is made to transfer the files to the systems backend MS SQL Server at UMTRI. When the request to transfer is made, the current file is closed and a new file is immediately opened to receive new snapshots. The closed file is transferred to the backend server via the cellular phone. In return, a confirmation of a successful transfer is made to determine if a re-transmit is required. The transfer request of the file may be done on-

May 31, 2012 Page 11 of 63
demand by the systems operators, routinely on a scheduled upload programmed by the operators or on an event trigger, such as a “buffer almost full” status.
The stored data may be viewed in an easy to read graphical format on the Droid’s display screen for in-vehicle monitoring of data. This is intended for vehicle testing and diagnostics purposes.
Data Sources The three sensor sources are comprised of Droid internal sensors, a Bluetooth CAN network interface, and an external Bluetooth module reading surface temperature and humidity.
Internal Sensors The Droid contains internal sensors that are sampled and stored in the data snapshot frames. These sensors include a GPS receiver and a three axis accelerometer. The internal GPS receiver will track location and maintain accurate timekeeping functions. The receiver’s coordinated Universal Time Code (UTC) will be corrected to local time (Eastern Standard Daylight time) prior to being stored in memory. The captured data will also indicate the number of satellites used in the acquisition of the position data.
All three axis of the Droid’s internal accelerometer will be sampled at approximately 100 samples per second to provide the resolution needed to evaluate rough road conditions at highway speeds. Raw data samples will be captured in the snapshot along with the time that it
Figure 1 - The Droid DataProbe System

May 31, 2012 Page 12 of 63
was taken. The data will be post processed to extract road surface information or vehicle dynamic movements.
CAN Network Interface The Droid also interfaces to the OBD II connector to capture operational data from the vehicle’s embedded network. This interface uses a OBDKey module equipped with a Bluetooth wireless
interface to send data from the CAN BUS OBD II connector to the Droid where the data is assimilated into a snapshot frame. The OBDKey module plugs directly into the OBD Connector located under the instrument panel, near the steering column (this is a standard location on all vehicles sold in the USA in the last 20 years). Because it is powered directly from the OBD connector, it powers up and down with the ignition key state.
The main functionality of the OBD Key module interface is to read the CAN Bus activity and send captured CAN messages to the Droid for assembly into snapshots. This will continue as long as the vehicle ignition key power is ON. Actual CAN message availability generated by a vehicle is determined by the manufacturer and varies widely from one OEM to another.
Surface Patrol Subsystem To measure road surface temperatures, a unique Vaisala Surface patrol system was adapted to the Droid platform using a Bluetooth wireless interface. This system is comprised of an infrared road surface temperature sensor mounted in the trunk floor, pointing through a drain hole to the road surface in the center of the vehicle. This provides the best protection for the device but does interfere with storage space for the spare tire. The system also contains a humidity sensor which also provides dew point data. This sensor was clamped on the front lip of the deck lid and protruded up about six inches. Both sensors were wired to a control module mounted on the back of the fold-down rear seat (2008 Taurus). A Bluetooth serial adapter is used as the primary interface to the Droid. This Surface Patrol system costs about $6,000, requires considerable installation labor, and is somewhat fragile due to the humidity sensor being exposed to the elements and an outside surface of the vehicle. It is not practical for use on a large number of fleet vehicles.
Configuration Of the three types of data available, the basic data snapshot, at a minimum, will consist of the Vehicle ID, and the GPS location and time of capture. The CAN network data, external sensor data and the accelerometer data are optional. Which of these data are captured in a snapshot is defined in a configuration screen upon initial setup. Once set, it continues with the configuration until changed by the user.
Data Logging When the vehicle is operating (ignition key on) and the Probe application is running, the Droid will capture one snapshot every second and add the data to the current, open data logging file. This will continue until the vehicle is stopped and turned off, the application is terminated manually, the Droid loses power (failure?) or a request is made to transfer the file to the home

May 31, 2012 Page 13 of 63
server. Under one of these conditions, the open snapshot file will closed. When a transfer request is made, the current data logging file will be closed and a new one opened to receive more snapshots. The closed file is then transferred to the home server.
UMTRI/MDOT Data Server A backend computer will be provided that will contain an MS SQL Server 2008 that will retain the vehicle’s snapshot data repository. The server will receive data files transferred from test vehicles in the field. Internal to UMTRI, analysts will evaluate and process the data to develop slippery road detection strategies and develop a process to automate the use of the data for potential asset management services such as for salt and snow plow logistics.
Pre and post processing algorithms will be utilized to filter and condition the data received for accuracy and appropriateness. MS Access will provide the user interface for data visualization and analysis. Data query and report forms will be provided as required to provide adequate monitoring and event awareness as the program proceeds. Trigger events will be defined to provide automatic notification when vehicle anomalies are indicated.
Additional System Functionality Similar to most other personal devices, the Droid is powered from a tethered power cord into a power connector in the vehicle which is switched on/off with the ignition activation. A standard cigar lighter connector is compatible, but does not switch off with the ignition and may run the battery down when the Droid is left powered on for long periods. The Droid needs to be powered on to operate and it needs to be mounted into its in-vehicle holder, but beyond this, no other driver interaction is required for normal operation. The Droid windshield mount contains magnets that are detected by electro-magnetic switches within the Droid and automatically launches the DataProbe activity.
Since the equipment used in this project is a full function PDA, the device may be removed from its mount and other practical applications can be downloaded and used at the discretion of the driver/operator. Such applications may include:
o Phone service for emergency notification
o E-mail or instant messaging for interaction with backend service operators
o Camera for documenting physical conditions at point of ABS activation.
o Mapping, routing and Navigation aids
o Vehicle graphical data monitoring on screen
Future connected vehicle applications that can be developed and added later include:
o In-vehicle signage
o Road roughness sensing (using internal accelerometer sensor)

May 31, 2012 Page 14 of 63
o Variable speed limits, e.g., school, time of day
o Trip travel time notification
Many functions can be combined. For example, the camera function can work while DataProbe is gathering data. The photo shown here was taken on M-14 on the day new construction was beginning between Plymouth and Ann Arbor. The picture is representative of the visual impact of the lane offset provided. The Droid windshield mount is designed such that the camera button is exposed along the top edge of the camera and the lens has a clear view directly forward of the vehicle. The driver simply touched the camera button once to activate the camera then touched it again to take the picture shown here. The Droid captures the exact time the picture was snapped and also captures the latitude and longitude of the location and stores this data in the EXIF photo properties header.
This proposed Droid-based OBE (on-board equipment) may become a baseline platform for other connected vehicle applications and is intended to have general purpose capabilities.
This project will strive to define and use components that are off-the-shelf and without hardware modifications. The use of off-the-shelf Motorola Droids may also enable additional instrumentation to be connected to the system. OBDKey CAN interface information can be found at: http://www.obdkey.com/index.asp
Figure 2 - New Construction on M-14

May 31, 2012 Page 15 of 63
Data structures, analysis and organization The data flow process in this system is straightforward. The Droid smartphone runs an application called DataProbe which reads internal and external sensors as well as data collected from system devices such as the CAN OBDKey. This data is captured and assembled into data file which is stored on the Droid internal SD memory card. These files can range in size between a few seconds of data or a maximum of 300 seconds (5 minutes). When the wireless data channel is available, these data files are sent to the server in the UMTRI offices. Generally this occurs every 5 five minutes but may be longer. If the system is shut down before data files are transmitted, they are sent on the next power up cycle. If they are in process of being transmitted when power is terminated, the Droid will complete the transfer before the device turns itself off.
Figure 3 - Data Flow Organization
The data files accumulate on the UMTRI server. Daily, a Matlab program is run that opens each data file and examines the quality of the data. If anomalies are found, the data file is closed then it is moved to an “anomaly” folder. If no anomalies are found, the file is moved to an accessible folder for general use. Also, once a day an incremental backup of the data files are made and a summary of the data file contents are evaluated and added to a Summary file. This process has these steps:
1. Data files received in server upload folder 2. Matlab anomaly sorter is run separating files with and without anomalies 3. The files without anomalies are summarized and added to the Summary File (logfile23) 4. A program is run to make a copy of the files without anomalies (backup)
Vehicle Data File Format
The data file created in the Droid aggregates multiple data sources into a file and stores the file in Droid core memory or the SD Memory card. This file contains up to 300 seconds of data. The

May 31, 2012 Page 16 of 63
data sampled every one second is assembled in records (rows). Each row can contain up to 325 data samples. The first 25 data values are signals received from a variety of sources. A list of possible signals is shown in Figure 4 and a sample of the data file is shown in Figure 5.
The following 300 signals are from the Droid’s 3-axis accelerometer. This sensor is sampled for each axis, 100 times per second. The data is captured in the file in ASCII characters and stored in comma separated variables (csv) format. This basic spreadsheet has 300x325 cells. A header is also included that contains pertinent information such as file name, file size, VIN, date, ambient temperature and odometer.
Two variations of the full sensor complement may occur. The system’s three sources of data signals are the Droid, the OBDKey and the Surface Patrol external sensor system.
If a vehicle is only equipped with a Droid only the first 7 data values will be captured in the data file plus the 300 accelerometer signals (307 total). If a CAN OBDKey is used, 14 columns will be added (321) and finally if the Surface patrol is used, the last 4 will be added making the total 325. If no data is available for a signal, the cell is filled with a 10001. For example, the CAN interface may be active but the particular vehicle may not provide the ABS active signal on the CAN network.
COLUMN HEADINGS DESCRIPTION Time Time of first sample taken LAT Latitude LONG Longitude ALT Altitude SAT Number of satellites received HEAD-G Heading calculated from GPS SPD-G Speed calculated from GPS RPM Engine RPM - CAN SPD-C Vehicle Speed - CAN ACC Accelerator Position - CAN ABS Anti-lock Brake activation – CAN ESP Electronic Stability Control - CAN TCS Traction Control – brakes – CAN TCSE Traction Control – engine – CAN DSCW Driver Stability Control Warning – CAN SWA Steering Wheel Angle - CAN BR Brake activation – CAN HD Headlight – CAN YAW Yaw rotation – CAN LAT-A Lateral – CAN LONG-A Longitudinal – CAN STMP Surface Temp – Surface Patrol DPNT Dew Point – Surface Patrol TMP-SP Ambient Temperature – Surface Patrol HUMD Humidity – Surface Patrol
Figure 4 - DataProbe Signal List

May 31, 2012 Page 17 of 63
Figure 5 - Data File Example
In this case a 10001 is placed in the empty cell. Another reason the signal may be missing is the timing of the request by the DataProbe is a little early and the CAN interface has not yet received the value from the network. Rather than wait for the signal, the cell is filled with an empty value (10001).
The Summary File Format (logfile23.csv)
The Summary File is a repository of the main characteristics of each data file. These characteristics are listed below and contain file name, date taken, start and stop times, general location when data taken, min and max speed during the test, distance traveled, mounting orientation, system mode and whether any CAN events were identified. The Summary file is opened and new file information from anomaly-free files are added every time the files in the
11
_185
204
8607
SAT
HEAD
_GSP
D-G
RPM
SPD-
CTH
ROT
ABS
ESP
TCSB
TCSE
DSCW
SWA
BRK
HDL
Y10
36.8
79.3
2518
78.1
18.5
00
00
02.
50
010
36.8
79.3
2508
77.8
17.5
00
00
02.
70
010
36.8
78.9
2500
77.5
200
00
00
2.9
00
1036
.778
.724
9377
.519
00
00
03
00
1036
.878
.124
8977
.318
.50
00
00
1.7
00
1036
.378
.124
8377
.117
.50
00
00
1.2
00
1036
.378
.124
7176
.713
00
00
01.
80
010
36.3
77.8
2460
76.3
130
00
00
2.1
00
1036
.377
.824
4975
.915
.50
00
00
1.2
00
1036
.277
2436
75.6
12.5
00
00
01.
60
010
36.4
76.6
2425
75.3
180
00
00
2.5
00
1036
.776
.224
2175
10.5
00
00
02.
10
010
36.7
76.2
2399
74.7
20
00
00
1.8
00
1036
.574
.823
8773
.711
.50
00
00
1.6
00
1036
.574
.323
6473
.313
.50
00
00
1.4
00
1036
.474
2349
7318
00
00
01.
40
010
36.7
73.9
2347
72.9
18.5
00
00
02
00
1036
.573
.623
4072
.718
.50
00
00
2.2
00
1036
.573
.623
3372
.513
00
00
01.
90
010
36.6
73.3
2338
72.4
13.5
00
00
02.
20
010
36.4
72.7
2310
71.8
14.5
00
00
01.
90
010
36.3
72.5
2302
71.6
15.5
00
00
02.
50
010
36.3
72.5
2296
71.2
160
00
00
3.5
00
1035
.872
2287
71.2
19.5
00
00
03.
20
010
35.8
7222
9471
.323
00
00
02.
40
010
35.6
72.2
2306
71.4
23.5
00
1000
110
001
1000
11.
80
010
35.4
72.6
2315
71.8
25.5
00
00
01.
90
010
3673
.323
4872
.820
00
00
01.
90
010
3673
.323
5072
.917
00
00
01.
80
010
35.7
73.8
2350
72.9
170
00
00
1.8
00
1035
.773
.823
4972
.717
.50
010
001
1000
110
001
-210
001
010
35.6
73.6
2335
72.8
17.5
00
00
00
00
1036
73.6
2339
72.7
200
00
00
2.9
00
1036
73.6
2345
72.7
20.5
00
00
00.
70
0

May 31, 2012 Page 18 of 63
upload folder are sorted (previous section). The logfile is named logfile23.csv. While directly
Figure 6 - Summary File Format Conventions
Figure 7 - The Summary File
accessible by Excel, the format is adjusted slightly and converted to an Excel format to see the data in an easy to read layout (with column widths adjusted, centered, sorted, etc.).
When DataProbe creates a new data file, it names the file with a convention shown in the graphic above. If the VIN number is read from the CAN bus, the first six characters are used as
COLUMN HEADINGS DESCRIPTIONDate Date vehicle file was created Start Time that first data row was sampledStop Time that last data row was sampled FILE NAMING CONVENTION 3FAHPO 05042011 150342 v1.6.0.csvFile File name VIN number (6) or Cell number (4)Size Number of bytes in file month/day/year**Rows Number of rows (taken once per second) hours/minutes/secondsAnomalies Number of anomalies (see description below) software versionLocation Descriptive location of vehicle - if known
StartLat Starting latitude of vehicle StartLong Starting longitude of vehicle SPD Min Minimum speed found in file ANOMALIES Each file tested for three conditions;SPD ave Average speed over duration of file Less than four satelites usedSPD Max Maximum speed found in file More than 326 colums reportedDistance Total distance covered No distance - vehicle did not move during file generationX axis Starting value of accelerometerY axis Starting value of accelerometer EVENTSZ axis Starting value of accelerometer ABS Anit-lock brakesMount Description of Droid mounting ESP Electronic Stability ControlMode B=Base; C=CAN; S=Surface Patrol; TCSB Traction Control System - Brake assistEvent Indicates number of events that occur (see list below) TCSE Traction control System - Engine assistAtmp-C Ambient temp from CAN busVersion Scanning software version
EXAMPLE
** Files generated prior to 4/1/2011 (using v 1.7.0 or earlier) have the month and day reversed in the file titles.
Size
Row
sAn
omal
ies
Loca
tion
Star
tLat
Star
tLon
gSP
D m
inSP
D av
eSP
D m
axDi
stan
ceX
axis
1129
778
300
0no
t det
erm
ined
42
.933
31-8
3.58
360
13.7
541.
8610
.04
11
3647
930
00
not d
eter
min
ed
42.8
7344
-83.
5968
56.8
80.3
81.8
6.54
10.0
7
1139
068
300
0no
t det
erm
ined
42
.790
04-8
3.54
1570
.379
.184
.56.
5710
.08
11
4218
830
00
not d
eter
min
ed
42.7
4301
-83.
4438
68.6
76.5
81.5
6.35
9.97
11
3902
530
00
not d
eter
min
ed
42.7
1081
-83.
3353
073
.479
.96
10.1
9
1144
151
300
0no
t det
erm
ined
42
.673
34-8
3.24
130
72.3
84.9
5.13
10.1
3
1005
946
265
0no
t det
erm
ined
42
.604
42-8
3.24
790
33.8
55.9
2.56
10.1
11
3624
230
00
not d
eter
min
ed
42.5
7084
-83.
2334
042
.759
.73.
4210
.11
11
6553
130
00
not d
eter
min
ed
42.5
3154
-83.
2044
00
44.4
1.06
10.1
2
1136
393
300
0no
t det
erm
ined
42
.516
64-8
3.20
380
45.7
50.3
3.51
10.1
7
9449
0924
90
not d
eter
min
ed
42.4
6532
-83.
2015
025
.951
.21.
6810
.13
11
3770
930
00
not d
eter
min
ed
42.6
1301
-83.
9404
020
.637
.11.
489.
89
1133
971
300
0no
t det
erm
ined
42
.602
63-8
3.91
740
45.1
53.5
3.31
9.48
11
3863
630
00
not d
eter
min
ed
42.5
811
-83.
8587
47.6
71.7
77.3
5.73
9
4602
7312
20
not d
eter
min
ed
42.5
3455
-83.
7684
048
.168
.81.
499.
26
3144
9283
0no
t det
erm
ined
42
.52
-83.
7566
015
48.4
0.44
9.71
11
3335
530
00
not d
eter
min
ed
42.6
4687
-84.
061
077
.479
.65.
79.
66
1134
251
300
0no
t det
erm
ined
42
.606
64-8
3.96
570
.576
.882
.36.
349.
69
1134
308
300
0no
t det
erm
ined
42
.575
66-8
3.85
3371
.777
.381
.56.
429.
69
1135
771
300
0no
t det
erm
ined
42
.522
62-8
3.75
461
.869
.178
.65.
89.
68
1133
995
300
0no
t det
erm
ined
42
.519
19-8
3.64
1364
.369
.476
.55.
89.
69
1131
458
300
0no
t det
erm
ined
42
.497
13-8
3.53
2464
.470
.777
.65.
919.
63
1126
546
300
0no
t det
erm
ined
42
.490
24-8
3.42
0555
.271
80.6
5.82
9.69
11
3075
430
00
not d
eter
min
ed
42.4
9127
-83.
3078
061
.780
.15.
129.
62
2189
5459
0no
t det
erm
ined
42
.458
92-8
3.22
340
8.9
37.2
0.2
9.65
11
3245
130
00
not d
eter
min
ed
42.9
3103
-83.
597
016
.348
.31.
6210
.02
11
2959
130
00
not d
eter
min
ed
42.9
2166
-83.
6212
00
58.9
1.05
10.0
8
1133
884
300
0no
t det
erm
ined
42
.910
89-8
3.60
690
60.3
78.4
4.36
10.0
5
1136
703
300
0no
t det
erm
ined
42
.849
44-8
3.58
8968
.777
.679
.16.
4210
.04
11
4390
430
00
not d
eter
min
ed
42.7
7174
-83.
5229
04
68.4
0.64
10.0
9
1131
422
300
0no
t det
erm
ined
42
.764
85-8
3.51
450
2.3
7.8
0.21
10.0
8
4613
612
0no
t det
erm
ined
42
.762
46-8
3.51
160
1.9
5.3
0.01
10.1
2
1140
441
300
0no
t det
erm
ined
42
.762
35-8
3.51
140
5576
.93.
8910
.1
1142
772
300
0no
t det
erm
ined
42
.740
86-8
3.44
820
52.7
743.
910
.12
11
3682
530
00
not d
eter
min
ed
42.7
3414
-83.
3797
15.7
34.3
442.
7610
.12
11
3756
130
00
not d
eter
min
ed
42.6
9721
-83.
3713
038
.848
.12.
9710
.13
May 31, 2012 Page 19 of 63
the first six of the file name. If the VIN is not available, the last four digits of the Droid phone number are used instead. The rest of the name format is straightforward as shown in the graphic. That is, the date, time and version number complete the rest of the file name.
If anomalies are found in the data file, the file is separated and stored in a separate folder and not included in the Summary File. Anomalies are defined by three conditions:
1. Three or less satellites visible to the Droid results in undependable location information from the GPS.
2. If more than 325 columns are reported in the spreadsheet this would indicate a corrupted file or a data collection error.
3. If the file does not show movement from one location to another, it is assumed to be a null file. Movement is indicated by the distance value being non-zero.
Zero Distance can be caused by several conditions such as extended idle times with the engine running, The DataProbe running while out of the vehicle (maybe charging the battery while on a table). Later versions of DataProbe sense this condition and will shut down DataProbe within 15 minutes.
Any one of several CAN event signals can set the Event value. The purpose of the bit is to allow quick scanning of the data file set to find files of interest. Notice that ABS lockup, Traction Control lockup and Electronic Stability Control can set the Event signal to 1 in the Summary File.
A possible performance enhancement for the updating of the Summary File (logfile23) might be the addition of an alert to be displayed on the server screen when an event has been reported by scanning a data file. Currently, the only recognition of an event that might occur is shown in the updated Summary File (logfile23).
The DataProbe Database
The folder containing the data files accumulated on the UMTRI server over the duration of this project contains 13,937 data files for a total of 13.2 GB of data. This data spans from 4/8/2011 to 5/9/2012 and resides in a folder named ‘database_a_valid’. All of the files are generated with a DataProbe version 1.4.8 or later. Version 1.4.8 changed the file naming format so that the date is listed in month/day/year sequence .
The prior versions (<= 1.4.7) use a day/month/year date sequence. The folder containing these data files is named PreVersio148. This folder contains 438 files (263 MB) dating from 10/13/2010 to 5/23/2011. These older files may require prior versions of Matlab script files for access. They are included here for historical purposes only.
Post collection tool box As DataProbe is expanded and more data uses are found, more and more data analysis tools will be needed, defined and developed. This section describes the tools created over the course of
May 31, 2012 Page 20 of 63
this project for the various purposes identified below. These tools were created using Matlab, a program designed for this purpose.
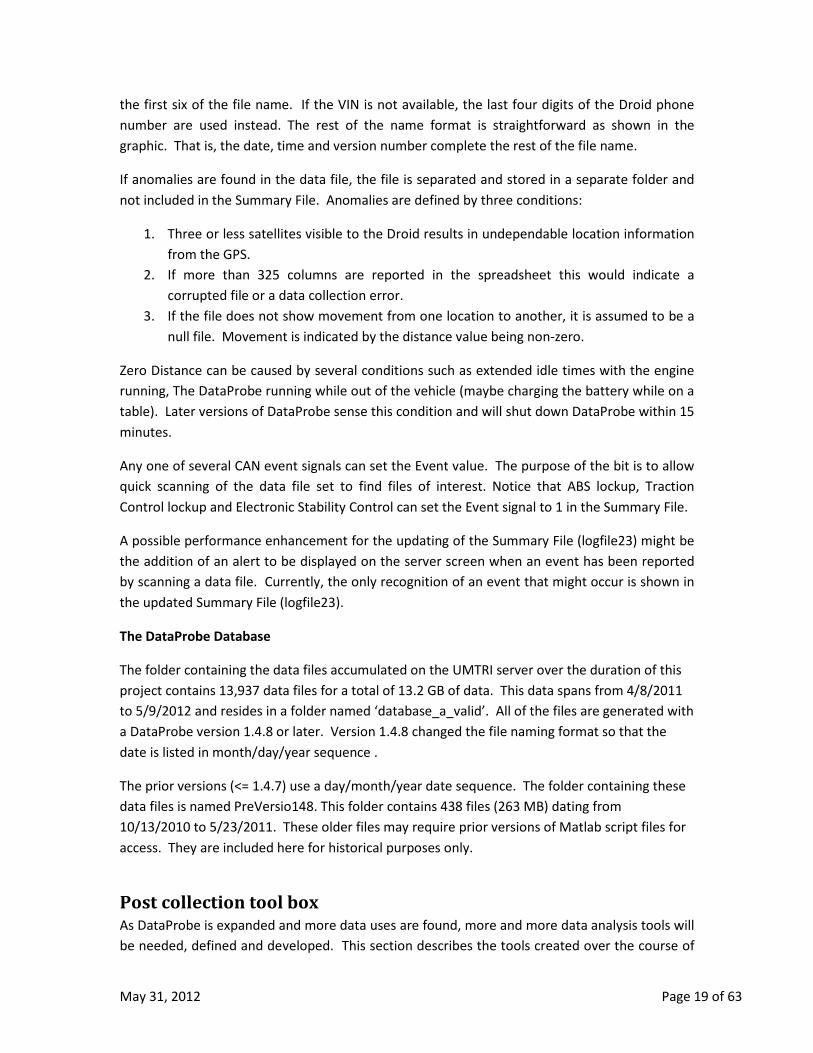
Daily mileage accumulation report (Scan9AutoDate.m) – A graphic of this report format is shown below. It contains a summary of miles driven, number of data samples taken and test duration for each of the deployed devices. The first column indicates the device ID by the last four digits of the phone number or the first four digits of the vehicle VIN number. The second column indicates the version of DataProbe contained in each Droid. The next three columns indicate miles, samples and time for the day specified when the report was done. The Events column indicates if any Events occurred and the next three indicate the accumulated miles, samples and time since the particular vehicle system was placed in service.
Distance is straightforward and is given in Miles. Samples are a little more complex in that a sample is really a one second data record captured in data files. Records, then are represented by one row in a data file. A full data file typically contains 300 rows (records). A record may be comprised of a various number of signals (columns in data file) collected due to system configuration (base, CAN and/or surface temperature). Therefore, the number of samples taken is the number of seconds data is accumulated during a trip. The total number of data samples, shown in column 8, is the total number of one second samples taken since vehicle deployment.
Figure 8 - Daily Mileage Report
C:\WWW\DataProbe\Stat_022712.csv DEVICE VERSION MILES SAMPLES TIME EVENTS TotMILES TotSMPLE TotTIME TotEVNTS
189 v1.8.0. 8.3 7 0 0 8.3 7 0 0411 v1.9.0. 0 0 0 0 2.8 710 0.2 01000 v1.6.0. 0 0 0 0 2574.2 215313 59.81 01784 v2.0.4a. 37.7 3261 0.91 0 978.1 88585 24.61 01851 v1.8.0. 0 0 0 0 167.1 17245 4.79 0
1FAF v2.0.3t. 82 5477 1.52 0 1963.5 147536 40.98 02352 v2.0.4a. 0 0 0 0 813.1 52110 14.48 03059 v1.8.0. 0 0 0 0 1154.4 60155 16.71 03082 v2.0.2. 0 0 0 0 1322.2 88415 24.56 03258 v1.8.0. 0 0 0 0 243.9 15950 4.43 03433 v1.8.0. 0 0 0 0 1149.9 64337 17.87 0
3FAH v1.8.0.. 0 0 0 0 1335.3 107451 29.85 04840 v2.0.2. 0 0 0 0 1473.2 92134 25.59 04983 v1.8.0. 0 0 0 0 192.5 11626 3.23 05126 v2.0.3. 0 0 0 0 6186.8 545565 151.55 06441 v1.8.0. 161.9 9125 2.53 0 8975.5 510030 141.67 06542 v1.8.0. 0 0 0 0 51.8 3611 1 06579 v2.0.3t. 11.9 253 0.07 0 2866.8 219710 61.03 06767 v1.8.0. 0 0 0 0 1193 92404 25.67 07953 v1.6.0. 0 0 0 0 0 504 0.14 06768 v2.0.3t. 0 0 0 0 347.9 32879 9.13 0

May 31, 2012 Page 21 of 63
*Devices showing only three digits for ID have their leading zeros suppressed by Excel. Device 189 should be 0189. Also, Device 411 should be 0411.
The program is preset with a specific date by the user before it is run. This is the day that will be assessed in the first data set (miles, samples, time columns) while the second data set always provides the total accumulated data.
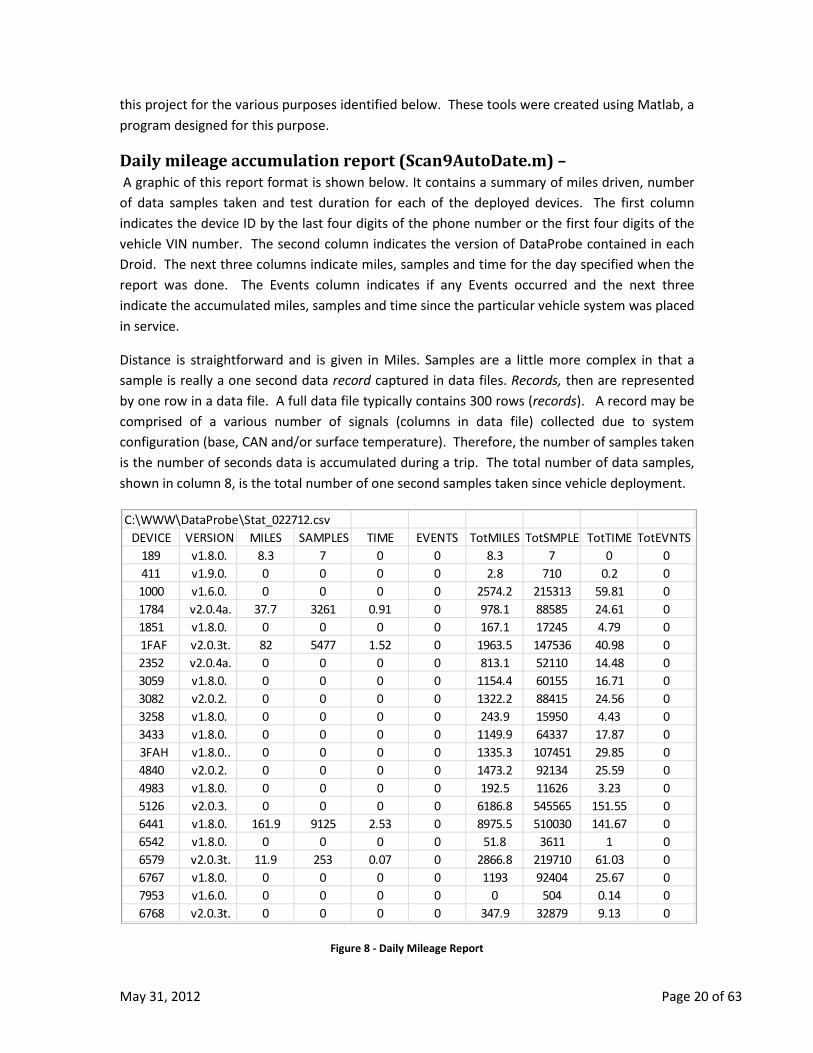
Visualizing Data Files – DPNCx7.m A plotting program was developed to visualize a Droid data file. The following section describes the variety of things the program does but does not look at the details of the software implementation. The details are best understood by going through the code listings and having some previous experience with Matlab. Also, the inner workings can be described better in the context of what it does relative to the application uses. Therefore, some of the software functional descriptions will be included later in the application sections.
The latest version of the visualization tool is DPNCx7.m. When started, the program asks the user to select the data file from a standard windows folder list. The file is opened by Matlab, the contents are organized and loaded and the Droid mounting orientation is confirmed by reading the accelerometer values for all three axis (the axis with the nominal value of 10.0 is the vertical axis).
The following graphic shows what the Matlab Command Window looks like when a data file has been selected. Notice the first line is the selected data file name. The next line shows the orientation is a fusion mounting where the Droid was mounted in the center console in a longitudinal orientation. That is, it was placed in a such a manner that the Droid’s display was facing the Driver’s door. The following five lines are the menu of commands available, followed by the ‘Select Action:’ input line. Entering a single digit command will execute the action. The command structure is several layers deep. Always entering a zero will cause the menu level to back up one level until it finally backs out of the data file (quits).
May 31, 2012 Page 22 of 63
Figure 9 - Menu Selection
Menu selection 5 - Vehicle Dynamics
For the first graphical example, the vehicle dynamics selection was made (selection 5). This results in generating the following graphic. Notice the four graphs span the full 300 seconds of data contained in the file. The sensitivity of each graph is preset based on the particular data being plotted. All parameters, scales and ranges can be easily changed either by the menu commands or by editing the DPNCx7.m script file.
Referring to the bottom graph in the figure, this is a compound graph showing the throttle position (ACC), steering wheel angle (SWA) and the brake switch status (BRK). What is important to note is the timing relationship between the signals not the specific levels, therefore, the decision was made to put all three signals on the same graphic, offsetting the signal graphs to display them clearly. Separating them would not allow all of the desired data to be shown due to the limited number of graphs that can be put on a page.
The next graph up is the heading of the vehicle and the altitude, both of which are derived from GPS data. The heading is shown on a 360 degree scale where zero and 360 are directly north. That explains why the graphic snaps back and forth between full scale and zero when the vehicle is heading north. Minor variations between 359 and 1 cause the switching to occur. Hysteresis can be added to the algorithm as a refinement but was not considered a priority at the time this program was developed. The second signal shown in this graph is altitude. It may have limited usefulness but it is included here for completeness. Notice the slight rise in the altitude around

May 31, 2012 Page 23 of 63
270 seconds. This is an expressway overpass. If this particular day was near freezing, maybe adding a plot of surface temperature would show this area over the expressway below freezing and signal an unsafe condition, for example.
The next up graph is speed (SPD-G) as calculated from GPS and finally the top graph in this example, is longitudinal force. In this graph the plot is reversed, that is values above zero are decelerations and values below zero are accelerations.
Figure 10 - Vehicle Dynamics example
The scenario from the data file shown in the picture is representative of starting a vehicle at home, maneuvering the vehicle out of the driveway onto a gravel side street (40 – 60 seconds), moving through an s-curve (120 – 130), turning north on pavement (150), turning east after stop at stop sign (185), continuing east. The next data file will continue the trip.
Notice that the top three graphs are generated by signals available in the Droid alone. The bottom graph must have signals from the CAN bus.
Entering zero in the Matlab Command Window will cause the program to return to the Menu.
Menu selection 6 – Plot Acceleration Data
From the Menu, selecting another command (6 – Plot Acceleration Data) results in the following graphic being displayed. The top graph is the force signal generated form the vertical axis of the accelerometer. This signal shows vehicle vertical vibration caused by road roughness. A process

May 31, 2012 Page 24 of 63
was used to convert this road roughness measurement to a Pavement Surface and Evaluation Rating System (PASER) rating used by the MDOT to rate roads across the state. This PASER value was incorporated in a Matlab algorithm and shown in the third graph as PASER. It is a 0 – 10 scale where 10 is the smoothest road surface.
Notice the section of very rough road between 230 – 265 seconds. This area had significant broken asphalt and potholes for almost a year before it was repaired. Later results are discussed in the application section. The section between 50 and 150 is a gravel private road showing a very good PASER rating.
Figure 11 - PASER Graphics Example
The bottom two graphs are the same as shown in the last graphic – heading and speed.
Entering zero in the Matlab Command Window will cause the program to return to the Menu.
Menu selection 7 – Plot histogram of PASER Rating Data
From the menu, enter a 7 to generate a histogram and variance calculation. For each entrance to the command, the user is asked to input the range of the sample desired. In this example, we chose to measure the Paser rating between 236 and 265 seconds which is the rough asphalt section from the previous graphic. This created the histogram below (left). The second sample tested was a section of gravel road between 80 and 122 seconds shown below (right).

May 31, 2012 Page 25 of 63
Asphalt: variance: 1.7313, Paser: 0 Gravel: variance: 0.22654, Paser: 5.3
Figure 12 - Histograms
Menu selection 4 – Plot Latitude versus Longitude (Map)
Entering 4 from the Menu screen will generate an x-y plot of latitude and longitude taken over the 300 seconds of the data file. This figure is shown in the graphic below. It shows the gravel
road in the lower left , turning left to go north-bound then turning right to go east. This feature is a useful quick reference for more complex data files to sort out vehicle movements.
Remaining Menu selections
The other menu commands in the program provide ways to change the range, coefficients, parameter selections, and what signals to plot. The program itself is somewhat clunky to use but does provide a significant engineering tool to assess a wide variety of data studies. A user should be skilled in using the Matlab language and feel comfortable making program changes to fit the specifics of the situation under study.
Figure 13 - Plotting Paths

May 31, 2012 Page 26 of 63
Finding specific segment locations (PASER_two_points.m) This program inputs coordinates for each end of a desired road segment then searches the Summary File (logfile23) to find which data files might contain that full segment.
Figure 14 - Output of PASER_two_points.m
Possible New Tools This project does not have the resources to explore all avenues of data analysis. Rather the exploration of new data algorithms, data base organizational structures and manipulative tools will grow over time as the program evolves. Following is a short list of possible new tools that could provide utility to the future data user.
1. Scan data in the Summary File and identify groupings of data files that comprise a complete trip. Looking at the starting time and ending time can be used to match a link between the two. A trip might be comprised of one, two or many files. The tool would generate an identifier that shows which data files make up separate trips. This can be helpful in quickly finding long trip events that span many miles.
2. Scan the Summary File and identify data file locations by a geographic grid system such that the Michigan map might be organized by 5 square mile cells. Each data file would be identified by which cells were occupied when the data file was generated. For example, in a data file, latitude and longitudinal would be compared to a cell map and a cell number assigned to the data file for each cell visited during generation. This would allow a user to quickly find files of interest in a particular area.
3. Link DataProbe photos taken to specific data files for quick reference.
Applications While many applications may use real time data, two hold promise to have short term benefits to MDOT: slippery road detection and road roughness monitoring.
File Name PASER PASER Variance Heading segment Smpl Row Location Location Row Location LocationRating Calc (deg) # sec. Start Lat Long End Lat Long
3FAHP0_05042011_120928_v1.6.0.csv 5 5.2 0.216 90 5 17 22 42.64741 -84.6457 39 42.64742 -84.64333FAHP0_05042011_120928_v1.6.0.csv 9 9.2 0.039 39.6 6 84 55 42.64789 -84.6423 139 42.65662 -84.64223FAHP0_05042011_120928_v1.6.0.csv 3 4.3 0.368 356.2 7 82 144 42.65722 -84.6422 226 42.66749 -84.64233FAHP0_05042011_120928_v1.6.0.csv 4 3.7 0.471 3.2 8 43 230 42.66805 -84.6423 273 42.67332 -84.64233FAHP0_05042011_120928_v1.6.0.csv 4 4.3 0.369 90 9 22 277 42.67388 -84.6423 299 42.67707 -84.64233FAHP0_05042011_121431_v1.6.0.csv 4 6.5 0.145 360 10 18 38 42.68216 -84.6424 56 42.68391 -84.64233FAHP0_05042011_121431_v1.6.0.csv 6 8.9 0.056 227.8 11 25 111 42.68414 -84.643 136 42.68228 -84.64563FAHP0_05042011_121431_v1.6.0.csv 2 1.7 0.833 316.6 12 19 149 42.68238 -84.6464 168 42.68314 -84.64823FAHP0_05042011_121431_v1.6.0.csv 2 2.5 0.682 270 12 19 173 42.68312 -84.6487 192 42.6831 -84.65093FAHP0_05042011_121431_v1.6.0.csv 2 0 1.528 90 12 8 245 42.683 -84.6484 253 42.68288 -84.64753FAHP0_05042011_122437_v1.6.0.csv 3 3 0.605 167.6 1 165 113 42.66794 -84.6621 278 42.6478 -84.66183FAHP0_05042011_122940_v1.6.0.csv 3 3.8 0.46 85.1 2 32 5 42.64736 -84.6612 37 42.6473 -84.65633FAHP0_05042011_122940_v1.6.0.csv 4 5.6 0.195 136.6 3 34 45 42.64671 -84.6552 79 42.64438 -84.65213FAHP0_05042011_122940_v1.6.0.csv 4 3.7 0.482 90 4 44 109 42.64428 -84.6509 153 42.64716 -84.6473FAHP0_05042011_122940_v1.6.0.csv 5 6.2 0.161 110.3 5 23 162 42.6475 -84.646 185 42.64738 -84.64333FAHP0_05042011_122940_v1.6.0.csv 9 9 0.051 90 6 74 199 42.6478 -84.6424 273 42.65663 -84.64223FAHP0_05042011_122940_v1.6.0.csv 3 4.6 0.315 360 7 22 277 42.65721 -84.6422 299 42.65988 -84.64223FAHP0_05042011_123443_v1.6.0.csv 4 3.6 0.498 360 8 35 66 42.66839 -84.6423 101 42.67313 -84.64233FAHP0_05042011_123443_v1.6.0.csv 4 4.3 0.367 360 9 50 107 42.67399 -84.6423 157 42.68149 -84.64233FAHP0_05042011_123443_v1.6.0.csv 4 6.2 0.159 360 10 13 162 42.68229 -84.6423 175 42.68386 -84.64233FAHP0_05042011_123443_v1.6.0.csv 6 8.6 0.067 90 11 25 252 42.6842 -84.643 277 42.68221 -84.6458

May 31, 2012 Page 27 of 63
Slippery Road application An effective slippery road detection system would seem to have obvious benefits for the motoring public as well as the maintenance crews that apply treatments to the road surfaces. A good system should identify exactly where the roads get slippery first, the area being affected, and a report of the conditions made to the local maintenance offices (state, county, city) so treatments can be selected and deployed quickly to the area. Also, dangerous conditions, once detected, should be reported directly to other drivers approaching the slippery area. The Maintenance Decision Support System (MDSS) has been under development by the Federal Highway Administration (FWHA) Office of Transportation Operations (HOTO) since 2001 (http://www.rap.ucar.edu/projects/rdwx_mdss/). This system uses existing data sources to support the decision making processes. One such weather data resource comes from the Clarus initiative which fuses data sources from available sensors, remotely operated weather stations and mobile sensors mounted on salt trucks. This information is quality checked before being made available to users on a public web site (http://www.its.dot.gov/clarus/).
While these tools are improving year-to-year they lack the direct sensing capability of vehicles that are affected the most. The Connected Vehicle program should provide this missing link by gathering information directly from vehicles on the roadway and examining their weather related behavior. This information, then, can be used in near real time to positively impact the travelers weather related situation. Reacting to the onset of an approaching winter storm can be managed with the conventional weather forecasting tools in common use today. Refining these tools with even more precise roadway weather data which MDSS and Clarus services provide can add significant improvements. But, the best information comes from vehicles directly reporting slippery conditions. For example, when it is damp at near freezing temperatures, getting direct information from a group of vehicles in a local area that their anti-lock brake systems are being activated, can be an immediate indication of black ice conditions.
One objective of this project is to determine what specific parameters can be sensed from vehicle operation that can be used to infer a potential unsafe weather condition. In keeping with another objective to achieve a low cost system, any incremental sensing mechanism must be low cost or be a shared component in a production vehicle that is used for another purpose. Here are examples of sensed parameters that can infer slippery conditions when the outside temperatures are near freezing:
1. Anti-lock brake system is activated 2. Traction Control system (engine or brake) is activated 3. Electronic Stability Control is activated 4. Measured speed (wheel sensors) momentarily does not match ground speed (GPS)
The activation of one of these safety systems is not sufficient, in itself, to conclude the road is slippery – other factors must be considered to improve the likelihood of an accurate conclusion. For example,
May 31, 2012 Page 28 of 63
1. The road surface must be close or below the freezing temperature. This can be approximated with the outside temp sensor that is on most vehicles today.
2. The event should be co-incident with similar events from other vehicles assuring a single event is not an anomaly
3. The road is not gravel 4. The deceleration rate measured by on-board accelerometers is less than expected for
ABS activation on a dry surface. In other words, the vehicle skids too easy inferring a low coefficient or friction (µ) (ice, snow, gravel, etc.)
5. Wipers and lights are ON inferring precipitation
The algorithms needed to infer or detect slippery conditions are not directly available in the vehicle for external use. Rather the vehicle’s data acquisition system gathers and transmits raw data to system servers which is then evaluated with a variety of algorithms to assess the vehicles situation and conditions. This allows maximum flexibility in using the latest algorithms available, fusing data from other vehicles, integrating weather data from Clarus, and considers road attributes.
This chart shows the various combinations of conditions and detection signals that can indicate slippery conditions. Two observations can be made immediately. First, most gravel roads are potentially slippery, especially with loose gravel after grading. However, an event such as ABS or TCS activating while driving them can remove all doubt. The driver must exercise caution in these circumstances, but the DOT asset operations and maintenance crews can do little to alleviate the problems.
The second observation to be made in this matrix is the conditions when the temperature is below 32 degrees. Any moisture accumulating on the road surface can make conditions slippery, however, detecting moisture is not easily done. That is why inferring slippery conditions by sensing slower than normal speeds, wipers ON and knowing about local weather reports of rain in the area, is not conclusive proof. If a safety system such as ABS or Traction Control is activated, however, under these other conditions, the chances are very high that slippery conditions exist and road surfaces may be treatable.

May 31, 2012 Page 29 of 63
Figure 15 - Inferring Slippery Conditions
However, without the supporting information, an activated ABS system doesn’t necessarily mean that the road surface is slippery. These systems can be activated for a wide variety of reasons; e.g., avoiding accidents, aggressive driving, stopping quickly with one wheel on a soft shoulder, etc. This is why more data must be used to support the supposition of slipperiness due to icy or snowy conditions. Further, the confidence of identifying icy conditions goes up dramatically if more the one or two vehicles report the same conditions in a local area.
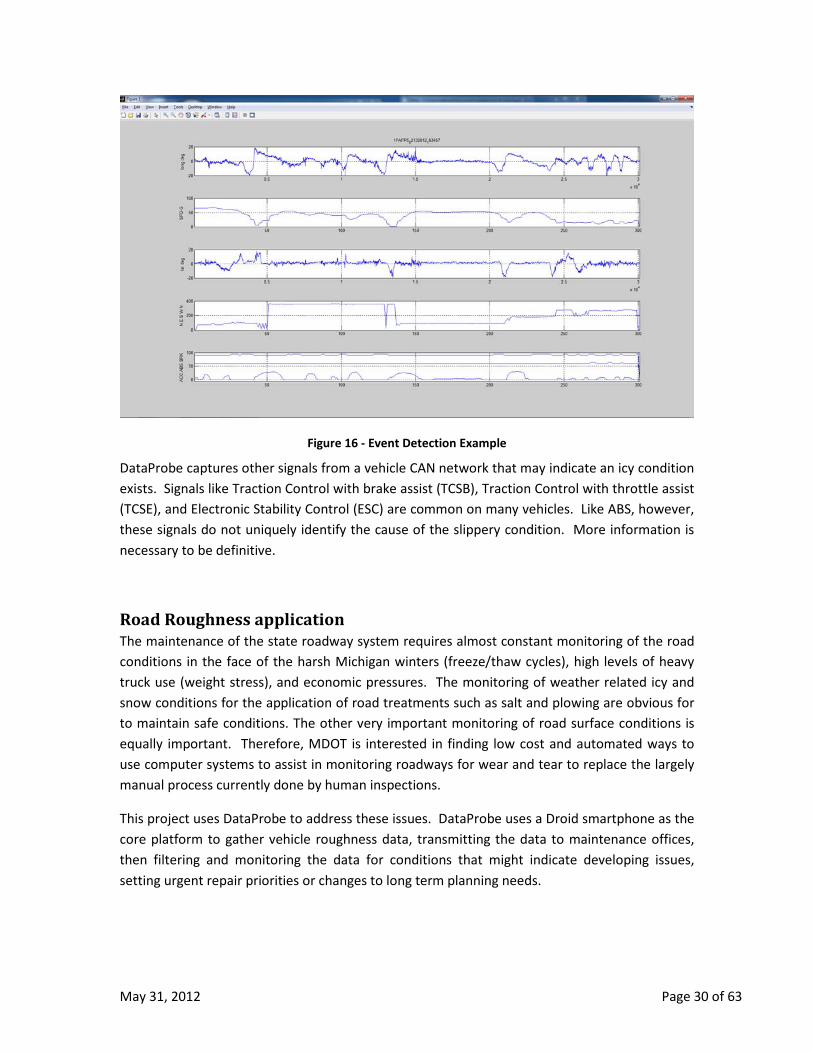
Event Detection Example The following graphics shows a data file containing an intentional ABS activation. Starting at 240 seconds the vehicle turned onto a gravel road with sections of loose gravel. At about 265 seconds into the graphic, the brake was applied hard three times in succession which caused the ABS system to activate. These three ABS events can be seen on the center line of the bottom strip chart. They are, of course, consistent with the Brake application shown on the top line of the bottom graph. The driver also followed each brake activation with a rapid throttle opening to maintain speed through this sequence. This can be seen in the bottom line of the bottom graphic (ACC). The top graph (long deg.) shows the deceleration force during the ABS activation events being reasonably high but no more so than several earlier events on the graphic; i.e., 30 sec, 125 sec, 219 sec., etc. This is because of the earlier braking events occurred on dry concrete that has a much higher coefficient of friction while the ABS events occurred easily on loose gravel. This example confirms the need to have additional information to confirm whether an ABS event is caused by an icy condition or some other road situation.
speed wipers
gravel <32 deg ABS TCS ESC accel decel slow ON slippery TBD
1 x - - - - - - - - x2 x - x - - - - - - x -3 x - - x - - - - - x -4 x - - - x - - - - x -5 x - - - - x - - - x -6 x - - - - - x - - x -7 - x x - - - - - - x -8 - x - x - - - - - x -9 - x - - x - - - - x -10 - x - - - x - - - x -11 - x - - - - x - - x -12 - x - - - - - x x x
Condition ResultDetectionLow U Active Dynamics Slippery
May 31, 2012 Page 30 of 63
Figure 16 - Event Detection Example
DataProbe captures other signals from a vehicle CAN network that may indicate an icy condition exists. Signals like Traction Control with brake assist (TCSB), Traction Control with throttle assist (TCSE), and Electronic Stability Control (ESC) are common on many vehicles. Like ABS, however, these signals do not uniquely identify the cause of the slippery condition. More information is necessary to be definitive.
Road Roughness application The maintenance of the state roadway system requires almost constant monitoring of the road conditions in the face of the harsh Michigan winters (freeze/thaw cycles), high levels of heavy truck use (weight stress), and economic pressures. The monitoring of weather related icy and snow conditions for the application of road treatments such as salt and plowing are obvious for to maintain safe conditions. The other very important monitoring of road surface conditions is equally important. Therefore, MDOT is interested in finding low cost and automated ways to use computer systems to assist in monitoring roadways for wear and tear to replace the largely manual process currently done by human inspections.
This project uses DataProbe to address these issues. DataProbe uses a Droid smartphone as the core platform to gather vehicle roughness data, transmitting the data to maintenance offices, then filtering and monitoring the data for conditions that might indicate developing issues, setting urgent repair priorities or changes to long term planning needs.

May 31, 2012 Page 31 of 63
DataProbe as a road roughness sensor The Droid has an internal 3-axis accelerometer that is capable of measuring motion and vibration in a wide variety of applications. DataProbe uses this capability to measure vehicle vibrations sensed at the top of the instrument panel as an indirect measure of vertical movements of the wheels. As the wheels move over cracks, potholes, and bumps, the energy of the vertical wheel motion is transferred through the suspension system to the vehicle body which transfers it to the instrument panel and windshield which in turn transfers it to the Droid which is mounted on a windshield bracket. Many things affect the fidelity of the motion transfer from say a pothole to the Droid sensor:
• Tire size and pressure • Suspension characteristics (geometry) and tuning (springs and shocks) • Body rigidity, tightness and dampening • Vehicle dynamics (speed, turning, braking) • Vibration resonances (frequency harmonics in vehicle structures) • Instrument panel structural attachments (rigidity) • Mounting bracket rigidity (rubber pads, thin plastic arms, slip fit joints)
Further, marking the location of a pothole or some other perturbation in the road surface requires the captured data to mark the location accurately. Currently, common GPS receivers in Droid devices are typically accurate to within 10 to 15 feet. Therefore, using the DataProbe methodology, we cannot determine how big a pothole is nor determine its location within 10 feet. What DataProbe can do very effectively, however, is measure the relative goodness of one situation over another, the relative roughness of this road over that one, or the relative worsening of this road over its roughness levels measured last month.
This comparative method, while effective, requires a lot of data to be recorded over similar paths so that averaging, selective filtering and self-learning techniques can be applied to reduce the impact of anomalies on a small set of data runs, anomalies such as mounting the Droid incorrectly in its holder.
PASER measurements using DataProbe MDOT surveys Michigan Roads annually to assess road surface conditions using PASER ratings. This is a visual and physical roughness assessment done with a qualified team of State, County and local transportation staff. A section of road is traversed, then, a rating of roughness is assigned based on the rider’s subjective feel of the drive quality. A rating of 10 is the smoothest and a rating of 1 is the worst road quality. The entire state is covered over a period of several months, county by county. No particular vehicle requirements are specified for the study, but an effort is made to use newer vehicles where possible.
One significant outcome from this project is the possibility that DataProbe can be used to collect PASER data continuously using a large number of vehicles. This approach can dramatically increase the quantity and quality of the data available for state and local road surveys. Further,

May 31, 2012 Page 32 of 63
the data collected can monitor all roads, monitor changes in road condition over time, and confirm construction changes were completed.
While this project confirms the feasibility of sensing road surface roughness using DataProbe, a next phase of this research project will confirm, with sufficient quantities of data, the relative accuracy and usefulness of this method. As more experience is gained, the use of DataProbe can be expanded further into the annual data gathering process.
DataProbe Roughness Measurements The accelerometer used in the Motorola Droid is the lis331dlh made by ST Microelectronics. It is a three-axis, low power MEMS device. Like all devices of this type, gravity always pulls down on one of the three-axis when a Droid is oriented in one of the positions listed in the table below. The quiescent output signals are shown in the chart.
The second position listed in the chart is the normal position for DataProbe when mounted on the instrument panel. This is similar to a navigation system mounting. In this orientation, the Droid’s x-axis will measure the vehicle’s vertical axis, the Droid’s y-axis will measure the vehicle’s lateral axis and the Droid’s z-axis will measure the vehicle’s forward or longitudinal forces.
The Droid is somewhat sensitive to its mounting arrangement in that the windshield mounting bracket used to hold the Droid may be subject to ‘floating’ if it is not mounted rigidly between the windshield and the instrument panel. When the Droid is suspended on the plastic mount it will lose fidelity in reading all of the vehicle’s body vibrations due to the flexibility of the plastic bracket. Further, vibration resonances can be generated by a cantilevered mounting. It is necessary to mount the Droid on a windshield with a suction cup, extend the arm such that the base of the Droid can touch the instrument panel with some pressure. It doesn’t require much pressure to work adequately. The vehicle itself is a far greater source of error in measuring vibration.
The following graphic is an example of the output of the vertical accelerometer signal gathered by DataProbe. This signal represents the vertical vibration measured with the Droid mounted on the instrument panel oriented similar to a navigation device. The signal trace shows 9.81 m/s2 nominal value with force exicitation from the vehicle varying above and below the nominal.
Position X Y Z vertically –
facing user
0 9.81 m/s2 0
vertical - left side
9.81 m/s2 0 0
vertical – upside down
0 -9.81 m/s2
0
vertical – right side
-9.81 m/s2
0 0
laying on back –
facing up
0 0 9.81 m/s2
laying on face – upside down
0 0 -9.81 m/s2
Figure 17 - Droid Orientation

May 31, 2012 Page 33 of 63
Figure 18 - Variation around the force of one gravity
While accuracy of the signal level is not critical, consistency is important. To minimize the error introduced if the Droid is not mounted very close to perpendicular to the road surface, the value of all three axis is computed using the square root of the sum of the squares algorithm. Therefore, a few degrees tilt in mounting the Droid will still result in a 9.81 m/s2 nominal result. Calculations like this are always done in post processing where algorithms can be changed, adopted, or adjusted to fit the needs of the analyst. The data collected in the DataProbe data files are always raw values from the accelerometer. A sample histogram is shown in this graphic representing a 10 second period taken over a rough section of asphalt.
In this project, variance of the vertical accelerometer signal was chosen as the metric to represent roughness. Variance is the square of standard deviation. The resulting variance in this sample was 1.7313. Matlab analysis tools allow the variance to be measured over any desired segment length.
MDOT expressed and interest in displaying the roughness value in real time on the Droid display by making a modification to the DataProbe application.
DataProbe measures the variance of the vertical force over the previous 3 seconds. Since the sample rate is 100 times per second, 300 values are used in a variance calculation. This resulting variance value is fitted to a calibration curve (discussed in next section) then updated on the Droid display every second. The displayed value can be turned off with a menu command selection to avoid bias while performing actual subjective ratings.
Figure 19 - Asphalt - roughness variance = 1.7313

May 31, 2012 Page 34 of 63
Initial DataProbe Calibration process The current PASER rating methodology uses MDOT qualified experts to drive a section of road and then assign a roughness value based on subjective feel and visual judgment. To evaluate the capability of DataProbe to automate this process, it was necessary to match the same ratings used by the PASER experts. To do this, a trial road test loop was defined around the village of Diamondale, MI and a MDOT expert was assigned to provide PASER rating for each section of road in this test loop (graphic on the right). This test loop happens to include a wide variety of roughness conditions from 2 to 9, on a 0 to 10 PASER scale. The latitude and longitude of each segment of the loop was carefully defined for each segment rated.
The Test Loop was then traversed with a 2010 Ford Fusion using DataProbe to capture roughness levels. Seven loops were made in a counter clockwise direction starting at Canal and
Lansing roads. The data files were examined and variance measured for each segment of the Test Loop. The variance values were derived from each segment length that exceeded 17 miles per hour. In other words, starting at the beginning of a segment, data collection began when the vehicle speed exceeded 17 mph and stopped when the speed dropped below 15 mph. A compilation of the seven values for each segment was then averaged and used to plot a correlation between this data and the PASER ratings provided by MDOT.
From this data, two observations were immediate. First, the Test Loop data did not make a distinction between 0, 1 or 2 rating values. The worst roads were rated <2. With this missing data, it was necessary to extrapolate to zero by filling in the data with estimated values. This is shown in red in the table on the right. Similarly, 10 was missing at the upper end, requiring an estimated value for the extrapolation. The second
Figure 20 - Diamondale Test Loop
Figure 21 - Initial PASER Calibration Curve
PASER Rating
V
ariance

May 31, 2012 Page 35 of 63
observation was the non-linearity of the subjective human ratings versus the measured variance values. At this time, with such limited experience with this data, no conclusions can be drawn on the non-linear relationship of variance versus subjective feel.
Two other data points for 7 and 8 in the table were found as outliers in the table and inconclusive. These two values were estimated as well. As a result of the curve fit table being comprised of seven actual measured variance values, eight MDOT rating values and two outliers, one cannot conclude this table is adequate to replace the current subjective method. Much more data is required, particularly at the ends of the scale (below 2 and above 9).
The following graphic is a sample of test data showing accelerometer data on the top row, followed by a derived real time PASER signal in the third row, over a 5 min sample time. This five minute data sample covers the test route from Windsor road to the first segment of Creyts road on the Diamondale Test Loop. Variance data is measured for each segment when the speed is stable and above 17 mph. The rectangles shown in the figure indicate the segments measured. The variance values shown in the boxes are taken over the width of the boxes as are the subjective ratings provided by the PASER expert (shown at the bottom). The variance numbers are then converted to PASER values using the curve fit algorithm described above. Since roughness naturally varies over the length of a road segment, the ‘real-time’ graph of PASER measurements is more useful to differentiate problem areas in the roads surface.
Figure 22 - Results of Initial Calibration

May 31, 2012 Page 36 of 63
This graphic shows reasonable correlation between what is measured and the subjective ratings by the MDOT rater, with two exceptions at Jefferson 1 and Bridge street. For these road segments, the measured data looks consistent and complete. No explanation can be found for the sizable difference in the measured versus rated numbers for Jefferson 1, but Bridge street is only different by 1 rating number. This could be caused by the rather course resolution used in the subject rating methodology.
Windsor Jefferson 1 Jefferson 2 Bridge Diamondale Creyts Variance 0.729 0.146 0.440 0.592 0.256 0.053
Measured 3.4 5.7 3.9 3.0 5.0 9.0 Subjective 3 3 4 4 5 9
Figure 23 - Subjective versus Measured PASER data
Obtaining more data to refine the curve fitting algorithm will be the objective of an extended phase to this project that will install Droids on vehicles used for MDOT’s annual PASER rating study (June 2012 – November 2012). MDOT completes a PASER survey of the State’s roads every year along with Counties and local road authorities.

May 31, 2012 Page 37 of 63
Lessons Learned The use of DataProbe to gather probe data from MDOT applications has been proven. This project confirms that the Droid by itself is useful and simple to deploy. In fact, the ability to use the Droid for business use and vehicle data collection is very complimentary and cost effective. The two uses are mutually exclusive in that when the car is in motion, the Droid should not be used for phone calls, texting or any other connected purpose. When the car is stopped, the Droid can be removed and used for a wide variety of purposes in the business environment. Further, when it is out of the vehicle, it also protects the Droid from extreme summer temperatures found in a closed car on the instrument panel.
The primary limitation is the data plan cost for the Droid being approximately $35 per month. Add this to the cost of providing the basic phone service and it might be prohibitive to provide to each MDOT employee. That is a business decision that must be evaluated for each application against the usefulness of the data in return.
An alternative might be DataProbe’s ability to switch the cellular service off so that data is accumulated in the 16 GB SD memory card. This would allow over 16,000 data files to be stored or an equivalent of 1300 hours of data to be stored. The data files could then be downloaded manually by PC at some convenient time or a WIFI link if one is available on occasion. The loss, of course, is the ability to see in near real time any significant events to be monitored. Also, the loss of data collection due to hardware failure or incorrect use may go undetected for a long period.
Another alternative might be the selective activation of the Droid data service under certain conditions. The DataProbe application can determine the sensitivity of the data and activate the send service as needed. This can minimize the user cost my minimizing unnecessary sending of data. For example, when an ABS event occurs, the data file can be sent immediately but if a background data file for roughness is generated it can be archived for a future transfer.
This project also confirmed that the CAN Bluetooth interface is a convenient source of data for some applications. Unfortunately, some desired signals for safety applications are not yet available on CAN networks. While signals like wiper and headlight activation is needed to support bad weather inference they are not yet available. These are included in the new SAE standard J2739 developed for connected vehicles, but no OEM is currently supporting the standard. UMTRI signed an agreement with Ford Motor Company in 2011 to use their proprietary message set for the purposes of this project. This gave DataProbe access to 17 signals otherwise not available. There is no short term solution to this limitation of not having CAN available for all applications. It must be dealt with on a case by case basis.
Conclusion The MDOT is planning to use DataProbe to gather probe data during the PASER annual survey starting in June 2012. This will generate sufficient data to confirm whether the subjective PASER

May 31, 2012 Page 38 of 63
rating methodology might be automated. This will result in considerable savings by MDOT and result in rating far more roads than ever before. This work will extend the current project at least to year end. Since this effort is a natural extension of DUAP, it is expected the funding will be pulled under the DUAP umbrella. Similarly, further weather related work is already planned for DUAP and it is a natural assumption that winter weather sensing will be included in DUAP and VIDAS as those requirements get firmed up.
Recommendations Smartphone technologies have proven applications that can add-value to a DOT’s operations, maintenance and asset management programs. The software used for this project, “DataProbe”, has the ability to coalesce data from other sensing devices on a vehicle into a smart phone and deliver the data from those sensors to a server for analysis and use. DataProbe has proven successful in this pilot program but a number of additional functions and services are needed to make it fully scalable. These additions would include:
• DataProbe software needs funding to provide continuous technical support for updates and troubleshooting issues.
• More fleet vehicles are needed so that a comprehensive comparison of data can be documented and consistencies in data sets between various collection platform types or similar vehicles can be made.
• More CAN bus and Surface Patrol devices are needed to link to the smart phone • Expand vehicle fleet data collection.
DataProbe and the smart phone technology in vehicles could be used to enhance a decision support system for winter maintenance operations as well. With enough penetration of fleet vehicles, this method of data collection could be used to collect atmospheric information between stationary Environmental Senor Stations (ESS) or Roadway Weather Information Stations (RWIS). With information like this, economies of scale could be achieved for winter maintenance operations. Further, improvements toward defining initiatives like level of performance, regain time and winter severity index would likely be achieved as well.

May 31, 2012 Page 39 of 63
Appendix
1. Droid Smartphone comparison chart
Figure 24 - Droid Smartphone comparison table

May 31, 2012 Page 40 of 63
2. Timeline by Quarters 2Q, 2010 - Work has commenced on the system design, architecture and vehicle configuration assumptions. A draft version of the Requirements document has been completed along with a draft SOW document to solicit a software developer. Both of these documents will be sent to and discussed with the MDOT Project Manager. Investigation into the available CAN interfaces is proceeding with the intent to find vehicles with ABS status messages.
3Q, 2010 - The Droid Data Collection Description and Requirements document was completed and refined to accommodate the Motorola Droid Smartphone and sensor interfaces needed. An RFQ was distributed to multiple software contractors with the requirements document. A survey of outside vendors found four suppliers from which Intersog was chosen as the most capable, with the best resources. A sample software algorithm was generated to validate the accelerometer functionality. Vehicle data was collected showing the three axis accelerometer working as expected. Additionally, investigation into the available CAN interfaces is proceeding with the intent to find vehicles with ABS status messages. Ford Motor has been approached to provide CAN data. An NDA has been initiated (April 15) but negotiations over some details have delayed the approval process. If unresolved in two weeks, OEMs will be solicited.
4Q, 2010 - A request was made to obtain a CAN data set from Ford Motor Company. An NDA initiated with Ford Motor Company in April was approved August 3. A 2010 Fusion data set was obtained and filtered for the CAN messages needed. The format and constructs were extracted and sent to the software developer for integration into the CAN OBDKey interface. Software changes are necessary to the interface and are currently in process. Surface temperature sensor and interface module were received July 26 from the supplier after three months since the order was placed. The unit is now in a bench setup for testing and software development. The surface temp system requires a conversion from standard serial output to a USB interface for the Droid (in process). Framework of the software application has been delivered and tested in several phases over the last 3 months.
1Q, 2011 - The DataProbe software application being developed is functionally completed, however, an in-stability observed has prevented extended vehicle testing. The current software version successfully implements four types of data: internal GPS/time/date, CAN data (Ford Fusion configuration), external surface temperature (Surface Patrol system), and the internal 3-axis accelerometer. Data files are formed and transferred to the Microsoft SQL server at UMTRI. The instability occurs in the scheduling routines initiated by the power on/off cycles. The developer is currently working to resolve these issues with the instability. A separate issue involves the CAN message set provided by Ford. Two CANID messages identified do not work as specified in the documentation. These two messages include 4 signals: Air Temp, Barometer, Coolant Temp, and Odometer. UMTRI is working with Ford to find a solution. Fourteen CAN signals are being received and captured successfully.
2Q, 2011 - The DataProbe software application being developed is functionally completed. The software instability identified last quarter has been resolved and all elements of the software

May 31, 2012 Page 41 of 63
are now functional. Detailed operational testing is being completed now to confirm full operational performance prior to release. Collected data files are being uploaded to an SQL server at UMTRI. The csv file format was finalized and is consistent with the Matlab visualization and analysis tools developed for this purpose. Refinements to the visualization tools will proceed as new needs arise. The current DataProbe application runs on a Droid with OBDKey Bluetooth connection to the CAN network of a 2010 Ford Fusion.
A summary overview of initial test results and observations to date:
• Droid internal accelerometer is sensitive enough to monitor road roughness, sense potholes and observe vehicle dynamics and turning movements and a vehicles acceleration or braking.
• A rich data set for vehicle dynamics can be gotten from the Droid device without requiring CAN. The combination of GPS receiver providing lat/long, altitude, speed, direction, distance, and time along with the 3-axis accelerometer sensing of vehicle turning movements, vehicle acceleration and braking can provide critical traffic movement, congestion, incident sensing and so forth. This capability significantly enhances the systems value over sensing road roughness alone.
• Slippery Road detection is significantly improved when CAN messages are available for ABS lock-up, and Traction Control activation.
3Q, 2011 - The DataProbe application developed for this project has been refined in several ways. The data output format has been adjusted; 1) Heading data source changed from the internal Droid magnetometer to a calculated value from GPS coordinates, 2) Headlight status (ON/OFF) added to the CAN data set which includes ABS, Traction control, throttle, brakes, RPM, etc., and 3) labels and format of data set re-arranged to provide easier readability. Matlab script files were created to analyze and summarize the "csv" data files collected from the DataProbe output. The first scans and maintains a summary list of the over 1200 data files contained in the database (so far). As files come in daily they are added to the list. The list contains file information such as: size, where the file data was collected, time/date collected, number of errors found (if any), min and max speeds, total distance covered, average 3-axis accelerometer values, mounting condition, CAN present, events found, and ambient temp.
Another Matlab script file was developed to evaluate and plot data from individual csv files. The script reads and extracts the raw data from the csv in a form that can be cross-plotted with other data. Since each csv file contains 300 data samples (5 minutes), the plots are also 5 minute samples. Three types of data are available for plotting: 1) location (coordinates, altitude, heading); 2) vehicle dynamics (speed, steering wheel angle, brake, throttle, pitch and roll angles, ); 3) road roughness (vertical forces, lateral and longitudinal forces). Using these facilities, for example, plotted data can easily identify rough spots in pavement surfaces which can be monitored over time, viewed on Google Earth, or physically examined by inspection. Due to the variations on vehicle characteristics (suspension, weight, size, tire pressure and body "tightness") and Droid mounting variations (rigidity, orientation, and resonance), the amplitude

May 31, 2012 Page 42 of 63
of road surface irregularities cannot be accurately measured with this system. However, considerable value can be obtained from comparative analysis. There is considerable value in having large amounts of data repetitively over the same road over long periods can be used to monitor current conditions, watch changes to the conditions over time, and identify specific faults that are comparatively worse than surrounding conditions.
4Q, 2011 - The DataProbe application continues to collect data files in UMTRI's SQL server database. Currently the database contains 6,400 files totaling 5.9 GB of data. While UMTRI is continuing to collect data on its vehicle, MDOT has deployed DataProbe on 11 of their internal fleet vehicles. A summary file is updated regularly to monitor progress and identify anomalies that may occur. A script file to automatically report out and summarize data volumes via e-mail to the project team is being completed. It will be activated in a week or so after final debug. A number of new Matlab programs have been generated to analyze the data collected. To assist in assessing road roughness data, two types of software programs have been developed. One type examines the accelerometer data in a file for levels, corrects for orientation errors, separates lateral and longitudinal vehicle dynamics from vertical acceleration data and computes normal distribution variance values for specific road segments. These computed variance values will be correlated to the PASER ratings used by MDOT to rate road roughness. The plotting programs have been updated to visualize this data for specific files of interest. The second type of software tools developed automatically scan the database to find specific files containing specific road segments. The user inputs two sets of coordinates that define the end points of a segment. The software searches the database looking for files containing these coordinates. The variance value of each segment found is calculated and reported. Another program searches the database finding all segments in each file, calculates the variance and reports out the results. This output containing this information can be examined to find segments with the worst case roughness, average values of segments given many vehicle passes made, changes in roughness values over time, and so forth.
1Q, 2012 - The DataProbe application is operational on 10 vehicles at MDOT and 1 vehicle at UMTRI the database has grown to over 8,000 valid data files, 24,900 miles driven, and almost 1.8 million data samples. To maintain the quickest processing of the data the files containing anomalies were separated into a separate folder. Anomalies can be caused from 1) using too few GPS satellites, 2) improper format, i. e., too many data columns, or 3) non-moving vehicle (zero mileage). These files have little value to the end user. A summary file of the current database is being printed and provided to the MDOT Project Manager.
An MDOT pool vehicle (2006 Taurus) has been provided to UMTRI to install a system that monitors road surface temperature, humidity, dew point and ambient temperature. The system is now operational including the OBDKey CAN monitoring device and ready for re-entry into service. The road surface sensor was mounted through the floor of the trunk (removed plug in existing drainage hole) with the optical sensor pointing straight down to the road surface. Adequate bracketing was added for support and protection. The humidity sensor was mounted on the trunk lid edge closest to the rear window. The conditioning module, wiring, and

May 31, 2012 Page 43 of 63
Bluetooth adapter is also mounted in the trunk within close proximity to the sensors. One of the recent changes made to the Droid display is the addition of a readout showing which devices are currently being used for data collection. A display showing B, BC, or a BCS representing Base, CAN or Surface Patrol connections is used.
The test data collected from a series of test runs in and around Diamondale and the MIS race track (reported last quarter) was evaluated and compared to the direct measurement by a PASER rating expert. Inconsistencies and outliers were noted and corrected. A curve fitting algorithm was applied to the resulting data and software modifications made to generate real-time PASER ratings as an output on the Droid display. Re-running the test loop route and comparing the PASER display with the PASER rating expert's results shows excellent correlation. One obvious observation is the range of the sensing possible using DataProbe is far greater than the range currently used by human observation. The current range for the Expert's rating is a scale from 1 - 10. A "poor" road condition is a rating of 1 which can be found on many current arterials. The variance measured by DataProbe can be scaled down to include even gravel roads. This enhanced range may be useful to county DOT's that need to maintain grading schedules for local gravel roads. This enhanced use of DataProbe may be the subject of future work project.
Significant variances can be seen on DataProbe systems mounted on different vehicles, using different mounting methods and in some cases, parasitic vibrations from vehicle subsystems such as the A/C compressor operation. These observations will be examined in the next quarter to find useful methods to achieve consistency and reduce variability of results.
2Q, 2012 - The DataProbe application continues to gather road data on a fleet of MDOT vehicles. One vehicle has accumulated 10,877 miles, another 6,187, another 3,486. The total fleet contains 10 vehicles but not all vehicles generate data on a regular basis. We have accumulated a total of 48,537 miles of driving and 3.4 million data points for a total of 948 hours of run time data.
In February, a 2006 Taurus was loaned to UMTRI to install the Surface Patrol system to gather weather information such as road surface temperature and humidity. The system was installed and returned to service. After 10 days of service, the Surface patrol system stopped sending data. Upon investigation, the humidity sensor had failed and was replaced with another. The vehicle was again returned to service. On occasion, a system connectivity issue would prevent the devices from starting up correctly and required a re-booting of the Droid and OBDKey. Interference from other DataProbe devices in the vehicle (spare units) was suspected as the cause and further investigation is needed. Due to a very mild winter, with only a few snow days, the vehicle collected very little road surface temperature data from snow covered or icy roads. March was even milder. Further, the vehicle itself had an inherent vibration during normal operation (even at idle) that was not identified. This vibration was sensed by the Droid accelerometer and prohibited the collection of useful road roughness data. For example, the DataProbe would frequently display a PASER level of 1 (very rough road) while sitting idle at a
May 31, 2012 Page 44 of 63
traffic light. Due to a re-organization of the ITS group at MDOT, it was decided to return this vehicle to the responsible department and transfer the equipment to another Taurus vehicle. It has not yet been decided to install the Surface Patrol sensors in the newer vehicle because winter has passed. However, the vibration levels in the newer Taurus are much better behaved. We are currently confirming the vehicle's overall performance.
Additional OBDKey devices made by KBM, inc., were purchased so that additional vehicles could be brought on-line. It was found that the firmware in the OBDKey had been updated from v1.30 to v1.40 requiring a change to the DataProbe application as well. Intersog, our software developer is currently working with Sinclair Easton from KBM to make the appropriate changes. This will expend the remaining funds for the project's material expenses.
A request to modify the Slippery Road budget was approved by MDOT Program Manager and the Office of Best Practices. The requested changes convert $25k in funds from leasing two vehicles to labor hours so that enhanced PASER algorithms could be developed and evaluated.
3Q, 2012 –On May 14, it was found that the Slippery Road data server crashed as a result of a failure in the RAID hardware interface. Rebuilding efforts was started but it is not expected to be brought back on-line until the project ended on May 31, 2012. As a result, the last data backed up to May 9, 2012 is the last reported in the database. When the server is brought back on-line, data files collected and stored by Droid units will be sent to the server. None are expected to be lost.
The Slippery Road project ends May 31, 2012.

May 31, 2012 Page 45 of 63
3. Vehicle Data Collection System Functional Requirements
Vehicle Data Collection System
Functional Requirements
Ralph Robinson University of Michigan
Transportation Research Institute 2901 Baxter Road
Ann Arbor, Michigan 48109-2150
(734) 764-2181
March 8, 2010 Revised: May, 2012

May 31, 2012 Page 46 of 63
DataProbe Functional Requirements Physical System Assumptions
• The basic handheld computer used is a Motorola Droid phone o The Android 2.0 O.S and the Droid microprocessor is fast enough
to run concurrent background services at the data sampling speeds needed
o Internal GPS, accelerometer, Bluetooth 2.0, and USB (optional) has fully functional drivers available
o Windshield mount magnets can select and initiate DataProbe background application
• The Bluetooth profile supports operating two concurrent devices o BT devices are automatically connected when DataProbe starts o Latency times when switching between BT devices is adequate
• Power supplies can be rigged to support device requirements • The humidity sensor selected is robust enough for automotive
environment Physical System Requirements
• A Motorola Droid phone operating with a Java-based Android 2.0 OS will be the base computer component.
o The GPS receiver and its integrated UTC clock will provide the systems location and timing functions
o The on-board 3-axis accelerometer will be the primary source of rough roughness measurements, sampling at 100 times per second.
o The Bluetooth 2.0 wireless transceiver will connect to, and pass data from, two external BT devices.
o The Droid phone will mount in the vehicle using a windshield mount made for this phone. The mount has magnets that activate the vehicle application automatically when the phone is mounted in the bracket.
o The phone will use a vehicle powerpoint plug (switchable cigar lighter connector) for its power source. The phone uses the USB Micro B connector as the charging port for the phone. An optional cable and power adapter will be provided for this connection.
o The Droid will use an active Verizon 3G data service to automatically transfer accumulated DataProbe data to the backend server at UMTRI. The Droid will be upgraded to a 32 GB Micro SD card
• The Bluetooth enabled CAN interface will use an OBDKey device based on the standard ELM 327 chip set. The OBDKey accesses the J1850 bus (PWM / Ford protocol only) and from the K-Line (ISO 9141, KWP2000) at both 10400 and 9600 bits per second. The OBDKey is made by KBM Systems, Ltd. (www.kbmsystems.net). This device is powered from the CAN OBDII connector and switches off with ignition key.

May 31, 2012 Page 47 of 63
• The Surface Patrol HD sensor system will be used to sense road surface temperature, ambient air temperature, dew point and relative humidity. Manufactured by Quixote Transportation Technologies, Inc. (www.qttinc.com) . The RS-232 output will interface to the Droid with an IOGear GBS301 Bluetooth Serial Adapter. This adapter has accessible DIP switches to match the serial bit rates. The vehicle display module will be placed in the glove compartment during normal usage. Occasional display use (testing, set-up, etc.) will occur with glove compartment left open for display observation.
• Two of the Surface Patrol HD sensors will require special mounting accommodations. The IR surface sensor and the humidity sensor will be packaged under the surface sheet metal locations that have the least mud, spray and water contamination. Additionally, the IR sensor must be orientated to point down to the road surface with clear line of sight visibility. The humidity sensor must be in a location to minimize impact to ambient temperature sensing (away from vehicle heat sources). These locations will be selected once the vehicles themselves have been selected. It is assumed that each vehicle will have unique mounting requirements.
• Maintenance Access by the field engineer o A routine schedule will be planned for vehicle maintenance
operations o Maintenance will include cleaning and calibrating the external
sensors o Updating, testing and monitoring the system operation o Inspecting cables, installation, and physical mounting of devices o Moving and deleting files from the Micro SD Card
Physical System Open Issues
o Surface temperature sensor requires a re-calibration plan for routine maintenance over the useful project life. Plan needs to match with vehicle users availability. Who? How?

May 31, 2012 Page 48 of 63
DataProbe Functional Requirements DataProbe Assumptions
o The Droid has sufficient capacity and speed to run this application as intended
o It is assumed that when the accelerometer sampling function is stopped (a menu choice) and other sensor snapshots are continued, sufficient capacity remains to perform other operations such as use of the phone.
o Sufficient documentation exists to enable use of the CAN OBD II and the other external sensor devices
DataProbe Requirements o The DataProbe application will automatically launch when the phone is
installed in the Motorola supplied windshield mount o DataProbe will have these specific functions:
o Simple user interface having menu selections to set up the configuration and terms of operation
o Background service running to gather, assemble and store data snapshots from three data sources into the 16 GB SD card
o File transfer protocol to send snapshots to UMTRI MS SQL server
o DataProbe Startup o Upon start up, DataProbe will initialize the devices, make the
necessary Bluetooth connections and sample one full framework of data from all available sources. A report-out of the system health will be made by displaying on the UI which devices have been successfully activated and reporting the initial snapshot data set in a list.
o The following conditions will be detected and, if an error exists, a connection will be initiated to the UMTRI server and the results of this report out sequence will be transferred Bluetooth connection cannot be made to the external sensors External sensors not reporting data Bluetooth connection cannot be made to CAN interface CAN interface not reporting data
o If a connection cannot be established with the UMTRI server at power up, the error message will be stored and re-sent on power down.
o After the initial startup, operation will continue in a normal manner even if an error exists.
o Data snapshots will accumulate in the SD Memory Card
o A running background service will continuously gather data, assemble data in a defined snapshot framework and store the results in the on-board SD memory card. Data source 1: Internal phone GPS lat/long, DTC Time/date,
vehicle ID, number of satellites seen, data mode, heading, speed (GPS calc).
Data Source 2: Defined set of CAN OBD II parameters

May 31, 2012 Page 49 of 63
Data Source 3: External road surface temperature, ambient temperature, humidity, dew point.
Data Source 4: internal 3-axis accelerometer absolute values (100 samples per sec.)
o A Data Mode activation sequence (next section) will be set based on certain environmental conditions or user commands. This sequence will specify which data will be collected in a snapshot and when.
o When in the disabled mode 3, the source 4 will not be activated. o This data collection service runs in the background continuously
until manually terminated by operator or powered down. Data Mode contents Mode Data Mode Parameter Source 1
(internal) Source 2 (CAN)
Source 3 (external)
Source 4 (accel)
1 Slippery conditions (<35 degrees); 1 snapshot per second sample rate
X X X -
2 Non-Slippery conditions with road roughness (>38 degrees) ; 1 snapshot per second sample rate; accelerometer sampled at 100 / sec.
X X - X
3 Manual selection disables road roughness
Don’t Care
Don’t Care
Don’t Care
-
If below 3 MPH, stop collecting data - - - -
o The 3-axis accelerometer will be used to monitor road roughness therefore it ideally needs to be mounted rigidly to the vehicle’s body structure. Some modification to the windshield mount may be required and will be determined with initial testing of the system
o The accelerometer will be monitoring all 3-axis (two bytes per axis) at a desirable 100 samples per second. Optimally, the samples taken should be evenly distributed at 20 ms intervals. Significant variations from this sample-to-sample rate will require each sample to be time stamped such that post processing can be used to reconstruct the original pattern. This would add another two bytes to each sample set. If the second approach is likely to be used, it must be discussed with this originator prior to the work being done to assess alternatives.
o The main snapshot generation rate is once per second for sources 1, 2, and 3. Source 4, the accelerometer data rate is 100 samples per second. Because of the wide difference, Sources 1, 2 and 3 should be placed at the beginning of the snapshot framework and the 100 samples of accelerometer data should be attached at the end.

May 31, 2012 Page 50 of 63
o The format, data sequence and size of the snapshot frame will be synchronized between the MS SQL Server and the DataProbe generator. The format should be readable by an application capable of reading comma separated variable (CSV) format. In assembling the data into the snapshot frame, if a data parameter is missing for whatever reason, a 10001 will be substituted.
o In a snapshot frame the leading data source will be Source 1 followed by source 2, source 3 and last, source 4. Each of these sections will lead with two bytes indicating first the source and second the number of bytes in the section.
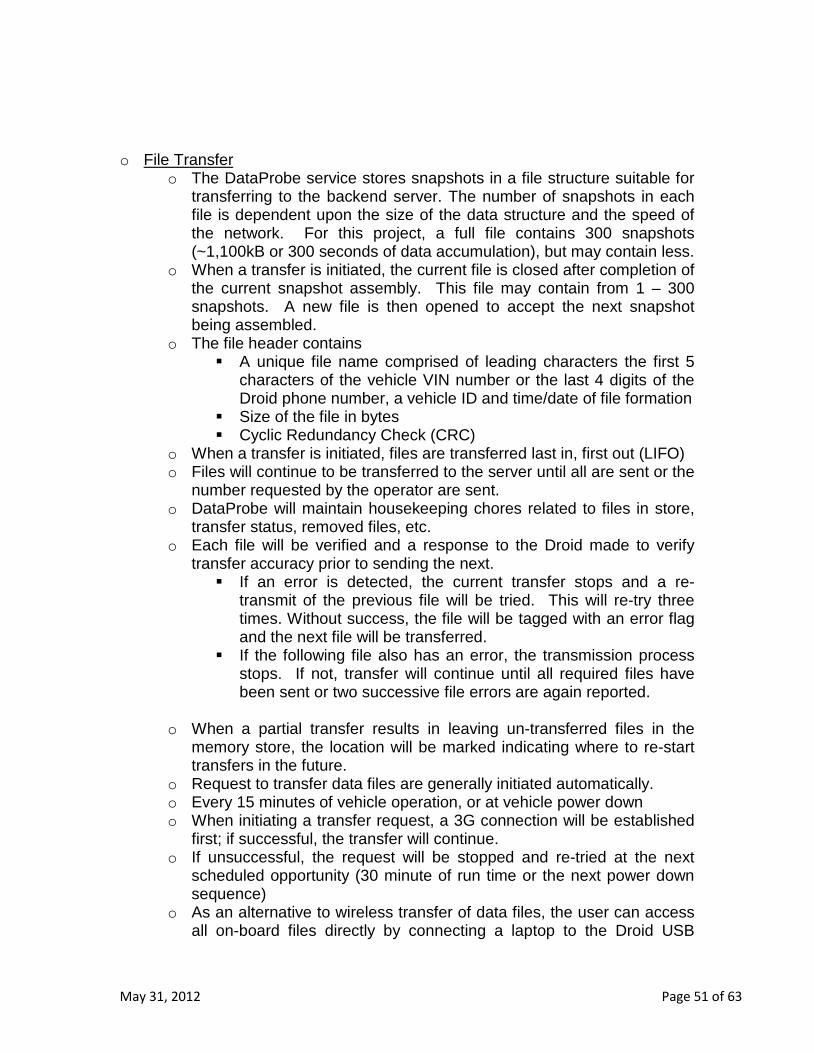
May 31, 2012 Page 51 of 63
o File Transfer o The DataProbe service stores snapshots in a file structure suitable for
transferring to the backend server. The number of snapshots in each file is dependent upon the size of the data structure and the speed of the network. For this project, a full file contains 300 snapshots (~1,100kB or 300 seconds of data accumulation), but may contain less.
o When a transfer is initiated, the current file is closed after completion of the current snapshot assembly. This file may contain from 1 – 300 snapshots. A new file is then opened to accept the next snapshot being assembled.
o The file header contains A unique file name comprised of leading characters the first 5
characters of the vehicle VIN number or the last 4 digits of the Droid phone number, a vehicle ID and time/date of file formation
Size of the file in bytes Cyclic Redundancy Check (CRC)
o When a transfer is initiated, files are transferred last in, first out (LIFO) o Files will continue to be transferred to the server until all are sent or the
number requested by the operator are sent. o DataProbe will maintain housekeeping chores related to files in store,
transfer status, removed files, etc. o Each file will be verified and a response to the Droid made to verify
transfer accuracy prior to sending the next. If an error is detected, the current transfer stops and a re-
transmit of the previous file will be tried. This will re-try three times. Without success, the file will be tagged with an error flag and the next file will be transferred.
If the following file also has an error, the transmission process stops. If not, transfer will continue until all required files have been sent or two successive file errors are again reported.
o When a partial transfer results in leaving un-transferred files in the
memory store, the location will be marked indicating where to re-start transfers in the future.
o Request to transfer data files are generally initiated automatically. o Every 15 minutes of vehicle operation, or at vehicle power down o When initiating a transfer request, a 3G connection will be established
first; if successful, the transfer will continue. o If unsuccessful, the request will be stopped and re-tried at the next
scheduled opportunity (30 minute of run time or the next power down sequence)
o As an alternative to wireless transfer of data files, the user can access all on-board files directly by connecting a laptop to the Droid USB

May 31, 2012 Page 52 of 63
port.DataProbe must interface and communicate with Microsoft SQL Server 2008 running on a Dell Workstation at the UMTRI office. The primary interface will be through a Verizon 3G IP data network.
o The Server protocol to handle and store incoming files must be identified and compatible with the MS SQL Server
o DataProbe Power Down Sequence
o When the vehicle is powered down (ignition turned off), DataProbe will immediately close and store the current snapshot file. Any further data collection will stop and the Bluetooth transceiver (sensor interfaces) and the GPS receiver will be terminated.
o An attempt to make a cellular connection to the UMTRI server will be made and if successful, the un-sent snapshots files will be transferred. If a connection is unsuccessful or any other error prevents
transmission, no further attempts will be tried until the next power up sequence.
o After transmission of snapshot files, or an attempt to transfer files has been completed, DataProbe will terminate further activity and the Droid will go into standby mode to minimize internal battery drain.
o Data files, initiated by the vehicle, will be transferred from the vehicle to the
backend server under several conditions: o The Droid is mounted in the magnetic windshield mount o DataProbe has been activated o The vehicle has files to be transferred o Every thirty minutes of vehicle run-time (+/- 5 minutes) o Power up error report o Power up transfer after previous power down transfer was un-
successful o Typical System Operation by the User
o The user(s) will be assigned the use of the vehicle containing the Droid DataProbe for a undetermined length of time.
o When the vehicle is not operating, the user can use the Droid for non-testing purposes as needed; e.g., “emergency services”, phone calls, navigation aids, etc.
o When the Droid is mounted in the windshield mount the DataProbe application will continue to collect data when the application is open, even when running in the background. Other programs opened by the user may or may not work depending on the required resources needed by the applications. The operation of DataProbe should be set with high priority such that real-time operation is assured over other applications.
o When operating the vehicle, the Droid must be inserted in the windshield mount holder and connected with its power cable. Once installed in the windshield mount, and power is applied to the USB

May 31, 2012 Page 53 of 63
connector (ignition key on) the DataProbe application will automatically start and run. This is enabled with special magnets embedded in the Verizon provided mount and sensed by the Droid.
o The operation of DataProbe should be transparent to the user and not require driver interaction, however if needed, DataProbe may be manually started by the user by selecting the application from the main application window.
o The configuration and setup functions available through the User Interface menus will be used by the field test engineer in person or by the driver under specific directions by the UMTRI operations office.
o The phone service will remain available for cases where communications between the UMTRI office and the remote vehicle must be made. This may occur if questionable test conditions are reported or if certain weather conditions require a photo to be taken.
o As an assist to the test operations office, the user should be capable, upon request, of using the Droid to take and transmit a photo back to the requester. This should be independent of the DataProbe application and would only be done when the vehicle is standing still.
o User Interface o The user interface is comprised of four screens as shown in the
following graphic o The Main window is shown in normal operation when the Droid is
mounted in the magnet based windshield mount o The list of data parameters to be shown is user selected
Select main Menu button Select first choice - “select parameters” New screen pops up of available choices Check all parameters of interest, scrolling down as needed Use return button to return to main window
o Alternately, accelerometer data indicating road roughness can be monitored Select main Menu button Check ”Show Accelerometer” box Use return button to exit Menu and show new window with
accelerometer strip chart Default strip chart speed is 10 seconds to sweep full path Raw, absolute data values are shown
o Accelerometer data collection may be forced off to reserve CPU capacity; faster Droid operation for other user defined purposes Select main Menu button Check ” Accelerometer probe data off” box Obviously, if this box is checked, the “show accelerometer box”
is disabled Use return button to return to main window

May 31, 2012 Page 54 of 63
o Normally, data snapshots are not taken when the vehicle speed is less than 3 mph. However, DataProbe data may be collected even when the vehicle is stopped by selecting : “DataProbe forced on” check box in the main Menu Select main Menu button Check “DataProbe force on” box Select return button to return to main window
o The DataProbe will automatically switch between monitoring slippery road conditions and rough road monitoring by monitoring the ambient temperature. This temperature switch point can be changed by the user. Note, this value has a 5 degree hysteresis centered around the shown value. Select the main Menu button Enter the desired switch point in the Amb Temp box Use return button to return to main window
o DataProbe may be forced to terminate by the user when in the handheld mode (not mounted) Select the main Menu button Select the “close app” choice Confirm yes when asked to confirm

May 31, 2012 Page 55 of 63
DataProbe open issues The phone features a 600mhz ARM A8 Cortex processor along with 256Mb of RAM. Even though the Droid features a 600Mhz processor, Motorola has under-clocked the processor to run at 500Mhz to maximize battery life. Some hobbyists have overclocked the Droid to as much as 1.1Ghz with commensurate compromises of CPU life expectancy, overheating and battery power. It is expected that the Droid right out of the box will have sufficient capability to provide the full function needs of the DataProbe application. If performance becomes marginal or runs slower than real-time, several steps may be taken. First, the option to run other applications concurrently will be removed. Second, over-clocking will be considered for these test applications. Third, for a longer term solution, another handheld device will be selected and used.

May 31, 2012 Page 56 of 63
4. Users Guide for the Droid Phone and DataProbe Application
Purpose
This project supports vehicle data collection useful in quantitatively assessing road surface conditions across a large area with many vehicles and in all kinds of weather. Specifically, road roughness and slippery road conditions can be assessed for potential corrective actions by the appropriate local or state maintenance crews.
The use of this Droid Smartphone with the DataProbe application mounted in a vehicle will gather a snapshot of data every second into a data file and transfer that file to a server at UMTRI every 5 minutes of vehicle operation. In total almost 100,000 data samples will be collected and transferred in a file that is 1.2 million bytes in size. The data collected contains data from vehicle sensors, GPS receivers and other embedded sensors in the phone.
This data will be compared with other vehicles, looking for changes in road conditions caused by weather, deteriorating surface defects, or unusual traffic conditions.
User Overview
To use the Droid DataProbe application, the user will assure the Droid is mounted in the correct position and the power cable is attached, prior to starting and driving away. The correct operation of the Droid can be easily seen on the display and will soon become familiar to the driver.
If the vehicle is equipped with a Power Point (cigarette lighter) that is powered only when the ignition key is on, operation is automatic and little more needs to be done. If the Power Point is powered at all times, then the driver must unplug the Droid after shutting off the ignition switch and re-plug it in before every start-up. In general, this is inconvenient and easily forgotten. A simple wiring change at the vehicle’s fuse panel can change the PowerPoint power source over to a fuse that is powered with the ignition key.
Proper Mounting Position
Several acceptable positions may be found to be both accurate for data collection and convenient for the driver. The best location is placing the Droid in a windshield mount similar to navigation devices. The Droid mounting bracket contains a magnet that activates a sensor in the Droid when it is mounted. This is what allows the Droid to automatically start the DataProbe application when power is applied. Of course, the

May 31, 2012 Page 57 of 63
position of the mount on the windshield needs to be in a location where the power cable can reach the PowerPoint socket. One more consideration for correct mounting is assuring the Droid is oriented so that it is aligned with the axis of the vehicle. The face of the Droid should be vertical within a few degrees and aligned with an imaginary line passing through the face with the center line of the vehicle. A few degrees of error can be electronically corrected but major misalignments will generate unreliable data. Consult with your provider of the equipment if you have any questions about the acceptability of the mounting position.
Normal Operation
Assume the Droid has been mounted and connected properly. When a driver enters and starts the vehicle, the Droid wakes up and briefly shows a Car Home application on the display, then quickly starts DataProbe and starts gathering data. The user does not have to take any actions. When the vehicle is turned off, the DataProbe application will keep the Droid power active for a few minutes so that the most recent data files can be transferred. Then the application closes and the Droid goes to sleep. This shutdown sequence can take 1 to 4 minutes depending on the cellular signal strength in that location.
Some vehicles have delayed power to keep the multimedia system powered for a few minutes after the ignition is turned off. This is usually interrupted when the doors are opened and then the power is terminated. The Droid may also be delayed shutting off along with the other vehicle devices if the vehicle is equipped with this feature.
On a hot day, when the vehicle is parked in the sun, the front instrument panel can approach 170 - 180 degrees. When the vehicle is started and the Droid is powered, it immediately heats further and then reboots. It will continually start, then reboot until the device is cooled to reasonable temperature. Therefore it is recommended to disconnect the device until the A/C system can drop the interior temperatures.
When the Unexpected Happens
If the startup sequence gets out of order or does not result in DataProbe operating correctly, the problem can generally be fixed by disconnecting the device, waiting a minute, then reconnecting. Also, rebooting the Droid by powering down and restarting the Droid may help. This clears the memory of other applications that may be running in the background, however most applications do not seem to interfere with DataProbe. It depends on which resources are being used.
If all else fails, call Ralph Robinson, UMTRI, (734) 764-2181.
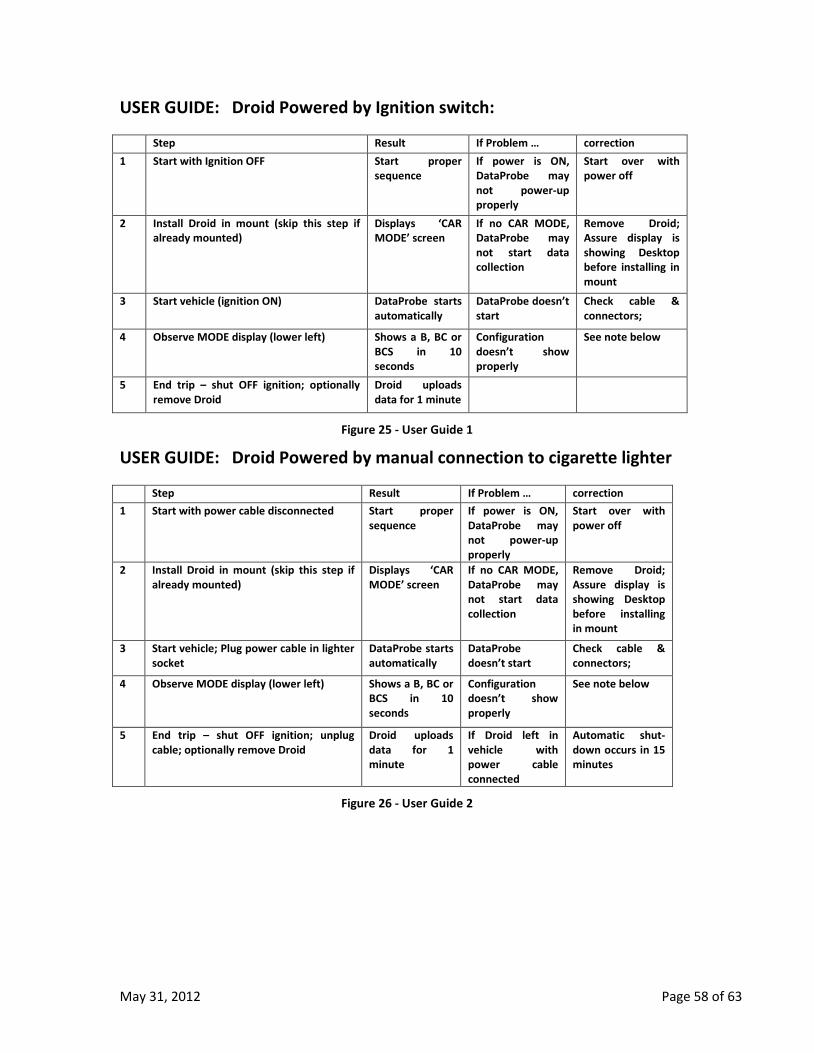
May 31, 2012 Page 58 of 63
USER GUIDE: Droid Powered by Ignition switch:
Step Result If Problem … correction 1 Start with Ignition OFF Start proper
sequence If power is ON, DataProbe may not power-up properly
Start over with power off
2 Install Droid in mount (skip this step if already mounted)
Displays ‘CAR MODE’ screen
If no CAR MODE, DataProbe may not start data collection
Remove Droid; Assure display is showing Desktop before installing in mount
3 Start vehicle (ignition ON) DataProbe starts automatically
DataProbe doesn’t start
Check cable & connectors;
4 Observe MODE display (lower left) Shows a B, BC or BCS in 10 seconds
Configuration doesn’t show properly
See note below
5 End trip – shut OFF ignition; optionally remove Droid
Droid uploads data for 1 minute
Figure 25 - User Guide 1
USER GUIDE: Droid Powered by manual connection to cigarette lighter
Step Result If Problem … correction 1 Start with power cable disconnected Start proper
sequence If power is ON, DataProbe may not power-up properly
Start over with power off
2 Install Droid in mount (skip this step if already mounted)
Displays ‘CAR MODE’ screen
If no CAR MODE, DataProbe may not start data collection
Remove Droid; Assure display is showing Desktop before installing in mount
3 Start vehicle; Plug power cable in lighter socket
DataProbe starts automatically
DataProbe doesn’t start
Check cable & connectors;
4 Observe MODE display (lower left) Shows a B, BC or BCS in 10 seconds
Configuration doesn’t show properly
See note below
5 End trip – shut OFF ignition; unplug cable; optionally remove Droid
Droid uploads data for 1 minute
If Droid left in vehicle with power cable connected
Automatic shut- down occurs in 15 minutes
Figure 26 - User Guide 2

May 31, 2012 Page 59 of 63
5. DataProbe Installation Guide
Droid Initial Setup
1. Installation and preparation a. POWER: If the vehicle has a power point (cigarette lighter socket) that is
activated with the ignition key, the powering of the DataProbe system is direct and convenient. Otherwise, the power needs to be manually applied by the driver plugging in the power cable to the cigar lighter each time the vehicle is turned on and off or the Droid must be removed from its dock each time, which also removes power. If a Droid is left activated when not being used, it can deplete the battery charge, generate un-useable data files, and waste cellular bandwidth to transmit. Some vehicle manufacturers, such as Chrysler, have changed the old cigar lighters to ignition activated power connecters for use by a variety of new personal devices. However, those vehicles that are still wired the old way can easily be modified by adding a power wire to an appropriate fuse takeout at the fuse panel. For a long term solution this should be considered. A temporary vehicle installation is still useable with manual connections.
b. MOUNT: Currently, the recommended mounting uses a provided windshield mount that attaches to the windshield with a suction cup. The bracket is adjusted so that the bottom edge is touching the instrument panel’s surface to maximize the transfer of vibrations to the Droid. Also, the orientation of the Droid is facing the rear of the vehicle. The display face is as close to vertical as possible and
parallel to the vehicle’s lateral axis.
Droid Normal Operation
When the Droid is mounted in the windshield mount, a magnet in the mount activates a magnetic sensitive switch in the Droid which in turn loads the CAR MODE application as shown below. Further, when power is applied to the Droid, and the CAR MODE application is active, DataProbe is automatically started as well. No further action is required of the driver in normal operation. When the trip is ended, the driver shuts off the vehicle’s ignition and disconnects the Droid power cable to end data collection.
Figure 27 - Droid in place on instrument panel
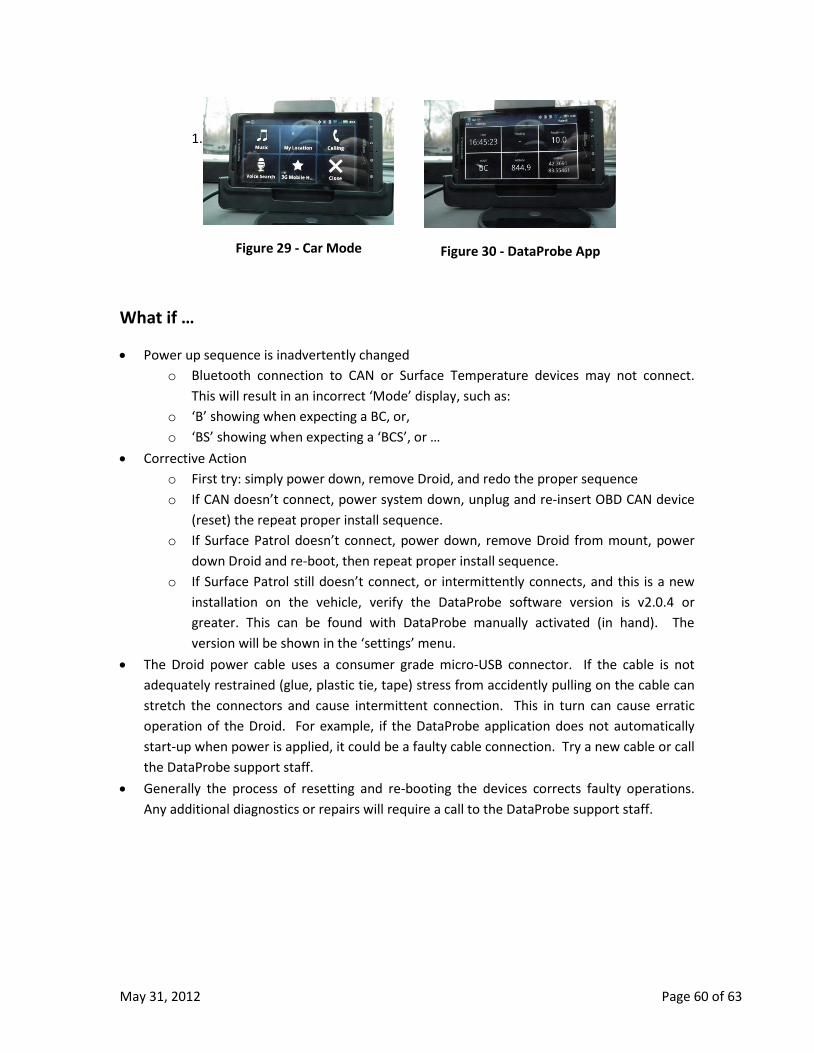
May 31, 2012 Page 60 of 63
1.
What if …
• Power up sequence is inadvertently changed o Bluetooth connection to CAN or Surface Temperature devices may not connect.
This will result in an incorrect ‘Mode’ display, such as: o ‘B’ showing when expecting a BC, or, o ‘BS’ showing when expecting a ‘BCS’, or …
• Corrective Action o First try: simply power down, remove Droid, and redo the proper sequence o If CAN doesn’t connect, power system down, unplug and re-insert OBD CAN device
(reset) the repeat proper install sequence. o If Surface Patrol doesn’t connect, power down, remove Droid from mount, power
down Droid and re-boot, then repeat proper install sequence. o If Surface Patrol still doesn’t connect, or intermittently connects, and this is a new
installation on the vehicle, verify the DataProbe software version is v2.0.4 or greater. This can be found with DataProbe manually activated (in hand). The version will be shown in the ‘settings’ menu.
• The Droid power cable uses a consumer grade micro-USB connector. If the cable is not adequately restrained (glue, plastic tie, tape) stress from accidently pulling on the cable can stretch the connectors and cause intermittent connection. This in turn can cause erratic operation of the Droid. For example, if the DataProbe application does not automatically start-up when power is applied, it could be a faulty cable connection. Try a new cable or call the DataProbe support staff.
• Generally the process of resetting and re-booting the devices corrects faulty operations. Any additional diagnostics or repairs will require a call to the DataProbe support staff.
Figure 29 - Car Mode Figure 30 - DataProbe App

May 31, 2012 Page 61 of 63
6. Surface Patrol Data Sheet

May 31, 2012 Page 62 of 63