slm utility-g3 software utility-g3 manual getting started 2-1 chapter 2 getting started this chapter...
TRANSCRIPT

SLM Utility-G3 Software Manual


ISLM Utility-G3.01 Rev J Supporting Firmware v. 2.3
Software Manual
Larson Davis SLM Utility-G3

Copyright
Copyright 2014 PCB Piezotronics, Inc. This manual is copyrighted, with all rights reserved. Themanual may not be copied in whole or in part for any use without prior written consent of PCBPiezotronics, Inc.
Disclaimer
The following paragraph does not apply in any state or country where such statements are notagreeable with local law:
Even though PCB Piezotronics, Inc. has reviewed its documentation, PCB Piezotronics, Inc. makes nowarranty or representation, either expressed or implied, with respect to this instrument anddocumentation, its quality, performance, merchantability, or fitness for a particular purpose. Thisdocumentation is subject to change without notice, and should not be construed as a commitment orrepresentation by PCB Piezotronics, Inc.
This publication may contain inaccuracies or typographical errors. PCB Piezotronics, Inc. willperiodically update the material for inclusion in new editions. Changes and improvements to theinformation described in this manual may be made at any time.
Recycling
PCB Piezotronics, Inc. is an environmentally friendly organization and encourages our customers tobe environmentally conscious. When this product reaches its end of life, please recycle the productthrough a local recycling center or return the product to:
PCB Piezotronics, Inc.Attn: Recycling Coordinator1681 West 820 NorthProvo, Utah, USA 84601-1341
where it will be accepted for disposal.
Warranty
For warranty information, see the Larson Davis Terms and Conditions of Sale on our website atwww.larsondavis.com/productwarranty.aspx.

Table of Contents
Chapter 1 Introduction 1-1
Overview ............................................................................................................... 1-1
System Requirements ............................................................................................ 1-1
Chapter 2 Getting Started 2-1
Installing the SLM Utility-G3 Software ............................................................... 2-1
Configuring the USB Port (Windows XP) ............................................................ 2-1
SLM Utility-G3 Main Window ............................................................................. 2-3
Menu Bar .......................................................................................................... 2-4
SLM Utility-G3 Toolbar .................................................................................. 2-5
SLM Utility-G3 Session Log ........................................................................... 2-6
Connecting to an Instrument ............................................................................ 2-7
Chapter 3 Instrument Manager 3-1
Overview ............................................................................................................... 3-1
Opening the Instrument Manager ......................................................................... 3-2
Instrument Status Tab ........................................................................................... 3-2
Setting the Date and Time ................................................................................ 3-3
Settings Tab ........................................................................................................... 3-5
Displaying the Instrument’s Setup ................................................................... 3-6
Displaying the Settings ..................................................................................... 3-6
Creating a New Setup ..................................................................................... 3-21
Uploading a Setup to the Instrument .............................................................. 3-33
Saving a Setup ................................................................................................ 3-33
Recalling a Setup ............................................................................................ 3-34
Deleting a Setup ............................................................................................. 3-34
Setup Manager ................................................................................................ 3-35
Manual Control Tab ............................................................................................ 3-38
Begin a Measurement ..................................................................................... 3-39
Stop a Measurement ....................................................................................... 3-40
Reset Current Measurement ........................................................................... 3-40
Locking the Instrument Keypad ..................................................................... 3-41
Store an Instrument File ................................................................................. 3-43
Browse Instrument Files ................................................................................. 3-44
Upgrade the Instrument .................................................................................. 3-47
Restore Instrument ......................................................................................... 3-50
ISLM Utility-G3.01 Rev J Supporting Firmware v. 2.3
ScreenGrabber ................................................................................................3-51
Start Live Stream ............................................................................................3-55
Switching Instrument Modes ..........................................................................3-58
Download Tab .....................................................................................................3-59
Selecting Files to Download ...........................................................................3-60
Add General Record Information ...................................................................3-60
Saving .ldbin Files ..........................................................................................3-61
Download Files ...............................................................................................3-61
Calibrate Tab .......................................................................................................3-64
Frequency Weighting/Detector .......................................................................3-65
Microphone/Preamplifier ................................................................................3-65
Calibration Data ..............................................................................................3-66
Calibration History .........................................................................................3-71
Export Calibration History ..............................................................................3-73
Print Calibration History .................................................................................3-73
Certification ....................................................................................................3-73
System Tab ..........................................................................................................3-76
Displaying the Instrument's Preferences .........................................................3-77
Displaying the Preferences .............................................................................3-77
Preferences ......................................................................................................3-77
Power/Lock .....................................................................................................3-82
System .............................................................................................................3-84
Displays ..........................................................................................................3-89
Reference Spectra ...........................................................................................3-92
Other (Model 831 only) ..................................................................................3-94
Communications (Model 831 only) ................................................................3-95
Saving Preferences ..........................................................................................3-99
Recalling Preferences ...................................................................................3-100
Deleting Preferences .....................................................................................3-100
Upload Preferences .......................................................................................3-101
Chapter 4 Data View 4-1
Data View Menu Bar .............................................................................................4-1
SLM Summary ......................................................................................................4-2
General Information ..........................................................................................4-3
Note ...................................................................................................................4-5
Overall Data ......................................................................................................4-5
Statistics ............................................................................................................4-6
Dose ..................................................................................................................4-6

Settings ............................................................................................................. 4-7
1/1 Spectra & 1/3 Spectra ................................................................................. 4-8
Weather ............................................................................................................ 4-9
Calibration History ......................................................................................... 4-10
Optional Summary Pages .................................................................................... 4-10
Time History Summary .................................................................................. 4-11
Event History Summary ................................................................................. 4-12
Measurement History Summary ..................................................................... 4-13
Printing a Summary ............................................................................................ 4-14
Saving a File ........................................................................................................ 4-14
Opening a Saved File .......................................................................................... 4-15
Importing Data From USB Memory ................................................................... 4-16
Closing the Data View ........................................................................................ 4-19
Measurement Log ............................................................................................... 4-20
Voice Annotation and Audio Recording ........................................................ 4-21
Chapter 5 Export Data 5-1
Exporting Measurement Files ............................................................................... 5-1
Select Export Format ........................................................................................ 5-3
Export the File .................................................................................................. 5-4
Automatically Launch Viewer Application ..................................................... 5-4
Chapter 6 Remote Connection 6-1
Initiating a Remote Connection ............................................................................ 6-1
Wireless Connection ............................................................................................. 6-2
Implementing the Connection .......................................................................... 6-3
Analog Modem Connection .................................................................................. 6-8
Internet Connection ............................................................................................... 6-9
Chapter 7 RT-60 1
Accessing RT-60 Mode ........................................................................................ 6-1
Settings Page ......................................................................................................... 6-2
Instrument Settings ........................................................................................... 6-3
Setup Manager .................................................................................................. 6-7
Data View ............................................................................................................. 6-8
Exporting Data .................................................................................................... 6-14
Chapter 8 FFT 1
Accessing FFT Mode ............................................................................................ 6-1
Settings Page ......................................................................................................... 6-1
ISLM Utility-G3.01 Rev J Supporting Firmware v. 2.3

Instrument Settings ...........................................................................................6-2
Data View ..............................................................................................................6-7
FFT Graph .........................................................................................................6-9
Tonality Data View .........................................................................................6-10
Exporting Data .....................................................................................................6-15

C H A P T E R
1 IntroductionThis chapter presents an overview and the system requirements for the SLM Utility-G3 software.
Overview
Larson Davis SLM Utility-G3 Software works inconjunction with both the Larson Davis Model 831 and theSoundTrack LxT. However, some of the functionalitydescribed in this manual is not supported in SoundTrackLxT.
This manual can be used with theModel 831 Manual (I831.01) and theSoundTrack LxT Manual (I770.01),which provide completespecifications and instructions forthe operation of these instruments.
The SLM Utility-G3 Software enhances the flexibility andease-of-use of the Model 831 and SoundTrack LxT byproviding setup utilities, instrument calibration, computer-based control of the instrument, data downloading, printing,and export of data to third party software for post processingand analysis.
System Requirements
Minimum RecommendedOperating System Windows XP Pro with
(SP3), Windows Vista Business, Windows 7
Windows 7 Pro
Computer Processor 1 GHz 2 GHzComputer Memory 2 GB 4 GBAvailable Hard Disk Space 100 MB 100 MBScreen Resolution 1024 X 768 1280 X 1024CD Drive Yes YesUSB Connection Yes YesMicrosoft Office Office 20031 Office 20102
Broadband Internet Required for Remote Internet and Wireless connections.Analog Modem Required for Remote Modem connections.1 Required for export to Excel2Required for export to Excel with full FFT support.
SLM Utility-G3 Manual Introduction 1-1

1-2 System Requirements SLM Utility-G3 Manual

C H A P T E R
2 Getting StartedThis chapter presents the information for installing, con-figuring, and using the SLM Utility-G3 software.
Installing the SLM Utility-G3 Software
Install SLM Utility-G3 prior toconnecting a sound level meter.
When you insert the SLM Utility-G3 CD, it will startautomatically. If it does not, access the CD drive and clicksetup.exe.
The install program installs the program files and promptsfor any additional required information. A PCBPiezotronics menu item will be created under the Programmenu item in the Start menu.
Configuring the USB Port (Windows XP)
The New Hardware Wizard, as shown in FIGURE 2-1,appears when an instrument is connected to a USB port.
FIGURE 2-1 Found New Hardware Dialog Box
SLM Utility-G3 Manual Getting Started 2-1

When the dialog box appears, click “No, not this time” andthen click Next to obtain the display shown in FIGURE 2-2.
FIGURE 2-2 Automatic Installation
Click the radio button for “Install the Software automaticallyand click Next to continue.
Upgrading Software to Version 2.0
Prior to version 2.0 of the SLM Utility-G3 software, thesaved settings files, calibration history log files, and certaininternal data files were created and saved in C:\ProgramFiles\PCB Piezotronics\Slm Utility-G3. However, with therelease of Windows Vista and Windows 7, this folder is nowa restricted folder that requires administrator privileges forwrite access. Beginning with version 2.0, these files are nowcreated and saved in one of the following locations, based onyour OS.
In these example paths, the foldermarked with an * is a hidden folderby default. To see this folder, enablethe ‘Show hidden files and folders’option on the View tab of the FolderOptions dialog in Windows.
Windows XP: C:\Documents and Settings\All Users\ApplicationData*\PCB Piezotronics\Slm Utility-G3.
Windows Vista: C:\Users\AllUsers*\PCB Piezotronics\SlmUtility-G3.
Windows 7: C:\ProgramData*\PCB Piezotronics\Slm Utility-G3.
2-2 Configuring the USB Port (Windows XP) SLM Utility-G3 Manual

If the user attempts to connect withthe instrument before it hascompleted its boot sequence, theconnection will fail and theinstrument may lock up.
When Slm Utility-G3 v2.0 or later makes a connection to ameter for the first time, a scan of the application folder isperformed looking for any legacy settings files (i.e.831setup.dat, SLMPreference.dat) and any existingcalibration history log file entries for the meter beingconnected. Any legacy data found is then merged into thenew files created in the folder described above.
SLM Utility-G3 Main Window
Only a single instance of SLMUtility-G3 can be run at a time.
When the SLM Utility-G3 Software is fully loaded, theSLM Utility-G3 Main window is displayed as shown in FIGURE 2-3.
FIGURE 2-3 SLM Utility-G3 Main Menu
Menu Bar
ToolbarSLM Utility-G3
SLM Utility-G3 Manual SLM Utility-G3 Main Window 2-3

Menu Bar
The Menu Bar, a standard Windows feature, contains thefollowing four drop-down menus, which are opened byclicking the title.
•File
In addition to standard Windows features, the File Menualso includes an item permitting the user to upgrade aninstrument without opening the Instrument Manager, asshown in FIGURE 2-4.
FIGURE 2-4 File Menu
•Connection
•View
•Help
Although most of the SLM Utility-G3 operations can beperformed using icons in the SLM Utility-G3 Toolbar, allfunctions can be performed by selecting one of the optionslisted on one of these menus as described in this manual.
Help/About
Click the Help Menu to obtain a single item, “About SLMUtility-G3. Click that to display the About window, whichprovides a list of the software components loaded and theirversion numbers.
UpgradeInstrument
2-4 SLM Utility-G3 Main Window SLM Utility-G3 Manual

SLM Utility-G3 Toolbar
Just below the menu bar is the toolbar as shown in FIGURE2-5.
FIGURE 2-5 Toolbar
The tool bar provides quick access to commonly usedsoftware functions. A description of the function of eachtoolbar button, or icon, is presented in Table 2-1 below.
The Connect button will make the connection to theinstrument connected to the computer.
The Disconnect button will terminate the connectionbetween SLM Utility-G3 and the instrumentconnected to the computer.
The Open File button will bring up a standardwindows browse window that will allow the user toopen an existing database record.
The Save File button will bring up a standardwindows save file dialog box, that will allow theuser to save the current SLM Utility-G3 file. Thedialog window will also allow the user to select afile name and location.
The Instrument Manager button will bring up theInstrument manager screen. The user can then setupthe instrument, set the clock, download data files,etc.
The Measurement Log button will display themeasurement log.
The Print button will print the currently displayedrecord.
Table 2-1 SLM Utility-G3 Toolbar Buttons
SLM Utility-G3 Manual SLM Utility-G3 Main Window 2-5

SLM Utility-G3 Session Log
On the left side of the screen you will find the SLM Utility-G3 Session Log.
FIGURE 2-6 SLM Utility-G3 Session Log
This useful area provides information with respect to thestatus of an active (connected) instrument, providing thefollowing information:
• If the PC is currently connected to an instrument
• Whether the connected instrument is running, stopped,reset, locked or unlocked
• The serial number of the instrument
• If data has been downloaded from the instrument
• If the unit has been calibrated
The SLM Utility-G3 Session Log will be automaticallyupdated when any of these operations has occurred.
Close/Open Session Log, Measurement Log and Instrument Manager
The Open/Closed status of the Session Log, MeasurementLog and Instrument Manager can be changed by clickingView from the Main Menu, which will open the menushown in FIGURE 2-7.
The Export Data button will export the currentlydisplayed record as an Excel spreadsheet, a Comma-Delimited File that can be opened in a spreadsheetapplication or as a text file. It will also allow theuser to select the output location and file name, andwhether or not to automatically launch the viewerapplication.
The About button will bring up the SLM Utility-G3About screen with the current revision number.
Table 2-1 SLM Utility-G3 Toolbar Buttons
2-6 SLM Utility-G3 Main Window SLM Utility-G3 Manual

FIGURE 2-7 View Menu
A check in front of an item indicates that it is already beingdisplayed; clicking it will close it. Clicking an uncheckeditem will open it and place a check in front of that item.
Connecting to an Instrument
Making the Connection
To connect to an instrument, click the Connect icon on thetoolbar as shown in FIGURE 2-8, or select
FIGURE 2-8 Toolbar: Connect
Connection->Direct->USB from the Main Menu as shownin FIGURE 2-9.
FIGURE 2-9 Connection/Direct
Single Instrument Connected to Computer
If only a single instrument is connected to the computer viaUSB, the connection to that instrument is initiatedautomatically.
SLM Utility-G3 Manual SLM Utility-G3 Main Window 2-7

Multiple Instruments Connected to Computer
When more than one instrument is physically connected tothe computer via USB, the dialog shown in FIGURE 2-10will be displayed.
FIGURE 2-10 Physically Connected Instruments
Click the down arrow next to the data field to list theconnected instruments by model and serial number as shownin FIGURE 2-11.
FIGURE 2-11 List of Physically Connected Instruments
In this instance, there are two instruments connected, aModel 831 and a SoundTrack LxT.
In this manual the displays willcorrespond to those obtained whenthe connected instrument is a Model831 unless specifically noted.
Select the desired instrument to connect to and click theConnect button to initiate the connection.
2-8 SLM Utility-G3 Main Window SLM Utility-G3 Manual

Multiple Instruments, Changing Instruments
You must close the InstrumentManager before you can click on anytoolbar button or menu.
When connected to one of multiple instruments connected tothe computer via USB, to change the connection to adifferent instrument, click Connection/ChangeInstrument, which will open the “Connect to SelectedInstrument” menu shown in FIGURE 2-10. Use this menuand proceed as described to select the new instrument withwhich to make the connection.
Interface Active Message
If the instrument is in the Measurement Setup, Preferencesor Calibration modes at the time the connection operation isinitiated, the message shown in FIGURE 2-12 will bedisplayed.
FIGURE 2-12 Interface Active Message
Click Yes to continue the connection or press No to abort theconnection operation and manually save the setup in theinstrument. Clicking Yes may cause the loss of settingchanges when the user closes the instrument’s user interface.
Disconnecting the Instrument
To disconnect the instrument from the software, click theDisconnect icon from the toolbar as shown in FIGURE 2-13.
FIGURE 2-13 Toolbar: Disconnect
SLM Utility-G3 Manual SLM Utility-G3 Main Window 2-9

Reconnecting the Instrument
After disconnecting from the instrument, clicking theconnect icon, as shown in FIGURE 2-8, will reconnect thesoftware to the same instrument to which it had beenconnected prior to disconnecting.
If there are multiple instruments connected to the computervia USB ports and you wish to connect to a differentinstrument than the one to which it had been connected priorto the disconnect, select Connection->Direct->USB from theMain Menu as shown in FIGURE 2-9. Continue to selectthe desired instrument as described in the "MultipleInstruments Connected to Computer" on page 2-8.
2-10 SLM Utility-G3 Main Window SLM Utility-G3 Manual

C H A P T E R
3 Instrument ManagerThis chapter presents information for the features and options of the Instrument Manager.
Overview
Most of the operations of the SLM Utility-G3 Software arecontrolled from the Instrument Manager. Specific featuresimplemented from the Instrument Manager include thefollowing:
This chapter describes theInstrument Manager for SLM mode.Please refer to Chapter 7 for RT-60mode specific changes and toChapter 8 for FFT mode specificchanges.
• Determination of instrument status; serial number,firmware version, battery status, data records inmemory and date/time.
• Management of instrument setups, including creation,modification and deletion of setups and utilization of theSetup Manager to work with the setup database.
• Manual control of the instrument via the PC.
Setup tabs displayed on theSoundTrack LxT may in some casesappear differently than those on theModel 831 and may also present asmaller set of parameters. In thismanual, setup tabs may be presentedseparately by instrument, or wheresimilar, represented simply by theModel 831 tabs.
• Downloading of data from the instrument to the PC
• System calibration
• Defining user preferences
SLM Utility-G3 Manual Instrument Manager 3-1

Opening the Instrument Manager
To view the instrument managerwindow an instrument must beconnected, as described in thesection "Connecting to anInstrument" on page 2-7. If youinadvertently close the InstrumentManager window, you can re-open itby clicking the Instrument Managericon on the toolbar.
The Instrument Manager is automatically displayed whenSlm Utility-G3 has successfully connected to an instrument.It is comprised of six tabs. When the Instrument Manager isfirst opened, the Instrument Status tab will be displayed asshown in FIGURE 3-2.
The Session Log will indicate the date and time theconnection was established, as shown in FIGURE 3-1.
FIGURE 3-1 Session Log: Connected
FIGURE 3-2 Instrument Manager: Instrument Status
Instrument Status Tab
To display the Instrument Status tab, click on theInstrument Status tab of the Instrument Manager. TheInstrument Status tab, as shown in FIGURE 3-2, displays
3-2 Opening the Instrument Manager SLM Utility-G3 Manual

the Model, Serial Number, Firmware Version, Power usage,amount of Free Memory, number of Records (data files),Instrument Time, and Computer Time. The Power, FreeMemory, and Records fields may be refreshed at any time byclicking the Refresh button. The Instrument Time andComputer Time are updated automatically every second.
Setting the Date and Time
To set the date and time on the instrument, clickthe Set Timebutton, as shown in FIGURE 3-2. This will display theInstrument Date and Time dialog box, as shown in FIGURE 3-3.
The System Preferences option setsthe synchronization of date and timewith the PC. See "Synchronize date/time with PC" on page 3-78.
FIGURE 3-3 Instrument Date and Time: Manual
There are two formats available fordate. See "Date Format" on page 3-78 for further detail.
Manually Setting the Date and Time
When “Sync. date/time” with PC is not selected, the dateand time in the instrument can be set manually. Clicking thedown arrow to the right of the Instrument Date field willopen the Instrument date calender shown in FIGURE 3-4.
FIGURE 3-4 Date Calender
SLM Utility-G3 Manual Instrument Status Tab 3-3
Click the left or right arrow keys at the top to bring up thedesired month and year, then click the desired day tocomplete input of the date.
In the Instrument Time field, the hours, minutes and secondsare selected separately, highlighting each and using the upand down arrow keys to the right of the data field to selectthe desired values. Clicking the Set button will set the Dateand Time on the instrument to the selected values.
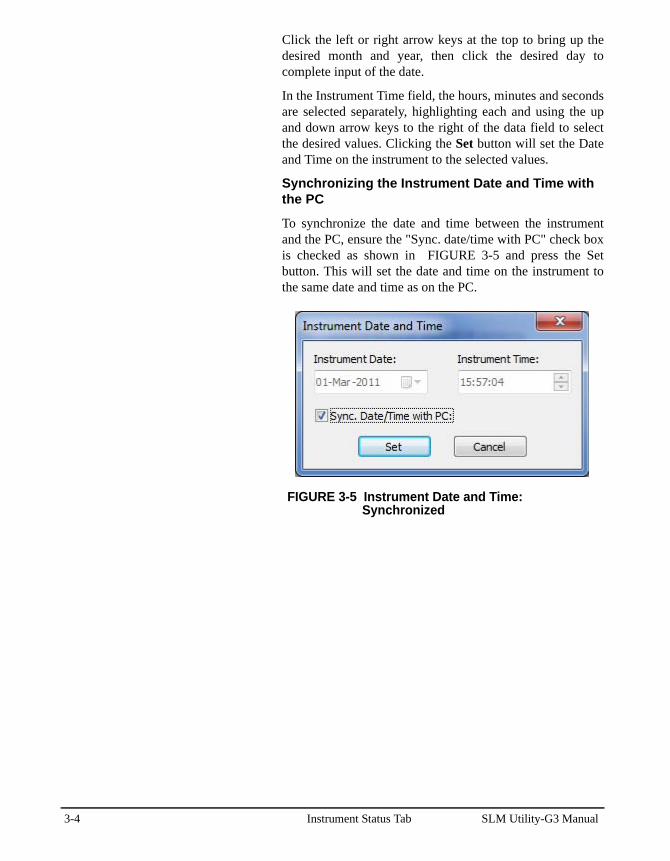
Synchronizing the Instrument Date and Time with the PC
To synchronize the date and time between the instrumentand the PC, ensure the "Sync. date/time with PC" check boxis checked as shown in FIGURE 3-5 and press the Setbutton. This will set the date and time on the instrument tothe same date and time as on the PC.
FIGURE 3-5 Instrument Date and Time: Synchronized
3-4 Instrument Status Tab SLM Utility-G3 Manual

Settings Tab
For a detailed description of thesettings defined on the variousSettings sub-pages, refer to theapplicable sound level metermanual.
To display the Settings tab, click on the Settings tab of theInstrument Manager.
The Settings tab is comprised of nine sub-tabs as shown in FIGURE 3-6. Each sub-tab can be accessed by clicking onthe appropriate sub-tab on the Settings tab. Sub-tabs that arecurrently out of view can be scrolled to by using the left/right arrow buttons at the far right. The Settings tab alsoprovides access to the Setup Manager, which is describedunder "Setup Manager" on page 3-34.
FIGURE 3-6 Instrument Manager: Settings
SLM Utility-G3 Manual Settings Tab 3-5

Displaying the Instrument’s Setup
When the Settings tab is selected for the first time, the setupcurrently active on the instrument will be downloaded anddisplayed on the appropriate sub-tabs. The Setup Managerdrop-down will show "<Instrument Settings>" to indicatethat the displayed values are what is currently set on theinstrument. The user may refresh the displayed values (orundo any changes made) by clicking on the Setup Managerdrop-down and selecting "<Instrument Settings>".
Displaying the Settings
The settings are distributed over nine sub-tabs. Each sub-tabis accessed by clicking the appropriate tab and will displaythe settings as shown in the following figures:
General
The General sub-tab provides access to the Default Data FileName and Measurement Description settings as shown in FIGURE 3-7.
FIGURE 3-7 Settings: General
3-6 Settings Tab SLM Utility-G3 Manual

Measurement
The Measurement sub-tab provides access to the settingsshown in FIGURE 3-8.
FIGURE 3-8 Settings: Measurement
SLM Utility-G3 Manual Settings Tab 3-7

Dosimeter
The Dosimeter sub-tab, shown in FIGURE 3-9, providesaccess to settings that define noise exposure level, duration,and threshold to comply with health and safety regulations.
FIGURE 3-9 Settings: Dosimeter
Auto-Calculate
The Criterion Level and Criterion Duration can be setindependently. However, the standards define a linearrelationship between level and duration. When Auto-Calculate is selected, (by checking the Auto-Calculate checkbox) only one of these values needs to be entered and theother one will automatically be set to follow the standard.
Load Std. Criteria
The user can populate the Dosimeter settings from a pre-defined set of Standard Criteria by clicking the Load Std.Criteria button. This will display the Standard Dose Criteriadialog as shown in Figure 3-10. Highlight the desired
3-8 Settings Tab SLM Utility-G3 Manual

Standard and click OK to make the change, or press Cancelto keep the current settings.
FIGURE 3-10 Standard Dose Criteria
Measurement Control
The Measurement Control sub-tab, shown in FIGURE 3-11,provides access to settings related to how and when theinstrument will RUN, STOP and/or STORE a measurement.The actual settings available will depend upon the RunMode selected, consistent with the different types of dataacquisition permitted.
FIGURE 3-11 Settings: Measurement Control
SLM Utility-G3 Manual Settings Tab 3-9

Time History (Model 831)
For time Periods less than 20 ms,please refer to "Time History (Model831): FST" on page 3-12
The settings available and displayed on the Time Historysub-tab will vary based on the Period selected, installedoptions, and the value of certain settings that are set on othersub-tabs. The Time History sub-tab, as shown in FIGURE3-12, represents all the settings available when a Period of100 ms or slower is selected.
FIGURE 3-12 Settings: Time History (Model 831)
LTWA and Lmax/Lmin
The LTWA and all Lmax/Lmin options will be disabled(greyed out) when the Period is 50 ms or faster.
Ln Statistics
The Ln Statistics setting will be disabled when the Period isfaster than 500 ms.
OBA Spectra
The OBA Spectra group will be hidden if the optionalfirmware 831-OB3 has not been installed. The settings willbe enabled/disabled based on the OBA Bandwidth setting onthe Measurement sub-tab.
3-10 Settings Tab SLM Utility-G3 Manual

LAFTM5
The LAFTM5 setting will only be enabled when the Periodis set to 5 s or slower and the "Takt Maximal Data" setting ischecked on the System->Preferences sup-tab.
Advance Settings
The Weather settings will bedisabled if the Weather setting on theWeather sub-tab is set to None. Also,the Preamp settings will only beenabled when a 426A12 orPRM2103 is attached to theinstrument.
In addition to the acoustic settings, a number of non-acousticand system settings can also be saved in a time history record.To access these additional settings, click the Advanced buttonon the Time History sub-tab to display the Advanced TimeHistory dialog as shown in FIGURE 3-13.
FIGURE 3-13 Advanced Time History
Check the box for each non-acoustic setting to be includedin the time history record and click OK when done.
SLM Utility-G3 Manual Settings Tab 3-11

Time History (Model 831): FST
When a Fast (FST) Time History Period of 10, 5, or 2.5ms is selected (only available when the optional firmware831-FST is installed), the Time History sub-tab willappear as shown in FIGURE 3-14.
FIGURE 3-14 Settings: Time History (Model 831): FST
Enabling this option will greatlyincrease the amount of memory used.
When selecting one of the Fast Time History periods (10, 5,2.5 ms), the following settings will be disabled:
• Measurement History
• Event History
• Sound Recording
• Spectral Ln
3-12 Settings Tab SLM Utility-G3 Manual

Also, the OBA Spectra settings will be limited to an Leq ineither 1/1 or 1/3 octave (not both) and all non-acousticsettings, except Tms (millisecond accuracy), will bedisabled as shown in FIGURE 3-15.
FIGURE 3-15 Advanced Time History: FST
SLM Utility-G3 Manual Settings Tab 3-13

Time History (SoundTrack LxT)
When connected to a SoundTrack LxT, the Time Historysub-tab will appear as shown in FIGURE 3-16.
FIGURE 3-16 Settings: Time History (SoundTrack LxT)
3-14 Settings Tab SLM Utility-G3 Manual

Events (Model 831)
The Events sub-tab, shown in FIGURE 3-17, providesaccess to settings related to noise exceedance events andtrigger levels.
FIGURE 3-17 Settings: Events (Model 831)
SLM Utility-G3 Manual Settings Tab 3-15

Events (SoundTrack LxT)
When connected to a SoundTrack LxT, the Events sub-tabwill appear as shown in FIGURE 3-18.
FIGURE 3-18 Settings: Events (SoundTrack LxT)
3-16 Settings Tab SLM Utility-G3 Manual

Markers
The Markers sub-tab, shown in FIGURE 3-19, providesaccess to settings related to pre-defined markers.
FIGURE 3-19 Settings: Markers
SLM Utility-G3 Manual Settings Tab 3-17

Miscellaneous (Model 831)
The Miscellaneous sub-tab, shown in FIGURE 3-20,provides access to settings defining the start times for Day,Evening, and Night time periods and associated noisepenalties, as well as Sound Recording settings that did not fitelsewhere.
FIGURE 3-20 Settings: Miscellaneous (Model 831)
3-18 Settings Tab SLM Utility-G3 Manual

Miscellaneous (SoundTrack LxT)
When Connected to a SoundTrack LxT, the Miscellaneoussub-tab will appear as shown in FIGURE 3-21.
FIGURE 3-21 Settings: Miscellaneous (SoundTrack LxT)
SLM Utility-G3 Manual Settings Tab 3-19

Weather (Model 831 Only)
The Weather sub-tab provides access to optional Weathersettings. The actual settings available will depend upon theWeather setting selected. The settings for Vaisala are shownin FIGURE 3-22.
FIGURE 3-22 Settings: Weather
Creating a New Setup
Setups which have been created andstored previously can be recalled,and modified if necessary, instead ofcreating new ones. For more detailson recalling a setup, see “Recallinga Setup” on page 3-33.
All of the settings on the various sub-tabs of the Settings tabare collectively referred to as a Setup. The user can makeany desired changes to the settings and save thatconfiguration in a Setup file. This allows the user to recall aparticular settings configuration to upload to an instrumentafter a Format/Restore Defaults or to upload to multipleinstruments.
General Settings
The Default Data File Name and Measurement Descriptionsettings are available on the General sub-tab as shown in FIGURE 3-7.
3-20 Settings Tab SLM Utility-G3 Manual

Measurement Settings
For a detailed description of thesettings defined on this tab, refer tothe instrument’s user manual.
The settings available on the Measurement sub-tab definesome basic sound level parameters such as Frequency andPeak Weighting, Detector type, Integration Method, Lnpercentages, as well as OBA (Octave Band Analyzer)settings such as Range, Bandwidth, Weighting, andSpectrum as shown in FIGURE 3-8.
Octave Band Data
Note that the OBA settings will only be available if theappropriate optional firmware has been installed:
• Model 831: 831-OB3 (1/1 and 1/3 octaves)
• SoundTrack LxT: LxT-OB1 (1/1 octave only) or LxT-OB3 (1/1 and 1/3 octaves)
Dosimeter Settings
In order to measure noise dose, theModel 831 must have the optionalfirmware 831-IH loaded. Thisfunctionality is standard with theSoundTrack LxT.
The settings defining the measurement of noise dose are setfrom the Dosimeter sub-tab, shown in FIGURE 3-9.
Predefined Setups
The Dosimeter settings can be loaded from a set ofStandards based pre-defined criteria by clicking the LoadStd. Criteria button which will display the Standard DoseCriteria dialog as shown in FIGURE 3-10. Simply highlightthe desired Standard and click OK to automatically populatethe settings.
Measurement Control Settings
For a detailed description of themeasurement control settings, withand without time history, refer to theinstrument’s user manual.
The settings available on the Measurement Control sub-tab,as shown in FIGURE 3-11, will define how and when theinstrument will RUN, STOP and/or STORE data whentaking a measurement and if a Measurement History will bekept. Most of the settings on this tab are shown/hidden and/or enabled/disabled based primarily on the Run Modesetting and the Enable Measurement History setting.
Measurement History
If an FST Period is selected on theTime History sub-tab, the EnableMeasurement History setting will bedisabled.
The Enable Measurement History setting determines if ameasurement history will be saved and stored with eachMeasurement. Of the remaining settings on this sub-tab,only "Interval Time Sync." and "Interval Time" aredependent on this setting.
SLM Utility-G3 Manual Settings Tab 3-21

Run Mode
The Select Run Mode setting determines how and when theinstrument will Run, Stop, and Store data and can be one ofthe following:
• Manual Stop
• Timed Stop
• Stop When Stable
• Continuous
• Single Block Timer
• Daily Timer
Click on the Run Mode drop-down to select the desiredmode as shown in FIGURE 3-23. The remaining settingsavailable on this sub-tab will be determined by the RunMode selected.
FIGURE 3-23 Select Run Mode
Manual Stop
In Manual Stop mode, the instrument will neverautomatically Run, Stop, or Store a measurement. To take ameasurement, the user must manipulate the appropriate keyson the keypad, either physically or via ScreenGrabber, toRun, Stop, and/or Store a measurement.
Enable Measurement History is the only other settingavailable when in this mode.
3-22 Settings Tab SLM Utility-G3 Manual

Timed Stop
In Timed Stop mode, the instrument will automatically stopand store at least one record each time the instrument is Runas shown in FIGURE 3-24.
FIGURE 3-24 Timed Stop
To enable the Measurement Countersetting, the Measurement Timesetting must be set to at least 1minute.
The duration of each record is determined by theMeasurement Time setting and the number of recordscreated (of Measurement Time duration) is determined bythe Measurement Counter setting. The user must stillmanually start the measurement.
As an example, using the settings shown in FIGURE 3-24,after the user presses Run, the instrument will create 10measurement records with each record having a duration of1:20 and then Stop.
Stop When Stable
In Stop When Stable mode, the instrument will continue torun until the measured level remains within a definedamplitude range for a defined duration of time, as shown in FIGURE 3-25.
FIGURE 3-25 Stop When Stable
SLM Utility-G3 Manual Settings Tab 3-23

The Delta setting determines the amplitude range and theTime setting determines the time duration requirement. Theuser must still manually start the measurement.
As an example, using the settings shown in FIGURE 3-25,after the user presses Run, the instrument will continue torun until the measured level stays within a .2 dB range for 20seconds and then Stop.
Continuous
In Continuous mode, the instrument will continue to rununtil the user presses Stop or the instrument exceeds itsstorage capacity. Several settings are enabled which willdetermine the time interval for each measurement history,provide a means of automatically storing data, and allow fora daily calibration check as shown in FIGURE 3-26.
FIGURE 3-26 Continuous
If the Enable Measurement History setting is checked, theInterval Time setting will determine the duration of eachmeasurement history record. The minimum duration is 1minute. The Interval Time Sync. setting, if checked, willensure that each measurement history record, after the first,will begin at a time that is a multiple of the Interval Timesetting. For example, using the settings shown in Figure 3-26, a measurement started at 08:13:23 would end at08:15:00 so that the next and subsequent measurementscould start at an even multiple of 5 minutes (i.e 08:15:00,08:20:00, 08:25:00, etc...). The Interval Time Sync. andInterval Time settings are disabled if the EnableMeasurement History setting is not checked.
The Daily Auto-Store setting allows for the automaticstoring of data at equal time intervals within a 24-hour timeperiod, beginning at a user specified time. For example,using the settings shown in FIGURE 3-26, a new data file
3-24 Settings Tab SLM Utility-G3 Manual

would be stored every 2 hours (12/day), beginning at 1 AM(01:00:00). The associated Time setting determines the startof the 24-hour time period. If the Daily Auto-Store setting isset to Never, the associated Time setting is disabled and noautomatic storage will occur.
The Daily Cal-Check setting will allow for an instrumentequipped with a Model 426A12 Outdoor Preamplifier toperform a daily calibration check at a time specified by theassociated Time setting.
Single Block Timer
In Single Block Timer mode, the user can specify a block oftime during which a measurement is to be run. Theinstrument will begin a measurement at the specified StartTime setting and end the measurement at the specified EndTime setting. This will occur every day beginning on thedate specified in the Start Date setting with the lastmeasurement occurring on the date specified in the End Datesetting.
For example, using the settings shown in FIGURE 3-27, theinstrument will begin a measurement at 1 am and end themeasurement at 3 am every day beginning on March 1st,2011 and ending on March 31st, 2011.
FIGURE 3-27 Single Block Timer
Daily Timer
Daily Timer mode is similar to Single Block Timer mode butallows the user to specify up to three, non-overlapping,
SLM Utility-G3 Manual Settings Tab 3-25

blocks of time during which a measurement is to be run.Selecting the One Time Block setting is functionallyidentical to Single Block Timer mode while selecting eitherthe Two Timed Blocks or the Three Timed Blocks settingwill allow for either two or three time blocks, respectively.
The Start Time and End Time settings for each block shouldnot overlap. Also, the earliest start time should be defined inthe Start Time 1 setting and the latest start time should bedefined in the Start Time setting of the last time blockspecified as shown in FIGURE 3-28.
FIGURE 3-28 Daily Timer
Daily Timer Example
As an example, lets say Bob has been asked by the citycouncil to take sound level readings near a busy intersection,during rush hour, every day, for a month. There are alsoseveral Bars in the area so Bob has been asked to also takereadings between 23:30 and 03:00 (Bars close at 01:00).
So Bob connects to his instrument using Slm Utility-G3 andconfigures the Measurement Control settings as shown in FIGURE 3-28. Bob then places his instrument in the field onthe last day of February.
3-26 Settings Tab SLM Utility-G3 Manual

Beginning on March 1st, the instrument will take threemeasurements every day until March 31st. The firstmeasurement will start at 05:00 and stop at 09:00, thesecond measurement will start at 15:30 and stop at 19:30,and the third measurement will start at 23:30 and stop at03:00 of the next day. The last measurement taken will startat 23:30 on March 31st and end at 03:00 on April 1st.
Time History Settings
The settings that define the measurement of time historydata are set on the Time History sub-tab, shown in FIGURE3-12.
OBA Spectra
OBA Spectra settings require the appropriate optionalfirmware be installed on the instrument.
• Model 831: 831-OB3 (1/1 and 1/3 octave bands)
• SoundTrack LxT: LxT-OB1 (1/1 octave only) orLxT-OB3 (1/1 and 1/3 octaves)
Also, the OBA Bandwidth setting on the Measurement sub-tab must not be set to Off.
Event Settings (Model 831 Only)
The settings that define the measurement of noiseexceedance events are set on the Events sup-tab (see FIGURE 3-17). Note that several optional firmwarepackages are required to be installed in the Model 831 for allsettings to be available.
Event History
Event History settings require the optional firmware 831-ELA be installed.
Event Time History
In addition to the above, Event Time History settings requirethe optional firmware 831-LOG be installed.
Spectral Mode
In addition to all of the above, Spectral Mode settingsrequire the optional firmware 831-OB3 be installed.
Marker Settings
The settings that define the marker data are set on theMarkers sub-tab, shown in FIGURE 3-19.
SLM Utility-G3 Manual Settings Tab 3-27

Audio Recording is only available onthe Model 831 when the optionalfirmware 831-SR is installed.
To automatically initiate an audio recording whenever aspecific Marker is set by the user, click to place a checkmark in the Record Sound check box for that Marker.
The Pre-marker Time setting allows for up to 9 seconds ofrecorded data prior to the Marker event be include in theMarker recording. The Record Time setting is how manyseconds to record after the Marker event with a maximumsetting of 9999 seconds.
Miscellaneous Settings
The Miscellaneous sub-tab, as shown in FIGURE 3-20,provides access to settings that do not fit elsewhere.
Ldn and Lden
Ldn and Lden require the optionalfirmware 831-ELA or LxT-CN.
The settings in the Ldn and Lden section are used to definethe Start Time settings for the Day, Evening, and Nightperiods (used in the calculation of Lden) as well as theEvening Penalty and Night Penalty settings applied to noiselevels measured during the associated time period.
Sound Recording (Model 831 Only)
Sound Recording requires theoptional firmware 831-SR beinstalled on Model 831.
The settings defined in the Sound Recording section areused for all Sound Recordings made on the instrument(Event Sound Snapshots, Marker Recordings, andMeasurement Sound Snapshots).
Sound Snapshot (Model 831 Only)
Sound Snapshot requires theoptional firmware 831-SR and 831-ELA be installed on the Model 831.
The Sound Snapshot section provides access to the SoundSnapshot settings for Measurement History records. TheEnable setting, if checked, will store a Sound Snapshot (of aduration defined by the Time setting) at the start of eachmeasurement (or interval) record. The Time setting definesthe duration of the Sound Snapshot and can be any valuebetween 1 and 9999 seconds.
3-28 Settings Tab SLM Utility-G3 Manual

Weather Settings
The Weather sub-tab provides access to various Weathersettings based on the choice made in the Weather drop-downsetting as shown in Figure 3-29. If the Weather setting is setto None, no other settings will be available.
FIGURE 3-29 Weather Setting
Weather-INT Settings (831-INT)
When the Weather setting is set to Weather-INT, the Weathersub-tab will appear as shown in FIGURE 3-30.
FIGURE 3-30 Weather-INT Settings
The correct values to use for the various Scale, Units, andOffset settings are dependent on the type of sensor and/ortransducer attached to the 831-INT. Please refer to the
SLM Utility-G3 Manual Settings Tab 3-29

instrument manual for a complete description of thesesettings.
Wind Settings
The Direction setting can be set to one of Compass, Degrees,Percent, or Volts and governs in which format the directionwill be displayed. When set to Compass, the direction isdisplayed as one of eight compass points (N, NE, E, SE, S,SW, W, NW). Otherwise, it is displayed as a numerical valuein the specified format.
The Threshold setting is used to set the 'Windy' threshold.Wind speeds above this setting will be considered 'Windy'.
The Excd. Pause setting can be either Yes or No anddetermines whether or not to pause data sampling whenwind speed exceeds the Excd. Level setting. When set toYes, Exceedance sampling will be paused until the windspeed falls below the Excd. Level setting minus theHysteresis setting. When set to No, Exceedance samplingwill not be paused.
The Excd. Level setting determines the wind speed level atwhich Exceedance sampling will be paused.
The Hysteresis setting determines how far below the Excd.Level setting the wind speed must drop before Exceedancesampling is resumed after being paused.
ADC1 & ADC2 Settings
The 831-INT has two analog/digital converter inputs used toobtain temperature and humidity data from externaltransducers. The ADC1 and ADC2 settings have thereforebeen predefined for Temperature and Humidity settings,respectively. However, since other types of transducers canbe connected to these ports, the Description, Scale, Offset,and Units settings can be set to appropriate values for thetransducer(s) being used.
3-30 Settings Tab SLM Utility-G3 Manual

Vaisala Settings
When the Weather setting is set to Vaisala, the Weather sub-tab will appear as shown in FIGURE 3-31.
FIGURE 3-31 Vaisala Settings
Vaisala does not allow the Units settings to be edited, but thedisplayed units will change between English and SI based onthe Units setting on the System tab, Preferences sub-tab asshown in FIGURE 3-99.
The Direction setting for Vaisala is limited to Compass andDegrees. Otherwise, all settings are the same as describedunder Weather-INT.
SLM Utility-G3 Manual Settings Tab 3-31

Uploading a Setup to the Instrument
Uploading settings or preferencesfrom SLM Utility-G3 to theinstrument will disable some settingsif the associated option is notinstalled on the instrument. Forexample, if a preference file whichturns on RS232 communications isuploaded to an instrument whichdoes not have the communicationsoption installed, those settings willbe ignored.
To upload new settings to the instrument, click the UploadSettings button at the bottom of the Settings tab as shown in FIGURE 3-6.
Saving a Setup
As stated previously, all instrument settings are collectivelyreferred to as a Setup. To save a Setup to the Stored Setupsfile on the PC, click Save at the top of the Settings tab asshown in FIGURE 3-6. This will display the Save Setupdialog where you can enter a name for the new Stored Setup,see FIGURE 3-32.
FIGURE 3-32 Save Setup
3-32 Settings Tab SLM Utility-G3 Manual

Recalling a Setup
To recall a previously saved Setup, click the Stored Setupsdrop-down and select the name of the Setup you wish torecall, see FIGURE 3-33. The selected Setup will be setactive and all the instrument settings on the various Settingstabs will be set to the recalled values.
FIGURE 3-33 Stored Setups
Deleting a Setup
Setups can also be deleted by usingthe Setup Manager (see “SetupManager” on page 3-34). Also, the"<default>" and "<InstrumentSettings>" Setups cannot be deleted.
To delete a previously saved Setup, select the desired Setupfrom the Stored Setups drop-down (see "Recalling a Setup"),and click the Delete button at the top of the Settings tab, asshown in FIGURE 3-6. The selected Setup will be deletedfrom the Stored Setups and all the settings will revert to the<default> Setup settings.
SLM Utility-G3 Manual Settings Tab 3-33

Setup Manager
The Setup Manager allows the user to transfer Setupsbetween Slm Utility-G3 and the instrument. To open theSetup Manager, click the Setup Manager button at the top ofthe Settings tab, as shown in FIGURE 3-6. This will openthe Setup Manager dialog box as shown in FIGURE 3-34.
FIGURE 3-34 Setup Manager
The Setups on PC window on the right hand side lists thoseSetups that are saved in the Stored Setups list on the PC(Slm Utility-G3), while the Slm Setups window on the lefthand side lists the Setups that are saved on the Instrument.
3-34 Settings Tab SLM Utility-G3 Manual
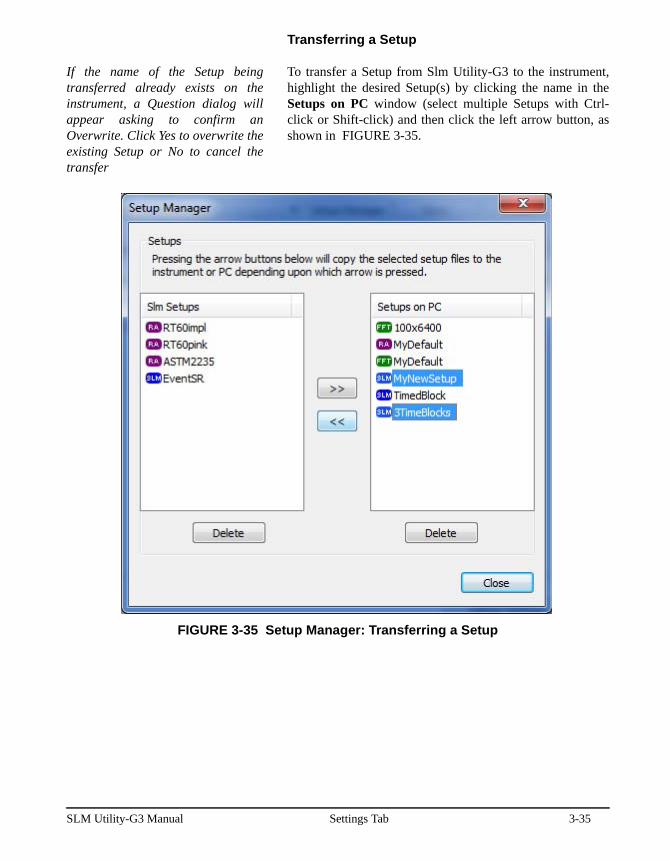
Transferring a Setup
If the name of the Setup beingtransferred already exists on theinstrument, a Question dialog willappear asking to confirm anOverwrite. Click Yes to overwrite theexisting Setup or No to cancel thetransfer
To transfer a Setup from Slm Utility-G3 to the instrument,highlight the desired Setup(s) by clicking the name in theSetups on PC window (select multiple Setups with Ctrl-click or Shift-click) and then click the left arrow button, asshown in FIGURE 3-35.
FIGURE 3-35 Setup Manager: Transferring a Setup
SLM Utility-G3 Manual Settings Tab 3-35

The selected Setup(s) will be copied to the instrument asshown in FIGURE 3-36.
FIGURE 3-36 Setup Manager: Transfer Complete
The process is the same for transferring from the instrumentto Slm Utility-G3. Simply highlight the desired Setup(s) inthe Slm Setups window and click the right arrow button. Theselected Setup(s) will then be copied from the instrument toSlm Utility-G3.
Deleting a Setup
To delete a Stored Setup from either the instrument or thePC, highlight the name of the Setup(s) to be deleted (selectmultiple Setups using Ctrl-click or Shift-click) in the SlmSetups window (for Setups stored on the instrument) or theSetups on PC window (for Setups stored on the PC) andclick the associated Delete button, as shown in FIGURE 3-34.
3-36 Settings Tab SLM Utility-G3 Manual

Manual Control Tab
The instrument can also be operatedmanually when not connected to thePC.
To display the Manual Control Tab, click the ManualControl tab of the Instrument Manager.
The Manual Control tab, as shown in FIGURE 3-37,allows the user to remotely operate an instrument connectedto Slm Utility-G3.
FIGURE 3-37 Manual Control Tab
SLM Utility-G3 Manual Manual Control Tab 3-37

The “Restore Model 831” and the“Upgrade Model 831” are onlyavailable when connected by USB orTCP/IP.
From the Manual Control tab, the following operations canbe performed:
• Run the instrument
• Stop the instrument
• Reset the data to clear the instrument memory
• Lock the instrument
• Unlock the instrument
• Browse instrument Files
• Upgrade the instrument
• Restore the instrument
• Store Data File
• Initiate a Live Stream permitting the user to listen tolive streaming audio from the Model 831.
• Switch modes between SLM Mode, RT-60 Mode(requires 831-RT option), and FFT Mode (requires 831-FFT option)
Begin a Measurement
Click Run, to put the instrument into the Run mode andbegin a measurement. After clicking Run, the Run Controlsection will appear as shown in FIGURE 3-38.
FIGURE 3-38 Run Key
When the instrument is running, the Run Status will be set to“RUNNING”. Also, the Session Log will be updated toreflect the running status of the instrument and the date andtime the run was initiated.
Run Status
3-38 Manual Control Tab SLM Utility-G3 Manual

FIGURE 3-39 Session Log: Running
Stop a Measurement
Click Stop to put the instrument into the Stop mode andend a measurement. After clicking Stop, the Run Controlsection will appear as shown in FIGURE 3-40.
FIGURE 3-40 Stop Key
When the instrument is stopped, the Run Status will changeto “STOPPED”. Also, the Session Log will be updated toreflect the stopped status of the instrument, along with thedata and time of the stop, as shown in FIGURE 3-41.
FIGURE 3-41 Session Log: Stopped
Reset Current Measurement
Warning! Use caution when usingthis action since deleted data cannotbe recovered. Data you wish to keepshould be stored to a file.
To reset the data currently in the memory of the connectedinstrument, click the Reset Current Measurement button asshown in FIGURE 3-42.
Run Status
SLM Utility-G3 Manual Manual Control Tab 3-39

FIGURE 3-42 Reset Current Data
The data and time of a reset appears in the Session Log asshown in FIGURE 3-43.
FIGURE 3-43 Session Log: Reset
Locking the Instrument Keypad
The Model 831 and SoundTrack LxT, have a very usefulkeypad Lock feature. The Lock Control section of theManual Control tab is shown in FIGURE 3-44.
The software does not enforce thelock setting so this menu can be usedto unlock a meter when the code isnot known.
FIGURE 3-44 Lock Control
The Lock Status, locked or unlocked, is indicated in theLock Status field. Buttons for locking and unlocking theinstrument keypad are located near the bottom of the LockControl area.
Lock Status
Set Lock UnLock
3-40 Manual Control Tab SLM Utility-G3 Manual

To Lock the instrument, click the Lock key shown in FIGURE 3-44, which will open the Set Unlock Code dialogshown in FIGURE 3-45.
FIGURE 3-45 Set Unlock Code
Permitting Calibration When Locked
To allow calibrating the instrument when Locked, check theAllow Calibration when Locked setting check box.
Click the down arrow to the right of the “Select LockMode:” field to open the drop-down menu shown in FIGURE 3-46.
FIGURE 3-46 Lock Mode Options
SLM Utility-G3 Manual Manual Control Tab 3-41

Lock Mode
See the instrument’s user manual fora complete description of the LockMode.
There are four options available for the lock mode.
• Unlocked: The keyboard is not locked; all functions areaccessible to the instrument user
• Locked with Auto Store
• Locked with Manual Store
• Fully Locked
Click on the desired option to make a selection.
Store an Instrument File
The keys will indicate LxT or 831depending on the instrumentconnected.
To store the measurement data currently in the memory to adata file, click Store 831 File as shown in FIGURE 3-47.
FIGURE 3-47 Store Instrument File
3-42 Manual Control Tab SLM Utility-G3 Manual

This will display the Enter 831 Data Filename dialog asshown in FIGURE 3-48.
FIGURE 3-48 Enter Data Filename
A default file name will appear corresponding to the nextavailable file name and number. This can be modified bytyping into the data field before completing the storageprocess.Click OK to complete the data storage.
Browse Instrument Files
To browse the files stored in the 831, click Browse 831 Filesas shown in FIGURE 3-49.
FIGURE 3-49 Browse 831 Files
SLM Utility-G3 Manual Manual Control Tab 3-43

This will open the 831 Files Browser window shown in FIGURE 3-50.
FIGURE 3-50 831 Files Browser
Rename Instrument Files
Any instrument file listed can be renamed by highlighting itwith the cursor and clicking Rename, which will create aframe around the file name as shown in FIGURE 3-51.
FIGURE 3-51 Rename 831 File
Modify the file name as desired and click outside the frameto accept the new name.
3-44 Manual Control Tab SLM Utility-G3 Manual

Delete Instrument Files
Any instrument file listed can be deleted by highlighting itwith the cursor and clicking Delete as shown in FIGURE 3-52.
FIGURE 3-52 Delete 831 Files
Delete All Instrument Files
All instrument files listed can be deleted by clicking DeleteAll as shown in FIGURE 3-53.
FIGURE 3-53 Delete All 831 Files
SLM Utility-G3 Manual Manual Control Tab 3-45

This will bring up the confirmation dialog box shown in FIGURE 3-54.
FIGURE 3-54 Delete Confirmation Dialog Box
Click Yes to confirm the deletion of all files.
Upgrade the Instrument
Using SLM Utility-G3, it is possibleto upgrade the instrument firmwarewithout opening the InstrumentManager, as described in the section"File" on page 2-4.
To upgrade the firmware in the instrument, first place thefirmware file on your computer using a path you willremember. The keys will indicate SoundTrack LxT or 831depending on the instrument connected.
The Upgrade function is availableonly when connected by USB orTCP/IP.
Click Upgrade 831 as shown in FIGURE 3-55.
FIGURE 3-55 Upgrade 831
3-46 Manual Control Tab SLM Utility-G3 Manual

This will display the warning message shown in FIGURE 3-56.
FIGURE 3-56 Upload 831 Warning Message
Press Cancel if you wish to abort the upload operation.
Press Download if you wish to download the data files andstore them to your computer before performing the uploadoperation.
Press Proceed to continue the upload operation.
This will open a window containing the 831 FirmwareLoader as shown in FIGURE 3-57.
FIGURE 3-57 SLM Firmware Programmer
SLM Utility-G3 Manual Manual Control Tab 3-47

Click Next to display the Select File box shown in FIGURE3-58.
FIGURE 3-58 Select File
For loading firmware files to the instrument, select one ofthe following options:
• For .ROM firmware files, select Upgrade the firmwareusing a .ROM file.
• For .OPT firmware files, select Change installed optionsusing a .OPT file.
• For firmware files to be used with the 831-INT-ET, selectUpgrade 831-INT-ET firmware.
Under the option selected, enter the path name of thefirmware file you received, or click Browse to locate andselect the appropriate file.
After selecting the appropriate option and specifying thepath for the firmware file, click Next to complete theupgrade process.
3-48 Manual Control Tab SLM Utility-G3 Manual

Restore Instrument
Restoring the instrument will deleteall measurement files and restore allsettings to factory defaults.
This action will restore the connected instrument to factorydefault settings.
The Restore function is availableonly when connected by USB orTCP/IP.
Click Restore 831 as shown in FIGURE 3-59.
FIGURE 3-59 Restore 831
This will produce the warning message shown in FIGURE3-60.
FIGURE 3-60 Restore 831 Warning Message
To proceed with the restoration, click Yes.
To abort the restoration, click No.
SLM Utility-G3 Manual Manual Control Tab 3-49

ScreenGrabber
The ScreenGrabber program permits the user to capture adisplay from the instrument screen and perform thefollowing actions:
• Copy it to the clipboard
• Save it as a bitmap file
• Display it in a large format
• Control the 831 by clicking on the 831 buttons
To open the ScreenGrabber program, click ScreenGrabberas shown in FIGURE 3-61.
FIGURE 3-61 Open ScreenGrabber Program
3-50 Manual Control Tab SLM Utility-G3 Manual

The ScreenGrabber display will appear, as shown in FIGURE 3-62.
FIGURE 3-62 ScreenGrabber Display
ScreenGrabber Menu
Right click on the ScreenGrabber display to open theScreenGrabber Menu, shown in FIGURE 3-63.
FIGURE 3-63 ScreenGrabber Menu
SLM Utility-G3 Manual Manual Control Tab 3-51
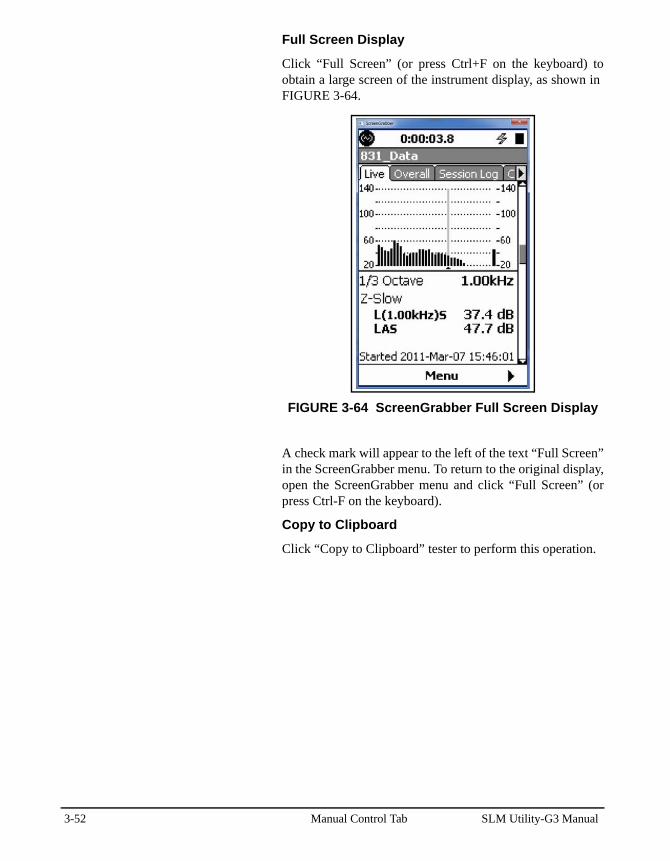
Full Screen Display
Click “Full Screen” (or press Ctrl+F on the keyboard) toobtain a large screen of the instrument display, as shown in FIGURE 3-64.
FIGURE 3-64 ScreenGrabber Full Screen Display
A check mark will appear to the left of the text “Full Screen”in the ScreenGrabber menu. To return to the original display,open the ScreenGrabber menu and click “Full Screen” (orpress Ctrl-F on the keyboard).
Copy to Clipboard
Click “Copy to Clipboard” tester to perform this operation.
3-52 Manual Control Tab SLM Utility-G3 Manual

Save Bitmap to File
The "Save As" dialog is a systemdialog and will appear differentlydepending on which OS the user isrunning. Also, the path and/or foldername shown will reflect the locationof the last file saved and will notnecessarily match what is shown inthis example screenshot.
Click Save Bitmap to File (or press Ctrl+S on the keyboard)to perform this operation. This will open the Save As dialog,shown in FIGURE 3-65. Use this to define the path to thelocation where the bitmap is to be stored and click Save tocomplete the operation.
FIGURE 3-65 Save As
SLM Utility-G3 Manual Manual Control Tab 3-53

Start Live Stream
In order to implement a live stream,the Model 831 must be runningfirmware version 1.6 or greater andthe Sound Recording Option must beenabled.
The Live Stream permits the user to listen to live streamingaudio from the Model 831
FIGURE 3-66 Start Live Stream
Click to Start Live Stream to open the Live Stream dialog shown in FIGURE 3-67.
FIGURE 3-67 Live Stream Menu
Amount of time datahas been streaming.
Amount of datacurrently buffered.
831 Sample Rate
Amount of data to storebefore playback begins
Turn On AutomaticGain Control
Save as a .wav File.
3-54 Manual Control Tab SLM Utility-G3 Manual

Buffer Length
The amount of data to buffer is determined by the bufferlength setting. The system will buffer the specified numberof seconds of data before beginning playback. If the amountof buffered data falls too low, playback will be paused whilethe buffer is refilled. The buffering status will be displayedas shown in FIGURE 3-68.
FIGURE 3-68 Live Stream Buffering
SLM Utility-G3 Manual Manual Control Tab 3-55

Save to File
Clicking Save to File will open the Select Output Fileshown in FIGURE 3-69.
The "Select Output File" dialog is asystem dialog and will appeardifferently depending on which OSthe user is running. Also, the pathand/or folder name shown willreflect the location of the last filesaved and will not necessarily matchwhat is shown in this examplescreenshot.
FIGURE 3-69 Select Output File
Use this to select where to save the Live Stream file.
3-56 Manual Control Tab SLM Utility-G3 Manual

Switching Instrument Modes
The RT-60 mode requires theoptional firmware 831-RT and FFTmode requires the optional firmware831-FFT. The mode buttons will beenabled when the appropriateoptional firmware has beeninstalled.
The Mode Control section allows the user the change whichmode the Model 831 is operating in as shown in FIGURE 3-70. The Mode Status shows the current mode of theconnected instrument. To switch modes, press the buttonlabeled with the desired mode. Note that the mode button forthe current mode will be disabled. Also, the mode button forany mode that is not currently installed will also be disabled.
FIGURE 3-70 Mode Control
After clicking a mode button, a warning dialog, as shown in FIGURE 3-71, will be displayed allowing the user toconfirm the mode change.
FIGURE 3-71 Change Warning
When changing modes the instrument manager will beautomatically closed and reopened with settings appropriatefor the chosen mode.
SLM Utility-G3 Manual Manual Control Tab 3-57

Download Tab
To display the Download tab, click the Download tab of theInstrument Manager.
The Download tab, as shown in FIGURE 3-72, allows theuser to download data files stored on the instrument to thePC.
FIGURE 3-72 Download Tab
3-58 Download Tab SLM Utility-G3 Manual

Selecting Files to Download
The initial list of files available to download will be limitedto the data files stored in the same mode the instrument iscurrently running. (i.e. if the instrument is in SLM mode,only SLM data files will be displayed.) To see all files for allmodes, check the Show All Files check box.
The user may choose which files to download by selectingone or more individual files, or by selecting all files. Notethat when showing all files and selecting more than one fileto download, only files that share the same mode may bedownloaded together in the same batch.
Selecting a File
To choose a file to download, simply click the filename inthe list to select the desired file. Multiple files may bechosen by using Ctrl-click to select each individual file or byusing Shift-click to select a block of files.
Selecting All Files
When selecting multiple data files,all files selected will be downloadedinto a single download file with eachdata file becoming a Data Recordwithin the downloaded file.
Clicking the Select All button will highlight all the files thatwere stored in the same mode as the current instrumentmode. The button will toggle to Deselect All which, whenclicked, will deselect all highlighted files.
Add General Record Information
The general record informationadded to the downloaded recordscan be edited later as described inthe section "Edit of General RecordInformation" on page 4-4.
By checking the Add General Record Information check boxprior to initiating the download, the user will be able to addsome general record information to each file that isdownloaded, as shown in FIGURE 3-74.
Same Information for All Records
If the general record information being entered is applicableto all the files in the download, the user may elect to checkthe Use for all Downloaded records? check box. This willapply the same information entered here to the current fileand all subsequent files so that the Add General RecordInformation dialog will not be displayed for the remainingfiles in the download.
SLM Utility-G3 Manual Download Tab 3-59

Saving .ldbin Files
The .ldbin file contains the meter data before it is translatedby the SLM Utility-G3 software. The file is not usuallynecessary to save except in some trouble-shooting cases orwith special file import requirements.
If you select this option, you will be prompted to save thefile to a location each time you download from the meter tothe SLM Utility-G3software.
Download Files
After selecting the desired file(s), click the Download buttonto initiate the download process, as shown in FIGURE 3-72.Progress is indicated with the Downloading box, as shownin FIGURE 3-73.
FIGURE 3-73 Download Progress
3-60 Download Tab SLM Utility-G3 Manual

If the Add General Record Information check box waschecked on the Download tab shown in FIGURE 3-73, theAdd General Information dialog will appear after the last fileis downloaded, as shown in FIGURE 3-74.
FIGURE 3-74 General Information
After all desired information has been entered, click OK tocontinue with the next file.
Delete Downloaded Files From The Instrument
At the conclusion of the download, the dialog box shown in FIGURE 3-75 is displayed to indicate that the downloadprocess has been completed and to provide the user with theoption of deleting the files which have just beendownloaded.
FIGURE 3-75 Delete Downloaded Files
SLM Utility-G3 Manual Download Tab 3-61

Click Yes to delete the files from the instrument, or No tokeep the files stored on the instrument.
The user must close the InstrumentManager to be able to interact withthe Data View.
At this point, the download is complete and each data file inthe download is 'translated' into a Data Record and madeavailable for viewing in the Data View, as shown in FIGURE 3-76.
FIGURE 3-76 Data View
For information on the displaying the downloaded data and acomplete description of the Data View, see Chapter 4 "DataView" on page 4-1.
3-62 Download Tab SLM Utility-G3 Manual

Session Log Entry
When the download is complete, a new entry will appear inthe session log indicating the date and time of the downloadas shown in FIGURE 3-77.
FIGURE 3-77 Session Log: Downloaded
Calibrate Tab
Click the Calibrate tab, as shown in FIGURE 3-78, tocalibrate a connected instrument using Slm Utility-G3.
FIGURE 3-78 Calibrate
SLM Utility-G3 Manual Calibrate Tab 3-63

For a complete description of theCalibrate functionality, please referto the Calibration chapter of theinstrument manual.
Normally the instrument is calibrated using an acousticcalibrator which exposes the microphone to a known soundpressure level (dB) at a known frequency. The calibrationprocedure adjusts the sensitivity of the meter so that themeter reads the applied decibel level.
There is, however, an alternative mode in which a voltage isinput directly to the input connector, without using thepreamplifier. In this case, the sensitivity is adjusted such thatthe meter reads a user-defined decibel level. This mode isuseful when the meter is being used to measure a signal froma transducer other than a microphone, such as anaccelerometer.
Frequency Weighting/Detector
When a calibration is performed, the instrument isautomatically set to use C-Weight for the frequencyweighting and Fast for the detector response time. The useof C-Weighting permits the use of calibrators providingsignals in the range 200 Hz to 1,250 Hz. The mostcommonly used calibrators provide signals at 1 kHz.
The Fast detector is used to minimize the amount of time ittakes for the value of the measured level to stabilize.
When the calibration is completed, the frequency weightingand detector are reset to those which were active prior to thecalibration.
Microphone/Preamplifier
The Microphone/Preamp section of the Calibrate tabdisplays the accuracy Class according the IEC and ANSIstandards and the model number of the preamplifier. Sincethese values are read from the instrument, the data appeargreyed out and are not accessible for user modification.
3-64 Calibrate Tab SLM Utility-G3 Manual

Calibration Data
The Calibration Data section of the Calibrate tab, shown in FIGURE 3-79, is used to perform the calibration.
FIGURE 3-79 Calibration Section of Calibration Tab
Post-calibration data appears inSLM Utility-G3 or data export filesonly if the calibration is performedon the instrument before saving thefile.
As mentioned at the beginning of the section, the calibrationcan be performed using either an acoustic calibrator or avoltage signal; usually the acoustic calibrator method isused. The instrument can have stored in its internal memorythe specifications of four different calibrators. This data canbe input either from the front panel of the instrument orusing SLM Utility-G3, as described below.
Manual Calibration
Edit Calibrators
To edit the calibrator specifications, click Edit Calibratorsas shown in FIGURE 3-80.
FIGURE 3-80 Edit Calibrators
CalibratorLevel
Calibrator
SLM Utility-G3 Manual Calibrate Tab 3-65

This will display a window listing all four possiblecalibrators, along with their output level and frequencyvalues shown in FIGURE 3-81.
FIGURE 3-81 Calibrator Specifications Table
Any of these specifications can be edited directly from thistable. When the calibrator(s) specifications have beenentered as desired, click OK to make the changes and closethis window.
Select Calibrator
To select the calibrator which is to be used for thecalibration, click the down arrow to the right of theCalibrator field, which will open a drop down menu listingall four calibrators as shown in FIGURE 3-82.
FIGURE 3-82 Calibrator Selection Menu
Highlight the desired calibrator with the cursor and click tomake a selection.
3-66 Calibrate Tab SLM Utility-G3 Manual

Perform Calibration
Click Calibrate, as shown in FIGURE 3-83, to begin thecalibration process.
FIGURE 3-83 Initiate Calibration
A message, as shown in FIGURE 3-84, will be displayed towarn that data in the instrument will be lost when thecalibration is performed.
FIGURE 3-84 Unsaved Data Warning
Click OK to continue with the calibration or click Cancel toabort the calibration process.
When the calibration process is continued, the messageshown in FIGURE 3-85 will appear to prompt the user toplace the calibrator over the microphone and turn on thecalibrator.
FIGURE 3-85 Turn On Calibrator Message
With the calibrator in place over the microphone andswitched on, click OK to continue.
SLM Utility-G3 Manual Calibrate Tab 3-67

Satisfactory Calibration
The calibration will continue until the level measured by theinstrument is within 0.5 dB of the calibration level, at whichtime the calibration will stop and the resulting data will bedisplayed as shown in FIGURE 3-86.
FIGURE 3-86 Calibration Results
Among the data presented are the Current Sensitivity, basedon the previous calibration, and the Calculated Sensitivity,based on the results of the new calibration. Click Yes toaccept the new calibration and update the sensitivity valuestored in the instrument with the new Calculated Sensitivity.Otherwise, click Cancel to discard the calibration and keepthe sensitivity of the instrument at the Current Sensitivityvalue.
Calibration Check
When the Model 831 is connected to an OutdoorMicrophone Preamplifier and Power Supply, the SLMUtility-G3 can be used to perform a calibration check. Toinitiate a calibration check, click Calibration Check in thecalibration Data section, which will open the CalibrationCheck dialog shown in FIGURE 3-87.
FIGURE 3-87 Calibration Check Menu
3-68 Calibrate Tab SLM Utility-G3 Manual

Direct Input of Microphone/Preamplifier Sensitivity
Microphone sensitivity is notcurrently supported on theSoundTrack LxT.
To utilize the nominal sensitivity of microphone/preamplifier combination being used, click Sensitivity in theMicrophone Preamplifier section, which will open thewindow shown in FIGURE 3-88.
FIGURE 3-88 Direct Input of Sensitivity
SLM Utility-G3 Manual Calibrate Tab 3-69

Calibration History
To display the calibration history, click Calibration Historyas shown in FIGURE 3-89.
FIGURE 3-89 Calibration History Button
This will bring up the Calibration History dialog box, asshown in FIGURE 3-90.
FIGURE 3-90 Calibration History Dialog Box
3-70 Calibrate Tab SLM Utility-G3 Manual

Calibration Spectrum
The icon to the left of a calibration indicates that there is acalibration frequency spectrum attached to the calibrationdata. The spectrum is only provided when the calibrationhad been done on the instrument itself. Calibrationsperformed via the SLM-Utility-G3 program do not include aspectrum.
This feature requires optionalfirmware 831-OB3, LxT-OB1 or LxT-OB3. Also, OBA must be enabledfrom the OBA Settings tab.
When spectral data have been saved with the calibrationdata, this can be displayed, as shown in FIGURE 3-91, bydouble clicking the desired calibration history record.
FIGURE 3-91 Calibration Spectra
This example shows a 1/3 octave spectrum. If 1/1 octaveshave been selected on the OBA Settings tab, the graphwould show a 1/1 octave spectrum.
Calibration Check History
For remote noise monitoring, you can perform a calibrationcheck at each remote site instead of calibrating with a soundlevel calibrator. To display the results of these calibrationchecks, select Calibration History from the View drop-down, as shown previously in FIGURE 3-90.
SLM Utility-G3 Manual Calibrate Tab 3-71

Export Calibration History
To export the calibration history, click the Export button atthe bottom of the Calibration History display shown in FIGURE 3-90. This will open the Export CalibrationHistory dialog box as shown in FIGURE 3-92.
FIGURE 3-92 Export Calibration History
Print Calibration History
To print the calibration history, click the Print button on thebottom of the Calibration History display shown in FIGURE 3-90.
Certification
It is standard practice to have a measuring instrument suchas the instrument certified by the manufacturer at regularintervals. The interval is usually selected by the useraccording to the application for which it is used, although insome cases this might be based on a requirement establishedby a client for whom measurements are being performed.Many PCB Piezotronics Inc. customers select to havecertification performed annually.
3-72 Calibrate Tab SLM Utility-G3 Manual

To assist users in maintaining their certification schedule,certification reminders are provided on the Calibrate tab asshown in FIGURE 3-93.
FIGURE 3-93 Certification Reminders
Last Certification Date
The date of the last certification is stored in the instrument aspart of the certification process.
Certification Interval
The desired interval, in years, between certifications is setby the user by clicking the down arrow to the right of theCal. Interval data field, which will open the drop down menushown in FIGURE 3-94.
FIGURE 3-94 Certification Interval Menu
The following choices are available:
• 1 Year
• 2 Years
• 3 Years
• 4 Years
• Never
Click on the desired value to make a selection. This value isstored in the instrument.
SLM Utility-G3 Manual Calibrate Tab 3-73

Certification Reminder
The instrument can be set to provide an on-screen reminderwhen the date for a new certification is approaching. Thismessage will appear at a user-selected number of days priorto the desired certification date. This number is set byclicking the down arrow to the right of the Cert. Reminderdata field, which will open the drop down menu shown in FIGURE 3-95
FIGURE 3-95 Certification Reminder Menu
The following choices are available:
• 15 Days
• 30 Days
• 35 Days
• 60 Days
• Never
Click on the desired value to make a selection. This value isstored in the instrument and used to determine when thecertification reminder should be displayed.
3-74 Calibrate Tab SLM Utility-G3 Manual

System Tab
Click the System tab on the Instrument Manager to displayits contents.
The System tab is comprised of seven sub-tabs as shown in FIGURE 3-96. Each sub-page can be accessed by clickingon the appropriate sub-tab on the System tab. Tabs that arecurrently out of view can be scrolled to by using the left/right arrow buttons at the far right.
FIGURE 3-96 Instrument Manager: System Tab
SLM Utility-G3 Manual System Tab 3-75

Displaying the Instrument's Preferences
When the System tab is selected for the first time, thepreferences currently active on the instrument will bedownloaded and displayed on the appropriate sub-tabs. TheStored Preferences drop-down will show "<InstrumentSettings>" to indicate that the displayed values are what iscurrently active on the instrument. The user may refresh thedisplayed values (or undo any changes made) by clicking theStored Preferences drop-down and selecting "<InstrumentSettings>".
Displaying the Preferences
The preferences are distributed over seven sub-tabs, asfollows:
• Preferences
• Power/Lock
• System
• Displays
• Reference Spectra
• Logic I/O (831 only)
• Communications
Each sub-tab is accessed by clicking the appropriate sub-tabon the System tab and will display the preferences as shownand described in the following sections.
Preferences
The Preferences sub-tab is displayed by clicking thePreferences sub-tab on the System tab and is shown in FIGURE 3-97.
3-76 System Tab SLM Utility-G3 Manual

FIGURE 3-97 System: Preferences
Display Options
The Display Options section of the Preferences sub-taballows the user to set the Language, Decimal format, Dateformat, and Units preferences as shown in FIGURE 3-97.
Language
Clicking the down arrow to the right of the Language fieldwill open a drop-down menu listing the language options asshown in FIGURE 3-98.
FIGURE 3-98 Language Selection
Click on the desired language to make the selection.
SLM Utility-G3 Manual System Tab 3-77

Decimal Format
A decimal can be represented by a period (.) or a comma (,).Click on the radio button to the left of the desired format tomake a selection.
Date Format
The date can be represented in one of two formats:
• dd mmm yyyy
• yyyy mmm dd
Click on the radio button to the left of the desired format tomake a selection.
Units
The following choice of units is provided:
• SI
• English
Click on the radio button to the left of the desired format tomake a selection.
Other Options
Synchronize date/time with PC
Click to place a check mark in the check box associated withthe text “Sync. date/time with PC” to synchronize the date/time of the instrument with the PC every time it isconnected.
Automatically Store Data on Stop
This option is provided to minimize the possibility thatmeasured data is lost by forgetting to store.
FIGURE 3-99 Auto Store
The options are as follows:
• None: No automatic storage of data
• Prompt: Upon stopping a measurement, a prompt isdisplayed asking whether or not the data is to be stored. Ifthe response is Yes, the user will be prompted for a file nameto assign to the stored file.
3-78 System Tab SLM Utility-G3 Manual

• Store: Upon stopping a measurement, the data isautomatically stored. There will be no prompts for a filesname; the default name will automatically be used alongwith an indexed numeric designator.
Reset Prompt
The user can choose whether or not a warning prompt isdisplayed on the instrument screen when the Reset button ispressed, prior to the reset being performed.
If this option is selected by placing a check mark in thecheckbox, the message “Are You Sure?” will be displayedon the screen prompting the user to select Yes to continuewith the reset or No to abort the reset operation.
If this option is not activated, the reset will be performedimmediately without a prompt.
Jack Function
The AC/DC output, Voice Recorder connector on the rightside of the base of the instrument can perform either of thefollowing functions:
• Provide AC and DC analog output signals proportionalto measured acoustic parameters.
• Provide a connection to a microphone-equippedheadset for the recording and playback of voicerecordings.
• Or it can be set to Off.
Click the down arrow to the right of the data field entitled“Jack Function” to open a drop-down menu listing theoptions as shown in FIGURE 3-100.
FIGURE 3-100 Jack Function
Click on the desired functionality to make a choice.
Takt Maximal Data (Laftm5)
Place a check in the check box to set the Model 831 tomeasure and display the parameter LAFTM5, called for by aGerman standard.
SLM Utility-G3 Manual System Tab 3-79

Microphone Correction
When using a free-field microphone for measurements in arandom incidence sound field, the user may wish to add arandom incidence correction to the sound levelmeasurement. Click the down arrow to the right of the datafield entitled “Microphone Correction:” to open a drop-down menu listing the options as shown in FIGURE 3-101.
FIGURE 3-101 Microphone Correction
Click on the selection desired, one of the following:
• Off to have no correction.
• RI:FF: to correct a random incidence microphone formaking measurements in an acoustic free-field.
• FF:RI: to correct a free-field microphone for makingmeasurements in a random incidence acoustic field.
• FF:RI 2106/8: to correct a free-field microphone formaking measurements in a random incidence acoustic fieldfrom within an EPS2106 or EPS2108.
• FF:FF 2106/8: to correct a free-field microphone formaking measurements in a free-field acoustic field fromwithin an EPS2106 or EPS2108.
• FF:90 2106/8: to correct a free-field microphone formaking measurements in a 90 acoustic field from within anEPS2106 or EPS2108.
3-80 System Tab SLM Utility-G3 Manual

Power/Lock
The Power/Lock sub-tab is displayed by clicking the Power/Lock sub-tab on the System tab.
The Power/Lock sub-tab provides access to the Lock Modeand Power Management preferences as shown in FIGURE3-102.
FIGURE 3-102 System: Power/Lock
Lock Preferences
See the instrument’s user manual fora detailed presentation of the lockingfeatures of the instrument.
There are four options available for the lock mode.
• Unlocked
• Locked with Auto Store
• Locked with Manual Store
• Fully Locked
Click the down arrow to the right of the “Lock Mode:” extfield to open a menu listing the options as shown in FIGURE 3-103.
FIGURE 3-103 Lock Mode Menu
SLM Utility-G3 Manual System Tab 3-81
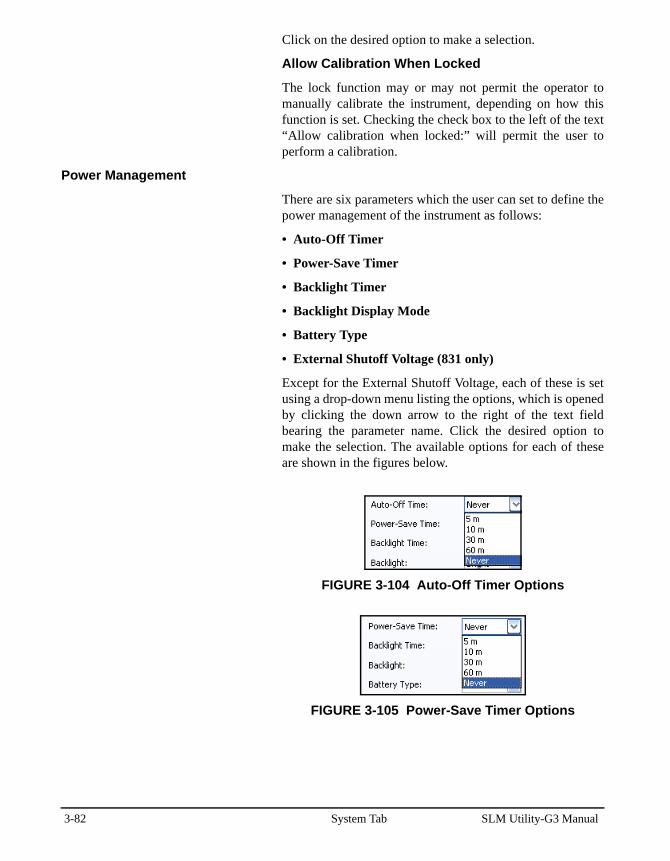
Click on the desired option to make a selection.
Allow Calibration When Locked
The lock function may or may not permit the operator tomanually calibrate the instrument, depending on how thisfunction is set. Checking the check box to the left of the text“Allow calibration when locked:” will permit the user toperform a calibration.
Power Management
There are six parameters which the user can set to define thepower management of the instrument as follows:
• Auto-Off Timer
• Power-Save Timer
• Backlight Timer
• Backlight Display Mode
• Battery Type
• External Shutoff Voltage (831 only)
Except for the External Shutoff Voltage, each of these is setusing a drop-down menu listing the options, which is openedby clicking the down arrow to the right of the text fieldbearing the parameter name. Click the desired option tomake the selection. The available options for each of theseare shown in the figures below.
FIGURE 3-104 Auto-Off Timer Options
FIGURE 3-105 Power-Save Timer Options
3-82 System Tab SLM Utility-G3 Manual

FIGURE 3-106 Backlight Timer Options
FIGURE 3-107 Backlight Options
FIGURE 3-108 Battery Type
External Shutoff Voltage
The external shut-off feature canonly be utilized when power isdelivered to the Model 831 via theI/O connector for peripherals andexternal power, such as from aCBL130, 426A12, 831-INT,EPS029-831, etc.
The default value is 10.8 volts, but the user can directly entera value between 10 and 25 volts.
System
The System sub-tab appears as shown in FIGURE 3-109. Inaddition to displaying all the options installed in thefirmware of the currently connected instrument, severalpreferences related to USB Options and InstrumentIdentification may be set here. The ability to mask options(see “Masking Firmware Options” on page 3-86) and uploadnew firmware (see “Firmware Upgrade” on page 3-87) arealso made available.
SLM Utility-G3 Manual System Tab 3-83

FIGURE 3-109 System Subtab
The USB port must be enabled toaccess the preferences on theoptional Communications sub-tabdescribed in “Communications(Model 831 only)” on page -3-94.
Enable USB Port
Place a check in the check box to enable the USB Port.
USB Storage
Data can be stored either to the internal memory of theinstrument or to a memory device on the USB port. Click thedown arrow to the right of the “USB Storage” text field toopen a menu listing the options as shown in FIGURE 3-110.
FIGURE 3-110 USB Storage Menu
Selecting No will cause all data to be stored to internalmemory. Selecting AutoSelect will cause data to be storedto a USB memory device if present, or to internal memory ifnot present or there is insufficient space.
Click on the desired option to make a selection.
3-84 System Tab SLM Utility-G3 Manual

GPS
When using an external GPS with the Model 831, click thedown arrow to the right of the GPS text field to open theGPS Control menu shown in FIGURE 3-111.
FIGURE 3-111 GPS Control Menu
With GPS Control set to On or Auto, the zone correctioncontrols become available as shown in FIGURE 3-112.
FIGURE 3-112 GPS Zone Correction
Firmware Options
Firmware options presently loaded into the instrument arelisted in the window entitled “Installed Options” on the rightside of the screen. If any of the check box of the options arenot checked, this means that they have been masked, ordisabled, as described in the next section.
SLM Utility-G3 Manual System Tab 3-85

Masking Firmware Options
Masking is temporary and does notresult in permanent loss of apurchased option. The user can re-enable a purchased option at anytime and a restore/format defaultsoperation performed on theinstrument itself will also enable allpurchased options. When the meteris in RT-60 mode, the RT-60,Exceedance, 1/1 Octave, and 1/3Octave options cannot be maskedand will not appear in the list. Whenthe meter is in FFT mode, the FFToption cannot be masked and willnot appear in the list.
The user can mask, or disable, any of the options installed inthe instrument. Click the Mask Installed Options button toopen the Options Mask window shown in FIGURE 3-113.
FIGURE 3-113 Option Mask
When the option is checked, it is enabled in the instrument.Unchecking removes the option. Click the boxes of alloptions which are to be masked, removing the check mark,and click the Upload Mask button.
3-86 System Tab SLM Utility-G3 Manual

The message shown in FIGURE 3-114 will appear toindicate that the upload has been successful.
FIGURE 3-114 Mask Options Loaded Message
You can quickly disconnect the meterfrom the SLM Utility-G3 software byclicking the Disconnect button, asshown below.
The meter must be rebooted for the changes to take effect.Click Yes to reboot the meter immediately. In this case theInstrument Manager will automatically attempt to reconnectafter rebooting.
If you click No, you will need to disconnect the meter fromthe program, reboot, and reconnect before the changes willtake effect. After reconnecting to the program, a prompt torestart the Instrument Manager will appear.
Firmware Upgrade
The instrument firmware can also beupgraded from the Manual Controltab as described in "Upgrade theInstrument" on page 3-46.
When upgraded firmware is available, or new options havebeen purchased, the user will be supplied with a file to beplaced on the PC. When the instrument is connected to thecomputer, the firmware upgrade process is initiated byclicking on the button labeled Upgrade Model 831 beneaththe “Installed Options” window.
Instrument Identification
Text for instrument identification purposes is entereddirectly into the three fields provided using the computerkeyboard.
SLM Utility-G3 Manual System Tab 3-87

Displays
Caution: each tab needs at least onetab to display.
The Displays sub-tab is displayed by clicking the Displayssub-tab on the System tab.
The Displays sub-tab allows the user to specify which tabthe instrument should display on startup. Also, the user maycustomize the tabs displayed as available on the instrument.
Because the tabs displayed are fixed for RT60 and FFTmodes, the Displays sub-tab will not be available if theinstrument is in RT60 or FFT mode.
FIGURE 3-115 System: Display
3-88 System Tab SLM Utility-G3 Manual

Pages/Startup Tab
The Pages and Startup Tab drop-downs provide access to thesame list of available tabs on the instrument. For the StartupTab, select which tab should be displayed first when theinstrument starts up. For the Pages, select a tab to displayand choose from all the pages available for the selected tab.
FIGURE 3-116 Tab Page/Startup Tab
Additional Displays
In addition to the pages available on the Live tab as shown in FIGURE 3-116, the following tabs and associated pages areprovided.
FIGURE 3-117 Pages on Overall
FIGURE 3-118 Pages on Session Log
SLM Utility-G3 Manual System Tab 3-89

FIGURE 3-119 Pages on Current
FIGURE 3-120 Pages on Measurement
FIGURE 3-121 Pages on Event
3-90 System Tab SLM Utility-G3 Manual

FIGURE 3-122 Pages on Time History
Reference Spectra
FIGURE 3-123 System: Reference Spectra
Requires optional firmware 831-OB3 or LxT-OB1 or LxT-OB3 to beenabled
The Reference Spectra sub-tab permits the user to editreference spectra already defined in the instrument and toupload these to the instrument following editing.
List can includefour 1/1 octavespectra (top four)and four 1/3 octavespectra (bottomfour)
SLM Utility-G3 Manual System Tab 3-91

Select Reference Spectrum
Click the number of the desired reference spectrum. If thatreference spectrum has been defined in the instrument, itwill be displayed graphically.
Edit Reference Spectrum
Click Edit to edit the selected spectrum. This will bring upthe dialog as shown in FIGURE 3-124.
FIGURE 3-124 Edit Reference Spectrum
Use the field in this table to define the name of the referencespectrum and to modify the spectrum levels for eachfrequency. Press OK to accept the changes and close thewindow.
Other (Model 831 only)
The Other sub-tab is displayed on the System tab.
The Logic I/O area provides access to the Logic In andLogic Out preferences. These preferences allow signals to bereceived from and/or sent to an external device such as the831-INT.
If your Model 831 is attached to a PRM2103 preamp, thePRM2013 area provides access for specifying heater states.See the PRM2103 Manual or Model 831 Manual for moreinformation on these settings.
3-92 System Tab SLM Utility-G3 Manual

.
FIGURE 3-125 Other Subtab
Logic In
Click the down arrow in the Logic In field to view optionsfor this setting, as shown in FIGURE 3-126.
FIGURE 3-126 Logic In
Logic Out
Click the down arrow in the Logic Out field to view optionsfor this setting, as shown in FIGURE 3-127.
FIGURE 3-127 Logic Out
PRM2103
If the Model 831 is attached to a PRM2103 preamp, clickthe Heater State down arrow to view options for thissetting, as shown in Figure 3-128.
SLM Utility-G3 Manual System Tab 3-93

FIGURE 3-128 PRM2103 Heater States
Communications (Model 831 only)
The Communications sub-tab on the System tab providesaccess to optional remote communication preferences asshown in FIGURE 3-129.
The Analog Modem Settings and RS-232 Settings groupsrequire the optional firmware 831-MDM be installed and theWireless Settings group requires the optional firmware 831-COMM be installed. If neither of these two optionalfirmware packages are installed, the Communications sub-tab will not be available on the System tab.
3-94 System Tab SLM Utility-G3 Manual

Also, to be able to edit these preferences, the instrumentmust be connected via USB or Internet and the USB HostPort preference must be enabled on the System sub-tabshown in FIGURE 3-109.
FIGURE 3-129 System: Communications
The preferences on the Communications sub-tab aredivided into four functional groupings as described below.
The optional USB analog modem(MDMUSB-A) is for use withstandard voice grade telephone lines(sometimes referred to as POTS forplain old telephone system) and willnot operate satisfactorily over VOIP(Voice Over Internet Protocol)telephone connections. The USBport must be enabled to use thefeatures on the optionalCommunications sub-tab.
Analog Modem Settings
FIGURE 3-130 Analog Modem Settings
SLM Utility-G3 Manual System Tab 3-95

When the meter is in RT-60 mode(see Chapter 7), only the RS-232Settings group will appear on theCommunications sub-tab.
RS232 Settings
FIGURE 3-131 RS-232 Settings
Wireless Settings
FIGURE 3-132 Wireless Settings
3-96 System Tab SLM Utility-G3 Manual

Clicking the Set SMS Options button displays the Set SMSOptions dialog, as shown in FIGURE 3-133. The SMSOptions preferences allow for SMS messages to be sent bythe instrument when a specific trigger condition is detected.Up to three trigger/phone number combinations may beconfigured.
FIGURE 3-133 SMS Options
Refer to the Model 831 Manual for details on settings andinformation for connecting a modem to a Model 831. Iffurther assistance is required, please contact PCB technicalsupport.
Network Settings
For Network Settings, specify the password for the networkin the Password field, as shown in Figure 3-134.
This password is only for 831-INT-ET connections.
FIGURE 3-134 Network Settings
SLM Utility-G3 Manual System Tab 3-97

Communications Watchdog
For more information on theCommunications Watchdog feature,see the Model 831 Manual or the831-INT Manual.
The Communications Watchdog option monitorscommunciation between the 831-INT and the Model 831. Ifno communication or data is received from the 831-INT bythe Model 831 within 5 minutes, the CommunciationsWatchdog feature will cause the Model 831 to shut downand restart.
WARNING! If disconnecting theModel 831 from an 831-INT,remember to disable theCommunications Watchdog feature ifyou are not reconnecting it.Otherwise the Model 831 will shutdown and restart every 5 minutes.
When the Model 831 is connected to the 831-INT, theCommunications Watchdog feature is automaticallyenabled. However, when removing the Model 831 from the831-INT, the feature is not automatically disabled, so youmust disable it if you are not reconnecting it to an 831-INT.
To enable or disable the Communications Watchdog,select or deselect the option, respectively, as shown inFigure 3-134.
Saving Preferences
To save a set of Preferences, press Save as shown in FIGURE 3-135.
FIGURE 3-135 Save Preferences
This will bring up the Save Configuration Menu shown in FIGURE 3-136.
FIGURE 3-136 Save Configuration Menu
3-98 System Tab SLM Utility-G3 Manual

Enter a name for this set of Preferences using the keyboardand click OK.
Recalling Preferences
To recall a previously stored set of Preferences, click thedown arrow to the right of the “Stored Preferences” field toopen a list of stored Preferences, as shown in FIGURE 3-137, and click the name of the desired setup to make aselection.
FIGURE 3-137 Recall a Set of Preferences Menu
The Preferences, Power/Lock, System, Display Menus,Reference Spectra, Other and Communications sub-tabswill now display the parameters corresponding to thisrecalled set of Preferences.
Deleting Preferences
To delete a stored set of Preferences, recall it as previouslydescribed and then delete it by clicking Delete, as shown in FIGURE 3-138.
FIGURE 3-138 Delete a Set of Preferences
SLM Utility-G3 Manual System Tab 3-99

Upload Preferences
To transfer preferences to the instrument, click the UploadPreferences button on the System tab, as shown in Figure 3-139.
t.
FIGURE 3-139 Upload Preferences
3-100 System Tab SLM Utility-G3 Manual

C H A P T E R
4 Data ViewThis chapter describes how to view sound level data in SLM Utility-G3.
Data View Menu Bar
Whenever a data file is downloaded from the instrument,imported from a USB thumb drive, or a saved data (.slmdl)file is opened, the data is presented to the user in a DataView. The initial display of the Data View will be asummary page appropriate to the mode (SLM, RA, FFT) theinstrument was in when the measurement was taken.
The Data View Menu Bar is shown in FIGURE 4-1.
FIGURE 4-1 Data View Menu Bar
The Data View Menu Bar is used to select which DataRecord to view as well as which page of the Data View todisplay. The Data Record is selected by clicking the DataRecord drop-down and selecting the desired record from thelist (a separate Data Record is created for each Data Fileincluded in the download). The buttons determine whichpage of the Data View to display.
•D1/D2: Selecting D1 and/or D2 will display the SLMSummary page with data and settings for Dose 1 (D1) and/orDose 2 (D2) in the Dose and Settings sections.
Display Summary
Time History
Event HistoryMeasurement History Data Records
SLM Utility-G3 Manual Data View 4-1

•TH: Selecting TH will display the Time History Summary.
The value “-99.9” in any summaryindicates an invalid value for thatparameter in the summary.
•EV: Selecting EV will display the Event History Summary.
•M: Selecting M will display the Measurement HistorySummary.
SLM Summary
When the Data View is first opened, the initial display willbe the SLM Summary page as shown in FIGURE 4-2
.
FIGURE 4-2 SLM Summary
Slight rounding differences canoccur between values measured anddisplayed on the instrument andthose downloaded and displayed onthe computer. This difference will inall cases be less than 0.1 dB.
The SLM Summary page of the Data View will displaysummary data for the currently selected Data Record. Thedata will be displayed in sections as described below.
4-2 SLM Summary SLM Utility-G3 Manual

General Information
The General Information section displays the file name,information concerning the instrument from which it wasdownloaded (i.e. serial number and model number), userinformation (User, Job Description and Location), start andstops times of the measurement, and calibration information.In the example presented here, the general information inputduring the download process was as shown in FIGURE 4-3.
FIGURE 4-3 SLM Summary: General Information
SLM Utility-G3 Manual SLM Summary 4-3

Edit of General Record Information
To edit the User, Job Description, Location, and Note fieldsof the SLM Summary, from the Main Menu click Options->General Information to display the General RecordInformation dialog as shown in FIGURE 4-4.
FIGURE 4-4 Edit of General Record Information
This is the same dialog as presented during the download ifthe Add General Record Information check box waschecked when the file was downloaded (see "DownloadTab" on page 3-58).
Note
The Note section, as shown in FIGURE 4-5, displays theinformation entered into the Note field of the GeneralRecord Information dialog as shown in FIGURE 4-4.
FIGURE 4-5 SLM Summary: Note
Overall Data
The Overall Data section reports the overall soundmeasurement data and sound exposure data, as well as the
4-4 SLM Summary SLM Utility-G3 Manual

date and time of the max and min values, measured duringthe runtime of this measurement.
FIGURE 4-6 SLM Summary: Overall Data
SLM Utility-G3 Manual SLM Summary 4-5

Statistics
The Statistics section reports statistical data measuredduring the runtime of this measurement.
FIGURE 4-7 SLM Summary: Statistics
Dose
The Dose section reports the measurement results related tonoise dose.
FIGURE 4-8 SLM S0ummary: Dose Data
Display of Dose Data
The SoundTrack LxT and the Model 831 (with optionalfirmware 831-IH installed) can measure two separate noisedoses using setup parameters which are selectedindependently. Dose related data is reported in both the Doseand Settings sections of the SLM Summary. The user canselect to report data related to Dose 1 and/or Dose 2 by
4-6 SLM Summary SLM Utility-G3 Manual

selecting the appropriate D1 and/or D2 buttons on the left ofthe Data View Menu Bar, as show in FIGURE 4-1. Whenboth buttons are selected, the Dose data will be displayedside by side as shown in Figure 4-8. When only one of theDose buttons is selected, the data for that Dose will bedisplayed in the same column as all other data.
Settings
Note that the displayed parametersassociated with noise dose representDose 1, Dose 2, or both, asdescribed in section "Display ofDose Data" on page 4-6.
The Settings section reports the value of certain settings ineffect at the time the measurement was taken.
FIGURE 4-9 SLM Summary: Settings
SLM Utility-G3 Manual SLM Summary 4-7

1/1 Spectra & 1/3 Spectra
The 1/1 Spectra and 1/3 Spectra sections display the OBAdata for full octave and third octave, respectively. Thesesections will only be displayed if the 1/1 and/or 1/3 OBABandwidth settings were selected for this measurement.
FIGURE 4-10 SLM Summary: 1/1 & 1/3 Octave Spectra
4-8 SLM Summary SLM Utility-G3 Manual

Weather
The Weather section reports the weather data accumulatedover the runtime of this measurement. This section will onlybe displayed if the Weather option was selected for thismeasurement.
FIGURE 4-11 Measurement Summary: Weather
Calibration History
The Calibration History section reports the last tencalibrations available on the meter at the time thismeasurement was stored. The calibrations are displayed indescending order by date with the most recent calibration atthe top of the list. This section will not be displayed if nocalibration histories are available.
FIGURE 4-12 SLM Summary: Calibration History
SLM Utility-G3 Manual SLM Summary 4-9

Optional Summary Pages
The Time History (TH), Event History (EV), andMeasurement History (M) summary pages are displayed byclicking the appropriate button on the Data View Menu Bar,as shown in FIGURE 4-1. These pages will only beavailable if the selected Data Record includes a TimeHistory, an Event History, and/or a Measurement History.
Time History Summary
The Time History Summary page will display the Record #,Date, Time, and the first six time history metrics selected foreach time history record included in the Data Record, asshown in FIGURE 4-13. To display all the time historymetrics, the Data Record must be exported (see Chapter 5"Export Data" on page 5-1).
FIGURE 4-13 Time History
4-10 Optional Summary Pages SLM Utility-G3 Manual

Event History Summary
The Event History Summary page will display the Record #,Date, Time, Duration, and the first five event history metricsselected for each event history record included in the DataRecord, as shown in FIGURE 4-14. To display all the eventhistory metrics, the Data Record must be exported (seeChapter 5 "Export Data" on page 5-1).
FIGURE 4-14 Event History
Measurement History Summary
The Measurement History Summary page will display theRecord #, Date, Time, Duration, and the first fivemeasurement history metrics selected for each measurementhistory record included in the Data Record, as shown inFIGURE 4-15. To display all the measurement historymetrics, the Data Record must be exported (see Chapter 5"Export Data" on page 5-1).
FIGURE 4-15 Measurement Data
SLM Utility-G3 Manual Optional Summary Pages 4-11

Printing a Summary
To print a summary page, select the desired summary in theData View and click the Print button on the Main Toolbar asshown in FIGURE 4-16, or select File->Print from the MainMenu, or press Ctrl-P on the keyboard. The default Printdialog will be displayed. After configuring the desired printoptions, click OK to complete the process.
A preview of the printed output may also be displayed byselecting File->Print Preview from the Main Menu.
FIGURE 4-16 Main Toolbar: Print
Saving a File
To save the file, click the Save button on the Main Toolbar,as shown in FIGURE 4-17, or select File->Save from theMain Menu, or press Ctrl-S on the keyboard. The defaultSave As dialog will be displayed. After selecting the desireddestination folder and filename, click Save to complete theprocess.
If the file has already been saved before, no Save As dialogwill appear and the existing file will be overwritten. To saveto a different location or filename, select File->Save As fromthe Main Menu.
FIGURE 4-17 Main Toolbar: Save
4-12 Printing a Summary SLM Utility-G3 Manual

Opening a Saved File
To open a saved file, click the Open button on the MainToolbar, as shown in 4, or select File->Open from the MainMenu, or press Ctrl-O on the keyboard. The default Opendialog will be displayed showing all files with the SlmUtility-G3 default extension of .slmdl. Files with an .slmdlextension are files that have been previously saved by SlmUtility-G3. Browse to the location of the desired file, selectit, and click Open to complete the process.
Slm Utility-G3 can also open files with a .ldbin extension.When files are downloaded from the instrument, a slm.ldbinfile is created that holds all the data files in a raw dataformat. Slm Utility-G3 then converts the slm.ldbin file intothe Data Records which are presented to the user in the DataView. To open a .ldbin file, click the file extension drop-down and choose Larson Davis binary files (*.ldbin). Thefile list will now show .ldbin files. To see both .slmdl and.ldbin files in the same location, select All Files (*.*) fromthe file extension drop-down.
FIGURE 4-18 Main Toolbar: Open
Importing Data From USB Memory
A detailed description of downloading data from the internalmemory of the instrument using the Instrument Managerwas presented in the section "Download Tab" on page 3-58.However, when using the Model 831, data can also be savedto a USB memory device.
SLM Utility-G3 Manual Opening a Saved File 4-13

To transfer data from a USB memory device into SlmUtility-G3, connect the USB memory device to the PC andselect File->Import from the Main Menu as shown inFIGURE 4-19.
FIGURE 4-19 File Menu
4-14 Importing Data From USB Memory SLM Utility-G3 Manual

This will display the Open File dialog shown in FIGURE 4-20.
FIGURE 4-20 Open File
Click the down arrow in the “Look in:” window to open themenu shown in FIGURE 4-21.
FIGURE 4-21 Open File Browser
831 Data Files
SLM Utility-G3 Manual Importing Data From USB Memory 4-15

The 831 data files will be located in the 831_Data folder inthe Removable Disk. Click the folder to display the 831 datafiles, as shown in FIGURE 4-22.
FIGURE 4-22 Open File with 831 Data Files
If importing data from a USB flashdrive, do not modify the file structureof the imported data on your PChard drive.
Select the data file(s) you wish to import and click the Openbutton to begin the process. The data file will be translatedinto a Data Record and presented to the user in the DataView, as described at the beginning of this chapter.
4-16 Importing Data From USB Memory SLM Utility-G3 Manual

Closing the Data View
To close the Data View, click the Close button (red X) at topright corner. If the downloaded file has not yet been saved, aprompt to save message will be displayed as shown inFIGURE 4-23. Click Save to save the file as outlined in"Saving a File" on page 4-12, click No to close withoutsaving, or click cancel to cancel the close operation.
FIGURE 4-23 Prompt to Save
Measurement Log
The Measurement Log displays the Record Type, Cause, andDate/Time of each Session log event.
To open the Measurement Log, click the Measurement Logbutton on the Main Toolbar, as shown in FIGURE 4-24. Thiswill display the Measurement Log dialog as shown inFIGURE 4-25.
FIGURE 4-24 Toolbar: Measurement Log
SLM Utility-G3 Manual Closing the Data View 4-17

FIGURE 4-25 Measurement Log
If the Measurement Log contains a record with a missingsound recording file, the record icon is displayed as shownin Figure 4-26.
FIGURE 4-26 Missing Sound Recording File
Voice Annotation and Audio Recording
Playback
Note: the default media playerassociated with .wav files inWindows will be used to play thesound recordings
All sound recordings, including Voice Annotations, in theMeasurement Log will be indicated by a speaker icon in theleft most column of the display, as shown in FIGURE 4-25.To listen to any given sound recording, click the speaker
4-18 Measurement Log SLM Utility-G3 Manual

icon for that recording. The recording will be converted to atemporary .wav file and passed to Windows for playback.
Alternative Playback Method
In the section "Saving an Audio Record as a Wave File" onpage 4-19, it can be seen that there is an option Play inaddition to saving the audio records. Clicking Play will alsoplayback the selected audio record.
Amplify Sound Record
Note that the fixed scale factor willbe lost when the amplify feature isutilized.
When playing back low level voice annotations and soundrecordings, if you wish to amplify the output level, check the“Amplify sound record” check box. This will apply a fixedgain to the audio playback only and will not alter the originalsound record.
Saving an Audio Record as a Wave File
To save any audio recording as a wave file, right-click thespeaker icon for the desired record to display the popupmenu as shown in FIGURE 4-27. Select Save audio recordas .wav file and the Windows standard Save As dialog box
SLM Utility-G3 Manual Measurement Log 4-19

will be displayed. Select the desired destination folder andfilename and click Save to complete the process.
FIGURE 4-27 Save Audio Records as Wave Files
Saving All Audio Records as Wave Files
To save all audio recordings as wave files, on the popupmenu, as shown in FIGURE 4-27, select Save all audiorecordings as .wav files. Now select the desired destinationfolder and base filename (default is the name of the currentData Record) in the Windows standard Save As dialog andclick Save to continue. At this point, all sound recordings inthe current Data Record will be saved as a .wav file in theselected destination folder. Each sound recording will begiven a unique name using the following format:
<basename>.<type>X_<datetime>.wav where <basename>is the filename selected on the Save As dialog, <type> iseither SOUND or VOICE, X is the sequential number of the<type> of recording, and <date/ time> is the Date/Time therecording was made.
4-20 Measurement Log SLM Utility-G3 Manual

C H A P T E R
5 Export DataThis chapter describes how Slm Utility-G3 can export measurement data to a text file, a CSV file, or to an Excel Workbook for further processing and reporting.
Exporting Measurement Files
Excel 2003 or later is required for anExcel export. Excel 2010 is requiredfor full support of an FFT export.
Begin by selecting the Data Record for the measurement youwish to export.
FIGURE 5-1 Data View: SLM Measurement Summary
SLM Utility-G3 Manual Export Data 5-1
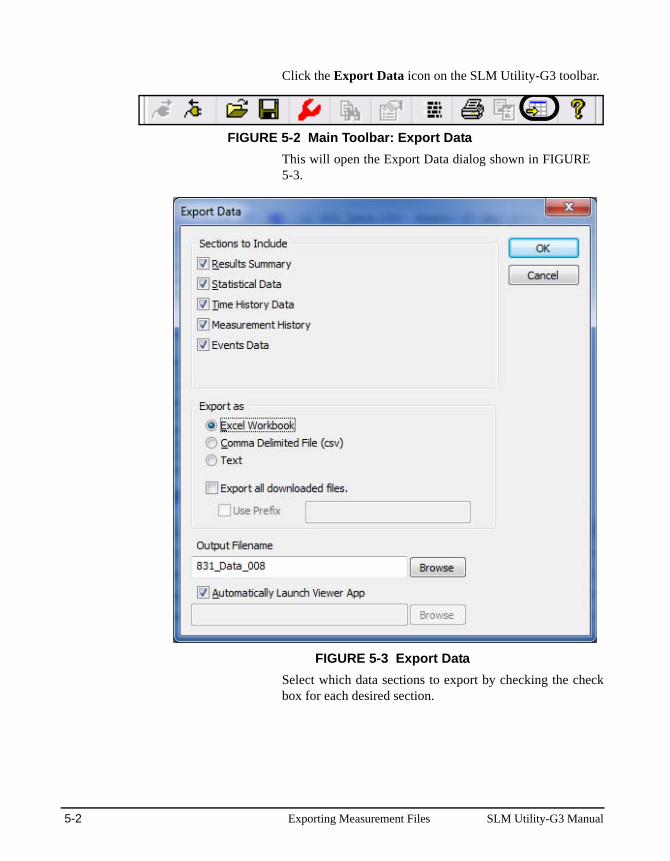
Click the Export Data icon on the SLM Utility-G3 toolbar.
FIGURE 5-2 Main Toolbar: Export Data
This will open the Export Data dialog shown in FIGURE5-3.
FIGURE 5-3 Export Data
Select which data sections to export by checking the checkbox for each desired section.
5-2 Exporting Measurement Files SLM Utility-G3 Manual

Select Export Format
Text files are typically used to exportdata to word processing programs.Comma-delimited files are used toexport data to spreadsheetprograms.
The data may be exported in one of three formats:
• Excel Workbook (Excel 2003 or later required)
When exporting to Excel, each section selected for exportwill be exported to a separate worksheet. Note that Excel2003 is limited to 256 columns and 65,536 rows. For thisreason, any data section that exceeds 65,000 rows will besplit into multiple worksheets (this is most common withTime History records with a very fast sample period).
You must close any open Excel filesbefore exporting to Excel. If an Excelfile is open, a warning will appearindicating that the export cannotproceed until the file is closed.
• Comma Delimited File (csv)
The CSV export will export all selected sections into asingle file, using the comma (,) as the field delimiter. Whenexporting on a PC with locale settings that use the comma asthe decimal separator, a semi-colon (;) will be used as thefield delimiter instead.
• Text
When the Text format is selected, the Field Delimiter drop-down will appear, as shown in FIGURE 5-4, allowing theuser to specify a comma (,), a pipe (|), or a (tab) as the fielddelimiter. In all other respects, the resulting output file is thesame as a CSV export.
FIGURE 5-4 Field Delimiter, Text File Export
Export All Files
If more than one Data Record exists in the Data View, theuser may export all Data Records at once by checking theExport all downloaded files check box. In this case, theOutput Filename will be automatically generated from the
SLM Utility-G3 Manual Exporting Measurement Files 5-3

Data Record name. An optional prefix may be used bychecking the Use Prefix check box and entering the prefix inthe edit field.
Export the File
Press OK in the upper right corner to implement the exportof the file.
In many instances, the user wants to examine the exportedfile, and possibly use it immediately for further processing.For this reason, the option to automatically launch theviewer application is provided in the Export File Menu. Thisfeature is described in the following section.
Date Formats for CSV and Text Files
When exporting to a csv or text file and the instrument’s date format is dd/mm/yyyy, the warning message shown in FIGURE 5-5 will appear, asking if you want to convert to the yyyy/mm/dd format
because this format is more universally recognized and is less likely to have conversion problems.
FIGURE 5-5 Date Format Conversion Message
Automatically Launch Viewer Application
If “-99.9” appears in an exporteddata field, it represents an invalidvalue for the field.
To automatically launch an application to view the exporteddata, check the Automatically Launch Viewer App checkbox. By default, this will launch the system definedapplication for each extension type (i.e. Excel for Excel(.xls) and CSV (.csv) and Notepad for Text (.txt) formats)when the export is finished. The user may also specifywhich application to launch for CSV (.csv) and Text (.txt)exports.
5-4 Exporting Measurement Files SLM Utility-G3 Manual

C H A P T E R
6 Remote ConnectionThe Remote Connection option is used to communicate with a Model 831 at a remote location via wireless modem, analog modem, or the internet.
Initiating a Remote Connection
The proper settings for remotecommunications must be set in boththe instrument and in Slm Utility-G3software before initiating a remoteconnection. See the instrumentmanual and "Communications(Model 831 only)" on page 3- 94 ofthis manual for further information.
To initiate a remote connection, click Connection on themain menu bar, highlight Remote to show the sub-menu,then click the desired connection type as shown in FIGURE6-1.
FIGURE 6-1 Remote Connection Menu
During the same session whenworking with the SLM Utility-G3,the connection preference will beremembered. Clicking on theConnect Icon will bring up the lastused connection method.
For a remote connection to succeed, the remote instrumentmust be configured to accept a connection using theconnection type selected. Only one remote connection typemay be active on the instrument at any given time.
SLM Utility-G3 Manual Remote Connection 6-1

Wireless Connection
When choosing the Wireless connection type, the RemoteSites dialog will be displayed as shown in FIGURE 6-2.
FIGURE 6-2 Remote Sites
Slm Utility-G3 connects to a Model 831 via wireless modemby sending an SMS message to the instrument, opening aTCP/IP socket on the PC, and then waiting for the incomingconnection request from the instrument. The SMS messageconsists of a specially formatted string which contains the IPaddress and port number. When the instrument receives theSMS message, it will initiate a TCP/IP connection request tothe IP address and port number specified in the SMSmessage.
6-2 Wireless Connection SLM Utility-G3 Manual

Step 1 Select which SMS mode to use.
Step 2 Fill in the address field with the email address provided by the cellular provider. This will typically be in the form of <phone number of wireless modem>@<some domain defined by the carrier>. This field will be disabled if sending an SMS manually.
Step 3 Select the COM port of the wireless modem attached to the G3 computer. This field will only be enabled when sending an SMS via a wireless modem attached to the PC.
Step 4 Enter the public IP address of your PC. To determine the IP address to use, visit www.canyouseeme.org or contact your network administrator.
Step 5 Enter a valid Port number for TCP/IP communication. Please make sure that the port is not blocked by firewalls. Also note that if you are using a cellular modem to connect to internet on the PC side make sure that the cellular provider does not do port blocking. The port number used must be greater than 1023 and less than 65536.
Step 6 Enter a timeout, in seconds, for the connection request to complete. The time required varies based on cellular and internet traffic volumes at the time of the request. A timeout of 5 minutes (300 seconds) is suggested as a starting point.
Step 7 Finally, enter the password which is set in the Model 831 and click OK.
Implementing the Connection
There are three ways to send the SMS message: via e-mail,via an attached wireless modem, or manually. Select theSMS mode by clicking the appropriate radio button in theSelect SMS mode section of the dialog as shown in FIGURE6-2.
SLM Utility-G3 Manual Wireless Connection 6-3

Send via Wireless Modem
To send via wireless modem, the PC running Slm Utility-G3must have a wireless modem attached and correctlyconfigured. Select Send SMS via wireless modem radiobutton and fill out the remainder of the dialog, shown inFIGURE 6-3. Select the appropriate COM port for theattached wireless modem from the second drop down listand all other entries are the same as for the e-mail option.
FIGURE 6-3 Send SMS via Wireless Modem
6-4 Wireless Connection SLM Utility-G3 Manual

Send Manually
The manual option requires that the SMS message is sentexternally from G3 (i.e. via cell phone or web page). G3 willopen the TCP/IP port and wait for the incoming connectionrequest, as shown in FIGURE 6-4, but will not generate orsend an SMS message internally.
FIGURE 6-4 Send SMS Manually
The body of the SMS message must be in the followingformat:
IPP<IP address>:<port>IPP
Using FIGURE 6-4 as an example, the correct SMS messageto send would be: IPP209.253.32.227:19576IPP.
SLM Utility-G3 Manual Wireless Connection 6-5

How to Choose Which Method to Use:
Send SMS via email (recommended solution)
Why Why Not
Most inexpensive solution and uses existing internet connection.
Not Automated
SMS messages are limited to160 characters. In some company settings, automatic text is added to all outgoing emails, which makes the SMS messages too large. Some providers will then break the message into smaller pieces and then send multiple SMS messages to the internet. In this instance, the 831 will reassemble the SMS message.
However some providers will not send the actual message, but rather a link to the message, thus rendering the SMS message with the connection unavailable to the instrument.Under these conditions you must send the message manually using a non-company email system or by using a cell phone to send the SMS directly to the instrument.
Send SMS via wireless modem
Why Why Not
Ease of use additional modem and SIMM card required.
Cellular service provider may only support MMS via email.
6-6 Wireless Connection SLM Utility-G3 Manual

Send SMS Manually (Least desirable solution, intended only for testing pur-poses
Why Why Not
Can send messages from cell phone Not Automated
Most difficult and time consuming
SMS messages are limited to160 characters. In some company settings, automatic text is added to all outgoing emails, which makes the SMS messages too large. Some providers will then break the message into smaller pieces and then send multiple SMS messages to the internet. In this instance, the 831 will reassemble the SMS message.
However some providers will not send the actual message, but rather a link to the message, thus rendering the SMS message with the connection unavailable to the instrument.Under these conditions you must send the message manually using a non-company email system or by using a cell phone to send the SMS directly to the instrument.
SLM Utility-G3 Manual Wireless Connection 6-7

Analog Modem Connection
When choosing the Modem connection type, the Connect toAnalog Modem dialog box will be displayed, as shown inFIGURE 6-5.
FIGURE 6-5 Connect to Analog Modem
Step 1 Enter the remote site telephone number.
Step 2 Select local modem port number. When the “Connect using TAPI” check box is not checked, select the appropriate COM Port to which the modem is connected. When the check box is checked, the menu will list only TAPI (Telephony API) enabled services attached to the PC.
Step 3 Select the Baud Rate.
Step 4 Enter the numeric password that was used in Model 831 and click CONNECT.
6-8 Analog Modem Connection SLM Utility-G3 Manual

Internet Connection
When choosing the Internet connection type, the RemoteInternet Site dialog is displayed as shown in FIGURE 6-6.
If you enter a valid host name, the IPaddress is automatically looked up.
FIGURE 6-6 Remote Internet Site
The IP address and Port number areconfigured in the 831 INT-ET. Pleaserefer to the 831 INT-ET manual formore information.
Step 1 Enter the host name or IP address assigned to the remote 831 INT-ET.
Step 2 Enter the Port number assigned to accept incoming connection requests and click Connect.
Step 3 Enter the network settings password. This should correspond to the password entered on the Communications sub-tab of the System tab of the Instrument Manager.
Step 4 Selct the Timeout period.
Step 5 Click Connect.
SLM Utility-G3 Manual Internet Connection 6-9

6-10 Internet Connection SLM Utility-G3 Manual

C H A P T E R
7 RT-60RT-60, or Reverberation Time, is a measurement of the time a sound takes to decay 60 dB from its initial sound pressure level.
This chapter covers the changes in Slm Utility-G3 when connected to an instrument in RT-60 mode.
Accessing RT-60 Mode
Note that RT-60 mode is onlyavailable if the optional firmware831-RT has been installed.
When using Slm Utility-G3 software, the mode of the Model831 can be changed through the Manual Control page of theInstrument Manager. To change to RT-60 mode, press theRT-60 mode button in the Mode Control section as shown in FIGURE 7-1.
FIGURE 7-1 Manual Control: RT-60 Mode
SLM Utility-G3 Manual RT-60 7-1

Settings Page
This section describes the settings available when SLMUtility-G3 is connected to an instrument in RT-60 mode.These settings are used to configure the instrument for anRT-60 measurement. For a complete description of theSettings page, please refer to the Settings Page section ofChapter 3 "Settings Tab" on page 3-5.
FIGURE 7-2 Settings
7-2 Settings Page SLM Utility-G3 Manual

Instrument Settings
The RT-60 settings are distributed over three sub-pages asfollows:
General
FIGURE 7-3 Settings: General
The General sub-page has the following settings:
Project Name: This will be the default name when storing afile.
Measurement Description: Up to 63 characters can be usedto describe the measurement.
Exit Time: The amount of time after RUN has been presseduntil the Model 831 begins to gather data. This time shouldbe used to exit the room prior to the measurement.
Lowest Band/Highest Band: These two settings define therange of filters over which the reverberation time iscomputed.
SLM Utility-G3 Manual Settings Page 7-3

RT-60
Note: When the method is set toImpulse, the Build Time setting is notenabled.
The settings on the RT-60 sub-page define how the sounddecay will be measured. Some settings are enabled/disabledbased on the method chosen.
Interrupted Method
FIGURE 7-4 Settings: RT-60 (Interrupted Method)
OBA Bandwidth: Select measurement bandwidth,1/1 or 1/3 octave.
Method: The method of measurement, either Impulse orInterrupted Noise.
Note: The Trigger Source frequencyrange will be limited to be betweenthe Lowest and Highest filters(inclusive) as set on the General sub-page shown in FIGURE 7-3.
Trigger Source: Allows the user to select which filteroutput to use as the trigger source when making ameasurement and can be:• Z-weighted.• Mid-Band: equivalent energy of 500 Hz to 2 kHz filters,inclusive.
7-4 Settings Page SLM Utility-G3 Manual

• A single 1/1 or 1/3 octave filter, based on the bandwidthselected.
Trigger Level: The signal level at which a reverberationtime measurement is triggered. When using the Impulsemethod, data acquisition is triggered when the rising soundlevel exceeds the configured Trigger Level. When using theInterrupted Noise method, data acquisition is triggered whenthe decaying sound level drops to 5 dB below the configuredTrigger Level.
Count: Indicates the number of successive reverberationtime measurements to take at a position. Once themeasurement is started by pressing RUN, the Model 831will begin making the measurement and automatically stopwhen the configured count has been reached.
Sample Rate: Sets the time interval between samples of thesound decay curve.
Build Time: Build time is available when the method is setto Interrupted Noise. The Build Time is the time the noiselevel must be above the configured Trigger Level tosufficiently energize the room. For example, if the BuildTime is set to five seconds, the sound source will be on forfive seconds plus the time it takes for the sound level toreach the trigger level.
Run Time: Sets the post trigger run time. The maximumvalue is dependent upon the Sample Period as indicated inTable 7-1.
Table 7-1 Max Run Time vs Sample Period
OBA Range: For most reverberation time measurements,the OBA Range will be set to Normal. Low would be usedwhen the range of the measurement remains near the noisefloor of the filters.
+20 dB Range: Should only be used for Interrupted Noisesince impulses can quickly exceed 120 dBZ.
Sample Period (ms) Max Run Time (s)
20 19
10 18
5 9
2.5 4
SLM Utility-G3 Manual Settings Page 7-5

Source
The settings on the Source sub-page are only available whenthe Interrupted method is selected on the RT-60 sub-page.For the Impulse method, an external noise source (i.e. startergun, balloon, etc.) is used so these settings do not apply.
FIGURE 7-5 Settings: Source (Interrupted Method)
RT-60 Noise: The signal used to energize the room can begenerated by an external sound source or using the internalnoise source of the Model 831. If using an external source,select "Off". If using the internal noise source, select"White" or "Pink" noise. The Model 831 outputs the noisesignal via the AC output connector. An external amplifierand speaker system are needed to sufficiently energize aroom.
Attenuation: This is used to reduce the output signal fromthe Model 831 in instances where the level might overloadthe amplifier input.
7-6 Settings Page SLM Utility-G3 Manual

Setup Manager
For additional information on the use ofthe Setup Manager, see Setup Manageron page 3-34.
The Setup Manager allows transferring user-definedmeasurement setups stored on the instrument to the PC andvice versa.
Notice that three default RT-60 setups are provided forconfiguring the instrument to perform RT-60 measurementsusing the Impulse and Interrupted methods as shown in FIGURE 7-6.
FIGURE 7-6 Setup Manager
SLM Utility-G3 Manual Settings Page 7-7

Data View
The Data View is displayed to the user whenever a data fileis downloaded from the instrument, Imported from a USBthumb drive, or a saved data (.slmdl) file is Opened. Theinitial display of the Data View will be a Summary of thefirst Data Record and is fully described in Chapter 4,beginning on page 4-1.
This section will describe the Data View for a RT-60Summary as shown in FIGURE 7-7.
FIGURE 7-7 Data View: RT-60 Summary
Please refer to Chapter 4 for a description of any sections notexplicitly described here.
RT-60 Ensemble
The RT-60 Ensemble section, shown in FIGURE 7-8displays the selected T20 or T30 Ensemble Average of allincluded decay measurements.
7-8 Data View SLM Utility-G3 Manual

FIGURE 7-8 RT-60 Summary: RT-60 Ensemble
Freq. (Hz): The range of frequencies over which the decaytime is measured. Displayed in either 1/1 or 1/3 octavebands as determined by the Bandwidth setting as shown in FIGURE 7-4 and may also be limited by the Lowest Band/Highest Band filter setting as shown in FIGURE 7-4.
Leq: Computed as the Leq between the initial exceedance ofthe trigger level to when the signal falls below the triggerlevel minus 5 dB, displayed in dB for each frequency.
Lmax: The maximum value of the time history at eachfrequency, displayed in dB.
Lbk: The background level measured for each frequency,displayed in dB.
T20 (T30): The T20, or T30 decay time for each frequency,displayed in milliseconds.
BT: The product of the filter bandwidth and the T20 or T30decay time for each frequency.
BK: A measure of the dynamic range between the excitationsignal and the background noise level, displayed in dB foreach frequency.
NL: The degree of non-linearity of the T20 or T30 portionof the decay curve, and is reported as permillage (parts perthousand) deviation from perfect linearity for eachfrequency.
SLM Utility-G3 Manual Data View 7-9

Cu: The degree of curvature, and is a comparison of the T20and T30. Cu is expressed as the percentage deviation frombeing perfectly in-line for each frequency.
SD: The standard deviation of the measurement results forthe T20 or T30 decay times, displayed as a percentage foreach frequency.
The Quality Indicators (BT, BK, NL, Cu, & SD) aredisplayed with Green, Yellow, or Red backgrounds toindicate Good, Fair, or Poor, respectively. Please refer toTable 7-2 below and the Quality Indicators section of theModel 831 Technical Reference Manual for a completedescription and the associated criteria for each QualityIndicator.
Table 7-2 Quality Indicator Criteria
Green =Good Yellow =Fair Red =Poor
>16 NA ≤ 16BK ≥ 35 dB (T20)
≥ 45 dB (T30)NA < 35 dB (T20)
< 45 dB (T30)
NL ≤ 5% 5‰ < NL ≤ 10% > 10%Cu 0%≤ Cu ≤ 5% 5% < Cu ≤ 10%
-5% < Cu < 0%> 10%≤ -5%
SD ≤ 5% 5% < SD ≤ 10% > 10%
7-10 Data View SLM Utility-G3 Manual

RT-60 Measurement Grade
The RT-60 Measurement Grade section, shown in FIGURE7-9, displays the estimated Accuracy Grade of thismeasurement as described in ISO 3382-2(2008).
FIGURE 7-9 RT60 Summary: RT-60 Measurement Grade
Estimated Grade: The model 831 reports three methods ofdiffering measurement uncertainty as described in ISO3382-2:2008(E). The grades are Precision, Engineering, andSurvey. If the measurement settings preclude achieving oneof the uncertainty grades described, “Settings Conflict” willappear in this field. This usually means that the LowestBand and/or Highest Band setting were outside of therequired range for all grades. Refer to Table 7-3 below andISO 3382-2:2008(E) for a complete description of theuncertainty grade criteria.
Frequency Range: The frequency range used for thismeasurement.
• Actual: The actual frequency range for this measurementdetermined by the Lowest Band/Highest Band settings.
• Required: The required frequency range for the estimatedgrade.
SLM Utility-G3 Manual Data View 7-11

Positions: The number of positions used in themeasurement.
• Actual: The actual number of times the RUN button waspressed.
• Required: The required number of positions for theestimated grade.
Decays/Positions: The number of decays measured at eachposition.
• Actual: The minimum number of decays across allpositions that meet the estimated grade requirements. Thiswill usually be the same as the Count setting but may befewer if some decays have been excluded.
• Required: The required number of decays at each positionfor the estimated grade.
Total Positions: Total number of positions.
Position: A list of each position.
Decays: The number of included decays at each position.
Table 7-3 Minimum Number of Positions and Measurements
Survey Engineering Precision
Source-microphone combinations 2 6 12
Source-positions 1 2 Microphone-positions 2 2 3
No. decays in each position (interrupted noise method)
1 2 3
Method Impulse orInterrupted
Interrupted Interrupted
Filter bandwidth 1/1 1/1 or 1/3 1/1 or 1/3
Frequency Range (minimum) 250 Hz to 2 kHz 125 Hz to 4 kHz (1/1)100 Hz to 5 kHz (1/3)
Standards ISO 10052 ISO 140
7-12 Data View SLM Utility-G3 Manual

OBA
The OBA section is displayed in FIGURE 7-10.
FIGURE 7-10 RT-60 Summary: OBA
# OBA Overloads: The number of OBA overloads thatoccurred during this measurement.
OBA Overload Duration: The total duration of all OBAoverloads.
1/1 OBA Under Range: This table shows the Z Weightingunder range value and the Noise Floor value for eachfrequency.
Settings
The Settings section, shown in FIGURE 7-11, displays theactive settings used for this measurement.
FIGURE 7-11 RT-60 Summary: Settings
SLM Utility-G3 Manual Data View 7-13

Exporting Data
When exporting RT-60 data, the Export Data dialog willappear as shown in FIGURE 7-12.
FIGURE 7-12 Export Data: RT-60
Note: The RT60 Detail Time Seriessheet is automatically included whenRT60 Detail is selected AND theSave All Time Series control optionwas enabled when the measurementswere made.
When exporting to an Excel Workbook, the RT60 data willbe exported to the selected worksheets.
7-14 Exporting Data SLM Utility-G3 Manual

Summary Sheet
The Summary sheet will contain the same information as theData View with the exception that the RT-60 Ensemblesection will display both T20 and T30 data. A samplescreenshot is shown in FIGURE 7-13. Please refer to theData View section of this chapter for a complete description.
FIGURE 7-13 RT-60 Export Summary Sheet
RT-60 Detail Sheet
The RT-60 Detail sheet will display an RT-60 detail(including both T20 and T30 data) of each decay capturedover the entire measurement. A sample screenshot is shownin FIGURE 7-14. Additionally, each decay record willindicate if an Overload was detected (Yes/No) and whetheror not the decay is excluded from the Ensemble average (anX in the Exclude column indicates it is excluded).
SLM Utility-G3 Manual Exporting Data 7-15

FIGURE 7-14 RT60 Export: RT60 Detail sheet
Ensemble RT60 Time Series Sheet
The Ensemble RT-60 Time Series sheet will display aspectra by time table of all of the decays captured during thismeasurement. The data from any decays excluded from theensemble will not be included.
RT-60 Detail Time Series Sheet
The RT-60 Detail Time Series sheet will show a spectra bytime table for each individual decay captured during thismeasurement. All decays will be shown, whether excludedor not.
7-16 Exporting Data SLM Utility-G3 Manual

C H A P T E R
8 FFT
The optional FFT mode provides signal analysis using a Fast Fourier Transform. This chapter describes SLM Utility-G3 functionality when connected to an instrument in FFT mode.
Accessing FFT Mode
FFT mode is only available if theoptional firmware 831-FFT has beeninstalled on the Model 831.
When using Slm Utility-G3 software, the mode of the Model831 can be changed through the Manual Control page of theInstrument Manager. To change to FFT mode, click the FFTmode button in the Mode Control section as shown in FIGURE 8-1.
FIGURE 8-1 Manual Control: FFT Mode
After clicking a mode change button, the Mode ChangeWarning dialog box will appear. Click Yes to continue withthe mode change, which will close and re-open theInstrument Manager in FFT mode. Click No to cancel themode change.
Settings Page
This section describes the settings available on the Settingspage when SLM Utility-G3 is connected to an instrument inFFT mode. These settings are used to configure the
SLM UTIL-G3 Manual Accessing FFT Mode 8-1

instrument for an FFT measurement. For a completedescription of the Settings page, please refer Chapter 3"Settings Tab" on page 3-5.
When first displayed, the Settings page will display thecurrent instrument settings. Settings can be changed andsaved to the meter by clicking the Upload Settings button orto a file by clicking Save. (For a complete description of theSetup Manager, and how to Save, Delete, and/or Recallsaved Setups, please refer to the appropriate section ofChapter 3.)
Instrument Settings
The FFT settings are distributed over two sub-pages asfollows:
General
The General sub-page has the following settings:
• Project Name: This will be the default file name whenstoring a file.
• Measurement Description: Up to 63 characters can beused to describe the measurement.
FFT
The FFT sub page, as shown in FIGURE 8-2, providesaccess to settings that define the parameters of an FFTmeasurement. The Count and Time settings will be enabledor disabled based on the Run Mode setting, as describedunder Run Mode on page 8-6.
8-2 Settings Page SLM UTIL-G3 Manual

FIGURE 8-2 Settings: FFT
SLM UTIL-G3 Manual Settings Page 8-3

For more information on FFTsettings, see the “FFT and Tonality”chapter in the Model 831 manual.
Frequency Span: defines the upper end of the frequencyresponse. Choices range from 100 Hz to 20 kHz as shown in FIGURE 8-3.
FIGURE 8-3 Frequency Span
Lines: defines the number of discrete frequency bands.Choices range from 400 to 6400 as shown in FIGURE 8-4.
FIGURE 8-4 Lines
Window: selects a window to provide emphasis or balancebetween frequency selectivity and amplitude ripple as thefrequency varies from one bin to another. Choices are shownin FIGURE 8-5.
FIGURE 8-5 Window
Frequency Weighting: A broadband Leq and Lpeak levelwill be measured using this weighting as well as beingapplied to the FFT spectrum.
8-4 Settings Page SLM UTIL-G3 Manual

For more information on measuringtonality with the Model 831, see theFFT chapter in the Model 831manual.
ISO 1996-2: enables 1996-2 Annex C tonalitymeasurements while in FFT mode.
Tone Seek Delta: determines noise pauses in yourmeasurement, as described in ISO 1996-2 C.4.2. The defaultis 1 dB.
For more information on selecting aregression range, see ISO 1996-2section C.4.
Regression Range: determines masking noise, as describedin ISO 1996-2 C.4.4.The percentage selected reflects the +and - range of the critical bandwidth to the right and left ofthe center frequency. For example, selecting 75% results ina range that is 75% to both the left and right of the centralfrequency.
Run Mode: this setting determines how a measurement isterminated and how history records are accumulated. Thethree run modes are described below:
• Manual Stop: a measurement begins when the userpresses RUN and ends when the user presses STOP. Ifmeasurement history is enabled, a history record will becreated with each STOP. Each RUN/STOP is considereda measurement and the overall data will include allsamples from all measurements.
• Count Stop: a measurement begins when the userpresses RUN and ends when the number of discrete FFTcalculations equals the Count setting. If measurementhistory is enabled, a history record will be created whenCount is fulfilled. A measurement may be terminatedearly by pressing STOP.
• Timed Stop: a measurement begins when the userpresses RUN and continues until the elapsed run timeequals the Time setting. If measurement history isenabled, a history record will be created each time theCount setting is reached. A measurement may beterminated early by pressing STOP.
Count: this setting defines the number of discrete FFTcalculations desired for each measurement and is used forCount Stop and Timed Stop run modes. This setting isdisabled for Manual Stop run mode. There is a minimumcount value based on the Frequency Span selected as shownin Table 8-1.
SLM UTIL-G3 Manual Settings Page 8-5

Table 8-1 Minimum Count
Time: this setting defines the run time desired to complete ameasurement when the run mode is set to Timed Stop. Thissetting is disabled for Count Stop and Manual Stop runmodes.
FFT Measurement History: when checked, this setting willenable the storing of FFT Measurement History records witheach measurement over time.
Range: this setting, in conjunction with the +20 dB Gainsetting, determines the amplitude measurement range of theFFT as shown in Table 8-2.
+20 dB Gain: this setting, in conjunction with the Rangesetting, determines the amplitude measurement range of theFFT as shown in Table 8-2.
Table 8-2 Range and Gain
Frequency Span
Minimum Count
20 kHz 20
10 kHz 10
5 kHz 5
2 kHz 2
1 kHz 1
500 Hz 1
200 Hz 1
100 Hz 1
+20 dB Gain Off +20 dB Gain On
Normal 143 dB peak maxi-mum
123 dB peak maximum
Low 110 dB peak Maxi-mum
90 dB peak maximum
8-6 Settings Page SLM UTIL-G3 Manual

Data View
The Data View is displayed whenever a data file isdownloaded from the instrument, Imported from a USBthumb drive, or a saved data (.slmdl) file is Opened. Theinitial display of the Data View will be a Summary of thefirst Data Record and is described in Chapter 4 "Data View",beginning on page 4-1.
This section will describe the FFT Summary for FFT data asshown in FIGURE 8-6.
FIGURE 8-6 Data View: FFT Summary
Please refer to Chapter 4 "Data View" on page 4-1, for adescription of any sections not explicitly described here.
SLM UTIL-G3 Manual Data View 8-7

Settings
The Settings section, shown in FIGURE 8-7, will displaythe active settings used for this measurement.
FIGURE 8-7 FFT Summary: Settings
Overall Broadband Data
The Overall Broadband Data section, shown in FIGURE 8-8, will display the broadband Leq, Lmax, Lmin, and Lpeakvalues recorded during this measurement. The values will beweighted according to the frequency weighting setting. Theoverload level, count, and duration, for both broadband andFFT, will also be displayed in this section.
FIGURE 8-8 FFT Summary: Overall Broadband Data
8-8 Data View SLM UTIL-G3 Manual

FFT Graph
To display a graph of the FFT measurement, click the Graphbutton on the Data View Toolbar as shown in FIGURE 8-9.
FIGURE 8-9 Data View Toolbar: Graph
A new window will pop up showing a graphicalrepresentation of the FFT data as shown in FIGURE 8-10.
FIGURE 8-10 FFT Graph
You can customize the FFT graph by double-clicking it or byclicking the Graph Properties Customization button and then
Data Legend
Measurement DataTable
FFT TonalityToggle
Cursor
Graph Display Options
Graph Properties Customization Button
SLM UTIL-G3 Manual Data View 8-9

specifying attributes in the Customize dialog box, as shownin Figure 8-11.
FIGURE 8-11 Customize Graph
Tonality Data View
To view the tonality data of the FFT measurement, click theFFT Tonality icon on the toolbar, as shown in Figure 8-12.
FIGURE 8-12 FFT Tonality Icon
8-10 Data View SLM UTIL-G3 Manual

The FFT Tonality dialog box appears, as shown in Figure 8-13.
FIGURE 8-13 FFT Tonality Dialog Box
In this dialog box, you can alter the settings for viewing thetonality data. For information on modifying the Tone SeekDelta or Regression Range, or the FFT settings, see the"FFT" section in this chapter or refer to the “FFT andTonality” chapter in the Model 831 Manual.
SLM UTIL-G3 Manual Data View 8-11

Click OK on the FFT Tonality dialog box to displaytonality data. Figure 8-14 shows the FFT graph with tonalitydata.
FIGURE 8-14 FFT Graph with Tonality Data
The tonality data graph displays tone indicators, as shown inFigure 8-14.
Tone indicators with a critical bandwidth line display tonesthat meet the ISO 1996-2 standard. Tone indicators without acritical bandwidth line represent tones that do not meet thestandard.
Tone Indicator withCritical Bandwidth Line
Tone Indicator withoutCritical Bandwidth Line
Data Set Summary forSelected Tone
Quality IndicatorInformation
8-12 Data View SLM UTIL-G3 Manual

For more information about qualityindicators for Model 831 tonalityassessments, see the “FFT andTonality Chapter” in the Model 831Manual.
When you select a tone, the Data Set displays a summary ofthe data associated with the tone. If the tone does not meetthe ISO 1996-2 standards, the quality indicator information,at the bottom of the Data Set appears.
To select a tone, click on the tone indicator, as shown inFigure 8-15.
FIGURE 8-15 Selecting A Tone
To zoom into individual tones, select the area on the graph tobe enlarged and drag the cursor to the end of the area, asshown in Figure 8-16.
SLM UTIL-G3 Manual Data View 8-13

FIGURE 8-16 Zoom Into View Tones
Zooming into tones may be helpful in viewing the noiseregression line, as shown in Figure 8-17.
FIGURE 8-17 Noise Regression Line
Select and drag area to zoominto one or several tones
Noise Regression Line
8-14 Data View SLM UTIL-G3 Manual

Exporting Data
When exporting FFT data, the Export Data dialog box willappear as shown in FIGURE 8-18. Refer to Chapter 5 in thismanual for more information about exporting data.
FIGURE 8-18 Export Data: FFT
When exporting to an Excel Workbook, the FFT data will beexported to the selected worksheets.
SLM UTIL-G3 Manual Exporting Data 8-15

Summary Worksheet
The Summary worksheet will be created when the Summaryoption is checked on the Export Data dialog box. TheSummary worksheet will display the same information asdisplayed on the FFT Summary View. Please refer to theFFT Summary section of this chapter for a completedescription.
Session Log Worksheet
The Session Log worksheet will automatically be createdwhen the Summary option is checked on the Export Datadialog box.
FFT Overall Worksheet
The FFT Overall worksheet will be created when the FFTOverall option is checked on the Export Data dialog box.This worksheet will display the active settings in effectwhen this measurement was taken, followed by thefrequency weighted broadband Leq and Lpeak values andthen the overall average and overall max FFT data for eachfrequency bin.
FFT Measurement History (Avg) Worksheet
The FFT Measurement History (Avg) worksheet will becreated when the FFT Measurement History option ischecked on the Export Data dialog box. This worksheetwill display the active settings in effect when thismeasurement was taken, followed by the FFT AverageSpectrum table. If using a version of Excel prior to 2010, thetable displays Records across the columns and Frequencydown the rows as shown in FIGURE 8-19. Due tolimitations in Excel prior to version 2010, the export will belimited to the first 254 history records. If using Excel 2010or later, the table displays Frequency across the columns andRecords down the rows as shown in FIGURE 8-20. Thiswill allow all data to be displayed.
8-16 Exporting Data SLM UTIL-G3 Manual

The following figure shows a partialFFT Average Spectrum table for ameasurement.
FIGURE 8-19 FFT Export: FFT Measurement History
SLM UTIL-G3 Manual Exporting Data 8-17

FIGURE 8-20 FFT Export: FFT Measurement History (Excel 2010)
FFT Measurement History (Max) Worksheet
The FFT Measurement History (Max) worksheet will alsobe created when the FFT Measurement History option ischecked on the Export Data dialog. This worksheet isidentical to the FFT Measurement History (Avg) worksheet,but with the Max data displayed instead of the Average.
FFT Tonality Worksheet
The FFT Tonality worksheet will be created when the FFTTonality option is checked on the Export Data dialog box.This worksheet includes tonality parameter with the FFTdata.
8-18 Exporting Data SLM UTIL-G3 Manual