social metrics: how social marketing measurement impacts business
TRANSCRIPT

by
Social Metrics How Social Marketing Measurement Impacts Business
Jan Rezab, @janrezab

50 % Of Global FORTUNE 500
800 000 Visits Per month
1 800 Customers

First Generation “The Checkbox Treatment”
Social Media Generational Development
Next Generation “Social Business”

Example of First Generation Companies

“Complain-‐ver/sing”

Example of Next Generation Companies

KLM
The best company on both Facebook and Twitter in customer service.
Alcance: 200+ blogs and forums, registered membership of over 2 million Posts mensuales: c200
Posts mensuales: c10k (peak 20k) Visitantes mensuales: c750
Fans: c500k Posts mensuales: c1k
Followers: c40k Tweets mensuales: c4k (peak 8k)
NPS: 78%
Ingresos de upsells: $ 1,5M / año
Contact Deflection:
20% 10 Languages
More than 100 Employees 1 Hour Response Time, 24/7

Nestlé
Full brand transforma/on
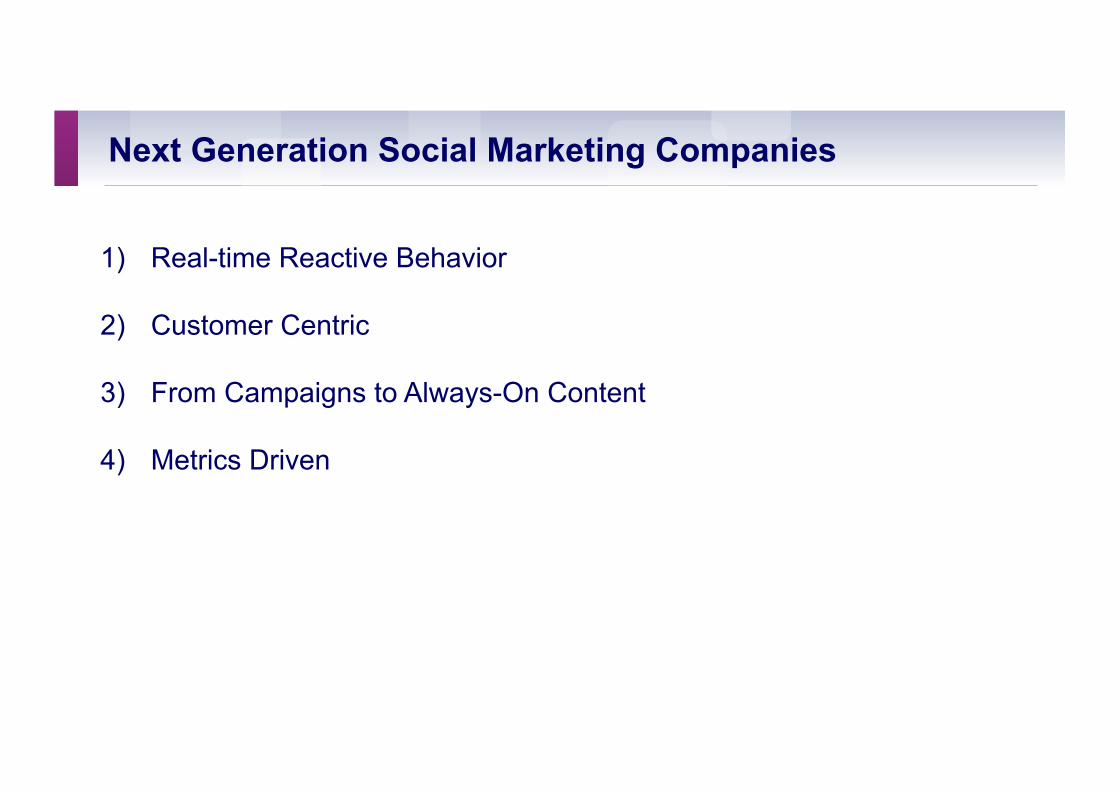
Next Generation Social Marketing Companies
1) Real-time Reactive Behavior
2) Customer Centric
3) From Campaigns to Always-On Content
4) Metrics Driven

Top Facebook Pages in Asia
Page Name Fans Fans in Asia Fans In Asia [%]
Tata Docomo 13 492 776 13 327 543 98.78 %
Intel 21 975 852 13 023 868 59.26 %
Samsung Mobile 24 154 066 12 562 535 52.01 %
BlackBerry 29 129 656 10 762 284 36.95 %
Nokia India 8 709 266 8 542 371 98.08 %
Kit Kat 18 363 513 7 528 717 41.00 %
Fastrack 7 690 357 7 503 839 97.57 %
Samsung Mobile India 7 463 126 7 322 668 98.12 %
Levi's 19 279 777 7 226 913 37.48 %
Coca-Cola 72 485 634 6 950 160 9.59 %
Source: Socialbakers, 7th of September 2013

Where the Top Brands’ Fans are from
Country Fan Market Share in Brands
India 34.80 % Indonesia 12.76 % Philippines 10.28 % Malaysia 6.72 % Pakistan 5.91 % Thailand 5.19 % Taiwan 3.61 % Saudi Arabia 2.37 % Japan 1.99 % Vietnam 1.71 % Jordan 1.51 % South Korea 1.43 % Bangladesh 1.30 % United Arab Emirates 1.23 % Hong Kong 1.06 %
Source: Socialbakers, 7th of September 2013

Dashboard

Three Dramatic Shifts
1) Focus on Content Marketing
2) Focus on Advertising
3) Focus on Social Customer Care

Content Marketing & Evolution of social
2013 on average
50 pages!
2009 on average
5 pages!
USERS ARE FANS OF MORE AND MORE PAGES

Content Marketing & Evolution of social
2013 on average
50 pages!
+ publish 40 posts / month
2009 on average
5 pages!
+ published 7 posts / month
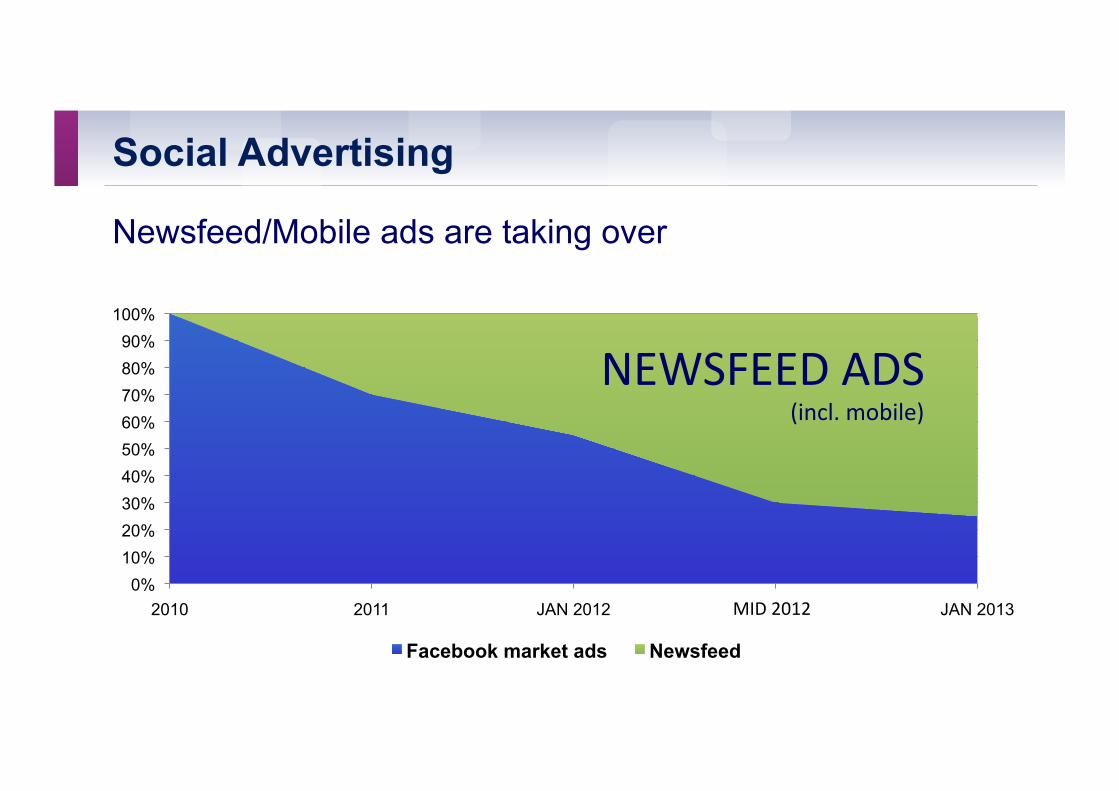
Social Advertising
Newsfeed/Mobile ads are taking over
0% 10% 20% 30% 40% 50% 60% 70% 80% 90%
100%
2010 2011 JAN 2012 FEB 2012 JAN 2013
Facebook market ads Newsfeed
NEWSFEED ADS (incl. mobile)
MID 2012

Social Paid Media - Advertising Shift
Facebook post Tweet Other Networks
Fans
Friends of Fans
Custom Audiences
Target Audience
Followers
Target Audience
Their Followers etc.
Target Audience

Big changes coming in structuring Social media teams

How Best Companies Structure Their Teams
Social media teams
Strategy Posting
Agency
Content planning
Targeting
Advertising
Analytics & Insights Customer care
team
Media
Content
Strategy & Consultants
Tools
Community management
Listening
Responding

Customer Service
SOCIALLY DEVOTED Being Good in Social Customer Care

Customer Care department
PR and Communications Digital Marketing Other 0
100
200
300
400
500
600
700
800
900
Aver
age
Num
ber o
f Que
stio
ns
Cooperate with customer care on social care – it belongs there

0
100
200
300
400
500
600
700
800
900
1000
External Agency 1-3FT 1-3FT and 1-3PT 1-3FT and 4-10PT
4-10FT Bigger social team
Average Number of Questions vs. Team Members
FT = Full /me, PT = Part /me

Fans and Fan Growth
Activity of Your Page
Engagement Rate
Reach
Response Rate Response Time
Social is not about one metric, it’s about all of them
$ Paid media

Our Research Supports this:
No Priority
Small Priority
Medium Priority
Big Briority
Fans & Fan growth 2.80 % 12.17 % 40.46 % 46.38 %
Engagement 2.62 % 4.75 % 21.60 % 72.01 %
Content Shareability 2.83 % 12.48 % 37.94 % 47.25 %
Customer Care Metrics 12.29 % 24.75 % 38.38 % 25.42 %
Advertising Metrics 13.86 % 25.71 % 38.73 % 22.04 %
Website Visits from Social Media 8.13 % 22.55 % 33.50 % 36.98 %
Which Metrics Do You Focus on on Social Media?

Key Take-Aways
What do next generation companies do

They put the customer first, …it pays off

They are metrics driven

They find insights and take them, keep finding out what works
(because that changes all the /me)

They innovate, so they don’t fall behind again

Thank you!
30
Jan Rezab CEO of socialbakers
On Twi'er: @janrezab

Thank you! Jan Rezab CEO of socialbakers
On Twi'er: @janrezab
See you later at drinks!