socio-economic data, growth trends, and land use ... · 3.1 socio-economic data, growth trends, and...
TRANSCRIPT

Hamilton Area Transportation Plan (2009 Update)
Prepared For: City of Hamilton Ravalli County Montana Department of Transportation
Prepared By: Camp Dresser & McKee (CDM) Inc. Helena, Montana
September 1, 2009
Socio-economic Data, Growth Trends, and Land Use Assignments Technical Memorandum
Working DraftWorking DraftWorking Draft
A

SOCIO‐ECONOMIC, GROWTH TRENDS, AND HAMILTON AREA TRANSPORTATION PLAN (2009 UPDATE) LAND USE ASSIGNMENTS MEMO SEPTEMBER 1, 2009
Page i
Table of Contents
3.1 Socio‐Economic Data, Growth Trends, and Land Use Assignments 3.1.1 Socio‐Economic Trends .................................................................................................. 1 3.1.2 Population Projections ................................................................................................... 8 3.1.3 Employment Projections ................................................................................................ 9 3.1.4 Allocation of Growth .................................................................................................... 12
List of Figures
Figure 3‐1: Ravalli County Population & Employment Trends Figure 3‐2: Incorporated Cities in Ravalli County Historic Population Trends (1970‐2005) Figure 3‐3: Ravalli County Age Distribution (1970‐2000) Figure 3‐4: Ravalli County Age Distribution (2000) Figure 3‐5: Ravalli County Employment Trends by Economic Sector (1970‐2000) Figure 3‐6: Ravalli County Employment Trends by NAICS (2005) Figure 3‐7: Year 2030 Projected Dwelling Units Figure 3‐8: Year 2030 Projected Dwelling Units ‐ Inset Area Figure 3‐9: Year 2030 Projected Non‐retail Employment Units Figure 3‐10: Year 2030 Projected Non‐retail Employment Units ‐ Inset Area Figure 3‐11: Year 2030 Projected Retail Employment Units Figure 3‐12: Year 2030 Projected Retail Employment Units ‐ Inset Area
List of Tables
Table 3‐1: Ravalli County Population and Employment Trends (1970‐2005) Table 3‐2: Incorporated Cities in Ravalli County Historic Population Trends (1970‐2005) Table 3‐3: Ravalli County Age Distribution (1970‐2000) Table 3‐4: Ravalli County Employment Trends by Economic Sector (1970‐2000) Table 3‐5: Projected Population and Dwelling Units in City and Planning Area Table 3‐6: Ravalli County Projected Employment Units Table 3‐7: Job Proportions for Ravalli County (2008 Data) Table 3‐8: Within Study Area Boundary – Projected Employment Units

SOCIO‐ECONOMIC, GROWTH TRENDS, AND HAMILTON AREA TRANSPORTATION PLAN (2009 UPDATE) LAND USE ASSIGNMENTS MEMO SEPTEMBER 1, 2009
Page 1
3.1 Socio-Economic Data, Growth Trends, and Land Use Assignments
This memorandum describes the method and process used to predict growth in the Hamilton area up to the year 2030. By using population, employment and other socio-economic trends as aids, the future transportation requirements for the Hamilton area are determined. A model of the transportation system for the Hamilton area was developed and assessed with the additions and changes to the system that are projected to occur up to the year 2030 being applied to the model to forecast the future transportation conditions. From this model, various scenarios were developed to test a range of transportation improvements to determine what affects may occur on the transportation system.
3.1.1 Socio-Economic Trends There is a direct relationship between motor vehicle travel growth and population and economic growth in Ravalli County. The population in Ravalli County has seen a significant population increase since 1990 with an increase of nearly 57%. A major concern to the influx of traffic volumes in Ravalli County is the rapid community population growth with particular interest to the City of Hamilton. There has been substantial employment growth in Ravalli County since 1990 with the county experiencing an 85% increase in employment. Table 3-1 and Figure 3-1 show the population and employment numbers for Ravalli County between 1970 and 2005.
Table 3-1 Ravalli County Population and Employment Trends (1970-2005)
Year Population * Employment **
1970 14,409 4,938
1980 22,493 7,490
1990 25,010 10,611
2000 36,070 16,963
2005 39,229 19,684
* Source: U.S. Bureau of the Census, Census of Population
** Source: U.S. Department of Commerce, Bureau of Economic Analysis

SOCIO‐ECONOMIC, GROWTH TRENDS, AND HAMILTON AREA TRANSPORTATION PLAN (2009 UPDATE) LAND USE ASSIGNMENTS MEMO SEPTEMBER 1, 2009
Page 2
0
5000
10000
15000
20000
25000
30000
35000
40000
1970 1980 1990 2000 2005
Figure 3‐1Ravalli County Population & Employment Trends
Population
Employment
The population trends within Ravalli County in relation to the incorporated cities and the rural area are shown in Table 3-2 and Figure 3-2. The incorporated cities in Ravalli County are Hamilton, Darby, Pinesdale (incorporated in 1990), and Stevensville. Each incorporated city, as well as the rural area, has seen a consistent population increase since 1980. Hamilton has seen the highest population increase of 62% between 1990 and 2005, while Stevensville has more than doubled in population during the same time period.
Table 3-2
Incorporated Cities in Ravalli County Historic Population Trends (1970-2005) Year County Rural Hamilton Darby Pinesdale Stevensville
1970 14,409 11,910 2,499 538 ~ 829
1980 22,493 19,832 2,661 581 ~ 1,207
1990 25,010 22,273 2,737 625 670 1,221
2000 36,070 32,365 3,705 710 742 1,553
2005 39,229 34,786 4,443 835 832 1,855
* Source: U.S. Bureau of the Census, Census of Population
~ Not incorporated when census population was conducted

SOCIO‐ECONOMIC, GROWTH TRENDS, AND HAMILTON AREA TRANSPORTATION PLAN (2009 UPDATE) LAND USE ASSIGNMENTS MEMO SEPTEMBER 1, 2009
Page 3
0
5000
10000
15000
20000
25000
30000
35000
40000
Figure 3‐2 Incorporated Cities in Ravalli County
Historic Population Trends (1970‐2005)
1970
1980
1990
2000
2005
In recent decades there were other notable changes in Ravalli County’s population. In Ravalli County, and elsewhere in Montana and the nation, the population’s age profile got older. Between 1970 and 2000, the number of county residents under the age of 18 increased by 4,168 persons, residents age 18 to 64 increased by 14,058 persons, and residents 65 and older increased by 3,435 persons. As “Baby Boomers” got older, they simply had fewer children than their parents. The change in age can be seen in Table 3-3. The percentage of each age group is shown graphically in Figure 3-3. From this figure, it is apparent that there has been an increase in the age group of 18-64 and a decrease in people less than 18 years of age. A more detailed age distribution for Ravalli County for the year 2000 is shown in Figure 3-4.

SOCIO‐ECONOMIC, GROWTH TRENDS, AND HAMILTON AREA TRANSPORTATION PLAN (2009 UPDATE) LAND USE ASSIGNMENTS MEMO SEPTEMBER 1, 2009
Page 4
0.0%
10.0%
20.0%
30.0%
40.0%
50.0%
60.0%
1970 1980 1990 2000
Percen
t of Total Pop
ulation
Year
Figure 3‐3 Ravalli County Age Distribution (1970‐2000)
<18
18‐64
65+
Table 3-3 Ravalli County Age Distribution (1970-2000)
Year Age
<18 18-64 65+ Total
1970 5,063 7,192 2,154 14,409
1980 6,934 12,581 2,978 22,493
1990 6,851 14,009 4,150 25,010
2000 9,231 21,250 5,589 36,070
Change (1970-2000) 4,168 14,058 3,435 21,661
* Source: U.S. Bureau of the Census, Census of Population
~ Not incorporated when census population was conducted

SOCIO‐ECONOMIC, GROWTH TRENDS, AND HAMILTON AREA TRANSPORTATION PLAN (2009 UPDATE) LAND USE ASSIGNMENTS MEMO SEPTEMBER 1, 2009
Page 5
<56% 5‐17
20%
18‐203%
21‐243%
25‐3410%
35‐4415%
45‐5416%
55‐597%
60‐645%
65‐748%
75‐845%
85+2%
Figure 3‐4Ravalli County Age Distribution (2000)
In 2000, there were 16,963 jobs in Ravalli County. This number is over three times the amount of 4,938 jobs that existed in 1970. Every sector has seen an increase in jobs since 1970, except for federal and civilian government, with the service industry experiencing the largest increase. Table 3-4 displays countywide employment by economic sector from 1970 through 2000. This information is shown graphically in Figure 3-5.
Table 3-4 Ravalli County Employment Trends by Economic Sector (1970-2000)
Economic Sector 1970 1980 1990 2000 Change
(1970 – 2000)
Farm 875 1,116 1,217 1,333 458
Agricultural Services & Forestry 60 121 275 583 523
Mining 13 16 76 41 28
Construction 175 437 637 1,613 1,438
Manufacturing 484 685 1,178 1,419 935
Transportation & Public Utilities
221 376 490 685 464

SOCIO‐ECONOMIC, GROWTH TRENDS, AND HAMILTON AREA TRANSPORTATION PLAN (2009 UPDATE) LAND USE ASSIGNMENTS MEMO SEPTEMBER 1, 2009
Page 6
‐10 0 10 20 30 40 50
Farm
Agricultural Services & Forestry
Mining
Construction
Manufacturing
Transportation & Public Utilities
Wholesale Trade
Retail Trade
Finance, Insurance & Real Estate
Services
Federal & Civilian Government
Military
State & Local Government
Number of Jobs (Hundreds)
Figure 3‐5Ravalli County Employment Trends by Economic Sector (1970‐2000)
Change (1970‐2000) 2000 1990 1980 1970
Wholesale Trade 39 92 193 441 402
Retail Trade 817 1,288 1,766 2,991 2,174
Finance, Insurance & Real Estate
347 514 687 1,361 1,014
Services 765 1,353 2,550 4,518 3,753
Federal & Civilian Government 563 549 454 485 -78
Military 113 134 193 189 76
State & Local Government 466 809 895 1,304 838
Total Employment 4,938 7,490 10,611 16,963
Source: U.S. Bureau of the Census, Census of Population
SOCIO‐ECONOMIC, GROWTH TRENDS, AND HAMILTON AREA TRANSPORTATION PLAN (2009 UPDATE) LAND USE ASSIGNMENTS MEMO SEPTEMBER 1, 2009
Page 7
0 500 1000 1500 2000 2500
Construction
Retail Trade
Health Care and Social Assistance
Other Services, Except Public Administration
Local Government
Manufacturing
Accommodation and Food Services
Real Estate, Rental and Leasing
Professional, Scientific, and Technical Services
Forestry, Fishing, & Related Activities
Mining
Administravtive and Waste Services
Arts, Entertainment, and Recreation
Finance and Insurance
Wholesale Trade
Federal, Civilian Government
Transportation and Warehousing
Educational Services
Military
Information
State Government
Utilities
Management of Companies and Enterprises
22682138
15161463
13671306
12291172
1079885885
833650
572535503468
207193174167
4133
Number of Jobs
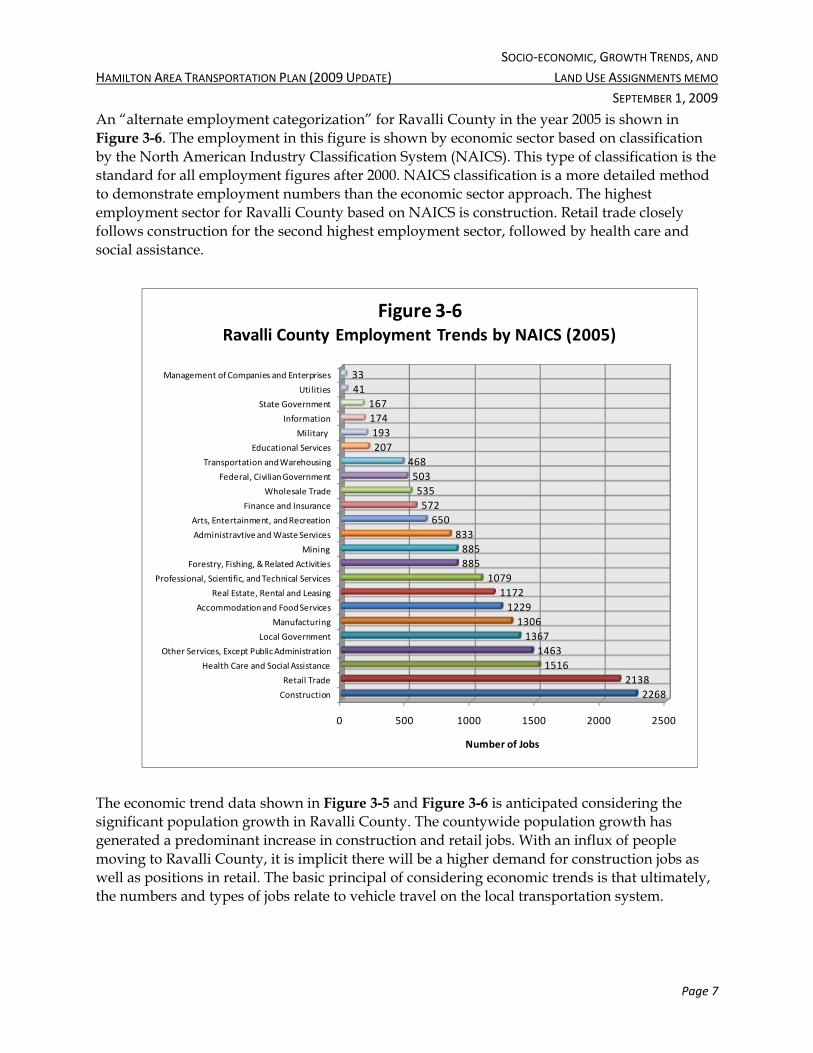
Figure 3‐6Ravalli County Employment Trends by NAICS (2005)
An “alternate employment categorization” for Ravalli County in the year 2005 is shown in Figure 3-6. The employment in this figure is shown by economic sector based on classification by the North American Industry Classification System (NAICS). This type of classification is the standard for all employment figures after 2000. NAICS classification is a more detailed method to demonstrate employment numbers than the economic sector approach. The highest employment sector for Ravalli County based on NAICS is construction. Retail trade closely follows construction for the second highest employment sector, followed by health care and social assistance.
The economic trend data shown in Figure 3-5 and Figure 3-6 is anticipated considering the significant population growth in Ravalli County. The countywide population growth has generated a predominant increase in construction and retail jobs. With an influx of people moving to Ravalli County, it is implicit there will be a higher demand for construction jobs as well as positions in retail. The basic principal of considering economic trends is that ultimately, the numbers and types of jobs relate to vehicle travel on the local transportation system.

SOCIO‐ECONOMIC, GROWTH TRENDS, AND HAMILTON AREA TRANSPORTATION PLAN (2009 UPDATE) LAND USE ASSIGNMENTS MEMO SEPTEMBER 1, 2009
Page 8
3.1.2 Population Projections Population projections are used to predict future travel patterns, and to analyze the potential performance capabilities of the Hamilton area transportation system. Projections of the study area’s future population are gathered from the recent Hamilton Growth Policy Update completed by Kate McMahon of Applied Communications. These projections for growth in the city area and planning area are based on State of Montana population projections for Ravalli County. The amount of growth in Ravalli County that will be captured by the city and planning area is distributed in proportion to the population distribution from the 2000 U.S. Census. Based on this method, the population for 2010 was compared to actual building permits and septic permits for new construction from 2000 to 2008 to confirm that projected growth was comparable to actual growth. To determine the number of projected dwelling units, population was divided by household size from the 2000 Census. As noted in Table 3.5, it is projected that by 2030, there will be an increase of 2,686 dwelling units between year 2010 and year 2030 within the Transportation Plan’s study area boundary. It is very likely that a portion of these new units will be annexed to the City. The projected population increase within the Transportation Plan’s study area boundary between the year 2010 and the year 2030 is 6,223 persons.
Table 3-5 Projected Population and Dwelling Units in City and Planning Area
Source: Hamilton Growth Policy Update (2009)
Year 2000 Year 2010 Year 2030
City Population 3,705 4,807 5,288
City Dwelling Units 1,915 2,392 2,631
Planning Area Population 5,799 6,789 12,531
Planning Area Dwelling Units 2,535 2,997 5,444
Total Population 9,504 11,596 17,819
Total Dwelling Units 4,450 5,389 8,075
SOCIO‐ECONOMIC, GROWTH TRENDS, AND HAMILTON AREA TRANSPORTATION PLAN (2009 UPDATE) LAND USE ASSIGNMENTS MEMO SEPTEMBER 1, 2009
Page 9
3.1.3 Employment Projections Employment numbers are used in the traffic model to help distribute vehicle traffic as accurately as possible. Places with high levels of employment will tend to generate high levels of vehicle traffic. The traffic generated is based in part on the employment type: either retail or non-retail jobs. Non-retail jobs consist of all types of jobs broken out by the NAICS classifications shown in Figure 3-5 excluding “retail trade.”
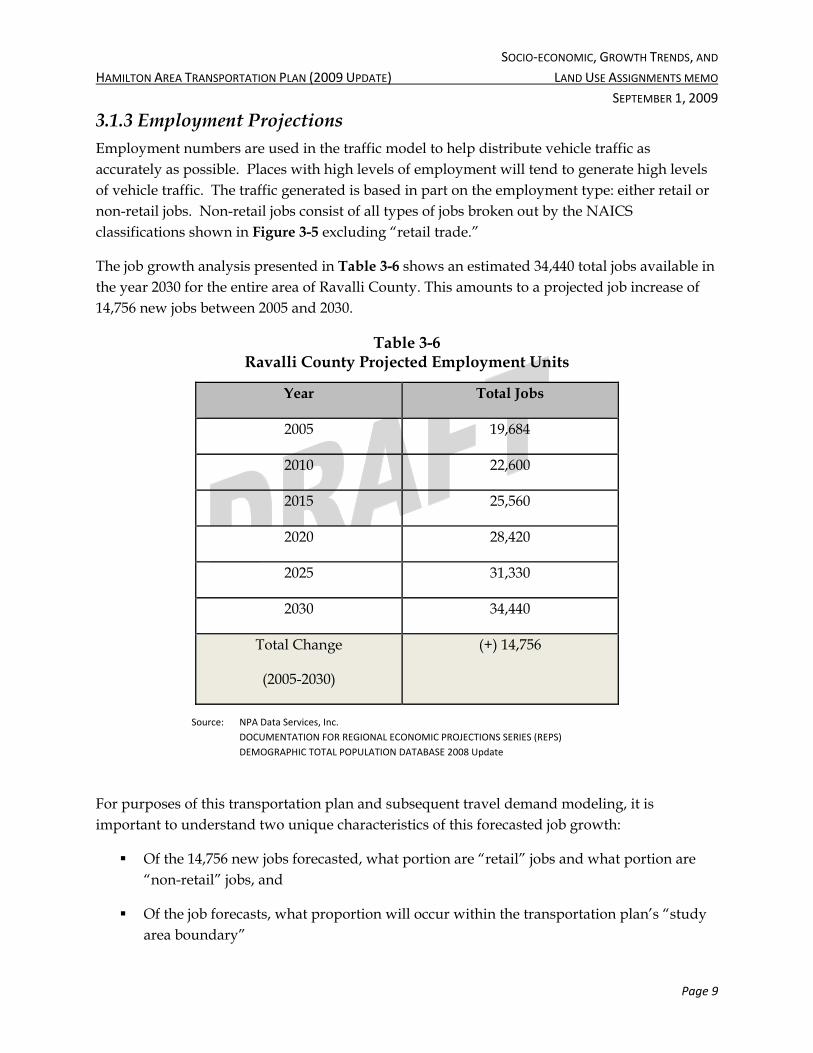
The job growth analysis presented in Table 3-6 shows an estimated 34,440 total jobs available in the year 2030 for the entire area of Ravalli County. This amounts to a projected job increase of 14,756 new jobs between 2005 and 2030.
Table 3-6 Ravalli County Projected Employment Units
Source: NPA Data Services, Inc.
DOCUMENTATION FOR REGIONAL ECONOMIC PROJECTIONS SERIES (REPS) DEMOGRAPHIC TOTAL POPULATION DATABASE 2008 Update
For purposes of this transportation plan and subsequent travel demand modeling, it is important to understand two unique characteristics of this forecasted job growth:
Of the 14,756 new jobs forecasted, what portion are “retail” jobs and what portion are “non-retail” jobs, and
Of the job forecasts, what proportion will occur within the transportation plan’s “study area boundary”
Year Total Jobs
2005 19,684
2010 22,600
2015 25,560
2020 28,420
2025 31,330
2030 34,440
Total Change
(2005-2030)
(+) 14,756

SOCIO‐ECONOMIC, GROWTH TRENDS, AND HAMILTON AREA TRANSPORTATION PLAN (2009 UPDATE) LAND USE ASSIGNMENTS MEMO SEPTEMBER 1, 2009
Page 10
For the proportioning of the retail and non-retail jobs, data obtained from the Montana Department of Labor and Industry was analyzed for the year 2005, by North American Industry Classification System (NAICS) categories, to ascertain the proportional ratio of retail jobs to non-retail jobs within Ravalli County. Data collected for this purpose is as shown in Table 3-7.
Table 3-7 Job Proportions for Ravalli County (2008 Data)
Source: Montana Department of Labor and Industry (2008 Data)
Note that a retail job percentage of 10.9% is likely a function of the unique occurrence of professional, agricultural, construction and related commercial sectors found within Ravalli County in general. Aside from portions of Hamilton, there are very few “retail” clusters within the County. This nuance appears to be confirmed by this lower than expected proportion of retail jobs from the NAICS dataset. Going forward, it is recommended to utilize a 15 percent proportioning for future retail jobs for this transportation planning exercise.
The final data analysis pertinent to job growth is to develop the percentage of the overall job forecast that will occur within the transportation plan’s study area boundary. To that end, two sources were analyzed for comparison purposes. The first source was the Montana Department of Labor and Industry data for the year 2008 as provided to the Montana Department of Transportation for travel demand modeling purposes. From this source, the data suggests the following:
Total Jobs within Project Study Area Boundary: 6,181 jobs
Total Jobs in Dataset for Ravalli County: 13,676 jobs
Percentage of Jobs within Study Area Boundary: 45.2 percent
The second source analyzed was the US Census Bureau’s County Business Pattern index for the year 2005. In that dataset, data for Ravalli County was queried by extracting total jobs within Ravalli County and also extracting total jobs within the zip code area 59840. It is important to recognize that total jobs reported from this dataset are lower than the US Census Bureau estimates previously presented. For purposes of this exercise, this is acceptable as a strict proportioning of the number of jobs within the study area boundary to Ravalli County as a whole are needed. Additionally, the zip code area of 59840 is slightly larger than the
Year/Percentage Jobs
Retail Non-Retail Total
2005 2,138 17,546 19,684
Percentage 10.9% 89.1% N/A

SOCIO‐ECONOMIC, GROWTH TRENDS, AND HAMILTON AREA TRANSPORTATION PLAN (2009 UPDATE) LAND USE ASSIGNMENTS MEMO SEPTEMBER 1, 2009
Page 11
transportation plan study area boundary, so the focus of this second method was to check for an “order-of-magnitude” percentage to compare to the previous method.
Based on this data, the following was realized:
Total Jobs Reported within Zip Code Area 59840: 4,601 jobs
Total Jobs Reported in Dataset for Ravalli County: 8,762 jobs
Percentage of Jobs within Zip Code Area 59840: 52.5 percent
After reviewing these two methods, it is assumed that 45.2 percent of the total predicted job growth, between 2005 and 2030, will occur within the transportation plan’s study area boundary. As such, of the 14,756 new jobs in the entire limits of Ravalli County, 6,670 jobs are expected to occur within this transportation plan’s study area boundary. This expected job growth, to be realized between the year 2005 and the year 2030, will amount to 1,000 (or 15%) new retail jobs and 5,670 (or 85%) new non-retail jobs. A summary of the number of projected jobs, by planning year, can be found in Table 3-8 below.
Table 3-8 Within Study Area Boundary - Projected Employment Units
Source: NPA Data Services, Inc. DOCUMENTATION FOR REGIONAL ECONOMIC PROJECTIONS SERIES (REPS) DEMOGRAPHIC TOTAL POPULATION DATABASE 2008 Update
Year Jobs
Retail Non-Retail Total
2005 1,335 7,562 8,897
2010 1,532 8,683 10,215
2015 1,733 9,820 11,553
2020 1,927 10,919 12,846
2025 2,124 12,037 14,161
2030 2,335 13,232 15,567
Total Change
(2005-2030)
(+) 1,000 (+) 5,670 (+) 6,670

SOCIO‐ECONOMIC, GROWTH TRENDS, AND HAMILTON AREA TRANSPORTATION PLAN (2009 UPDATE) LAND USE ASSIGNMENTS MEMO SEPTEMBER 1, 2009
Page 12
3.1.4 Allocation of Growth The new growth predicted in sections 3.1.1, 3.1.2, and 3.1.3 of this document ultimately become input into the Transcad travel demand model. In fact, the Montana Department of Transportation’s modeling of future traveling patterns out to the year 2030 planning horizon required identification of future socioeconomic characteristics within each census tract and census block. County population and employment projections were translated to predictions of increases in housing and employment within the City of Hamilton and the planning area boundary. This information was obtained via the recent Hamilton Growth Policy Update and the analysis presented herein. During that effort, consideration was given to recent land use trends, land availability and development capabilities, land use regulations, planned public improvements, and known development proposals.
Figure 3-7 and Figure 3-8 show where potential dwelling unit increases are expected to be developed up to the year 2030 in the planning area boundary. Figure 3-9 and Figure 3-10 show where potential non-retail job increases are expected to be developed. Figure 3-11 and Figure 3-12 show where potential retail job increases are expected to be developed.

Riverside CutoffSee DetailSee Detail(Figure 3-8)(Figure 3-8)
Skalkaho Hwy
Wes
tsid
e R
d
Stock Farm Rd
Bow
man
Rd
Us
Hig
hway
93
S
Ric
ketts
Rd
Wilc
ox L
n
Orc
hard
Dr
Mill Creek Rd
Hamilton Heights Rd
Fole
y Ln
Oertli Ln
Mckillop Ln
Fish
Hat
cher
y R
d
Orion Belt Way
Sle
epin
g C
hild
Rd
Blodgett View Dr
Hon
eyho
use
Ln
Bell Ln
Jorgy Way
Roaring Lion Rd
West River Rd
Hawker Ln
Oilw
ell R
d
Wyant Ln
Arrow Hill Dr
Duus Ln
Fros
t Ln
Pon
dero
sa D
r
Rose Ln
Unn
amed
Blodgett Camp Rd
Lovers Ln
Elk Ridge Rd
West Hills Way
Coa
ch L
n
Lincoln Ln
Mariah Ln
Stacy Ln
Joy
St
Gra
nt L
n
Krue
ger L
n
Nighthawk Ln
N Gold Creek Loop
Mcc
arth
y Lo
op
Ashlin Ln
West Bridge Rd
Har
vey
Ln
Maki Dr
Sun
haw
k Ln
Yeria
n Ln
War
bler
Ln
Mihara Ln
Hub
Ln
Rum
mel
Ln
Aren
a R
d
Mason Ln
Saw
yer L
n
Springhill Rd
Hilltop D
r
Saw
tooth Ln
Nic
ol L
n
Wal
l St
Kaib
ab T
rl
Salmon Way
Har
mon
y W
ay
Two
Hor
se L
n
Chads Rd
Cartwright Way
Noland Dr
Sshe
nsh
Trl
Md Cir
River Farm Trl
Laur
ie W
ay
Mus
tang
Ln
Ced
ar S
t
Palfiena Trl
Qua
il R
un
Som
eesc
h Ln
Meadowlark Ln
Wap
iti Lo
op
Long
Ln
Dia
mon
d 3
Rd
Ellingwood Ln
Stewart Ln
Lulu Ln
Arbo
r Ln
Merlin Watch Rd
Cas
e Ln
Birc
h S
tMeadow Dr
Bass Ln
East
side
Hw
y
Golf Course Rd
N 1
st S
t
Tammany Ln
S 1s
t St
Old
Cor
valli
s R
d
Kurtz
Ln
Coo
per L
n
Black Ln
Pine St
W Main St
Skyl
ine
Dr
Dal
y Av
eFairgrounds Rd
N 2
nd S
t
Ravalli St
Desta St
Big
Cor
ral R
d
N 1
0th
St
S 8t
h S
t Ham
ilton
Airp
ort
Free
ze L
nMarcus St
Airp
ort R
d
Grundy Ln
Gen
eva
Ave
Grove St
Bedford St
Census Blocks with Expected DU GrowthProjected Dwelling Units
0 - 2525 - 125125 - 225225 <
Functional ClassificationPrincipal Arterial (per FHWA)Major Collector (per FHWA)Collector (Local Designation)Local
Study Area BoundaryHamilton City LimitsBitterroot RiverRailroad
0 0.5 1
Miles
Z:\g
is\P
ublic
\MD
OT\
Ham
ilton
\MX
D\R
evis
ed_0
6300
9\Fi
g3_7
_203
0Dw
Uni
ts_0
9063
0_85
x11d
raft.
mxd
.
Figure 3-7Year 2030 Projected Dwelling UnitsHamilton Area Transportation Plan(2009 Update) DRAFT
General Infill Area

Riverside Cutoff
0
0
Ric
ketts
Rd
S 4t
h S
t
S 3r
d S
t
Mill
St
N 7
th S
tWest River Rd
N 8
th S
t
Dor
an L
n
Alley
Gra
ntsd
ale
Rd
Hon
ey L
n
Nicol Ln
Oertli Ln
Blue
Ln
Weber Dr
Stock Farm
Rd
Angel Ln
Nol
and
Dr
High R
d
Md Cir
River Farm Trl
Jonc
ar C
t
Bunt
Ln
Bayberry LnWestwood Dr
Daly Mansion Rd
Foxfield StW
inkl
er L
n
Antigone Dr
Livi
s Ln
Blodgett View Dr
Wer
th L
n
Sky West Ln
Mer
gans
er L
n
Shady Ln
Silverado Trl
Flower St
Parker St
Arbo
r Ln
Tailgate Ln
Winn
ers W
ay
China Silk Way
S 6th St
Sage
Ln
Vict
or S
t
Tammany HlManhattan St
E Desmet St
Villa
Ct
Theb
ian
Ln
Unn
amed
Meadow Dr
Kayne Rd
Skyrid
ge D
r
North Hillcrest Dr
Rosemary Ln
Con
rad
St
Harbison Dr
South Ct
Blue Bird Dr
Dan
iel C
t
Copper C
t
Alley
S 6t
h St
N 1
st S
t
S 1s
t St
Kurtz
Ln
East
side
Hw
y
Pine St
W Main St
Golf Course Rd
Old
Cor
valli
s R
d
Dal
y Av
e
Coo
per L
n
River St
State St
Fairgrounds Rd
N 6
th S
t
N 4
th S
t
N 5
th S
t
N 3
rd S
t
N 2
nd S
t
Ravalli St
Skyline Dr
Desta St
Big
Cor
ral R
d
Tammany Ln
Lewis Ln
N 1
0th
St
S 7t
h S
t
S 8t
h S
t
Cherry St
New York Ave
Madison St
Free
ze L
n
Marcus St
Airp
ort R
d
Desmet St
Pinckney St
Grundy Ln
S 9t
h S
t
Franklin Ave
Geneva Ave
Saranac Ave
Baker St
Hattie Ln
Adirondac Ave
Alic
e A
ve
Grove St
Pennsylvania Ave
Bailey Ave
Bedford St
N D
aly
Ave
E Ravalli St
Roosevelt Ln
Prov
iden
ce W
ay
Hope Ave
Adirondac Ave
Bedford St
Census Blocks with Expected DU GrowthProjected Dwelling Units
0 - 2525 - 125125 - 225225 <
Functional ClassificationPrincipal Arterial (per FHWA)Major Collector (per FHWA)Collector (Local Designation)Local
Preliminary Study Area BoundaryHamilton City LimitsBitterroot RiverRailroad
0 1,000 2,000
Feet
Z:\g
is\P
ublic
\MD
OT\
Ham
ilton
\MX
D\R
evis
ed_0
6300
9\Fi
g3_8
_203
0Dw
Uni
tsIn
set_
0906
30_8
5x11
draf
t.mxd
.
Figure 3-8Year 2030 Projected Dwelling Units - Inset AreaHamilton Area Transportation Plan(2009 Update) DRAFT
General Infill Area

Riverside CutoffSee DetailSee Detail(Figure 3-10)(Figure 3-10)
Skalkaho Hwy
Wes
tsid
e R
d
Stock Farm Rd
Bow
man
Rd
Us
Hig
hway
93
S
Ric
ketts
Rd
Wilc
ox L
n
Orc
hard
Dr
Mill Creek Rd
Hamilton Heights Rd
Fole
y Ln
Oertli Ln
Mckillop Ln
Fish
Hat
cher
y R
d
Orion Belt Way
Slee
ping
Chi
ld R
d
Blodgett View Dr
Hon
eyho
use
Ln
Bell Ln
Jorgy Way
Roaring Lion Rd
West River Rd
Hawker Ln
Oilw
ell R
d
Wyant Ln
Arrow H
ill Dr
Duus Ln
Fros
t Ln
Pond
eros
a D
r
Rose LnU
nnam
ed
Blodgett Camp Rd
Lovers Ln
Elk Ridge Rd
West Hills Way
Coa
ch L
n
Lincoln Ln
Mariah Ln
Stacy Ln
Joy
St
Gra
nt L
n
Krue
ger L
nNighthawk Ln
N Gold Creek Loop
Mcc
arth
y Lo
op
Ashlin Ln
West Bridge Rd
Har
vey
Ln
Maki Dr
Sunh
awk
Ln
Yeria
n Ln
War
bler
Ln
Mihara Ln
Hub
Ln
Rum
mel
Ln
Aren
a R
d
Mason Ln
Saw
yer
Ln
Springhill Rd
Hilltop D
r
Sawtooth Ln
Nic
ol L
n
Wal
l St
Kaib
ab T
rl
Salmon Way
Har
mon
y W
ay
Two
Hor
se L
n
Chads Rd
Cartwright Way
Noland Dr
Sshe
nsh
Trl
Md Cir
River Farm Trl
Laur
ie W
ay
Mus
tang
Ln
Ced
ar S
tPalf iena Trl
Qua
il R
un
Som
eesc
h Ln
Meadowlark Ln
Wap
iti Lo
op
Long
Ln
Dia
mon
d 3
Rd
Ellingwood Ln
Stewart Ln
Lulu Ln
Arbo
r Ln
Merlin Watch Rd
Cas
e Ln
Birc
h S
t
Meadow Dr
East
side
Hw
y
Bass Ln
Golf Course Rd
N 1
st S
t
Tammany Ln
S 1s
t St
Old
Cor
valli
s R
d
Kurtz
Ln
Coo
per L
n
Black Ln
Pine St
W Main St
Skyl
ine
Dr
Dal
y A
ve
Fairgrounds Rd
N 2
nd S
t
Ravalli St
Desta St
Big
Cor
ral R
d
N 1
0th
St
S 8t
h S
t Ham
ilton
Airp
ort
Free
ze L
n
Marcus St
Airp
ort R
d
Grundy Ln
Gen
eva
Ave
Grove St
Bedford St
0 0.5 1
MilesFigure 3-9Year 2030 Projected Non-retail Employment UnitsHamilton Area Transportation Plan(2009 Update) DRAFT
Census Blocks with Expected Job GrowthProjected Non-retail Jobs
5 - 1920 - 3940 - 59
60 - 99100 - 500More than 500 Jobs
Functional ClassificationPrincipal Arterial (per FHWA)Major Collector (per FHWA)Collector (Local Designation)Local
Preliminary Study Area BoundaryBitterroot RiverHamilton City LimitsRailroad
Z:\g
is\P
ublic
\MD
OT\
Ham
ilton
\MX
D\F
ig3_
9_N
R_E
mpl
oym
ent.m
xd

Riverside Cutoff
0
0
0
Ric
ketts
Rd
S 4t
h S
t
S 3r
d St
Mill
St
N 7
th S
tWest River Rd
N 8
th S
t
Dor
an L
n
Alley
Gra
ntsd
ale
Rd
Hon
ey L
n
Nicol Ln
Oertli Ln
Blue
Ln
Weber D
r
Stock F
arm R
d
Angel Ln
Nol
and
Dr
High R
d
Md Cir
River Farm Trl
Jonc
ar C
t
Bunt
Ln
Bayberry LnWestwood Dr
Daly Mansion Rd
Foxfield StW
inkl
er L
n
Antigone Dr
Livi
s Ln
Blodgett View Dr
Wer
th L
n
Sky West Ln
Mer
gans
er L
n
Shady Ln
Silverado Trl
Flower St
Parker St
Arbo
r Ln
Tailgate Ln
Win
ners
Way
China Silk Way
S 6th St
Sage
Ln
Vict
or S
t
Tammany HlManhattan St
E Desmet St
Villa
Ct
Theb
ian
Ln
Unn
amed
Meadow Dr
Kayne Rd
Skyr
idge
Dr
North Hillcrest Dr
Rosemary Ln
Con
rad
St
Harbison Dr
South Ct
Blue Bird Dr
Dan
iel C
t
Copper C
t
Alley
S 6t
h S
t
N 1
st S
t
S 1s
t St
Kurtz
Ln
East
side
Hw
y
Pine St
W Main St
Golf Course Rd
Old
Cor
valli
s R
d
Dal
y A
ve
Coo
per L
n
River St
State St
Fairgrounds Rd
N 6
th S
t
N 4
th S
t
N 5
th S
t
N 3
rd S
t
N 2
nd S
t
Ravalli St
Skyline Dr
Desta St
Big
Cor
ral R
d
Tammany Ln
Lewis Ln
N 1
0th
St
S 7t
h S
t
S 8t
h S
t
Cherry St
New York Ave
Madison St
Free
ze L
n
Marcus St
Airp
ort R
d
Desmet St
Pinckney St
Grundy Ln
S 9t
h S
t
Franklin Ave
Geneva Ave
Saranac Ave
Baker St
Hattie Ln
Adirondac Ave
Alic
e A
ve
Grove St
Pennsylvania Ave
Bailey Ave
Bedford St
N D
aly
Ave
E Ravalli St
Roosevelt Ln
Prov
iden
ce W
ay
Hope Ave
Adirondac Ave
Bedford St
0 1,000 2,000
FeetFigure 3-10Year 2030 Projected Non-retail Employment UnitsInset AreaHamilton Area Transportation Plan(2009 Update) DRAFT
Census Blocks with Expected Job GrowthProjected Non-retail Jobs
Functional Classification
5 - 1920 - 3940 - 59
60 - 99100 - 500More than 500 Jobs
Principal Arterial (per FHWA)Major Collector (per FHWA)Collector (Local Designation)Local
Bitterroot RiverHamilton City LimitsRailroad
Z:\g
is\P
ublic
\MD
OT\
Ham
ilton
\MX
D\F
ig3_
10_N
R_E
mpl
oym
ent_
Inse
t.mxd

Riverside CutoffSee DetailSee Detail(Figure 3-12)(Figure 3-12)
Skalkaho Hwy
Wes
tsid
e R
d
Stock Farm Rd
Bow
man
Rd
Us
Hig
hway
93
S
Ric
ketts
Rd
Wilc
ox L
n
Orc
hard
Dr
Mill Creek Rd
Hamilton Heights Rd
Fole
y Ln
Oertli Ln
Mckillop Ln
Fish
Hat
cher
y R
d
Orion Belt Way
Slee
ping
Chi
ld R
d
Blodgett View Dr
Hon
eyho
use
Ln
Bell Ln
Jorgy Way
Roaring Lion Rd
West River Rd
Hawker Ln
Oilw
ell R
d
Wyant Ln
Arrow H
ill Dr
Duus Ln
Fros
t Ln
Pond
eros
a D
r
Rose LnU
nnam
ed
Blodgett Camp Rd
Lovers Ln
Elk Ridge Rd
West Hills Way
Coa
ch L
n
Lincoln Ln
Mariah Ln
Stacy Ln
Joy
St
Gra
nt L
n
Krue
ger L
nNighthawk Ln
N Gold Creek Loop
Mcc
arth
y Lo
op
Ashlin Ln
West Bridge Rd
Har
vey
Ln
Maki Dr
Sunh
awk
Ln
Yeria
n Ln
War
bler
Ln
Mihara Ln
Hub
Ln
Rum
mel
Ln
Aren
a R
d
Mason Ln
Saw
yer
Ln
Springhill Rd
Hilltop D
r
Sawtooth Ln
Nic
ol L
n
Wal
l St
Kaib
ab T
rl
Salmon Way
Har
mon
y W
ay
Two
Hor
se L
n
Chads Rd
Cartwright Way
Noland Dr
Sshe
nsh
Trl
Md Cir
River Farm Trl
Laur
ie W
ay
Mus
tang
Ln
Ced
ar S
tPalf iena Trl
Qua
il R
un
Som
eesc
h Ln
Meadowlark Ln
Wap
iti Lo
op
Long
Ln
Dia
mon
d 3
Rd
Ellingwood Ln
Stewart Ln
Lulu Ln
Arbo
r Ln
Merlin Watch Rd
Cas
e Ln
Birc
h S
t
Meadow Dr
East
side
Hw
y
Bass Ln
Golf Course Rd
N 1
st S
t
Tammany Ln
S 1s
t St
Old
Cor
valli
s R
d
Kurtz
Ln
Coo
per L
n
Black Ln
Pine St
W Main St
Skyl
ine
Dr
Dal
y A
ve
Fairgrounds Rd
N 2
nd S
t
Ravalli St
Desta St
Big
Cor
ral R
d
N 1
0th
St
S 8t
h S
t Ham
ilton
Airp
ort
Free
ze L
n
Marcus St
Airp
ort R
d
Grundy Ln
Gen
eva
Ave
Grove St
Bedford St
0 0.5 1
MilesFigure 3-11Year 2030 Projected Retail Employment UnitsHamilton Area Transportation Plan(2009 Update) DRAFT
Census Blocks with Expected Job GrowthProjected Retail Jobs
5 - 1920 - 39
40 - 59More than 60 Jobs
Functional ClassificationPrincipal Arterial (per FHWA)Major Collector (per FHWA)Collector (Local Designation)Local
Preliminary Study Area BoundaryBitterroot RiverRailroad
Z:\g
is\P
ublic
\MD
OT\
Ham
ilton
\MX
D\F
ig3_
11_R
_Em
ploy
men
t.mxd

Riverside Cutoff
0
0
0
Ric
ketts
Rd
S 4t
h S
t
S 3r
d St
Mill
St
N 7
th S
tWest River Rd
N 8
th S
t
Dor
an L
n
Alley
Gra
ntsd
ale
Rd
Hon
ey L
n
Nicol Ln
Oertli Ln
Blue
Ln
Weber D
r
Stock F
arm R
d
Angel Ln
Nol
and
Dr
High R
d
Md Cir
River Farm Trl
Jonc
ar C
t
Bunt
Ln
Bayberry LnWestwood Dr
Daly Mansion Rd
Foxfield StW
inkl
er L
n
Antigone Dr
Livi
s Ln
Blodgett View Dr
Wer
th L
n
Sky West Ln
Mer
gans
er L
n
Shady Ln
Silverado Trl
Flower St
Parker St
Arbo
r Ln
Tailgate Ln
Win
ners
Way
China Silk Way
S 6th St
Sage
Ln
Vict
or S
t
Tammany HlManhattan St
E Desmet St
Villa
Ct
Theb
ian
Ln
Unn
amed
Meadow Dr
Kayne Rd
Skyr
idge
Dr
North Hillcrest Dr
Rosemary Ln
Con
rad
St
Harbison Dr
South Ct
Blue Bird Dr
Dan
iel C
t
Copper C
t
Alley
S 6t
h S
t
N 1
st S
t
S 1s
t St
Kurtz
Ln
East
side
Hw
y
Pine St
W Main St
Golf Course Rd
Old
Cor
valli
s R
d
Dal
y A
ve
Coo
per L
n
River St
State St
Fairgrounds Rd
N 6
th S
t
N 4
th S
t
N 5
th S
t
N 3
rd S
t
N 2
nd S
t
Ravalli St
Skyline Dr
Desta St
Big
Cor
ral R
d
Tammany Ln
Lewis Ln
N 1
0th
St
S 7t
h S
t
S 8t
h S
t
Cherry St
New York Ave
Madison St
Free
ze L
n
Marcus St
Airp
ort R
d
Desmet St
Pinckney St
Grundy Ln
S 9t
h S
t
Franklin Ave
Geneva Ave
Saranac Ave
Baker St
Hattie Ln
Adirondac Ave
Alic
e A
ve
Grove St
Pennsylvania Ave
Bailey Ave
Bedford St
N D
aly
Ave
E Ravalli St
Roosevelt Ln
Prov
iden
ce W
ay
Hope Ave
Adirondac Ave
Bedford St
0 1,000 2,000
FeetFigure 3-12Year 2030 Projected Retail Employment UnitsInset AreaHamilton Area Transportation Plan(2009 Update) DRAFT
Census Blocks with Expected Job GrowthProjected Retail Jobs
5 - 1920 - 39
40 - 59More than 60 Jobs
Functional ClassificationPrincipal Arterial (per FHWA)Major Collector (per FHWA)Collector (Local Designation)Local
Bitterroot RiverRailroad
Z:\g
is\P
ublic
\MD
OT\
Ham
ilton
\MX
D\F
ig3_
12_R
_Em
ploy
men
t_In
set.m
xd