sohrab ghaedi - met
TRANSCRIPT

DOI:10.28974/idojaras.2019.4.7
521
IDŐJÁRÁS Quarterly Journal of the Hungarian Meteorological Service
Vol. 123, No. 4, October – December, 2019, pp. 521–534
The variability and trends of monthly maximum wind speed over Iran
Sohrab Ghaedi
Shahid Chamran University of Ahvaz Khuzestan province, 6137873397Ahvaz, Iran
Author E-mail: [email protected]
(Manuscript received in final form October 8, 2019)
Abstract⎯ The maximum wind speed trends over Iran were analyzed based on the data recorded at 49 synoptic stations in Iran, including at least 40 years of data. The regions with maximum winds in Iran are most often seen in the Zagros Mountain. The nonparametric Mann–Kendall test at 95 % level of significance was used to survey whether there is a trend for the maximum wind speed data. Sen’s slope estimator was also used to determine the magnitude of the trends. The results reveal that the rate of positive trend is much higher than the negative trend and, in some months, it reaches more than 57% throughout the territory of Iran. Line slope is positive in 86.7% of the country’s area. The increasing wind speed can have significant negative impacts on installations and structures, erosion, human health, evapotranspiration, and wind energy. Key-words: maximum wind, trend, Mann-Kendall test, Sen Slope estimator, Iran
1. Introduction
Climate system is a complex set of elements and factors whose interaction leads to fluctuations or changes in the system. Many studies on climate change have been done on only one of the climatic elements. Many changes, variations, and trends are not the result of one element alone, and are the result of interaction of several climatic elements and factors (Tuller; 2004). Wind speed indicates the
522
impact of different elements influencing one another. Therefore, the study of wind speed trends can reveal climate changes. Wind is not only a reflection of the atmospheric general circulation characteristics, but it is also a source of climatic renewable energy. (Liu; 2000).
According to the report of the Intergovernmental Panel on Climate Change (IPCC), global warming has resulted in an increase of natural disasters such as floods, droughts, storms, etc. in the world (IPCC; 2014). Storms and maximum winds are among the most devastating natural disasters. Windstorms cause more than half of the economic loss associated with natural disasters in Europe (Munich; 2007). Ulbrich et al. (2013) believe that windstorms have been the most costly natural hazard in Europe. Long-term variations in near-surface wind speed have a marked impact on a variety of applications including wind energy, building construction, coastal erosion, and evaporation rates, among others (Troccoli et al.; 2012). To achieve optimal design balance between safety and design costs, must be accurately estimated extreme wind speeds (Chiou et al.; 2012).
Research regarding changes in maximum wind speeds at the national level is important for the sustainable utilization of wind energy and the mitigation of disasters caused by extreme winds. This research is also useful to estimating the cost of electricity generating from wind, wind industry planning and grid maintenance (Ying et al.; 2013). In general, the results of studies regarding the trends of winds, maximum winds, gusts, and storms can be classified into three categories. Most of this research indicates a decrease in their trends.
Vautard et al. (2010), using data from 822 weather stations in the northern mid-latitudes, showed that surface wind speeds a drop of between 5% to 15% during a thirty-year period (1979 – 2008). A statistically significant decline was also reported between 1980 and 2005, dropping 5% (equivalent to 0.02 ms-1 per year) across the network. Negative trends are similarly found in the PRECIS-Re data in the UK by Hewston and Dorling (2011). McVicar et al. (2012) analyzed 148 studies reporting surface wind speed trends from across the globe, and found that the average trend was –0.014 ms-1 for studies with more than 30 sites observing data for more than 30 years. Ying et al. (2013) found that the annual and seasonal maximum wind speed, the frequency of gale days, and the wind speed in the troposphere and lower stratosphere declined from 1956 to 2004 (especially in winter) in China. Azorin-Molina et al. (2014) analyzed wind speed trends in the Iberian Peninsula and found a slight downward trend for the annual mean wind speed of −0.016 ms-1 per decade for 1961–2011 and −0.010 ms-1 per decade for 1979–2008. Baule and Shulski (2014) at several locations in the Beaufort/Chukchi Sea coastal region of the Arctic found negative trends in wind speed at several locations, particularly at locations in Alaska. Romanic´ et al. (2015) reported statistically significant negative trends of the Koshava wind speeds and wind activity observed at all five weather stations, which have been more pronounced for wind speeds above 5 ms-1. Brazdil et al. (2016) surveyed the variability of maximum wind gusts in the Czech Republic and found statistically
523
significant decreases (deepest in November and in autumn), with the exception of spring (for stations above 300 m) and summer. Minola et al. (2016) studied near-surface wind speed trends in Sweden and found downward trends of −0.06 and −0.14 ms-1 per decade for annual mean wind speed of periods 1956–2013 and 1979–2008, respectively. Laapas and Venalainen (2017) found a negative trend in the analysis of monthly mean and maximum wind speed time series in Finland during 57 years.
Other have achieved positive and negative trends in the regions in their studies.
Yan et al. (2002) found an increasing trend of 0.2 ms-1 per decade, which had prevailed over the ocean, in contrast to a decreasing trend of -0/1 m s-1 per decade prevailing over continental Europe in summer. Bronnimann et al. (2012) studied extreme winds at northern mid-latitudes since 1871, and noticed that the annual 98th percentile of wind speed exhibits changes towards more extreme winds in the North Atlantic storm track region (or a pole-ward shift), decreasing wind extremes over the northern subtropics (especially China), and an equator-ward shift of the Pacific storm track. Klink (2015) analyzed seasonal patterns and trends of the fastest 2-min winds at coastal stations in the conterminous USA and concluded, there were positive trends in winter, spring, and summer, while negative trends are frequent in autumn.
Some studies indicate an increase in their trends: Kruger et al. (2010) surveyed 94 weather stations in South Africa and reported average annual maximum wind gusts having increased by +0.09 ms-1 in a decade. In Switzerland, Usbeck et al. (2010) estimated the increase of maximum gust wind speeds and severe winter storm damages in both amount and frequency from 1858 to 2007. Fujii (2007) found in Japan that 10 min mean wind speed greater than 20ms-1 increased 1.5-fold from 1976–1985 to 1996–2005. He also reported the incidence of wind speed greater than 35 ms-1.
As to the variability of wind speeds, several explanations have been given including decreases in horizontal atmospheric pressure gradients (Guo et al.; 2010), increased surface roughness surrounding the observed sites (Vautard et al.; 2010), natural climatic variability (Pirazzolli and Tomasin; 2003), time period chosen for analysis (Troccoli et al.; 2012), and influences of changes in the observing instrumentation/firmware (Pryor et al.; 2009).
The aim of this paper is to present a comprehensive analysis of monthly and annual maximum wind peak trend in Iran based on instrumental measurements with respect to their spatiotemporal trends.
2. Data and methodology
Iran is located in the southwestern of Asia (25–39°N, 44–63 °E) and consists most of the Iranian Plateau. Persian Gulf and the Oman Sea are situated in the southern
524
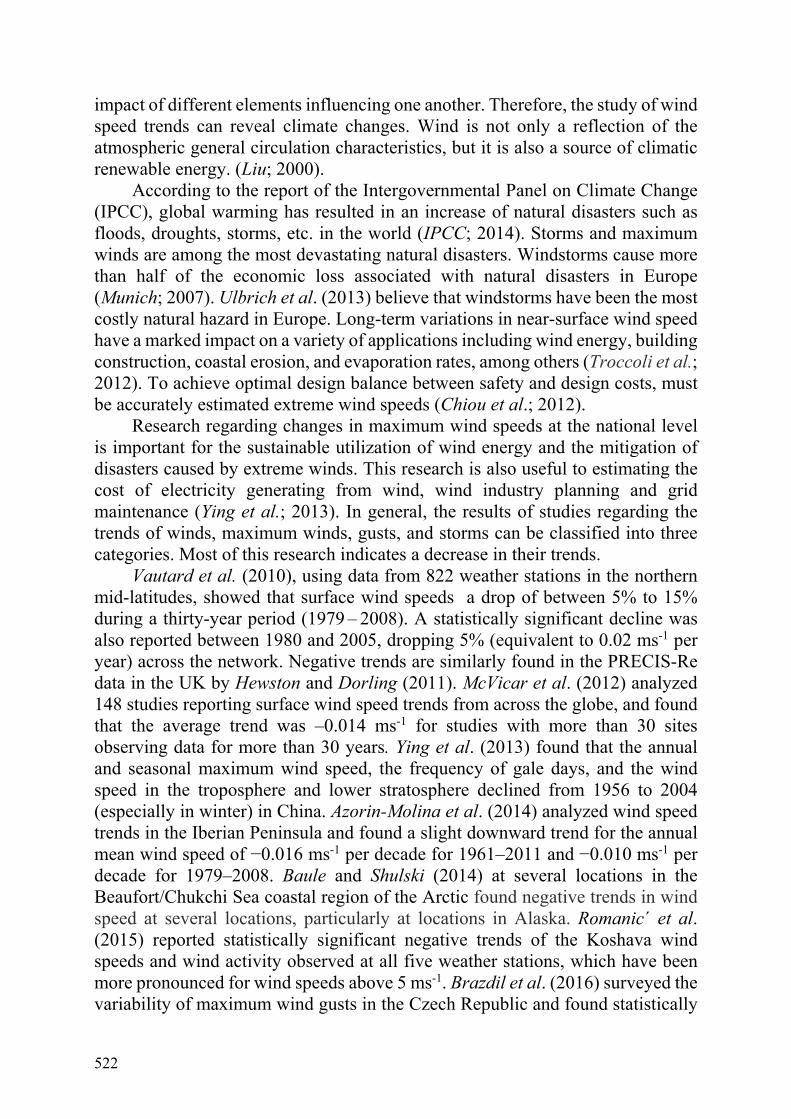
of Iran and the Caspian Sea in the north (Fig. 1). This country is one of the world’s most mountainous countries, with its landscape dominated by rugged mountain ranges and populous western and northern part is the most mountainous, with ranges such as the Zagros and the Alborz Mountains (Rahimzadeh et al., 2011).
Fig. 1. Position and elevation of stations
The monthly maximum wind speed is the highest wind speed observed in the period of every month, and is measured for every station, along with the associated month of occurrence. The first few Iranian meteorological stations have been launched since 1951. Although the number of stations has gradually increased during the time, the statistical period in many of them is short, thus reducing the accuracy of the trend statements. In this study, the researcher observed wind speeds measured at the standard 10-meter height at 49 stations across Iran run by the meteorological organization in the variability period of 1951–2015. Therefore, the selected stations had a history of at least 40 years of data.
Since the data from the stations represent points rather than areas, the simple Kriging interpolation method is used to generalize point data to the area. There are several methods for interpolation among which Kriging is one of the most commonly used method in climatology (Cellura, 2008; Li et al., 2016). The Kriging method provides the best unbiased linear estimation which the weights of the sample values is estimated based on the variogram model. (Moral, 2010).
525
2.1. Classification and zoning of maximum wind
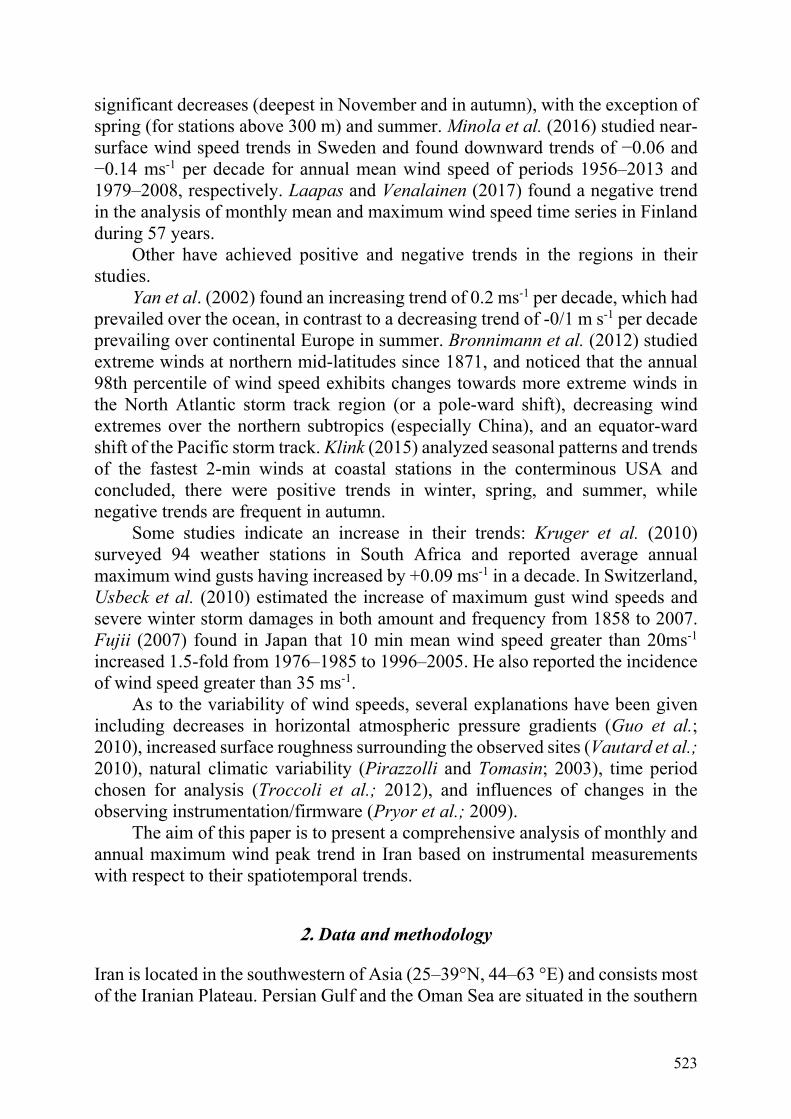
A cluster analysis on annual average of maximum wind showed that Iran can be classified into four regions. The value of maximum wind average varies between 8 and 20.77 ms-1. A discontinuous strip from the northwest to the southeast, located on the Zagros Mountains, and an area in the northeast show the severest maximum winds. The lowest wind speed was observed in a discontinuous strip from the southwest to the southeast and on a relatively extensive region in the northeast. Fig. 2 represents the classification of annual average of maximum winds over Iran.
Fig. 2. Classification of annual average of maximum winds over Iran.
2.2. Monthly trends
Table 1 represents the areas with their percentage of the monthly and annual maximum wind speed trends. According to these values, the trend of the maximum wind speed over Iran is seen in all conditions: neutral, positive, and negative. The most frequent case is related to no trend situation, which varies in percentage from 42.3 (May) to 85.2 (December). The percentage of areas with negative trends in most months is very low, with the highest ones in June and July, and even in January, March, April, September, November, and December there is no point with a negative trend. The area with a positive trend is much higher than negative. This is observed in many areas of the country with a monthly average

526
of about 38.3%. Annual average shows that in more than half of Iran’s territory, the maximum wind speed is incremental. The highest ones are observed from May to August and the lowest trends are seen from September to February. Spreading of the area with positive trend in the warm months shows that either the gradient of pressure in these months is increased or the amount of roughness is decreased.
Table 1. Percentage of areas with monthly and annual maximum wind speed trends
Jan Feb Mar Apr May Jun Jul Aug Sep Oct Nov Dec Ann
Negative trend
0.0 0.1 0.0 0.0 0.2 1.2 1.8 0.7 0.0 0.3 0.0 0.0 0.9
No trend 83.0 69.0 57.0 47.8 42.3 46.0 61.2 49.1 65.0 65.4 65.0 85.2 41.0
Positive trend
17.0 30.9 43.0 52.2 57.5 52.8 37.0 50.2 35.0 34.3 35.0 14.8 58.1
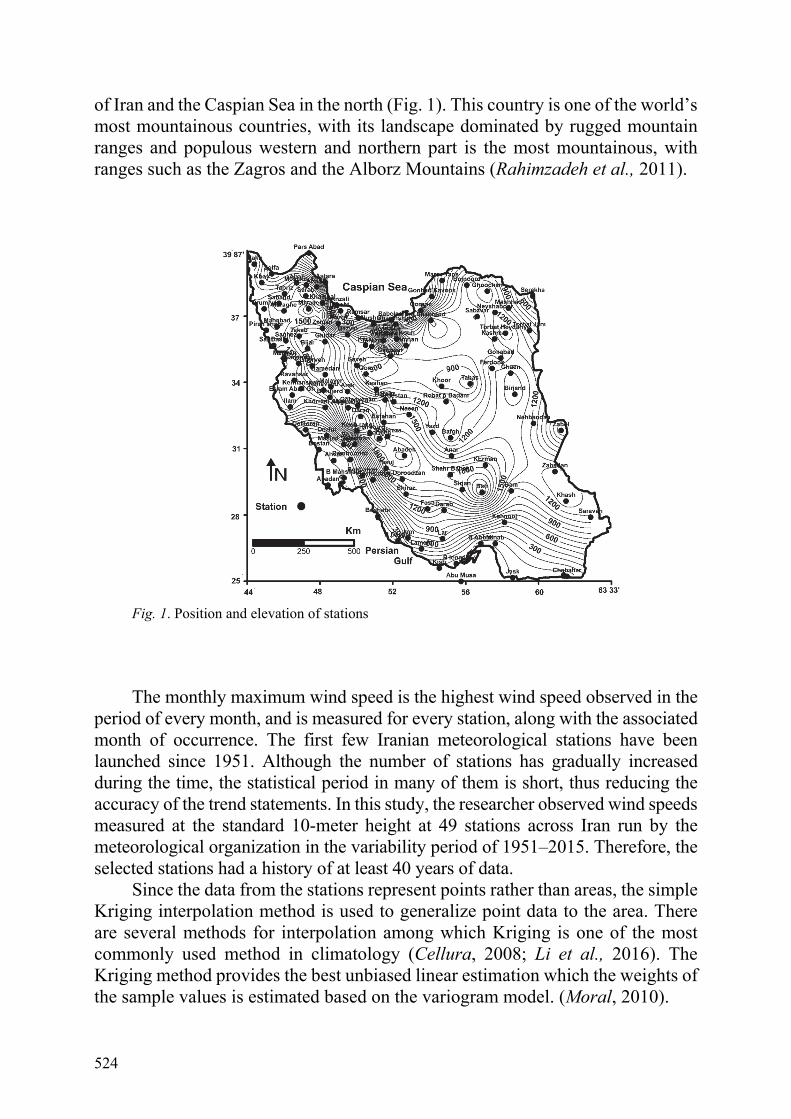
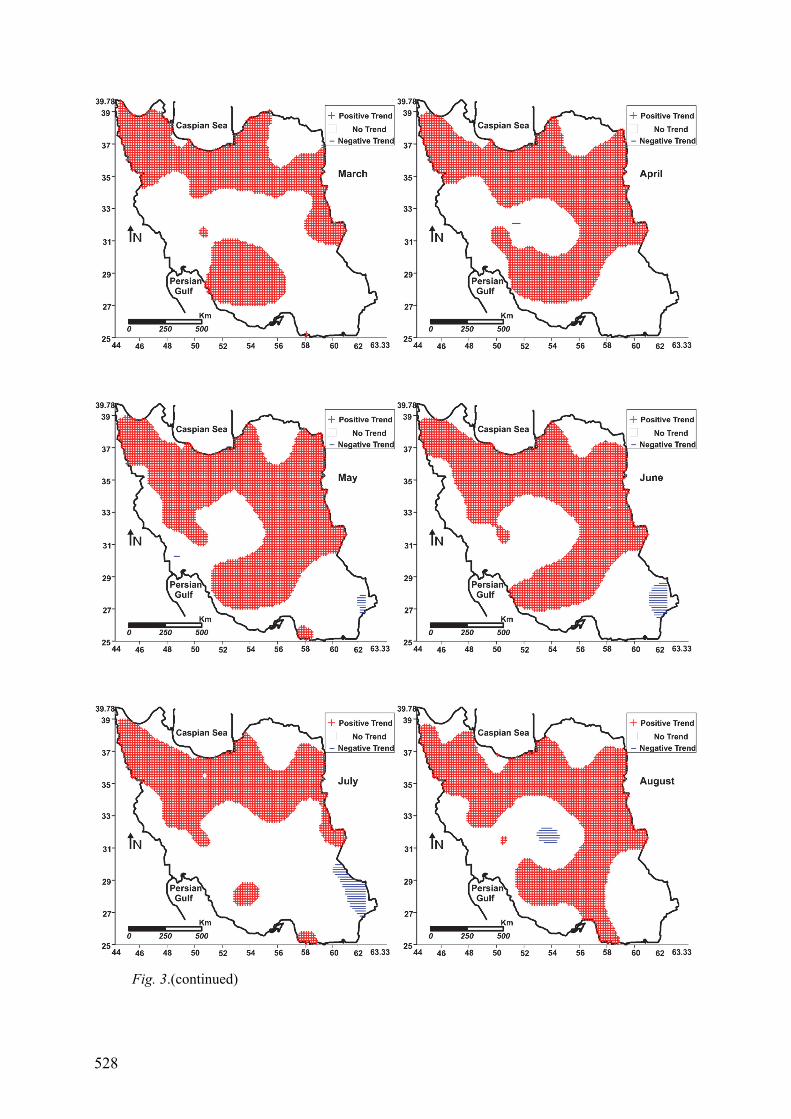
Fig. 3 presents the spatial distribution of monthly maximum wind speed in the territory of Iran. “Red plus” and “blue line” symbols have been used to show positive and negative trends, respectively. According to Table 1, the trend is positive in 17% of the area of Iran in January. Discontinuous regions of Zagros and Alborz Mountains, the southern coasts of the Caspian Sea, and the central, northeastern, and eastern regions of the country show a positive trend. In this month there is no negative trend in any part of the country. In February, the magnitude of the positive trend and the extent of the regions with a negative trend is increased. During this month, in addition to the regions that showed positive trends in January, other areas in the northwest and Jask also show a positive trend, while negative trend can be seen only in the northwest. The positive trend increases dramatically in March and covers about 43% of the territory of Iran. This is due to the increasing positive trend in the northwest and the center. Like in January, negative trend can’t be observed at any station. In April, the areas with a positive trend are increased, but this increase has been in the central and eastern regions. Northwestern areas have experienced a decrease. The extent of the regions with a negative trend is lower than 1% in the central region of the country. The highest positive trend is related to May. Exactly in this month, there is an area with a negative trend in the southeast. After May, the area of the positive trend gradually decreases until it falls to the lowest value in December. Of course, this decline is in the negative trend and the area of regions without trend is incremental. An increase in the negative trend was seen only in the southeast and a 4.7% decrease in the positive trend along with slight changes in the regions is the difference between June and May. The highest negative trend area is related to July (1.8%), but the extent of positive trend has decreased. In August, limited
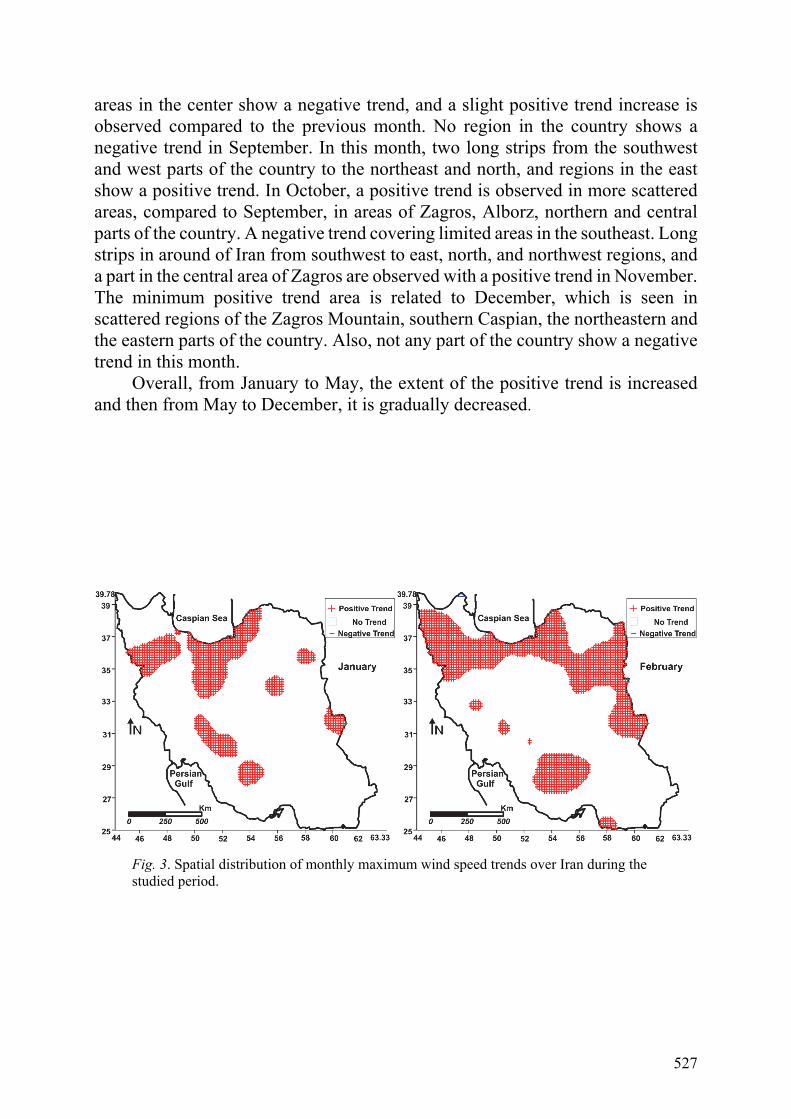
527
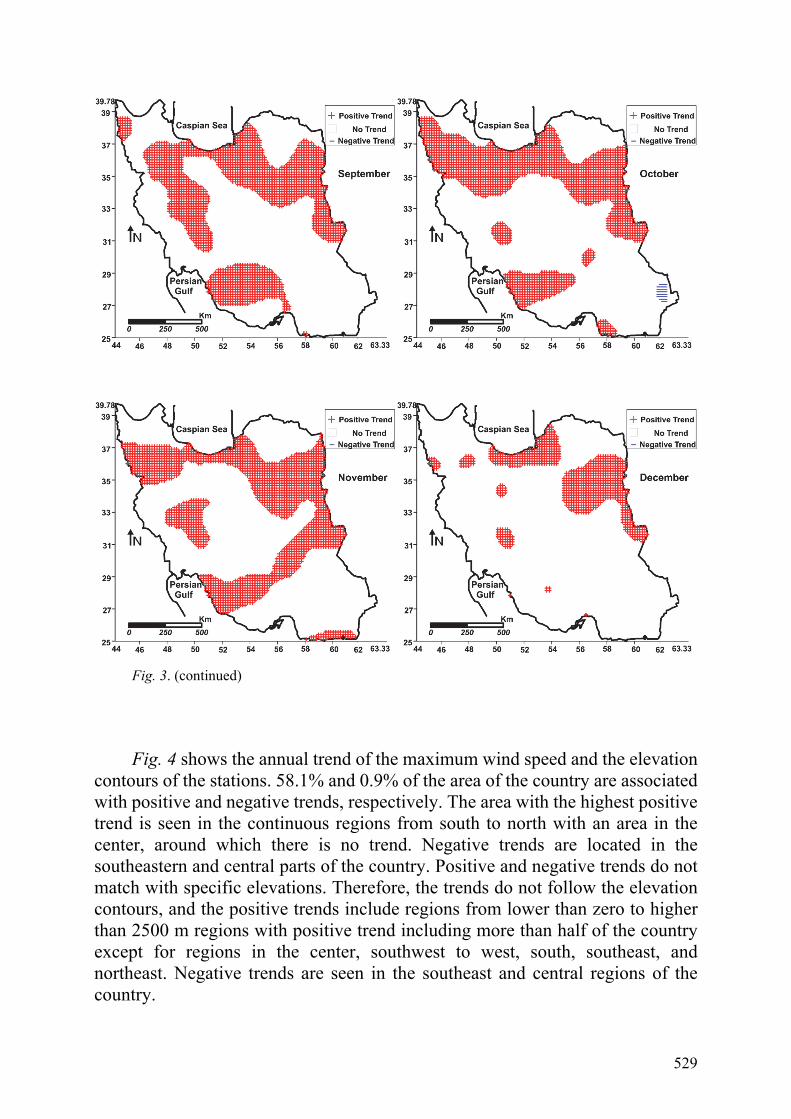
areas in the center show a negative trend, and a slight positive trend increase is observed compared to the previous month. No region in the country shows a negative trend in September. In this month, two long strips from the southwest and west parts of the country to the northeast and north, and regions in the east show a positive trend. In October, a positive trend is observed in more scattered areas, compared to September, in areas of Zagros, Alborz, northern and central parts of the country. A negative trend covering limited areas in the southeast. Long strips in around of Iran from southwest to east, north, and northwest regions, and a part in the central area of Zagros are observed with a positive trend in November. The minimum positive trend area is related to December, which is seen in scattered regions of the Zagros Mountain, southern Caspian, the northeastern and the eastern parts of the country. Also, not any part of the country show a negative trend in this month.
Overall, from January to May, the extent of the positive trend is increased and then from May to December, it is gradually decreased.
Fig. 3. Spatial distribution of monthly maximum wind speed trends over Iran during the studied period.
528
Fig. 3.(continued)
529
Fig. 3. (continued)
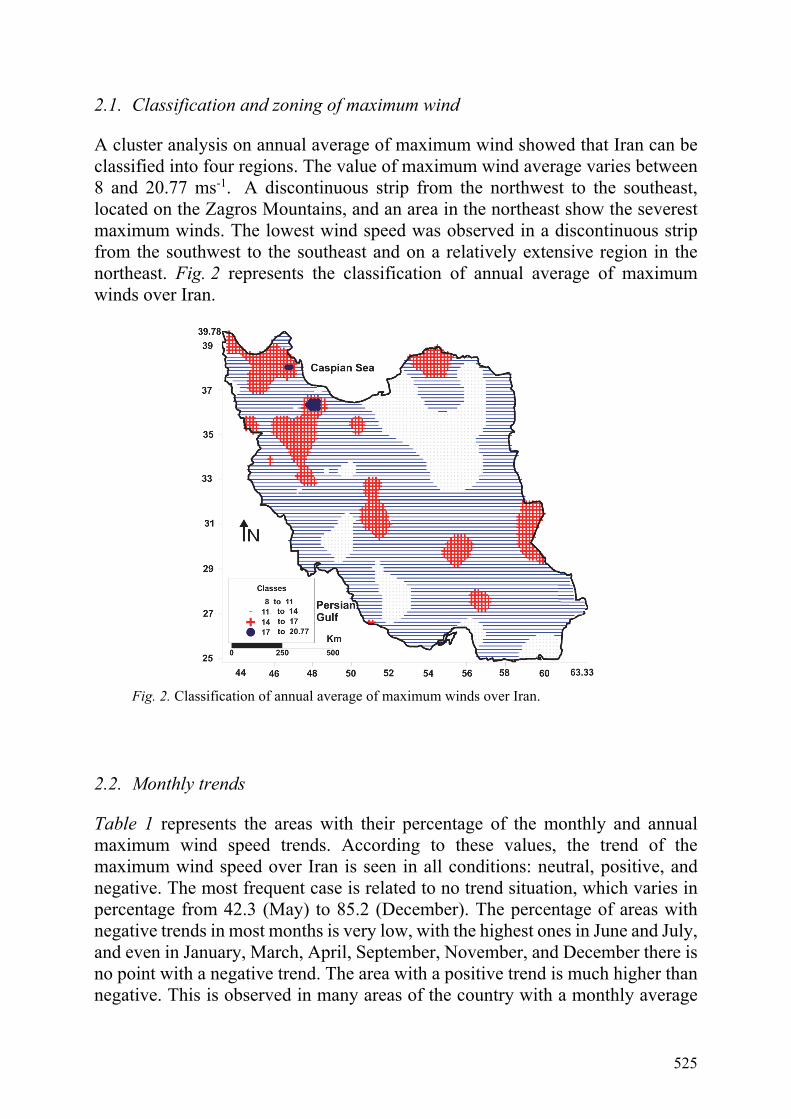
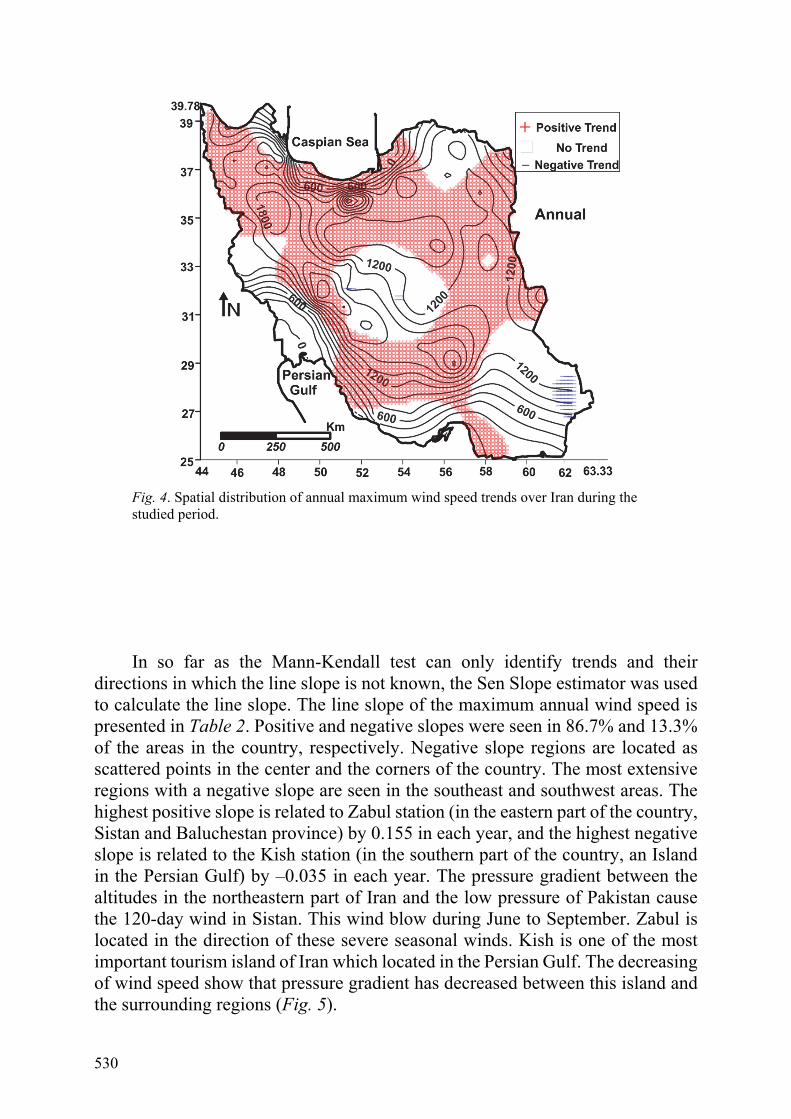
Fig. 4 shows the annual trend of the maximum wind speed and the elevation contours of the stations. 58.1% and 0.9% of the area of the country are associated with positive and negative trends, respectively. The area with the highest positive trend is seen in the continuous regions from south to north with an area in the center, around which there is no trend. Negative trends are located in the southeastern and central parts of the country. Positive and negative trends do not match with specific elevations. Therefore, the trends do not follow the elevation contours, and the positive trends include regions from lower than zero to higher than 2500 m regions with positive trend including more than half of the country except for regions in the center, southwest to west, south, southeast, and northeast. Negative trends are seen in the southeast and central regions of the country.
530
Fig. 4. Spatial distribution of annual maximum wind speed trends over Iran during the studied period.
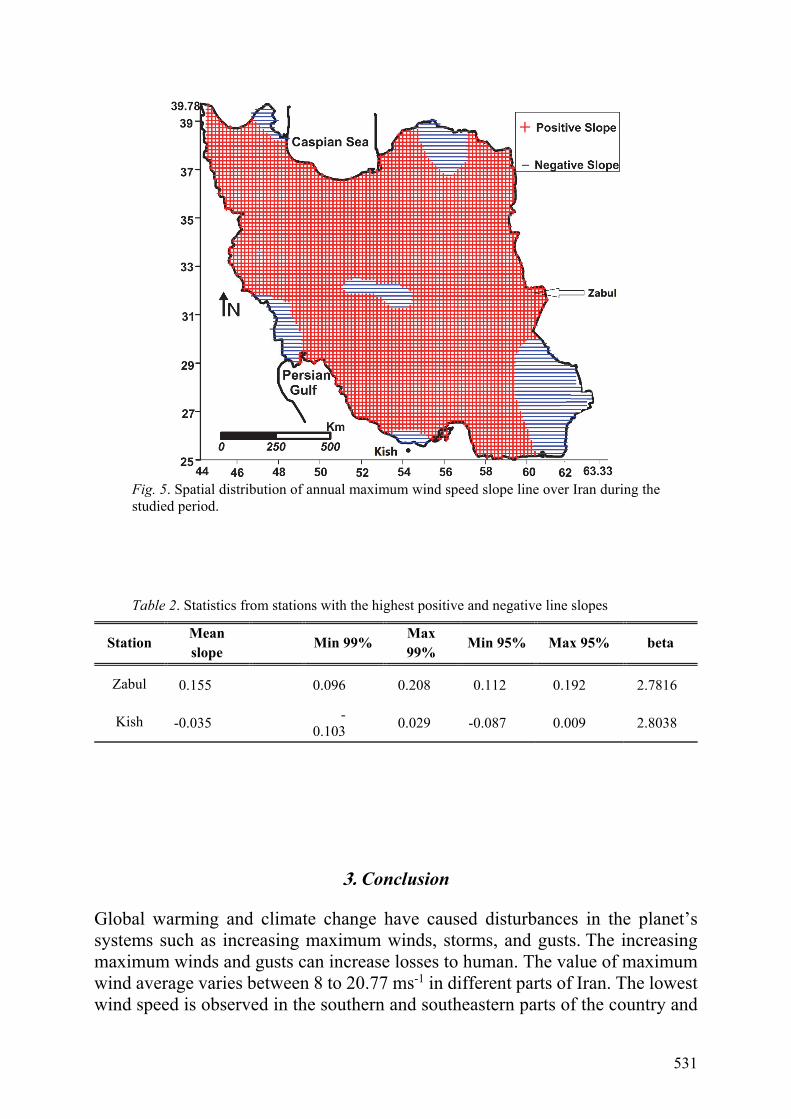
In so far as the Mann-Kendall test can only identify trends and their directions in which the line slope is not known, the Sen Slope estimator was used to calculate the line slope. The line slope of the maximum annual wind speed is presented in Table 2. Positive and negative slopes were seen in 86.7% and 13.3% of the areas in the country, respectively. Negative slope regions are located as scattered points in the center and the corners of the country. The most extensive regions with a negative slope are seen in the southeast and southwest areas. The highest positive slope is related to Zabul station (in the eastern part of the country, Sistan and Baluchestan province) by 0.155 in each year, and the highest negative slope is related to the Kish station (in the southern part of the country, an Island in the Persian Gulf) by –0.035 in each year. The pressure gradient between the altitudes in the northeastern part of Iran and the low pressure of Pakistan cause the 120-day wind in Sistan. This wind blow during June to September. Zabul is located in the direction of these severe seasonal winds. Kish is one of the most important tourism island of Iran which located in the Persian Gulf. The decreasing of wind speed show that pressure gradient has decreased between this island and the surrounding regions (Fig. 5).
531
Fig. 5. Spatial distribution of annual maximum wind speed slope line over Iran during the studied period.
Table 2. Statistics from stations with the highest positive and negative line slopes
beta Max 95% Min 95% Max 99%
Min 99% Mean
slope Station
2.7816 0.192 0.112 0.208 0.096
0.155 Zabul
2.8038 0.009 -0.087 0.029 -
0.103
-0.035 Kish
3. Conclusion
Global warming and climate change have caused disturbances in the planet’s systems such as increasing maximum winds, storms, and gusts. The increasing maximum winds and gusts can increase losses to human. The value of maximum wind average varies between 8 to 20.77 ms-1 in different parts of Iran. The lowest wind speed is observed in the southern and southeastern parts of the country and

532
the highest is observed in Manjil and Ardebil (more than 17 ms-1). This is true for the discontinuous parts of the Zagros Mountain as a belt extending from northwest to southeast, and a relatively small region in the east of the Caspian Sea. The investigation of monthly and annual maximum wind speeds indicates that all the three states of positive, negative, and no trend can be seen in Iran. The most prevalent state is related to no trend, which changes between 42.3% (annual) and 85.2% (December). The percentage of the area with positive trend changes between 57.5% (annual) and 14.8% (December). The area with negative trend is very insignificant (less than 2%). The line slope of the annual maximum winds is presented in Table 2. Positive and negative slopes are seen in 86.7% and 13.3% of the areas of the country. Negative slope regions are located as scattered points in the center and the corners of country. The most extensive regions with a negative slope are seen in the southeastern and southwestern parts of the country.
Any effective factor on pressure gradient and roughness can change the speed of winds and gusts. Drying of the country's water areas, including lakes and lagoons, has increased the temperature in these areas and has increased their pressure gradient with regions surrounding them (like the Urmia Lake and the Bakhtegan Lake). Destruction of forests in the Zagros Mountain and in the northern part of the country has led to decreasing the roughness, and the result is an increase in the wind speed. On the other hand, the temperature increase in the high pressure regions has led to a decrease in the pressure gradient as well as in the wind speed (southeastern area). In the centra and eastern regions, the occurrence of dust has decreased the wind speed. Broadly speaking, there are different reasons for each region in Iran due to specific environmental conditions. These cases of increased maximum wind speed have strong negative impacts on installations and structures, erosion, human health, evapotranspiration, and wind energy, therefore, necessary measures are obligatory to be taken to reduce the negative consequences.
References
Azorin-Molina, C,. Vicente-Serrano S. M., McVicar T. R., Jerez S., Sanchez-Lorenzo A., López-Moreno J. I., Revuelto J., Trigo R. M., Lopez-Bustins J. A., and Espirito-Santo F., 2014: Homogenization and Assessment of Observed Near-Surface Wind Speed Trends over Spain and Portugal, 1961–2011. J. climate 27, 3692–3712.https://doi.org/10.1175/JCLI-D-13-00652.1
Baule, W.J. and Shulski, M.D., 2014: Climatology and trends of wind speed in the Beaufort/Chukchi Sea coastal region from 1979 to 2009. Int. J. Climatol. 34, 2819–2833. https://doi.org/10.1002/joc.3881
Brazdil, R., Hostynek, J., Reznickova, L.R., Zahradnicek, P., and Tolasz, R., 2016: The variability of maximum wind gusts in the Czech Republic between 1961 and 2016. Int. J. Climatol 37,1961–1978, https://doi.org/10.1002/joc.4827
Bronnimann, S., Martius, O., von Waldow, H, Welker C, Luterbacher, J, Compo, G.P., Sardesmukh, P.D., and Usbeck, T., 2012: Extreme winds at northern mid-latitudes since 1871. Meteorol. Z. 21, 13–27. https://doi.org/10.1127/0941-2948/2012/0337
533
Cellura, M., Cirrincione, G., Marvuglia, A., and Miraoui A., 2008: Wind speed spatial estimation for energy planning in Sicily: Introduction and statistical analysis, Renew. Energy. 33, 1237–1250. https://doi.org/10.1016/j.renene.2007.08.012
Chiou, P., Miao, W., and Ho, T.C., 2012: The Annual Maximum Wind Speed at Pisa Airport in Italy, Int. J. Environ. Sci. Develop. 3, 258–262. https://doi.org/10.7763/IJESD.2012.V3.227
Fujii, T., 2007: On geographical distributions and decadal changes of the annual maximum wind speeds caused by typhoons in Japan. J. Nat. Disaster Sci. 26, 267–277 (in Japanese with an English abstract).
Guo, H., Xu, M., and Hu, Q., 2010: Changes in near-surface wind speed in China: 1965–2005. Int. J. Climatol. 31, 349–358. https://doi.org/10.1002/joc.2091
Hewston, R. and Dorling, S.R., 2011: An analysis of observed daily maximum wind gusts in the UK. J. Wind Eng. Ind. Aerodyn. 99, 845–856. https://doi.org/10.1016/j.jweia.2011.06.004
IPCC, 2014: Synthesis report. Contribution of working groups I, II and III to the Fifth Assessment Report of the Intergovernmental Panel on Climate Change [Core Writing Team, R.K. Pachauri and L.A. Meyer (Eds.)]. IPCC Geneva Switzerland.
Klink K., 2015: Seasonal patterns and trends of fastest 2-min winds at coastal stations in the conterminous USA. Int. J. Climatol. 35, 4167–4175. https://doi.org/10.1002/joc.4275
Kruger, A.C., Goliger, A.M., Retief, J.V., and Sekele, S., 2010: Strong wind climatic zones in South Africa. Wind Struct.13, 37–55. https://doi.org/10.12989/was.2010.13.1.037
Laapas, M. and Venalainen, A., 2017: Homogenization and trend analysis of monthly mean and maximum wind speed time series in Finland. 1959–2015. Int. J. Climatol. 37, 4803–4813. https://doi.org/10.1002/joc.5124
Li, X., Meshgi, A., and Babovic, V., 2016: Spatio-temporal variation of wet and dry spell characteristics of tropical precipitation in Singapore and its association with ENSO. Int. J. Climatol. 36, 4831–4846. https://doi.org/10.1002/joc.4672
Liu, X.N., 2000: The homogeneity test on mean annual wind speed over China. J. Appl. Meteorol. Sci. 11, 27–34. (In Chinese).
McVicar, T.M ., Roderick, M.L. Donohue, R.J. Li, L.T. Van Niel, T.G. Thomas, A. Grieser, J. Jhajharia, D. Himri, Y. Mahowald, N.M. Mescherskaya, A.V. Kruger, A.C. Rehman, S., and Dinpashoh, Y., 2012: Global review and synthesis of trends in observed terrestrial near-surface wind speeds: Implications for evaporation. J. Hydrol. 416–417, 182–205. https://doi.org/10.1016/j.jhydrol.2011.10.024
Minola, L., Azorin-Molina, C., and Chen, D., 2016: Homogenization and assessment of observed near-surface wind speed trends across Sweden. 1956–2013. J. Climate 29, 7397–7415. https://doi.org/10.1175/JCLI-D-15-0636.1
Moral, F.J., 2010: Comparison of different geostatistical approaches to map climate variables: application to precipitation. Int. J. Climatol. 304, 620–631. https://doi.org/10.1002/joc.1913
Munich, R.E., 2007: Zwischen Hoch und Tief — Wetterrisiken in Mitteleuropa, Edition Wissen. Publication of the Munich Re, Order Number, 302-05481, www.munichre.com (In German)
Pirazzolli, P.A. and Tomasin, A., 2003: Recent near-surface wind changes in the central Mediterranean and Adriatic areas. Int. J. Climatol.238, 963–973. https://doi.org/10.1002/joc.925
Pryor, S.C., Barthelmie, R.J., Young, D.T., Takle, E.S., Arritt, R.W., Flory, D., Gutowski, W.J, Nunes, A., and Roads, J., 2009: Wind speed trends over the contiguous United States. J. Geophys. Res. Atmosphere 114 D14. https://doi.org/10.1029/2008JD011416
Rahimzadeh, F., Noorian, A.M., Pedrama, B.M., and Michael, C.K., 2011: Wind speed variability over Iran and its impact on wind power potential: a case study for Esfahan Province. Meteorol. Appl. 182, 198–210. https://doi.org/10.1002/met.229
Romanic, D.C., uric, M., Jovicic, I., and Lompar, M., 2015: Long-term trends of the ‘Koshava’ wind during the period 1949–2010. International J. Climatol. 352, 288–302. https://doi.org/10.1002/joc.3981
Troccoli, A., Muller, K., Coppin, p., Davy, R., Russell, C., and Hirsch, A.l., 2012: Long-term wind speed trends over Australia. J. Climate 25, 171–184. https://doi.org/10.1175/2011JCLI4198.1
Tuller, S.E., 2004: Measured wind speed trends on the west coast of Canada. Int. J. Climatol. 24, 1359–1374. https://doi.org/10.1002/joc.1073

534
Ulbrich, U., Leckebusch, G.C., and Donat, M.G., 2013: Windstorms, the most costly natural hazard in Europe. Natural Disasters and Adaptation to Climate Change.. Cambridge University Press: Cambridge. UK.
Usbeck, T., Wohlgemuth, T., Dobbertin, M., Pfister, C., Burgi, A., and Rebetez, M., 2010: Increasing storm damage to forests in Switzerland from 1858 to 2007. Agric. Forest Meteorol.150, 47–55. https://doi.org/10.1016/j.agrformet.2009.08.010
Vautard, R., Cattiaux, J., Yiou, P., Th´epaut, J.N., and Ciais, P., 2010: Northern Hemisphere atmospheric stilling partly attributed to an increase in surface roughness. Nat. Geosci. 3, 756–761. https://doi.org/10.1038/ngeo979
Yan Z., Bate S., Chandler R E., Isham V., and Wheater H., 2002: An Analysis of Daily Maximum Wind Speed in Northwestern Europe Using Generalized Linear Models. J. Climate 15, 2073–2087. https://doi.org/10.1175/1520-0442(2002)015<2073:AAODMW>2.0.CO;2
Ying, J., Yong, L., and Zongci, Z., 2013: Maximum wind speed changes over China. Acta Meteorology Sinica, 27, 63–74. https://doi.org/10.1007/s13351-013-01