collectionscanada.gc.cacollectionscanada.gc.ca/obj/s4/f2/dsk1/tape2/pqdd_0028/mq50343.… · sol...
TRANSCRIPT

SOU CARBON DYNAMICS IN A NITROGEN-ENRICHED GRASSLAND
Christina Melanie Heidorn
A thesis submitted in confonnity with the tequirements for the degree of Master of Science
ûraduate Deparmient of Botany University of Toronto
Q Copyright by Christh MeIanie Heidom 2000

National Library BiblioWge nationale du Cana
Aquisitions and Acquisitions et Bibliographie Services services bibliogiogiaphiques
The author has gcanted a non- L'auteur a accordé une licence non exclusive licence aiiowing the exclusive pemiettant à la National Library of Canada to Bibliothèque nationale du Canada de reproduce, loan, disttlibute or seU repduire, prêter, distniuer ou copies of this thesis in microform, vendre des copies de cette thèse sous paper or electronic formats. la fome de microfichelfilm, de
reproduction sur papier ou sur format électronique.
The author retains ownership of the L'auteur conserve la proprieté du copyright in this thesis. Neither the droit d'auteur qui protège cette thèse. thesis vor substantial extracts fiom it Ni la thèse ni des extraits substantiels may be printed or o t h d s e de celle-ci ne doivent être imprimés reproduced without the author's ou autrement reproduits saus son pamission. autorisation.
cana!!

SOL CARBON DYNAMICS IN A NITROGEN-ENRICHED GRASSLAND
Christiaa Melanie Heidom. Department of Botany, University of Toronto
Mastet of Science, 1999
Soil organic carbon (SOC) dynamics wen investigated in a grassland where 13 years of N
fertilization shifted vegetation fiom C, to C, species. The k t i o n of organic matter (OM) input
retained in the soil ranged fiom 1 7 to 28%. and was d e c t e d by litter quality (C :N ratio). Isotopic
composition (&I3C) of soil ranged h m -19.7 to -24.9460; there was no isotopic htionation during
formation of SOC fiom plant inputs. 6I3C of active and slow SOC pools described by the
CENTURY mode1 (W3C,, and 613C,,,,,, respectively) were estimated h m soi1 incubation data.
6I3CS,, was stiongly correlateâ to &I3C of OM inputs during 13 years. The size of the active p l
ranged h m 1.9 to 13.6% of total SOC and was related to plant growth aad species diversity.
6I3C,, did not reflect 6I3C ofrecent OM inputs. Any interpntatiion of 6I3C,, must consider the
plant and physicai conditions when sampling occurred.

The process of scientific research and Wting is both fantastically fun and tembly difficult at times,
and 1 owe a debt of gratitude to the members of my excellent supe~sory cornmime, who guided
me on the joumey. To David Wedin, for providing me with a chaiienging and interesthg project
that allowed me to use my engineering skilis to explore the field of biology, and for his enthusiasm
and excellent jokes. To Barbara S h e m d Lollar, for letting me leam, leam, leam in the lab, and
for her sympathy and support in difficult times. I especially wish to thank Robert Jefferies, for his
patience a d kindness, and the t h e and energy he spent editing this document and getting me to the
defense. nisnk you for haWig faith in me.
In the Stable Isotope Lab, John Laasdowu, Neil Amer, Stephui Taylor and Greg Slater provided
expert advice and assistance, and made the lab a truiy fun place to work. Special thanl<s to Deborah
Tarn and Kristina Damjanovic h m the Botany Department, who provided many h o w of labour and
without whom I wouid probably still be in the lab. 1 also thank Heather Peat and Bill Draper for
being mat Iab and office mates.
If ever there was a project that was a team effort, this is it, Although this document bears only my
name, 1 couid not have completed tbis work without the dogged determination of many friends to
see me t h u g h it. That it was completcd at aii is a testament to their unwavering and generous
support. Among those who have, in one way or another, helped me make it are my brother, Oliver,
my parents, Wuif and Helga Heidom, Martin G d , Paul Norbo, Wendy Untereiner, Shem
Charleton, Damll Barker and David Anthoay. I thsnk Heather Poilard, the best Heathet in the
world, for teaching me the meaning of the word 'unconditional', and for pointing out everything
that's good about hot sauce. 1 thank Sue and Emma Dexter, directors of the Centre Des Études, for
their niendship and support, and for pointing out to me that 'everyone h o w s you put eggs in the
cake!'. I thank Sean Oraham fot his kindness and excellent advice, and for sharing my love of
iegumes and gariic. I th& Greg Slatet for stupid liquid nitrogen tricks, flaming propanol aud the
'cray old man pants' dance. 1 couldn't have done it without you. And finally, I thanlr Ruchi Sud
for her support in the final push. Ker deliveries of homemade food kept me h m starvation.

This document is dedicated in loving memory to my grandfather,
Dr. Erwin Hartmann, and to Wintiied Ilgenstein.
Sitting beside the road, watcbg the wagon mount the hiiî toward her, Lena thinks, 'I have corne h m Alabama: a fur piece. Ail the way h m Alabama a-walkjng. A fur piece.'
h m 'Light in August', William Faulkner, 1932

TABLE OF CONTENTS
... Acknowledgements ........................................................... ui
Table of Contents .............................................................. v
List of Tables ................................................................. x
List of Figures .............................................................. xii
List of Equations ............................................................ xiv
1 . BACKGROUND ........................ ................................. 1
1.1 Introduction ......................................................... 1
1.2 The Role ofsoil ûrgmic Matter ........................................ 2 1.2.1 Plant-Soii Interactions ......................................... 3
................................ 1.2.2 SOM in the Globd Carbon Cycle 3
...................................... 1.3 Classification of SOM Components 4 ................................................... 1.3.1 Definition 4
1 . 3.2 Early SOM Classifications ...................................... 4 1.3.3 Modem SOM Classifications .................................... 6
1.3.3.1 Non-humic Substances ................................. 6 1.3 .3.2 Kumic Substances ..................................... 6
1.3.4 Ecological Relevance of SOM Classifications ...................... 7
......................................... 1.4 Mechanisms of SOM Formation 7
1.5 Factors Affecting SOM Decomposition ................................... 9 ................................................ 1.5.1 inputFactots 9
.............................. 1.5.1.1 LitterQualityandQuantity 9 ..................................... 1.5.1.2 Litter Placement 10
............................................. 1.5.2 Matrix Effects - 1 1 ......................... 1.5.2.1 Soi1 MoishneandTernperature 1 1
...................................... 1.5.2.2 Nmient Status 1 1 ................... 1 52.3 Drying/wetting and Freedthaw cycles 14
......................................... 1.5.2.4 Soif Texture 14 ....................................... 1.52.5 SoilStnicture 14
................................. 1.5.2.6 Effiect of Cultivation -15


2.1.1 CedarCnekNatural History Axea .............................. -41 2.1.1.1 Location ........................................... 41 2.1.1.2 History ............................................ -41 2.1.1.3 Vegetation and SoiI ................................... 42 2.1.1.4 Secondary Succession on Old Agricuiturai Fields at CCNHA . -42
................................................... 2.1.2 FieldB -43 2.1.2.1 History ............................................. 43 2.1 2 2 Experimental N-gradient .............................. -43 2.1.2.3 Vegetation .......................................... 46 2.1.2.4 Species Characteristics ................................ 48 2.1.2 5 Precipitation ....................................... -51
2.2 Sampling Methods .................................................. 52 2.2.1 Soi1 Sampling ............................................... 52 2.2.2 Vegetation Sampling ......................................... 52
2.3 Soi1 Incubation Method ............................................... 53 2.3.1 Incubation Chambers ......................................... 53 2.3.2 CO2 Collection and Sampling .................................. 55 2.3.3 Isotopic Analysis of Soi1 Respired CO, ........................... 55 2.3.4 Elernental Adysis of Soii Respired CO, ......................... 56 2.3.5 Estimation of SOM Pool S k s and Isotopic Composition h m
........................................ Soi1 Respiration Data -56 ..................... 2.3 .5.1 Calcdation of Soil Respiration Rate -56
............................... 2.3 S.2 Curve Fittbg Procedure 56 ......................... 2.3.5.3 Calculationof Active Pool Size 58
................. . 2.3 5.4 Calcdation of Active and Slow Pool 613C 59
.......................................... 2.4 Soi1 Decarbonation Method -60
............. 2.5 Combustion Method for V3C Measunments of ûrganic Sarnples -60 2.5.1 R e a g e n t h ~ t i o n .......................................... 61
.......................................... 2.5.2 Sample Preparation 61 ................................... 2.5.3 Sample Loing Procedure -62
................................................ 2.5.4 Combustion 63 ........................................ 2.5.5 Cryogenic Pwification 64
................................................. 2.6 Elemental Anaiysis -65
.............. 2.7 Reconstruction of Vegetation History and Past Inputs to the Soil 65
............................................... 3.1 Vegetation qrilamics -67 ............................ 3.1.1 NetnimaryPdUCfion(1982-1994) 67

3.1.2 Species Composition (1 982-1994) .............................. -67 3.1.3 C, BiomassandProportionofC, mdC4 Species ................... 70 3.1.4 Effect of Drought ............................................ 73 3.1.5 Estimation of 6°C of OM 1nput (1982-1994) ...................... 73 3 . L -6 implications for SOM Pools ................................... 75
3.2 Buik Soi1 Anaiyses .................................................. 78 32.1 Initiai Butk Soi1 Carbon Content and 6°C Values (1982) ............. 78 3.2.2 Final Buik Soi1 Carbon Content (1994) ........................... 78
3.2.2.1 Bulk Density Comction ............................... 78 3.2.3 F M Bulk Soi1 6°C (1994) .................................... 79
... 3.2.4 Efficiency of Soi1 Carbon Sequestration in Plots of C, and C, Species 8 L 3.2.4.1 Estimation of %Cm .................................. -83
3.2.4.1 .a Calculation of Turnover Rate of "Old" C .......... 83 ..................... 3.2.4.1.b Calcuiationof%C, in Soil 85
32.5 Reconstruction of OM input h m Bulic Soi1 b"C ................... 86
3.3 ActiveSOMPoolSize ............................................... 87 3.3.1 Respiration Rate Pattern and C w e Fit ........................... 87 3.3.2 Size ofthe Active SOM Pool ................................... 91
3.4 Isotopic Composition of Slow and Active SOM Pools ...................... 92 3 -4.1 Reconstruction of Bulk Soil Isotopic Composition fiom &'3C,w
................................................. and WC,. 95
4 . DISCUSSION ............................................................ 97
4.1 Vegetaîion Dynamics ................................................ 97 4.1.1 C, and C, Dyaamics .......................................... 97 4.1.2 Effcct of Drought ............................................ 97
4.2 Bulk Soi1 Carbon Dynamics ........................................... 99 4.2.1 Effects of Site History on Soil Organic Carbon ..................... 99
4.2.1. 1 Initial Soi1 Conditions ................................. 99 4.2.1.2 Final Soi1 Conditions ................................. 99
............................................ 4.2.2 b'3CSoilvs.NPP 99 4.2.3 Reconsüuction of OM inputs h m Bulk Soil Muisurrments ......... 101
....................... 42.3.1 Fidelity of Isotopic Composition 101 4.2.3.2 Limitations of OM Input Reconstruction from
.............................. BUlkSoil Measurements 102 4.2.4 Efficiency of Soil Carbon Sequestration in Plots of CI and C, Species . L03
4.2.4.1 Effect of Species Composition on Litter Quality ........... 103 4.2.4.2 Effect of Litîer Quaiiîy on Soi1 Catôon Sequesîration ....... 104

4.3.1 Justification of Estimation Method For Active Pool Size fiom Respuation Rate Data ....................................... 106
............. 4.3.2 Pattern of Active SOM pool Size Along the N Gradient 107 4.3.3 Factors Affecthg Soi1 Microbial Biomass ........................ 108
4.3.3.1 EffectofPlantGmwthStage .......................... 110 4.3.3.2 Soi1 Moisture ....................................... 111 4.3.3.3 Net Piimary Production .............................. 112 4.3.3 . 4 Nitrogen Fertiliraton ................................ 112 4.3.3.5 Plant Species and Species Diversity ..................... 113
.... 4.3.4 Factors M i t i n g Non-Microbial Component of Active SOM Pool 114
4.4 Isotopic Composition of Active and Slow SOM Poois ...................... I l 5 4.4.1 Calcdation of Isotopic Compositions ........................... 115 4.4.2 Reconstruction of Bulk Soü Isotopic Composition Fmm 6l3CdV
and OI3C., ................................................ 116 4.4.3 Pattern of Slow SOM Pool Isotopic Composition Values Along the
N Gradient ................................................ 117 4.4.4 Pattern of Active SOM Pool Isotopic Composition Values Along the
................................................. NGradient 118 .... 4.4.4.1 Exchange of Carbon Between the Active and Slow Pools 119
4.4.4.2 E f k t of Fertiüzation on the Isotopic Composition of Plants . 1 19 4.4.4.3 Sample Hanâiing .................................... 119
......... 4.4.4.4 Variability Among Plant Biochemical Components 120 ............ 4.4.4.5 Microbial Fractionation Duting Decomposition 121
5 . CONCLUSIONS ......................................................... 123
APPENDIX A: PROCEDURAL TESTS ...................................... A 4
A.1 IncubationMethOd ................................................ A 4 A.1.1 Syringe Injection Technique ................................. A-l A.1.2 Storage Effects of Incubation Chambers ........................ A 4 A . 1.3 Effect o f 4 Concentration on Soil Respiration Rate and 6% of
Respired CO, ............................................ A-2 A . 1 A Effmt of CO, Concentration on Soi1 Respiration Rate and 6°C ..... A-3
............................................... A.2 Combustion Method A 4
................................... APPENDIX B: EXCLUSION OF PLOT 8-39 B-1

Table 1-1
Table 1-11
Table 1-III
Table 1-IV
Table I -V
Table 1-VI
Table 1-W?
Table I -VIU
Table 2-1
Table 2-II
Table 2-III
Table 1-IV
Table 2-V
Table 2-VI
Table 3-1
Table 3-II
Table 3-III
Physical factors and their effects on SOM decomposition rates .............. 12
SOM pool sizes and hunover times for some SOM models ................. 21
Driving variables of some SOM models ............................... -22
Validations of some SOM models .................................... 22
Environmental factors that affect the isotopic composition of bulk plant tissue ......................................................... -34
Intraspecific variation of 6l3C in terrestrial plant species .................. 35
Differences in 613C between different plant tissue types ................... 35
Differences in &13C between plant biochemical h t ions and whole plant .......................................................... tissue 36
N-addition rates for the nine treatments in the experimental fertilization .. gradient ............................ .... ... ............... 45
Aboveground relative abundance of the three dominant species in Field B ......................................................... in1992 47
Four measures of tissue q d t y in above- and belowground biomass of the thee dominant species in this study ................................. -49
Root:shoot ratios of the three dominant species in this study .............. -50
List of samples analyzed for carbon isotopic composition using the combustion method .............................................. -64
Parameters used in estimation of amount and isotopic composition of plant input to the soil for 1982- 1994 ....................................... 66
h-treatment (1982) and post-treatment (1994) bulk soil C content and .............................................. isotopic composition 79
......................... Data used in the calculation of %C lost in T9 .. 83
.. Data used in the cafculation of %C retained in each treatments ......... ,. 85
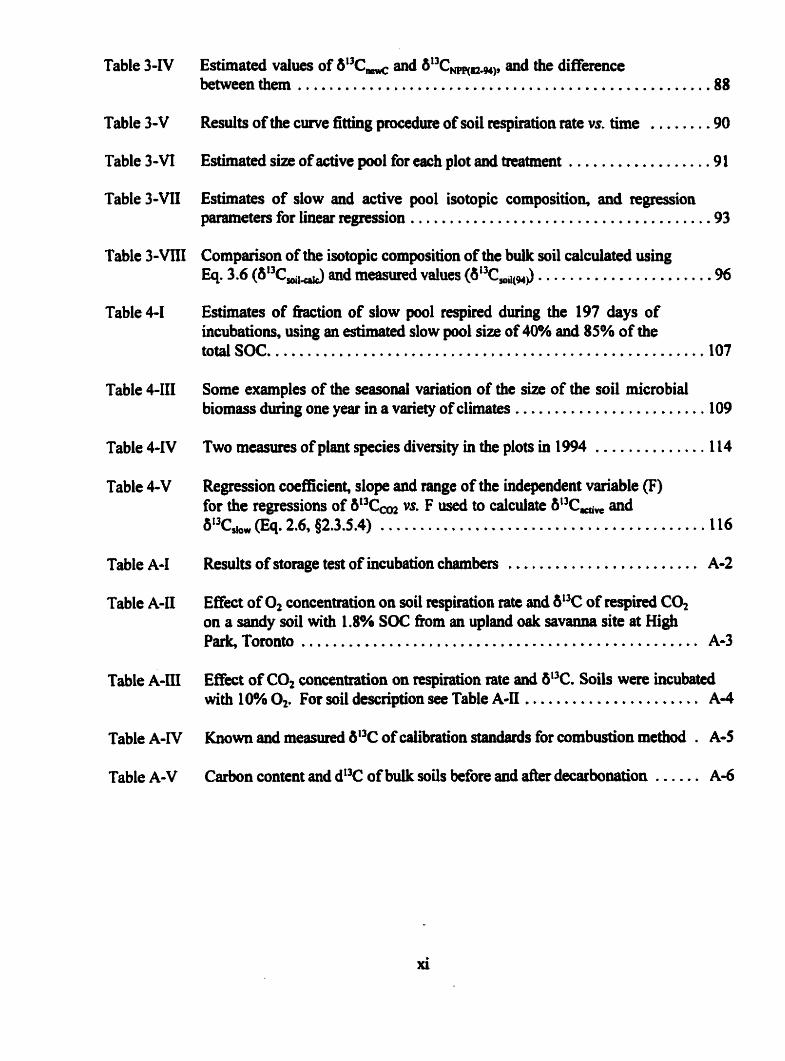
Table 3-IV
Table 3-V
Table 3 4 1
Table 3-VII.
Table 3-Vm
Table 4-1
Table 4-III
Table 4-iV
Table 4-V
Table A-1
Table A-II
Table A-III
Table A-iV
Table A-V
Estimated values of ot3C, and b " C m n , and the Merence between them . . . . . . . . . . . . . . . . . . . . . .. . . . . . . . , . . . . . . . . . . . . . . . . . . . , -88
Results of the cuwe fitting procedm of soii respiration rate vs. time . . . . . . . -90
Estimated size of active pool for each plot and treatment . . . . . . . . . . . . . . . . . .91
Estimates of slow and active pool isotopic composition, and regression parameters for hear regression . . . . . . . . . . . . . . . . . . . . . . . . . . . . . . . . . . . . . -93 Cornparison of the isotopic composition of the buik soi1 calculated using Eq. 3.6 (IUCmil& and measund values (6i3C,Mw,,S . . . . . . . . . . . . . . . . . . . . . -96
Estimates of fiaction of slow pool respired during the 197 days of incubations, using an estimated slow pool size of 40% and 85% of the totalSOC. .. ....... .. ..... . ..... ......... .... ... ...... ...... .... 107 Some examples of the scssonal variation of the s k of the soi1 microbial biomass d u ~ g o n e year inavariety ofclhates . . . . . . . . . . . . . . . . . . . . . . . . log
Two meames of plant species diversity in the plots in 1994 . . . . . . . . . . . . . -114 Regression coefficient, slope and range of the independent variable (F) for the ngressions of it3Ccoa vs. F used to calculate b'FhW and buCslOw (Eq. 2.6, $2.3.5.4) . . . . . . . . . . . . . . . . . . . . . . . . . . . . . . . . . . . . . . . . .Il6 Results of storage test of incubation chambers . . . . . . . . . . . . . . . . . . . . . . . . A-2
Effcct of 4 concentration on soi1 respiration rate and 6°C of respked CO2 on a sandy soi1 with 1.8% SOC h m an upland oak savanna site at High Park, Toronto . . . . . . . . . . . . . . . . . . . . . . . . . . . . . . . . . . . . . . . . . . . . . . . . . . A-3
Effect of CO, concentration on respiration rate and 6%. Soils were incubated with 10% Op For soi1 description see Table A 4 . . . . . . . . . . . . . . . . . . . . . . A-4
Known and measured W3C of calriration standards for combustion method . A4
Catbon content and dt3C of buik mils before and after dewôonation . . . . . . A 4

Fig . 1.1
Fig . 1.2
Fig . 1.3
Fig . 1.4
Fig . 1.5
Fig . 1.6
Fig 1.7
Fig . 1.8
Fig . 1.9
Fig . 2.1
Fig . 2.2
Fig . 2.3
Fig . 2.4
Fig . 2.5
Fig . 2.6
Fig . 2.7
Fig . 3.1
Estimated C pool sizes and annual fluxes between terrestrial. marine and atmospheric compartments ............................................. 2
Simplified acid-aW SOM fktionatioa scheme ............................ 5
Schematic diagram of four ptoposed formation mechanisnu for humic substances . . 9
The effects of temperature and moisme on OM decomposition rate fiom two ....................................................... SOMmodeIs 13
.................. Microbial decomposition as a series of first-order reactiom -17
Schematic diagram of theC submodel of the CENTURY mode1 ............... 24
...... Stable carbon isotope ratios of major components of terrestrial ecosystems 29
Stable carbon isotope ratios of temstnai plants grouped by photosynthetic ........... mechanism. aquatic plants. atmospheric CQ and marine carbonates -29
............. 6°C of plant biochemicai fkactions relative to whole plant material 37
Pattern of (a) secondary succession. and @) soi1 C storage in abandoneci agricuitural fields at CCNHA .......................................... 44
Dominant species and successionai patterns in early. mi& and late successional fields at CCNHA .................................................... 45
Total biomass vs . total soi1 nitrogen of A . repenr. P . pratensis. and S. scopmium grown on a soii N gradient ............................................ 50
Annuai precipitation at CCNHA beîween 1982 and 1994 ..................... 51
Schematic diagrams of incubation chambers ............................... 54
Iliustration of the non-linear curve fit of respiration rate vs . tirne .............. -58
Schematic diagram of the vacuum manifold used for evacuation of ampoules during sampte preparation, and for cryogenic purification of CO2 samples for
..................................................... isotopic analysis 63
Treatment means of total NPP (aboveground and belowground) for the period 1982 to 1994 ....................................................... 68

Fig. 3.2
Fig. 3.3
Fig. 3.4
Fig. 3.5
Fig. 3.6
Fig. 3.7
Fig. 3.8
Fig. 3.9
Fig. 3.10
Fig. 3.1 1
Fig. 3.12
Fig. 3.13
Fig. 3.14
Fig. 3.15
Fig. 4.1
Species distribution aftet 13 years of fertilization, estimated fiom long-terni vegetation data . . . . . . . . . . . . . . . . . . . . . . . . . . . . . . . . . . . . . . . . . . . . . . . . . . . . . .69
Estimated aboveground C, biomass (a) and proportion (O) between 1982 and 1994 for controls, low N (TZ, T3), medium N (T4, TS), and bigh N (T6, T7, T8) treaûnents . . . . . . . . . . . . . . . . . . . . . . . . . . . . . . . . . . . . . . . . . . . . . . .71
Relative and absolute amounts of C, production for 1982-94 . . . . . . . . . . . . . . . . . .72
Estimated total aboveground biomass between 1982 and 1994 for controls plots and plots that received low N, medium N, and high N additions . . . . . . . . . . . . . . .74
Treatment means of estimated annual ii3C,, for 1982-94 . . . . . . . . . . . . . . . . . . . .75
Treatment means of estimated cumulative &"Cm for thne periods: 1982-1994, 1990-94ad1994 ....... .... . .... ........ .... .... ......... ... . . . . . . . 77
Treatment meaas of values of a%,, for 1994 (solid black lim) and values of cumulative 613C, for 1982 to 1994 (solid grey lhe) . . . . . . . . . . . . . . . . . . . . . . . .BO Final 6I3C, vs. cumulative 613C, . . . . . . . . . . . . . . . . . . . . . . . . . . . . . . . . . . . . . . 8 1
Final soil carbon content in 1994 vs. total cumulative organic matter input (total cumulative NPP h m 1982 to 1994) . . . . . . . . . . . . . . . . . . . . . . . . . . . . . . . .82
Schematic diagram of the conceptuai mode1 useâ to calculate the turnover rate of old &a ushg Eq. 3.2 . . . . . . . . . . . . . . . . . . . . . . . . . . . . . . . . . . . . . . . . . . . .84
The percentage of OC input retained in the soil (%Cd vs. cumulative C, proportion (1982-94) for al1 plots . . . . . . . . . . . . . . . . . . . . . . . . . . . . . . . . . . . . . . .86
A typical example of soi1 respiration rate vs. tirne . . . . . . . . . . . . . . . . . . . . . . . . . . -89
Tnatment means of the estimateci size of the active SOM pool . . . . . . . . . . . . . . . -92 Treatment means of estimated isotopic composition of (a) the slow SOM pool and 1982-1994 OM input, and @) the active SOM pool and 1990-1994 and 1994 OM input . . . . . . . . . . . . . . . . . . . . . . . . . . . . . . . . . . . . . . . . . . . . . . . . . . . . . . . . . .94
Abovegrouad (a) and belowground (b) biomass C:N ratios dong N gradients in three fields at CCNHA (Field A (a), Field B (0) and Field C (A)) after 12 years of fertiiization . . . . . . . . . . . . . . . . . . . . . . . . . . . . . . . . . . . . . . . . . . . . . .1W

LIST OF EOUATIONS
CO2 conc. x v x pco, C% rate =
I,UOO,ûOO x time seuied
total C i =
(Eq. 1.2)

active Cq(t) = /'r,(r)dt O
slow Cmsp(r) = &l~d l = l # j = rf
MTPP, x mot: s h w t , x (O/o roots,,-, BNPP, =
root turnover time (Eq. 2.8)

NPP = C NPP,
X-A y+A. 13 &'3cs0i1(w, =-* z "CsOIm CNPP(~Z -91) (Eq. 3.2)

Simpson's diversity index = 1 C (pr~prt im2 ) (Eq. 4.2)
(Eq. 4.3)
(Eq. 4.4)

1. BACKGROUND
1.1 Introduction
Vegetation inauences soi1 organic matter (SOM) dynamics, and both an involved in
processes that result in global change as they affect the pool of carbon (C) in temestrial habitats,
particulariy soi1 orgaaic carboa (SOC), and the exchange of carbon between the atmosphere and
terrestriai environments (Zepp and Sonntag, 1995).
Changes in global climate, atmospheric nitmgen (N) deposition and land use are among the
causes of the k y large sale vegetation changes in p i e s assemblages that rue happening now,
or are pndicted to happen within a few decades (Vitousek, 1994; Sûain and Thomas, 1995). For
example, large amounts of atmospheric N-deposition from anthropogenic sources are weli
documented for Europe md North Amenca (Jeffenes and Mmn, 1997) and have led to the loss of
heathlands in the Nethehds (Aerts, 1993; de Smidt, 1995). Land use changes such as defonstation
(Myers, 1 995; Jang et al., 1996), changing fire and distutbance regimes (Steuter et PL, 1990; Archer,
1 995) and abandonment of agricultural fields (ho yue et al., 1 987) have led to significant vegetation
losses that have affect4 an estimated one third to one half of the world's ice-fm land (Vitousck,
1994). There is aiso evidence of changing plant species composition due to climate change (Archer,
1995; Peat, 1997). Some of these result in a change of vegetation type (eg. gnissland to forest,
Schwartz et al., 1996). while others ase SB in plant hctionai type (eg. C,- to C3- dominated
shmbland or grasslands, D m et al., 1985; Peat, 1 997).
Although many of these vegetation shifts occur locally on a relatively s r d l spatial sale,
collectively they represent a significant alteration of the temstrial biosphere and may cesult in
changes in SOM dynamics (Houghton et al., 1983). Since SOM is a large component of the
temstrial organic C store and this pool exchanges large amounts of carbon with the atmosphere and
terrestrial biota (Fig. 1.1) it is important to determine its role in the global carbon budget. Small
relative changes in SOM dynamics may result in large absolute changes in its total C storage and its
exchange of C with the atmosphere.

110 soi/ \ ' mspimtbn \ 98
ï b n t 60 \ \
Fig. 1.1 Estimated C pool sizes and annual flues between terrestrial, marine and atmospheric compartments. Pool sizes are given in Pg C, fluxes in Pg C yrl, based on estimates in Post et al., 1982; Woodwell, 1984; Eswaran et al., 1993; Moore and Braswell, 1994; Goudriaan, 1995; Schimel, 1995; GifTord et al., 1996; and IGBP Terrestrial Carbon Wotking Group. 1998.
1.2 The Role of Soi1 Organic Matter
The importance of SOM in soi1 fertility has long been ncogaipd, but ment motivations for
studying SOM have also included its use in waste treatment and soi1 ranediation (Tate and Klein,
1985). erosion control (Pimentel et al.. 1995). and its mle in the globai C cycle (Schimel, 1995;Tate,
1995). The d e of plant-soü interactions and SOM dynamics in the global C cycle are ofparticular
devance to this study.

1.2.1 Plant-Soi1 Interactions
Soi1 organic matter links the tenesttial biosphere to the mineral environment thmugh plant-
soi1 interactions. Important feedbacks exist between plants and SOM, as plants provide most of the
organic matter input to the soi1 and SOM controls the conditions in which plants p w .
SOM affects plants by Unproving soil texture through decnased compactibility and increased
aeration, increasing water retention, and acting as a slow-relurse nutrient pool and a pH bdfkr. It
also reduces the leaching of nutrients, incnases the cation exchange capacity of the mil, and binds
biotoxins. As weil. p w i n g suisons are rnaxhized due to the dark colour of SOM which causes
soils to wam relatively quickly in the spring. In addition to these factors, soil humic compounds
can modi@ plant metabolism by iduencing membranes and ion transport in mots (Pinton et al.,
1992).
While SOM strongly affects plant growth, it is also true that plants control their soil
environment. Plant mots hold soil in place and aid in the formation of soil aggregates (Materechera
et al., 1992). they release aciûs that hciease weathering and nutrient release (Anderson, 1995),
provide habitat for soi1 microbes, and release mot exudates that stimulate the microbial biomass
and/or moderate the effect of humic substances on mots (Pinton et al., 1992; Hu et al., 1995; Tate,
1995).
1.22 SOM in the Global Carbon Cycle
SOM is a large component of global carbon stores, with an estimated 1500 Pg C in the upper
1 m of soils (Post et al., 1982; Eswaran et al., 1993)(Fig. 1.1). This amounts to roughly % of the C
stored in the temstrial biosphere, and twice the amount stokd in the atmosphere. The exchange of
C between soil and the atrnosphere is c a 60 Pg pt, or about ten times the amount celeased through
fossil fuel combustion every year. Consequently, relatively small changes in SOM dynamics,
brought about by the effiects of glotd change on net primary production (NPP) and decomposition,
codd result in large absolute changes in soi1 carbon storage and its exchange of C with the
atmosphere, thus ameliorating or worsening the global change problem.

1.3 Classification of SOM Components
1.3.1 Defmition
The tesms soi1 organic maaei and humus have been used interchangeably in the literatute.
In g e n d , SOM is defhed as aii non-living organic matter in the =il, excluding litter. This raises
the pmblem of defining the boundary between fresh Litter, decayed litter and humus dong the decay
continuum. Several approaches have been suggested, based either on a chemical me- of the state
of decomposition of the litter (eg. the lignocellulose index of Melillo et al., 1989) or on
decomposition kinetics (eg. the shift h m N-immobilization to mineralkation; Aber and Melillo,
1 MO) .
While these definitions are useful, in practice it is impossible to separate al1 fine root litter
from the soil, so that measuements of SOM usually include al1 OM in the soi1 except plant material
that is easily removed manually or by sieving, and the microbial biomass. Most SOM models
include the living soil biomass in one of th& pools. While this is not strictiy in keeping with the
above definition, it has a relatively srnall effect on soil carbon estimates, since the microbial biomass
is generally 4% of total SOM.
For the purposes of this stuày, SOM includes the soil microbial biomass and al1 non-living
SOM excluhg plant litter.
13.2 Eariy SOM Ciassifications
The fht serious attempts at determining the chemical composition of SOM tmk place in the
early 1800's, and the ht alkali extraction of SOM is attributed to Achard in 1786 (Stevenson,
1994). The classification scheme of SOM components developed during this petiod was based on
the diEeremt colours and solubilitics of SOM components in alkali and acid solutions. It fonns the
basis of t&e fiilvic acid - humic acid - humin system stiii in use today (Fig. 1.2).
The popular mode1 of SOM at this t h e was that each fiaction consisted of ody one
chemical, although this compound could be very complex. By the end of 1800's this idea was king
challenge& as it became apparent that each isolateci SOM fraction was a complex mixture of highly

variable, mody coiioidal and weakly acidic chemicals.
In the early 1900's Schreiner and Shorey discovered the existence in SOM of many
commonly known compounds such as hyckarbons, organic acids, fats and carbohydrates
(Stevenson, 1994). Furthemore, Schwnik established in the 1930's that the nmaining fiactions of
SOM, known as "humics", were mixtures of compounds, as opposed to the previously held view that
they were specific compunds (Stevenson, 1994).
HUMUS
Precipitate Humin
Solution 1 tmt wilh acid
Soluîion Precipitate Fulvic acid Humic acid
Ibht bmwn to yellow da& bmw
incrsssing polymerization incmsing mokular weight
Figure 13 Simplied acid-alkali SOM ktiomtion scheme (adapted h m Stevenson, 1994).
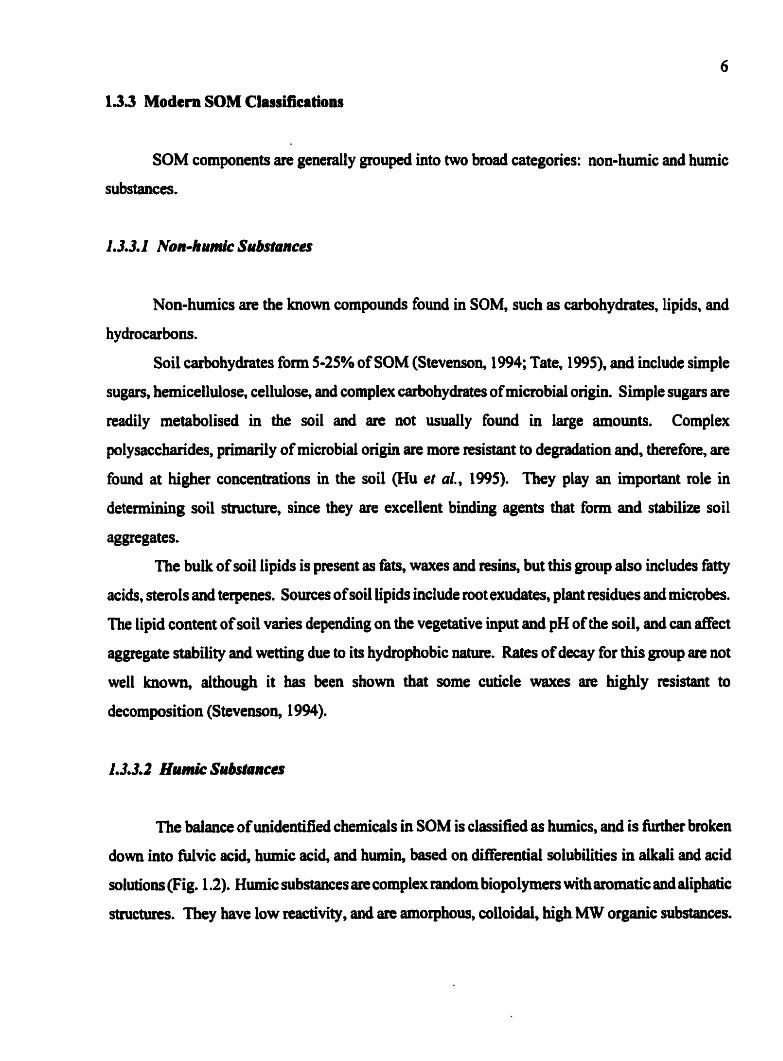
1.3.3 Modem SOM Classifications
SOM components are genedy grouped hto two broad categories: non-humic and humic
substances.
1.3.3.1 Non-bumie Substances
Non-humics are the known compounds found in SOM, such as carbohydrates, Lipids, and
hydrocarbns.
Soil carbohyhtes fom 5025% of SOM (Stevenson, 1994; Tate, 199S), and include simple
sugars, hemiceilulose, cellulose, and complex carbohydrates of micmbial origin. Simple sugars are
readily metabolised in the soil and are w t usually found in large amounts. Complex
polysaccharides. primarily of microbial origin are more nsistaut to degradation and, therefore, are
found at higher concentrations in the soil (Hu et al., 1995). They play an important role in
determining soil st~cture, since they are excellent binding agents that fom and stabilize soil
aggregates.
The buik of soi1 lipids is present as fats, waxes and resins, but this group also includes fatty
acids, sterols and terpenes. Sources of soii lipids inchde mot exudates, plant cesidues and microbes.
The lipid content of soi1 varies depending on the vegetative input and pH of the soil, and cm affect
aggregate stability and wetting due to its hydrophobie nature. Rates of decay for this group are not
well biown, although it has been shown that some cuticle waxes are highly resistant to
decomposition (Stevenson, 1 994).
The balance of unidentifid chernicals in SOM is classined as humics, and is futthet broken
d o m Uito fidvic acid, humic acid, and humin, based on differentiai solubiiities in alkaii and acid
solutions Fig. 1.2). Humic substances aze complex =dom biopolymers with aromatic and aliphatic
structures. They have Iow reactivity. and arc amorphous, colloidal, high MW organic substances.

11.4 Ecological Relevance of SOM Classüicationcl
ALkali-acid extraction techniques are still in use today and have resulted in the
characterisation of many difEerent chernical SOM fiactions However, the chemical structure of a
SOM cornpound andor its decomposabiiity under laboratory conditions do not give any information
about how the compound behaves in soil, shce decomposition is stK,ngfy affecteci by soil
conditions. Decomposition under laboratory conditions tends to be faster than in mil, probabiy
because adsorption onto clay and other soi1 materials protect organic matter (OM) fiom decay (Van
Veen and Paul, 198 1). nienfore, cheaiical extraction of SOM fiactions is of limited use because (a)
many of the measured fiactions are complex mixtures of random polyrners that are undefined, (b)
their in situ decomposition dyaamics are unknown, and (c) it does not yield ecologically fiinetional
pools.
It is more useful to have a functional definition of SOM cornponents based on their
susceptibility to decomposition. A commody held view of SOM is bat it contains a sxnaîi pool of
easily decomposable matenal (known variously as the labile, active or microbiai pool) and one or
mon pools of more recalcitrant OM (known as slow, passive, recalcitrant, or refractory pools).
These are discussed in detail beiow.
1.4 Mechanisms of SOM Formation
The small labile component of SOM is thought to contain mostiy leachates h m fnsh litter,
root exudates and microbial biomass, ie. simple compounds that degrade rapidly and corne dirrctly
h m the biota SOM extraction techniques show the presence of maay such familiar compounds,
eg. simple sugars. However, they also show the presence of some remarkably recaicitrant and
complex biopolymers that persist h soils for centuries or miilennia (Tnunbore et al., 1996; Paul et
al., 1997). As none of these compounds are fomd in plants or micmbes, and they are a siflcant
portion of total SOM, it is of interest to understaad how this ncalcitrant SOM is f o d
Despite decades of effort to elucidate this process, the= is still no collse11sus on the
mechanism. Severai theories have been proposed, and the four most common ones are illustrated
in Fig. 1.3.

The lignin theory (Pathway #1 in Fig. 1.3) was first introduced by Waksman in the 1930'9
and States that microbially modified lignin combines with amines in the soi1 to fom humic and
f'ulvic acids, ie. microbes are able to use the lignin only pattially and the midues go on to form
humus (Stevenson, 1994). This is thought to be a relatively slow process. Today this theory is
thought to be obsolete for aerobic soils, as it has been shown that Li@ decomposition is slow but
complete (Stevenson, 1994), and then is isotopic evidence tôat ligalli is not preserved (WedinetaL,
1995). However, this pathway may be important under anaerobic conditions.
The polyphenol theory(Pathway #3 in Fig. 1.3) does not mly on incornplete degradation of
lignin. Rather, it proposes that microbiai decomposition of l i p h yields phenolic aidehydes and
acids which are converted to quinones. These and quinones of microbial origin are then M e r
converted into f'ulvic or humic acids under the pnsence or absence of amino acids. The relative
importance of microbes in this process is not known. The result is a very complex, non-repeating,
random mixhlre of polymers. This theory is the most popuiar for aerobic soils.
A variation on this theory is the rnicrobial synthesis theory (Pathway #2 in Fig. 1.3) in wbich
polyphenols an synthesised by microbes h m non-Iignin carbon sources. Support for this theory
cornes nom studies where humus was formed h m non-lignin sources eg. under mosses or in gas-
saturated soils where microbes use hydrocarbon gas as substrate (Stevenson, 1994).
Sugrnemine condensation (Pathway #4 in Fig. 1.3) has also ken suggested as a pathway of
humus formation. This includes the non-enymatic polymensation of microbial products to fom
compiex biopolymers.
In generel, the formation of recalcitrant SOM is a microbially mediated process. While no
single theory explains ail situations, it is likely that ail of the proposeci mechanisms are vaüd but that
different processes dominate under different conditions (eg. aerobic vs. anaerobic mils).

Figure
Transformation by Miaoorgsnisms
V
Amino Compounds bcompositim Sugars
3 Schematic diagram of four proposed formation mechanisms for humic substances: 1. Lignin Theory, 2. Polyphenol Theory (aka. Ligninquinone Theory), 3. Micmbial Synthesis Theory, and 4. Sugar-amine Condensation Theory (da. Reduciag Sugar Theory, Browning Reaction). Adapted h m Stevenson, 1994.
HumicSubstanœs
1.5 Factors Aneeting SOM Decomposition
<
The factors affecthg SOM decomposition can be classed broadly into two categories: input
factors and matrix effféct. The former includes factors of quality and quaatity of OM inputs, while
the latter includes dl of the physical characteristics ofthe soi1 environment that affect the microbes'
ability to decornpose OM.
1.5.1 Input Factors
I.XI.1 Litter QUOI& a& Quantity
The intrinsic resistance of plant iitter to decomposition is a fiinction ofits physical structure
and chernical composition. The term litter quality uSually refefs only to the

but it must be kept in mind that microbial decomposition is also limited by physical access to OM.
Thus, small particles of plant material (eg. fine roots, ieaves) might be expected to decompose more
rapidly than large pieces (eg. large roots, wood), all other things being equai, since they have a
greater surface-to-volume ratio, allowing easier microbial access.
Many different measures of litter quality have been used as measutes of the paiatability of
litter to microbes (see also 51.6). ln general, iitter decomposition rates decrease with chernical
complexity and increase with initial litter nuûient content (usualiy nitrogen). Several stuâies have
shown that initial C:N, 1ignin:N or ügnin:cellulose ratios are good pndictors of relative rates of litter
decay, especially in short term dynamics (Meliilo et al., 1982; Cotnifo et al., 1995; Cortez et al.,
1996). Chernical resistaace of litter can be formed directly by primary producers, by microbially
mediated polyrnerizatioa of biopolymers, by extemal factors such as fire and UV, and by the
formation of organo-mineral complexes (Davidson et al., 1995).
The quantity of OM inputs to the soil is also a factor in decomposition dynamics and includes
aboveground and belowground Iitter as well as root exudates. It is challenging to measure these
factors accurately. Significant losses due to decomposition W o r herbivory may occur in the
d a c e litter iayer before the liner becomes part of the sutface soi1 layer, so that aboveground Iitter
measurements may overestimate the actuai input to the soil. Belowground inputs are difficuit to
measure due to the nature of the soi1 environment. It is hard, if not impossible, to s e p t e roots
completely fiom mil, and the distinction between Live and dead mots is difficdt, especially with fine
roots. Isotope tracers are a usefui twl in diis application(Balesdent and Balabane, 1992; Johensson,
1992; Mary et ai., 1992). Little is known about the mount of photosynthate that is allocated to root
exudates, but some estimates exkt (Paustian et al., 1990; Johansson, 1992).
1. S. 1.2 Liner Placement
The location of OM inputs can have an effect on decomposition rate, since the aboveground
and belowground enviroaments have diffennt physical conditions* Sutface litter is mbject to
different temperature and moi- @ m e s than subsuface litter (Seastedt, 1988) and may
experience different fkeze-thaw cycfes (Scott et al., 1996). It has been suggested that the close
proximity of belowground inputs, particulariy fine mots, to clay minerais in the soii rnay decnase

their decomposition rate as they can bind to clay minerals readily and form recalcitrant organo-
minerai complexes (Oades, 1995).
Table 1-1 lists some of the physical factors that affect SOM decomposition rates. Some of
the firctors sue discussed in more detail below.
I.5.2.l Soil Moistun and Temperature
Fig. 1.4 shows two examples of temperature and moisturt effects on SOM decomposition.
Low soi1 moisture content nsuits in low decay rates. In con- decay rates are reduced by both
Low and hi& temperatures outside of the optimal range of ca. 25-35°C. Soil moisture and
temperature are usually included in SOM simulation models as two of the most important input
variables (see 8 1.7).
The effect of exogenou nutrients, particularly N, on decomposition rates is unclear In
theory, because the bulk of plant littet is a relativeiy low q d t y substrate, microbial decomposition
is limited by the nutrïti0118L content of litter and one would expect N-addition to have a positive
effect on decomposition rates. However, a m i e w of over 60 studies of the effcct of N-addition on
litter decay found positive, negative and neutral effects on decay rates (Fog, 1988). The effect on
short-terni dynamics was o h n opposite to that on long-tcmi dynamics, so that short-term decay
rates were greater with N-addition, but longierm decay rates were the same or la s with N-addition
than without. The nature of the nittogenous material added, eg. inorganic vs. orgmic fertiiizei, had
no effect,

12
Table 1-1 Physical fwtoa and their effects on SOM decomposition rates.
decomposition rate decreases with increashg moisture stress
Van Veen and Paul, 198 1; Parton et al., 1987; Burke et aï., 1989; Zsonlay and GBrlitz, 1994
PH
level of aeration (O2 level)
nutrient status
drying/wetting cycles
fkeze/tiiaw cycles
soil texture
soil sttucture
low decomposition rate at low and hi& temperatwes; optimal range =2S-3S OC
decomposition rate tends to be low at low pH
decomposition rate decreases with 4 level
positive, neutraî, or negative
CO, flush after re-wetting; increaseâ solubility of OM
affect aggregate stability
total SOM and SOC retention increases with clay content
Van Veen and Paul, 198 1; Parton et al., 1987
Davidson et al., 1995
Brady, 1990
Fog, 1988; Ladd et al., 1994; Zwlnay and GOrlitz, 1994; Gregorich et al., 19%
Srnasen, 1974; Bartlett and James, 1980; Kieft et al., 1987; Qian and Wdî, 1990; van Gestel, et al., 1991
Lehrsch et al., 199 1
S e m w n , 198 1; Paul, 1984; Merckx et al., 1985; Van Veen et al., 1985; Burke et ai., 1989
aggregates protect OM Tisdall and Oades, 1982; h m decomposition Skjemstad et al., 1 983

MOISTURE (STRESS) K R
Fige 1.4 The effects of temperature and moistue on OM decomposition rate h m two SOM modeis: (a) Van Veen and Paul, 198 1, and (b) Parton et al., 1987. PPT/PET = monthly

A brief flush of soi1 nspired CO, occurs after dry soüs an re-wetted (Smnscn, 1974; Kieft
et al., 1987). This has been atûibuted to the decomposition of dead microbes that were killed during
drying and to the exposure of nadily decoqosable material as aggregates break apart duhg re-
wetting. Changes in aggregate surfiace chemistry and OM solubility after such cycles have also k e n
observeci (Smnsen, 1974; B d e t t and James, 1980; Qian and Walt, 1990).
Freeze/thaw cycles can ais0 break up aggregates and change aggregate stability (Lehrsch et
al., 1991).
1.5.2.4 Soil Texture
Clay content is an important factor in SOM decomposition since it has the ability to bind OM
tightly to its sucface and incorporate it into organa-minerai complexes. In general, SOM levels
increase with clay content (Parton et al., 1987). although this is not always the case (Schimel, 1986).
While clay protects OM by buidhg it to its d a c e , it also binds microbes to its surface and
can create local spots of high rnicrobial concentration and activity. It has been shown for a variety
of substrates that clay decreases decomposition rates, increases microbid biomass and microbial
efficiency (Merckx et al., 1 985; Van Veen et al., 1 985; Van Veen et ai., 1987; Ladd et al., 1995).
l.5.2.S Soiï Structure
Soil structure is the factor cumntly receivhg the most attention, as it is not included widely
in models but is thought to be the key to pa t e r mode1 generaiity (see 81.7). The hierarchid
approaeh to soi1 structure introduced by Tisdall and Oades (1982) divides aggregates into size
classes in which différent binding mechanisrns are at work. Aggregates can be fonned through
chemicai processes such as organo-mineral complex formation, or by encrustation of plant materid
with more decomposed OM. Fine mots, fimgal hyphae and particdatly polysaccharides play an
important d e in the maintenance of soii aggngates (Buyanovsky et al , 1994).
Chemicaiiy labile OM can persist in the soi1 wii kyond its expected turnover time by being

15
physically protected withui soil aggregates. This was confirmed by Skjemstad et al. (1993) who
used ultraviolet radiation to remove the outer shell of aggregates and expose theù centres. The
centres were richer in OM than the outer sheîls, and contained older, but more labile OM. Since
macroaggregates are held together by less recalcitnuit material than microaggregates, the aggregate
size hierarchy is also a hierarchy of recdcitrance.
1.5.2.6 Effect of CuItiwLfo~~
Many studies show tbat cultivation usually, but not always, decmases SOM levels
(Cambardeilaand ELiiott, 1992; Tiessenet al., 1994; Scholes and Scholes, 1995; Wander and Traina,
1996). Increased aeration from plowing and hcreased moisture content from irrigation, reduced C
inputs as plants are harvested, and often reduced root:shoot ratios nsult in decreased OM inputs and
increased decomposition rates (Schimel, 1986). There may also be physical dimption of
aggregates, which exposes relatively labile OM that is lost rapidly (Cambardella and Elliott, 1992),
and changes aggregate stability ( M o d et al., 1995). Even when total soü C does not change,
there can k significaat effects on humus chernistry (Schulten and Hempfliag, 1992).
1.5.3 Potential Feedbacks in a Cbanging Environment
Besides the dinct effects of changing environmental conditions, such as temperature and
precipitation, on soil decomposition processes, many indirect effects of global atmospheric c h g e
may occur tbrough plant-soi1 feedbacb. Increases in atmospheric CO2 have a fertilizing effect on
plants, particularly C, plants, and can incmse NPP significantly (Conray* 1992; Idso and Idso, 1994;
MandasCheid et al., 1997; DeLucia et al., 1999). Changes in mot-shoot allocation and the qualiîy
of mot exudates also bave k e n obsaved under these conditions (Paterson et al., 1996). AU of these
factors can affect SOM dyasmics.
Atmospheric CO2 enrichment has also been shown to cause increased C:N ratios in plant
tissues (Couteaux et al., 1996) and decreased leaf N concentrations (Conray, 1992; Manderscheid
et al., 1997), and it has ken suggested that this wili result in lower litter quaiity and, consequently,
lower decomposition rates. At a recent meeting* researchers concluded that the= is no evidence to

support this hypothesis and that the effect, if any, is insignificant, as nutrient translocation during
xnescence tends to eliminate the changes observed in live tissue quality (Norby and Cotdo, 1998).
It must be kept in mind, however, that most studies consider only intraspecific changes and that
shih in the local species composition a particular site, due to climate change, CM alter not only the
quality of litter, but also its quantity, above- and belowground allocation, and seasonai timing.
Thus, signifïcant changes in litter quality (ie. C:N ratio) may occur locally as the result of
species shifts induced by climate change. While incnsses in litter C:N ratio have been shown to
lead to lower decomposition rates (8 1 .S. 1. l), their effect on total soil carbon storage has not been
investigated. As the soil is a globally important pool of carbon, it is of interest to know whether
changes in litter quality (C:N ratio) WU affect total soil C storage.
Changes in plant composition and NPP can also affect mil temperature and mois- regimes
as a result of changes in cover and evapotranspiration.
1.6 Microbial Decomposition
Decomposition of OM is constrained by the energy and nutrient requirements of the
microbial biornass. As the OM quality, ie. nuûient content of the substrate, decreases during
decomposition, the energy yield becomes lower. Accordingly, the decay of k s h OM c m be divided
into thm phases (van Veen and Paul, 198 1). as iliustrated in Fig. 1 .5:
1. New C-nch OM provides a good energy source and the miçrobial population
inmases rapidiy.
2. As decomposition proceeds, the quality of OM and its energy yield declines, but
decomposition stili provided dequate nutrients for an active microbial pool.
3. With fùrther decomposition, OM quality declims to the point where its energy yield
becomes low enough to signiscantly slow d o m decomposition and reduce the size
of the active micmbial biomass.
The soil microbial population is the key to carbon and nutrient cycling in soil, since its d e ,
comparecl to straight chemicai ttansfomtiom, is large. Most OM inputs undergo micmbial
transformation on their way to becoming SOM. Even though this pool is a srnail component of total
SOM, it controls nutrient cychg and C turnover (Wedin and Pastor, 1993).

EQUATION FOR ACTUAL DECOMPOSITION
Fig. 1.5 Microbial decomposition as a series of fltsf-order reactions. C, = carbon of fiaction x remaining, k, = decomposition rate constent of fiaction x, subscript t = proteins and solubles, 2 = celiulose and hernicellulose, and 3 = lignh (Source: Van Veen and Paul, 198 1).
Soil microbial populations are very diverse and full species analyses of soils for the purposes
of modelling soil ptoasses are aot practical or even possible. Microbiologists have cnticised
ecologists for using the black box approach with the microbial biomass and not conside~g or
modelling the effects of soü conditions on its growth (Grant and Rochette, 1994). includhg
microbial biomass dynamics in SOM models would present two main ptoblems: the problem of
scale, and the trade-off between generaiity and complexity (see also 4 1 J.5.2).
One of the pmbiems facing soi1 scientists is the disparity between the temporal and spatial
sales of microbiai processes and the scale on which soii characteristics are rneasu~ed. Soü ptesents
anextndy hetemgeneous environment to soil with large local gradients of moishue, pH,
O2 etc., and the buk soil conditions may be very different fiom those king experienced by the

micmbial population. Measuring and modelling this extreme complexity may not be not necessary
in the context of SOM models (McGill, 1996).
1.7 SOM Models
1.7.1 Introduction
The 1st 25 years have seen the development of a number of SOM computer simulation
models based on the theones describai in previous sections. Since SOM is an important component
of terrestrial ecosystems, applications of these models are wide and include applications in
agriculture and the analysis of the global carbon cycle. As scientific decision-making and pdct ive
tools, SOM models allow the user to:
synthesize information on many different and complex soü processes,
gain a bmer understanding of the underlying mechanisma and discover where M e r
research is required,
test theories about soi1 processes,
make policy decisions based on simuiated responses to management or environmental
changes when field d e s are Unpractical due to slow SOM response, and
integrate the soi1 system into larger ecosystem models for d y s i s of global carbon
budget and nuhient cycles.
The foUowing sectioas briefly describe some of the relevant model characteristics, focusskg
on the multi-pool approach, which was the conceptual model used in this study.
1.7.2 Dcvclopment of SOM Modeb
Initial attempts at modelhg SOM dynamics were inauenced by agriculhual interests and
modeilers focussed on the role of SOM as a nutrient ceservoit, with the aim of optirnizing
fertiluation regimes. As interest in the physical characteristics of SOM and its ability to control the
stability ofaggtegates pw, the models were also used to assess the effects of difEerent cuitivation
schemes on long-term soii fertiiity. These modeIs wen usuaiiy site-specifïc aud o h empiricai in
nature. More recently, as emphasis has been placed on the importance of SOM dynamics Ui
ecosystem hct ion, models have been used to investigate soi1 forniaton and plant-soi1 feedbacks
in naturai and distutbed ecosystems. Recent rescarch into the globd carbon cycle bas prompted the
inclusion of SOM models in globai carbon budgets to assess the potential impacts of global
atmospheric change on this large carbon resewoir.
E d y SOM models were single comparhnent models baseâ on fïrst order kinetics that treated
the SOM as a homogeneous pool with an exponentiai decay rate (eg. MY, 1941). However, it soon
became apparent that the rate constant ofSOM decay changes with tirne d u ~ g decornposition, and
îhat the single-pool model is too simpiistic to simulate this behaviour.
The most cornmon way to account for the tirne-dependence of the SOM decay rate constant
is to use a multiple-pool model. Mdti-pool models split the bulk SOM into sepamte pools of
different sizes and turnover rates. This type of model was pioneend by Jenkinson and Rayner
(1 977) with the model based on and validated by data from the classic Rothamsted experiment. This
approach is discussed in more detail below (8 1.7.3).
A contrastiiig approach is the continuous quaiity theory in which the litter is treated as one
cohort whose rate constant varies as a fiinction of time based on litter quality at that stage of
decomposition (Agren and Bosatta, 1996).

1.73 The Multi-pool Approach
1.Z3.1 General Stwctute and CharacterLrtia
Many multi-pool rnodcls are in use today and include long- and short-tenn simulations using
static or dynamic input variables (McGill, 1996). Several of these models are appropriate for studies
of the effects of management, land use change and global atmosphcric change, since they operate
on the appropriate timescale. These include the model of Van Veen and Paul (1981), the
Rothamsted mode1 (RothC-26.2)(Jenkinson, 1 WO), and the CENTURY mode1 (Parton et ai., 1987).
which are descnbed below as a representative selection of muiti-pool models.
Although they differ in some of th& parameters, these multi-pool models have many
common features. They are processsriented moàels (vs. orgdsm-oriented models) that use first
order kinetics to describe decomposition of each SOM pool. The models use monthly time steps and
simulate SOM changes that occur on the decadal timescaie.
Table 1-11 shows the divisions of SOM and plant inputs to the soi1 in the thm models. Ail
include above and klowground plant inputs that are divided into fiactions of different
decomposabilities based on some measure of litter quality (eg. 1ignin:N ratio). The SOM is divided
into t h e pools that differ somewhat h m model to model but always iaclude a mal1 pool (4%
of total SOC) with rapid turnover (4 p.), a large pool 4 t h medium tmover and a smaller pool
with very slow turnover. The characteristics of these pools are discussed below in more detail
(8 1.7.4).
Al1 thm models include climatic conditions (ie. temperature and precipitation) and litter
quality as dnwig variables (Table 1-m). The effccts of climate variables are included as
non-dimensionai multiplicative scaling factors thet modify an optimal decomposition rate, based
on experimentally d e t e h d fimctions (Van Veen and Paul, 1981; Parton et al., 1987). Litter
quaiity controls the split of plant material into pools of rapid and slow turnover. In generai, lignh
is shunted to the slowest plant pool.
Increasingly, soi1 texture has been included in models to account for the Merences in total
soi1 carbon sequestration that have been observed in soils dong textural gradients (van Veen et al.,
1984; Parton et ai., 1981). In general, clay mils tend to have highet levels of total C tban sandy

soils. In the CENTURY and RothC-26.2 models, soil texture acts as a controlling variable for
microbid decomposition. The mode1 of Van Veen and Paul explicitîy includes the effects of
physical protection by introâucing the concept ofthe "characteristic capacity" of a soil to physicaiiy
protect microbiai biomass and SOM. Each of the SOM pools in this mode1 include pcotected and
unpmtected fractions with tumover rates that M e r by two orders of magnitude.
These models have been validated in a variety of systems and climates, ranghg fiom long-
term laboratoty incubations to landscape scale field studies (Table 1-IV). The CENTURY model
served as the conceptuai model for the pnsent sntdy and is described in mon detail below.
Tabk 1-ïI SOM pool sizes and tumover times for wme SOM models, Where pool sizes and turnover times were not given in the literature, they were caiculated frorn reportcd data Erom the foiiowing sources: Paustian et al., 1992, Motavalli et al., 1994 for the CENTURY model; lenkiason and Raynet, 1977, lenichson et al., 1992 for RothC-26.2; and Voroney et al,, 1981 for the model of Van Veen and Paul.. Turwver time = I/k, where k = decay rate constant.
Mode1 ' Name Turnover Name Turnover aame (% of total SOM) timt (ym) üme Qn) - - -- - - -- - - - - - - - - - - -
CENTURV 1. Active 2-5 0.5-5 1. Metablic 0.14 2. Slow 40-85 20-100 2. Stnicniral 1-5 3, Passive 10-40 200-4000
RothC-26.2* 1. Biomass 2-7 1 .S 1. Decornposable 0.2 2. Humifid OM 50 2, Resistant 3.3 3. Inert OM 9-18 QD
Van Veen 1. Biomass 2 O. 1 1. Decomposable and Paur 2. Decomposable 55-59 0.3 2. Stl'~ctuni1
3. Recalcitrant 39-45 680 3. Recalcitrant Parton et al., 1987; * Jenlcinson, 1990; ' Van Veen and Paul, 1981.

Table 1-ïII Driving variables of some SOM models.
--
Mode1 name DrMng variablm Physical pmtection/soil testure
CENTURY temperature, precipitation, soi1 texhite controls active pool decay texture, tignin:N of plant input and efficiency of tramfer h m active
to slow pool RothC-26.2 temperatun, pncipitation, soi1 texture controls microbial efficiency
texture, iitter quaiity (DPM:RPM)'
Van Veen and temperature, precipitation SOM and biomass include physically Paul pmtected and unpmtected £tactions 'DPM = decomposable plant material, RPM = resistant plant material.
Table 1-IV Validations of some SOM models.
Mode1 name Validation Source
CENTURY estunation of SOC pools in tropical forest Motavalii et al., 1994 soils simulation of SOM in Great P tains Parton et al., 1987 grasslaads simulation of long-terni wheat fdlow Parton and Rasmussen, 1994 system, Oregon
r effects of OM additions and fertilization on Paustian et al., 1992 SOM, Sweden
r SOM dynamics in volcanic d s , Hawaii Townsmd et al., 1995 simulation of long-term cmp rotation, Momal et al., 1997 Saskatchewan and Alberta
ROM-26.2 effects of OM additions, Rotharnsted Jenkinson, 1990 classicai expehents simulate radiocarboa ages and back- Jeokinson and Coleman, caiculate OM inputs, Rothamsted 1994
r simulate effects of management regimes on Jenkinson et ai., 1992 SOC, Rothamsted
Van Veen effects of management on grassland soiIs, Van Veen and Paul, 1981 and Paul Saskatchewan
lab incubations Van Veen et al., 1984 r effects of cultivation on prairie SOC Votoney et ai., 198 1

1.7.4 The CENTURY Mode1
CENTURY was developed in the late 1980's and has since been modified to simulate
range/croplauds, grasslauds, and forests (Table 1-IV). It has also been used in estimates of global
soil C and to predict rrsponse to global change (Schimel et al., 1994; VEMAP, 1995).
The model includes C, N and plant submodels. The soil C submodel is a 3-pool model with
active, slow and passive SOM fiactions that uses first order decay kiaetics (Fig. 1.6).
1,7.4.1 The Active SOM Pool
The active pool represents only a small part of the total organic matter present in the soi1
(usually 2-S%)(Table 1-Il). This pool is usually thought to contain the soil microbiaî biomass,
microbial products andor labile organic material with a turnover of 0.5-5 years (Table 1-11). Due to
its rapid turnover and the key role of microbes in decomposition, this pool controls nutrient
mineralkation and, therefore, has an important role in plant nutrient supply (Wedin and Pastor,
1993). It responds rapidly to management or vegetation changes and may be an early indicator of
slower changes in the bulk SOM (eg. Powlson et al., 1987), dthougb this is not always the case and
the validity of using short-term dynamics as an indicator of long-tenn patterns has ken questioned
(Ladd et al., 1994). However, due to its d size, it does not play an important role in buik SOM
changes or the physical pmperties of the soil. This is the most thoroughiy chamcterized pool, since
soil microbial biomass can be measured fairy accunitely, and techniques exist to extract labile
components, such as water soluble htions.
The slow pool is a large ftaction of the bulk SOM (up to 85% of total SOM) with a turnover
tiw on the order of decades. This pool is important to soil fertility since it acts as a significant
nutrient resmroir and makes a large conûibution to soii stnxtwe. Much of the ofganic matter that
binds microaggregates into macroaggregates (eg. polysaccharides) is thought to belong to this pool
(Tisdall and Oades, 1982; Elliott, 1986; Cambardelia and Ellitoc 1992). This is the pool most

affected by cultivation, presumably because physical protection withidamong aggregates plays a
large part in its maintenance, and the physically protected but chemically labile organic matter
decomposes relatively rapidly as aggregates are broken spart during cultivation (Elliott, 1986;
Cambardella and Elliott, 1992). The slow p i is thought to be the most important pool in relation
to changes in management practices, land use or global atmospheric conditions because of these
characteristics. This pool is relatively poorly characterizcd kcause no laôoratory method yet exists
to separate this functiod pool, and because it probably consists of a large variety of chemicdly
dissimilar compomnts.
LN = Iignin:N ratio A = lîgriin ftadion
CO*
Fig. 1.6 Schematic diagram of the C submodel of the CENTURY mode1 (adaptecl from Parton et al., 1987).

L7.4.3 The Passive SOM Pool
The rest of the SOM decomposes at a very slow rate (turnover in centuries) and is thought
not to play a role in medium-terni dynamics, as it does not appear to be significantly afîiected by
rapid environmental changes (Cambardella and Elliott, 1992; Paul et d., 1997). It may, however,
be important in maintainhg soi1 structure and ameliorating the physical conditions acting on
microbes and plants, eg. by acting as a pH buffer or by increasing water holding capacity.
1.7.4.4 Plant Input POOIS
Plant litter (above- and belowground) is divided into structural and metabolic pools based
on the lipnin-to-N ratio. Al1 lignin is in the structural pool, and lignin concentration controls the
decomposition rate of this pool (Melillo et al., 1982; Cortez et al., 19%).
1.7.5 Criticijms of SOM Modeb
SOM is a complex mixture of chernical cornpounds that represent a continuum of
decomposition h m h s h litter to very recalcitraat SOM. One of the key questions fwing modekm
is how to split SOM into a small number of pools, as any delineation ofdiscreet pools is somewhat
arbitrary (Melillo et al., 1989). While there is no definitive answer to this question, there is a
convergence among the approaches taken by different cesearchers. The pools are most often
kineticaiiy defhed, as opposed to biochemicaiiy, since chemidly diffant compounds may have I
similar decomposition dynamics. The kinetically defined pools each coasist of a heterogemous
dctm ofchemically a d o r physically protected organic compounds. This type of pool definition
may result in good cunre fits for decomposition observations, but does not guarantee that the conect
concepnial d e l has been deduceci.
One of the biggest criticisms of SOM models is the difficulty of experUnentally verifying
these khetically defined pools. As of yet, no direct correspondence between measurable and

modelled pools has been established, although then are a number of laboratory methods that a h
to separate hctioaally meaningfbl SOM fiactions (Cambardeiia and Elliott, 1992; Buyansovsky
et al.. 1994; Motavalli, 1994; Chcistemen, 1996). Fractionation methods based on physical
separation (eg. particle size or gravimetnc methods) seem to hold more promise than those based
on chernical separation (Wander and Traina, 1996), shce decomposition is controlled by microbial
accessibfity to SOM.
The protective action of soil aggegates has been weII documentcd (TisdalI and Oades, 1982).
Pores of varyllig sizes on and in aggregates protect microbes and SOM by pcoviding refuges for
microbes fiom larger predators and preventing the access of microbes to OM (Van Veen et ai.,
1984). Microbial accessibility is not expiicitly modelled in most models (eg. by hcluding soil
structure) and many contend that this is a fùndamental flaw. Preliminary attempts to include
accessibility now exist (Christensen, 1996; Elliott et al.. 1996). Many believe thrit herein lies the
key to greater genetality. Soil texture, wbich is kquently included in the models, may aot be a very
good measun of accessibility because it is not affected by management, wlde soi1 structure is.
Soil processes occur on many difEerent spatial aiid temporal scaies: conditions on the scale
of microns are relevant for microbial processes, while buik conditions Vary on the scde of meters
to kilometers. 1s it nasonable to expect models that are based on one spatial and temporal scale to
be able to scale up to predict changes on a scale severai orciers of magnitude larger?
Application of SOM models to issues on a landscape and global sale has bmught into focus
the neeâ for UicreaSed mode1 gendity. If models are to be used to simulate the large range of
climatic and edaphic conditions found throughout the worid, t&en they must have sutncientiy gened
coatmlling variables. This impiies that the models must become increasingly mechanistic in their
treatment of soi1 processes.
Recent mode1 cornparisons ('VEMAP, 1995; Parton, 1996) found hdrimental dienaces
between the mechanistic treatments ofdifferent models, tesulting in quaiitativeiy different responses
under climate change s c d o s . For example, with increased temperature, some modeis p d c t e d
increased soi1 C due to i n d nutrient mimralizationand NPP, while others p d c t e d decreased

27
soil C due to increased drought stress and iowend productivity. The greatest uncertainty in the
models was founà to be associated with the plant-soi1 interactions.
1.8 Stable Carbon Isotope Aaalysis in SOM Studies
in order to meanire the sizes and turnover times of ciBetent SOM fkctions, both radioactive
and stable carbon isotope tracet techniques have been used. Each of these metbods has inherent
advantages and limitations, and is appropriate for ody a mge of turnover times. No single method
can measun the characteristics of aii pools, fkom the rapidly cychg labile pool to the cenhuics-old
passive pool.
Radioisotope methods have included 14C-labelled substrate additions (Van Veen et al., 1985;
Van Veen et al*, 1987; Ladd et al., 199S), bomb test "C tracers (Trumbote, 1996), and 14C dating
(Nordt et al., 1 994; Paul et al., 1997). Radioisotope techniques can be diacuit since they involve
hazardous materials and are very sensitive to contadnation (Paul et al., 1997). A h , methods such
as bomb test 14C tracers require uncontaminateci acchived pre-bomb samples, wbich can be difficuit
to obtain (Paul et al*, 1997).
Nahiral abundance stable carbon isotope techniques have emerged over the last two decades
as powerfbl tools for tracing the flow of carbon and other elements in ecological systems, including
soil. With the high precision of measurements diat can be made, "C tracers are a safe and reliable
way to investigate carbon dynamics in many applications.
1.8.1 Stable Carbon Iaobpe Notation
Carbon exists on Earth prirmilily as two stable isotopes, 'T and 13C, the former king by fat
the most commoa. The atmosphere contains approximately 98.9% and 1.1% I3C in the form of
carbon dioxide. Isotopic composition of a substance is measured using a mass specmmeter ahr
conversion to CO2 (usuaiiy by combustion), and is expressed as a ratio of the two isotopes with
respect to some standard The composition is most o f h expressed using the delta (8) notation in
units of per mil (%O), as foilows:

where R = 13C/nC. The most commonly used standard is the Pee Dee Belemnite (PDB). Ail
measurerneats quoted here are with respect to PDB.
1.83 Stable Carbon Isotopes in Phnb
Ail physical, chemicai and biologicai processes have the potential to tktionate isotopic
signatures, resuiting in source and pcoduct carbon pools withciiffecent isotopic compositions. Many
of the fktionations Uivolved in rnass tramfer between the major enviromgental carbon pools have
been well documente& as have the isotopic compositions of those pools (Fig. 1.7). This enables the
use of tracer studies to measun carbon fluxes or xcoashuct past pool sizes (eg. Jasper and Hayes,
1990).
In the early 1970's it was fht recognized that M e m i t photosynthetic pathways in terrestrial
plants, namely the Calvin cycle (CI) and Hatch-Slack (C4) pathways, have different isotopic
~tionations, so that C, and C4 plants can be distinguished by their isotopic composition (Smith and
Epstein, 1971; Bender, 1971)(Fig. 1.8). Good reviews of the physiological foundation for these
fktionations, dong with relevant models, c m be found in O'Leary (198 1), Farquhar et al. (1989)
and Fogel and Cifuentes (1993). The fbtionations are disnissed here briefly.

Atmorphrric COa At morgheric COz (utban anal (rural a m i 1.8 tû 42 % -7.8 %m
CAM ~ k n t s -IO to
soit organk -r)% -13 Yim motter
Fig 1.7 Stable carbon isotope ratios of major components of temestrial ecosystems (Source: Boutton, 1991).
Fig. 1.8 Stable carbon isotope ratios of tmehal pIants grouped by photosynthetic mechanism, aquatic plants, atmosphdc C 4 and d e carbonates (Source: Rounick and Winterboum, 1986).

2.8.2. I Isotopic f'iuc~onotion Irr C, plants
C, plants, also known as "cool season" plants, make up more than 90% of al1 temstrial plant
species (Ehleringer et al., 1997) and range in 6°C values h m about -32%0 to -22960. with a mean
of -270h. This value is about 20Soo more negative thaa the source carbon, atmosphenc CO,
(O'Leary, 198 l)(Fig 1.7). This large difference is the result of fhctionation during physical and
enymatic processes, namely CO2 diffusion into the leaf and subsequent carbon fixation by ribulose
1 J-bisphosphate carboxyldoxygenase (RUBISCO). The fiactionation can be described by the
following mode1 (Farquhar et al., 1982):
where 6°C- = isotopic composition of atmosphenc CO2 (-8%), a = fractionation due to diffusion
into the leaf (4.4%0), b = fhctionation due to carbon fixation by RUBISCO (29.4%). and pi@, is
the ratio of intercellular to atmospheric CO2 concentration.
1.8.2.2 Isotopic fructionatin in C, piants
C, plants are predominantiy grasses and herbaceous plants that make up only 5% of al1
terrestrial plant species (Ehleringer et al., 1997) but account for 20-30% of global net primary
production (NPP) (Lloyd and Farquhar, 1994; Ehlerhger et al., 1997). The C, photosynthetic
pathway is thought to be an adaptation to the relatively low atmosphenc CO2 concentrations that
have occumd at some periods in the geologic past, and CO moistue stress in xeric conditions (Street
Pemtt et al., 1 997; Cerling et al., 1997; Ehleringer et al., 1997). C, plants are dominant compoaents
of grasslands and savannas, and because theV distribution is closely linked to temperature and
moi- gradients they are known as "wann season" plants (Teeri and Stowe, 1976; Ehleringer
et al., 1 997). Isotopic composition in this gtoup of plants ranges from -8960 to - 18%. with a mean
of - 1 3 % ~ ~ Farquhar et al. (1982) developed the following mode1 to descnbe the fcractionation
occUmng during C, photosynthesis:

where b3 = fktionation due to RUBISCO (29.4%0), b, = firactionation due to phosphoenolpyruvate
(PEP) carboxylase (5.7%0), and @ = the proportion of carbon k e d by PEP carbxylase that leaks
out of the bundle sheath cells into the mesophyll cells (0.2 to 0.3).
1.8.3 CJC4 Tracer Methodr
C,- and C,-denved carbon len& itself well to in situ tracer studies due to the large difference
in isotopic composition between the two photosyathetic types (ca 14460 difference betwan meaos).
Applications of CJC, tracer methods include archeologicd studies, food web studies and climate
cecoIlStNctions (Cerling et ai., 1 989; Marino and McEhy, 1 99 1 ; Des Marais et ai., 1992;Kingston
et al., 1994; Hogberg and Ekblad, 1996). A h , knowledge of faetors that cause variability in 6°C
within each plant type can be used to -te past conditions (Marino et al., 1992).
C,/C, tracers are especidy useful in ecologicai studies, since the two functional types M e t
not ody in 6°C but aiso in theù ecological d e s ( T b and Stowe, 1976). Thus, C3:C4 ratios c m
k used to reconstmct past environmental conditions. Several studies have used presmed plant C
of various f o m to do this, eg. using C pnserwd in tree cellulose (Stuiver and BraPrmes, 19873,
in SOM (Schwartz et a', 1986; Kingston et al., 1994), or as pedogenic carbonates (Cerling et cd,
1989; Kingston et al., 1994; Cole and Monger, 1994).
In SOM studies, C JC, carbon has been used to recoastnict past vegetation h m buik soi1
rneasurrments (Schwartz et al*, 1986; S teuter et al., 1 990; Nordt et al., 1 994; Archer, 1995). and to
investigate the dyaamics of physical or chernical SOM fhctions, eg. by ushg C4 carbon as an in situ
tracer in C, mils and vice versa (BaIesdent et al., 1987; Baiesdent and Balabane, 1992; Boade et al.,
1 992; ûregorich et al., 1995; Martin et al., 1990).
In order to interpret 6°C patterns in m e r studies propedy, it is important to be aware of
potential soma of variabiiity in and ktionation of the isotopes during ecosystem processes.
These are discussed below as they relate to SOM studies, in paiticuiar.

1.8.4 Sources of Vatiability in &13Cw,
1.8.4. la Environmental Factors
Any factor that affects the ratio of intercellular to atmospheric CO2 concentration has the
potential to change the isotopic composition of carbon fixed by a plant, by affecthg the rate of
diaision of CO2 into the leaf andh the rate of photosynthesis (Eqs. 1.2 and 1.3). Among these
factors are plant moisture and nutrient status, canopy effect, altitude and inhibition of photosynthesis.
Moi- status affects i13C,, by changing stomatal conductance, which leads to opposite
results in C, and C, plants. Using Eqs. 1.2 and 1.3, decreased @JpJ due to decreased stomatal
conductance under water stress results in more positive 6°C values in C, plants and more negative
6°C values in C, plants. In general, the effect is thought to be negligible in C, plants. Shifts in plant
isotopic composition in C, plants due to changes in moi- status are usuaily between 1 - 3%
(T'able 1-V).
This dependence of 6°C on moishue ngime must be taken into account in plant sampling
protocols as it cm result in seasonal, year-to-year and topographical patterns of 6°C of the
vegetation (van Kessel et al., 1994). In SOM stucües, this relatively small variability is of l e s
importance within a particular site, since SOM teptesents an integrated picture of vegetation inputs
over many years and damps out seasonal and mual variation.
Nutrient status has the potential to change plant isotopic composition by afKectiag the
chlorophyll concentration of leaves and, thus, their photosynthetic rate. This effect is not as well
documented as water sûess and shifb to more positive and more negative d l F have been observai,
but the effect seems to be relatively srnail (1-2%o)(Table 1 4 ) .
Source carbon (atmospheric C01) for plants growing under dense canopy may include a
signifiant amount of respireci CO, rnaking it significandy depleted in I3C compared to the mean
6°C- of - 8 O h (Sternberg et al,, 1989). This phenornenon is d e d the canapy effect and redts
in more negative &I3ck unda dense canopy than in open habitat (Table I-V).
The changes in partial pressun of CO2 caused by changes in altitude can aiso affeçt the

isotopic composition of plants (Table 14). Damage to the photosynthetic apparatus, eg. by UV-B
radiation, cm also alter the 6I3C of bulk plant tissue (Table 1 4 ) .
1.8-4. I b Genetic Factors
Variation in 6°C within a species is not only controlled by envimamental factors, but also
by genetics. Intra9pecific variation has been detected within particular sites for various species. as
show in Table 1-VI. For CI plants Linle variation has k e n obsmred within species (O'Leary,
1988), although Hubick et al. (1990) found smaii but signifïcant variation in Sorghum bicolor. In
C, plants the variation tends to be larger than in C, plants and is in the range of 2-4l%0. In general,
intraspecinc variation within a particulat site is in the range of 1-2%.
Variability in 6°C among diffennt plant parts in non-woody plants is usually on the order
of <2%0, and is thought to be the nsult of Merences in biochemical composition between different
tissues, and plant processes such as translocation. Ranges in 6I3C up to 2.8% between different
plant tissues have been found (Balesdent et al., 1 987; Gregorich et al., 1995).
Table 1-W lists some ciifferences in W3C between plant parts. Roots are generally a960
enriched in 13C with respect to bulk plant tissue, or abovegrouad plant parts in non-woody plants
(Table 1-VII). Translocation ami volatiluation during senescence are thought to cause the
d b n c e s in &IF that have been obsemd between live and dead leaves (Balesdent et al., 1993;
Peat, 1997). Terwilliger (1997) foimd new leaves on a variety of deciduous C3 plants to be 1-5%
more positive t h old leaves on the same plants.
Again, shce SOM reflects the cumulative input owr many years h m both above aud
belowground litter, the variation between plant parts is not likely to affect total SOM, but must be
taken into account in the design of plant sampihg protocols. The only factor that could have an
eEect is the Merence between above and klowground parts, iftheir rates of assimilation into SOM
diffa significantiy, but there is no information avdable on this in the literature.

34
Table 1-V Enviromentai factors that affect the isotopic composition of bulk plmt tissue.
Environmental Effcft on &I3Cc, Specia factor
(%O)
Source
H,O stress &O stress
H,O !mess H20 stress
H,O stress H20 stress H,O stress H20 stress HO s tms
H20 ~ S S
H20 stress &O stress H,O stress
N-fertilization K- fert ilization N+K-fectilization K- fertilization
Canopy efl't Cmopy e f F ' C q effct Canopy effect Canopy effwt Canopy effat
Altitude
Altitude
Photoinhibition
+12%o pet I OOOm elevation
+4% pet 4000m elevation
a.2960with W-B exposm
crested wheatgrass
c hickpea Gossypiwn hirmtum wheat cowpea Lycopersicon pennellii FI hybrid L. esculentum wheat
P a canoia
desert plants w heat
Phleum prutense Phleum pratense Phieum pratense Gossypium hirsuttmr
bamboo Hirtella trianàka Te~agmtris c i p Trichilia panamens& beech leaves deciduous trtts
vegetation
C, vegetation, Papua New Guinea
Johnson et al., 1990 Wintet, 198 1 Wintet, 1981 Farquhar and Richards, 1984 Kirchhoffet al., 1989 Martin and Thorstenson, 198% Martin and Thorstenson, 1988 Martin and Thorstenson, 1988 van Kessel et al, 1994 van Kessel et ai, 1994 van Kesse f et al, 1994 Ehleringer and Cooper, I988 E hdaie et ai., 1 99 1
Bender and Berge, 1979 Bender and Berge, 1979 Bender and Berge, 1979 Bednarz et al., 1998
Sternberg et al., 1989 Sternberg et al., 1989 Sternberg et aL, 1989 Sternberg et al., 2989 Schleser, 1992 Hamba et pl,, 1997
Kamet et al., 1988
Bird et al., 1994
Omtod et ai., 1 997
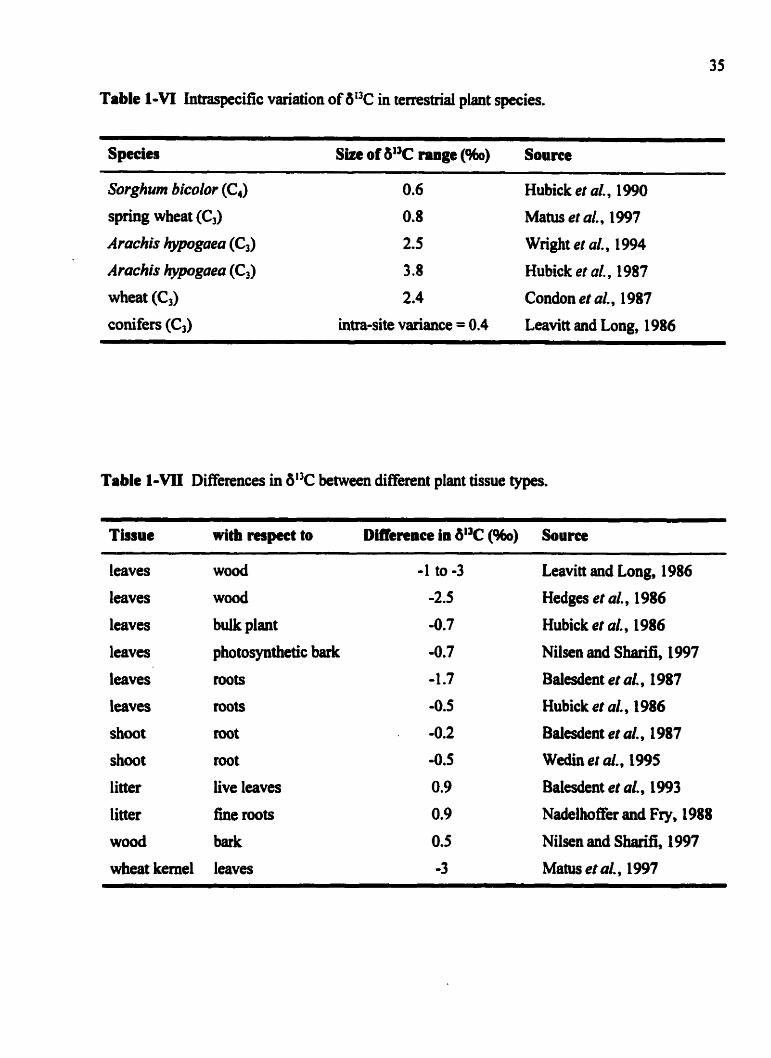
Table 1-VI Intraspecific variation of 6°C in terrestrial plant species.
Species Size of 6°C nage (960) Source - -
Sorghun bicolor (C,) 0.6 Hubick et al., 1990
spring wheat (C,) 0.8 Matus et al., 1997
Aruchis hypogaea (C,) 2.5 Wright et ai., 1994
Arachis hypoguea (Cd 3.8 Hubick et al., 1987
wheat (C,) 2.4 Condon et al., 1 987
conifen (C3 intra-site variance = 0.4 Leavitt and Long, 1986
Table 1 - M Differences in W3C between difEerent plant tissue types.
Tissue with napcct to Dillercnce in W3C (%O) Source
leaves
leaves
leaves
leaves
leaves
leaves
shoot
shoot
litter
litter
wood
wheat kernel
wood
wood
buik plant
p ho tosynthetic bark mot!?
roofs
mot
root
Live leaves
fine mots
bark
leaves
Leavitt and Long, 1986
Hedges et al., 1986
Hubick et al*, 1986
Nilsen and S M , 1997
Baiesdent et al., 1987
Hubick et al., 1986
Baksdent et al., 1987
Wedin et al., 1995
Balesdent et al., L993
Nadelhoffer and Fry, 1988
Nilsen and S M , 1997
Matus et al., 1997

1.&4.3 Variabil& Among Plant BiochemCaI Comp~~en&
Table 1-WI and Figure 1.9 show the ranges of b l F for a variety of plant biochemical
fbctions. Lignin and lipids are d y drpleted in I3C, wwhi cellulose is generally e ~ c h e d 6 th
respect to the buik plant tissue.
In general, the isotopic fkctionations described in the above sections change W3C by less
than 2460.
Table 1-MII Differences in 6% between plant biochemical fiactions and whole plant tissue.
Biochemical fraction D~ertnce in aUC wHh respect to Source whok plant (360)
lipids
lipids
lipids
cellulose
cellulose
celluiose
cellulose
amino acids, sugars and starches
Hubick et al., 1986
Tieszen, 1991
Nadelhoffer and Fry, 1988
Berner et ai., 1987
Nadelhoffet and Fry, 1988
Wedin et al., 1 995
Schieser, 1992
Benner et ai., 1987
Tieszen, 1991
Leavitt and Long, 1986
Nadehoffer and Fry, 1988
Tieszen, 1991
Nadelhoffer and Fry, 1988

pectin - hernicellulose - amino acids - sugars œ
cellulose - lignin - lipids -
t 1
4 - 6 - 4 0 2 0 2 4 6
13 6'=c-- - 6
Fig, 1.9 6% of plant biochernical fractions relative to whole plant materiai (Source: Boutton, 1996).
11.5 Special Considerationa for SOM Studia
1.aS.l Fidelity of lsdupic Signature of OM l n p ~
There is a large body ofindirect evidence to support the hypothesis that the isotopic signature
of plant material is preserved in its associateci SOM. SOM in surfiace soi1 under indisturkd
vegetation has ken found to have a W C simiiar to the vegetation in a wide varïety of habitats and
climates (Dzutec et al., 198s; Nadeihoffer and Fry, 1988; Baldent et al., 1993; Bird et al., 1994;
Gregorich et al., 1995; Schwartz et al, 1996).
Surtace SOM is ofien slightly (cl to 2%) more positive than abovegmund litter inputs
(Dzurec et al., 1985; Nadeihoffer and Fry, 1988; Baiesdent et al., 1993; B M et al., 1994). This may
be a resuit of the fact that belowground inputs tend to be more positive than abovegroumi üttet (see
5 1.8.4.2). Danec et al. (1985) observeci SOM that was 2-3960 enriched with respect to plant litter
and roots.

A geneal pattern of isotopic enrichment with depth in undistwbed soils hm been observed
by severai investigators (eg. Balesdent et al., 1987; Volkoff and Cem, 1987; Nadelhoffer and Fry,
1988; Steuter et al., 1990;; Balesdent et al., 1993; Oregorich et al., 1995;). T&is enrichment can be
as large as 3%0 in subsurface soils. Where past vegetation changes have been eliminated as potential
sources for this shift, factors such as f'ktionation during decomposition, illuviation and historie
changes in atmospheric 6% have beni considerrd as causes (Nadeihoffer and Fry, 1988).
For d a c e soils, such as &ose used in this snidy, there are three potentiai sources of
hctionation that couid remlt in sigdicant ciifferraces between the &13C values of the vegetation
and SOM: differentiai preservation of plant chernical hctions, microbial hctionation during
decomposition, and changes in isotopic composition of atmospheric COp
As noted above, dflemit biochemicai fiactions in plants exhibit a wide range of 6°C values.
This creates the potential for values of 6°C ,, to change during decomposition due to Merentiai
preservation of cecalcitmnt biocheaiical fktions such as lignin, cellulose and lipids ( B e ~ e r et al.,
1986a, 6).
A study conducted in anaerobic Sediments found adecresse in values of &I3C,, with age that
couid k accounted for by an increase in liner Lignin concentration (Bennet et uL, 1987). Similar
increases in litter lignh concentration with increasing mass l o s have also been observed under
aerobic conditions, but have not b e n associateci with the expected SM to more negative &l3CIim
values (Nadelho ffer and Fry, 1 988; Baiesdent et al., 1 993; Wedin et al., 1 995). There is evidence
that 6I3Clim values remain almost constant, even at high mass l o s after several years of
decomposition in the field (Meliiio et ai., 1989; Wedin et al., 1995; Boutton and Y d , 19%;).
Isotopic s b in these cases are less than 0.5%.

There is a potentiai for isotopic fiactionation at both uptake and synthesis levels during
micmbial decomposition of plant litter, ie. microbes couid discriminate duriag uptake of carbon or
during assimilation of it into &eu own tissues. Changes in 6I3CMk during long-term soil incubations
have been small(O.S%o over 600 days)(NadehoEer and Fry, 1988), but it has bem suggested that
they result nom repeated micmbial hctionation as carbon cycles h u g h the microbial biomass and
labile SOM pools.
Several investigators have conducted studies of isotope discrimination during microbiai
metabolism, but these have been limited to a mal1 number of species of bacteria and fungi grown
on selected carbon substrates (eg. Macko and Estep, 1984; Blair et al., 1985; Will et al., 1989). In
these studies, differences between &I3C* and WC,, varied h m -5.5 to + I l . 1%. Fractionation
was not systematically predictable and was a hction of substrate and microbial species.
The net effect of microbial fhctionation on SOM is not known and thete is no direct
evidence that it contributes to a sipnincant shift during decomposition. Given the large microbial
species diversity found in mils and the large diversity of substrates that are used by microbes, it is
conceivable that, while individual firactionations may be significant, the net effect on the buk soil
is close to zero. 'ïhe similarity of isotopic signatures of d a c e soils to cumnt vegetation in many
studies (Q 1.8.5) lends support to the idea that microbid reworkhg of the SOM does not shift the WC
in the short term (ie. timescale of years).
1.8.S4 Changes in AinwspLeric a3C
Atmosphenc carbonisotope compositionhas changedoverthe last 200 years h m ca. -6.5%
to ca. -8%. prhuüy due to fossil fuel consumption and laad use changes (Keeling et ai., 1979;
Faure, 1986). Although the cumnt snidy deais with a timescale of just over one decade and the
above change is not signifiant in the caiculation of isotopic changes, this SM must be taken into
account in longet snrdies and when looking at oidet, more rrcalcitrant pools of carbon.

1.9 Study Objectives
As signifiaint changes in vegetation composition, eg. h m C, to C, species, are precücted
to occur as a resuit of global climate change in the next decades, it is of interest to determine how
such changes will affect soi1 carbon cycling.
In this study, a combination of stable carboa isotope techniques was used to investigate SOM
dynamics in a grassland where experimentai fertilization had redted in signincant vegetation
changes over 13 years, h m native C, prabie species to htroduced C, grasses. This site had a weîi
docurnented vegetation history a d provided a unique opportuiiity to use stable isotope methods to
mess the effects of changes in species composition on SOM dynamics on the decadal timescaie.
The study focussed specifically on thne questions:
Did Merences in the litter quality of the two fùnctionai types of plants (C, and C,)
result in Werent rates of soils carbon sequestration over 13 years?
Can buk soil isotopic measurements be used to reconstruct vegetation histories reliably
on the decadal timescale relevant to global change issues?
How do rneasmments of the size and isotopic composition of the active and slow
SOM pools, as described by the CENTURY model, compare to the concephial model?
To address the above questions, the vegetatioa bistory of the site was nconsûucted h m a
long-term vegetation data set collected by other nsearchers at the site over the 13 years of the
fertilization expriment. Bdk soil isotopic measmments were pedormed and a novel soi1
incubation method for the measment of the isotopic composition of soi1 nspirrd CO2 was
developed and used to estllnate the size and isotopic composition of the active and slow SOM pools,
as described by the CENTURY mdel.

2.1 Site Description and History
2.1.1 Cdar Cmek Natural Birtory Ani
2.1 .l. 1 Locution
The experiments nported hem were performed on soil samples tiom an experimentai soil
nitrogen gradient in an abandoned agricultural field (Field B) at Cedar Creek Nahiral History Area
(CCNHA) in east-central Minnesota. This Long-Tem Ecologîcal Research Site is located 45 km
north of Minaeapolis, MN (45'24' N, 93 O 12' W) on the Anoka County Sand Plain, a large, deep
outwash deposit fomied 12,000-1 3,000 BP during the glacial retreat. CCNHA lies in the transitional
zone between prairie to the west and deciduous fonst to the east. The a m has a continental climte
(mean annual temperatwe = S.S°C, mean annual pncipitatioa = 73 cm; Wedin et al., 1995), and
maximum monthly precipitation (1 1.4 cm) coincides roughiy with the peak of the growing season
in Iune (Tester, 1989).
Prairie v i e s became a signincant part of the vegaation in east-central Minnesota about
8 000 BP aAer the retreat of the ice. The combination of edaphic, c h t i c and disturbance regimes
(th, grazing) found in this area led to the establishment of relatively open prairie and savannah
instead of fores&. At the thne of Empean senlement in the 1850's the vegetation at CCNHA was
a mixture of prairie, oak savannah, oak scmb and deciduous focest on weli-drained uplands, and
marshes and swamps in the lowlands (Johnston et al., 1996). Fire played an important role in
maintainhg the open charamr of the prairie and savanaah, and fhe control meastues initiateci by
the settiers remlted in reletively rapid focest enmachment (Tester, 1989). Some logging took place
in the Iate 1800's to clear land for cultivation and to provide Iumber for construction, but most
agricultural fields were brought into cultivation between 1 9 0 and 19 10, when numerou feniis were
established in the ana (Tester, 1989).
2. I. 1.3 Vegetdon and Soü
Currendy, the uplands of CCNHA are a mosaic of prairie, savannah, oak woods and more
than thirty abandoned agricultuial fields that range in age h m 1 to 70 years since they were
abandoned. The dominant grasses in these abandoned fields are Agropyron repens (Qu~ckgrass, an
htroduced European C3 rhizomatous grass) and Agrostis scabra (a native C, bunchgrass) in early
successional fields, Poapratenris (Kentucky bluegrass, an introduced CI rhizomatous grass) in mid-
successional fields, and two native C, bunchgrasses, Schizaclyrium scopuriuin (Little Bluestem)
and Andropogon gerardi (Big Bluestem), in late mccessional fields (Tilmaa, 1988).
The upland soils at CCNHA are nutrient-pot, well-sortcd fine to meâium-textured sands of
the Sarteli and Zimmerman series [Typic Udipsamments and Alfic Udipsamments (Regosols),
respectively; Pastor et al., 1987 that are very low in organic matter content (sand content > 90%).
Nitmgen (N) is the nutrient limiting primary production in old fields at CCNHA (Tilman, 1983,
1984, 1987). In 1982, experimentaî N-gradients were established by other researchers on 4 of the
old fields at CCNHA and for more ihen a decade detailed records of vegetation dynamics and soi1
chemistry have been kept by the staff of CCNHA. The soi1 samples for this experiment corne from
one of the above experimental gradients (Field B).
fl.l.4 Seconda~ Successian on Old AgrCCultumol Fiel& ut CCNRl
Secondary succession in abandoned agriculnirsl fields at CCNHA begins under conditions
of extnme N limitation that redt in low NPP and a nlatively slow rate of succession (Inouye et al.,
1987). A study of 22 mch fields at CCNHA showed that soi1 N was highly comlated with field age,
and SOM levels were sttongiy cortelated with soi1 N (Inouye et d , 1987).
The successional sequence on these nutrient-poor soas is tied to nutrient status (Fig 2.l(a)).
Early successional fields are dominated by Eunisian annuals such as Ambrosia mtemisi@Iia
(tagweed) and Erigeron canadensis (horseweed). probably because they ate agricuitwal weeds
andlot mlu'ntain a Iatge seedbank in the soi1 (Tilman, 1988). As the fields age and N-avaiIabiilty

increases, the relative abundance of perennials increases and the introduced antluafs are eventually
displaced by prairie species (Fig. Z.Z)(houye et al., 1987).
Carbon storage in the topsoil decnases initially after abandonment, due to low vegetative
inputs and high decomposition rates in the recently disturbed till layer (Zak et aï., 1990). Soi1 C
storage shows a net increase only &er ca. 18 years of secondary succession and is still incteasing
after 50 years (Fig. Z.l(b)).
2.1.2 Field B
Field B is an 8.8 ha level uplaad field that has a well-drained Zimrnerman fine sand soi1
(Tihan, 1987). It was probably brought hto cultivation in the first decade of this century and iikely
was croppecl under rotation with soybean, corn, and rye for approximately 50 years. n i e field was
1st cultivated in 1957 with s o y h . Hence it was 25 years old in 1982 when the experimental
nitrogen additions wen begun. Thenfore, the soi1 in Field B is a mid-successional field and is still
accruhg SOM pig. 2.1 (b)).
in 1982 an experimentd nitmgen gradient was established on Field B by researchers at
CCNHA, with 9 levels of nitrogen addition that included an unmanipuiated conûol (T9) and 8
treatments which received a mixture of otht nutrient9 and diffmnt amounts of nitmgen (Tl - T8;
Table 2-9. Thus, the= were two control treatments that did not receive any N: T9 (completely
unmanîpuiated) and Tl (received no N, but 0th- nutrients).

CULT1VATED YEARS SINCE F i E u ABANOONMENT . T
Figi 2.1 Pattern of (a) secondary succession (Source: Tilman, 1988). and (b) soi1 C storage (Source: Johnston et al*, 1996) Ïn abandoneci agrictiitural fields at CCMIA.

EARLY MID LATE
Ememn canadensis ~ g & p y m mpens ~ n d e o n getdi i Schizachynùm scopanutn Poe pmtensis
Agmpymn repens l
Fig. 2.2 Dominant species and successional patterns in early, mid- and Iate successional fields at CCNHA (based on data in Tilrnan, 1988 and inouye et al., 1987).
Table 2-1 N-addition rates for the nine treatments in the experimental fertilization gradient. Nitrogen was added as NH,N03. AU treatments except T9 also received the same mixture of other nutrients (P, K, Ca, Mg, S and trace metals) at the following rates: P205, 20 g m m 2 * ~ ' ; K20, 20 g*m4yri; CaCO,, 40 gm-2yri; MgSO,, 30 gw2*yri; CuSO,, 18 pg*m*2-yr1; ZnSO,, 37.7 jigm-2*yrs; COCO, 15.3 pg-m-*y-'; MnCl,, 322 pg m 2 * ~ ' ; and NaMoO,, 15.1 pg*m-2*yr?
.
Treatment N-addition rate (gNmo2*yr1)

Details of the design may be found in Tian (1987) and are described briefly here. Six
replicate plots of each treatment were established in a completely randornized design, for a total of
54 plots. The plots measured 4 m x 4 m each and were separated h m each 0 t h by a I rn b s e r
zone. They were fertiliPd twice a year by workers at CCNHA, in mid-May and early June, by hand-
broadcasting haif of theu muai dose of nutrients on each occasion. The field was smunded by
a large fence and sub-surface barriet to eliminate d m and rabbit herbivory.
ui this study, 27 of these 54 plots were used. Three rqlicate plots of e x h ûeatment were
chosen based on vegetation data of 1992. Mean abovegrouad relative abundances (proportion of
aboveground biomass) of the three dominant p i e s (Agropyron repens (C,), Poapratensis (C3) and
Schizachyrium scoparium (C,)) were calculated for each treatment, and the three plots most closely
resembling the mean were selected from each treatment (Table 2-II). Plots with unusuai vegetation,
e.g. woody species, were excluded. More importance was placed on C, abundance than on the other
two species in selecting plots.
The vegetation in 1982 was dominatcd by Schizachyrium scoparium, Pwpratenss, Panicum
oligosanthes, Lespedeza capitata, Cyperus fllimlmis, Rosa atRansana, Solidogo rigida, and S.
nemoralis (Tilman, 1987). No invasion of woody species had taken place prior to 1982, nor since
that tune. Over the 13 years of the N-addition experiment (19824994). thne species (Agropyron
repens, Pou pratensis, and Schizuchyn'um scopm*um) dominated the vegetation in the plots and
accounted for the bulk of aboveground biomass (85% 1 7 %).

Table 2-Iï Aboveground relative abundance of the three dominant species in Field B in 1992. Plots seiected for this study are marM with an asterisic (*). Plots 3-48 and 7-53 were excluded because ofthe presence of woody species orant hills.
Treatment Plot A.npcnr S s c a p b u n P.pntensb A mpas S scoparlm Rprrdmsb

Table 2-II cont'd
Abovegrouad relitive ribundance Mean aboveground nbtive abundance
Treatment Plot A .mpas S scoparium P. pmtens& A. repens S scoparkm PD pniensb
8 3 1 .O0 0.00 0.00 8 4* 0.98 0.00 0.00 8 22 1 .O0 0.00 0.00 8 39. 0.86 0.03 0.00 8 44 0.28 0.00 0.0 1 8 47' 0.76 0.00 0.0 1 0.8 1 0.0 1 9 6 0.00 0.91 0.05 9 12' 0.00 0.8 1 0.08 9 2tf 0.00 0.74 0.2 1 9 35 0.00 0.8 I 0+07 9 37 0.03 0.2s 0.5 1 9 52* 0.00 0.67 021 0.00 0.70 O. 19
The three dominant species differ in their tissue chemistry, allocation patterns and responses
to fertilization. These are described here briefly, focussing on factors that affect litter decomposition
and SOM dynamics, as described in 11 .S.
Table 2-III üsts some measures of tissue quaiity of the three species. S. scoporium bas lower
iitter quality than P. prutemis and A. repens, as indicated by its lower N content and higher lignin
content, especidly in belowgmund biomass. S. scoparium has highly lignified, Long-tived mots.
The mges of %N show in Table 2-III are for plants grown on soi1 N graâients. No correlations
were found between total soi1 N and tissue N concentrations in these d e s ; however, Nelson and
Sosulki (1984) found that fertilization increased the N concentration of P. pmtemis.
High litter N concentrations have been shown to inctease the decomposition rate of
S. scopurim litter (Pastor et al., 1987), but litter N concentration did not Vary systematically with
N fertilization rate and thm was no direct relationship between N-addition rate and decomposition
dynamics.

Table 2-I I I Four meames of tissue quality in above- and belowground biomass of the three dominant species in this study.
%N % Lignin C:N Ligmin:N
Source Spceia above ôelow above below abovt below above below
Wedin and A. repens 0-9 1 .O 6.1 8.4 56 46 6.8t 8.4t Tilman, 1990 P. pratensis 0.7 0.7 4.0 10-1 64 69 5 . 14.4+
Sscopmium 0.4 0.5 5.8 11.3 109 102 14-9 22.6t
Tilman and A. repens 1.2-1.4 1.0-1.2 WedinJ991 P.pratemis 1.1-12 0.7-09
Shopmium 0.6-1.1 03-0.6
Wedin et al.. A. repens 12.5 15.9 1995 P. pratensis 10.7 17.0
S. scoparium 15.4 22.5 tCalculated h m % N and % Lipin &a.
DifEerences in litter quality may have an effect on decomposition rates, as suggcsted by the
ciifFemit rates of litter accumuiatioa in experiments with monocuitutes of the species (Tihan and
Wedin, 199 1). scopmitm had significantiy pater rates of liner accumulation than P. prutewis
and A. repens, which suggests that its poorer litter quality ratio renders it less decomposable.
Table 2-N shows above- and belowground allocation in the t h species. S. scopium has
greater allocation to mots than the other two species. The ranges of root:shoot ratios shown from
Tilman and Wedm (1991) in Table 2-IV are for plants grom in monocultures dong a soi1 N
gradient. In that study, al1 three species responded to increaseâ soi1 N by increasing biomass
allocation to aboveground parts, ie. by reâucing the root:shoot ratio. S. scopium had a larger range
of r0ot:shoot ratio dong the N gradient than the other two species. In low N conditions, it supports
large mot systems thst compte effedively for the scarce resource, but it is also able to increase its
aboveground allocation more than the other species in high N conditions due to its large nitmgen
use efficiency (NUE; g biomasdg N). The NUE of S. scopmium, P. pratensis and A. repenr are 203,
107 and 78, respectively (Wedin and Tiiman, 1996), and total biomass of S. scopifwn increases
at a greater rate with fertilization than that of the other two species (Fig. 2.3).

Table 2-IV Root:shoot ratios of the tîuee dominant species in this study.
Source Specics Root=Shoot
Tilman and Wedin, 199 1 A. reponr P. prutensis S. scoparium
Tiiman, 1988 A. repens 1 P. pratensis 1.2 S. scopmiwn 1 .S
Fig. 23 Total biomass vs. total soi1 nitrogen of A. reprts, P. pratensis, and S. s c o ~ * u m p w n on a soü N gradient (Source: Eilman and Wedh, 199 1).

Mean annual precipitation for the period of 1982 to 1994 was Ca. 840 mm. Then were two
noteworthy &ou@ during this period (Fig. 2.4): a short one-year drought in 1992, and an
exceptiody severe and long drought for three years in the late 1980's (1987-1989).
Fig. 2.4 Annual precipitation at CCNHA between 1982 and 1994. The dashed linc indicates the mean annual precipitation for this period (836 mm).

2.2 Sampling Methods
Re-tteatmcnt soil was sampled in 1982 by workers at CCNHA. Four 15 cm long soil cores
(1 " diameter) were collected in each plot and mixed ( T i 1987). These samples were oven-dried
(40°C) and storeci at room temperature in Whirlpak bags in the C C W soiî archives. Post-
ûeaûnent soil samples were collectecl in Juiy 1994 by Dr. David Wedin. Four soil cons of depth
15 cm were collected and mixed for each of the 27 plots. The cons wen taken with a 1" diameter
corer dong a transect through each plot that started and ended 50 cm h m the edge of the plot. The
samples were air-drieâ at Cedar Creek and then oven-dried at 40°C for 7 days at the University of
Toronto. The dry soils were sifted t h u g h a 1 mm screen to remove roots, and any remaining plant
material > 1 mm was picked out manually with forceps. The dry soils were stored in sealed Whirlpak
bags at m m temperature until analysis.
A sampiing depth of 15 cm was chosen for the 1994 samples to allow direct comparison to
the archived 1982 samples and to data h m other studies at CCNHA, as 15 cm was the sampling
depth most commody used at the site. As well, the fiaction of mots found in the O - 15 cm layer was
hown for the plants in this study, so tbat estimates of belowground OM input to the soil in this layer
could be made (sa 82.7). The use of 15 cm cores iikely introduced a dilution effit, as a large
proportion of OM is deposited on the mil d k c e in the form of abovepund litter, and a shaîiower
sampling depth (eg. O - 5 cm) would have been more sensitive to changes in the vegetation.
However, the 15 cm depth was chosen to maintain a consistent pmtocol for al1 samples.
2.23 Vegetation Samplliy
Vegetation and mot samples had been collecteci annually by M a t CCNHA since the start
of the experiment in 1982, foilowhg the procedure of T i (1987). Sampling occurred in Juiy
or Au- to coincide roughly with the tirne of peak abovegmund live biomass. Briefly,
aboveground vegetation was clippcd h m a IO cm x 3 m strip tbat t r a v e d each plot, .md was
sorted into live and dead biomass. Cive plants were sorted hvtha by species, and ail samples wae

53
oven-dried to constant mass at 40°C and weighed. The resulting &ta set of abovegrouad biomass
was used in this snidy to reconstruct vegetation dynamics h m 1982 to 1994 (42.7). and some ofthe
atchived vegetation samples h m 1993 were used for isotopic measunments in this study, as
describeci below.
2.3 Soi1 Incubation Metbod
An improved aerobic soi1 incubation methcd was developed to measure the rate of soil
respiration and the 613C of respired CO, duhg long-terni laboratory incubations. Soils were
incubated in sealable chambers, and the evolving CO2 was trapped periodically for isotopic and
compositiod analysis. The Avantage of this method over traditional meth& is that the gas was
injected directly from the chambers into agas chromatograph - interfaced m a s spectmmeter without
M e r treatment, thus eliminating the need for KOH traps and time-consuming wet chemistry. The
method was tested ngourously for potentid sources of isotopic Eractionation, and the results of these
procedural tests are included in Appendix A.
2.3.1 Incubation Chambers
Incubation chambers were constructed fiom modifi.ed 500 mL glass Mason jars (Consumers
Glass). Swagelok 118" brass bulkhead unions with their nuts removed were installed as sampling
ports through holes in the lids (Fig. 2.5). A ~ b b e r O-ring ktween lid and union, and iiberal use of
silicon sealant on both sides of the iid ensured a tight seal (Appendix fA.1.2). A 50 mL polyester
M e r was used in each chamber to contain the soi1 sample, making it possible to remove the soil
without disturbing it, tg. to clean condensation h m the interior of the chamber or to weigh soil
periodicaily .

silioone seahnt lid
Fig. 2.5 Schematic diagrams of incubation chambers (a) open, and (b) sealed during CO2 collection. Also shown is a close-up of the iid with sampling port (c).

2 3.2 CO2 Collection and Sampiing
The sampiing ports remained open (both nuts removed; Fig. 2.5(a)) during incubation to
dlow gas exchange with the atmosphere while keeping moi- loss to a minimum. Soi1 moisture
levels were checked once a week by weighing the soil and nplacing any lost water. A moisture level
was chosen that resulted in thomughly moistened, but not waterlogged soils. On each samplhg
occasion, each chamber was purged with 10% 4 in He (Appendix §A. 1.3), and sealed by piacing
a nibber septum (Hamilton Co. 76010) in the upper nut (Fig. 2.5(b)). C O was allowed to
accumulate in the headspace until the minimum concentration required for analysis was reached, at
which tirne the gas was sampled by syringe through the sephim.
In this investigation, duplicate incubations were performed for each ofthe 27 plots, for a total
of 54 incubations. Measurements of respiration rate and b13C of respiced CO2 werc made on days
9, 22, 60, 1 19 and 197 h m the start of incubation. Approximately 30 g of soil were used per
chamber and were maintained at a moishire level of OJ3g H20 g dry soit1. The chambers were left
sealed at each sampling long enough to accumulate at least 1000 ppm of CC& in air, the minimum
concentration required for isotope analysis (Appendix 8A.1.4). This concentration was reached
within 2-10 days after seaiing, dependirig on the soil C content and stage of incubation. Chambers
were kept sealed for the minimum time to avoid CO2 toxicity to the microbes (Appendix #A. 1.4).
CO2 concentrations were generally in the range of 1000 to 1500 ppm at sampling, and never
exceeded 2000 ppm.
For isotopic adysis, 400 mL of gas were withdrawn with a 500 mt Pressure-Lok C-ge
with a side-port needle (Hamilton Co.), and were injected directly into the GC interface of a
Finnigan MAT252 mass spectrometer with a triple beam collection system (Appendix §A.1.1)-
Three to six injections were perfosmed per chamber oneach sampling occasion. Redts are reporteci
with respect to the PDB standard (§ 1.8.1). Overall accuacy and repducibility, includiag machine
and incubation error was iû.S%.

23.4 Elemental Analysis of SOU Respiml CO2
CO, concentrations in the chambers were measured immediately followiag isotopic analysis
with a Shimadm GC-8 gas chromatograph fitted with a 5 mL sample loop, an FID detector, a
Shimadzu MTN-1 rnethanizet and a Varian 4270 integrator. The carrier gas was helium aad
methanizer, oven and injector temperatures were 275 OC, 50 OC and 150°C respectively . A linear
2-point calibration was perfonned ushg laboratory standards of 999 ppm and 9936 pprn. NO
contaminating gases (eg. CH,, NOJ were detected.
23.5 Estimation of SOM Pool Sizes and Isotopie Compo~ition From SOU Respiratioii Data
2.3.5.1 Cdcu&ion of Soil Respiration Rate
Soil respiration rate was calculated h m the incubation data as follows:
CO, conc. x V x ~ c o , CO2 rate =
1,000,000 x time seaied (Eq. 2.1)
where CO2 rate = respiration rate [mgC dayl],
CO2 conc. = CO2 concentration in the incubation chamber headspace [ppm,],
V = headspace volume [a&] = 500 mL,
tiw sealed = time the chamber had been sealed for CO2 coiiection [days], and
p, = c h n density of CO2 at m m temperature = 0.50 mgC mL1.
Soil respiration rates duriag laboratory incubations typicaiiy decline exponentially with tirne.
Single and double exponential models (ie. muiti-pI models) have been used to describe this pattern
and to estimate the sizes and decay rates of Iabik and recalcitrant SOM pools (eg. MotavalIi et al.,
1994). The use of exponential cuve fits implies that the microbes are abstrate-limited.
The non-linearcm &thg procedure ofJMP Version 3.2.2 (SAS Mtute k., Cary, NC),
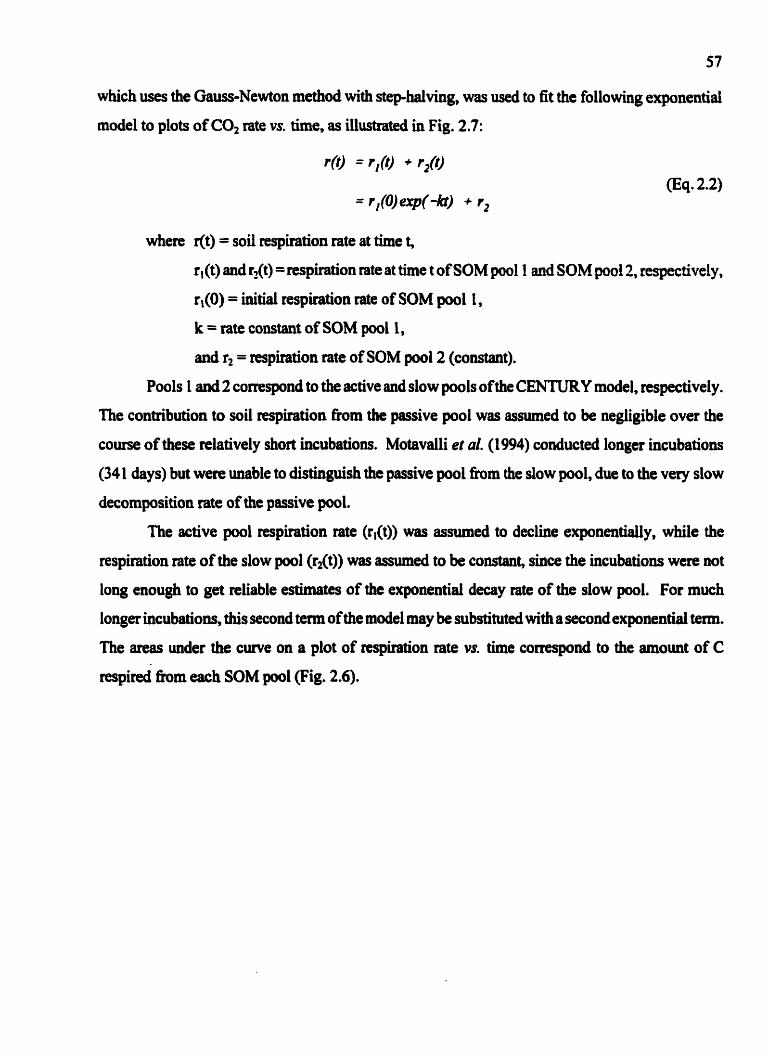
which uses the Gauss-Newton mthod with step-halving, was used to fit the following exponential
model to plots of CO, rate vs. tirne, as iiiusûated in Fig. 2.7:
where r(t) = soil respiration rate at time t,
q (t) and r?(t) = respiration rate at tirne t of SOM pool 1 aad SOM pool 2, resptctively,
q(0) = initial respiration rate of SOM pool 1,
k = rate constant of SOM pool 1,
and r2 = respiration rate of SOM pool 2 (constant).
Pools 1 and 2 correspond to the active and slow pools of the CENTURY moâel, respectively . The contribution to soil respiration nom the passive pool was assumed to be negligible over the
course of these ielatively short incubations. Motavalli et al. (1994) conducted longer incubations
(341 days) but were unable to distinguish the passive pool h m the slow pool, due to the very slow
decornposition rate of the passive pool.
The active pool respiration rate (r,(t)) was essumeci to decline exponentiaily, while the
respiration rate of the slow pool (r,(t)) was a s s d to be constant, since the incubations were not
long enough to get diable estimates of the exponential decay rate of the slow pool. For much
longer incubations, dUs second tem of the model may be substitutcd with a second exponential term.
The areas under the c w e on a plot of respiration rate vs. the comspond to the amount of C
resPired h m each SOM pool (Fig. 2.6).

total d l re8pitatkri rate,
-------- I SLOW
'2
Fig. 2.6 Illustration of the non-linear cuve fit ofrespiration rate vs. the . The solid line shows the exponential + constant curve of Eq 2.2, the deshed line shows the constant value of the slow pool respiration (rd. The two areas under the curve represent the amount of C respired fiom thc active and slow pools.
The amount of C respired ( C d h m the whole soi1 and the active and slow pools can be
calculated from Eq. 2.2 as foiiows:
total CT(a = rodt

r,(O! f
active cm# = kl( t )dt = Ppc -&,Io
Setting t = œ in Eq. 2.4 gives an estimate of the aize of the active pool (total active
C = -rl(0)/k).
2.3.5.4 Caicdatwn of Active and Slow P od a3C
Since the soi1 respired CO2 is a combination of CO2 denved h m the active and slow pools,
a simple isotope balance cm be used to calculate the isotopic compositions of the active and slow
pools (onC,, and 613C,, respectively) h m the isotopic composition of the respired CQ
(013CEoa), assuming that &"Cd= and OI3C, remain constant throughout the incubation. At any
given thne,
where F = the fraction of total CO2 contributed by the active pool = r,(t)/r(t).
Thus, if 613C,,0,,, and &13C,, are constarit, then a linear regression of W3C, VS. F sbuid
yield a straight line with a dope of bt3C, + 613Cs,kr and a y-inteqt of 613Cdw.

2.4 Soi1 Decarbonation Method
In O& to remove inorganic carbon (carbonates) h m soii before combustion for stable
carbon isotope adysis, the samples were treated with acid (Boutton, 1991). 1.5 - 2g subsamples
of soi1 were p u n d in a mortar and pestle, mixed with 15 mL of 1N HCl in a 50 mL Erlenmeyer
flask, and placed on a shaker table at 125 rpm for 24 hr, or until complete decarbonation was
achieved. To check for completion, a vacuum was applied to the flasks with a handpump. The
cessation of bubbling under vacuum indicated complete decarbonation.
Once decarbonated, the soWacid slunies were decaated into 50 mL polyester centrifuge tubes
and cenûifiged for 20 min at appmximately 8500 rpm. The soils used in this study were very sandy
and did not fomi a stable pellet. It was, thenfore, necessery to aspirate the supernatant after
centrifugation. Subsequentiy the soils were resuspcnded in about 40 mL of deioniPd water and
recentrifbged to remove the remaining acid. This rinsing step was repeated once more, for a total
of two water rinses, to bring the soils back to their original pH, which was measured using pH
paper. The samples were washed into aluminum weighiag bats and dried at 50°C for 48 hr.
2.5 Combustion Methd for 613C Measurements of Organic Samples
Static and dynamic combustion methods have ban used by many investigators to measure
the carbon isotopic composition of a variety of orgaaic materials (eg. Sofer, 1980; Boutton et al.,
1983; Showers and Angle, 1986). For this investigation, a static, high temperature combustion
method was chosen. Stetic combustionmethods eliminate the possibility of memory effects, as each
ssmple is combusted in its own container. This procedure has been shown to k more efficient anâ
yield mon reproducible resuits than dynamic methods (Sofa, 1980; Boutton et al., 1983; Stuivet,
1984). As well, high temperature techniques result in more complete combustion (Boutton et al.,
1983). fewa impurities (LeFeuvre mdJones, 1988). and betterreproducibility (Sofu. 1980; Boutton
et al., 1983) than low tempera- methods.
In this method, organic mataial is bmed at 850°C in a sealed evacuated quartz ampoule in
the presence of copper o d e , which acts as an oxygen donor. The organic carbon is converteci ta
CO, and then cryogenidy purifid for adysis by mass spectrometry. Copper wire is also added
to the ampoules, as it is thought to remove excess O2 and to convert nitmgen oxides to Nb CO to
CO, and S02 to CuSO, (Kendall, 1990; BOU~~OII~ 1991). The method is desctibed in more detail
below.
2.5.1 Reagent Prepadoa
Quariz ampoules, appmximately 20 cm in length and sealed at one end, wen prepared with
a H2/0, torch h m quartz tubhg (9 mm 0.d.. 7 mm i.d.). The ampoui es were pwified by firing them
in a mutne fumace at 850°C for I hr (LeFeum and Jones, 1988). It is important ?O wipe the outside
of the ampoules thorougûly to nmove fingerp~ts kfon firing, as salt can etch the quartz and make
it difficult to obtain a propet seal when the ampoules are attacheci later to an evacuation manifold
with Ultra-ton fittings.
A.C.S. certifieci wire form C u 0 (Fisher Chemicai, Fair Lawn, New Jersey, USA) was aushed
slightly in an agate mortar and pestie to break up the largest pieces (LeFeuvre and Jones, 1988). The
C u 0 was purified at 500°C in a mutne frimace for one hour. It was then stored under vacuum in
ashed, sealad glass ampoules until requirrd.
AR366 graaular Cu metai was w d as supplied by Alpha Resources tnc. (StevensviUe,
Michigan, USA) (Macke. pers. comm.).
Samples of organic material were thomughly dried and finely grouad to ensure homogeneity
of samples (LeFeum and Jones, 1988). This is especially important for soils, as they tend to be
hetemgeneous and ditncult to sub-sample (Boutton, 1991; Mike Chapman. pers. comm.). Finely
ground materiai also combusts more completely than coarse mataial (LeFeuwe and Jones, 1988,
Boutton, 1991. Ehle~ger, 1991). Samples that may contah carbonates were decatbonated as
described above before combustion (Boutton, 199 1).

2.5.3 Simple Loadhg Procediire
The amount of materiai requind for analysis is a fiinctioa of carbon content and the
requirements of the mass spectmmeter. In this investigation, sample sizes were chosen for a yield
of 5 to 10 mL of CO, Le. about 5 mg of plant material (C content = 45%C) or 75-200 mg of soi1 (C
content = 1 -2%C). Although this amount of COl greatly exceeds the minimum requirernent of the
mass spectrometer, the use of relatively large amounts of organic matter reduces the problem of
obtaining a representative sub-sarnple from heterogeneous material.
Each sample was weighed onto a clean piece of Al foil and loaded into an ampoule using a
longstem b e l to avoid deposition near the mouth of the ampoule, where it might be combusted
during sealing. Funnels made h m Al foil are ofien best for this purpose, since static charges do not
build up on their SUTface as they do on glass.
Approximately 2 g of Cu0 were added to each ampoule (Sofer, 1980; Minagawa et al., 1984;
LeFeuvre and Jones, 1988) with a longstem h e l . It is important to avoid the preseace of Cu0 dust
on the top half of the ampoule, as it can cause improper sealing. lg of Cu wire was added to the
ampoule (Mhagawa et al., 1984). This order of ingredients, with the sample at the bottom and the
heavier metd on top, helped to prevent the sample and Cu0 h m king drawn into the vacuum
manifold during evacuatioa
The ampoules were crimped with a H A torch about 7 - 10 cm h m the mouth, so that an
opening of about 2 mm remained. This made it easier to s e d the tubes under vacuum.
Up to 8 ampoules were attached at once to a vacuum manifold with 3/8" Ultratorr fittings aad
were evacuated to <1.2E-3 Torr (Sofer, 1980; Boutton et ai., 1983; LeFeuwe and Jones, 1988)
before king d e â with a H2/02 torch (Fig. 2.7).
Sealed ampoules may be stored indefhitely before combustion, but should be d y s e d
w i t b 5 days after combustion, since carbonates may begin to fonn, causing significatlt isotopic
Eractiomtions of carbon (Stuiver et al., 1984; Engel and May~lsrd, 1989). AU analyses in this
investigation were p d o d within 3 days of combustion.

Fig. 2.7 Schematic diagram of the vacuum manifold used for evacuation of ampoules durhg ample preparation, and for cryogenic purification of CO2 samples for isotopic d y s i s . During sample preparation, up to 8 ampoules were attached to the manifold using a multi- port manifold in place of one of the sample vessels in the diagram.
2.5.4 Combustion
The ampoules were &&en to mix the contents thomughly (Boutton, 199 1). and loaded into
1" diameter steel tubes to prevent damage to the fiaiace or ot&er ampoules, should one of the tubes
explode during combustion. Numbets punched into the steel tubes made etching the quartz for
identification unnecessary. The CuO was distributecl evenly dong the Iength of the tube (Sofer,
1980). Up to 17 steel tubes were loaded horizoatally into a steel rack in a muffle funiace and baked
at 850°C for 1 br (Boutton et al., 1983).
A slow cooling regime was used to ensure cornpiete conversion of NO, to N, CO to COt,
SOx to CuSO, (Boutton, 1991). The himece was aüowed to cool to 600°C fora dweiitime o f 1 hr.
Samples were then left to cool slowly ovemïght to pment cracking of the quartz
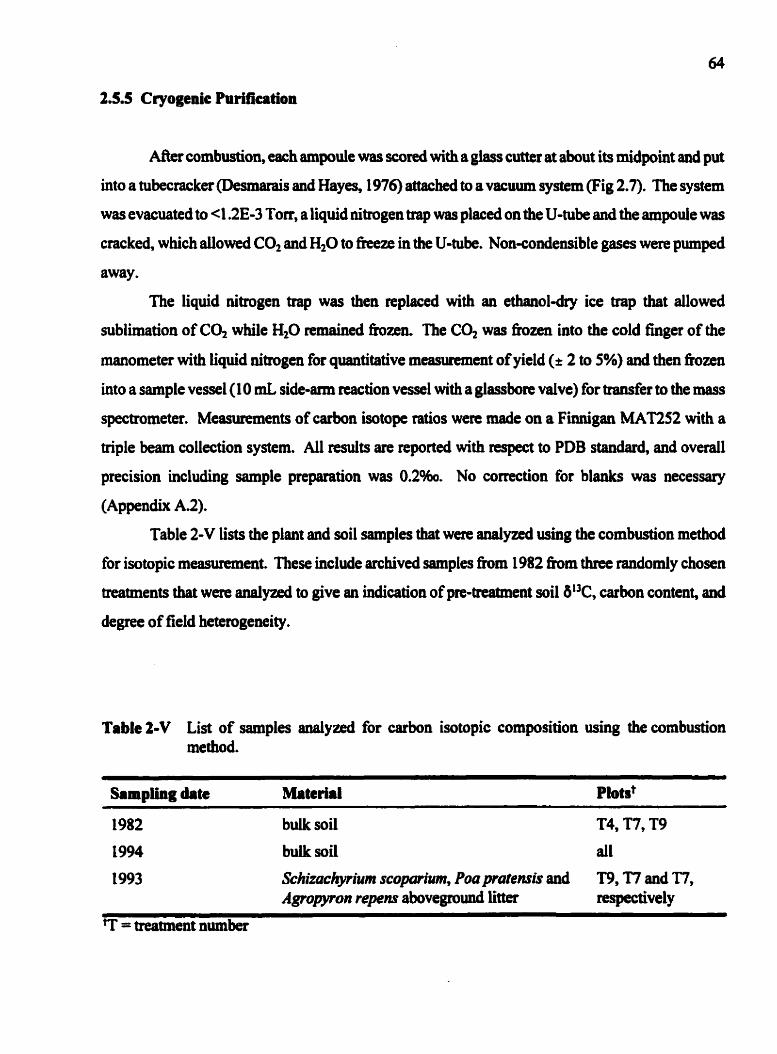
2.5.5 Ccyogenic Purification
Mer combustion, each ampoule was scored with a giass cutter at abaut its midpoint and put
into a tubectacker (Desmarais and Hayes, 1976) attached to a vacuum system (Fig 2.7). The system
was evacuated to 4.2E-3 Torr, a üquid nitrogen trap was placed on the U-tube and the ampoule was
cracked, which allowed CO2 and H20 to fmze in the U-tube. Non-condensible gases were pumped
away.
The liquid nitmgen trap was then replaced with an ethanol-dry ice trap that alîowed
sublimation of CO, while H20 remawd fiozen. The CO2 was fmzen into the cold figer of the
manometer with iiquid nitrogen for quantitative measiitement of yield (î 2 to 5%) and then fiozen
into a sample vessel (1 0 mL side-ami reaction vessel with a glassbore valve) for ûansfer to the mess
spectrometer. Measurements of carbon isotope ratios were made on a Finnigan MAT252 with a
triple barn collection system. AU results are reported with respect to PDB standard, and overall
precision including sarnple pnparation was 0.2%. No correction for blanks was necessary
(Appendix A.2).
Table 2-V lists the plant and soi1 samples that were analyzed using the combustion method
for isotopic measunment. These include archived samples h m 1982 fiom t h e randomly chosen
treatments that were analyzed to give an indication of pre-treatrnent soi1 &13C, carbon content, and
degree of field hetemgeneity.
Table 2 4 List of samples d y z e d for carbon isotopic composition using the combustion method.
Sampiing date Materiai Plotst
bulk soii T4, T7, T9
bulk soii al1
Schizachynium scopariwn, Pouprafemis and T9.7'7 and T7, Agropvron repens a b o v e p d litter respectively

Carbon content of soi1 and plant samples was m e m d on a LEC0 CHN-600 elementai
aaalyzer (St. Joseph, Missouri, USA). Samples were decarbonateci, dried and ground, as described
above for combustion. The anaiyzer was caiibrated with a labontory soil standard with a carbon
content of 0.77 0.02%. Precision was * 0.04 or 0.3%, whichever was Iarger.
The plant and soil samples listed in Table 2-V were analyzed in this nianaer.
2.7 Reconstniction of Vegetation History and Past Inpub to the Soi1
A data set of annual measurements of aboveground biomass for each species at the peak of
the growing season had beai collectcd by s W a t CCNHA for al1 plots for the period 1982 to 1994
and was used in this study to recoastnict quantitative and isotopic plant inputs to the soil (see also
52.2.2). Since S. scopmium, A. repens, and P. proionsis together accounted for >80% of
aboveground biomass, estimates of the amount of net primary production (NPP) and values of 6°C
in tissues were based on these three species, with the balance of the biomass lumped as C, "forbst'.
The amount and blF of total NPP for each plot in each year was estimated as follows:
ANPP, = peak biomassx x ( p a E m J
ANPP, x root: shootX x (% r o ~ t s ~ ~ ~ ~ ) ~ BNPP,=
root twnover tinte
(Eq. 2.9)
(Eq. 210)

where subscript x indiates p i e s x, ANPP = muai aôovegiound NPP, BNPP = aunuai
belowpuad NPP. Root turnover t h e was assurned to be 2 years for al1 species. Beiowground
inputs wen calculated to a depth of 15 cm since soi1 sampies used in this study came fiom this layer.
Values for the above parameten are listed in Table 2-VI.
Table 2-VI Panmeters used in estimation of amount end isotopic composition of plant input to the soi1 for 19824994,
ANPP : peak biomass 1 : 1 .2Sa 1 : 1 .7Sa 1 : 1 ,7Sa 1:l' % of roots in 0-15cm layer 8W 90' 9P 9P
6°C -1 1 .8%ob -26.mb -27.S%ob -26.mC D. Wedin (unpublished data) measureâ in this study estimate based on other C, plants
3.1 Vegetation Dynamics
The resuits of the vegetationrecotl~tnrctiondescribed in 82.7 are given below. Abovegmund
biomass data were used to estimate NPP, species proportions, C, and C, plant biomass and the
proportion of the two groups, and 613C signatures of NPP. The ecological implications of the
observed vegetation patterns on soi1 carbon storage and soi1 isotopic composition are also presented.
One of the plots (8-39) had u n d vegetation pattern, and was excluded h m m e r
analysis, based on its vegetation pattems (see Appendix B for complete details).
3.1.1 Net Primary Pmductioii (1982-1994)
Total estiuiated cumulative NPP fmm 1982 to 1994 increased non-lineady dong the N
gradient (Fig. 3.1). Cumulative production was approximately four times higher in plots that
nceived the high N ûeatments than in conml plots. nim was no significant différence w0.8) in
NPP between the two types of control plots (Tl and Tg). which c o b e d that N was nuûient-
limiting at the site (Fig. 3.1). N addition increased NPP significantly, with respect to that in the
controls, in all treatments except T2 (Tdcey-Kramet test, a = 0.05).
As describai in detail in pmious studies of Field B and M a r N-gradients in other fields,
fertihtion had a large effect on species composition in abandoned fields at CCMIA. The main
effects o M addition on vegetation composition a& CCNHA were decreased species diveisity aad the
displacement of native C, pmdd prairie species by introùuced C, species (Tilman 1987,1988;
inouye and T i 1988; Wedin and Tilman, 1996). Species richness in Field B and on two similar
N gradients in otha fields decrresed by 50% after 12 yeam of fertilization, as exotic C, species, such
as A. repens and P. pratensis, dîsp1aced the more diverse native piaine flora (Wedin and T i i
1996).

Fig. 3.1 Treatment means of total NPP (abovegrouad and klowground) for the period 1982 to 1994, as estimated in 82.7. EITO~ bars are 1 SD, n=3 fot al1 treatments, except the highest N-addition rate (27 g N m*2 yrg'), where n-2. The two control tmtrnents (N-addition rate = O g N rn-2 yr-') did not differ signincantly w0.8).
Fig. 3.2 shows the estunateci relative abundance of the thne dominant species in the 27 plots
used in tbis study, der 13 yem of N-addition. The estimates were calculatecl as describeci in 82.7.
The distribution of the species sorteci sharpIy dong the N-gradient. S. scop*um was dominant in
plots in the low N ûeatments, but was displaceci ahnost completely by A. repenr in the high N
treatments. P. pratemis m h e d its peak abundance at intemediate rates o M addition. This pattern
was estabLished in the initial years of the expetiment (Xilmao, 1988).

Figi 3.2 Species distribution after 1 3 years of fertilization, estimated h m longiem vegetation data as per t2.7. The two control ûeatments pl and T9) are show combined, as they did not differ signifïcantly (t-test, p = 0.1,l .O and 0.9 for A. repenr, S. scomum and P. prcrtemis, respectively). E m bars are 1 S a n=3 for aii mmients, except T8, where n=2.

3.1.3 C, Biomass and Proportion of C, and C4 Species
Fig. 3.3 shows the estimateci aboveground C4 biomass and the proportion of C4 species in
plots dong the N gradient between 1982 and 1994, as calcdated foliowing $2.7. The trestments
were grouped into four N categories (controls, low, medium and high additions ofN), for simplicity.
The plots receiving the control ûeatments had a relatively constant C, biomass (mean = 78 I 29 g
m") and proportion of C, biomass (mean = 0.70 i 0.16) during the study, which strongiy suggested
that the field had reached a relatively steady species composition by 1982 and was no longer
representative of an earlier dynamic stage in the successional sequence described in 92.1.1 -4.
Although C4 p i e s were evenaially displaced in the plots that receiveà high N additions,
C, biomass initially increased in these plots, relative to that in control plots. AAet several years, the
biomass decmased rapidly. A similar, but less rapid trend occumd in plots that received the
intermediate levels of N, although they had not lost ail C, plants by 1994. Over an extended peciod
(25 yrs), the C, component of the vegetation may be lost eventdly h m plots that received these
treatments.
C4 biomass was slightly higher in the plots where low amounts of N were added compand
with correspondhg values in controls plots and, by 1994, there was a trend towards lower C,
biomass in the formet plots.
The estimated cumulative NPP C, plants (1982-1994) and relative abundance of species
d B e d dong the gradient (Fig. 3.4). Even though C, species were displaced completely a f k a few
years in plots that receivd the high N treatments, the initial period of hi& C4 pmductivity resulted
in about the same total C, biomass h these treatments as that in the contml treatments. In contrast,
the cumulative relative abundance of C4 s p i c s declhed dong the graàient, but there was little
change in the amount of biomass at T2-TS, due to the fact that these plots were dominated by C,
plants for several years aiter the start of the experiment and had a 1- C4 biomass.

Year
Fig. 3.3 Esthated abovegroumi C, biomass (a) and proportion (O) behmen 1982 and 1994 for controis, low N m, T3), medium N (T4, T5), and high N (T6, T7, T8) tteatments, estimateci as per 82.7. Error bars are 1 SD of category means.

Fig. 3.4 Relaîive and absolute arnounts of C, production for 1982-94. Conml treatmaits 0 1 and T9) are show combined as they did not m e r signincantly w0.8 and p0.9 for C, relative abundance and NPP, nspectively). E m bars are 1 SD, n=3 for al1 treatments except T8 (27.2 g N ni2 y-') , where n=2.

Net primary production was affecteci strongly by an muswiiy long and severe drought in the
iate 1980's (set 52.1 -2.5). Although estimated production decreased in d treatments in these years
(Fig. 3 .5), plots with a signifïcant C, biomass component (medium and high N trratments) showed
much larger declines in biomass under bught conditions than the C,-dominated plots that received
the low-N treahnents. At the height of the ârought in 1988, the largest decrease in aboveground
biomass occurred in T7, where 1988 biomass was 74% lower than the pre-drought average (1982
to 1986). In cornparison, in the control treatments, biomass in Tl did not decrease significantly
@=OS) and that in T9 dropped by 3 5% @-Q.03).
3.15 Estimation of oi3C of OM Input (1982-1994)
Fig. 3.6 shows the estimated carbon isotopic composition of the annuai NPP (6"C,) for ail
nine treatments, as calculated following 82.7. The two control treatments 0 1 and Tg) had a
relatively constant 6'3C,,, reflecting the relatively stable C,-dominated vegetation. nie means of
6I3C, for the control treatments (Tl and Tg) were -16.3 a2.1Jbr and -1 5.9 * 2.3'96, cespectively,
and did not daer significantly (p0.3, F = 0.76, df = 76).
Fig. 3.6 clearly shows the temporal patterns of change to C,dorninated vegetation that
resulted h m fertiiization. Incmasing N input increaseâ the rate of change h m C, to C, vegetation.
At the highest N-addition rate (T8), the shift o c c d rapidly and the vegetation was composed of
entirely C, plants &er about 5 yrs, while the vegetation in plot in T6 and T7 reached that stage after
about 8 years. Although the remahhg treatments (T2-T5) did not result in total domination of the
vegetation by C, plants by 1994, they ai l showed trends to more negative values, with latgest
rates of change in the composition of the vegetation occwing in plots which received the higher
rates of addition of N.
The hi& rates of change in 613c,, found in T6-T8 resulted in zelatively large standard
deviations (SD) for the treatment means in m e years. This is due to slight differences between the
plots of each treatment in the timing of the shift k m C, to C, vegetation. Where the rate ofchange
is large, an offset as smaii as one year between plots cm remit in rdativeiy large SD's.

Fig. 3.5 Estimated total aboveground biomass between 1982 and 1994 for controls plots and plots that received low N, medium N, and high N additions, as per 82.7. The shaded bar in each graph iadicates the three years of hught in the lait 1980s. N = 3 for ali treatments except T8 (high N), where n=2.
O
v 1 I 1 I
1982 1- 1986 1 088 1s90 1982 l! 1
Year

1982 1988 1990 1982 1986 1990 1982 1988 1990 1994
Year
FigB 3.6 Treatment means of estimated annuai 6"C, for 1982-94. Errot bars are 1 SD, n=3 for al1 treatrnents except T8, where n=2.
3.1B6 Implications for SOM Pwlr
Baseà on pa- of isotopic composition of OM inputs to the soil, predictions can be made
for the isotopic composition of the SOM pools b a d on the CmJTURY model, as describeci in
1.7.4. Since al1 ûeatments haâ similar soü 613c values at the beginning of the experiment, the bulk
soil O"C signature shouid reflect the isotopic composition of the total OM input into the soiî during
the experiment (1982-94). The fmai buik soi1 &I3C should be expeckd to lie between the initial soii

6°C and 8'3C, values. The slow SOM pool should show a similar pattern and may nfiect the OM
input during 13 years of the experiment even better than the values for the bulk soil, since it has a
faster tumover thne than the bulk soil. The slow pool tumover is on the order of decades, similar
to the duration of the experiment: thus, the slow pool should contain primarily OM input h m the
experiment, while the bulk soi1 also contains older, acalcitrant OM (passive pool). The active pool,
with its short tumover tirne, should d e c t the 6I3c, of the most ment yeais. These predictiom
will be assessed in §4.2.2,4.4.3 aad 4.4.4, respectively.
Fig. 3.7 shows the estimated cumulative 6% of OM inputs for the periods of interest. The
dotted line indicates the estimated isotopic composition of the cumulative NPP (613C,,,$ in each
treatment, which shouid be refiected in the slow SOM pools and in the bulk soils. The values were
calculated as the weighted means of 6"~ , for 19824994, as follows:
Although the &I3C, signature was ca -27.5960 in the high N ptots during the final years of
the experiment (Fig. 3.6). the high initial C, productivity in these plots resulted in a 013CNepc0.PI,
value that was significantiy more positive (ca. -23 to -25%0). The graph also shows the effect of the
different rates of vegetation change arnong treatrnents, which resuited in more positive b13Cwn.M)
values in plots of T6 and T7 c o m p d with plots that ceceived highet amounts of N (T8), even
though al1 of these treatments were represented only by C, plants in 1994.
nie dashed and solid liaes in Fig. 3.7 show the isotopic composition ofNPP for two petiods
and are iaformative about the nature of the active SOM pool. Since this pool is thought to have a
turnover time ranging h m 0.5 to 5 years (Parton et aï., 1987; Paustian et al., 1992; Motavalli et al.,
1994). Fig. 3.7 shows the cumulative b"~, for the final year and the last five years of the
experkent (6i3CNPp(P11 and 613CNPRw91), rrspectively). 613C,R-1 was calcdatedusing Eq. 3.1 with
summation iimits of 90 to 94. The two periods difliered signiscantiy ody in ûeatrnents which
ceceived medium amounts of N, due to the fact that the @es composition in these mtments
changed nlatively quickly duiing the finai five years of the experiment (Hg. 3.6).

3.2 Buik Soil Analyses
3.2.1 Initial Buk SOU Carbon Content and 6°C Values (1982)
Pte-treatment (1982) bulk mil %C and &13C values were measured for aN plots in t h
randomly chosen treatments (T4, T7 and T9). Mean soi1 carbon content was 0.26 0.05% and the
soi1 6°C value was -22.7 * 0.4% (Table 3-1).
3.23 Final Bu& SoU Carbon Content (1994)
Soil carbon content (%C) increased between 1982 and 1994 in al1 treatments, inciuding the
controi treatments (Tl and T9), and mged h m 0.3 1 to 0.80 %C in 1994 (Table 3-1).
The two control tteatments (Tl and Tg) did not Mer in their soi1 C contents (p0.7) and
showed a net increase of ca. 45% in soi1 C storage behmen 1982 and 1994 (Table 3-1). The largesi
increase in soil C content o c c d in treatments that received high amounts of N (T7 and T8) and
the increase was ca 200%.
It is not stnctly correct to use soil % C as a direct measure of mil carbon storage without
taking into account potentid changes in the soil bulk density (BD [g cm-3]) with increasing % C. No
dinct measurements of BD wae made in this study, but the telationship between BD and sail % C
at the site, as determined in a pcevious study, was used to estabiish whahcr a correction for BD
changes was nece- (BD [g cm*3] = -O.O73(%C) + 1.5; Wedin, unpublished data). Using this
equation and the m e d vaiues of %C, the calculated range ofBD in this experiment was 1 A42 to
1.486 g cm-3. This range was smali and did not &kt the calculation of carbon content significantly,
so that no c o d o n for BD was mcessary and %C could be used dirrctly as a meamce of soil C
storage.

Table 3-1 Pre-treatment (1982) and pst-treatment (1994) bulk soil C content and isotopic composition.
-
N-additioa rate Wk'?M Bulk 6°C (%O) 1!W4 Tmatmtat Mea& Treatment Plot (LN m" yfJ) 1982 1994 1982 1994 K C 6°C (W.)
- -- --
1982 Mean (SD): 0.2qO.OS) -22.7(0.4)
' numbers in btackets are 1 SD.
3.2.3 Final BuUc SOU bUC (1994)
Table 3-1 gives the fiaal (1994) carbon isotopic compositions of the soil, which ranged h m
-1 9.7%0 in the control plots to -24.9%. in plots that received bigh arnounts of N (T8). The meam of
soil &13C for the control treatments (Tl and Tg) did not differ significantly @ = 0.4).

As explaineci in 53.1.6, the final bulk soi1 isotopic composition (6uC,,,tw$ should ceflect
6'3~wRna) values. Both sets of resuits are shown in Fig. 3.8, dong with the initial soi1 6°C value
(613Cmil~or) for reference. The deta confonn to the expected pattern, with the nnal soi1 6I3C values
placed between the initial soi1 6% and the bI3C values of OM input. A linear regession of
b"C,,, against 6t3cwRw was highiy si@cant (Fig. 3.9). The point at which y = x on the
regression line ia Fig. 3.9 is the point where iI3C, = IUCinitirlMI, which shouid be the sarne as the
measured b13Cmi1(a1 value. The value on the graph is -23.0%0, which is within the error of the
muisured 613C,w, cesuit of -22.7 MA%.
Fig. 3.8 Treatment means of v a b of ot3C,, for 19% (sotid black b) and values of cumulative 6I3CC, for 1982 to 1994 (soiid grey line). Also shown, fot reference, is the initiai soi1 isotopic composition in 1982 (deshed line). The two controt treaûnents âid not di&r siBnificantiy @ = 0.8 and 0.4 for 6WmMa1 and 6t3C,,, respectively). Error bars are 1 SD.

Fig. 3.9 Final 6I3C,, vs. cumulative b'3C,,. Emr bars are 1 SD of ûeatment means, n=3 for al1 ûeatments except TB, where n=2. The equation for the linear regression (solid line) is b13CmiNM, = -15.1 + 0.3S(b1'Cm,,~. t marks the point where &13C,Mw, = &"Cwpca-er,. The two control treatments did not differ sigaincantly @ = 0.8 and 0.4 for 6'3CNPP(n44, and 5I3C,,, respectively).
3.2.4 Efficiency of Sou Carbon Squestration in Plob of C, and C, Species
It is of interest to know whether the ratio of the biomass of C, to C, species affects the rate
of carbon accrrtion in the soi1 (ie. does the lower litter quality of C, species resuit not only in slower
litter decomposition, but also in higher soi1 carbon storage in the long tam?). Fig. 3.10 shows the
relationship between naal soi1 carbon content and total OM input to the mil. Values of nnal soi1 %C
are stmngIy coneiated with total NPP, and the y-interrept ofthe linear regression line is within enor
of the measured vaiue of sou Y& in 1982 of 0.26 26 O.OS%C (Table 3-0. Thre is no obvious

difference in the rate of soil C accretion beîween the Iow NPP plots wbich were dominated by C,
species and plots where NPP is high, that are dominated by C, species.
I f the low quality of C4 litter does remit in higher rates of soil C sequestration, the fiaction
of OC input retained as SOC (%Cd shouid increase with the proportion of C4 biomass in the OM
input. In order to test this prediction, %Cm was calculateci for each ûeatment and plotted as a
fiinction of cumulative proportion of C4 species for the cumulative biomass between 1982 and 1994.
Fig. 3.10 Final soil carbon content in 1994 vs. total cumulative orgdc m8tter input(tota1 cumulative NPP h m 1982 to 1994). Emr bars are 1 SD of traitment means, n=3 for ai i ûeatments except T8, where n=2. The linear regrrssion equaîion (solid he) is %C = 3.74E-S(NPP) + 0.28.

3.2.4. I Estimation of %Cm
3.2.4. I .a Culculation of Turnover Tate of "Old" C
The schematic diagram in Fig. 3.1 1 illustrates the nrst step in the calculation of %Cm in soil.
For the purposes of this discussion, carbon present in the soil in 1982 will be caîled "old" C, and
carbon accrued after 1982 will be calied "new" C (shown as white and grey in Fig. 3.1 1). Let X be
the amount of old C present in soi1 in 1982, A be the amo~t ofold C lost to decomposition between
1982 and 1994, and Z be the total amount of soil caibon present in 1994. Y is the net increase in
carbon between 1982 and 1994 (Y=Z-X), and Y+A is the amount of new C present in the soil in
1994 (Fig. 3.1 1).
X, Y and Z (g C m-') can be calculated ditectiy fiom measurements of soil C as a percentage
of the dry weight and the estimated bulk density (83.2.2.1). An estimate of A can be calcdated h m
the control treatments as follows. Let the isotopic compositions of X and Z k &'3~,,(,, and
613C,l(w,, respectively, and assume that the isotopic composition of old C does aot change as a result
of decomposition, ie. that PC, = &"C,,,,. Since the isotopic composition of the OC input in the
control treatments was appmximateiy constant during the expciiment (Fig. 3 A), one can assume that
613~,, = àt3CWR,. A simple isotope balance of the soi1 in 1994 (Eq. 3.2, Fig. 3.1 1) can be
solved for A (Eq. 3.3, Fig. 3.1 1). and, hence, WA is the fiaction of the original carbon lost to
decomposition during the 13 years of the expriment.
Using this appmach, the tumover of "old" carbon was calculated using data h m conml
plots (T9) (Table 3-II), sime direct mcasurrments of initial and nnal mil C contents were made for
thir treatment (Table 3-1). Approximately 10% of the old C was Iost between 1982 and 1994.
Table 3-11 Data useâ in the calculation of %C lost in Tg. Values given are matment mem. Soil carbon contents O(, Y and Z) were calculated to a depth of 15 cm usiag a mean buk density of 1.48 g cmœ3 and measmd %C values h m Table 3-1 [soii C content = (%CI1 00) x 1 .48 g cmm3 x 15 cm x 10,000 cm2 m-2]. A was calculated h m Eq. 3 3 (Fig. 3.11) and %C,m = (ABC) x 100.

X-A Y+A, 13 6'3Cd4941 =-'0' 3cd4M) +- z z C~Pq82-W)
. Isotope balance:
(Eq. 3.2)
(Eq.3.3)
Solving for A:
Fig. 3.11 Schematic diagram of the conceptuai mode1 used to calcuiate the turnover rate of old carbon using Equation 3.3. X = the amount of soi1 C present in 1982 ("old C"), A = the amount of old C Iost between 1982 and 1994, Y = the net gain of C and Z = the total soi1 C pnsent in 1994.
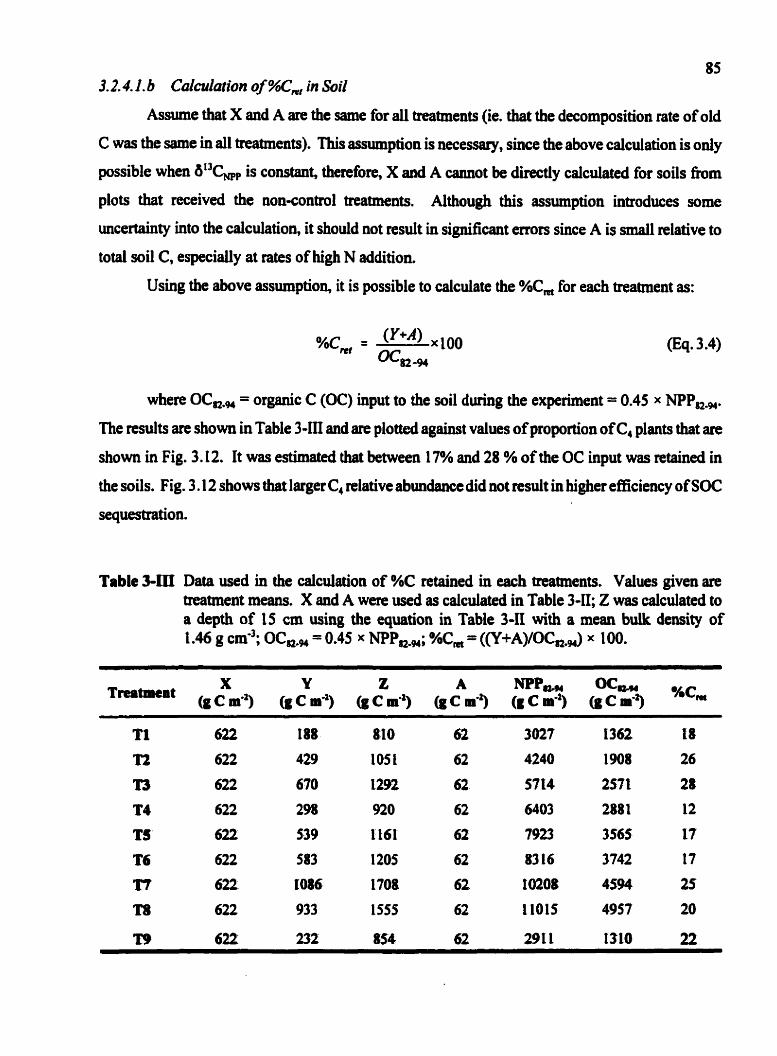
85 3.2.4.1. b CuZ~tllation of %Cmf in Soil
Assume tbat X and A are the same for ai i treatments (ie. that the decomposition rate of old
C was the same in ai l ûeatments). This assumption is necessary, since the above caiculation is only
possible when b"Cm is constant, thetefore, X and A cannot be d h t l y calculated for soils from
plots that received the non-contml ûeatments. Although this assumption introduces some
uncertainty into the calculation, it should not result in signifiant emrs since A is smail relative to
total soil C, especiaily at rates of high N addition.
Using the above assumption, it is possible to calculate the %Cm for each treatment as:
where OC, = organic C (OC) input to the soil during the expriment = 0.45 x NPP,.
me results are shom in Table 3-iII and are plocted agairist values of proportion of C, plants that are
shown in Fig. 3.12. It was estimated that between 17% and 28 % of the OC input was retained in
the soils. Fig. 3.12 shows that larger C, relative abundance did not result in higher efficiency of SOC
Table 3-ïII Data used in the calculation of %C retained in each treatments. Values given an treatment mem. X and A were used as caiculated in Table 3 4 ; Z was calculated to a depth of 15 cm using the equation in Table 3-II with a mean bulk density of 1 .46 g cmo3; OC, = 0.45 x NPP,,; %Cm = ((Y+A)/OC,) x 100.

Fig. 3.12 The percentagc of OC input retained in the soi1 (%Cd vs. cumulative C, proportion (1982-94) for ai i plots. Linear regression of the data (solid lim) was not significante %CM was calcuiated as describecl in 83.2.4.1 be
40 -
30 -
J 20 - àP
10-
4
4
O O
If the isotopic composition of Litter is p-ed as it decomposes and becomes part of the
SOM, then the 6°C values ofthe soiî C accnied between 1982 and 1994 (6I3c,) and the OM input
to the soi1 during that tirne (6"Cm&) shodd be the same. 6°C- was caicuiated h m the
meaaued soi1 Y& and 6°C values, and the turnover rate of old C calcdated in 03 2.4.1 .a (1 0% loss
of old C), in the foiiowing isotope balance:
?=0.011, p>0.7 O
O m
O
a m a 1
I) m m
A
O a
a a w m
a
m
I 1 I I 0.2 0.4 0.6 0.8
C, proportion (1 982-94)

Solving for 0t3C,:
where %C, = %CM - (0.9*%Ca. The 6°C- values were then compared to the estimated
isotopic compositions of the OM input to the soils (&'3~mRn.w9. The results are shown in
Table 3-IV.
The difference between bI3c,: and 6'3C,, was normaily distributcd (Shapiro-Wiikes
test, p = 0.6) aMi ranged h m -4.7% to 2.0%. The mcan was statistically different nom O
(p = 0.005) and was -1.1% * 1.8960.
3.3 Active SOM Pool Size
The respiration rate results nom incubations are presented end estimates of active pool size
are given.
3.3.1 Respiratioa Rate Pattern and Curve Fit
Fig. 3.13 shows a typical acample of the pattern of mil respiration rate observed during the
incubations. For dl incubations, respiration rate decüned exponentially and reached a relatively
constant rate by the end of the incubations (day 197). The two replicates of each plot were always
within measurement error of each other, and the exponentiai decay mode1 desctibed in 92.3.52
[r(t) = q(O)exp(-kt) + rd was a good fit for the data. Table 4-1 iists the parametet estimates from the
curve fittïng procedure.
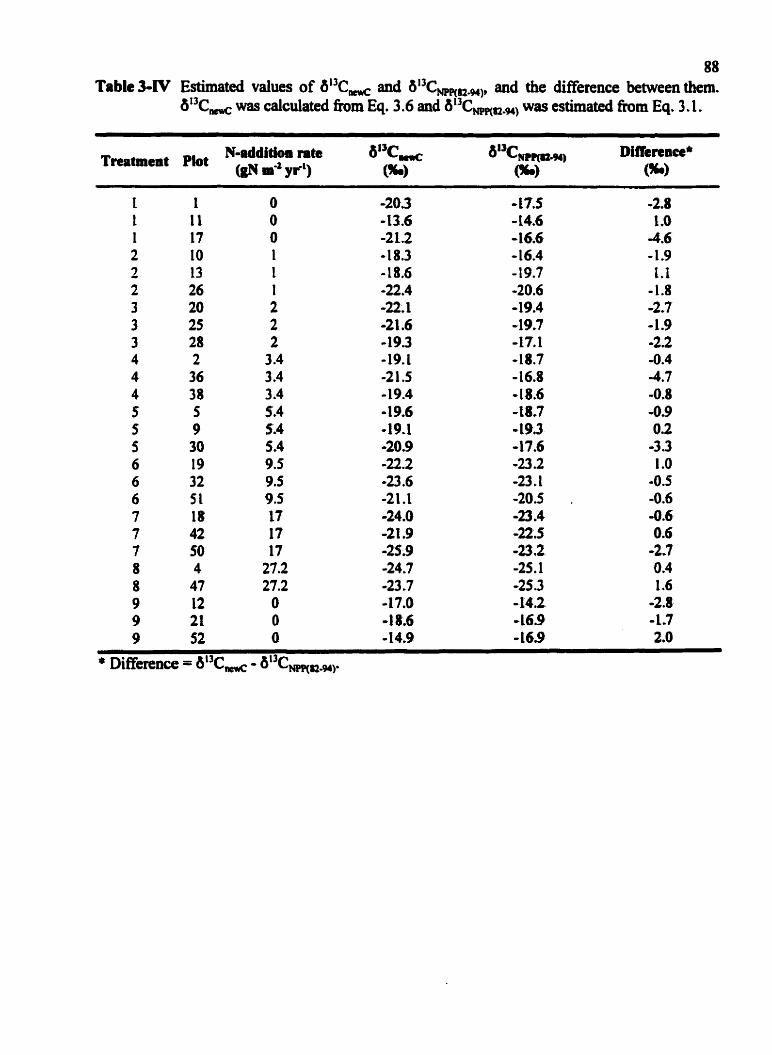
88 Table 3-IV Estimated values of b13C, and 6'3CNprm-M), and the dwerence between them.
6°C- was calculated h m Eq. 3.6 and 6"CWRu, was estimated from Eq. 3.1.
Tmtment Plot N-addition rate 6I3CM w wL) (tc)
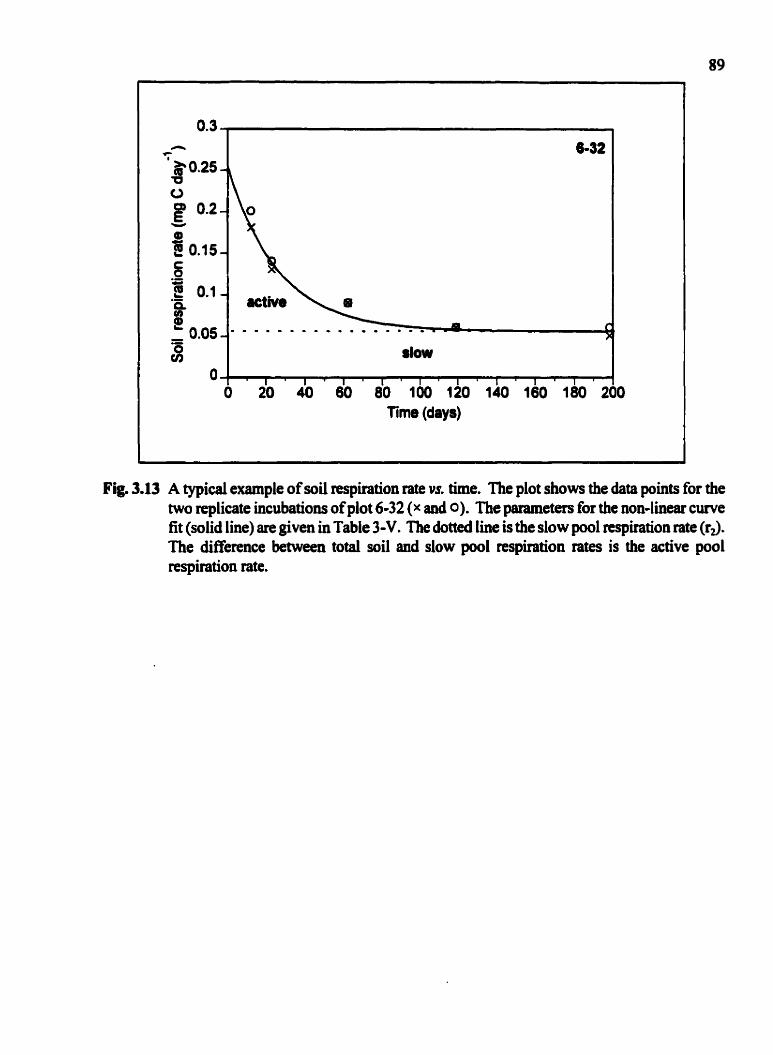
0.3 n
T- 6-32
.- 8 slow
O 20 40 60 80 100 120 140 160 180 20( Time (days)
Figo 3.U A typical example of soil respiration rate vs. tirne. The plot shows the data points for the two replicate incubations of plot 6-32 (x and O). The parameters for the non-linear curve fit (solid line) are given in Table 3 4 . The doaed fine is the slow pool respiration rate (rd. The difference between total soil and slow pool respiration rates is the active pool respiration rate.

Table 3-V 90
Redts of the c w e fittiiig procedure of soi1 respiration rate vs. time using the mode1 r(t) = r,(O)exp(-kt) + r2t, where r(t) = soi1 respiration rate at time t, r,(O) = initial active pool respiration rate, r, = slow pool respiration rate, and k = active pool rate constant. The c w e fits were dom using JMP non-linear cuve fitting, and ail fits converged with a = 0.05.

91 3.3.2 Sue of the Active SOM Pool
The s k of the active pool for each plot, calculated using Eq. 2.4 is shown in Table 341 ,
relative to the total soi1 (pg C g-' soii) and to the total SOC (% of total SOC). The active pool size
difFered significantly between the two control treatments (Tl and T9), which had mean active pool
s i ~ s of 6.1 * 1.1% and 4.1 & 0.2%, respectively @Q).05, F = 9.6317, df = 5).
Table 341 Estimateci size of active pool for each plot and matment, calculated using Eq. 2.4.
-
N addition Active pool size Mean ac!ive pool r i p f Treatmeat Plot rate
(g N mes y r ) (% o f tobl SOC) Uy C g' d l ) (X of total SOC) (pg C gml mi0
I 1 O 7.0 21% I I l O 6.2 219 6.1 (1.1) 219 (1) 1 17 O 4.9 220 2 10 1 6.3 260 2 13 1 5.7 230 6 2 (0.4) 296 (89) 2 26 1 6.4 398 3 20 2 6.9 311 3 25 2 9.0 589 8.0 (1.1) 478 (147) 3 28 2 8.0 533 4 2 3.4 13.6 479 4 36 3.4 6.9 327 10.8 (3.4) 448 (t09) 4 38 3.4 12.0 539 5 5 5.4 2-4 134 5 9 5.4 1.9 95 2.2 (0.2) 1 16 (20) 5 30 5-4 2 3 120 6 19 9.5 3.2 174 6 32 9.5 2.7 1 76 3.6 (1-1) 191 (28) 6 51 9.5 4.8 223 7 18 17 4.2 328 7 42 17 3 "7 293 3.7 (0.5) 297 (29) 7 50 17 3.3 270 8 4 27.2 2.0 129 8 47 27.2 2.7 206 23 167 9 12 O 4.1 155 9 21 O 4.3 171 4.1 (0.2) 159 (1 1) 9 52 O 4-0 151
* numbers in btsckets are ISD of treatment mean

Fig. 3.14 Treatment meam of the estimated size of the active SOM pool. Error bars are 1 SD, n=3 for al1 treatments except T8 (27.2 g N ma* TI), where n=2.
The treatment means of active pool size are plotteâ vs. N addition rate in Fig. 3.14. Active
pool size increased through T4, h m 4 - 6% of SOC in the controls to 1 1% in T4, and then declined
to a relatively constant size of 2 - 4% in T5 to T8.
3.4 Isotopic Composition of Slow and Active SOM Pools
The isotopic composition of soil respited C 4 for the two nplicate incubations for each plot
was within measurement emr (* 0.5%) for ail but two rneasutements: Plot 8-4 on day 9 and
Plot 9-2 1 on day 60 (difference between repliates was 1.1%).
Table 3-W shows the resuits of the caicuiation of 613C, and 613C,, as descd'bed in
62.3.5.4. The correlatios were highiy signincant fot 14 plots (8 > 0.8, p < 0.05) and somewhat

93 significant for a M e r 3 plots (0.6 < ? < 0.8. p < 0.08). Fig. 3.1 5 shows the treatment meam of
6°C- and &"c, and the isotopic composition of the relevant OM but , teproduced fiom
Fig. 3.7.
0'3~,,, was strongiy coneiated to 6"cwRPa) (? = 0.90. p < 0.0001). ComIations between
613C,, and PC,,, and &"Cm were also sisaificant (9 = 0.43, p c 0.005, and 8 = 0.55,
p < 0.05, respectively).
Table SVII Estimates of slow and active pool isotopic composition, and regnssion parameters for linear regression (Eq. 2.6). 6I3Cd, = intercept of regession.
Sbpe &"CI, Treatment meana (960) Tmtment Plot r'
(K.) W ) ar=c- ai SC,

Figi 3.15 Treatment means of estimated isotopic composition of (a) the slow SOM pool and 1982- 1994 OM input, and (b) the active SOM pool and 19904994 and 1994 OM input. The grey h e shows the 1982 soi1 isotopic composition (-22.7%) for cornparison.

From the estimated values of 6°C- &I3C,, and the active pool size, it is possible to back-
calculate the isotopic composition of the buik soi1 and to compare this value to the measured value,
&"C,l~wr This calculation requires the assumption that the passive pool s k is small. Table 3-Vm
shows the results of this calcdation, using the following isotope baiance:
where 5'3C,, = the calculated isotopic composition of the bulk soi1 in 1994, and
LVe = the size of the active pool as k t i o n of total SOC.
The rnean of the diffierence between the measured and calculated values
(bL3C,,,(,, - b13C,,.& was -0.6 * 0.6% ami was within measurement error.

Table 3-VIIï Cornparison of the isotopic composition of the bulk soi1 calculated using Eq. 3.7 (6"Ci ,A and m e a s d values (6'3~dw$.
-- --
~reatmtmt ~ l o t a~,, auc, a ~ , , . ~ c - 1 1 -21 J -22.1 -0.6 I 11 - 19.4 -19.7 103 I If -20.4 -22.0 -1.6 2 10 -19.8 -20.8 -1 .O 2 13 -20.6 -2 1 .O -0.4 2 26 -22.1 -22.5 -0.4 3 20 -21.4 -22.4 -1 .O 3 25 -22.5 -22.0 0.5 3 28 -20.5 -20.5 0.0 4 2 -21.2 -2 1 -5 -0.3 4 36 -21 2 -22.1 -0.9 4 38 -19.4 -21.1 -1 .7 5 5 -19.8 -20.9 -1.1 5 9 -20.2 -20.8 -0.6 5 30 -21 .2 -2 1.7 -0.5 6 19 -23.1 -22.4 0.7 6 32 -23 -4 -23 3 O. 1 6 51 -22.0 -2 1.9 O. 1 7 18 -2 1 .? -23.6 -1.9 7 42 -2 1.8 -22. t -0.3 7 50 -243 -24.9 -0.6 8 4 -24.0 -24.0 0.0 8 47 -22.7 -23.4 -0.7 9 12 - t 9.5 -20.5 -1 -0 9 21 -19.5 -2 1 .O -1.5 9 52 -19.1 -19.7 -0.6

4. DISCUSSION
4.1 Vegetation Dynamics
4.1.1 C, and C, Dyiamies
The two control treatmeats did not diaer significmtly in NPP, therefore nitrogen was
nutrient-limiting at the site (53.1.1). The npid hcrease in production at low and medium N addition
rates (Fig. 3.1) was a reflection of the high NUE of Schizachyrum scoparium, compared to the C,
species (52.1 -2.4). In the initial years of the experiment, SchUachyrm scoparium was able to
incnase its biomass significantly with fertilization, befon king displaced by the Ci species
(Fig. 3.3). As a result of this initial increase in C, production, plots with high N aâdition rates had
a significant C, component in their cumulative biomass (Fig. 3.4). However, by the end of the
experiment, the medium and high N plots were dominated by Agropyron repenî and P m pratensis
(Fig. 3.2). Thus, the N-gradient was also a gradient of C, relative abundance against which
hypotheses about the relative efficiencies of soi1 carbon storage in C3- and C,-dominateci plots couid
be tested (Fig. 3.4).
It was not clear h m the data w h e k plots that were giwn low and medium amounts of N
had reached their new "steadyy' species compositions by 1994, or were still in the process of
changing, albeit at a slow rate. It is possible that, given sutlicient time, most or ail of the oonîontrol
treatment plots would becorne dominateci by C, species. This illustrates the importailce of
considering temporal patterns in analyshg the responses of species to treaûnents. Even d e r more
than a decade, the ratio of CJC, species was st i i i changing, and "spot" measuns of the composition
of the vegetation, such as those shown in Fig. 3.2, can be misleading.
The drought in the late 1980's was the worst bught ofthe fast 150 years at CCMIA (TiIman
and El Haddi. 1992). The second year of the drought, 1988, was the hottest growing season of the
13 y e m of the experiment with 600 degree days >lS°C compareci with the pndmught average of

about 400 degne days (Tilrnari, 1996), and had the lowest biomass of al1 years between 1982 and
t 994.
in a study of 207 plots in similar experimental N gradients on four fields at CCNHA
(includhg Field B), TiLaan (1996) found that the decrease in net primary production during the
drought in 1987-1989 was a fuuction of pre-drought (1986) species nchness and C, biomass
(Tilman, 1996). The C, species at this site are more drought-tolerant and have larger, longer-lived
root systems than C, m i e s which are present Species richaess was an important factor in the
stability of biomass durhg the drought, ie. plots with high species richness d e r e d srnalier h p s
in biomass during the drought than those with low species richness (Tihan, 1996). Since plant
diversity decreased almg the N gradient (Wedin and Tilman, 1996) and C, relative abunidance also
decreased dong the gradient (Fig. 3.3 and 3.4), the drought effect on plants present increased in
tandem with N addition rate. Plots that received high N treatments showed larger decreases in
biomass during the peak of the drought than plots that meived the low N treatments, due to the
presence of drought-intolerant plant species (Fig . 3 -5).
The effect of the drought had Uiauenced SOM dynamics. Its unwual length and severity
probably led to an unusually large root death, ie. larger than normal belowground litter input. This
pulse of mot litter could leave an isotopic signal in the soi1 for some tirne, since belowground litter
is of a lower quality with respect to N than aboveground litter and may decompose mon slowly
(Table 2-III, 92.1.2.4). The mots of S c h u a c ~ u m scoparztum, in particular, are highly lignifiai and
large.
Litter and SOM decornposition rates dining the h u g h t years wen Uely significantly lower
than in other y e a ~ ~ , since decomposition rate is strongly affkcted by moishin (Van Veen and Paul,
198 1 ; Parton et al., 1987; sec also 4 1 S.2.l). This, in combination with the large mot litter input,
may have resulteâ in a pulse of OM input during those years that was slower in relation to its normal
rate of incorporation into the SOM.
The dtought might also have played a role in the vegetation dynamics dong the N gradient.
Since C, plants an f a v o d undet water-stressed conditions, it is possible that the decline of C,
species in the fertilizeri plots was delayed somewhat by the drought h m 1987 to 1989 (Fig. 3.3).

4.2 Bulk Soil Carbon Dynamics
4.2.1 Effkcta of Site Hhtory on Soü Organic Carboa
4.2.1.1 lMiaI Soil Condittons
Although the initiai (1982) vegetation in Field B was dominated by C, species and had an
isotopic composition of ca. -16% (Fig. 3.6), the initial soil 6I3c signature wes significantly more
negative (-22.7%. Table 3-1). due to the vegetation history of the field The @culturai crops grown
on the field before 1957 were a mixture of C, and C, crops (P2.1.2.1) that resulted in OM input to
the soil with an intermediate 6°C value. M e r abandonment from agriculture, it is likely that C,
species did not become a signifiant part of the vegetation mtil more than a decade had elapsed
(Fig. 2.l(a)). Thus, the OM inputs to the soil in Field B had a significant C, component for at least
70 to 80 years befoce this experiment began.
4.2: 1.2 Final SOU Conditions
Al1 ûeatrnents showed significant increases in soil C content during the experiment, ranging
h m net increases of 45% in the controls to 200% in the two highest N treatments. The relatively
large increase in the control treatments iadicated that Field B was still in the recovey phase &er
abandonment h m agriculture and it was accruhg carbon relatively rapidly. As Uldicated in 82.1.1 -4
and Fig. 2.l(b), soil carbon content at CCNHA was reduced as a result of agricultural practices and
declined f i d e r d e r abandonment. Soils did not show a net C gain above agricuitural levels until
about 18 years a f k abaadonment. It likely takes many d d e s for values to r e m to pm-
agriculture levels.
4.2.2 413C Soü m. NPP
Final bulk soi1 6°C values were in the expected range (Fig. 3.8) and were strongly comlated
with the isotopic compositionof total OM input h m 1982 to 19% (Fig. 3.9). Using the asmmption
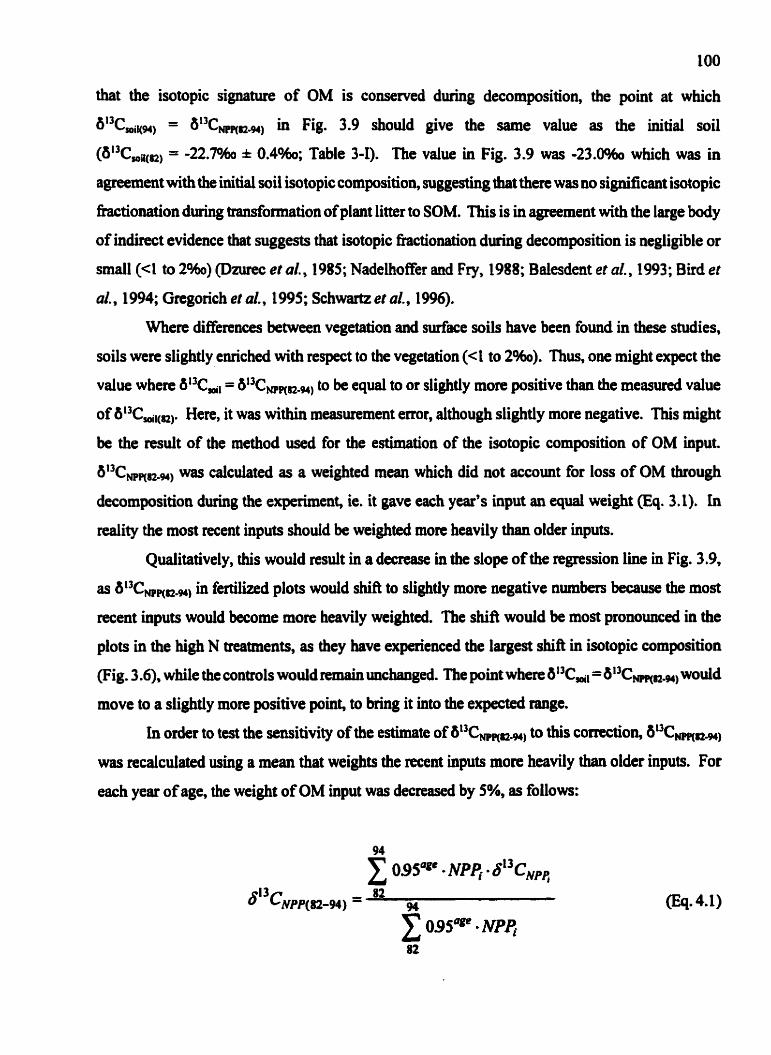
that the isotopic signatute of OM is consewed durhg decomposition, the point at which
613C,1(M) = 6'3CNnm.w) in Fig. 3.9 should give the same value as the initial soil
(613Cmi1(12) = -22.70h & 0.4%; Table 3 4 ) . The value in Fig. 3.9 was -23.0960 which was in
agreement with the initial soil isotopic composition, suggesting that there was no significant isotopic
hctionation during transformation of plant litter to SOM. This is in agreement with the large body
of indirect evidence that suggests that isotopic hctionation during decomposition is negligible or
small(cI to 2%) @zurec et al., 1985; Nadelhoffer and Fry, 1988; Balesdent et al., 1993; Bird et
al., 1994; Gregorich et al., 1995; Schwartz et al., 1996).
When differences behmcn vegetation and d a c e mils have been found in îhese studies,
soils were slightly enriched with respect to the vegetation (4 to 2%). Thus, one might expect the
value where &I3C,, = 6I3CMR,, to k equal to or slightly more positive than the m e a s d value
of 613CIoi,(m). Here, it was withh measurement error, although slightly more negative. This might
be the remlt of the method used for the estimation of the isotopic composition of OM input.
OI3CWR,, was dculated as a weighted mean which did not account for loss of OM dirough
&composition duïing the experiment, ie. it gave each year's input an equal weight (Eq. 3.1). In
reaiity the most ment inputs shouid k weighted more heavily than older inputs.
Qualitatively, this would result in a decrease in the slope of the regression line in Fig. 3.9,
as W3C,,,,, in fertilized plots would shift to slightly more negative numôers because the most
recent inputs would become more heavily weighted. The shift would be most pronounced in the
plots in the hi& N treatments, as they have expaienced the largest shift in isotopic composition
(Fig. 3.6). while the controls wouid remain unchanged The point where 6I3C,, = 6'3CpRt(a.wi wouid
move to a slightly more positive point, to bring it into the expecteâ range.
In order to test the semitivity of the estimate of 013Cwp(~JWl to fhjs comction, 013CNPP(12941
was ncalcuiated using a mean that weights the recent inputs mon heady than older inputs. For
each year of age, the weight of OM input was decrrased by 5%, as foilows:

where age = age of input in 1994, and subscnpt i = year.
This was not intended to simulate actuaî turnover of C in the soil, rather to test the sensitivity
of the calculation to this reduction. The reduction of 5% per year in relation to age was probably
u~vealistically large, conside~g that the turnover of the buik soi1 was 10% in 13 years (93.2.4.1 .a).
Despite this the analysis showed that the estimate of b'3Cwnw is not very sensitive to this
adjustment. The largest effect was in the plots that received the medium and high N treatments
where the values became 0.7Oh more uegative. This change shifted the point where
613C,i, = 6''CWRn44, to around -22.7%, which was the expected value.
4.2.3 Reconsttuction of OM Inputs from Bulk Sol1 Meaauremenb
The isotopic composition of soil carbon accnied betwem 1982 and 1994 was, on average,
1.1% more negative than the estimated isotopic composition of OM inputs to the soi1 duruig that
period (83.2.5). in con- in other studies, surface mils under steady vegetation were the same as
or slightly e ~ c h e d with respect to the plants (Dzurec et al., 1985; Nadeihoffer and Fry, 1988;
Balesdent et al., 1 993 ; Bird et al., 1994; Gregorich et al., 1995; Schwartz et al., 1996).
The difference between accrueci soi1 C and vegetation is likely a result of the method used
to estimate 613Cm,,,, as discussed in the prcvious section. Adjusting the estimate to account fot
decomposition reduces the difference between the isotopic composition of new soi1 C and the OM
input. While it is unlikely that this comction would d u c e the merence to zero, the nsuiting
ciifference mnetheless is ükely to be small(<l%o) and suggests that the isotopic signature of OM
is presmed in the soil with high fidelity.
nie difference between new soil C isotopic composition and OM input ranged h m -4.7%.
to 2.0%0 (Table 3-IV). Several f a o r s may contribute to this large vaiiability. First, in the
estimation of 613C,, the isotopic composition of aii plants other than the three most dominant
species (rorbs'") not measuted direcîiy, but was assigned and average C, value of -26.W~
($2.7). This e m r is unükcly to lead to a systematic shift in estimate values, since the relative
abundance of forbs did not Vary systematidy with N addition, but contributes to variabiiity. The

error is likely to be small since the 'îorbs" were composed primarily of C, species, so that &13C,
should not Vary by more than 1 to 2%. The relative abundance of forbs was small(0.15 * 0.18, n
= 338) so that the overall estimate of 6"C, should not be affkcted.
Second, the estimate calculation for b13Cmm.w, d a s not take into accomt changes in
belowground litter generation and decomposition rates during the drought years. As discussed in
44.1.2, increased root death and lower decomposition rates during these years may have resulted in
an unusually large belowground OM input and a lag in t h e betwem nomial rates of assimilation
of litter in the soil and actual assimilation of OM input h m those years.
Third, soil heterogeneity in the field contributed to the variability. Measurements of initial
soil conditions showed that the isotopic composition of the soil varied somewhat between different
locations in the field (Table 3-1). T h i s illustrates the aeed for adequte sampliag protocols in mil
studies. Hem, four cores were taken h m different locations in each plot aud mixed, in an effort to
minimize the sampling emr. Great care was taken in the subsampling procedures to assure thst
representative subsamples of soil were used for anaiysis and incubation in the lab. The high
repmducibiiity of results from nplicate subsamples in the incubations and bulk analyses indicates
that the subsampling procedure was adequate.
42.3.2 Limilatwns of OM Input Recons~ruction froni Bdk Soü Measuccmenlic
Isotopic measurements of soi1 have been used to recoll~t~ct vegetation histories and show
where shifts in plant bctional type bave o c c d due to clhatic changes (Peat, 1997, Archer,
1995; Schwartz et al., 1986; D m et al., 1985). These studies were primarily interesteci in
vegetation changes that have occurred on a t h e scale of centuries, but for global climate change
discussions, it may bt of interest to try to assess changes in specks assemblages o v a shocta periods.
Stable aubon isotope methods for SOM can be usef'ul in this regard; however, they have limitations
at this t h e d e , which arr illustrated in this study.
In this study, vegetation undenvent a relatively large shift ia 6I3C along the N gradient, h m
c a -16.0% in the conüol plots to ca. -27.596 in the Gdominated high N plots (Fig. 3.6). In
addition, the soi1 accnied carbon mpidly so tbat a large part of the bulk soil at the end of the
experiment was composed ofnew carbon that had beenadded diiting the 13 years of tbe experiment.
Yeî, a f k more than a decade, the bulk soi1 along the gtadient had a range of values of ody 3.3%0,

1 O3
h m -20.4% to -23.7%0 (Table 3-0. Naturaiiy o c c ~ g vegetation shifts (eg. due to global change
or N deposition), are likely to be slower and/or l e s dramatic (ie. a smaller shift in bI3C, values),
and are Iücely to occur on mils that are not accniing carboa as rapidly as here. Hence, the isotopic
signal ofthe vegetation change couid not be reliably measured in the soi1 for some time and it might
not be possible to register changes &er only a decade. Where new carbon becomes a smaller part
of the total carbon, buik soi1 measurements would be of Iimited use.
43.4 Emciency of SOU Carbon Squcstirtion in Plots of C, and C, Specim
4.2.4. I Effecf of Specios Compositio~~ on Litfer Quaiity
Fertilization redted in increased relative abundance of C, species and loss of C, species
dong the N gradient in Field B. Since these two functiod groups dEer in litter quality, significant
changes in litter quality also occumd dong the N gradient. P. pratensis and A. repens have lower
C:N ratios and a lower lignin content than correspondhg values for S. scoparium (Tables 2-iII).
Thus, litter quality increased dong the gradient as C, species were Iost (ie. C:N and 1ignin:N ratios
decreased).
Litter quality was not measund in this stuây, but data h m Field B teported in Wedin and
Tilaan (1 996) showed that C:N ratios of aboveground ütter and mots d e d dong the N gradient
after 12 years of N addition, mm 40 to 20 and fiom 60 to 25, respectively (Fig. 4.1). These values
were for the species composition of plots at the end of the experirnent, when the proportion of C,
plants ranged h m 0.6 in the control plots to O in plots that received high amounts of N (Fig. 3.2).
The relative pmportion of C, biomass h m 1982 to 1994 as a pmportion of the total biomass had
a dightly smaller range, fimm 0.7 in the control plots to 0.2 in plots that received high addition
nitrogen (Fig. 3.4). Thus, it is like1y that the range of C:N ratios dong the N gradient for the
cumulative biomass was similar to that found in the above study in 1994.

Fig. 4.1 Abovegmund (a) and belowground (b) biomass C:N ratios h g N gradients in ttme fields at CCNHA (Field A (a), Field B (0) and Field C (A)) after 12 years of fertilhtion. (Source: Wedin and T i a n , 1996).
The question of how litter quality is affeçted by environmental change and how it in tum
affects decomposition dyaamics in terrestrial ecosystem hris k e n dsed in investigations into the
response of plant-soi1 systems to global atmospheric change. Mauy shidies have show that litter
quality is a good predictor of litter decomposition rates and that incrrases in litter C:N or lignin:N
ratios result in slower decomposition (Meiillo et ai. , 1982; Cotnifo et a/. , 1995; Cortez et al., 1996).
Observations of increases in plant tissue C:N ratio under enriched CO2 atmosphetes leci to the
hypothesis that atmospheric CO2 edchment wiU lead to lower litter quality and lower
decomposition rates (eg. Couteaux et al., 19%). However, the current evidence shows that,
although the C:N ratio of live tissue may increase with CO? enrichment, the increase is lost during
senescence, ot is insisnificant in cornparison to other factors, such as litter quantity (Norby and
Cotdo, 1998).
However, litta quality is also a hct ion of species composition, which can be altemi by
climate change or N deposition (Vitousek, 1994, Archer, 1995, deSmidt, 1995). One example o f
such vegetation changes is a shift h m C, to C, v i e s , since C, species distribution is cfosely
linked to climate and C, photosynthesis is titvotued by increases in atmospheric CO, concentration

(Ehleringer and Monson, 1993). Thetefore, it is of interest to kuow how mer quality affects carbon
decomposition dyaamics.
While the effect of litkr q d t y on short-tmn litter decomposition rates has been well
charactetized, the effect on long-tenn soi1 carbon siorage is less clear. There are two components
in the modelling of the transformation of iitter to SOM: decomposition rate and the efficiency of
decomposition, ie. the fiaction of C lost as CO, durhg decomposition. Thus litter decomposition
rates are not informative about the the fiaction of OM input that ultimately ends up as SOM.
Severai studies have found that short-term decomposition dyaamics can be quite different thaa long-
term dynamics and that, dtimately, the f'raction of initial C remaining is d e c t e d by initial
decomposition rate (Melillo et d, 1989; Paul and Clark, 1989). This implies that, all other things
king equal, SOC storage is nota hction of litter quality. There have been no d e s of long-term
SOC stonige as a bction of litter quality. The N gradient in Field B affiords the opportunity to test
the hypothesis that soi1 C storage is unaffected by litter quality while controlling for edaphic and
clhatic factors.
nie changkg pattern of litter quelity a h g the N gradient in Field B has implications for
short- and long-term rates of OM decomposition. in a ütterbag study at CCCNHA (Wedin et al.,
1993, the fiaction of initial litfer remairhg a h r 2 years was significantiy lower for S. scopraum
(40% and 50% for aboveground litter and roots, respcctively) than that for A. repens (6W and 70Lh
for abovepund litter and roots, respectively) and for P. pratensis (65% and 70% for aboveground
litter and roots, respectively). This coafirms that litter of S. s c o m m had a lower decomposition
rate than the C, species.
It bas been shown that total ecosystan C storage (soi1 + biomass) per unit added of N
inc~ased with an increase in C, biomass in the plots in Field B, ie. that C, species led to greatcr
ecosystem C storage than C, species per unit ofN (Wedin and Tihan, 1996). However, it is mcIear
whether this increased C storage was the result of greater soil C sequesûation.
The trearinent means of the fiaction of OC input retained in the soil (%Cd &r 13 years of
the expriment ranged h m 12% to 28% (Table 3-m). This compares favourably with the results
of several other shidies t&at found 7 - 30% of litter remalliiilg or retained in the soil after pMods of
dccompositions ranghg h m 1 to 6 years (Melillo et al., 1989; Paul and Clark, 1989; Cotnao et al.,
1 995; Weûin et d., 1995).
The pnccntage of C rrtaiaed (%Cd did not vaiy systematidy with the in~te8se in relative

106
abundance of C, plants, indicating that the lower litter quality of C, plants did not lead to hi*
relative rates of carbon sequestration in the mil, even though litter decomposition rates were lower
for the C, species. This supports the contention that short-tenn litter dylismics are not very
informative about the efficiency of SOC atotage under different vegetation types within a particuiar
site and that SOC sequesûation is d e c t e d by the differences in litter quality between the two
hctional types of plants.
4.3 Active Pool Size
4.3.1 Justifkation of Estimation Method For Active Pool Size from Respiration Rate Data
The mode1 used to fit the data of soi1 respiration rates (Eq. 2.2) yielded excellent fits for al1
plots. From the estimateci slow pool respiration rate (r, in Table 3-V) it is possible to determine
whether the assurnption of a constant slow pool respiration rate was nasonable by estimating the
fiaction of the slow pool that was lost to respiration during the incubations. If this ûaction was
small, then the assumption of a constant respiration rate of the slow pool was a gooâ approximation
and was valid.
in general, the slow pool is estimateci to be 40985% of total SOC (Parton et al., 1987;
Paustian et al., 1992; Motavalli et al., 1994). in this saidy, the mils wcmed a large amount carbon,
most of which was probably in the slow pool because the passive pool is usually reiatively srnall and
responds siowly to OM input, and the active pool is also smali (2-1 1%, 83.3.2). Therefore, the
actual size of the slow pool was probably closer to 85% than to 4W. However, in i n s calculation,
both extremes were used to make a consmative estimate of the fiaction of the slow pool lost during
the incubations. nie nsults are shown in Table 4-1. On awrage m s s al1 treatments, 18% 6%
and 8% 3% of carbon h m the slow pool was lost to respiration during the incubations, using
estimates of slow pool sizes of 4Wh and 85% of total SOC, respectively. Since the actual size of the
slow pool was Likcly large* the fiaction of the slow pool lost was pmbably mund Io?!. This is a
small fiaction of the total slow pool, and, thaefore, the use of a constent slow pool respiration rate
was j d e d .

Table 4-1 Estimates of fiaction of slow pool respind during the 197 days of incubations, using an estimated slow pool size of 40% and 85% of the total SOC. Total SOC = SOC in each incubation chamber = soil %C x amount of soil used in incubation; r, = slow pool respiration rate as estimated in 53.3.1 ; slow pool C = 40 or 85% of total SOC; total slow pool C respired = r, x 197 days; % slow pool C respited = (total slow pool C respired/slow pool C) x 100.
Slow pl C ./. slow pool C
43.2 Pattern of Active SOM Pool S b Along the N Gradknt
Active pool sizes in this study mged h m 2 to t 4% of total SOC (Table 3-VI and Fig. 3-14),
and were s u n i l a to values reported in other incubation snidies, which range h m 1.9 to 15% of total
108
SOC (Motavalli et al., 1994; Townsend et al., 1995). CENTURY mode1 simulations at various sites
have estimated the active pool N e at 24% (Paustian et al., 1992; Motavalli et al., 1 994). M y one
of the treatments, T4, was well outside the range of these simulation estimates estimates.
Motavalli et al. (1994) found that mode1 predictions tend to underestimate the active pool size in
cornparison to results fiom incubation studies.
Active pool sizes increased with N addition at fertilization rates up to 3.4 g N m2 yr', but
decreased, with respect to that of the controls where higb fertilization rates were applied (Fig. 3.14).
The active pool sizes were similar for aii txeatments at rates ofN additioa above 5 A g N m2 yrl, and
they were 24% of SOC.
The active pool is thought to be composed primarily of rnicrobial biomass, but also to contain
labile, readily decomposable organic cornpoumis such a simple sugars and water soluble organics.
Sources for these include plant litter, root exudates, and microbiai pducts and wastes. Thus the
size of the active SOM pool is iduenced by factors that affiit the size of the microbial biomass
andfor the deposition or creation of labiie organic compormds in the mil. These include
envuonmentai and biotic factors aich as soil moi- and temperature, addition of fertilizet,
substrate quantity and quality, plant litter divers@ and sessonal patterns of plant activity. These d l
be discussed in more detail as they relate to the observed pattern of active pool size dong the N
gradient in Field B.
4.3.3 Factors Atreting Soil Miciobial Biomass
D b t meamements of the size of the soi1 miCrobial biomass (SMB) in a variety of climates
and soils have show that soil microbial biomass carbon (SMB-C) can be as much as 6% of total
SOC, but is usually 4% of total SOC (Anderson and Domsch, 1989; Iasam et ai., 1989; Collins et
al., 1 992; Luho et al., 1 992; Joergensen et al., 1 994; Love11 et al., 1995; Mahmood et al., 1 99%
He et al., 1 997; Jeasen et al., 1 997). Thus, SMB is a large component of the active SOM pool, but
the non-microbial component is also signifiant*
A study by Joergensen (1994) showed that microbiai biomass sUt can vary widely
thughout the year, and he drew attention to the importance of the timing of soi1 samphg in
relation to the interpretation of the redts. In bis study, SMB-C varied by a ktor of 2, h m L 80

to 363 pg C g-1 soil, in one year. Subsequent studies have investigated this phenornenon in more
detail and have tried to relate the variation to environmental factors (eg. temperature, soil moisture),
or to different stages of plant growth during the seasons (eg. Garcia and Rice, 1994; He et al., 1997;
Mahmood et al., 1997). Table 4-III shows the range of sizes of the microbial biomass during one
year that have been found in studies. The annual minimum aud maximum values can Mer by a
façtot of 5, and it is common for the maximum to be twice as large as the minimum (see max/min
in Table 4.m).
Table 4- ï I I Some examples of the seasonal variation of the size of the soil daobial biomass during one year in a variety of climates.
- -
Soit micmbial C (pg C g' mil)
Aanual Annud miulmia Location Source minimum maximum
1 .4 Kansas, prairie Garcia and Rice, 1994 1.5
1.8 Ohio, grassland Collins et al., 1992 2.0 1.8 1.5
2.4 Brasil, giassland Luizao et al., 1992 2.2 4.5
1.8 United Kingdom, Lovell et ai., 1995 2.0 grassland 1.8 1.7 2. t
2.9 Pakistim, arable mils Mahrnood et al., 1997 5.5 1 -7 2.8 1.8 1.5 13

The causes of these temporal variations are poorly undetstood. A survey of 58 shidies of the
temporal pattem of SMB concluded that there are no consistent seasonal pattem of SMB 4 t h
climate or plant development (Wardle, 1998). DiBerent &es often found either no pattern or else
contradictory ones (eg. SMB has been shown to both inmase and decrease with soi1 moistue). The
latter effect is likely due to increased competition for nutrients between plants and microbes during
times of active plant growth (Wardle, 1998). Similady, plant mot growth has been s h o w to
increase SMB by providing large amouats of substrate, and to decrease SMB, pmbably because of
competition for nutrients (Garcia and Rice, 1994; Wardle, 1998).
The incoasistency of the results b e ~ e e n different investigations suggests that the effects are
site specinc and that other factors, such as plant species, plant diversity and nueieat status of the
soil, may also be important in the regdation of the SMB. Thus, the observed pattern of active pool
size dong the N gradient in Field B may be the nsult of a combination of the above factors, as
discussed below.
In the curent study, soils were sampled in late summer. At that tirne, the C, and C3 species
were at dBerent developmental stages. C4 plants at CCNHA have one active growth period during
the summer, and they had already partially or fully senesced at the time of sampling. In contrast,
C, plants at CCNHA experience two growth periods, one early in the season, the other in late
sumrner and early fall. Thus, at the time of sampling, plants in the high N plots dominated by C,
species were actively photosynthesizing and g~owing. It is muonable to expect that the amount and
type of mbstrate would dBer between these two vegetation types in Iate summer, and that this
would affect SMB size. OM input to the soi1 at that time would consist primarily of plant iitter in
plots with C4 species, and thizodeposits (mot exudates and secmioas, sloughed mot cells) in plots
where C3 species were dominant.
In a study of an undisturbed prairie in Kaasas dominated by native grass species, including
S. scopwium, SMB declined during the summer months, but increased dtamaticaiiy to its maximum
in Iate summer and early fd ( M a and Rice, 1994). This pattem was attributed to the seasonai
pattem of plant growth, which is simiiar to that at CCNHA, as this was the tirne of m h u m

litterfaIl, root decay and translocation of carbohydrates h m aboveground to belowground plant
parts (Garcia and Rice, 1994). This could contribute to the pattern of large active pool sizes in the
plots dominated byC4 species, since the largest OM input in these plots probably occuncd at this
the. OM input, in the fonn ofütter, bas k e n shown to temporarily increase SMB (He et al., 1997;
Jensen et al., 1997).
In contrast, it has been suggested that active plant growth can reduce the size of the SMB
because of cornpetition for nutnents (Wardle, 1998). This is consistent with the small SMB
obsewed in the plots dominated by C, species in Field B, where plants were still in their growth
phase. The small size of the active pool in these plots may also be the result of lower C input to the
soil because of rhizodeposition, compared to the large amount of litter deposition in the plots where
C, grasses were abundant. However, it is impossible to test this hypothesis without measurements
of the amount of OC input (eg. water-soluble organic cornpounds).
Regnssion of the size of the active pool against 1994 C, proportion to test this hypothesis
was not possible because both are not nonnaily distributad.
4.3.3.2 Soü M&tute
It is possible that soi1 moisture levels differed somewhat between plots domiriated by either
C, or C, species due to two fmrs: soi1 textue and plant growth.
Soil carbon content was higher in high N treatments than low N treatments, and thus may
have led to slightly bettet water retention in mils in these plots. However, this effect was likely
smali, since buik soi1 texture was probably not signficantly flected.
The demand on soi1 water stores made by growing plants likely reduced the soii moisture
content of plots where C, plaats were dominant in cornparison to plots where C4 plants were
abundant. The effect of plant growth on soil moisture was probably greatet than that of texture, thus
one would expect a decrease in soü moistwe content almg the N gradient. The efFect of this
potentiai dinerence h soi1 rnoisture on SMB is not easiiy predictable (se+ discussion in 54.3 3), but
it is possible that a de- in soi1 moisture had a deleterious effeet on the s k of the SMB.

The sîze of the SMB has been shown to increase with the amount of OM added. Garcia and
Rice (1994) found that year-to-year differences in SMB were due to differences in annuai plant
production. This variable may have contributed to the increase in active pool size with fertiiization
in the treatments in which C, plants dominated (Tl-T4). which wen at the end of their growing
seascm and plots received large litter input h m these plants at the t h e of sampling. NPP and C,
biomass increased with feailzation in those treatments. The effect may be particuiarly pmounced,
since root allocation in C, plants is high, so that a large amount of root litter may be available at the
end of the growing season. Root litter is in more intimate contact with microbial biomass than
aboveground litter, and its labile components are readily avdable to the SMB. in con- they
must be leached out of abovegmund litter before they can mach the SMB.
Total muai NPP was higher in the plots in which C, p i e s were abundant, but since at the
time of sampüng they had not yet reached the season of msximum litter input, the SMB sbowed no
response.
It was not possible to regress active pool size against C, biomass as they were both wt
normally distributed.
Fertilization with inorganic ferti1izer (N) has k e n shown to denrase the size of the SMB
(Garcia and Rice, 1994; LoveU et al., 1995). Diffecent effets have been found for diffêrent
fertilizers (cg. Hu et al. (1991) found that N addition decreased SMB, P addition increased SMB,
and NPK addition had variable effects). This may have been a contributhg factor affecting the size
of the s d active p i s in the treatrnents which received large amounts of N.
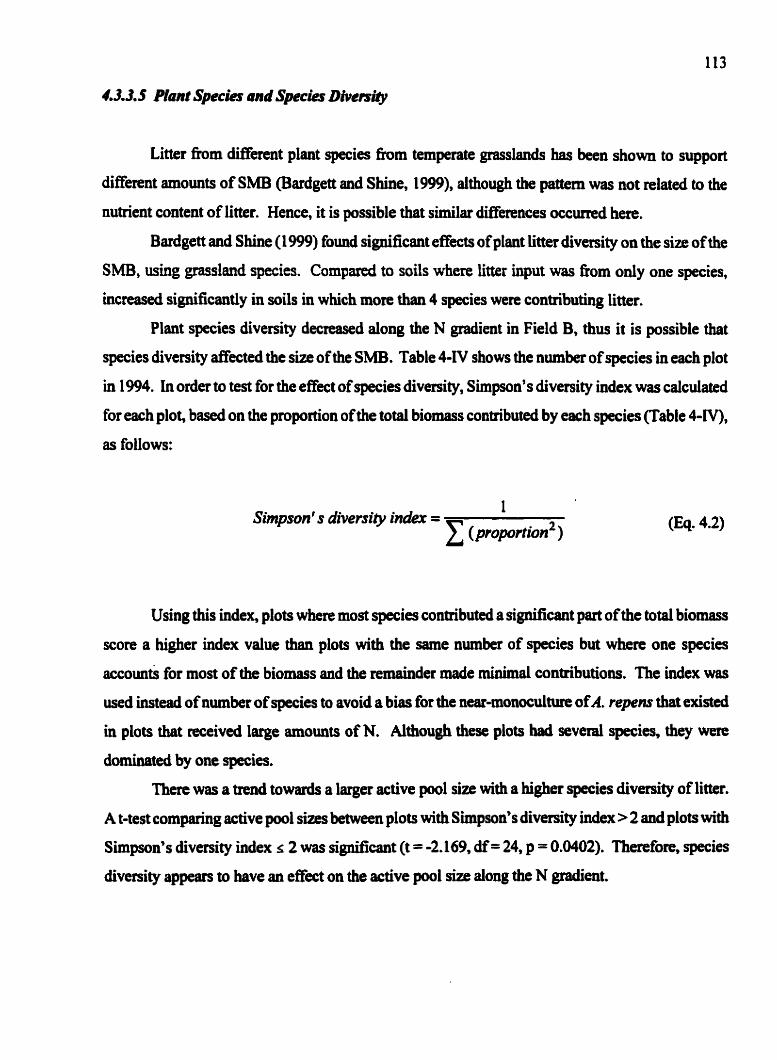
4.3.3.5 Plant Specks and Spech Diversi&
Litter h m different plant species from temperate grasslands has ben shown to support
different amounts of SMB (Bardgett and Shine, 1999), although the pattern was not related to the
nuûient content of litter. Hence, it is possible that similar ciifferences occinred here.
Bardgett and Shhe (1 999) found signincant effects of plant iitter diversity on the s u e ofthe
SMB, using grassland species. Cornparrd to soils where litter input wss fiom only one species,
iacreased significantly in soils in which more than 4 species were contributing litter.
Plant spccies diverty decreased along the N gradient in Field B, thus it is possible that
species diversity affected the size of the SMB. Table 4-IV shows the number of species in each plot
in 1994. In order to test for the effet of species divasity, Simpson's diversity index was calculated
for each plot, based on the proportion of the total biomass contributed by each species (Table 4-IV),
as follows:
Simpson' s diversiîy index =
Using this index, plots where most species contributed a significant part of the total biomass
score a higher index value then plots with the same number of species but when one species
accoun& for most of the biomass and the rernainder made minimal contributions. The indcx was
used instead of number of species to avoid a bias for the nnu-monoculture of A. repens that existed
in plots that received large amounts of N. Although these plots had several species, they were
dominated by one p i e s .
There was a trend towards a larger active pool size with a higher species diversity of litter.
A t-test comparing active pool sizes between plots with Simpson's diversity index > 2 and plots with
Simpson's diversity index s 2 was signifiant (t = -2.169, df- 24, p = 0.0402). Therefore, species
diversity appaus to have an effect on the active pool size along the N gradient.

Table 4-IV Two measures of plant species divemity in the plots in 1994. Simpson's diversity index was cdcuiated following Eq. 4.2.
-- -
Treatment Plot No. of specicr in 1994 Slmpaoo's diveiaity index
43.4 Factors Affecting Non-Mierabid Camponent of Active SOM Pool
The a m o ~ t of non-mictobial labile organic matter in the mil cm be dfiected by plant growth
and species ciifferences in allocation and litter composition. OM input to the soi1 at the tirne of
sampüag was in the fom of abovegrouad and bciowground Litter in the plots domineted by C,
species, and it is reasonable to expect a large amount of labile OC to be pmsent in these plots at the
end of the growing season (Garcia and Rice, 1994). In contrast, OM input h the plots dominated
by C, species were pbably primdy in the form of rhizodeposits. These have been shown to

contain labile components such as simple sugars, organic acids and amino acids (Schilling et ai.,
1998). It is likely that the amount of labile OM in the soi1 was higher in the plots dominated by C,
plants t h in the plots where C3 plants were abundarit, due to the large input of litter.
4.4 Isotopic Composition of Active and Slow SOM Pools
4.4.1 Crlculatioxs of hotopic Compositions
The lin= ngressions of 6I3Cm vs. F used to calculate the isotopic compositions of the
active and slow SOM pools h m incubation data were sigaificant for the majority of plots (Table
3-w, indicating that the assumption that 6°C- and d13Cs,ow did not change during the incubations
was justified Thm are three potential sources of enor that may account for the insignitlcance of
the regression in some of the plots.
First, it is possible that 6°C- and i13C,, were not constant during the incubation in these
plots. However, it is unlilcely that this assumption was valid in some plots but not in others, thus this
was probably not the cause of the error.
Second, in plots where WC,, and 6I3Csk were very similar, the dope of the regression was
small and the measurement emr (iû.S%o) was large in relation to the dope, which caused low
regression coefficients.
Third, the range of the independent variable, F, was nlatively small for some plots, leadiag
to low ngression codlicients. Table 4 4 shows the regression coefficients, the mges of F and
slopes for each plot. Plots with insignificant ngressions al1 bad a combination of d l F ranges and
small slopes which couid account for the small ? values.
The 3 vaiues of these plots would probably improve significantly with additional sampüng
points, howevet, the 5°C- and it3CSlm values would not be affected sigriificantly as the dopes and
intercepts are not likely to change by much.

Table 4-V Regression coefficient, siope and range of the independent variable (F) for the regressions of W3C, vs. F used to calculate 6I3C,, and W 3 C , (Eq. 2.6, $2.3.5.4).
4.43 Reconstniction of Bulk SOU hotopic Camporith From IUC, and 6°C-
The values of bulk soi1 isotopic composition calcdated b m the isotopic compositions of
the active and slow SOM pools were in excelient agreement with meamred values of 613C,w, and
die mean offset ktween the two was within meamernent emr (Table 3-Vm). Even though th
caiculated and measured values did not diffa significantiy, the caiculated values tended to k m m
positive than the measured oaes. This trend codd ôe a result of (a) fiactionation during
decomposition, or (b) the emx introduced by the omission ofthe passive pool
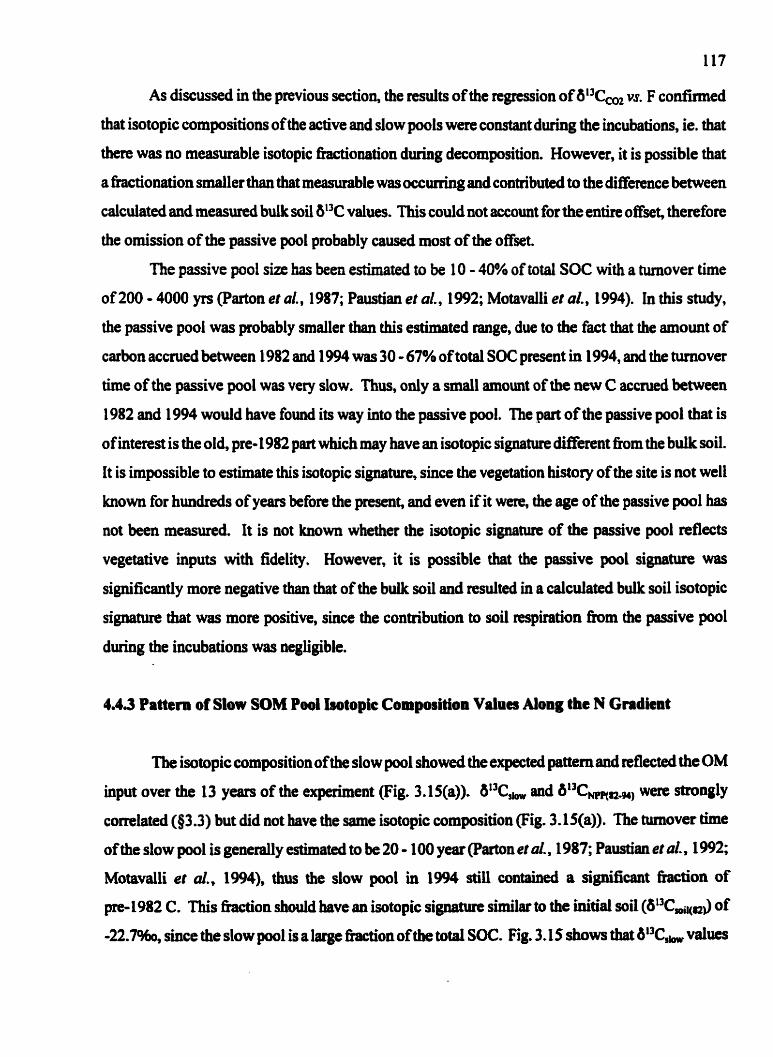
As discussed in the previous section, the results of the regcession of d13Cco2 vs. F confirmed
that isotopic compositions of the active and slow pools were constant during the incubations, ie. that
there was no measurable isotopic ktionation during decomposition. However, it is possible that
a fractionation srnalier than that muwrable was occurhg and conûibuted to the difference between
calculated and meamnd bulksoii W C values. This couid not account for the entire offsa, therefore
the omission of the passive pool pmbably caused most of the offset.
The passive pool size has been estimated to be 10 - 40% of total SOC with a tumover time
of 200 - 4000 p (Parton et al., 1987; Paustian et al., 1992; Motavalli et al., 1994). In this saidy,
the passive pool was probably smaller than this e b t e d mge, due to the fact that the arnount of
carbon accrued between 1982 and 1994 was 30 - 67% of total SOC pnsent in 1994, and the turnover
time of the passive pool was very slow. Thus, only a smdl amount of the new C a c c d between
1982 and 1994 would have found its way into the passive pool. The part of the passive pool that is
of interest is the old, pre-1982 part which may have an isotopic signature Mereut fiom the buIk soil.
It is impossible to estimate this isotopic signature, since the vegetation history of the site is not well
known for hundreds of years before the present, and even if it were, the aga of the passive pool has
not been measured. It is not hown whether the isotopic signature of the passive pool reflects
vegetative inputs with fidelity. However, it is possible that the passive pool signatuire was
significantly mon negative than that of the bulk soi1 and redted in a calcuiated buik soil isotopic
signature that was more positive, since the contribution to soi1 respiration h m the passive pool
during the incubations was mgligible.
4.4.3 Pattern of Slow SOM Pool olotopic Composition Vaiucr Along the N Gradient
The isotopic compositionof the slow pool showed the expected pattem and reflected the OM
input over the 13 years of the experiment (Fig. 3.15(a)). b13C, and &'3Crnn1212911 were strongly
comlated ($3.3) but did not have the same isotopic composition (Fig. 3. IS(a)). nie turnover time
of the slow pool is generaily estimateci to be 20 - 100 year (Parton et al., 1987; Paustian et ol., 1992;
Motavaili et al.. 1994), thus the slow pool in 1994 still contained a significant fiaction of
pre-1982 C. This fiacton should have an isotopic signature similm to the initial soi1 (&13Cd(I?)) of
-22.7% since the slow p l is a large fitaction of the total SOC. Fig. 3.15 shows that &I3Cs, values

indeed fa11 between the initial soil value and the 1982 - 1994 OM input.
An atternpt was made to estimate the f'raction of the slow pool that was new (post-1982)
carbon, using the assumption that old @re-1982) carbon in the slow pool haâ the same isotopic
composition as that of the soil in 1982 and an isotope balance, as foilows:
Solving for L:
where X, = the f'raction of the slow pool diat is new C. It was expected that this fiaction would
inmase dong the N gradient as the amount of carbon accmed increased. However, the size of the
uncertainty associated with the estimated isotopic compositions was relatively large in cornparison
to the diffmncc ktween 613C,&13Cm(2.wl and & " C m i , especially in treatments with high N
addition rates (Fig. 3.1 S(a)). As a ndt, the uncertainty in X was very large and the calculation was
not possible for several treatments (T6 and n). It was concluâed that the estimates of X were
unreliable.
4.4.4 Pattern of Active SOM Pool Iotopic Comporition Values dong the N Gradient
The isotopic composition of the active pool was wealciy correlateci to the OM input and did
not follow the expected pattern, based on the conceptuai d e l (Fig. 3.1 5(b)). Based on the range
of turnover times ofthe active pool h m other studies, bf3C, was expected to reflect the isotopic
composition of the OM input of the Iast 1 to 4 years of the fertilization experiment (93.1.6). Fig.
3.15(a) shows that matched the OM input well in Tl to T4, but was not in agreement with
the OM input for TS to T8. The Merence between the expected and obsennd r d t s iipcnased

119
along the N gradient, and at the highest N addition rate, 6I3C,, was ca. 8% more positive than that
of the ment OM input. It is likely that this very large Merence was due to a combination of
factors. Possible conûibuting factors are: exchange of C between the active and slow pools, effeçts
of fedization on plants, sample bandling, variability of isotopic compositioa among plant
biochemical components, and microbial fractionation. These are discussed in detaii below.
4.4.4. I Exchartge of Carbon BeWeen Be Ac& and SIow POOIS
As cm be seen in Fig. 1.6, carbon flows between the active and slow pools, and a part of the
decomposition of the slow pool results in labile organic compounds that become part of the active
SOM pool. Thus, it is possible that part of the ciifference between the observed and expected
013CL(iVe vaiues was due to this flow of carbon h m the slow pool into the active pool. This ef5ect
would be smallest in the treatments with low N addition rates, since the slow pool in these treatments
had an isotopic composition similar to that ofthe ment OM inputs. However, in the treatments with
high N addition rates, the slow pool C was sigDificantiy e M c h d with respect to the tecent OM
input. This may have resulted in a small SM to more positive values in bi3C,, in these treatments.
4.4.4.2 Enect of Fer(SI&tiOn on the Isotopic Conposition of Pian&
Fertilization can shift the isotopic composition of plant tissues to more positive values, and
shifts of up to 1.8%0 have been obsawd with N + P fertilization (Table 1-V). Thus, it is possible
that plant isotopic compositions became stightly more positive than estimated with inmasing N
addition dong the fertilization gradient in Field B. This effect would be largest at high N addition
rates, and may have contributed to the increasing difTerence between expected and observed 6°C-
vaiues along the N gradient.
Soi1 samples useâ in this shidy were dried and sieved before behg ce-wetted for incubation.
It is known that drying and te-wetting of soiis dimpts soi1 stnicturr and breaks up aggngates

120
(Smnsen, 1974; Kieft et ai., 1987)). This process can expose chemically labile, old C that was
previously protected h m decomposition by occlusion in soi1 aggregates. Thus, a flush of C is &en
observeci in incubations afbr drying/re-wetthg cycles as this old but labile OM decomposes (Kieft
et al., 1987).
There are two reasons why shifts in 6'3C,, due to contamination of the active pool with old,
labile C h m dismpted aggregates was probably smdl in this study. F h t , the soils used wen very
sandy (93% sand) and had a very low leve! of aggregation. Thus, although it cannot be ruled out as
a potential source of error in the meamment o f &'3Cdw one would expect this effect to be small.
Second, ali soils in this study accnied a sipnincant amount of C during the 13 years of the
experiment, thus it is remonable to expect that the isotopic composition of any labile C exposed due
to dismption of aggregates wodd contain a mix of pre-1982 and post-1982 carbon. This would
d u c e the size of the effect on 6l3CdW ie. any old, labile exposed during drying and re-wettiag
would be diluted with more recently added C.
Since the isotopic composition of $"Cm changed less over the course of the experiment in
the treatments with low N addition rates than in those with high N addition rates, exposure of labile
C due to aggregate disniption would likely have caused a gnater shift in &13C,, at high N addition
rates than at low rates. However, this effect should be small since the soils were not very
aggregated.
Disetent plant chernical components c m Vary significantly h m the whole plant tissue in
their isotopic signature, and ciifferences of as much as 8% have k e n obsmted between particder
types of compounds and whole plants (see § 1.8.4.3, Table 1-Vm and Fig. 1.9). If the labiie plant-
derived OM in the active soi1 carbon pool was composed of a particulat gmup of compounds (eg.
sugars), it is possible that the isotopic signature mis sipnificantly different h m that of the whole
plant.
The difference between the expected and obsaMd remlts was strongiy cornlated to the
proportion of C, plants in the total biomass in 1994 C, (9 = 0.85, p = 0.0004), and the difference
i n d as the C, proportion decrrrwd This suggests that the shifk h m expected values at high

N addition rates might be related to differences in the labile plant components present in the soils
of plots domhated by C, or C, species at the time of sampling.
As discussed in g4.3.3.1, the C, and C, species were at diffèrent growth stages at the time
of sampling and it is reasonable to expect that the plmt-derived labiie organic compounds in the soi1
differed in quantity and composition between the two types of plants. Soiis in plots with high
abundance of CI species were experiencing litter input h m abovegrouad and belowground plant
parts. They also had a relatively high species diversity, so that the chemical composition of the total
labile OM input was pmbably very diverse. In contrast, the main labile OM components in the plots
dominated by C, species were pmbably root exudates and secretions, and since they were essentially
monocultures of A. repris, it is possible that their chemical diversity was lower thaa that in the plots
dominated by C, species, and that a particular group of compounds npnsented this pool.
Root exuâates have ôeen show to contain mostly sugars, carboxylic acids and arnino acids
(Klein et al., 1988; Schiliing et ai., 1998). The isotopic composition of sugars and amino acids are
usually mon positive than the whole plant, by up to 4% (Fig. 1.9), therefore, it is possible that the
labile aon-microbial OM in the plots with abundant C, species was enriched by a similar amount.
This could account for piut of the difference between the expected and observed WC,, values in
the plots in which C, species wen abundant*
Isotopic fiactionation of substrate during decomposition is wt well charactetized. Some
studies exist where investigators have measureâ isotopic hctionation of particular substrates
(usually sugars or amino acids) by particdm microbial species (Macko and Estep, 1984; Blair et al.,
1985; Wili et al-, 1989). They have found sometimes large fkactionations of up to 1 l%o between
die subsûate and either micmbial cells or respired CO,.
There are two points et which isotopic fiïictionation can occur: during uptake of the substrate
into the micmbial cell, or during eaymatic reactions. In the fkst case, the isotopic composition of
the substrate pool would change as it is useâ up. This has been obsened, for example in species of
h g i grown on different media with different substrates et uL, 1989). In the second case, the
pduct s of the decomposition reaction (ie. CO2 and rnicrobial biomass) diaet in theu isotopic

compositions. BlaV et al., 1985 found that the isotopic compositions of metabolic products of E.
coli grown with glucose as a carbon source differed by as much as 15.7% h m one auother.
The incubation &ta indicated that the isotopic composition of the active pool did not change
significaatly as it was used up, suggesting that htionation during microbial uptake was small.
However, it is possible that significant fhctioaations did occur draing the enymatic decomposition
reactions, resulting in soi1 respired CO2 that was enrichcd in I3C with respect to the substrate. Since
large microbial fhctioaations leadhg to either more negative and more positive isotopic signatures
have been observed, it is possible that the diversity of labile OC inputs in the plots dominated by C,
species led to a diverse biomass using many different substrates and reaction pathways, so that the
net fhctionation was negligible. This is supported by evidence that isotopic compositions of soils
tend to be similar to that of total OM inputs ( D m et al., 1985; Nadchoffer and Fry, 1988;
Balesdent et al., 1993; Bird et al., 1994; Gregorich et al., 1995; Schwartz et al., 19%).
In con- OM input in the plots domiaated by C3 species was limited to root inputs and it
is possible that this substrate was not very chemically diverse, due, in part, to the timing of the
sampling and, in part, to the low species diversity in these plots. This wouid make it more likely for
fiactiontition to be detected.
Ali of the fectors mentioned above, with theexception of microbial fhtionation, can account
for an offset between the expected and observed values of 6°C- of ody (4%. Thus, a signifiant
portion of the difference is unaccounted for by these f'actors, and micmbial ktionation may be
responsible for the recorded data.
Ovetall, the cause of the unexpected pattern of remlts of 6%- at high N addition rates
canwt be nsolved conclusively with the present data set, but it seems Likely that it is the result of
several factors working together, since the total off- h m the expected pattern is large in
cornparison to the each ofthe fcactots discussed. This Nustrates the importance ofadquate samplhg
of pools of soi1 C which have a tapid turnover, as they may fluctuate in si= and isotopic
composition throughout the year due to plant growth pattern and physical conditions.

CONCLUSIONS
This study presents direct evidence that bulk soi1 preserves the isotopic signature of its
organic matter input with high fidelity, suggesting that total isotopic btionation of the bulk input
during decomposition is smail or negligible. Thus, isotopic analysis of the buîk soi1 can be uscd to
reconsûuct past organic matter inputs whac changes in CJC, composition of the vegetation have
taken place. However, since the soi1 isotopic composition represents an integrated value for many
years of litter input, it responds nlatively slowiy to vegetation changes. nius, this technique is of
limited use on a decadal thescale, unless the vegetation changes are very large. The sensitivity of
the technique may be improved by using smaller sampling depths.
Variability of soil isotopic composition can be hi& even w i t h one site, aad soil sampling
protocols for this type of analysis must use a sufnciently large number of samples to account for this
variability. Also, if sampling is to occur over long pends of the, eg. once a decade, then samples
should bc taken b m the same location each the, to m i n h h the problem of soi1 heterogeneity.
Litter quality (C:N ratio) affects litter decomposition rates, but does not affect the efficiency
of soi1 organic carbon sequestration, ie. the fiaction of litter ultimately retained as soil orgaaic
matter. T'us, changes in litter quslity that will nsult h m shifts in plant species composition h m
C, to C, species due to climate change in the next decades wiii not idYicd the efficiency of soi1 carbon
storage.
An improved soil incubation technique for the measurement of the isotopic composition of
soil cespimi CO2 was developed, tested, and used successfully to estimate the isotopic compositions
of the slow and active soi1 orgaaic matter pools. Aithough the active and slow pool isotopic
compositions remained unchanged during incubations, some evidence suggests that the= may be
signifîcant differences between the isotopic composition of mpind CO2 and the products of
decomposition, especially in the active mil carbon pool that is aniiag over rapidly.
hterpretation of the active pool measmments must take into consideration the timing of
sampling. The size and isotopic compositionofthe active pool may be & i d strongiy by seasonai
patterns of vegetation growth and death of plant tissue. Annuai patterns of the active pool size and
composition have not been measuied. in order to interpret propaly measurements of this pool, its
size and isotopic composition should k m d tbughout the seasons ead the cesulîs related to

vegetation growth and climate. Also, üttle is laiown about the seasonal pattern of the isotopic
composition of microbial abstrate, eg. as the organic matter input changes from mot exudates to
whole plant litter at the end of the growing season. Furthet investigations into the natute of
micmbial fcractionation would also be useful in the interptetation of active pool patterns.

Aber, ID., and LM. Melillo, 1980. Litter decomposition: mcanning relative contributions of organic matta and nitrogen to fonst soiis. Canadhn Journal of Botany 58:416-421.
Aerts, R, 1993. Cornpetition between dominant plant species in heathiands. in Heatbhndr: Patterns and Processes in a Changing Environment. R Aerts and G.W. Heil (Eds.), Kluwer Academic Publishers, Dordrecht pp. 125-1 5 1.
Agren, G.I., E. Ba~stta, and J. Balesdent, 1996. Isotope dimimination during decomposition of organic matter: A theoreticai d y s i s . Soi1 Science Society of Americi Journal 60: 1 12 1- 1 126.
Anderson, D.W., 1995. The role of nonliving orga~c matter in soils. in The Role of Noaüviag Orlpnic Matter in the Earth'r Carbon Cyde. R.G Zepp and Ch. S o ~ t a g (eds.), John Wiley & Sons, New York.
Anderson, R.C., and A.E. Liberta, 1989. Growth of Little Bluestem (Schhachyrium scoparium)(Poaceae) in fumigated and nonfumigated soils under various inorganic nutneat conditions. Anneticam Journal of Botany 76:gS- 104.
Anderson, R.C., and A.E. Liberta, 1992. Muence of supplemental inorganic nutrients on growth, survivorship, and mycorrhizal relationships of Schitachyfum scoparium (Poaceae) grown infumigated and unfumigated soil. Amcrican Joumai of Botany 79:406-414.
Anderson, T.-H., and K.H. Domsch, 1989. Ratios of microbiai biomass carbon to total o@c carbon in arable soils. SOU Biolow and Biochemishy 21 :471-479.
Anderson, T.-H., and K.H. Domsch, 1990. Application of eco-physiological quotients (qC4 and qD) on microbial biomasses h m soüs of Werent cropping histories. Soü Biology and Blochemistry 22:ZS 1-255.
Archer, S., 1995. Tree-grass dynamics in a Prosopis-thomscmb savanna piiddand: Recollstlllcting the past and ptedicting the funue. Ecorcience 2:83-99.
Balesdent, J., and M. Baiabane, 1992. Maize motderived mil organic carbon estimatecl by natural I3C abundance. Sdl Biolow and Biochemism 24:W- 10 1.
Balesdent, J., C. Gyardin, and A. Mariotti, 1993. Site-releted 6I3C of ûee leaves anâ soi1 organic matter in a temperate forest E-1- 74:lîl3- 1721.
Baiesdent, J., A. Mariotti, and B. Guillet, 1987. NaRiral I3C abundance as a tracer for studies of mil organic matter dynamics. Soiï B i o l m and Bioehemiatry 19:25-30.

Bardgett, R.D., and A. Shine, 1999. Linkages behveen plant litter diversity, soü rnicrobial biomass and ecosystem hction in temperate grasslands. SOU Biolow and Biochemhty 3 1 :3 17- 321.
Bames, P.W., L.L. Tieszen, and D.J. Ode, 1983. Distribution, production, and diversity of C,-and C,dominated cornmunities in a mixed prairie. Canadian Journal of Botany 6 1 :74l-7S 1.
Bartiett, R., and B. James, 1980. Studying drkd, stored soi1 samples - some pitfells. Soi1 Science Society of America Journal 44:72 1-724.
Bednan, C.W., D.M. Oosterhuis, and R.D. Evans, 1998. Leafphotosynthesis and carboa isotope discrimination of cotton in response to potassium deficiency. Environmental and Experimenîal Botany 39: 13 1-1 39.
Bender, M.M., 1971. Variations in the 13C/12C ratios of plants in relation to the pathway of photosynthetic carbon dioxide fixation. Pbytochemistry 10: 1239-1 244.
Bender, M.M., and A. J. Berge, 1979. Muence ofN and K fertilhtion and growth temperature on l3C/I2C ratios of timothy (Phleum pratense L.). Oecologia 44: 1 17-1 1 8.
Bennet, R., A.E. Maccubbin, and R.E. Hodson, 1986. Temporal nlationship betweenthe deposition and microbial degradation of lignoceiiulosic deûitu in a Georgia Salt Marsh and the Okefenokee Swamp. Oecologia l2:29 1-298.
Benner, R., M. A. Mo- and ILE. Hodson, 1986. Biogeochemical cycling of lignocellulosic carbon in marine and fkshwater ecosystems: Relative contributions of procaryotes and eucaryotes. Limnology and Oecinogrpby 3 1 :89-100.
Benner, R., M.L. Fogel, K. Sprague, and RE. Hodson, 1987. Depletion of I3C in lignin and its implications for stable carbon isotope d e s . N a m 329:708-710.
Bird, ML, S.G. Haberle, A.R. Chivas, 1994. Efféct of dtitude on the carbon-isotope composition of forest and giessland soils h m PapuaNew Guinea. Global Biogeochemieil Cycles 8: 13- 22.
Blair, Ne, A. Leu, E. Maoz, Je Olsen, E. Kwong, and D. Des Marais, 1985. Carbon isotopic hctionation in hetetotrophic microbial metabolism. Applied and Environmental Microbiology SO:996-lOO 1.
Bonde, T. A., B. T. Christensen, and C. C. Ceni, 1992. Dyaamics of soil organic matter as teflected by nahiral 'C abundance in particle size 6actiom of forested and cultivated oxisols. SOU Biolow and Bkhemisty 24:275-277.

Boutton, T.W., 1991. Stable Carbon Isotope Ratios ofNanuaj Materials: 1. Sample Prepamtion and Mass Spectlometric Analysis. h Carbon Isotope Tecbniqucr, D.C. Coleman and B. Fry (eds.), Academic Press, London.
Boutton, T.W., W.W. Wong, D.L. Hachey, L.S. Lee, M.P. Cabrera, and P.D. Klein, 1983. Cornparison of quartz and pyrex tubes for combustion of organic samples for stable carbon isotope analysis. Analytical Chembtry 55: 1832-1 833.
Boutton, T. W., and S. Yamasaki (Eds.), 1996. Mass Spectrometry of Soih. M. Dekket, New York.
Brady* N., 1990. The Nature and Propertks of Soib, 10U Ed.. Macmillan, New York.
Burke, K., CM. Yonker, W.J. Parton, C.V. Cole, K. Flach, and D.S. Schimel, 1989. Textue, climate, and cultivation effects on soü orgaaic matter content in US. grassland soils. SOU Science Society of America Journal 53:800-805.
Buyanovsky, GA., M. Aslam, and G.H. Wagner, 1994. Carbon turnover in soil physicai ht ions. Soi1 Science Sockty of America Journal 58:1167-1173.
Cambardella, C.A., and E.T.EUiott, 1992. Particdate soil organic-matter changes across a grassland cultivation sequence. Soü Science Sockty of Ameriœ Journal 56:777-783.
Cambardella, C.A., and E.T.EUiott, 1993(a). Methods for physicd separation and characterization of soil organic mattet fhctions. Gcoderma 56:449-457.
Cambardeila, C.A., and E.T.Elliott, 1993(b). Carbon and nitmgen distribution in aggregates h m cultivated and native grassland soils. Sdl Science Society of America Journal 57:1071- 1076.
Cerlhg, T.E., J. Quaûe, Y. Wang, and LRBowman, 1989. Carbon isotopes in soils and pdaeosols as ecology and palaeoecology indicators. N i t u n 34 1 : 13 8-9.
Cerling, T.E., J.M. Hhs, B.I. MacFadden, M.G. Leakey, J. Quade, V. Eise~iann, and J.R. Ehleringer, 1997. Global vegetation change through the MioeedPliocene boundary. Nahm 389:153-158.
Chapin iII, S.F., AJ. Bloom, C.B. Field, and RH. Waring, 1987. Plant responses to multiple environmentai factors. BioScience 37:49-57.
Christensen, B.T., 1996. Matching Measurable Soi1 Organic Mattet Fractions with Conceptuai Pools in Simulation ModeIs of Carbon Turnover: Revision of Mode1 Structure. in Evaluatioi of Soii 0- Matter Modcb Using Wtbg Long-Tcrm Dataseb, D.S. Powlson, P. Smith, and LU. Smith (Eds.), NATO AS1 Saies 1. vol. 3 8, Springa Veriag, Berlin.

Cole, D.R., and H.C. Monger, 1994. Muence of atmospheric CO2 on the deciine of C, plants during the last deglaciation. Nature 368533436.
Colliris, RP., P.E. Rasmussen, a d C.C. Douglas, 1992. Crop rotation and residue management effect on soi1 carbon and micmbial dynamic. Soü Science Society of America Journal 56:783-788.
Condon, A.G., R.A. Richards, and G.D. Farquhai., 1987. Carbon isotope discrimination is positively correlateci with grain yield and dry matter production in field-grown wheat. Cmp Science 27:996-lûûl.
Comy, J.P., 1992. Muence of elevated atmospheric CO, concentration on plant nutrition. Australim Journal of Botany. 40:445-456.
Cortez, 1, J.M. Demanrd, P. Bottner, and L. Jocteur Monder, 1996. Decomposition of Mediterranean leaf Littes: a microcosm experiment investigating relationships between decomposition rates and litter quaiity. Soi1 Biolow and Biochemistry 28:443452.
Cotnifo, M.F., P. Ineson, and J.D. Roberts, 1995. Decomposition of birch leaf iitters with varying C-to-N ratios. SOU Bklogy and Biochembtty 27: 12 19-1 221.
Couteaux, M.M., LJ. Monrozier, P. Bottner, 1996. Inc~ased atmospheric CO,: Chernical changes in decomposing sweet chestnut (Cmtanea sativa) leaflitter incubated in microcosms under increasing food web complexity. Oikos 76:553-563.
Davidson, E., G. Agren, O. Daniel, L C . Emeis, C. Largeau, C. Lee, K. Mopper, LM. Odes, W.S. Reebugh, D.S. Schimel, R.G. Zepp, 1995. Group Report: What are the physicai, chernical, and biological processes that coatrol the formation and degradation of nonliving organic matter? In The Rok of NonlMng Organic Matter in the Euth's Carbon Cycle. R.G. Zepp and Ch. Somtag (eds.) John Wiley, New York
DeLucia, E.H., I.G. Hamilton, SL. Naidu, RB. Thomas, JA. Andrews, A. Finzi, M. Lavine, R. Matamaia, JE. Mohan, G.R Hendry, WH. Schlesiaga, 1999. Net primary production of a forest ecosystcm with experimental CO, emichment, Sekace 284:1177-1179.
DeLucia. EH., W. Schlesinger, and W.D. Bihgs, 1988. Water relations and the maintenance of Sierran conifers on hydtothedy altered rock. Ecology 69:303-3 1 1.
de Smidt, J.T., 1995. The Imminent DestnictionofNorthwest European Heaths Due to Atmosphcric Nitmgen Deposition. In Heatbr and Moorluid: Cultural Landscapes. D.B.M. Thompsoa, A.I. Hester, aad M-B. Usher (Eds.), Scoaish Natural Heritage, Edinbwgh, pp. 206-217.
DesMarais, D. I., I.M. Hayes, 1976. Tube cracker apparatus for openhg giass-seaieci ampoules uIlcLet vacuum. AiillytiCILi Cbemistay 48:M 1-2.

DesMarais, D.J., H. Strauss, RE. Summoas, and J.M. Hayes, 1992. Carbon isotope evidence for the stepwise oxidation of the Pmterozoic environment. Nature 3 S9:605-609.
Ducatti, Ce, E. Salati, and D. Maitins, 199 1. Measurement of the natural variation of l3C:l2C ratio in leaves at Reserva Ducke Forest, central Amau,nia. Fomt Ecology and Managtmeat 38:201-210.
Dnirec, R.S., T.W. Boutton, M.M. Caldwell and B.N. Smith, 1985. Carbon isotope ratios of soi1 organic matter and their use in assessing commmity composition changes in Cutlew Valley, Utah. Oecologii 66: 17-24.
Ebdon, J.S., A.M. Petrovic, and T.E. Dowsoa, 1998. Relationship between carbon isotope discrimination, water use efficiency, and evapotranspiration in Kentucky Bluegrass. Crop Science 38: 157-1 62.
Ehdaie, B., A.E. Hall, G.D. Farquhar, H.T. Nguyen, and J.O. Waines, 199 1. Water-use efficiency and carbon isotope discrimination in wheat. Cmp Science 3 1 : 1282- 1288.
Ehleringer, J.R., 199 1. l3C/I2C Fmtionation and Its Utility in Temestrial Plant Studies. In Carbon Isotope Techniques. D.C. Coleman and &Fry (eds.), Academic Press, London.
Ehleringer, J.R., T.E. Cerling, and B.R. Heliiker, 1997. CI photosynthesis, atmospheric CO1, and cihate. Oecologia 1 l2:285-299.
Ehieringer, J.R, and T.A. Cooper, 1988. Correlations between carbon isotope ratio and microhabitat in desert plants. Oceologia 76562-566.
Ehieringer, J.R, and R.K. Monson., 1993. Evolutionary and ecological aspects of photosynthetic pathway variation. AanuaL Review of Ecology and Systematics 24:4 1 1-439.
Elliott, E.T., 1986. Agpgate structure and carbon, nitmgen, and phosphorus in native and cultivated soiis. Soil Science Society of Americi Journal 50:627-633.
ElLiott, E.T., K. P a d a n , and S.D. Frey, 1996. Modeling the Measmble or Measuring the Modelable: A Hienuchicai Appmach to Isolathg Meaningful Soi1 Organic Maiter Fractionations. In Evaluatioa of Sofl Orgirnic Matter ModeL Udng Exiaing Long-Teim Datasets, D.S. Powlson, P. Smith, and J.U. Smith (Eds.), NATO AS1 Series 1, vol. 38, Springer Verlag, Beilia
Engel, M.H., and RH. Maynard, 1989. Prepafation of organic matter for stable carbon isotope analysis by seaied tube combustion: A cautionary note. Analytical Cbemimy 6 1 : 1996- 1998.
Emman, H., E. van den Berg, and P. Reich, 1993. ûrganic carbon in soils of the world. Sdl Science Sodety of America Journal 57:192-194.

Fallett, R.F., E.A. Paul, S. W. Leavitt, AD. Halvorson, D. Lyon and GA. Peterson, 1997. Carboa isotope ratios of Great Plains soils in wheat-fdow systems. SOU Science Society of America Journal 6 1 : 1068- 1077.
Farquhar, GD., I.R Ehleringer, and KT. Hubick, 1989. Carbon isotope discrimination and photosynthesis. Annual Revim of Plant Physiology and Plant Molecular B ~ O ~ O M 1989 40:503-537.
Farquhar, G.D., and R.A. Richards, 1984. Isotopic composition of plant carbon comlates with water-use efficiency of wheat genotypes. Australlin Journal of Plant Physiology 1 1539-552.
Faure, G., 1986. Principlea of Isotope Geology, 2* Ed.. John Wiley, New York.
Fog, K., 1988. The effect of added nitrogen on the rate of decomposition of organic matter. Biologieal Review 63:433-462.
Fogel, M.L., and L.A. Ckntes, 1993. Isotope Fractionation during Primary Production. in Orgaiic Geochemirtry, M.H. Engel and S A Macko (eds.), Plenum Press, New York.
Garcia, F.O., and C.W. Rice, 1994. Microbial biomass dynamics in tdgrass prairie. Soü Science Sockty of America Journal 58:816-23.
Gifford, R.M., J.L. Lutze and D. Bamtî, 1996. Global atmospheric change effects on temstrial carbon sequestration: exploration with a global C- and N-cycle mode1 (CQUESRJ). Plant and Soil 1 87:369-387.
Goucûiaan, Je, 1995. Globai carbon cycle and carbon sequestration. in Carbon Sequcstiraon in the Biorphere. M.A. Beran (ad.), NATO AS1 Series, Vol 33. Springer Verlag, Beriin.
Grace, JOB., 1990. On the Relationship between Plant Traits and Cornpetitive Ability. In Perspectiva on Pluif Cornpetition. JOB Grace and D. Tilman (eds.), Academic Press, London. pp. 5 1-65.
Grant, RF., and P. Rochette, 1994. Soil rnicrobial respiration at difEerent water potentials and temperatUres: Theory and mathematicai modelhg. Soil Science Society of America Journal S8A681-1690.
Gregorich, E.G., B.H. EIlert, CF. Dnuy. and B.C. Liang, 1996. Fertilization effects on soi1 organic maner tuniover and corn residue C storage. SOU Science Society of America Journal 60:472-476.
Gregorich, E.G., B.H. Ellert, and CM. Monreai, 1995. Turnover of soi1 organic matter and storage of corn residue carbon estimateci h m naturai 13C abundance. Canadian Jourmi of SOU Science 75:161-167.

Harnba, Y.T., S. Mori, T.T. Lei, T. Kaike, and E. Wada, 1997. Variations ia leaf 813C dong a vertical pronle of inadiance in a temperate Japauese forest. Oecologia 1 1 O:253-26 1.
Hartge, K.HO, and B.A. Stewart (eds.), 1995. SOU Structure: Ib Development and Funetion. C.R.C. Press, Boca Raton Florida.
He, Z.L., J Wu, A.G. O'Dome11, and J.K. Syers, 1997. Seasonai responses in microbial biomass carbon, phosphom and sulphur in soils unda pasture. Biology and Fertility of S o b
1428.
Hedges, J.L. W.A. Cl& P.D. Quay, J E Richey, A.H. Deval and U. de M. Santos, 1986. Compositions and flues of particdate organic material in the Amemn River. Limnology and Oceanography 3 1 :717-738.
HBgberg, P., and A. Ekblad, 1996. Substrate-hduced respiration measured in situ in a Crplant ecosystem using additions of C,-sucrose. Soü Biology and Biochemistry 28: 1 13 1-1 138.
Houghton, R A , J.E. Hobbie, J.M. Melillo, B. Moore, B.I. Peterson, G.R Shaver, and G.M. Woodwell, 1983. Changes in the carbon content of terrestrial biota and soüs between 1860 and 1980: a net celease of CO2 to the atmosphere. Ecological Monographs 53:235- 262.
Hu, S., D.C. Coleman, PI. He& and M.H. Beare, 1995. Biotic manipulation effects on soi1 carbohydrates and microbial biomass in a cultivated soil. Soi1 BioRogy and Biochemisby 27: 1 127-35.
Hubick, K.T., GD. Farquhar, and R Shorter, 1986. Comlation between watet-use efficiency and carbon isotope discrhbtion in diverse peanut (Aruchis) germplasm. Australian Journal of Piant Phygiology 13:803-8 16.
~ubick, K.T., G.L. Hanmer, G.D. Farquhar, LJ. Wade, S. von Caemmeret, and S. Henderson, 1990. Carbon isotope discrimination varies geneticaily in C, species. Plant Physiology 91 534-537.
Idso, KE., S. B. Idso, 1994. Plant responses to atmospheric CO2 enrichment in the face of environmental coIIStraiIIts: a nview of the past 10 years' research. Agicultural and Fomt M c t c a r ~ l w 69: 1 53-203.
IGBP Terrestrial Carbon WoiLing Group, 1998. The terrestrial carbon cycle: implications for the Kyoto Protocol. Sdeact 280: 1393-1394.
hoyue, RS., N. I. Huntly, D. Tilman, LR T e e , M. Stillwell, and KC. m e t , 1987, Old-field succession on a Minnesota sand plain. Ecology 69(l): 12-26.

Inoyue, R.S., and D. Tilman, 1988. Convergence and divergence of old-field plant communities dong experimental nitrogen gradients. Ecology 69:995- 1 004.
Insam, H., D. Paricinson, and K.H. Domsch, 1989. Muence of macroclimate on soil microbial biomass. SOU Biology and Biochcmimy 2 1 :211-221.
Jager, G., and EH. Bruins, 1975. Effect of repeated drying at different temperatures on soi1 organic matter decomposition and characteristics. aad on the soil microflora. Soü Biology and Biochemistry 7: 153- 159.
Jang, J. C., Y. Nishigarni and Y. Yanagisawa, 1996. Assessrnent of global forest change between 1 986 and 1993 ushg satellite-derived terrestrial net primary productivity . Environmental Conservation 23:3 1 5-32 1.
Jasch, B., J. Ihnea, and L.L. Tieszen, 1990. Woodland/grassland boundary changes in the middle Niobrara Valley of Nebraska identified by 6°C values of soi1 organic matter. Amcricai Midland Natumlist l24:3O 1-308.
Jasper, J.P., and J.M. Hayes, 1990. A carbon isotope record of CO2 levels during the late Quateniary. Nature 347:462-464.
Jefferies, RL., and J.L. Maron, 1997. The embemissment of riches: atmospheric deposition of nitrogen and community and ecosystem processes. Trends in Evolutionary E c o l o ~ 12: 74- 77.
Jeakinson, D.S., 1990. The hunover of organic carbon and nitmgen in soil. Phiioaophical Transactions of the Royal Society of London B 329:361-368.
Jenkinson, D.S., and K. Coleman, 1994. Calcdating the annual input of organic matter to soi1 h m measurwients of totai organic carbon and radiocarbon. European Journal of Soii Science 45: 167-1 74.
Jenkinson, D.S., D.D. Harkness, E.D. Vance, D.E. Adams, and A.F. Harrison, 1992. Calcuiating net primary production and annual input of organic matter to soil h m the amount and raâiocatbon content of soi1 orgdc matter. SOU Biology and Biochembtry 24:295-308.
lenkinson, D.S., and J.H. Rayner, 1977. The turnover of soii organic matter in some of the Rothamsted classical experiments. Soil Science 123298-305.
Iettny, K., l94L. Factors of Soii Formation. McGraw-Hill, New York.
Jensen, L.S., T. Muella, J. Magid, and N.E. Neilsen, 1997, Temporal variation of C and N minetalization, rnicrobial biomass and extractable organic pools in soi1 a f k oilseed rape straw incorporation in the field. Soii Bioiogy and Biochtmistry 29: 1043-1 055.

Joergensen, R.G., B. Meyer, and T. Mueller, 1994. Time-come ofthe soil microbial biomass under wheat: a one year field study. SOU Biology and Biochemlshy 26:987-994.
Johansson, G., 1992. Release of organic carbon h m gmwing mots of meadow fescue (Festuca pratensis L.). Soii Biology and Biochembtry 24:427-433.
Johnson, DA., K.H. Asay, L.L. Tieszen, J.R. Ehle~ger, and P.G. Merson, 1990. Carbon isotope discrimination: Potential in screening cool-season gnisses for water-ümited environments. Crop Science 30:338-343.
Johnston, M.H., P.S. H o m m J.K. Engstrom, and DI. Grigal, 19%. Changes in ecosystem carbon storage over 40 years on an old-fieWforest landscape in esstcentral Minnesota. Forest Ecology and Management 83: 17-26.
Keeling, C.D., W.G. Mook, and PP. Tans, 1979. Recent trends in the l3CIl2C ratio of atmosphedc carbon dioxide. Nature 277: 121 - 123.
Kek, R., 1992. Packing away carbon isotopes. Nature 357:445-446.
Kendall, C., and E. Grim, 1990. Combustion tube method for measurement of nitmgen isotope ratios ushg calcium oxide for total removal of carbon dioxide and water. Analytical Cbemistry 62:526-529.
Kieft, T.L., E. Soroker, and M.K. Firestone, 1987. Microbial biomass response to a apid hcrease in water potentiai when dry soil is wettad SOU Biologr and Biochemiitry 19: 1 19-126.
Kingston, J.D., B.D. Marino, and A Hill, 1994. Isotopic evidence for neogene hominid paleoenvironments in the Kenya Rift Valley. Scknce 264955-959.
Kirchhoff, W.R. A.E. Hall, and W.W. Thomson, 1989. Gas exchange, carbon isotope discrimination, and chiomplast ultrasüucture of a chlorophyll-deficient mutant of cowpea. Crop Sdence 29: 109-1 15.
Kirschbaurn, M.U.F., 1995. The temperature dependence ofsoil organic matter decomposition, and the effect of global w d g on soi1 organic C storage. Sou Biolow and Biochembtry 27:753-760.
Klein, D.A., B.A. Fdeticic, M. Biondini, and M.J. Trüca, 1988. Rhiu,sphere micmorganism effects on soluble amino acids, sugars and orgaaic aciâs in the mot zone of Agropyon cristatum, A. smithii and Boutelortu gracilis. Piaat and Soü 1 10: 19-25.
Kther, Ch., G.D. Farquhar, and 2. Roksandic, 1988. A global survey of carbon isotope discrimination in plants h m high altinide. Ocrobglr 743623432.

Ladd , LN., M. Amato, P.R Grace, and J.A. Van Veen, 1995. Simulation of 14C turnover through the micmbial biomass in soils incubated with 14C-labelled plant residues. Soii Biolow and Biochemistry 27:777-783.
Ladd, IN., M. Amato, Zhou Li-Kai and J E Schultz 1994. Differential effects of rotation, plant residue and nitmgen feitihr on microbial biomass and organic matter in an Australian Alfisol. SOU Biology and Bioebemistry 26:82 1-83 1.
Lawley, R.A., R. Campbeli, E.1. Newman, 1983. Composition of the bacterial flora of the rhuosphere of time grassland plants grown sepately and in mixture. Soil Biology and Biochemirtry 1 S:6OS607.
Leavitt, S.W., and A. Long, 1986. Stable-carbon isotope variability in tree foliage and wood. Ecology 67: 1002-1 0 10.
LeFeuvre, R.P., and R.J. Jones, 1988. Static combustion of biological samples sealed in g las tubes as a preparation for 6°C detennination. Aaalyst 1 13 :8 17-823.
Lehrsch, G.A., R.E. Sojka, D.L. Carter, and P.M. Jolley, 1991. Freezing effects on aggregate stctbility affected by texture, mineralogy, and orgaaic matter. Soii Science Society of Americi Journal 55: l4OI-MO6.
Lloyd, J., and G.D. Farquhar, 1994. I3C discrimination durhg CO, assimilation by the tercestrial biosphere. Oecologia 99:îO 1-2 15.
Lovell, RD., S.C. M s , and R Bardgett, 1995. Soü microbial biomsss and activity in long-tam grassland: Effect of management changes. SOU Bioiogy and Biochemirtry 27:969-975.
Luizao, W.C., T A Bonde, and T. Rosswall, 1992. Seasonai variation of soi1 microbial biomass - the effects of clearfelling a tropical raidorest and establishment of pastm in the central Amazon. Soü Biology and Bioehemistry 24:805-813.
Macko, S.A., anci MLF. Estep, 1984. Microbial alteration of stable nitrogen and carbon isotopic compositions of organic matter. Organic Gmfhemistry 6:787-790.
Mahmood, T., F. Azam, F. Hussain, and K.A. Malik, 1997. Carbon availabiiity and micmbial biomass in mil under an imgated wheat-malle cropping system receiving Merent fertiiizer treatments. Bioloty and Fertiüty of Soih 25:63-8.
Majek, B.A., C. Erickson, and W.B. Duke, 1984. Tiliage effects and environmental Uinuences on quackgrass ( A g r o ~ o n repens) r b m e growth. Weed Science 32176-381.'
Mderscheid, R, I. Bender, U. Schenk, and HJ. Weigel, 1997. Response ofbiomass d nitrogen yield of white clover to radiation and atmospheric CO2 concentration. Environmental and Esperiaentai Bobsy 38A3 1-43.

Marino, B.D., and M.B. McElroy, 199 1. Isotopic composition of atomospheric CO, idemd h m carbon in C, plant cellulose. Nature 349: 127- 1 3 1.
Marino, B.D., M.B. McElroy, R.J. Salawitch, and W.G. Spauiding, 1992. Glacial-to-interglacial variations in the carbon isotopic composition of atmospheric CO2. Nature 357:461-466.
Mariotti, A., and I. Balesdent, 1990. 13C natutal abundance as a tracer of soi1 organic matter turnover and paieoenvito~~ment dynamics. Chernical Geology 84:2 17-2 1 9.
Martens, R, 1987. Estimation of micmbial biomass in soil by the respiration methoâ: importance of soil pH and flushing methods for the measurement of cespired CO2. Soil Biology and Biochembtty 19:77-8 1.
Martin, A., A. Mariotti, J. Balesdent, P. Lavelle, and R Vuattoux, 1990. Estimate of organic matter turnover rate in a savanna soil by 13C naturai abundance measurements. SOU Biology and Biochemistry 22:s 17-523.
Martin, B. , and Y.R Thorste~lson, 1988. Stable carbon isotope composition (WC), water use efficiency, and biomass pmiuctivity of Lycopmicon esmienium, Lycoperdcon pennellii, and the F1 hybrid. Plant Physiology 88~213-217.
Mary, B., A. Mariotti, and I.L. Morel, 1 992. Use of I3C variations at naturai abundance for studying the biodegredation of root mucilage, mots, and glucose in soil. SOU Biology and Biochemhtry 24: 1065-1072.
Materechera, S.A., A.R Dexter, and A.M. Aiston, 1992. Formation of aggregates by plant mots in homogenised soils. Plant and SOU 142:69-79.
Matus, A., A.E. Slinkard, and Cs van Kessel, 1997. Genotype x environment interaction for catbon i.wtope discrunination in spring wheat. Crop Science 37:97-102.
McGill, W.B., 1996. Review and Classification of Ten Soil Organic Matter (SOM) Models in Evaluation of Soü Organk Matter Modeb Uaing Esisting Long-Term Dataaets, D.S. Powlson, P. Smith, and LU. Smith (eds.), NATO AS1 Series 1, vol. 38, Springer Verlag. Berlin.
Melilio, LM., J.D. Aber, A.E. LUikins, A. Ricca, B. Fry, and KeL Nadelhoffer, 1989. Catbon and niaogen dyaamics dong the decay contlliuum: Plant litterto soii organic matter. Plant and Soii l 15: 189-198.
MeIiiio, J.M., J.D. Aber, and J.F. Muratore, 1982. Niüogen and lignin conûol of hsrdwood ieaf litter decomposition dynamics. Ecolow 63 :62 1 -626.
Merckx, R., A. den Hartog, and LA. van Veen, 1985. Turnover of root-denved material and related micmbial biomass formation in soils of dBerent textwe. Soii Biology and Bioebemky l7:565-569.
Minagawa, M., D.A. Winter, and LR Kaplan, 1984. Cornparison of Kjeldahl and combustion methods for measurement of nitmgen isotope ratios in organic matter. Anaïytical Chemishy 56: 1859-1861.
Monreal, CM., M. Schnitzer, H.-R Schulten, C.A. Campbell, and D.W. Anderson, 1995. Soil organic structures in macm and microaggregates of a cultivated brown chemozem. Soil Biology and BiochemWtry 27:845-853.
Monmal, C.M., R P Zentner, and LA. Robertson, 1997. An analysis of soil organic matter dynamics in relation to management, erosion and yield of wheat in long-term crop rotation plots. Canadian Journal of Soil Science 77553-563.
Moore iII, B. and B.H. Braswell lr., 1994. Planetary metabolism: Understanding the carbon cycle. Ambio 23 :4-12.
Motavalli, POP, C.A. Palm, WJ. Parton, E.T. Elliott, and S.D. Frey, 1994. Cornparison of labonitory and modeling simulation rnethods for estimating soil catbon pools in tropical forest soils. Soii Biology and Biochemistry 26:935-944.
Mueller, T., L.S. Jensen, J. Magid, and N E Nielsen, 1997. Temporal variation of C and N turnover in soil after oilseed rape straw incorporation in the field: simulations with the =il-plant- atmosphen mode1 DAISY. Ecological Modehg 99:247-262.
Myers, Ne, 1995. n i e world's fonsts: need for a policy appraisal. Science 268:823-824.
Naùelhoflier, K.J., and B. Fry, 1988. Controls on natuml nitrogen-15 and carbon-13 abundances in forest soil organic matter. SOU Science Wety of America Journal 52: 1633-1640.
Nelson, S.&, 1983. Response of Kentucky bluegrass (Pw pratenriS) to amount and fkquency of nitmgen application. Cinadian Journal of Plant Scknce 64:369-374.
Nelson, S.H., and F.W. Sosulski, 1984. Amino acid and protein content of Poapratendî as related to nitmgen application and color. Canadirn Journal of Plrnt Science 64:691-697.
Nüsen, E.T., and M.R. Sharifi, 1997. Carbon isotopic composition of legumes with photosythetic stems h m mediterraneanand desert habitats. Amcrican Journa1 of Botany 84: 1707-1 71 3.
Nissenbaum, A., and ICM. Schallinger, 1974. The distribution of the stable carbon isotope (UC/lT) in W o n s of soii organiç metter. Geodcnu 11:137-145.
Norby, RJ., and M.F. Cotnrfo, 1998. A question of litter quaîity. Nihim 3%: 17-1 8.
L.C., T.W. Boutton, C.T. Hailmark, and M.R. Waters, 1994. Late quatemary vegetation and climate changes in centrai Texas based on the isotopic composition of organic carboa Quatemary Reaearch 41 :log-120.
Oades, LM, 1995. An O v e ~ e w of Processes Affecthg the Cycling of Organic Carbon in Soils. in The Rok of Nonliving Organic Matter in the Earth's Carbon Cyck. RG. Zepp and Ch. Somtag (eds.), John Wiley, New York.
O'Leary, M.H., 1981. Carbon isotope fkctionation in plants. Phytochemiatry 20553-567.
Omuod, D.P., A.-M. Schmidt and N. I. Livingston, 1997. Effect of W-B radiation on the shoot dry matter production and stable carbon isotope composition of two Arabidopsis thaiiuna genotypes. Physiologia Plantamm 10 1 :497-502.
Ostendorf, D.W., DJ. DeGroot, S.3. Pollock, and LJ. Long, 1997. Aerobic degradation potential assessrnent h m oxygen and carbon dioxide soil gas concentrations in roadside mil. Journal of Environmental Quality 26:445-453.
Parton, W.J., 1996. Ecosystem model comparisons: science or fmtasy world? in Evahiation of Soil Organic Matter Modeb Using Esbting Long-Tem Datasets, D.S. Powlson, P. Smith, and J.U. Smith (Eds.), NATO AS1 Senes 1, vol. 38, Springer Verlag, Berlin.
Parton, W.J., D.S. Schimel, C.V. Cole, and D.S. Ojima, 1987. Analysis of factors controlhg soil organic matter levels in Great Plains grasslands. Soü Science Society of America Journal 5l:ll73-1179.
Parton, W. J., and P.E. Rasmussen, 1994. Long-term effects of crop management in wheat-faliow: ïï. CENlVRY model simulations. SOU Science Society of America Journal 58530436.
Pastor, j., MA. Stillwell, and D. TiImm, 1987. Little bluestem Litter dynamics in Minnesota old fields. Oecologia 72:327-330.
Paterson, E., E.A.S. Rattray and K. Killham, 1996. Effect of elevated atmospheric CO2 concentration on C-Wtioning' and rbuosphere C-flow for tfnee plant species. Soil Biology and BiochemUty 28: 195-20 1.
Paul, EA., 1984. Dyilemics of o r p i c matter in soils. Plant and Soi1 76:275-285.
Paul, E.A., and F.E. Clark, 1996. Soi1 Miuobiolow and Biochwishy, 2'''' ed., Academic Press, New York
Paul, E.A., R.F. Foliett, S.W. Leavitt, A. Halvorson, GA. Peterson and D.J. Lyon, 1997. RadiOcafbOn dating for determination of soi1 organic matter pool sizes and dyaamics. Soi1 Science Society of America Journal 6 1 : 1058-1067.

Paustian, K., O. Andrén, M. Clarholm, A.-Ce Hansson, O. Johansson, J. LagerlM, T. Lindberg, R Pettersson, and B. Sohlenius, 1990. Carbon and nitrogen budgetsof four agro-ecosystems with mual and petennial aop, with and without fertilization. Journal of Applkd Ecology 2750-84.
P a d a n , K., W. J. Parton, and J. Persson, 1992. Modeling mil organic matter in organic-amended and nitrogen-fertilized long-term plots. Soil Science Society of America Journal 56:476-488.
Peaî, H.C.L., 1997. Dynamics of C, and C, productivity in oorüern mbed gras8 prairie. Master's thesis, University of Toronto.
Pimentel, D., C. Harvey, P. Resosudarmo, K. Sinclair, D. Kun, M. McNair, S. Crist, L. Shpritz, L. Fitton, R Seouri and R Blair, 1995. Environmental and economic costs of soil erosion and conservation benefits. Science 267: 1 1 17-1 123.
Pinton, R, 2. Viuanini, G. Vizzotto, and A. Maggioni, 1992. Soil humic substances affect transport properties of tonoplast vesicles isolated h m oat mots. Plant and Soii l42:203-2 10.
Polley, H. Wayne, Hyârum B. Johnson, and Hmnan S. Mayeux, 1992. Detennination of mot biomasses of thm species p w n in a mixture using stable isotopes of a b o n and nitrogen. Plant and Soii 142:97-106.
Post, W.M., W.R. Emanuel, P.J. Zinke, and A.G. Stangenberger, 1982. Soil carbon pools and world life zones. Nature 298: 156-1 59.
Powlson, D.S., P.C. Brookes, and B.T. Christensen, 1987. Memurement of soil microbiai biomass provides an early indication of changes in total soi1 organic matter due to straw incorporation. Soi1 Bio lw and Biochemistty 19: 159-164.
Powlson, D.S., P. Smith, and LU. Smith (eds.), 1996. Evaluation of SOU Organic Matter Models Using Exhting Long-Term Datmets. NATO AS1 Series, Series 1: Global Envitomenta1 Change, Vol. 3 8. Springer Verlag, B e r h
Qian, P., and I.D. Wolt, 1990. Effects of drying and time of incubation on the composition of displaced soi1 solution. Soii Science 149:367-374.
Robertson, RA., and P.G. Safnpa, 1990. The inauence of mots on flushes of microbial C and N foilowing Mgation-incubation of a pastue soi1 Soi1 Biology a d Bkhemistry 22: 1 O0 1- 1002.
Ross, DJ., 1990. Estimation of soil micmbid C by a fumigatio~exttaction method Muence of seasons, soils and caiibration with the fumigation-incubation procedure. Soii Biolow and Biochcmhtry 22295-300.

Rounick, J.S., and M.J. Wmterbourn, 1986. Stable Carbon Isotopes and Carbon Flow in Ecosystems. BioScience 36: 17 1-1 77.
Schilling, G., A. Gransee, A. Deubel, G. Lezovic, and S. Ruppel, 1998. Phosphou availability, mot exudates and micmbial activity in the rhizosphere. Zeitrehrift mr Planzenern~hmng und Bodenkuade 161 :465-78.
Schimel, D.S., 1986. Carbon and nitmgen turnover in adjacent grassland and cropland ecosystems. Biogeochemiatry 2:345-357.
Schimel, D.S., 1995. Terrestrial ecosystems and the carbon cycle. Global Change Biology 1 :77- 91.
Schimel, D.S., B.H. Brasweli, E.A. Holland, R. McKeown, D.S. Ojima, T.H. Painter, W.J. Parton, and A.R. Townsend, 1994. Climatic, edapbic, and biotic controls over storage and turnover of carbon in soils. Global Biogeochemieal Cycla 8:279-293.
Schleser, G.H., 1992. 6°C pattern in a forest tree as an indicator of carbon transfer in trees. Ecology 73: 1922- 1925.
Scholes, R.J., and M.C. Scholes, 1995. The effect of land use on nonliving orgaaic matter in the soil. In The Role of Nonliving Organic Matter ln the Earth'r Carbon Cycle. R.G. Zepp and Ch. Sonntag (eds.), John Wüey, New York.
Schulten, He-R, and R. Hempfling, 1992. Infiuence of agiculturai soi1 management on humus composition and dynaxnics: Classical and modern anaiytical techniques. Piant and Soil 142:259-271 .
Schwartz, D., H. de Foresta, A. Mariotti, J. Balesdent, I.P. Massimba, C. Girardin, 1996. &sent dynemics of the savanna forest bomdary in the Congolese Mayombe: a pedological, botmical and isotopic (13C and I4C) study. Oecologia 106:s 16-524.
Schwartz, D., A. Mariotti, R. Ladkanehi, and B. Guillet, 1986. '3C/12C ratios of soii organic matter as indicators of vegetation changes in the Congo. Gcoderma 39:97-103.
Scott, N.A., C.V. Cole, E.T. Elliott, and S.A., Juffhan, 1996. Soil texturaicontrol on decomposition and soi1 organic matter dynamics. Soil Science Society of Amtria Journal 60: 1 102-1 109.
Seastedt, T.R, 1988. Mass, nitrogen, and phosphorus dynamics in foliage and root detritus of tallgcass prairie. Eeology 6959-65.
Showers, WJ., and D.G. Angle, 1986. Stable isotope cbaracteiization of otganic carbon accumulation on the Amazon continentai shelf. Continentai Shtlf Research 6227-244.

Singh, S., and J.S. Singh, 1995. Micmbial biomass associatecl with water-stable aggregates in forest, savanna and croplaad soils of a seasonally dry tropical region, India. SOU Biology and Biochemirhy 27: 1027-1033.
Skjemstad, J.O., LJ. Janüc, M.J. Head, and S.G. McClure, 1993. High energy ultra-violet photo- oxidation: anovel technique for studying physically pmtected organic matter in clay and silt- sized aggregates. Journal of SOU Sdenct 444859499.
Sofer, Z., 1980. Preparation of carbon dioxide for stable carbon isotope d y s i s of petroleum ktions. Anaiytical ChemMy S2:l389-l39l.
Smnsen, L.H., 1974. Rate of decomposition of organic matter in soi1 as inauenced by npeated air drying-rewetting and repeated additions of o ~ a n i c materiai. Soii Biology and Biochemky 6:287-292.
Smnsen, L.H., 198 1. Carbon-nitmgen relatioaships during the humification of cellulose in soils containhg different amounts of clay . Sou Biology and Biochemistry 13 :3 13-321.
Smith, B.N., and S. Epstein, 1971. Two categories of 13CIL2C ratios for higher plants. PIaiit Physiology 47:3 80-384.
Smith, S.V., and P. Ksoopnick, 1981. Carbon-13 isotopic hctionation as a m e a m of aqwtic metabolism. Nature 29425-253.
Stemtserg, L. Da S.L., S.S. Mulkey, a d S. J. Wright, 1989. Ecological interpreiation of leafcarbon isotope ratios: Influence of respired carbon dioxide. Ecology 70: 13 17-1 324.
Steuter, A.A., B. Jasch, L Ihnen and L.L. Tieszen, 1990. Woodland/grassIand boundary changes in the Middle Niobrara Valley of Nebraska identified by S13C values of soi1 otgmic metter. American Midiand Naturaibt 124:301-308.
Stevenson, F.J., 1986. Cyck of Soü. John Wiley, New York.
Stevenson, F.J., 1994. Humus Chemistry. 2& Ed., John Wiley, New York.
Seain, B.R. aiid R.B. Thomas, 1995. Anticipated Effects of Elevated C G and Climate Change on Plants h m Mediterranean-Type Ecosystems Utilizing Results of Studies in Other Ecosystems. In Global Chamge and Miditerranean-Type Ecosystems. LM. Moreno and W.C. ûechel (eds.), Springa Verlag, Berlin.
Street-Perrott, FA., Y. Huang, R A. Pemtt, 1997. Impact of lower atmospheric carbon dioxide in tropical moutain ecosystems. Sekna 278: l4226.
Süicklaad, TeCe, and P.Sollins, 1987. I m p d method for sepmting light-and heavy-Mon organic material fïom soZ Son Sekace Wety o f Amerki Journal 51: 1390-1393.
Shiiver, M., and T.F. Braziunas, 1987. Tree celîulose "CP2C isotope ratios and clhatic change. Nature 32858-60.
Stuiver, M., R.L. Bu4 and P.D.Quay, 1984. '3C/12C ratios Ui tree rings and the trader of biospheric carbon to the atmosph. Journal of Gcopbysical Rcs#reh 89: 1 173 1 - 1 1748.
Tate, R.L.9 1995. SOU Micmbiology. John Wiey, New York.
T e , LA., md L.G. Stowe, 1976. Climatic patterns and the distribution of CI grasses in North America. Oecoiogh 23: i - i 2.
Terwiiiiger, V.J., 1997. Changes in the 6°C values of ûees during a tropical rainy season: some effccts in addition to diffusion and carboxylation by Rubisco? American Journal of Botany 84: 1693-1 700.
Tester, J.R., 1989. Effects of fïre froquency on oak savatlll~~ in east-central Minnesota. Bulletin of the T o m Botanid Club 1 l6:134?-144.
Tiessen, H., E. Cuevas, and P. Chacon, 1994. The role of soi1 organic matter in sustaining soi1 fertility. Nabre 371 :783-785.
Tieszen, L.L., 1991. N a W variations in the carbon isotope values of plants: Implications for archaelogy, ecology, and paleoecology. Journal of Anheological Science 18:227-248.
Tieszen, L.L., and S. Archer, 1990. Isotopic Assessrnent of Vegetation Changes in Grassland and Wodand Systems. in Ecological Studies VOL 80: Plant Biology of the Buin and Range. C.B. Osmond, L.F. Piteika, and G.M. Hidy (ods.), Springer-Verlag, Berlin.
Tieszen, LL., MoMm Senyimba, SX.Jmbamba, and J.H. Troughton, 1979. nie distribution of C3 qnd C, grasses and carbon isotope discrimination dong an altitudinai and moistue gradient in Kenya. OccoIogia 37:33 7-350.
Tüman, D., 1983. Plant succession and gopher disturbance along an experimental gradient Oceologh 60:285-292.
Tilmaa, D., 1984. Plant domhance along an expeximental nutrient gradient. Ecology 65:1445- 1153.
Tilman, D., 1987. Secondary succession and the pattern of plant dominance dong experimental nitmgen gradients. Ecological Momogmphr S7:l89-2 14.
Tilman, D., 1988. Plant Strategies and the Dynamia and Structure of Piant Cornmualties. Princeton University Rcss, Princeton, New Jersey.
Tilman, D., 1996. Biodiversity: Population vasus ecosystem stability. Ecolw 77:350-363.

Tilman, D., and A. El Hacidi, 1 992. Drought and biodiversity in grasslards. Oecologia 89:257-264.
Tilman, D., and D. Wedin, 1991. Plant traits and resource reductioa for five grasses growing on a nitmgen gradient* Ecology 72:685-700.
Tisdail, LM, and JM Odes, 1982. Orgaaic matter and water-stable aggregates in soils. Journal of Soil Science 33:141-163.
Townsend A.R, P. Vitousek, and S.E. Trumbore, 1995. Soii organic matter dynamics dong gradients in temperatme and land use on the island of Hawaii. Ecology 76:721-733.
Tnunbore, S.E., O.A. Chadwick, and R Amundson, 1996. Rapid exchange between soil carboa and atmospheric carbon dioxide dnven by temperature change. Science 272:393-396.
Van Auken, O.W., LK. Bush, and D.D. Diarnond, 1994. Changes in growth of two C, grasses (Schizachyrium scopmim and P~llronplicatuiurn) in monoculture and mixture: Muence of soil depth. American Journal of Botany 8 1 : 15-20.
van Gestel, M., J.N. Ladd, and M. Amato, 199 1. Carbon and nitrogen mineralization h m two mils of contrasting texture and microaggregate stability: influence of sequentiai fumigation, drying and storage. SOU Biology and Biochemistry 23 : 3 13-322.
van Kessel, C., RE. Farrell, and D.J. Pennock, 1994. Carbon-13 aad nitmgen-1 5 natural abundance in crop residues and soil orgmic matter. SOU Science Society of America Journal 58:382- 3 89.
van Veen, LA., LN. Ladd and M. Amato, 1985. Turnover of carbon and nitrogen thugh the microbial biomass in a sandy loam and a clay soil incubated with [I4C(U)] glucose and [lWJ(N&hSO, under different moistue ngimes. Soii Biolagy aad Bioehcmiatry 17:747- 756.
van Veen, LA., J.N. Ladd and M. Amato, 1987. Tumowt of carbon, nitrogen and phosphorus Wugh the microbial biomass in mils incubated with I4C-, lu- and 3'P-labelled bacterial cells. SOU Biology and Biachemhtiy l9:559-565.
van Veen, S.A., LN. Ladd, and M.J. Frissel, 1984. Modehg C and N turnover through the microbid biomass in soil. Plant and Soii 76:257-274.
van Veen, JA*, and E.A. Paul, 198 1. Orgenie carbon dynamics in grasstand soils. 1. Background information and cornputer simulation. Canadiin Journal of Soil Seience 61 : 185-201.

VEMAP members, 1995. Vegetationkcosystem modehg and adysis project: Comparing biogeogiaphy and biogeochernistry models in a continental-sale study of temsûial ecosystem responses to clhate change and CO2 doubling. Global Biogeocbemical Cyclea 9:407437.
Vitousek, Peter M., 1994. Beyond Global Wamiing: Ecology and Global Change. Ecology 75:1861-1876.
Volkoff, B., and C.C. Cem, 1987. Carbon isotopic f'ractionation in subtropical BraPlian graasland soils. Cornparison with tropical forest soils. Plant and SOU 102:27-3 1.
Voroney, R.P., LA. Van Veen, and EA. Paul, 1981. Organic C dyoamics in p s l a n d mils. 2. Mode1 validation and simulation of the long-tem effects of cultivation and rainfall erosion. Canadian Journal of Soil Science 61 :211-224.
Wander, M.M., and S.J. Traina, 1996. Organic matter hctions h m organicaily and conventionaiîy managed soils: 1. carbon and nitrogen distribution. Soii Science Soc Am. J. 60: 108 1-1087.
Wardle, D.A., 1998. Controls oftemporal variability of the soit microbial biomass: a globai-scaie synthesis. Soil Biologr and Biochemirtry 30: 1627- 1637.
Wedin, D.A., and J. Pastor, 1993. Nitmgen mineraiization dynamics in grass monocultures. Oecologia 96: 1 86-1 92.
Wedh, D.A., L.L. Tieszen, B. Dewey, and L Pastor, 1995. Carbon isotope dynamics during grass decomposition end soi1 organic mattet fomtion. Ecology 76: 1383-1 392.
Wedin, D.A., and D. Tilman, 1990. Species effeets on nitrogen cycling: A test with perennial grasses. Oecologia 84:433-Ml.
Wedin, De, and D. Tilman, 1993. Cornpetition among grasses dong a nitmgen gradient: initial conditions and mechanisms of cornpetition. Ecologîcal Monogipbs 63: l99-229.
Wedin, DA., and D. Tilman, 1996. Influence of nitrogen loading and species composition on the carbon balance of grasslands. Science 274: 1720-1 723.
Will, O.H., L.L. Tieszen, T. Galach, and M. Kelien, 1989. Alteration of carbon isotope ratios by eight Ustilugo sp ies on defined media. Bobnicai GazeHe 150: 152-1 57.
Winter, K., 1981. CO2 and water vapour exchange, malate content and 6% value in Cicer mietintlm grown unâer two water regimes. Zdtschrüt filr Wlrnzenphyaiologk und Bodenkunde 10 1 :421-430.

Woodwell, G.M., 1984. The carbon diolride problem. In The Role of Terrestrial Vegetation in the Global Catbon Cycle: Memurement by Remote Senring. SCOPE 23, G.M. WoodweU (ed.), Job Wiley, New York.
Wright, G.C.. R.C. Nageswara Rao, and G.D. Farquhar, 1994. Water-use efficiency and carbon isotope discrimination in peanut under water deficit conditions. Cm p Science 34:92-97.
Zak, D.R., D.F. Grigal, S. Gleeson, and D. Tilman, 1990. Carbon and nitmgen cychg during old- field succession: Consüaints on plant and microbial biomass. Biogeochemistry 1 1 : 1 1 1 - 129.
Zepp, KG., and Ch. Sonntag (eds.), 1995. The Role olNoaliving Organk Matter in the Earth's Carbon Cycle. John Wiley, New York
Zsolnay, A. and H. Golitz, 1994. Water extractabie organic matter in arable soils: eff- of drought and lougtenn fertilization. Sou Biolou and Biochemiahy 26: 1257-1 26 1.

t PROCEDURAL TESTS
This appendix contains the redts of procedural tests that were performed for the incubation,
combustion, and decarbonation methods to ensure that they did not result in isotopic ktionation
of the samples.
A.l Incubation Method
A.1.1 Syringe Injection Technique
Isotopic hctionation of gas samples can occur during withdrawaî fiom sample vessels with
a syringe and subsequent injection into the GC interface of the mass spectrometer (B. Shetwood
Lollar, pers. comm.). The withdrawaüinjection technique (82.3.3) was tested for fhctiomtion using
a CO2 laboratory working standard (SL2) with a known 6°C value of -47.89Oo0 * 0.0 1% (a=@.
Three empty incubation chambers were filled with 2,000 ppm Sa2 in He and sealed. 500pL
of gas were withdrawn immediately through the septum using a 500pL Pressure Lok C-series
gastight syringe with a sideport needle (Hamilton Co.). The gas was injected into the GC intenace
of the mass spectrometa; 10 injections were perfonned h m each chamber. Reproducibility and
accuraçy were excellent, with the mean measured 6°C = -47.86% * 0.07% compared to the hown
value of -47.890r60 *0.01%o.
A.13 Stomge Effècts of Incubatioa Chambers
Interaction of the sample gas with different materials (e.g. nibber) can result in isotopic
wtionation (B. Shenivood Loliar, pers. comm.). Also, impmpet seaiing ofthe sample chamber can
cause fiactionetion due to diffusion or contamination with atmospheric CO2 (iJIC--8%). The
inabation chambers were tested for long-tecm storage effects to d e out these factors.

A-2
Empty chambers were nIled with t h different concentrations of SIL2 in either He or a 10%
4 in He mixture. They were then stored in an incubator for 5 or 8 days at the same conditions as
actual soii incubations (Table A-1).
Table A-1 Redts of storage test of incubation chambers. Chambers were stored in the âark in an incubator at 30 OC. 10 injections were ma& per chamber. àI3C of Sa2 = 47.9960.
- - - - - - . --
Gas COz conc (ppm) Stonge t h e (days) n b l C (%O) ' - - - - - - - -- - -- --
SIL2 in He 2,000 8 2 47.4 (0.1)
SE2 in He 10,000 8 2 -47.7 (0.1)
Sa2 in O2Me 5,000 5 3 -47.9 (0.2)
'numbers in brackets are 1 SD.
The gradual enrichment ofthe samples in the firsttwo tests is consistent with a smaii amount
of leakage of atmospheric CQ into the chambers. However, the resulting shift to more positive 6°C
is insignifiant for short storage periods, such as those used during the soü incubations (2 to
10 days). It shouid k noted that the effect of this contamhation is even smaller for mil nspired
CO2 which is significantly more enriched in 13C (by > + 2 W ) than the working standard used here.
A13 E f k t of O3 Concentration on Soi1 Respiration Rate and 6°C of Respireci COa
To maintain aerobic conditions during times when the chambers were sealed, a mixturr of
4 in He was useâ as purghg gas (82.3.2). A test was perfiormed to determine the effect of O2
concentration of the purging gas on the rate of soil respiration and the isotopic composition of the
respired COI, with the aim of finding the minimum 4 concentration requited in the pwghg gas.
Two experiments, one short-term (-24 hm) and one long-tam (-72 hrs) were conducted.
Table A-II shows the results of tests using mbsamples of a soii nom High Park, Toronto,
Canada, that werr incubated for 72 ot 24 hrs with O - 2û?h 4 in He. As long as aerobic conditions

prevailed, 6°C was steady at ca. -22.6%0 but respiration rate and 6I3C were significantly aected
by anaembic conditions, and a minimum of 5 - 10% 4 was required to avoid this effect. Therefore,
a mixture of 10% O2 in He was chosen as purging gas for the study.
Tabk A-II Effect of 4 concentration on soi1 tespiration rate and 6% of respind CO2 on a sendy soil with 1.8% SOC h m an upland oak savanna site at High Park, Toronto.
Time sealed 0, coiic Final COz CON. Resphtioa rate 6I3C II
(in) (%) @ ~ m ) (mg CO2 h f g dry soii -') (960)
A.1.4 E f f ~ t of CO2 ConcenWtion on SOU Respiration Rate and 6I3C
Soi1 CO2 concentrations are elevated with respect to the atmosphere, which has a
concentration of -300 ppm. CO, concentrations innonîompacted, non-clay mils can be 10 to 100
times higher than the atmosphere (Brady, 1990; Andrews, 1973). and as high as 19,000 ppm in
subsurface soüs (Ostendorf et al., 1997). At very high concentrations, the plants and soi1 microbes
can be detrhentdiy affecfw by CO2 toxicity.
A test was pedormed to determine m e t measurable miciobiai inhibition duc to CO2
tolticity wouid occur over the range of CO, concentrations expected during incubation. Table A m
shows the resuits of tests in which soil samples were incubaîeâ with 10% 4 for 14 to 93 hrs to nach
CO, concentrations ranging h m 1,100 ppm to 9,500 ppm.
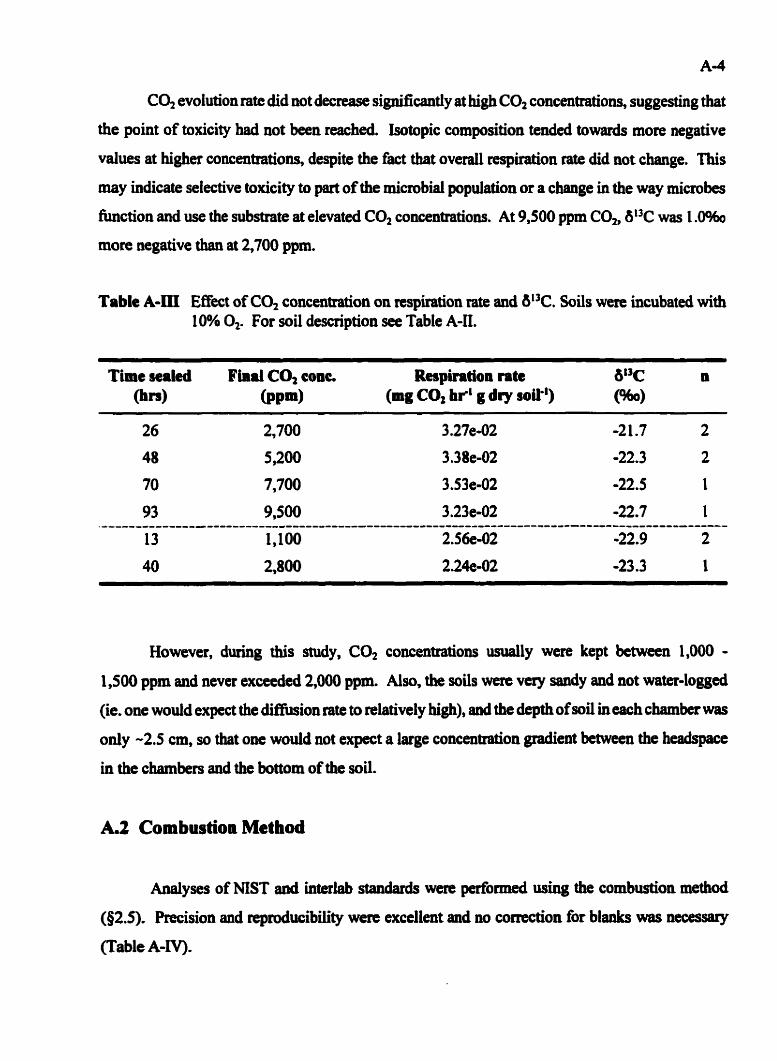
CO2 evoiution rate did not decrease siflcantly at high CO2 concentrations, suggesting that
the point of toxicity had not been reached. lsotopic composition tended towards more mgative
values at hi* concentrations, despite the fact that o v e d respiration rate did not change. ' b i s
may indicate selective toxicity to part of the microbial population or a change in the way microbes
h c t i o n and use the substnue at elevated CO2 concentrations. At 9,500 ppm CO2, 6°C was 1 .O%o
mon negative than at 2,700 ppm.
Tabk A-IXI Effect of CO2 concentration on respiration rate and 6°C. Soils w m incubated with 10% 0,. For soi1 description see Table A-II.
Time aeaied Final CO2 conc. Respiration rate & W n (b@ @PW (mg CO* brt g d y soW1) (%O)
However, during this snidy, CO2 concentrations d y were kept ôetween 1,000 - 1,500 ppm and never exceeded 2,000 ppm. Mm, the soiis were vay sandy and not water-Ioggeà
(ie. one would expect the dinusion rate to nlatively high), and the depth of soi1 in eech c h b e r was
only -2.5 cm, so that one would not expect a large concentration m e n t between the headspace
in the chambers and the bottom of the SOU.
A 2 Combustion Method
Analyses of NIST and interlab standards were perfomied ushg the combustion methcd
(82.5). Precision and reproducibility were excelient and no c o d o n for blaDks was necessary
(Table A-IV).
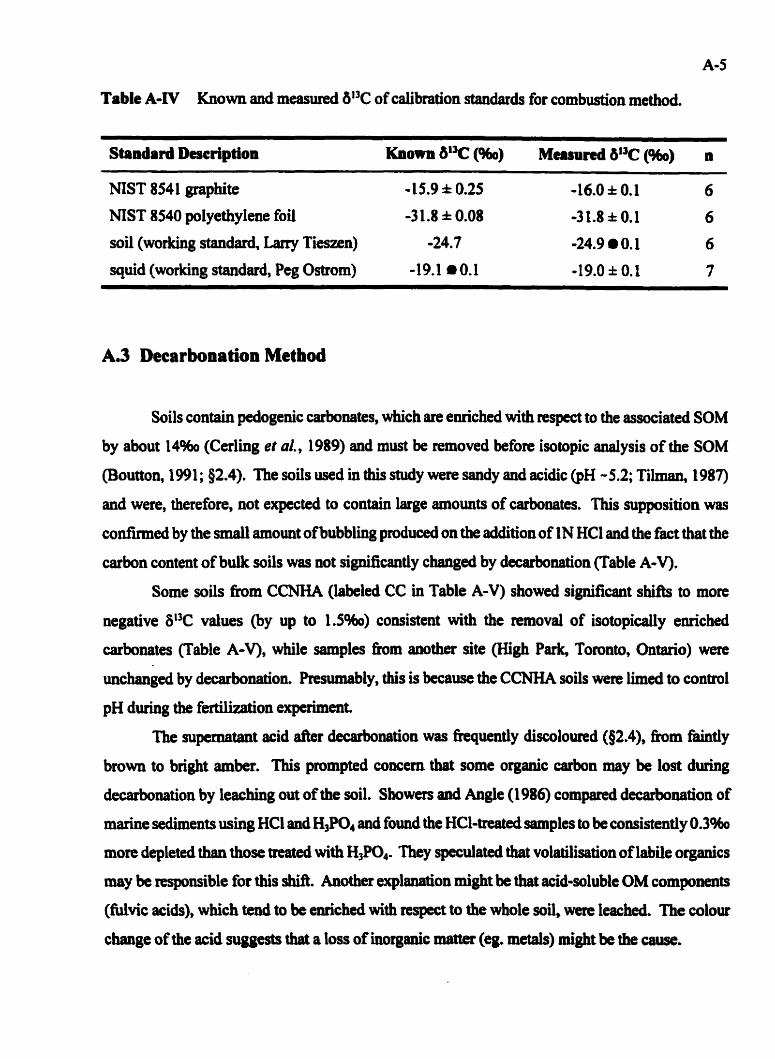
Table A-IV Known and measund W C of caiibration standards for combustion method.
Standard Description Known P3C (960) Meammi WC (960) n
N?ST 8541 graphite - 15.9 i 0.25 -16.0 0.1 6
NIST 8540 polyethylene foi1 -3 1.8 * 0.08 -31.8 i 0.1 6
soi1 (working standard, Larry Tieszen) -24.7 -24.9 0.1 6
squid (working standard, Peg Ostrom) -19.1 m0.1 -19.0 i 0.1 7
A.3 Decarbonation Metbod
Soils contain pedogenic carbonates, which are e ~ c h e d with respect to the associated SOM
by about 14% (Cerling et al., 1989) and must be removed before isotopic anaiysis of the SOM
(Boutton, 1991 ; 92.4). The soils used in this shdy were sandy and acidic (pH -5.2; Tilman, 1987)
and were, thetefore, not expected to contain large amounts of carbonates. This supposition was
confirmeci by the d amount of bubbling produced on the addition of IN HCI and the fact that the
carbon content of bulk mils was not sigdicantly changeci by decarbonation (Table A-V).
Some soils h m CCNHA (labeled CC in Table A-V) showed significant shiAs to more
negative 6 l F values (by up to 1.5%) consistent with the removal of isotopically enriched
carbonates (Table A-V), while samples from amthet site (High Park, Toronto, Ontario) were
unchanied by decarbonation. Resumably, this is b u s e the CCNHA mils were iimed to conml
pH during the fertiIization experiment,
The supernatant acid a b decarbonation was fiequently discoloured (§2.4), h m faintly
brown to bright amber. This prompted concern that some organic carbon may k lost during
decarbonation by leaching out of the soil. Showers and Angle (1986) compareà decatbonation of
marine sediments using HCl anû H3P04 and found the HC1-treateà samples to be consistendy 0.3460
more depleted thaa those mted with H3P04. They speculated that volatiliszttion of labile orgdcs
may be tesponsible for this M. Another explanadion might k thet acid-soluble OM components
(fiilvic acids), which tend to be enriched with xespect to the whole soil, wm leached. The colour
change ofthe acid suggests diat a loss of inorganic matter (eg. metais) might k the cause.
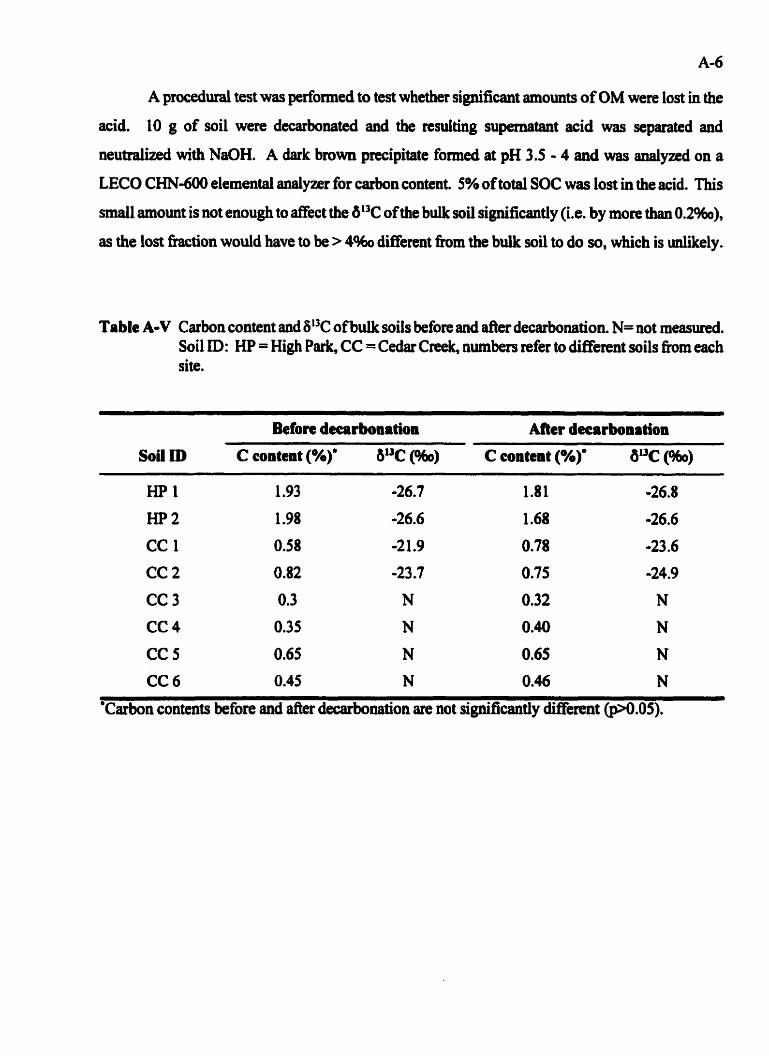
A procedural test was perfomed to test whether sisnifiaint amomts of OM were lost in the
acid. 10 g of soi1 were decatbonated and the resulthg supernatant acid was separated and
neutraiized with NaOH. A dark brown precipitate formed at pH 3.5 - 4 and was analyzed on a
LEC0 CHN-600 elemental analyzet for carbon content. 5% of total SOC was lost in the acid. This
small amount is not enough to affect the b13C of the bulk soi1 significantly (Le. by more than 0.2%).
as the lost fiaction would have to be > 4% different h m the bulL soi1 to do so, which is ualikely.
Table A-V Catbon content and 6I3C ofbulk soils before and d e r decarbonation. N= not measured. Soil ID: HP = High Park, CC = Cedar Cmk, numbers refer to different soils from each site.
.- - - - - - - - -
Before decarbonation After decarbonation
Soi1 ID C content (%)' W C (960) C content (%)' WC (%O)
HP1 1.93 -267 1.81 -26.8
HP2 1,98 -26.6 1.68 -26.6
CC 1 OS8 -2 1,9 0.78 -23.6
CC 2 0.82 -23.7 0.75 -24-9
CC 3 0.3 N 0.32 N
CC 4 0.35 N 0.40 N
CC 5 0.65 N 0.65 N
CC 6 0.45 N 0.46 N
'Carbon contents before and afkr decarbonation an not sipnificantly cîifEerent (pO.05).

Plot 8-39 had an wusual vegetation pattem, and its isotopic compositions of soi1 and SOM
pools were very difEerent h m other plots in Ta. For these tessons, it was excluded nom the
analysis, as described below.
The initiai soil respiration rate of plot 8-39 duiing the incubations was approximately four
t hes largei than that of the other two plots in T8, and was more than twice as large as the highest
initial respiration rate measumf in a.U plots. The estiniated value of 613C, was - 12.9%0, cornparcd
to the values of -l9.4%0 and -19.5960 found in the o t k two plots of T8. This value was not ody
unusually high for this treatment, but was the highest measured in this study. It wss c a 4% more
positive than the most positive vegetative input measurod in the study. The nason for this musual
resuk are not known.
Besides yielding anomalous results in the incubations, plot 8-39 also had aa unusuai
vegetation history . Although its 1994 m i e s composition was similar to the other plots in T8, with
a large abundance of Agropyron repenr, it did not follow the same temporal pattem of species shift
as the other plots in T8. Vegetation in the 0 t h plots lost its C, cornponent in approximately 5 years
after initiation of the fcrtiiization experiment while plot 8-39 had a hi& abundance of C, plants for
the nrst 9 years of the experiment. As a result of this delayeci change to C, species, the total
cumulative C, biomass firom 1982 to 1994 in plot 8-39 was ca. 2.8 times h i g k than in the other
plots of T8. The C, proportion of the total cumuiative NPP h m 1982 to 1994 in plot 8-39 was 0.55,
compad with 0.14 and 0.18 in the othet plots of T8.
Plot 8-39 also différai signincantly b m the other two plots in T8 in total cumulative NPP
h m 1982 to 1994, which was 28% lower h this plot.
Overd, the temporal pattem of vegetation change in plot 8-39 was similar to those observed
in T5, and very dissimilat to T8. The muons for this are unknown.
Based on the above infocmation, plot 8-39 was excluded h m fbrther analysis.