solargis report · psa, tabernas, almeria, spain ... executive summary ... 2009 76.0 105.1 150.8...
TRANSCRIPT

Direct Normal Irradiation - long-term average © 2014 GeoModel Solar
© 2014 GeoModel SolarReport number: SG-0000-0000-1
SolarGIS® Report
Solar Resource Overview
Site name:
PSA, Tabernas, Almeria, SpainType of Data:15-minute time seriesPeriod:01/01/1994 - 31/12/2013
Customer:PSA DLR
Date of Issue:31 January 2014
Issued by:GeoModel Solar s.r.o.Tel: +421 2 492 12 [email protected]://solargis.infohttp://geomodelsolar.eu
SITE NAME: PSA, Tabernas, Almeria, Spain, TYPE OF DATA: 15-minute time series, CUSTOMER: PSA DLR
Report number: SG-0000-0000-1 © 2014 GeoModel Solar Issued: 2014-01-31 15:01
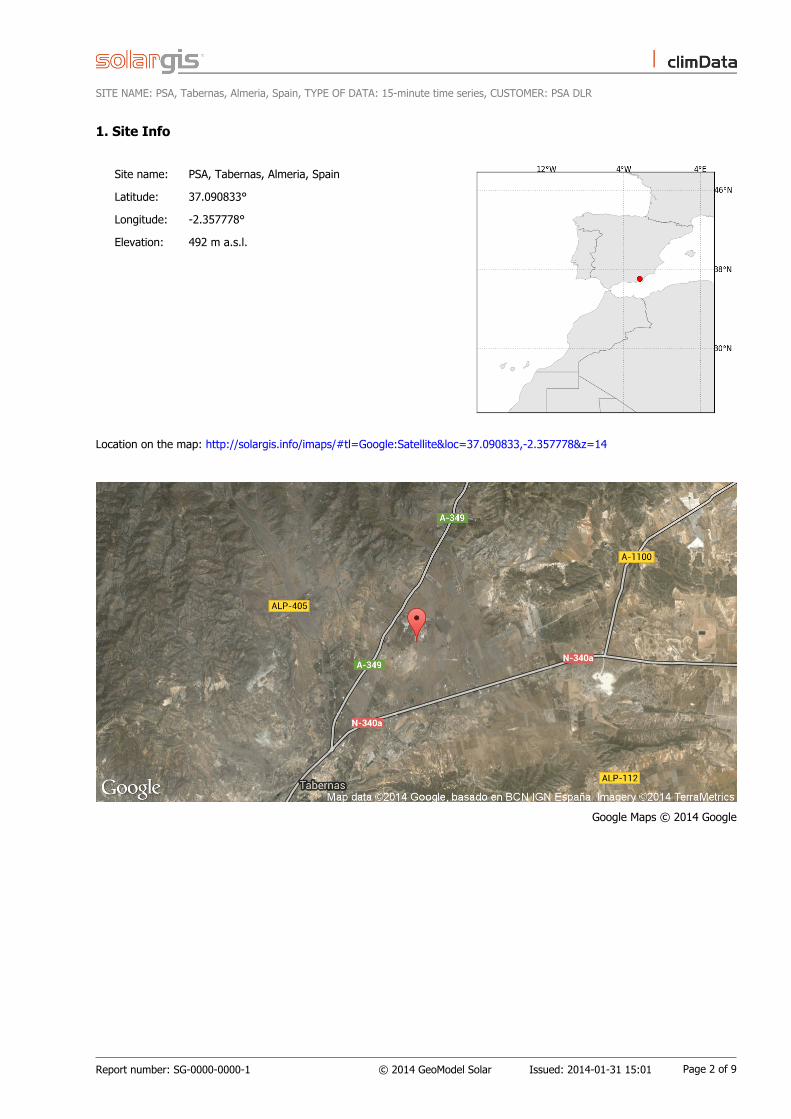
1. Site Info
Site name: PSA, Tabernas, Almeria, Spain
Latitude: 37.090833°
Longitude: -2.357778°
Elevation: 492 m a.s.l.
Location on the map: http://solargis.info/imaps/#tl=Google:Satellite&loc=37.090833,-2.357778&z=14
Google Maps © 2014 Google
Page 2 of 9

SITE NAME: PSA, Tabernas, Almeria, Spain, TYPE OF DATA: 15-minute time series, CUSTOMER: PSA DLR
Report number: SG-0000-0000-1 © 2014 GeoModel Solar Issued: 2014-01-31 15:01
2. Executive Summary
Long-term average yearly values calculated from complete calendar years (1994-2013):
Global Horizontal Irradiation 1871.9 kWh/m²
Direct Normal Irradiation 2093.4 kWh/m²
Diffuse Horizontal Irradiation 623.1 kWh/m²
Air Temperature at 2 m 16.6 °C
3. SolarGIS Database Description
Output from the climate database SolarGIS v1.9
Solar Resource
Description: Data calculated from Meteosat MSG and MFG satellite data (© 2014 EUMETSAT) and fromatmospheric data (© 2014 ECMWF and NOAA) by SolarGIS method
Spatial resolution: 250 m
Meteorological Data
Description: Spatially disaggregated from CFSR and GFS (© 2014 NOAA) by SolarGIS method
Spatial resolution: Temperature 1 km, other meteorological parameters 33 km to 55 km
4. Data Overview
Type of data: 15-minute time series
Period: 01/01/1994 - 31/12/2013 (701280 records)
Parameters:
Code Description Data in CSV file Overview in PDF file
GHI Global horizontal irradiance [W/m2]
DNI Direct normal irradiance [W/m2]
DIF Diffuse horizontal irradiance [W/m2]
flagR Cloud identification quality flag: 0: sun below horizon, 1: modelvalue, 2: interpolated 1hour, 5: long term monthly median orpersistence
SE Sun altitude angle [deg.]
SA Sun azimuth angle [deg.]
TEMP Air temperature at 2 m [deg. C]
RH Relative humidity [%]
WS Wind speed at 10 m [m/s]
WD Wind direction [deg.]
Page 3 of 9
SITE NAME: PSA, Tabernas, Almeria, Spain, TYPE OF DATA: 15-minute time series, CUSTOMER: PSA DLR
Report number: SG-0000-0000-1 © 2014 GeoModel Solar Issued: 2014-01-31 15:01
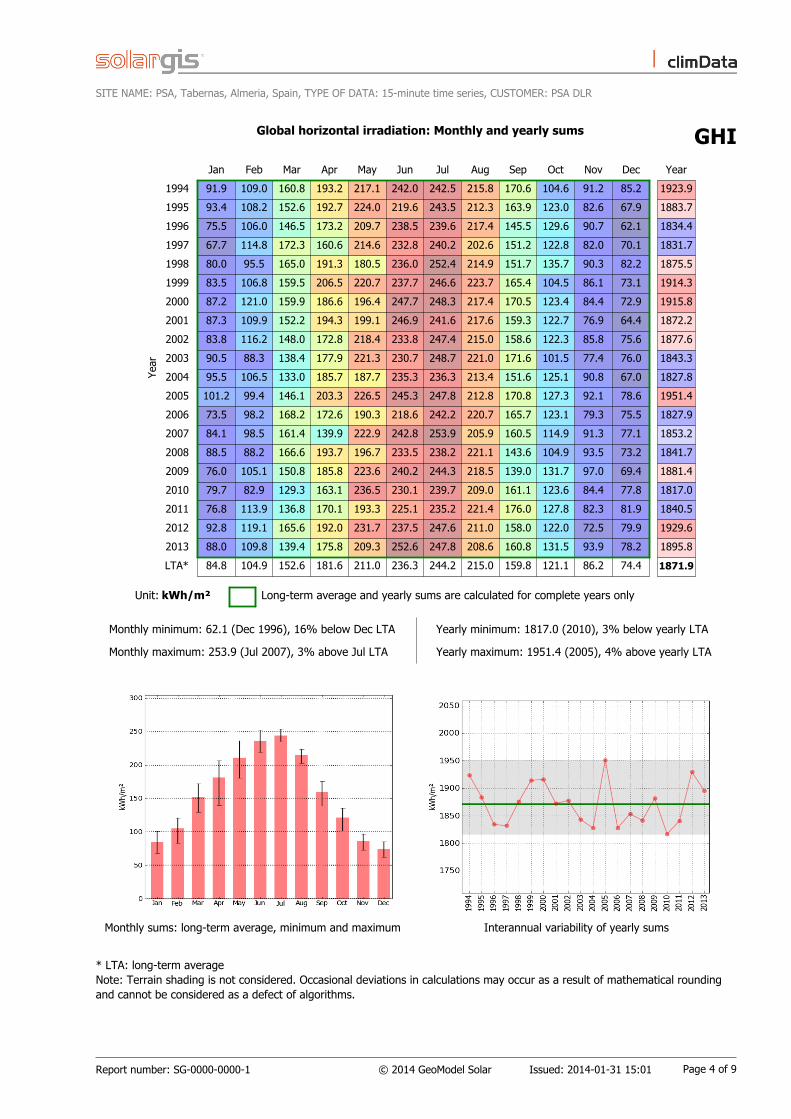
Global horizontal irradiation: Monthly and yearly sums GHIYe
ar
Jan Feb Mar Apr May Jun Jul Aug Sep Oct Nov Dec Year
1994 91.9 109.0 160.8 193.2 217.1 242.0 242.5 215.8 170.6 104.6 91.2 85.2 1923.9
1995 93.4 108.2 152.6 192.7 224.0 219.6 243.5 212.3 163.9 123.0 82.6 67.9 1883.7
1996 75.5 106.0 146.5 173.2 209.7 238.5 239.6 217.4 145.5 129.6 90.7 62.1 1834.4
1997 67.7 114.8 172.3 160.6 214.6 232.8 240.2 202.6 151.2 122.8 82.0 70.1 1831.7
1998 80.0 95.5 165.0 191.3 180.5 236.0 252.4 214.9 151.7 135.7 90.3 82.2 1875.5
1999 83.5 106.8 159.5 206.5 220.7 237.7 246.6 223.7 165.4 104.5 86.1 73.1 1914.3
2000 87.2 121.0 159.9 186.6 196.4 247.7 248.3 217.4 170.5 123.4 84.4 72.9 1915.8
2001 87.3 109.9 152.2 194.3 199.1 246.9 241.6 217.6 159.3 122.7 76.9 64.4 1872.2
2002 83.8 116.2 148.0 172.8 218.4 233.8 247.4 215.0 158.6 122.3 85.8 75.6 1877.6
2003 90.5 88.3 138.4 177.9 221.3 230.7 248.7 221.0 171.6 101.5 77.4 76.0 1843.3
2004 95.5 106.5 133.0 185.7 187.7 235.3 236.3 213.4 151.6 125.1 90.8 67.0 1827.8
2005 101.2 99.4 146.1 203.3 226.5 245.3 247.8 212.8 170.8 127.3 92.1 78.6 1951.4
2006 73.5 98.2 168.2 172.6 190.3 218.6 242.2 220.7 165.7 123.1 79.3 75.5 1827.9
2007 84.1 98.5 161.4 139.9 222.9 242.8 253.9 205.9 160.5 114.9 91.3 77.1 1853.2
2008 88.5 88.2 166.6 193.7 196.7 233.5 238.2 221.1 143.6 104.9 93.5 73.2 1841.7
2009 76.0 105.1 150.8 185.8 223.6 240.2 244.3 218.5 139.0 131.7 97.0 69.4 1881.4
2010 79.7 82.9 129.3 163.1 236.5 230.1 239.7 209.0 161.1 123.6 84.4 77.8 1817.0
2011 76.8 113.9 136.8 170.1 193.3 225.1 235.2 221.4 176.0 127.8 82.3 81.9 1840.5
2012 92.8 119.1 165.6 192.0 231.7 237.5 247.6 211.0 158.0 122.0 72.5 79.9 1929.6
2013 88.0 109.8 139.4 175.8 209.3 252.6 247.8 208.6 160.8 131.5 93.9 78.2 1895.8
LTA* 84.8 104.9 152.6 181.6 211.0 236.3 244.2 215.0 159.8 121.1 86.2 74.4 1871.9
Unit: kWh/m² Long-term average and yearly sums are calculated for complete years only
Monthly minimum: 62.1 (Dec 1996), 16% below Dec LTA Yearly minimum: 1817.0 (2010), 3% below yearly LTA
Monthly maximum: 253.9 (Jul 2007), 3% above Jul LTA Yearly maximum: 1951.4 (2005), 4% above yearly LTA
Monthly sums: long-term average, minimum and maximum Interannual variability of yearly sums
* LTA: long-term averageNote: Terrain shading is not considered. Occasional deviations in calculations may occur as a result of mathematical roundingand cannot be considered as a defect of algorithms.
Page 4 of 9

SITE NAME: PSA, Tabernas, Almeria, Spain, TYPE OF DATA: 15-minute time series, CUSTOMER: PSA DLR
Report number: SG-0000-0000-1 © 2014 GeoModel Solar Issued: 2014-01-31 15:01
Direct normal irradiation: Monthly and yearly sums DNIYe
ar
Jan Feb Mar Apr May Jun Jul Aug Sep Oct Nov Dec Year
1994 161.1 151.5 182.0 200.5 197.0 230.7 226.0 213.6 182.3 104.8 137.3 163.1 2149.9
1995 165.1 152.2 172.1 203.2 203.7 194.4 235.5 206.4 173.5 135.8 106.1 104.2 2052.3
1996 104.6 141.5 153.7 158.7 192.5 224.8 229.0 216.3 140.6 164.3 141.6 91.6 1959.0
1997 91.4 168.3 217.5 153.3 188.9 214.7 232.3 197.6 149.5 145.0 113.1 113.1 1984.6
1998 118.7 124.5 191.6 192.9 143.8 220.3 250.1 217.7 150.6 177.1 142.9 156.3 2086.5
1999 143.2 153.9 185.4 221.8 198.2 224.6 236.2 230.9 176.0 107.4 130.2 122.6 2130.5
2000 150.4 180.5 181.5 185.5 179.8 241.1 241.4 218.9 185.1 149.0 125.2 117.0 2155.2
2001 135.1 153.5 156.7 199.5 177.0 242.5 227.6 215.1 159.4 149.4 105.7 100.5 2022.1
2002 134.2 174.5 160.3 167.2 200.7 214.8 241.8 209.2 152.0 143.2 124.4 128.1 2050.4
2003 163.9 114.9 146.4 180.8 216.8 205.7 242.2 231.3 193.9 99.3 105.9 136.2 2037.3
2004 180.6 148.0 144.1 205.0 152.0 225.7 224.0 215.1 151.5 150.8 150.3 114.1 2061.3
2005 203.7 152.1 150.1 218.6 218.9 238.5 243.7 214.2 191.1 162.9 148.6 150.7 2293.2
2006 113.8 131.9 217.2 147.3 144.6 192.1 224.1 234.1 175.1 137.8 116.7 124.1 1958.9
2007 143.8 134.0 206.2 108.5 226.9 246.5 263.8 191.1 158.0 132.3 145.0 142.1 2098.2
2008 156.7 107.1 214.5 210.3 159.1 230.2 226.6 231.3 137.8 104.9 155.9 133.9 2068.2
2009 115.7 149.6 177.5 202.6 217.8 242.0 245.6 227.2 134.2 177.5 159.1 120.3 2169.1
2010 126.9 98.2 135.4 138.2 248.5 224.5 231.6 205.1 177.2 161.5 141.4 129.6 2017.9
2011 119.5 176.4 143.6 157.4 166.3 217.0 223.0 219.7 204.8 159.3 116.5 156.7 2060.3
2012 169.4 191.2 199.6 207.3 237.2 221.8 242.2 194.9 167.7 155.9 94.2 144.2 2225.8
2013 155.3 174.0 154.7 183.9 205.6 275.7 263.7 208.8 180.8 171.1 166.2 148.3 2287.9
LTA* 142.7 148.9 174.5 182.1 193.8 226.4 237.5 214.9 167.1 144.5 131.3 129.8 2093.4
Unit: kWh/m² Long-term average and yearly sums are calculated for complete years only
Monthly minimum: 91.4 (Jan 1997), 35% below Jan LTA Yearly minimum: 1958.9 (2006), 6% below yearly LTA
Monthly maximum: 275.7 (Jun 2013), 21% above Jun LTA Yearly maximum: 2293.2 (2005), 10% above yearly LTA
Monthly sums: long-term average, minimum and maximum Interannual variability of yearly sums
* LTA: long-term averageNote: Terrain shading is not considered. Occasional deviations in calculations may occur as a result of mathematical roundingand cannot be considered as a defect of algorithms.
Page 5 of 9

SITE NAME: PSA, Tabernas, Almeria, Spain, TYPE OF DATA: 15-minute time series, CUSTOMER: PSA DLR
Report number: SG-0000-0000-1 © 2014 GeoModel Solar Issued: 2014-01-31 15:01
Diffuse horizontal irradiation: Monthly and yearly sums DIFYe
ar
Jan Feb Mar Apr May Jun Jul Aug Sep Oct Nov Dec Year
1994 26.6 34.1 53.6 60.7 76.3 73.2 76.9 67.9 56.5 49.7 31.8 23.8 631.0
1995 26.7 35.0 51.3 60.2 78.1 76.7 72.9 70.1 57.8 51.9 37.0 28.3 645.9
1996 32.6 36.8 54.2 69.2 76.1 76.0 74.0 68.8 58.2 43.7 30.1 27.6 647.2
1997 30.9 32.3 48.3 60.4 79.2 76.4 74.2 68.4 58.6 46.6 33.7 26.5 635.7
1998 31.9 33.9 52.1 62.6 80.8 75.0 72.0 65.3 57.2 44.1 29.3 24.0 628.2
1999 26.3 32.7 51.5 60.0 77.7 75.3 75.3 64.4 56.5 47.2 30.3 27.1 624.2
2000 26.8 33.1 55.4 63.2 68.7 73.6 74.2 66.2 54.7 44.5 31.0 28.5 619.7
2001 31.9 35.6 59.5 60.8 75.7 71.5 77.3 69.0 58.4 44.9 31.9 26.6 642.9
2002 28.2 31.3 52.2 62.9 76.0 76.2 74.5 72.2 63.8 48.2 32.4 27.2 644.8
2003 24.0 33.2 52.4 60.6 70.1 80.4 74.4 63.3 52.4 48.1 31.8 24.7 615.3
2004 23.3 34.8 49.0 51.8 81.6 70.3 74.4 65.4 58.6 45.6 27.6 25.3 607.6
2005 21.4 28.4 57.6 58.9 72.3 72.4 73.2 68.1 54.8 43.2 29.6 22.6 602.6
2006 28.8 35.3 44.1 74.7 84.5 80.1 80.4 62.5 58.3 50.6 30.8 28.5 658.7
2007 28.0 34.1 45.6 68.8 68.2 66.7 66.8 75.7 61.8 45.1 29.8 24.3 614.7
2008 26.2 38.2 43.7 57.6 83.1 71.3 76.1 63.6 58.4 50.0 28.3 24.4 620.8
2009 29.1 33.4 49.2 56.8 73.5 67.2 69.7 65.5 57.8 41.5 29.3 24.8 597.7
2010 29.2 36.4 50.2 73.4 65.4 70.2 73.7 69.4 53.4 41.1 25.4 28.7 616.6
2011 29.7 30.7 53.6 67.0 77.4 70.6 77.4 71.0 50.7 44.6 32.5 23.6 628.8
2012 26.1 28.9 50.4 57.7 67.2 77.3 73.9 77.2 56.4 41.7 33.2 26.2 616.3
2013 27.2 29.0 50.6 57.8 67.7 57.6 62.7 67.0 51.1 43.3 25.5 24.6 564.1
LTA* 27.7 33.4 51.2 62.3 75.0 72.9 73.7 68.1 56.8 45.8 30.6 25.9 623.1
Unit: kWh/m² Long-term average and yearly sums are calculated for complete years only
Monthly minimum: 21.4 (Jan 2005), 22% below Jan LTA Yearly minimum: 564.1 (2013), 9% below yearly LTA
Monthly maximum: 84.5 (May 2006), 12% above May LTA Yearly maximum: 658.7 (2006), 6% above yearly LTA
Monthly sums: long-term average, minimum and maximum Interannual variability of yearly sums
* LTA: long-term averageNote: Terrain shading is not considered. Occasional deviations in calculations may occur as a result of mathematical roundingand cannot be considered as a defect of algorithms.
Page 6 of 9

SITE NAME: PSA, Tabernas, Almeria, Spain, TYPE OF DATA: 15-minute time series, CUSTOMER: PSA DLR
Report number: SG-0000-0000-1 © 2014 GeoModel Solar Issued: 2014-01-31 15:01
Average diurnal (24 hour) air temperature at 2 m TEMPYe
ar
Jan Feb Mar Apr May Jun Jul Aug Sep Oct Nov Dec Year
1994 8.9 9.9 12.8 13.9 19.2 22.2 27.6 27.3 20.5 16.8 14.0 10.8 17.0
1995 9.7 11.8 11.8 13.8 18.8 21.1 25.7 25.2 19.9 17.7 14.4 11.3 16.8
1996 10.2 8.2 10.7 14.1 16.7 21.6 24.4 24.1 19.5 16.2 12.5 10.1 15.7
1997 9.1 11.6 13.0 14.9 18.0 22.0 23.3 24.2 21.6 18.7 13.4 10.6 16.7
1998 9.7 10.4 13.2 14.1 16.5 22.6 25.9 25.3 22.3 16.5 12.9 8.7 16.5
1999 8.7 9.0 11.4 15.3 19.5 22.2 25.3 25.9 21.6 17.3 10.5 9.3 16.4
2000 6.9 11.9 12.3 13.6 18.5 22.5 25.0 25.4 21.6 16.2 11.7 10.4 16.3
2001 9.8 10.2 14.7 15.3 17.2 24.1 24.8 25.7 21.4 18.7 10.9 8.9 16.8
2002 9.1 11.1 12.2 13.7 17.6 23.1 24.2 23.8 21.3 17.6 13.5 10.9 16.5
2003 8.5 8.5 12.0 14.2 18.0 24.7 26.5 26.7 21.7 16.7 12.6 9.6 16.7
2004 10.5 10.0 11.3 13.1 15.4 23.4 24.8 26.0 22.8 18.5 11.6 9.2 16.4
2005 7.4 6.9 11.2 14.7 19.4 23.2 26.3 24.7 20.9 17.2 11.2 8.9 16.1
2006 7.2 8.6 13.1 15.8 19.4 22.0 26.3 24.4 22.0 18.9 13.8 9.1 16.8
2007 9.1 11.5 11.7 13.1 18.7 22.0 25.1 24.6 21.1 16.8 12.2 9.6 16.3
2008 10.1 10.3 13.1 14.9 17.1 21.5 25.4 25.3 21.1 16.8 10.5 8.1 16.2
2009 8.2 9.1 12.0 13.4 18.8 24.0 27.0 25.4 20.9 18.9 14.5 10.9 17.0
2010 9.1 9.7 10.6 14.1 17.2 21.3 25.8 25.5 21.5 16.5 11.5 9.4 16.0
2011 8.4 9.3 10.4 15.6 18.6 22.9 26.0 26.8 23.2 18.3 13.4 10.5 17.0
2012 9.1 6.8 11.4 14.1 19.8 25.3 26.2 28.5 22.4 18.4 12.8 10.9 17.2
2013 10.0 8.9 11.8 14.7 17.3 21.5 25.3 25.6 22.4 18.3 12.5 9.3 16.5
LTA* 9.0 9.7 12.0 14.3 18.1 22.6 25.5 25.5 21.5 17.5 12.5 9.8 16.6
Unit: °C Long-term average and yearly averages are calculated for complete years only
Monthly minimum: 6.8 (Feb 2012), 2.8 below Feb LTA Yearly minimum: 15.7 (1996), 0.9 below yearly LTA
Monthly maximum: 28.5 (Aug 2012), 2.9 above Aug LTA Yearly maximum: 17.2 (2012), 0.6 above yearly LTA
Monthly long-term average, minimum and maximum Interannual variability of yearly averages
* LTA: long-term averageNote: Occasional deviations in calculations may occur as a result of mathematical rounding and cannot be considered as adefect of algorithms.
Page 7 of 9

SITE NAME: PSA, Tabernas, Almeria, Spain, TYPE OF DATA: 15-minute time series, CUSTOMER: PSA DLR
Report number: SG-0000-0000-1 © 2014 GeoModel Solar Issued: 2014-01-31 15:01
5. SolarGIS climData License Agreement
This License Agreement is between GeoModel Solar s.r.o. (referred to as "GeoModel Solar") and the Customer. Bypurchasing SolarGIS climData (referred to as "climData") related to this SolarGIS® Report you as the Customer agree to bebound by the following Terms and Conditions.
Protection of Proprietary Rights
Customer acknowledges that it obtains only the right to use the climData consistent with this License Agreement and thatno right, title or interest in or to any copyrights, trademarks, or other proprietary rights relating to climData is transferredfrom GeoModel Solar to Customer.
Terms and Conditions
1. GeoModel Solar grants to Customer limited non-exclusive and non-transferable license to use climData within the entity itrepresents.
2. Customer shall not copy the whole or parts of the SolarGIS climData database.
3. The climData shall be used only by Customer for its own personal or internal business use and not for public distribution.No part of this restriction should be construed to disallow the acquiring climData as service for Customer’s partners andclients ("end users") as long as the source "SolarGIS climData © 2014 GeoModel Solar" is referenced.
4. Customer may use only the climData or subset thereof for which it has paid the required license. The license to useclimData is granted for an unlimited period of time provided that all applicable copyright notices and files(s) are maintainedwith climData or part thereof.
5. Sublicensing is possible provided previous written consent from GeoModel Solar. Customer shall ensure that sublicenseecomplies with all terms and conditions of this License Agreement and shall assume all responsibilities for any breach of anyterms and conditions of this License Agreement by sublicensee. Sublicensee shall not be entitled to grant further sublicense.
6. Customer shall not publish, transmit or communicate any competitive comparison, analysis or "benchmarking" of theclimData without the prior written consent of GeoModel Solar. Published or posted analysis based in whole or in part onclimData must reference "SolarGIS climData © 2014 GeoModel Solar" as part of the final work.
7. Considering the nature of climate fluctuations, interannual and long-term changes as well as the uncertainty ofmeasurements and applied methods, Customer acknowledges that GeoModel Solar cannot give any warranty on theaccuracy of the data. GeoModel Solar has done its utmost to make an assessment of climate conditions based on the bestavailable data, software and knowledge.
8. GeoModel Solar shall in no way whatsoever be liable for results related to the use of the climData by the Customer.
9. Customer shall indemnify, defend and hold harmless GeoModel Solar, its officers, employees and agents from and againstany and all claims, actions, damages or injuries of any kind and nature arising out of any cause or event which isattributable to its use of climData.
10. Any conflict between the terms of this License Agreement and any other form of agreement or terms shall be resolvedin favor of the terms expressed in this License Agreement and in accordance with the laws of the Slovak Republic. In theevent any of the provisions on this License Agreement are held by a court or other tribunal of competent jurisdiction to beunenforceable, such provisions shall be eliminated or limited to the minimum extent necessary so this agreement shallotherwise remain in full force and effect.
11. This License Agreement constitutes the entire agreement between the Parties regarding the subject matter herein.
Page 8 of 9

SITE NAME: PSA, Tabernas, Almeria, Spain, TYPE OF DATA: 15-minute time series, CUSTOMER: PSA DLR
Report number: SG-0000-0000-1 © 2014 GeoModel Solar Issued: 2014-01-31 15:01
6. Data Uncertainty
Solar Resource
Quality of SolarGIS data is determined by underlying models, spatial and time resolution of atmospheric and meteorologicalinputs and their accuracy. SolarGIS has been tested by 100+ ground measurements worldwide, and the modeldemonstrates stable performance within the margins of uncertainty described below.
Typical uncertainty of GHI yearly summaries is within the range of ±4% (considering 80% probability of occurrence). Intropical rain climate, high-reflectance deserts, mountains, complex coastal zones, high latitudes, snow, and regions withhigh and changing concentrations of atmospheric aerosols, the uncertainty as high as ±7% has been observed.
Uncertainty of DNI yearly summaries typically stays within the range of ±8%. In more complex geographies it can be ashigh as ±12%, especially in regions with high and dynamically changing concentrations of atmospheric aerosols, in humidtropical regions, high latitudes, mountains, snow regions, complex deserts with occasional occurrence of snow and water,urbanized and industrialized areas. Maximum DNI deviations up to ±15% from the ground measurements have beensporadically observed.
Higher uncertainty is also assumed in regions with limited availability of high-quality ground measurements.
Meteorological Data
Meteorological parameters are derived from the numerical weather models CFSR and GFS. Compared to solar resource data,they have lower spatial and temporal resolution, and lower accuracy. They characterize wider geographic region rather thana specific site. Especially relative humidity, wind speed and wind direction values have higher uncertainty, they may notaccurately characterize the local microclimate and should be used with caution.
More about SolarGIS models, the underlying algorithms, input data and uncertainty can be consulted at:http://solargis.info/doc/methods
7. Service Provider
GeoModel Solar s.r.o., M. Marecka 3, 84107 Bratislava, SlovakiaCompany ID: 45 354 766, VAT Number: SK2022962766Registration: Business register, District Court Bratislava I, Section Sro, File 62765/BTel: +421 2 492 12 491http://geomodelsolar.eu, http://solargis.info, [email protected]
SolarGIS®
is a trade mark of GeoModel Solar.
This document is electronically signed by GeoModel Solar. The authenticity of this report can be verified here:http://solargis.info/doc/120
Page 9 of 9