solaris consortium final project report high-early
TRANSCRIPT

SOLARIS Consortium
Final Project Report
High-Early-Strength High-Performance Concrete for Rapid
Pavement Repair
Prepared by:
Nader Ghafoori, Ph.D., P.E.
Meysam Najimi, Ph.D.
Matthew Maler, MS Student
Department of Civil and Environmental Engineering and Construction University of Nevada Las Vegas
4505 Maryland Parkway Box 454015
Las Vegas, Nevada 89154-4015

I
Final Report January 16, 2017 TITLE High-Early-Strength High-Performance Concrete for Rapid Pavement Repair SOLARIS Consortium, Tier 1 University Transportation Center Center for Advanced Transportation Education and Research Department of Civil and Environmental Engineering University of Nevada, Reno Reno, NV 89557
Nader Ghafoori, Ph.D., P.E. Professor of Civil Engineering Department of Civil and Environmental Engineering and Construction University of Nevada Las Vegas 4505 Maryland Parkway- Box 454015 Las Vegas, Nevada 89154-4015 Phone: (702)895-2531 Fax: (702) 895-3936 E- mail: [email protected]

II
DISCLAIMER:
The contents of this report reflect the views of the authors, who are responsible for the facts and accuracy of the information presented herein. This document is disseminated under the sponsorship of the U.S. Department of Transportation’s University Transportation Centers Program, in the interest of information exchange. The U.S. Government assumes no liability for the contents or use thereof.

III
Table of Contents
List of Tables ............................................................................................................................................................ VIII List of Figures ..............................................................................................................................................................XI
Chapter 1 Introduction, Economic Impacts, National Survey, and Literature Review . 1
1.1 Introduction ............................................................................................................................................................ 1 1.2 Economic Impacts ............................................................................................................................................... 2 1.3 Background ............................................................................................................................................................ 4
1.3.1 National Survey ........................................................................................................................................... 5 1.3.2 Literature Review ....................................................................................................................................... 8
1.4 Cement Types in HES Concrete ................................................................................................................. 17 1.4.1 Portland Cement....................................................................................................................................... 17 1.4.2 Proprietary Rapid Setting Cements .................................................................................................. 19
1.5 Typical HES Concrete Production Cost ................................................................................................ 20
Chapter 2 Materials, Mixture Design, Curing, and Testing Methods .............................. 22
2.1 Materials ................................................................................................................................................................ 22 2.1.1 Laboratory Temperature and Humidity .......................................................................................... 22 2.1.2 Water............................................................................................................................................................. 22 2.1.3 Fine Aggregate ......................................................................................................................................... 23 2.1.4 Coarse Aggregate .................................................................................................................................... 24 2.1.5 Cement Types ........................................................................................................................................... 25 2.1.6 Admixtures ................................................................................................................................................. 25
2.2 Batch Design ....................................................................................................................................................... 26 2.3 Curing Methods ................................................................................................................................................. 26
2.3.1 Opening Time Curing ............................................................................................................................ 26 2.3.2 24-Hour Curing ........................................................................................................................................ 29 2.3.3 28-Day Moist Curing ............................................................................................................................. 29
2.4 Testing Equipment & Methods ................................................................................................................... 30 2.4.1 Mixing .......................................................................................................................................................... 30
2.4.1.1 Mixer ....................................................................................................................................................... 30 2.4.1.2 Mixing Time and Procedure .............................................................................................................. 30 2.4.1.3 Consolidation ........................................................................................................................................ 31
2.4.2 Fresh Properties of HES Concretes .................................................................................................. 32 2.4.2.1 Workability ............................................................................................................................................ 32

IV
2.4.2.2 Setting Times ........................................................................................................................................ 32 2.4.2.3 Air Content and Unit Weight ............................................................................................................ 33 2.4.2.4 Heat of Hydration ................................................................................................................................ 34
2.4.3 Hardened Properties of HES Concretes ......................................................................................... 35 2.4.3.1 Mechanical Properties......................................................................................................................... 35
2.4.3.1.1 Compression Test ........................................................................................................................ 35 2.4.3.1.2 Bending Test ................................................................................................................................. 36
2.4.3.2 Volumetric Change Properties .......................................................................................................... 36 2.4.3.2.1 Drying Shrinkage ........................................................................................................................ 36
2.4.3.3 Transport Properties ............................................................................................................................ 38 2.4.3.3.1 Absorption .................................................................................................................................... 38 2.4.3.3.2 Water Permeability ..................................................................................................................... 40 2.4.3.3.3 Rapid Chloride penetration Test ............................................................................................. 40 2.4.3.3.4 Rapid Migration Test ................................................................................................................. 42 2.4.3.3.5 Corrosion ...................................................................................................................................... 42
2.4.3.4 Durability Properties ........................................................................................................................... 46 2.4.3.4.1 Abrasion Resistance ................................................................................................................... 46 2.4.3.4.2 Resistance to Freezing and Thawing ..................................................................................... 48
2.5 Summary of Experimental Program ..................................................................................................... 51
Chapter 3 Fresh Properties of HES Concretes ............................................................................ 52
3.1 Required HRWR to Maintain Uniform Workability ...................................................................... 52 3.2 Workability .......................................................................................................................................................... 53 3.3 Setting .................................................................................................................................................................... 54 3.4 Air Content and Unit Weight ....................................................................................................................... 57 3.5 Heat of Hydration ............................................................................................................................................. 57
3.5.1 Opening Time Heat of Hydration ..................................................................................................... 59 3.5.2 Maximum Heat of Hydration ............................................................................................................. 62
Chapter 4 Hardened Properties of HES Type V Portland Cement Concretes ................ 67
4.1. Introduction ......................................................................................................................................................... 67 4.2. Results and Discussion ................................................................................................................................... 68
4.2.1. Compressive Strength ............................................................................................................................ 68 4.2.1.1. Effects of Cement Content................................................................................................................. 70 4.2.1.2. Effects of Accelerator Dosage .......................................................................................................... 72 4.2.1.3. Effects of Air-Entraining Admixture .............................................................................................. 73
V
4.2.1.4. Effects of Hot Water Usage ............................................................................................................... 74 4.2.1.5. Effects of Curing Age ......................................................................................................................... 75
4.2.2. Flexural Strength ..................................................................................................................................... 75 4.2.3. Absorption and Volume of Permeable Voids .............................................................................. 77
4.2.3.1. Effects of Cement Content................................................................................................................. 79 4.2.3.2. Effects of Accelerator Dosage .......................................................................................................... 81 4.2.3.3. Effects of Air-Entraining Admixture .............................................................................................. 81 4.2.3.4. Effects of Hot Water Usage ............................................................................................................... 82 4.2.3.5. Effects of Curing Age ......................................................................................................................... 82
4.2.4. Rapid Chloride Penetration Test ....................................................................................................... 83 4.2.4.1. Effects of Cement Content................................................................................................................. 84 4.2.4.2. Effects of Accelerator Dosage .......................................................................................................... 85 4.2.4.3. Effects of Air-Entraining Admixture .............................................................................................. 85 4.2.4.4. Effects of Hot Water Usage ............................................................................................................... 86 4.2.4.5. Effects of Curing Age ......................................................................................................................... 86
4.2.5. Rapid Chloride Migration Test .......................................................................................................... 86 4.2.5.1. Effects of Cement Content................................................................................................................. 88 4.2.5.2. Effects of Accelerator Dosage .......................................................................................................... 89 4.2.5.3. Effects of Air-Entraining Admixture .............................................................................................. 89 4.2.5.4. Effects of Curing Age ......................................................................................................................... 90
4.2.6. Water Permeability ................................................................................................................................. 90 4.2.7. Drying Shrinkage..................................................................................................................................... 92
4.2.7.1. Effects of Cement Content................................................................................................................. 92 4.2.7.2. Effects of Accelerator Dosage .......................................................................................................... 95 4.2.7.3. Effects of Hot Water Usage ............................................................................................................... 96 4.2.7.4. Effects of Curing Age ......................................................................................................................... 96 4.2.7.5. Comparison with NDOT Specification .......................................................................................... 96
4.2.8. Corrosion Resistance.............................................................................................................................. 97 4.2.9. Frost Resistance ....................................................................................................................................... 99 4.2.10. Abrasion .................................................................................................................................................. 102
Chapter 5 Hardened Properties of HES Type III Portland Cement Concretes ............. 104
5.1. Introduction ....................................................................................................................................................... 104 5.2. Results and Discussion ................................................................................................................................. 105
5.2.1. Compressive Strength .......................................................................................................................... 105 5.2.1.1. Effects of Cement Content.............................................................................................................. 105

VI
5.2.1.2. Effects of Air-Entraining Admixture ........................................................................................... 108 5.2.1.3. Effects of Curing Age ...................................................................................................................... 109
5.2.2. Flexural Strength ................................................................................................................................... 109 5.2.3. Absorption and Volume of Permeable Voids ............................................................................ 111
5.2.3.1. Effects of Cement Content.............................................................................................................. 112 5.2.3.2. Effects of Air-Entraining Admixture ........................................................................................... 114 5.2.3.3. Effects of Curing Age ...................................................................................................................... 114
5.2.4. Rapid Chloride Penetration Test ..................................................................................................... 114 5.2.4.1. Effects of Cement Content.............................................................................................................. 116 5.2.4.2. Effects of Air-Entraining Admixture ........................................................................................... 116 5.2.4.3. Effects of Curing Age ...................................................................................................................... 117
5.2.5. Rapid Chloride Migration Test ........................................................................................................ 117 5.2.5.1. Effects of Cement Content.............................................................................................................. 118 5.2.5.2. Effects of Air-Entraining Admixture ........................................................................................... 119 5.2.5.3. Effects of Curing Age ...................................................................................................................... 119
5.2.6. Water Permeability ............................................................................................................................... 120 5.2.7. Drying Shrinkage................................................................................................................................... 121
5.2.7.1. Effects of Cement Content.............................................................................................................. 122 5.2.7.2. Effects of Curing Age ...................................................................................................................... 123 5.2.7.3. Comparison with NDOT Specification ....................................................................................... 124
5.2.8. Corrosion Resistance............................................................................................................................ 125 5.2.9. Frost Resistance ..................................................................................................................................... 127 5.2.10. Abrasion .................................................................................................................................................. 129
Chapter 6 Hardened Properties of HES Rapid Set Cement Concretes ............................ 131
6.1. Introduction ....................................................................................................................................................... 131 6.2. Results and Discussion ................................................................................................................................. 132
6.2.1. Compressive Strength .......................................................................................................................... 132 6.2.1.1. Effects of Cement Content.............................................................................................................. 132 6.2.1.2. Effects of Air-Entraining Admixture ........................................................................................... 135 6.2.1.3. Effects of Curing Age ...................................................................................................................... 135
6.2.2. Flexural Strength ................................................................................................................................... 136 6.2.3. Absorption and Volume of Permeable Voids ............................................................................ 137
6.2.3.1. Effects of Cement Content.............................................................................................................. 138 6.2.3.2. Effects of Air-Entraining Admixture ........................................................................................... 140 6.2.3.3. Effects of Curing Age ...................................................................................................................... 140

VII
6.2.4. Rapid Chloride Penetration Test ..................................................................................................... 140 6.2.4.1. Effects of Cement Content.............................................................................................................. 142 6.2.4.2. Effects of Air-Entraining Admixture ........................................................................................... 142 6.2.4.3. Effects of Curing Age ...................................................................................................................... 142
6.2.5. Rapid Chloride Migration Test ........................................................................................................ 143 6.2.6. Water Permeability ............................................................................................................................... 144 6.2.7. Drying Shrinkage................................................................................................................................... 145
6.2.7.1. Effects of Cement Content.............................................................................................................. 146 6.2.7.2. Effects of Curing Age ...................................................................................................................... 148 6.2.7.3. Comparison with NDOT Specification ....................................................................................... 149
6.2.8. Corrosion Resistance............................................................................................................................ 149 6.2.9. Frost Resistance ..................................................................................................................................... 150 6.2.10. Abrasion .................................................................................................................................................. 153
6.3. Concluding Remark ....................................................................................................................................... 154
Chapter 7 Comparison of HES Concretes ................................................................................. 155
7.1. Introduction ....................................................................................................................................................... 155 7.2. Properties ............................................................................................................................................................ 157
7.2.1. Compressive strength ........................................................................................................................... 157 7.2.2. Flexural strength .................................................................................................................................... 159 7.2.3. Absorption and Volume of Permeable Voids ............................................................................ 160 7.2.4. Rapid Chloride Penetration Test ..................................................................................................... 162 7.2.5. Rapid Chloride Migration Test ........................................................................................................ 163 7.2.6. Water Permeability ............................................................................................................................... 165 7.2.7. Drying Shrinkage................................................................................................................................... 166 7.2.8. Corrosion Resistance............................................................................................................................ 167 7.2.9. Frost Resistance ..................................................................................................................................... 168 7.2.10. Abrasion .................................................................................................................................................. 170
7.3. Concluding Remarks ..................................................................................................................................... 171
References ..................................................................................................................................................... 173
Appendix A ................................................................................................................................................. 177

VIII
List of Tables
Table 1-1: America’s ASCE Infrastructure Report Card grades 1998-2013 (ASCE, 1998,
2001,2005,2009, 2013) ....................................................................................................................... 3
Table 1-2: Literature Review - Projects Table 1 of 3 ........................................................................ 9
Table 1-3: Literature Review - Projects Table 2 of 3 ..................................................................... 10
Table 1-4:Literature Review - Projects Table 3 of 3 ...................................................................... 11
Table 1-5: Literature Review - Laboratory Research Table 1 of 5 ........................................... 12
Table 1-6: Literature Review - Laboratory Research Table 2 of 5 ........................................... 13
Table 1-7: Literature Review - Laboratory Research Table 3 of 5 ........................................... 14
Table 1-8: Literature Review - Laboratory Research Table 4 of 5 ........................................... 15
Table 1-9: literature Review - Laboratory Research Table 5 of 5 ............................................. 16
Table 1-10: Cement Composition at a glance ................................................................................... 18
Table 1-11: Literature Review - Project Cost .................................................................................. 21
Table 2-1: Size Gradation of Coarse Aggregate ........................................................................... 25
Table 2-2: Concrete Constituents and Proportioning Using Metric Units ............................ 27
Table 2-3: Concrete Constituents and Proportions Using British Units ................................ 28
Table 2-4: Experimental Program ........................................................................................................ 51
Table 3-1: Water-to-Cement Ratio, HRWR Used, and Resulting Slump ............................. 54
Table 3-2: Initial and Final Setting Times for Type III and Type V Cement Concretes . 56
Table 3-3: Results for Unit Weight, Amount of Air-Entrainment Used, Change in
HRWR, and Resulting Air Content ............................................................................................. 58
Table 3-4: Heat of Hydration at Opening Time and Maximum Heat of Hydration
Including Elapsed Time ................................................................................................................... 61
Table 4-1: Compressive Strength of Type V-HES Concretes (psi) .......................................... 69
Table 4-2: Opening Time of Type V-HES Concretes and Range of Compressive
Strengths at Opening Time ............................................................................................................. 69
Table 4-3: Flexural Strength of Type V-HES Concrete ............................................................... 76
Table 4-4: Results of Absorption Test for Type V-HES Concretes Containing 2%
Accelerator ............................................................................................................................................ 78
Table 4-5: Results of Absorption Test for Type V-HES Concretes containing 2.8%
Accelerator ............................................................................................................................................ 79
IX
Table 4-6: Passing Charges of Type V-HES Concretes ............................................................... 84
Table 4-7: Chloride Penetration Depth of Type V-HES Concretes ......................................... 87
Table 4-8: Water Penetration Depth of Type V-HES Concretes .............................................. 92
Table 4-9: Time to Failure for Type V-HES Concretes in Corrosion Test ........................... 98
Table 4-10: Abrasion Depth of Type V-HES Concretes ...........................................................103
Table 5-1: Compressive Strength of Type III-HES Concretes (psi)......................................106
Table 5-2: Opening Time of Type III-HES Concretes and Range of Compressive
Strengths at Opening Times .........................................................................................................107
Table 5-3: Flexural Strength of Type III-HES Concretes .........................................................110
Table 5-4: Results of Absorption Test for Type III-HES Concretes .....................................112
Table 5-5: Passing Charge of Type III-HES Concretes .............................................................115
Table 5-6: Chloride Penetration Depth of Type III-HES Concretes .....................................117
Table 5-7: Water Penetration Depth of Type III-HES Concretes ...........................................120
Table 5-8: Time to Failure of Type III-HES Concretes in Corrosion Test .........................126
Table 5-9: Abrasion Depth of Type III-HES Concretes.............................................................130
Table 6-1: Compressive Strength of Rapid Set HES Concretes (psi) ...................................133
Table 6-2: Opening Time of Rapid Set HES Concretes and Range of Compressive
Strengths at Opening Times .........................................................................................................133
Table 6-3: Flexural Strength of Rapid Set HES Concretes .......................................................136
Table 6-4: Results of Absorption for Rapid Set HES Concretes ............................................138
Table 6-5: Passing Charge of Rapid Set HES Concretes ...........................................................141
Table 6-6: Water Penetration Depth of Rapid Set HES Concretes ........................................144
Table 6-7: Time to Failure of Rapid Set HES Concretes in Corrosion Test ......................149
Table 6-8: Abrasion Depth of Rapid Set HES Concretes ..........................................................153
Table 7-1: Key Elements of Mixture Design, Fresh Properties, and Opening Time of the
Selected HES Concretes ................................................................................................................156
Table 7-2: Results of Absorption Test for the Selected HES Concretes..............................161
Table 7-3: Ultimate Mass Loss of the Selected HES Concretes Subjected to 25 Freezing
and Thawing Cycles ........................................................................................................................169
Table 7-4: Ranking of the Selected HES Concretes for Different Properties ....................172

X
Table A- 1: Survey Responses for Massachusetts, Kentucky, Nebraska, and Florida ...179
Table A- 2: Survey Responses for Massachusetts, Kentucky, Nebraska, and Florida ...180
Table A- 3: Survey Responses for Alabama, Arkansas, Indiana, and California .............181
Table A- 4: Survey Responses for Alabama, Arkansas, Indiana, and California .............182
Table A- 5: Survey Responses for Kansas, Louisiana, Connecticut, and Illinois ............183
Table A- 6: Survey Responses for Kansas, Louisiana, Connecticut, and Illinois ............184
Table A- 7: Survey Responses for Iowa, Hawaii, Virginia, and Arizona............................185
Table A- 8: Survey Responses for Iowa, Hawaii, Virginia, and Arizona............................186
Table A- 9: Survey Responses for Idaho and Vermont ...............................................................187
Table A- 10: Survey Responses for Idaho and Vermont ...........................................................188

XI
List of Figures
Figure 1-1: Spending for America’s Infrastructure 1945-2014 (CBPP.org) ........................... 4
Figure 1-2: U.S. Map Showing Cements Used by State. (Information Via Survey.) .......... 7
Figure 2-1: Sieve Analysis for the Fine Aggregate ..................................................................... 23
Figure 2-2: Rotating Pan Mixer ............................................................................................................. 31
Figure 2-3: Mechanical Consolidation Table ................................................................................... 32
Figure 2-4: (Left) Abrams Slump Cone; (Right) Acme Penetrometer ................................... 33
Figure 2-5: Air Content Meter - Pressure Type ............................................................................... 34
Figure 2-6: Heat of Hydration Set-Up ................................................................................................ 35
Figure 2-7: Compression Loading Machine .................................................................................. 37
Figure 2-8: Flexure Schematic for 4-Point Loading (a.k.a. 1/3 Point Loading) ................. 37
Figure 2-9: Dry Shrinkage Length Indicator .................................................................................... 38
Figure 2-10: Absorption Equipment; Oven, Boiling Pot, and Balance with Buoyancy
Basket ..................................................................................................................................................... 39
Figure 2-11: Water Permeability Test Apparatus ........................................................................... 41
Figure 2-12: RCPT Set-Up and Schematic ....................................................................................... 43
Figure 2-13: RMT Set-Up and Schematic ......................................................................................... 44
Figure 2-14: Corrosion Set-Up and Schematic ................................................................................ 45
Figure 2-15: Abrasion Resistance Testing Machine ...................................................................... 47
Figure 2-16: Typical Trend for the Cooling of the Freeze/Thaw Samples ........................... 49
Figure 2-17: Cooler Used for Pre-Cooling of Freeze/Thaw Samples ..................................... 50
Figure 2-18: Freezer Used to Freeze the Freeze/Thaw Samples ............................................... 50
Figure 3-1: Initial and Final Setting Times for Type III and Type V ..................................... 56
Figure 3-2: Air Content of Rapid Set concrete as a Function of Air-Entraining
Admixture, Cement Factor 650 lb/yd3 ....................................................................................... 59
Figure 3-3: Heat of Hydration at Opening Time ............................................................................. 64
Figure 3-4: Typical Heat of Hydration Trends for Non-Air-Entrained HES Concretes
(650 lb/yd3) ........................................................................................................................................... 65
Figure 3-5: Typical Heat of Hydration Trend for Air-Entrained HES Concretes
(650 lb/yd3) ........................................................................................................................................... 65

XII
Figure 3-6: Maximum Heat of Hydration Temperature ............................................................... 66
Figure 4-1: Opening Time of Type V-HES Concretes ................................................................. 71
Figure 4-2: Compressive Strength of Type V-HES Concretes at 24 Hrs and 28 Days .... 72
Figure 4-3: Flexural Strength of Type V-HES Concretes ........................................................... 77
Figure 4-4: Absorption and Volume of Permeable Void for Type V-HES Concretes ..... 80
Figure 4-5: Passing Charges of Type V-HES Concretes ............................................................. 83
Figure 4-6: Chloride Penetration Depth of Type V-HES Concretes ....................................... 88
Figure 4-7: Water Penetration Depth of Type V-HES Concretes ........................................ 91
Figure 4-8: Drying Shrinkage of Type V-HES Concretes Transferred to Shrinkage Room
at Opening Time ................................................................................................................................. 93
Figure 4-9: Drying Shrinkage of Type V-HES Concretes Transferred to Shrinkage Room
at the Age of 24 Hrs .......................................................................................................................... 94
Figure 4-10: Drying Shrinkage of Type V-HES Concretes Transferred to Shrinkage
Room at the Age of 28 Days .......................................................................................................... 94
Figure 4-11: The Ultimate Shrinkage (1-Year) of Type V-HES Concretes ......................... 95
Figure 4-12: Drying Shrinkage of Type V-HES Concretes After 28 Days in Shrinkage
Room ....................................................................................................................................................... 97
Figure 4-13: Time to Failure for Type V-HES Concretes in Corrosion Test....................... 99
Figure 4-14: Mass Loss of Type V-HES Concretes Tested at the Age of 24 Hrs ............101
Figure 4-15: Mass Loss of Type V-HES Concretes Tested at the Age of 28 Days .........101
Figure 4-16: Ultimate Mass Loss of Type V-HES Concretes Subjected to 25 Freezing
and Thawing Cycles ........................................................................................................................102
Figure 5-1: Opening Time of Type III-HES Concrete ................................................................107
Figure 5-2: Compressive Strength of Type III-HES Concretes at 24 Hrs and 28 Days.108
Figure 5-3: Flexural Strength of Type III-HES Concretes ........................................................111
Figure 5-4: Absorption and Volume of Permeable Voids of Type III-HES Concretes .113
Figure 5-5: Passing Charge of Type III-HES Concretes ............................................................115
Figure 5-6: Chloride Penetration Depth of Type III-HES Concretes ....................................118
Figure 5-7: Water Penetration Depth of Type III-HES Concretes .........................................121
Figure 5-8: Drying Shrinkage of Type III-HES Concretes Transferred to Shrinkage
Room at Opening Time ..................................................................................................................122

XIII
Figure 5-9: Drying Shrinkage of Type III-HES Concretes Transferred to Shrinkage
Room at the Age of 24 Hrs ...........................................................................................................123
Figure 5-10: Drying Shrinkage of Type III-HES Concretes Transferred to Shrinkage
Room at the Age of 28 Days ........................................................................................................124
Figure 5-11: The Drying Shrinkage of Type III-HES Concretes After 28 Days and 7.5
Months in Shrinkage Room ..........................................................................................................125
Figure 5-12: Failure Time of Type III-HES Concretes in Corrosion Test ..........................126
Figure 5-13: Mass Loss of Type III-HES Concretes tested at the Age of 24 Hrs ............128
Figure 5-14: Mass Loss of Type III-HES Concretes tested at the Age of 28 Days ..........128
Figure 5-15: Ultimate Mass Loss of Type III-HES Concretes Subjected to 25 Freezing
and Thawing Cycles ........................................................................................................................129
Figure 5-16: Abrasion Depth of Type III-HES Concretes ........................................................130
Figure 6-1: Opening Time of Rapid Set HES Concretes ...........................................................134
Figure 6-2: Compressive Strength Rapid Set HES Concretes at 24 Hrs and 28 Days ...134
Figure 6-3: Flexural Strength of Rapid Set HES Concretes .....................................................137
Figure 6-4: Absorption and Volume of Permeable Voids Rapid Set HES Concretes ....139
Figure 6-5: Passing Charge of Rapid Set HES Concretes .........................................................141
Figure 6-6: Rapid Set HES Concrete Samples Subjected to Rapid Chloride Migration
Test (After Spraying Silver Nitrate) ..........................................................................................143
Figure 6-7: Water Penetration Depth of Rapid Set HES Concretes .......................................145
Figure 6-8: Drying Shrinkage of Rapid Set HES Concretes Transferred to Shrinkage
Room at Opening Time ..................................................................................................................146
Figure 6-9: Drying Shrinkage of Rapid Set HES Concretes Transferred to Shrinkage
Room at the Age of 24 Hrs ...........................................................................................................147
Figure 6-10: Drying Shrinkage of Rapid Set HES Concretes Transferred to Shrinkage
Room at the Age of 28 Days ........................................................................................................147
Figure 6-11: The Drying Shrinkage of Rapid Set HES Concretes After 28 Days and 7.5
Months in Shrinkage Room ..........................................................................................................148
Figure 6-12: Time to Failure of Rapid Set HES Concretes in Corrosion Test ..................150
Figure 6-13: Mass Loss of Rapid Set HES Concretes Tested at the Age of 24 Hrs ........151
Figure 6-14: Mass Loss of Rapid Set HES Concretes Tested at the Age of 28 Days .....152
XIV
Figure 6-15: Ultimate Mass Loss of Rapid Set HES Concretes Subjected to 25 Freezing
and Thawing Cycles ........................................................................................................................152
Figure 6-16: Abrasion Depth of Rapid Set HES Concretes ......................................................154
Figure 7-1: Compressive Strength of the Selected HES Concretes at 24 hrs ....................158
Figure 7-2: Compressive Strength of the Selected HES Concretes at 28 Days ................158
Figure 7-3: Flexural Strength of the Selected HES Concretes ................................................159
Figure 7-4: Void Contents of the Selected HES Concretes ......................................................162
Figure 7-5: Passing Charges of the Selected HES Concretes ..................................................163
Figure 7-6: Chloride Penetration Depth of the Selected HES Concretes ............................164
Figure 7-7: Water Penetration Depth of Selected HES Concretes .........................................165
Figure 7-8: Drying Shrinkage of HES Concretes After 28 Days in Shrinkage Room ...166
Figure 7-9: Drying Shrinkage of HES Concretes After 7.5 Months in Shrinkage Room
.................................................................................................................................................................167
Figure 7-10: Failure Time of HES Concretes in Corrosion Test ............................................168
Figure 7-11: Ultimate Mass Loss of the Selected HES Concretes Subjected to 25
Freezing and Thawing Cycles .....................................................................................................169
Figure 7-12: Abrasion Depth of the Selected HES Concretes .................................................170
1
Chapter 1 Introduction, Economic Impacts, National Survey, and Literature Review
1.1 Introduction
In the construction industry, High Early-Age Strength (HES) concrete was
traditionally regarded as a concrete that achieves a loading strength in matter of days
rather than weeks. However, in the last 10-15 years, this time has been reduced down to a
matter of hours. The required minimum compressive strength is determined on a case-
by-case basis depending on the project. In construction applications for structures and
dwellings the minimum allowed by the International Building Code is 2500 psi (IBC
2012), while in road and bridge construction the minimum requirement is typically 3000
psi, and for airport construction is typically 4000 psi. Due to the accelerated strength
gain of HES provided by chemical admixtures, the minimum opening strengths are often
reduced since it is expected that the concrete continues to gain strength after the traffic
load is introduced. Since the target of this investigation is high early-age strength
concrete for the purposes of road and bridge deck repairs, this will be the main focus
from this point on.
In this chapter, economic impacts associated with the extended lane closures and
road construction will be discussed along with the past 30 years studies conducted on
high early-age strength concrete, a national survey, and a brief discussion of ASTM types
and proprietary rapid setting cements will also be provided.
The following chapters will discuss materials and methods, fresh properties,
mechanical properties, transport properties, durability, and dimensional stability

2
properties of the studied high early-age strength concretes using different cement types
and parametric variables, such as cement factor, accelerator dosage, air-entrainment, and
age.
1.2 Economic Impacts
In the last 30 years the United States experienced two economic recessions. The
First occurred in the mid-part of the 1980s whereas; the second occurred approximately
2008 to 2012. These recessions have caused highway and bridge maintenance programs
to be deferred to a future date or to be neglected altogether. This combined with an
infrastructure that was already aging and in need of repair, coupled with an over-burden
in usage due to under predicted increases in population over time for some areas, is now
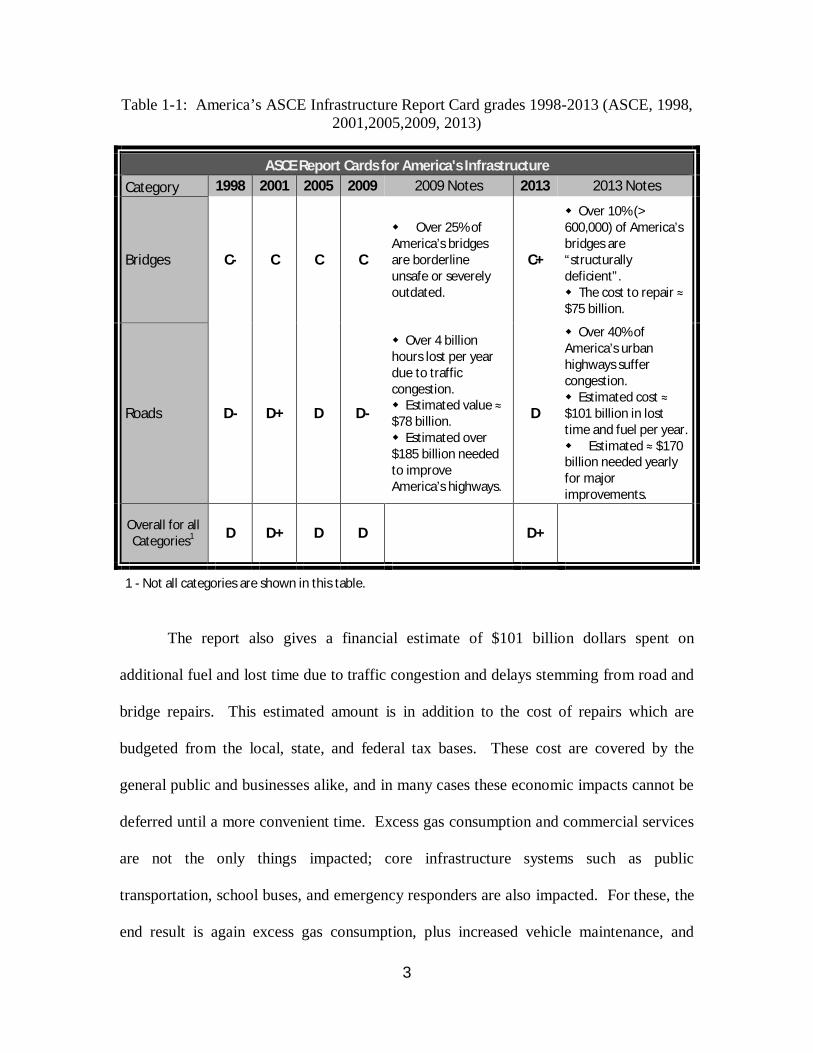
leading to a highway infrastructure system that is literally crumbling. In 2013, the ASCE
Report Card reported that at least one out of ten bridges in America fell in the
“Structurally Deficient” category, thus receiving a grade of C+. This category implies
that major maintenance, or rehabilitation, or in some cases replacement is required. The
average age of U.S. bridges in use is 42 years old. It was also reported that about one-
third United States highway system, approximately 1.3 million miles, received a grade of
D (Poor condition or worse) (ASCE). Table 1-1 shows that while a minor improvement
has occurred in the “Bridge” category of the report card over the last 18 years, the quality
of roads has been fluctuating between D- and D+. For the last 18 years the overall grade
for America’s infrastructure (all 16 categories) has been between D and D+.
3
Table 1-1: America’s ASCE Infrastructure Report Card grades 1998-2013 (ASCE, 1998, 2001,2005,2009, 2013)
ASCE Report Cards for America's Infrastructure Category 1998 2001 2005 2009 2009 Notes 2013 2013 Notes
Bridges C- C C C
Over 25% of America’s bridges are borderline unsafe or severely outdated.
C+
Over 10% (> 600,000) of America’s bridges are “structurally deficient”. The cost to repair ≈ $75 billion.
Roads D- D+ D D-
Over 4 billion hours lost per year due to traffic congestion. Estimated value ≈ $78 billion. Estimated over $185 billion needed to improve America’s highways.
D
Over 40% of America’s urban highways suffer congestion. Estimated cost ≈ $101 billion in lost time and fuel per year. Estimated ≈ $170 billion needed yearly for major improvements.
Overall for all Categories1 D D+ D D D+
1 - Not all categories are shown in this table.
The report also gives a financial estimate of $101 billion dollars spent on
additional fuel and lost time due to traffic congestion and delays stemming from road and
bridge repairs. This estimated amount is in addition to the cost of repairs which are
budgeted from the local, state, and federal tax bases. These cost are covered by the
general public and businesses alike, and in many cases these economic impacts cannot be
deferred until a more convenient time. Excess gas consumption and commercial services
are not the only things impacted; core infrastructure systems such as public
transportation, school buses, and emergency responders are also impacted. For these, the
end result is again excess gas consumption, plus increased vehicle maintenance, and

4
decreased productivity. Thus, tax payers now see a third, albeit discrete, financial burden
that must be paid through the tax base. These over-burdens are essentially bleeding the
budget of valuable funds that could be better spent on longer lasting repairs with shorter
closure times. Figure 1-1 shows that the United States is at a 30 year low with respect to
allocating funds to infrastructure repair and maintenance. These low points (1984 and
2014) coincide with the previously mentioned economic recession periods. The ASCE
report card for 2013 is also a reflection of this trend.
Figure 1-1: Spending for America’s Infrastructure 1945-2014 (CBPP.org)
1.3 Background
The following is a review of the responses to a questionnaire to the U.S.
Departments of Transportation and a literature review of studies into high early-age
strength concrete dating back 30 years.
5
1.3.1 National Survey
In the Fall of 2015, and again in the Spring 2016, a survey was sent out to State
Departments of Transportation (DOTs) and regional offices of the Federal Highway
Administrations (FHWA). The focus of the survey was to obtain information on the high
early-age strength repairs used by different state agencies. The survey questions and
results listed by State can be found in Appendix A. The survey provided the following
keys pieces of information that were used for material selection and proportioning of this
study:
All States used/allowed high early-age strength concrete for pavement repairs,
and almost all used/allowed high early-age strength concrete for bridge deck
repairs.
Opening times vary with geographic location and cement type used. Times as
low as 4-6 hrs have been documented using Type-III PC and 8-10 hrs using Type-
I PC during summer placement. Opening times as low as 2.5 hours have been
seen using rapid setting cements. Some States base opening time on compressive
or flexural strength, while some impose a 4-6 hr minimum (at least one cold
weather State has a 12 hr min). Typical max opening times are 24, 48, and some
cases 72 hrs (at least one hot weather State has a 12 hr max.) Many States require
strength testing at intervals of 24, 48, and/or 72 hrs regardless of opening time.
The required compressive strength at opening to traffic ranged between 1500–
3500 psi (4000 psi for deep repairs), with the majority being 3000 psi.
Many States do not have flexural strength requirements. When required, the
range is 380-600 psi.

6
Few States have a specification for drying shrinkage. When specified the range is
0.03-0.05 % at 28-days after placement.
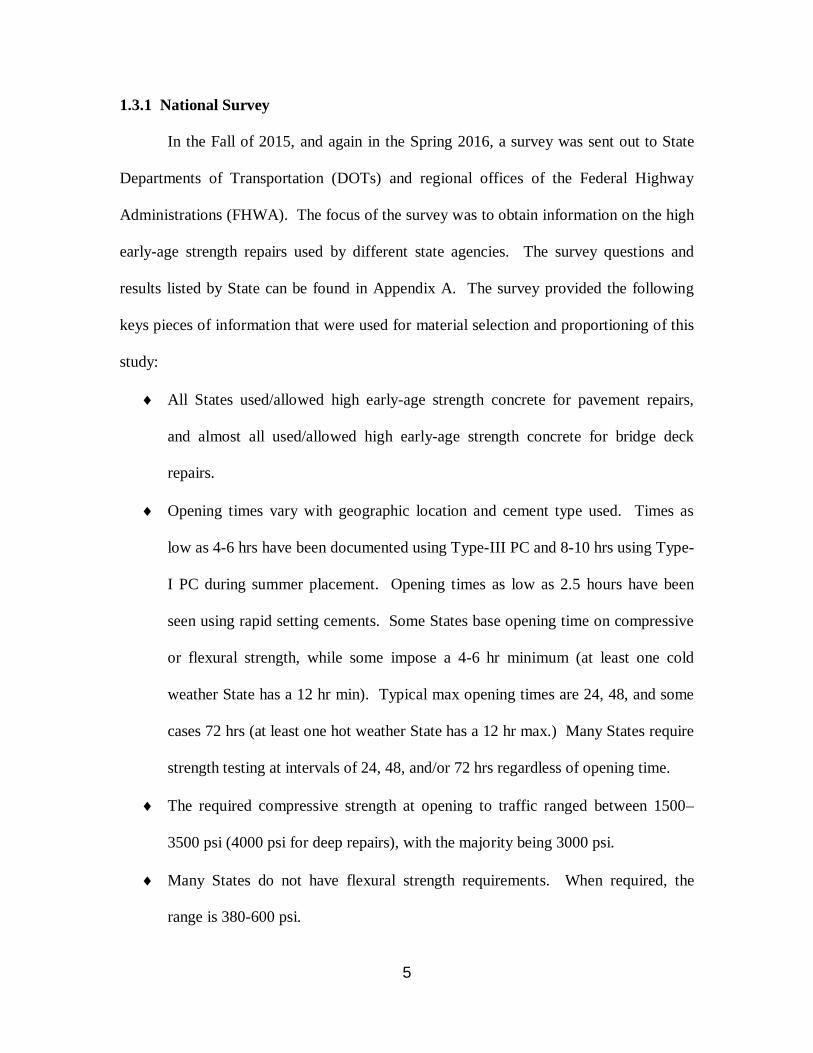
Type(s) I, II, III Portland Cement, and in some cases proprietary bag mixes such
as Rapid Set, are the most prevalently used for high early-age strength concrete in
bridge and road repair. See Figure 1-2 for a graphic representation.
The cement factors used for HES repairs ranged between 600-900 lb/yd3, with the
lower values 600-750 lb/yd3 being more favorable due to economics.
Most States allow for the use of alternate/supplementary cementitious materials
within specified limits. Some States do not allow silica fume.
Most states do not specify minimum water-to-cement ratios. They do, however,
specify a maximum value of 0.40-0.45.
All States have some form of curing method involving curing compounds, wet
burlap, wet plastic, or curing blankets.
Minimum R-value for curing blanket not generally specified, the value ranged
from 1-5.
Nearly all States allowed for the use or accelerating admixtures for pavement and
bridge deck repairs. Some allowed the use for pavement only. Nearly all States
require non-chloride accelerators when used.
Nearly all States allowed for the use of retarding admixtures – although not
typically needed with high early-age strength concrete using Portland cement.
In regions that have freeze/thaw weather cycles, the required air-content ranged
between 5 and 8.5 %.
7
Figure 1-2: U.S. Map Showing Cements Used by State. (Information Via Survey.)
Types of Portland Cement: - I, I/II, III, V, IP, IS, IT; RapidSet – RS; Proprietary Bag Mix – PBM; Blended - Bl
I/II, III, RS
I/II, III, IP & IT - Bl
I/II, III
I, RS
I, III
II, III, RS I, II, III, IP, IS, IT, RS
I, II, III, RS
(PBM, RS)
I/II, III
I, II, IP, IS, RS
I, II, RS
I, II, III, RS
(RS)
III

8
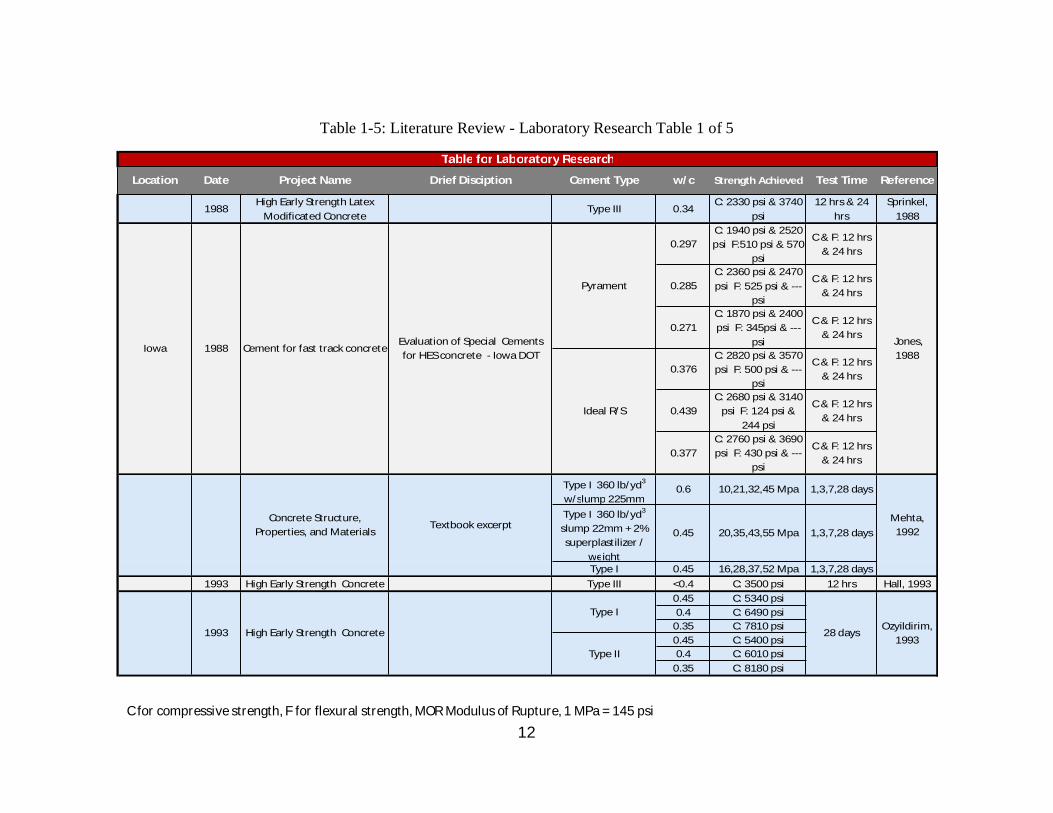
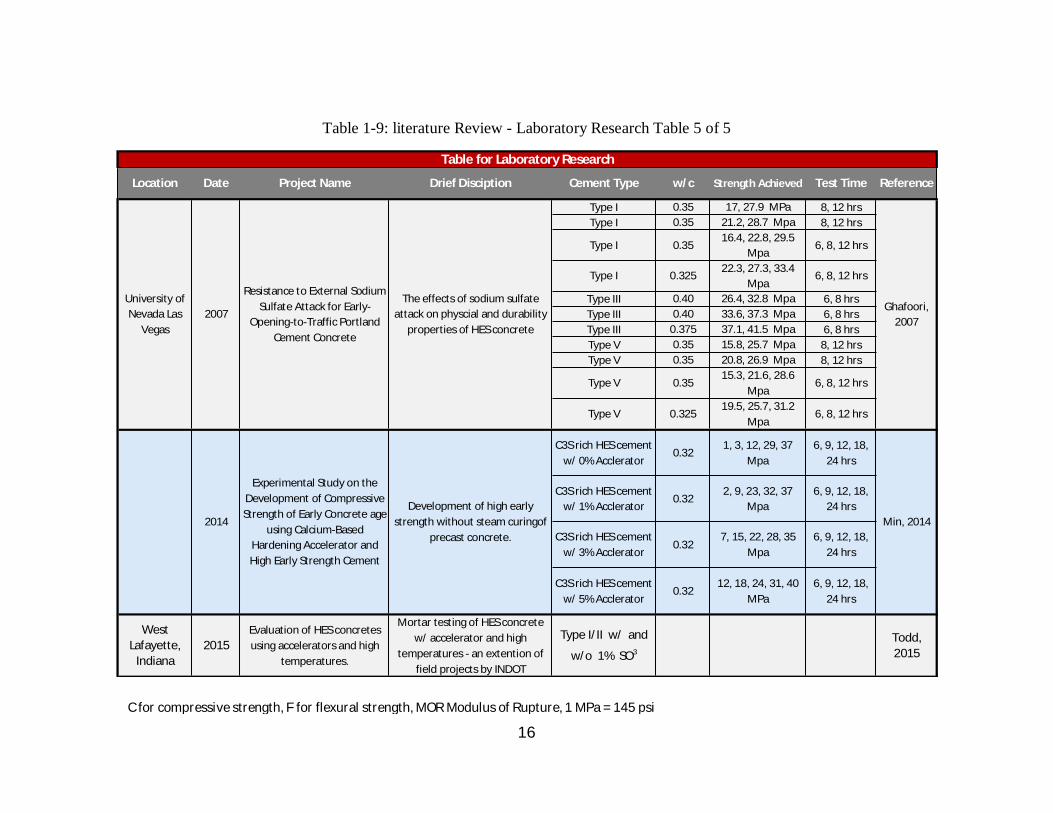
1.3.2 Literature Review
The literature review for this project dates back approximately 30 years.
Although the literature covered a broad use of high early-age strength concrete for road
and bridge repairs, there were four key points of information gleaned that were used in
material selection and mixture proportioning designs for this study:
Cement type, cement factor, and supplementary cementious materials.
Water-to-cementious materials ratio
Opening times
Strengths achieved
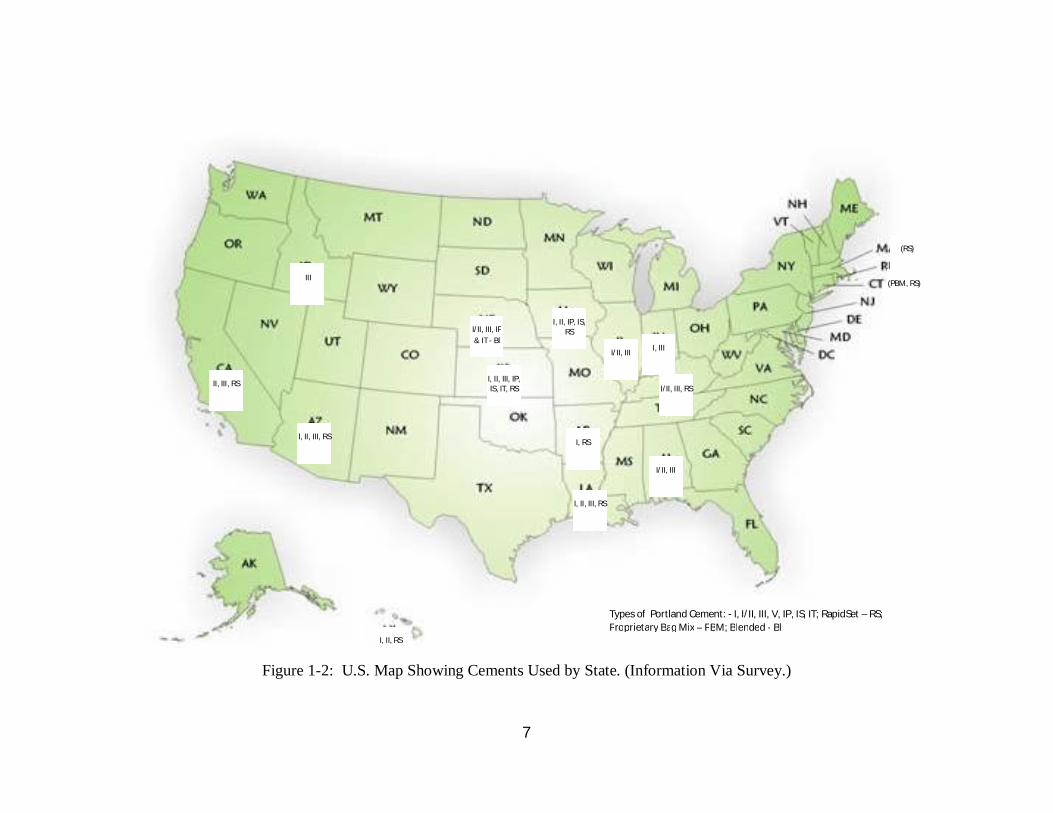
Tables 1-2 through 1-4 provide the aforementioned information from various highway
and bridge repair projects throughout the U.S. In addition to this information, the
geographic location, year, and a brief description of the project is also provided. The
results shown reflect the responses from the survey with respect to types of cement used,
supplementary cementitious material limits, and water-to-cement ratio. In addition to
field reports, there was also literature documenting laboratory research investigating high
early-age strength concrete. A majority of these were for highway and bridge deck
repairs. Tables 1-5 through 1-9 provide the key points previously mentioned with respect
to laboratory research projects. In addition to this information, the laboratory name and
location, year, and a brief description of the research project are also provided. The
information shown reflect the results with respect to types of cement used, supplementary
cementitious materials limits, water-to-cement ratio, test time, and strength achieved.

9
Table 1-2: Literature Review - Projects Table 1 of 3
Project Location
Poject Date
Project Name Drief Disciption Cement Type w/cStrength Achieved
Test Time Reference
IOWA 1987Creating cement for
fast track constructionClass C fly ash 70lbs/yd3
w/Type III 640 lbs/yd3 0.43 to 0.45
C: 3 467 psi F: 607 psi
24 hrs Knuston, 1987
Osceola 1987 Osceola Airport projectClass C fly ash 70lbs/yd3
w/Type III 640 lbs/yd3 0.43 to 0.45
F: 415psi & 780psi
12 hrs & 26 hrs
Michigan 1987 Michigan road project No fly ash Type III 710 lbs/yd3 0.38 F: 425 psi 12 hrs
Cedars Rapids, Iowa
Fast trackClass C fly ash 73lbs/yd3
w/Type III 641 lbs/yd3 0.41
C: 3550 psi & 4660 psi F: 420 psi &
530 psi
C & F: 12 hrs & 24 hrs
Cedars Rapids, Iowa
Fast track 2Class C fly ash 80lbs/yd3
w/Type III 742 lbs/yd3 0.38
C: 4990 psi & 5260 psi
F: 570 psi & 690 psi
C & F: 12 hrs & 24 hrs
Vermilion, Ohio Type III 900 lb/yd3 0.4
MOR : 400 psi
4 hrs
Vermilion, Ohio 900 lb/yd3 of a blended cement 0.27 C: 2000 psi 4 hrs
Vermilion, Ohio
750 lb/yd3 of a rapid set cement
0.4 C: 2000 psi 4 hrs
Vermilion, Ohio Type III 870 lb/yd3 0.38 C: 2000 psi 4 hrs
Augusta, Georgia 850 lb/yd3 blended cement 0.29 C: 2000 psi 6 hrs
Vermilion, Ohio 650 lb/yd3 rapid set cement 0.5 C: 2000 psi 6 hrs
Augusta, Georgia Type I 750 lb/yd3 0.38 C: 1000 psi 4 hrs
St. Louis County, Missouri
May, 2004 Bridge #: J6I1515
Latex Modified Concrete - Very High
Early Strength placement on the
bridge decks.
Latex Modified Concrete - Very High Early Strength (LMC-VE)
Pull off tensile
strength : Ave. = 115
psi
6 hrs old
St. Charles County, Missouri
May, 2004 Bridge #: J6I1444Repair and overlay a 5-lane bridge with
LMC-VE.
Latex Modified Concrete - Very High Early Strength (LMC-VE)
modified with Rapid Set.
Pearson, 1987
Table for Projects
Whiting, 1994
Grove, 1989Urban road
construction1989
Early Strength gain of rapid Highway Repair
concrete1994 Road repair
Wenzlick, 2006
C for compressive strength, F for flexural strength, MOR Modulus of Rupture, 1 MPa = 145 psi
10
Table 1-3: Literature Review - Projects Table 2 of 3
Project Location
Poject Date
Project Name Drief Disciption Cement Type w/cStrength Achieved
Test Time Reference
New jersey Type I 799 lb/yd3 0.41C: 3865 psi F: 380 psi
24 hrs
New jersey Type I 705 lb/yd3 0.41 C: 3607 psi 24 hrsStorm Lakem,
IA1980
US-71 bonded overlay
Type III 0.45 F: 350 psi 7.5 hrs
Barksdale, AFB (IA)
1992Runway keel
reconstructionSpecial blended 0.27 F: 450 psi 4 hrs
Cedars Rapids, IA
1988Highway 100 intersection
replacementsType III 0.38 F: 400 psi 12 hrs
Manhattan, KS
1990SR-81 Arterial reconstruction
Type III 0.44 F: 450 psi 24 hrs
Lansing, MI 1989Lane addition to I-
496Type III 0.45 F: 550 psi 19 hrs
Denver, CO 1992I-25 to I-70
interchange Ramp reconstruction
Type III 0.32 F: 2500 psi 12 hrs
Dallas county, IA
1987Single-route access road reconstruction
Type III 0.425 F: 350 psi 9 hrs
Rawlins, WY 1992Interslate 80
wideringType III 0.47 F: 3000 psi 24 hrs
Erie County, PA
1991SR 832 & I-90 Interchange
reconstructionType III 0.37 F: 3000 psi 24 hrs
Dane County, MO
1991 I-70 bonded overlay Type III 0.4 F: 3500 psi 18 hrs
Cooper County, WI
1992Runway 18/36
extensionType III 0.455 F: 3500 psi 12 hrs
North Hampton, VA
1990SR -13 bonded
overlayType III 0.42 F: 3000 psi 24 hrs
Menominee, NE
1992 US-81 reconstruction Type II 0.423 F: 3500 psi 24 hrs
Smithfield, NC
1990US-70 inlay of aphalt
intersection approaches
Type III 0.35 F: 450 psi 48 hrs
Ansari, 1997Fast track concrete for
pavement repair
Fast track concrete pavement
Table for Projects
ACPA, not dated
C for compressive strength, F for flexural strength, MOR Modulus of Rupture, 1 MPa = 145 psi

11
Table 1-4:Literature Review - Projects Table 3 of 3
Project Location
Poject Date Project Name Drief Disciption Cement Type w/c Strength
AchievedTest Time Reference
Aug, 2014 Type I/II 0.343F: 300, 330, 360, 450 psi
4, 5, 6, 8 hrs
Sept, 2014 Type I/II 0.343F: 240, 320,
390, 400, 490 psi
4, 5, 6, 8, 24 hrs
Oct, 2014 Type I/II 0.343F: 240, 320, 380, 400 psi
6, 8, 11, 24 hrs
LaPorte County, IN
June, 2014 Bridge No. 157 Type II 0.4035000, 6200, 7400, 8200
psi
3, 5, 7, 14 ,28 days
Starke County, IN
Nov, 2014 Bridge No. 31 Type II 0.403
4200, 4900, 6300, 6900, 7800, 8300
psi
5, 7, 14, 28, 56, 91 days
Starke County, IN
April, 2014 Bridge No. 70 Type II 0.403C: 7340,
7780, 8050 psi
28, 56, 91 days
Starke County, IN
June, 2014 Bridge No. 79 Type II 0.403C: 8230,
9120, 9120 psi
28, 56, 91 days
Evaluation of Interna Cured High
Performance Concrete (ICHPC)
Bridge Decks
Todd, 2015
Table for Projects
Todd, 2015
US Highway 30. Full depth lane repair
using HES. 2-Lanes each direction.
Three sites visited.
INDOT Project No. R-35341
Us Highway 30, Indiana. From Illinois border past
Dyer.
C for compressive strength, F for flexural strength, MOR Modulus of Rupture, 1 MPa = 145 psi
12
Table 1-5: Literature Review - Laboratory Research Table 1 of 5
Location Date Project Name Drief Disciption Cement Type w/c Strength Achieved Test Time Reference
1988High Early Strength Latex
Modificated ConcreteType III 0.34
C: 2330 psi & 3740 psi
12 hrs & 24 hrs
Sprinkel, 1988
0.297C: 1940 psi & 2520 psi F:510 psi & 570
psi
C & F: 12 hrs & 24 hrs
0.285C: 2360 psi & 2470 psi F: 525 psi & ---
psi
C & F: 12 hrs & 24 hrs
0.271C: 1870 psi & 2400 psi F: 345psi & ---
psi
C & F: 12 hrs & 24 hrs
0.376C: 2820 psi & 3570 psi F: 500 psi & ---
psi
C & F: 12 hrs & 24 hrs
0.439C: 2680 psi & 3140
psi F: 124 psi & 244 psi
C & F: 12 hrs & 24 hrs
0.377C: 2760 psi & 3690 psi F: 430 psi & ---
psi
C & F: 12 hrs & 24 hrs
Type I 360 lb/yd3
w/slump 225mm0.6 10,21,32,45 Mpa 1,3,7,28 days
Type I 360 lb/yd3
slump 22mm + 2% superplastilizer /
weight
0.45 20,35,43,55 Mpa 1,3,7,28 days
Type I 0.45 16,28,37,52 Mpa 1,3,7,28 days1993 High Early Strength Concrete Type III <0.4 C: 3500 psi 12 hrs Hall, 1993
0.45 C: 5340 psi0.4 C: 6490 psi
0.35 C: 7810 psi0.45 C: 5400 psi0.4 C: 6010 psi
0.35 C: 8180 psi
1993 High Early Strength Concrete
Concrete Structure, Properties, and Materials
Table for Laboratory Research
Jones, 1988
Mehta, 1992
1988 Cement for fast track concreteEvaluation of Special Cements for HES concrete - Iowa DOT
Pyrament
Ideal R/S
Type I
Type II
Textbook excerpt
Iowa
Ozyildirim, 1993
28 days
C for compressive strength, F for flexural strength, MOR Modulus of Rupture, 1 MPa = 145 psi

13
Table 1-6: Literature Review - Laboratory Research Table 2 of 5
Location Date Project Name Drief Disciption Cement Type w/c Strength Achieved Test Time Reference
Type I 0.35900, 3097; 6688
psi8, 12 hr; 28
days
Type I 0.351488, 3173; 5277,
5346, 6696 psi8, 12 hrs; 3,
7, 28 days
Type I 0.351656, 3250; 6710
psi8, 12 hr; 28
days
Type I 0.3251992, 3547; 7409
psi8, 12 hr; 28 days
Type III 0.42725, 3779, 4588; 5348, 5935, 6726
psi
6, 8, 12 hrs; 3, 7, 28 days
Type III 0.43318, 4075, 4677; 5476, 6002, 6935
psi
6, 8, 12 hrs; 3, 7, 28 days
Type III 0.3753335, 4602, 5101;
7345 psi6, 8, 12 hrs;
28 days
Type I w/ Air Ent. 0.352464, 4043; 8033
psi8, 12 hrs; 28 days
Type I w/ Air Ent. 0.353073, 4158; 8200
psi8, 12 hrs; 28 days
Type I w/ Air Ent. 0.352381, 3305, 4280;
8350 psi6, 8, 12 hrs;
28 days
Type I w/ Air Ent. 0.3253231, 3963, 4836;
9211 psi6, 8, 12 hrs;
28 days
Type III w/ Air Ent. 0.43824, 4758; 8191
psi6, 8 hrs; 28 days
Type III w/ Air Ent. 0.44874, 5411; 8570
psi6, 8 hrs; 28 days
Type III w/ Air Ent. 0.3755385, 6014; 9025
psi6, 8 hrs; 28 days
Tays, 2002Study the abrasion resistance of HES concrete using Type I and III
Portland cement.
Abrasion Resistance of Fast Track Portland Cement
Concrete2002
University of Tennesse
Table for Laboratory Research
C for compressive strength, F for flexural strength, MOR Modulus of Rupture, 1 MPa = 145 psi

14
Table 1-7: Literature Review - Laboratory Research Table 3 of 5
Location Date Project Name Drief Disciption Cement Type w/c Strength Achieved Test Time Reference
Institut National des
Sciences Appliques de
Lyon
New application of calcium sulfoaluminate cement.
Development of concrete with high early strength: 40 Mpa, 6h after its preparation, and higher
than 55 Mpa after 24h.
80% of Calcium Sulfoaluminate
(CSA). 20% of OPC (Type I).
0.37Mix 1 : 40Mpa. Mix 2 : 35 Mpa. Mix 3 :
46 Mpa.6 hours Pera, 2004
Departement of civil
engineering, Michigan State
University
Evaluation of high-early strength PCC mixtures used in
full depth repairsType I and Type III 0.4 38-50Mpa 28 days Buch, 2006
SDC III : using Type III cement
0.36 4540 psi 12h
MSC III : using Type III cement
0.36 3735 psi 12h
LMC RS : using CTS Rapid Set cement
0.39 3630 psi 12h
C-I 0.43 19N/mm2 7daysC-II 0.38 34.1N/mm2 7daysC-IV 0.38 33.3N/mm2 7daysSC-I 0.37 50.4N/mm2 7daysSC-I 0.37 44.1N/mm2 7daysSC-II 0.38 51.3N/mm2 7daysSC-I 0.39 27.1N/mm2 24hSC-II 0.38 31.7N/mm2 24hSC-II 0.38 28.4N/mm2 24hSC-II 0.38 25.2N/mm2 24h
Portland cement 70.9MPa 1 day20%GGBS 76.6MPa 2 day35%GGBS 75.7MPa 3 day50%GGBS 55.4MPa 4 day70%GGBS 36.1MPa 5 day
Table for Laboratory Research
Evaluation of concrete overlay mixes that are intended to reach
a strength that would allow traffic at a very early age (2 to 4
hours)
High Early Strength Concrete Overlays
ODOT - Office of Materials
Management Cement & Concrete Section
Fast track construction
Fast Track Construction with High-Strength Concrete Mixes Containing Ground Granulated
Blast Furnace Slag
Develop mix proportioning information for production of
high early strength concrete for precast concrete pipe
production.
High Early Strength Concrete without Steam Curing
Kumar, 2012
Soutsos, not dated
ODOT, 2007
C for compressive strength, F for flexural strength, MOR Modulus of Rupture, 1 MPa = 145 psi

15
Table 1-8: Literature Review - Laboratory Research Table 4 of 5
Location Date Project Name Drief Disciption Cement Type w/c Strength Achieved Test Time Reference
2006Grade 1 : AASHTO
T22 ASTM C3955Mpa<Comp.
strength<69Mpa56 days
2006Grade 2 : AASHTO
T22 ASTM C3969Mpa<Comp.
strength<97Mpa56 days
2006Grade 3 : AASHTO
T22 ASTM C3997Mpa<Comp.
strength56 days
2007Grade 1 : AASHTO
T2224Mpa<Comp.
strength<55Mpa28 days
2007Grade 2 : AASHTO
T22 55Mpa<Comp.
strength28days
2007Grade 3 : AASHTO
T2224Mpa<Comp.
strengthearly ages
Mix 1 : I 0.31 44.8MPa 7daysMix 1 : I 0.31 61.3MPa 28daysMix 2 : I 0.35Mix 3 : II 0.31
Mix 4 : I/II (Lafarge Sugar Creek SF)
0.32 28.4MPa 7days
Mix 4 : I/II (Lafarge Sugar Creek SF)
0.32 36.3MPa 28days
Mix 5 : I/II (Lafarge Sugar Creek SF)
0.35 34.9MPa 7days
Mix 5 : I/II (Lafarge Sugar Creek SF)
0.35 50.4MPa 28days
Emaco T430 mix 10.1MPa 7daysEmaco T430 mix 15.9MPa 28days
LMC-VE 30.4MPa 7daysLMC-VE 30.3MPa 28days
RSLP Mix 1 26.3MPa 7daysRSLP Mix 1 29.2MPa 28daysRSLP Mix 2 72.8MPa 7daysRSLP Mix 2 77.6MPa 28days
The procedure and methods for selecting durable CP materials.
Selection of Durable Closure Pour Materials for Accelerated
Bridge Construction
Table for Laboratory Research
Zhu, 2010
C for compressive strength, F for flexural strength, MOR Modulus of Rupture, 1 MPa = 145 psi
16
Table 1-9: literature Review - Laboratory Research Table 5 of 5
Location Date Project Name Drief Disciption Cement Type w/c Strength Achieved Test Time Reference
Type I 0.35 17, 27.9 MPa 8, 12 hrsType I 0.35 21.2, 28.7 Mpa 8, 12 hrs
Type I 0.3516.4, 22.8, 29.5
Mpa6, 8, 12 hrs
Type I 0.32522.3, 27.3, 33.4
Mpa6, 8, 12 hrs
Type III 0.40 26.4, 32.8 Mpa 6, 8 hrsType III 0.40 33.6, 37.3 Mpa 6, 8 hrsType III 0.375 37.1, 41.5 Mpa 6, 8 hrsType V 0.35 15.8, 25.7 Mpa 8, 12 hrsType V 0.35 20.8, 26.9 Mpa 8, 12 hrs
Type V 0.3515.3, 21.6, 28.6
Mpa6, 8, 12 hrs
Type V 0.32519.5, 25.7, 31.2
Mpa6, 8, 12 hrs
C3S rich HES cement w/ 0% Acclerator
0.321, 3, 12, 29, 37
Mpa6, 9, 12, 18,
24 hrs
C3S rich HES cement w/ 1% Acclerator
0.322, 9, 23, 32, 37
Mpa6, 9, 12, 18,
24 hrs
C3S rich HES cement w/ 3% Acclerator
0.327, 15, 22, 28, 35
Mpa6, 9, 12, 18,
24 hrs
C3S rich HES cement w/ 5% Acclerator
0.3212, 18, 24, 31, 40
MPa 6, 9, 12, 18,
24 hrs
West Lafayette,
Indiana2015
Evaluation of HES concretes using accelerators and high
temperatures.
Mortar testing of HES concrete w/ accelerator and high
temperatures - an extention of field projects by INDOT
Type I/II w/ and
w/o 1% SO3 Todd, 2015
Table for Laboratory Research
University of Nevada Las
Vegas
Ghafoori, 2007
2007
Resistance to External Sodium Sulfate Attack for Early-
Opening-to-Traffic Portland Cement Concrete
The effects of sodium sulfate attack on physcial and durability
properties of HES concrete
2014
Experimental Study on the Development of Compressive Strength of Early Concrete age
using Calcium-Based Hardening Accelerator and High Early Strength Cement
Development of high early strength without steam curingof
precast concrete.Min, 2014
C for compressive strength, F for flexural strength, MOR Modulus of Rupture, 1 MPa = 145 psi

17
1.4 Cement Types in High Early-Age Strength Concrete
In high early-age strength concrete Portland cement is by far the most commonly
used with several types to choose from, however, it is not the only cement available.
1.4.1 Portland Cement
When referencing concrete construction in the United States utilizing Ordinary
Portland Cement, the recognized standards are set forth by the American Society for
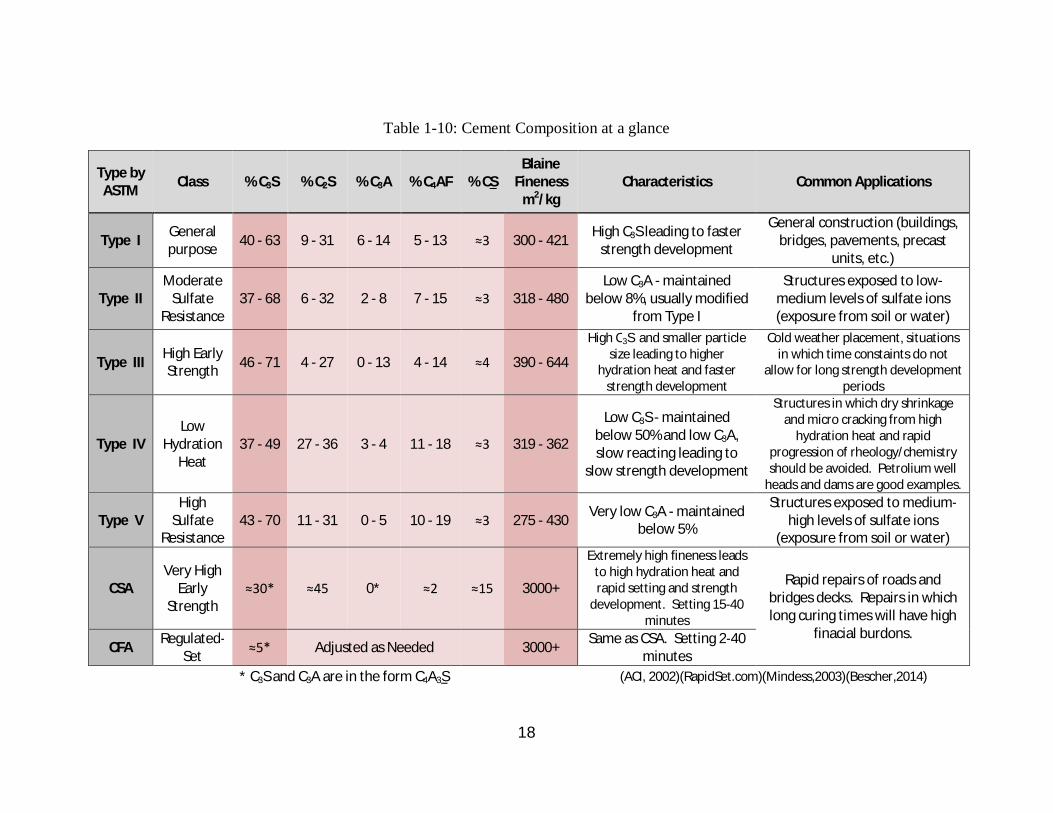
Testing and Materials (ASTM). ASTM divides Ordinary Portland Cement (OPC) into
five types. These types are categorized by their four main components, in addition to their
particle size (a.k.a. Blaine Fineness). Table 1-10 shows the five types of Portland cement
along with four main components listed in descending order of importance from left to
right. In the cases of Type I and Type III, this is also the descending order of abundance.
Each of these four categories has a specified range in which each type of cement must
maintain for proper Type identification.
Table 1-10 also indicates the Blaine fineness, which represents the particle size.
The higher the Blaine value the smaller the particle. The smaller the particle the faster
the cementious material can achieve full hydration, which leads to higher heat of
hydration and an increased rate of strength development. From the table it can be seen
that Type III, which is designed for high early-age strength, has both a high C3S and a
high Blaine Fineness value. Type V, is noticeably lower with respect to C3S and Blaine
Fineness when compared to the other types. These two values are what steer conventional
thinking away from using Type V for high early-age strength (HES) products. Nevada
requires Type V Portland cement for all construction activities.
18
Table 1-10: Cement Composition at a glance
Type by ASTM Class % C3S % C2S % C3A % C4AF % CS
Blaine Fineness
m2/kg Characteristics Common Applications
Type I General purpose 40 - 63 9 - 31 6 - 14 5 - 13 ≈3 300 - 421 High C3S leading to faster
strength development
General construction (buildings, bridges, pavements, precast
units, etc.)
Type II Moderate
Sulfate Resistance
37 - 68 6 - 32 2 - 8 7 - 15 ≈3 318 - 480 Low C3A - maintained
below 8%, usually modified from Type I
Structures exposed to low-medium levels of sulfate ions (exposure from soil or water)
Type III High Early Strength 46 - 71 4 - 27 0 - 13 4 - 14 ≈4 390 - 644
High C3S and smaller particle size leading to higher
hydration heat and faster strength development
Cold weather placement, situations in which time constaints do not
allow for long strength development periods
Type IV Low
Hydration Heat
37 - 49 27 - 36 3 - 4 11 - 18 ≈3 319 - 362
Low C3S - maintained below 50% and low C3A, slow reacting leading to
slow strength development
Structures in which dry shrinkage and micro cracking from high
hydration heat and rapid progression of rheology/chemistry should be avoided. Petrolium well
heads and dams are good examples.
Type V High
Sulfate Resistance
43 - 70 11 - 31 0 - 5 10 - 19 ≈3 275 - 430 Very low C3A - maintained below 5%
Structures exposed to medium-high levels of sulfate ions
(exposure from soil or water)
CSA Very High
Early Strength
≈30* ≈45 0* ≈2 ≈15 3000+
Extremely high fineness leads to high hydration heat and rapid setting and strength
development. Setting 15-40 minutes
Rapid repairs of roads and bridges decks. Repairs in which long curing times will have high
finacial burdons. CFA Regulated-
Set ≈5* Adjusted as Needed 3000+ Same as CSA. Setting 2-40 minutes
* C3S and C3A are in the form C4A3S
(ACI, 2002)(RapidSet.com)(Mindess,2003)(Bescher,2014)

19
1.4.2 Proprietary Rapid Setting Cements
There are several proprietary cementious products on the market today that are
not Portland cement, even though they share almost the same ingredients and are
developed through the same kiln processes. The main differences in the production
process are the kiln temperatures at the addition of ingredients and the time duration that
those temperatures are held. Calcium Flouroaluminate (CFA) Cement and Calcium
Sulfoaluminate (CSA) Cement are both considered rapid setting, or rapid hydrating,
cements that can achieve structural strengths (load bearing) in as little as 1 hour and 3
hours, respectively.
Rapid Set, manufactured by CTS Cement and sold commercially, is an example
of a CSA cement that has achieved structural strengths in as little as 1 hour. It’s designed
for use in rapid highway and airport runway repairs. It has also been used in high-
volume public structures such as sport stadiums and retail stores.
CFA cements have setting times as fast as 2 minutes up to 40 minutes. These
cements are “set regulated” by using soluble sulfates and citric acid. CFA cements are
blended specifically per situation with a precise setting time and can be produced directly
in the kiln, or from modified Portland cement Type I clinker.
4x4 Concrete is a patented process developed by BASF Chemicals. This process
claims 4000 psi in 4 hours using local source aggregate materials, ordinary Portland
cement, and their (BASF) chemical admixtures. This aggressive strength development is
originally intended for highway and runway repairs, but 4x4 Concrete can be used in
various applications.
20
In comparison to ordinary Portland cements, many of these products and
processes have a significantly higher dollar amount associated with them when compared
to ordinary Portland cement. In addition, some of their long-term properties may have
been compromised in exchange for rapid strength development. Therefore, they tend to
be used as emergency repairs and in high priority situations such as inner city freeway
exchanges and airport runways, or situations in which a significant dollar amount is
associated with the elapsed closure time.
1.5 Typical High Early-Age Strength Concrete Production Cost
As part of the literature review, a projects table was developed. Some of these
projects discussed cost either as a whole, or by the cubic yard of concrete. Table 1-11
provides information on cost and size of a few projects. The table also gives project
location and a brief description. It can be seen that these projects took place in areas
subject to freezing and therefore exposure to de-icing salts. The cost per cubic yard of
these projects justifies the continuing development of high early-age strength concrete in
an attempt to see a better return on investment through longer product life.
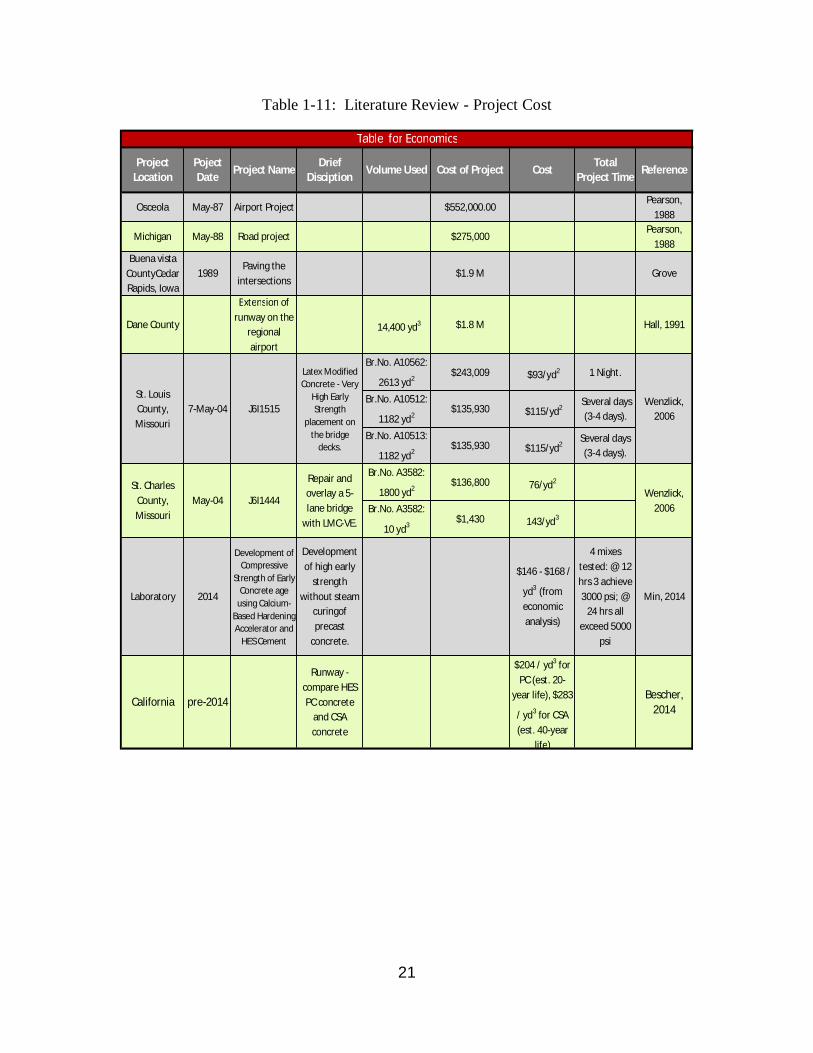
21
Table 1-11: Literature Review - Project Cost
Project Location
Poject Date Project Name Drief
Disciption Volume Used Cost of Project Cost Total Project Time Reference
Osceola May-87 Airport Project $552,000.00 Pearson,
1988
Michigan May-88 Road project $275,000 Pearson,
1988Buena vista
CountyCedar Rapids, Iowa
1989Paving the
intersections$1.9 M Grove
Dane County
Extension of runway on the
regional airport
14,400 yd3 $1.8 M Hall, 1991
Br.No. A10562:
2613 yd2$243,009 $93/yd2 1 Night.
Br.No. A10512:
1182 yd2 $135,930 $115/yd2 Several days
(3-4 days).
Br.No. A10513:
1182 yd2 $135,930 $115/yd2Several days (3-4 days).
Br.No. A3582:
1800 yd2$136,800 76/yd2
Br.No. A3582:
10 yd3 $1,430 143/yd3
Laboratory 2014
Development of Compressive
Strength of Early Concrete age
using Calcium-Based Hardening Accelerator and
HES Cement
Development of high early
strength without steam
curingof precast
concrete.
$146 - $168 /
yd3 (from economic analysis)
4 mixes tested: @ 12 hrs 3 achieve 3000 psi; @
24 hrs all exceed 5000
psi
Min, 2014
California pre-2014
Runway - compare HES PC concrete
and CSA concrete
$204 / yd3 for PC (est. 20-
year life), $283
/ yd3 for CSA (est. 40-year
life)
Bescher, 2014
St. Charles County, Missouri
May-04 J6I1444
Repair and overlay a 5-lane bridge
with LMC-VE.
Wenzlick, 2006
Table for Economics
St. Louis County, Missouri
7-May-04 J6I1515
Latex Modified Concrete - Very
High Early Strength
placement on the bridge
decks.
Wenzlick, 2006

22
Chapter 2 Materials, Mixture Design, Curing and Testing
Methods
Chapter 2 of this study discusses material properties and storage, concrete mixture
proportioning and design, three curing methods attributed for different ages, and testing
methods and equipment.
2.1 Materials
The materials section of this report discusses the section and classification of the
materials used in this study.
2.1.1 Laboratory Temperature and Humidity
The laboratory was climate controlled to maintain an ambient temperature of 24°
± 1.7° C (75° ± 3° F), and a humidity of 15 ± 5%.
2.1.2 Water
The water used for mixing in this study was municipal tap water. This is standard
practice for the local construction industry. The water was dispensed into plastic
containers and allowed to acclimate to lab temperature for a minimum of 24 hours prior
to use.

23
The water used for testing was also municipal tab water as described above. There
were two exceptions, test that required a sodium hydroxide solution and test that required
the use of a humidifier. Distilled water was used for these situations.
2.1.3 Fine Aggregate
The fine aggregate used in this study was obtained from a local quarry in Sloan,
Nevada. ASTM C136 (Standard Test Method for Sieve Analysis of Fine and Course
Aggregates) and ASTM C33 (Standard Specifications for Concrete Aggregates) were
used for determination of suitability with respect to size distribution. The fine aggregate
was found to be within the limits set by the standard as shown in Figure 2-1.
Figure 2-1: Sieve Analysis for the Fine Aggregate
ASTM C128 (Density, Relative Density (Specific Gravity), and Absorption of
Fine Aggregate) was used to determine the absorption properties of the fine aggregate.
The results were as follows:

24
Relative Density (Specific Gravity) Oven-Dry 2.76
Relative Density (Specific Gravity) Saturated-Surface-Dry 2.76
Apparent Relative Density (Apparent Specific Gravity) 2.82
Absorption 0.81%
The fine aggregate was dried to a moisture content of 0.1 – 0.01 % before it was stored in
the laboratory in sealed 5-gallon plastic buckets in order to acclimate to the laboratory
room temperature for a minimum of 24 hours prior to use.
2.1.4 Coarse Aggregate
The coarse aggregate used in this study was also obtained from a local quarry in
Sloan, Nevada. The coarse aggregate was received as ASTM #67 and ASTM #7 – for
nominal sizes of ¾” and ½”, respectively. The coarse aggregate was dried to a moisture
content of 0.1 – 0.01 % prior to sieving. The coarse aggregate was sieved using ¾”, ½”,
3/8”, and #4 U.S. sieves. Aggregates above or below these sieve sizes were discarded.
For ASTM #7 coarse aggregate, to keep the ½” size would have caused the resulting size
distribution of the ½” – ¾” aggregate used for testing to be skewed towards the ½” size.
Upon sieving, coarse aggregate was stored in sealed, 55-gallon steel barrels by
size. For the purpose of concrete batching, coarse aggregate was brought into the
laboratory and stored in sealed, 5-gallon plastic buckets and allowed to acclimate to the
laboratory temperature for a minimum of 24 hours prior to use. Table 2-1 shows the
recombined proportions, based on ASTM #67, that were used.

25
Table 2-1: Size Gradation of Coarse Aggregate
ASTM Sieve Size
ASTM #67 ASTM #7 Recombined Distribution
1” 3/4” USED 5% 1/2” USED DISCARD 35% 3/8” USED USED 30%
#4 USED USED 30% #8 DISCARD
Pan DISCARD DISCARD
2.1.5 Cement Types
The cements used in this project were Portland cement Type III and Type V, and
a proprietary calcium sulfoaluminate (CSA) cement. In addition, two blended cement
combinations of Type V and CSA were also investigated. Sierra Ready-Mix, a local
supplier, provided the Type V Portland cement, whereas CalPortland Cement
Manufacturing, out of California, provided the Type III. The CSA cement was provided
by CTS Cement from California. It is marketed under the name Rapid Set.
2.1.6 Admixtures
The following chemical admixtures were used. The admixtures were stored in the
laboratory in 9.5 L (2.5 gal.) sealed plastic containers.
Master Set AC534 Non-Chloride Accelerator
Master Glenium 7920 Polycarboxylate High-Range-Water-Reducer (HRWR)
Master Air AE200 Air-Entrainment (AE)
Master Set Delvo Hydration Stabilizer / Set Retarder
26
2.2 Batch Design
Tables 2-2 and 2-3 show the resulting batch designs used for this study in two unit
systems. Nomenclature for the batch IDs used in this study will be as follows:
Air Entrainment -
Cement Type -
Cement Factor -
Accelerator Amount (%)
Therefore, an air-entrained mixture of Type V at 386 kg/m3 (650 lb./yd3) with 2%
accelerator/cwt. has the ID: AE-V-650-2.0
The “AE” prefix is omitted when air-entraining admixtures is not used.
2.3 Curing Methods
Upon casting all samples were troweled smooth on the exposed surface and
covered with plastic film that was held in place with a rubber band. Three different
curing types; namely opening time curing, 24-hour curing, and 28-day moist curing were
utilized. Their descriptions can be found in the following sections.
2.3.1 Opening Time Curing
Curing for the Opening Time (OT) involved insulating test samples, while
remaining in their molds, with a layer of curing blanket. The OT is defined as the
elapsed time, starting when the water is added to the cement, needed for the concrete to
reach a minimum compressive strength of 20.68 MPa (3000 psi).

27
Table 2-2: Concrete Constituents and Proportioning Using Metric Units
Cement Material Water
Coarse Agg.
Fine Agg.
High Range Water
Reducer (w/ AE)
Air Entrainmen
t When Used
Accelerator
CA / FA Ratio = 55/45
Units: kg / m3 (L / m3)
Type V-2.0%
Accelerator
385.6 120.6 1140.8 933.4 3.24 (3.24) 2.1 7.71 445.0 136.2 1087.5 889.7 2.91 (2.80) 2.5 8.90 504.3 151.8 1034.1 846.1 2.47 (2.14) 2.8 10.09
w/c = 0.275 563.6 167.5 980.8 802.4 2.03 (1.87) 3.1 11.27
Type V-2.8%
Accelerator
385.6 120.6 1140.8 933.4 3.24 (3.24) 1.5 10.80
504.3 151.8 1034.1 846.1 2.64 (2.42) 1.5 14.12
Type III 326.3 128.9 1157.0 946.7 2.20 (2.14) 0.8 6.53 385.6 148.9 1096.9 897.5 1.87 (1.65) 1.9 7.71
w/c = 0.35 445.0 168.9 1036.8 848.3 1.65 (1.37) 2.3 8.90
Retarder (L / m3)
Rapid Set 326.3 144.8 1123.3 919.1 1.87 (1.70) 0.055 1.21 w/c = 0.4 385.6 167.7 1057.1 864.9 2.20 (1.81) 0.110 1.21
Type V / Rapid Set
Blend (VRS)
(50/50) 192.82 Type V, 192.82 Rapid
Set
144.1 1098.9 899.1 2.75 (2.53) 0.110 0.60
w/c = 0.3375 for VRS 50/50, w/c = 0.3063 for VRS 75/25
(75/25) 289.22 Type V, 96.41 Rapid
Set
132.4 1119.9 916.3 3.19 (3.08) 0.165 None
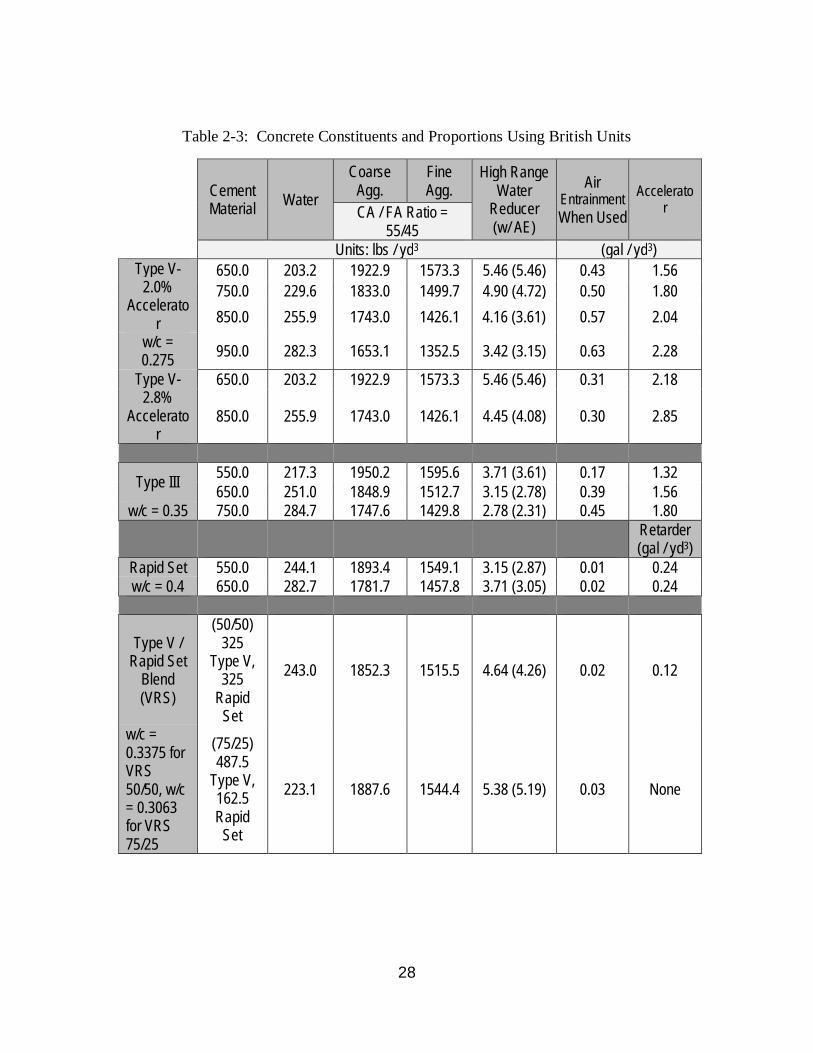
28
Table 2-3: Concrete Constituents and Proportions Using British Units
Cement Material Water
Coarse Agg.
Fine Agg.
High Range Water
Reducer (w/ AE)
Air Entrainment When Used
Accelerator
CA / FA Ratio = 55/45
Units: lbs / yd3 (gal / yd3)
Type V-2.0%
Accelerator
650.0 203.2 1922.9 1573.3 5.46 (5.46) 0.43 1.56 750.0 229.6 1833.0 1499.7 4.90 (4.72) 0.50 1.80 850.0 255.9 1743.0 1426.1 4.16 (3.61) 0.57 2.04
w/c = 0.275 950.0 282.3 1653.1 1352.5 3.42 (3.15) 0.63 2.28
Type V-2.8%
Accelerator
650.0 203.2 1922.9 1573.3 5.46 (5.46) 0.31 2.18
850.0 255.9 1743.0 1426.1 4.45 (4.08) 0.30 2.85
Type III 550.0 217.3 1950.2 1595.6 3.71 (3.61) 0.17 1.32 650.0 251.0 1848.9 1512.7 3.15 (2.78) 0.39 1.56
w/c = 0.35 750.0 284.7 1747.6 1429.8 2.78 (2.31) 0.45 1.80
Retarder (gal / yd3)
Rapid Set 550.0 244.1 1893.4 1549.1 3.15 (2.87) 0.01 0.24 w/c = 0.4 650.0 282.7 1781.7 1457.8 3.71 (3.05) 0.02 0.24
Type V / Rapid Set
Blend (VRS)
(50/50) 325
Type V, 325
Rapid Set
243.0 1852.3 1515.5 4.64 (4.26) 0.02 0.12
w/c = 0.3375 for VRS 50/50, w/c = 0.3063 for VRS 75/25
(75/25) 487.5
Type V, 162.5 Rapid
Set
223.1 1887.6 1544.4 5.38 (5.19) 0.03 None

29
For cylinders, the insulation consisted of wrapping the samples with layers of
curing blankets (R-Value = 3.4) before placing them in a curing box lined with ¾”
Styrofoam. The cube-shaped samples were placed into the described curing box. Layers
of curing blankets were placed between the box and the sample, including the top of the
sample, prior to closing the box with its lid. Beam-shaped specimens were wrapped
around their long axis with two layers of curing blankets and the ends (short dimensions)
taped closed.
Once test samples were insulated, they were placed on a wooden table and
covered by an additional layer of curing blanket to prevent any draft effects from the
laboratory’s climate control system.
2.3.2 24-Hour Curing
The 24-Hour (24 H) curing method had the same procedure as the OT curing
method for the duration of opening time. Afterward, the curing blanket was removed and
the test specimens, while remaining in their molds, were kept in the laboratory
environment to reach 24-hours of age prior to testing.
2.3.3 28-Day Moist Curing
Upon casting, test samples were kept in their mold, with no insulation, for 24
hours. Upon de-molding, they were kept in a moist curing room till they reached the age
of 28 days prior to testing.
30
2.4 Testing Equipment & Methods
The following sections discuss the mixing equipment and testing procedures used
to evaluate fresh and hardened properties of the studied high early-age strength concretes.
2.4.1 Mixing
This section covers the mixing equipment and procedure.
2.4.1.1 Mixer
A pan-style counter-current mixer with a capacity of 0.0283 m3 (1 ft3) and a
constant speed of 60 RPM was used. Figure 2-2 presents the rotating pan mixer used in
this study.
2.4.1.2 Mixing Time and Procedure
The following mixing procedure was adopted in the ordered mentioned.
1. Combined coarse aggregate and 1/3 mixing water (add air-entraining admixture if
needed).
2. Mixed for 2 minutes.
3. Added fine aggregate and 1/3 mixing water (add hydration stabilizer if needed).
4. Mixed for 2 minutes.
5. Added cement (Type V 1st for the blended cements) and the remaining mixing
water.
6. Mixed for additional 3 minutes.
7. Added accelerator and HRWR during the first minute of mixing cementitious
materials.

31
Figure 2-2: Rotating Pan Mixer
2.4.1.3 Consolidation
Upon molding, specimens were densified for a period of approximately 7
seconds, longer as workability decreased, using a vibrating table operating at 6200 Hertz
as shown in Figure 2-3.

32
Figure 2-3: Mechanical Consolidation Table
2.4.2 Fresh Properties of High Early-Age Strength Concretes
The following section discusses the equipment and test methods used to evaluate
fresh properties of the studied concretes.
2.4.2.1 Workability
To determine workability, the slump test was performed using the Abrams cone,
as shown in Figure 2-4, using ASTM C143/AASHTO T119. Material was removed from
the mixer immediately after mixing and the test was completed within two minutes.
2.4.2.2 Setting Times
The initial and final times of setting test was performed using an Acme
Penetrometer in accordance with the ASTM C403. To produce the test sample, fresh
concrete was wet-sieved through a #4 U.S. sieve, densified in a 152 mm x 152 mm x 152

33
mm (6 in. x 6 in. x 6 in.) mold, and tested immediately thereafter. The test apparatus is
also shown in Figure 2-4.
Figure 2-4: (Left) Abrams Slump Cone; (Right) Acme Penetrometer
2.4.2.3 Air Content and Unit Weight
The air content and unit weight of the studied freshly-mixed concretes were
identified by using a pressure-type air-content meter in accordance with ASTM C231.
This device, which had a sample size of 0.007 m3 (0.25 ft3), was also used to determine
unit weight of the trial HES concretes. The device is shown in Figure 2-5.

34
Figure 2-5: Air Content Meter - Pressure Type
2.4.2.4 Heat of Hydration
Heat of hydration of the studied high early-age strength concretes were evaluated
using 102 mm x 102 mm (4 in. x 4 in.) cylindrical samples in accordance with ASTM

35
C186. Figure 2-6 shows the heat of hydration set-up, including a USB-501-TC-LCD
thermocouple data collector, used in the study.
Figure 2-6: Heat of Hydration Set-Up
2.4.3 Hardened Properties of High Early-Age Strength Concretes
The following sections discuss the equipment and testing methods used to
evaluate hardened properties of the studied high early-age strength concretes.
2.4.3.1 Mechanical Properties
The two mechanical properties, using compression and bending test, that were
investigated in this study are presented in the following sections.
2.4.3.1.1 Compression Test
Cylindrical specimens with dimensions of 102 mm x 203 mm (4in. x 8 in.) were
used to evaluate compressive strengths of the studied concretes at different ages in
accordance with ASTM C39. Figure 2-7 shows the compression-loading machine used
in this study. The loading capacity of the machine was 2,224 kN (500,000 lbs). For
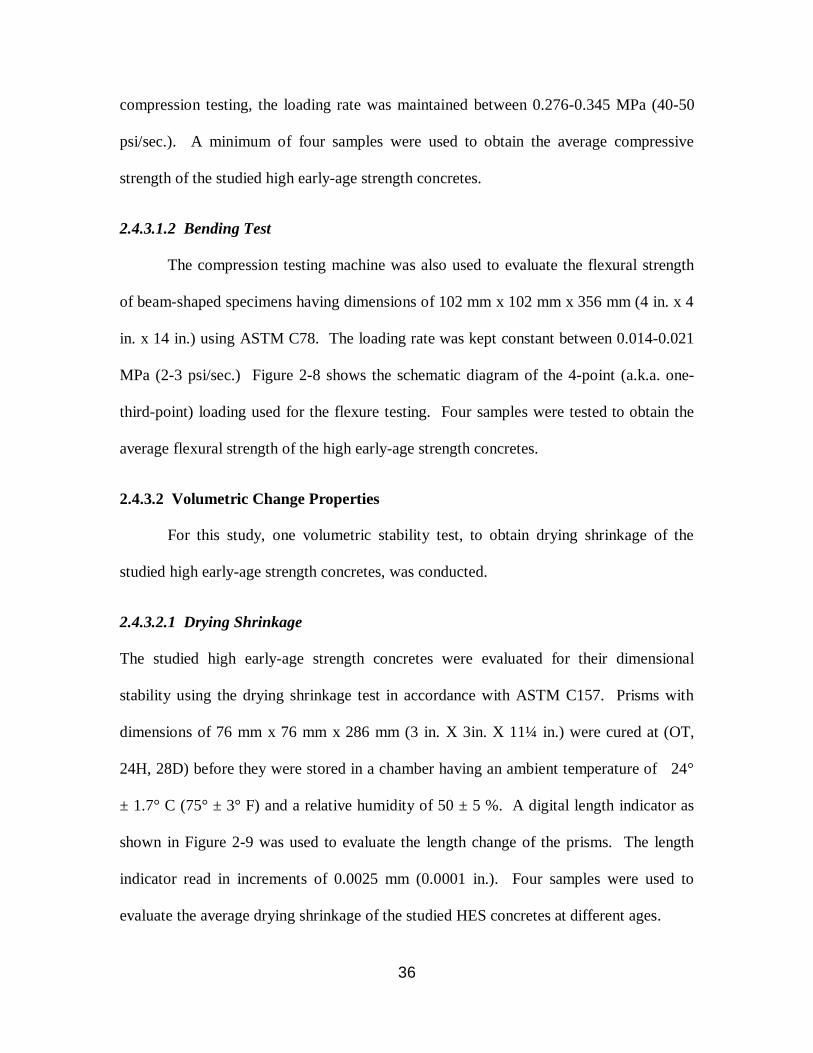
36
compression testing, the loading rate was maintained between 0.276-0.345 MPa (40-50
psi/sec.). A minimum of four samples were used to obtain the average compressive
strength of the studied high early-age strength concretes.
2.4.3.1.2 Bending Test
The compression testing machine was also used to evaluate the flexural strength
of beam-shaped specimens having dimensions of 102 mm x 102 mm x 356 mm (4 in. x 4
in. x 14 in.) using ASTM C78. The loading rate was kept constant between 0.014-0.021
MPa (2-3 psi/sec.) Figure 2-8 shows the schematic diagram of the 4-point (a.k.a. one-
third-point) loading used for the flexure testing. Four samples were tested to obtain the
average flexural strength of the high early-age strength concretes.
2.4.3.2 Volumetric Change Properties
For this study, one volumetric stability test, to obtain drying shrinkage of the
studied high early-age strength concretes, was conducted.
2.4.3.2.1 Drying Shrinkage
The studied high early-age strength concretes were evaluated for their dimensional
stability using the drying shrinkage test in accordance with ASTM C157. Prisms with
dimensions of 76 mm x 76 mm x 286 mm (3 in. X 3in. X 11¼ in.) were cured at (OT,
24H, 28D) before they were stored in a chamber having an ambient temperature of 24°
± 1.7° C (75° ± 3° F) and a relative humidity of 50 ± 5 %. A digital length indicator as
shown in Figure 2-9 was used to evaluate the length change of the prisms. The length
indicator read in increments of 0.0025 mm (0.0001 in.). Four samples were used to
evaluate the average drying shrinkage of the studied HES concretes at different ages.

37
Figure 2-7: Compression Loading Machine
Figure 2-8: Flexure Schematic for 4-Point Loading (a.k.a. 1/3 Point Loading)
102mm(4in.)
102mm(4in.)
102mm(4in.)

38
Figure 2-9: Dry Shrinkage Length Indicator
2.4.3.3 Transport Properties
For the studied high early-age strength concretes, five transport properties were
evaluated. These properties were: Absorption, Water Permeability, Rapid Chloride
Penetration, Rapid Migration, and Corrosion Tests.
2.4.3.3.1 Absorption
The absorption properties of the studied high early-age strength concretes were
evaluated in accordance with ASTM C642 using cylindrical specimens with a a diameter
of 102 mm (4 in.) and a height of 51 mm (2 in.). These properties included Absorption
After Immersion, Absorption After Immersion and Boiling, and Volume of Permeable

39
Pore Space (Voids). The procedure used to evaluate absorption properties was as follows
in the order mentioned:
Samples were placed in an oven at 80° C (176° F) for 7 days, then weighed.
Samples were soaked in regular tap water at laboratory temperature for 7 days
before they were towel dried to saturated surface dry SSD condition and weighed.
Samples were boiled for 4 hours and held for 20 hours, before they were weighed
in SSD condition again.
Samples were placed in a wire mesh basket and immersed in water to obtain the
buoyancy weight.
Figure 2-10 shows the equipment used to evaluate absorption properties of the test
specimens.
Figure 2-10: Absorption Equipment; Oven, Boiling Pot, and Balance with Buoyancy Basket

40
2.4.3.3.2 Water Permeability
The water permeability of the studied high early-age strength concretes was
conducted in accordance with EN 12390-8:2000 using cube shaped specimens of 152 mm
x 152 mm x 152 mm (6 in. x 6 in. x 6 in.). The water permeability apparatus, with 3
samples, is shown in Figure 2-11 The air-pressure for the system was maintained at 5
bars during testing. The test was conducted for 3 days. Once stopped, the sample was
removed, split in two equal halves using the compression machine. As water penetration
discolored the concrete, the depth of this discoloration was immediately marked on both
halves and measured. The standard states to avoid taking measurements at aggregate-
paste interfaces and where voids connect to the surface being tested. The tested surface
was chosen based on the fewest visible voids. Three samples per curing type (OT, 24H,
28D) for each batch design were tested.
2.4.3.3.3 Rapid Chloride penetration Test
For the studied high early-age strength concretes, the Rapid Chloride Penetration
Test (RCPT) was conducted on 102 mm (4 in.) x 51 mm (2 in.) cylindrical specimens
using ASTM C1202. Four samples were used to obtain the average RCPT results.
Figure 2-12 shows the RCPT set-up. The Sodium Chloride (NaCl) solution was at 3.0%
and the Sodium Hydroxide (NaOH) solution was at a concentration of 0.3 M. The
current was directed through the NaCl (Cathode/Catholyte) side to the NaOH
(Anode/Anolyte) side (negative - to - positive). The sample was placed into the acrylic
molds with the bottom of sample on the NaCl side and the troweled top on the NaOH
side, see the schematic in Figure 2-12.

41
Figure 2-11: Water Permeability Test Apparatus

42
2.4.3.3.4 Rapid Migration Test
Rapid Migration Test (RMT) of the studied high early-age strength concretes
studied were conducted in accordance with NT Build 492. The cylindrical samples had
dimensions of 102 mm (4 in.) x 51 mm (2 in.) and 4 samples were used to determine
average RMT results. Figure 2-13 shows the Rapid Migration Test set-up. The Sodium
Chloride (NaCl) solution was at 10.0% and the Sodium Hydroxide (NaOH) solution was
at a concentration of 0.3 M. The current was directed through the NaCl
(Cathode/Catholyte) side to the NaOH (Anode/Anolyte) side (negative-to-positive). The
sample was placed into the rubber molds with the bottom of sample on the NaCl side and
the troweled top on the NaOH side (see the schematic diagram in Figure 2-13.)
Once the test was completed, the samples were promptly removed and split in half
using a compression machine. Both halves were sprayed with a silver nitrate (AgNO3)
solution at a concentration of 0.1 M. The AgNO3 reacted with the Cl- which penetrated
into the sample and discolored the sample. This discoloration was measured from the
bottom of the sample. For this study measurements were taken approximately 4 mm
apart.
2.4.3.3.5 Corrosion
The corrosion tests of the studied high early-age strength concretes were
conducted using 102 mm (4 in.) x 152 mm (6 in.) cylindrical specimens in accordance to
FM 5-522. The test set-up is shown in Figure 2-14 along with a schematic illustrating the
cross-section of the sample to clarify re-bar location. The re-bar used in this study was
typical 12.7 mm (½ in. or #4) Grade 60, and the salt water was 5% NaCl. The depth of
the salt water was maintained to 3 in. The voltage was 30 volts and the test continued
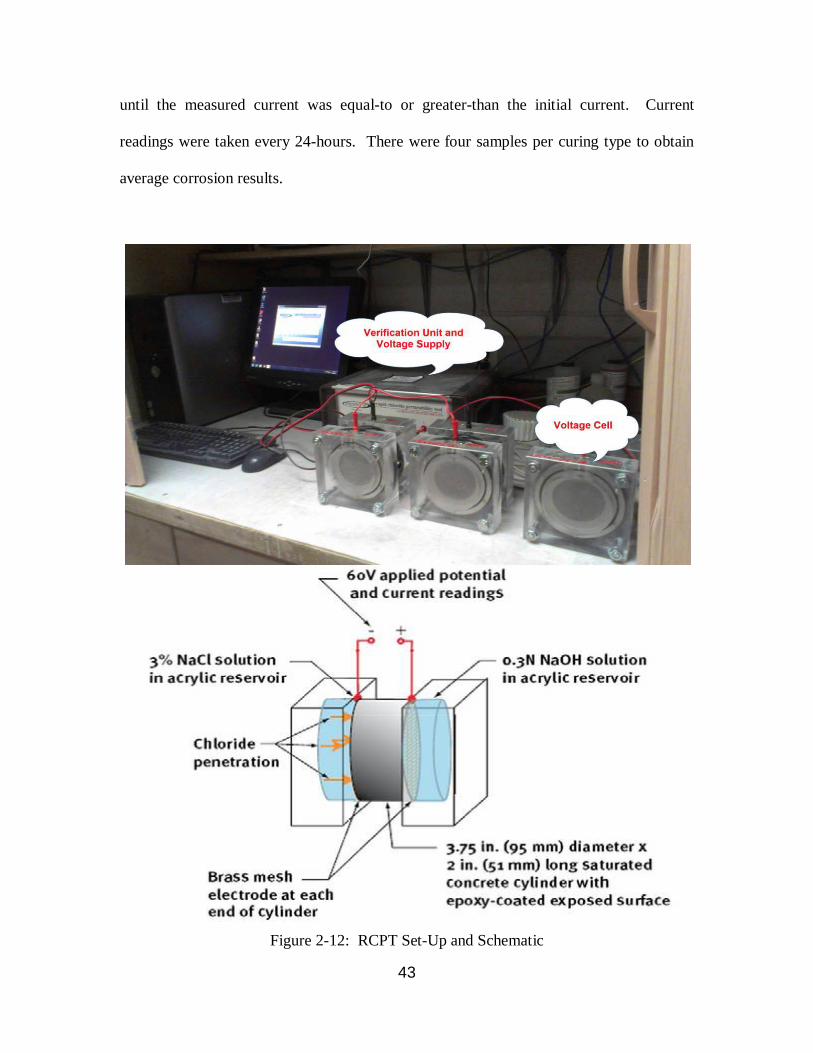
43
until the measured current was equal-to or greater-than the initial current. Current
readings were taken every 24-hours. There were four samples per curing type to obtain
average corrosion results.
Figure 2-12: RCPT Set-Up and Schematic
44
Figure 2-13: RMT Set-Up and Schematic

45
Figure 2-14: Corrosion Set-Up and Schematic
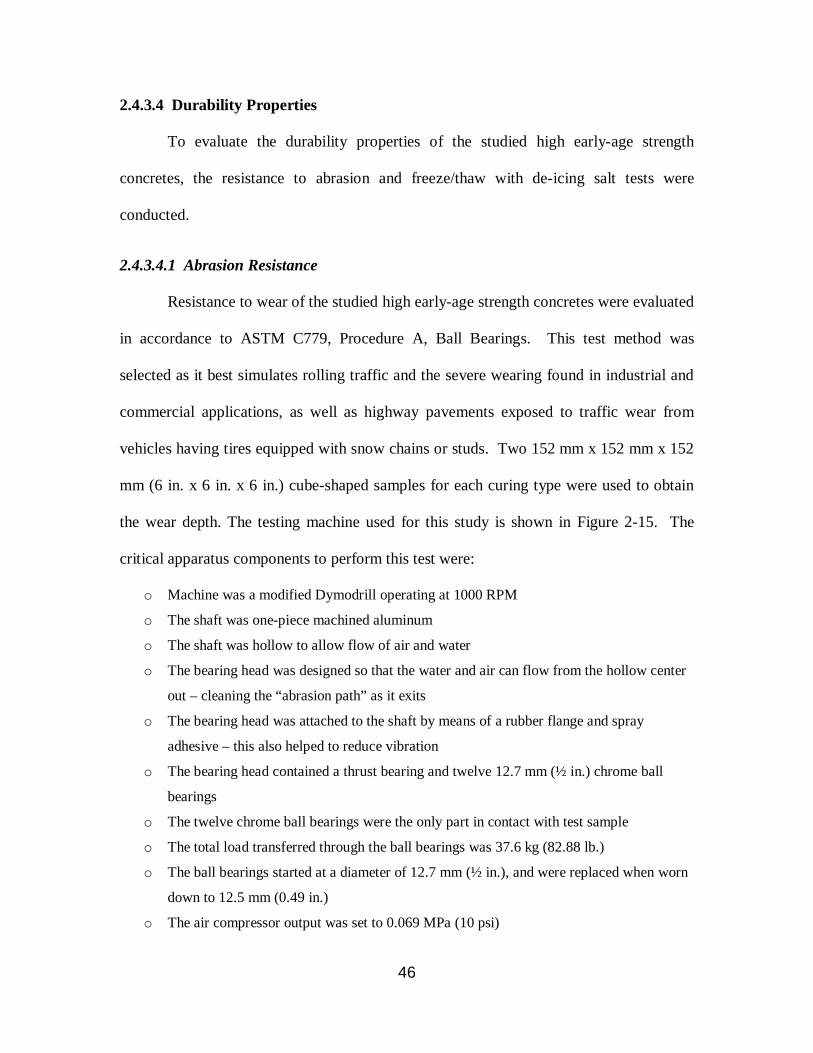
46
2.4.3.4 Durability Properties
To evaluate the durability properties of the studied high early-age strength
concretes, the resistance to abrasion and freeze/thaw with de-icing salt tests were
conducted.
2.4.3.4.1 Abrasion Resistance
Resistance to wear of the studied high early-age strength concretes were evaluated
in accordance to ASTM C779, Procedure A, Ball Bearings. This test method was
selected as it best simulates rolling traffic and the severe wearing found in industrial and
commercial applications, as well as highway pavements exposed to traffic wear from
vehicles having tires equipped with snow chains or studs. Two 152 mm x 152 mm x 152
mm (6 in. x 6 in. x 6 in.) cube-shaped samples for each curing type were used to obtain
the wear depth. The testing machine used for this study is shown in Figure 2-15. The
critical apparatus components to perform this test were:
o Machine was a modified Dymodrill operating at 1000 RPM
o The shaft was one-piece machined aluminum
o The shaft was hollow to allow flow of air and water
o The bearing head was designed so that the water and air can flow from the hollow center
out – cleaning the “abrasion path” as it exits
o The bearing head was attached to the shaft by means of a rubber flange and spray
adhesive – this also helped to reduce vibration
o The bearing head contained a thrust bearing and twelve 12.7 mm (½ in.) chrome ball
bearings
o The twelve chrome ball bearings were the only part in contact with test sample
o The total load transferred through the ball bearings was 37.6 kg (82.88 lb.)
o The ball bearings started at a diameter of 12.7 mm (½ in.), and were replaced when worn
down to 12.5 mm (0.49 in.)
o The air compressor output was set to 0.069 MPa (10 psi)

47
o The water was regular tap water at laboratory temperature, the container was a standard
5-gallon bucket mounted such that the height of the bucket produced 1,143 mm (45 in.)
of head pressure
o The water output was gravity feed at a rate of 2.25-3.0 L / 20 min. test (0.6-0.8 gal/20
min. test)
o The water and air were turned on prior to the start of testing.
o The gauge interval was 0.0025 mm (9.84 x 10⁻⁵ in.)
o The test was conducted for 20 minutes and 30 seconds while taking readings every 30
seconds, or until an abrasion depth reached 3.0 mm (0.113 in.)
Figure 2-15: Abrasion Resistance Testing Machine

48
2.4.3.4.2 Resistance to Freezing and Thawing
Resistance to freezing and thawing of high early-age strength concretes were
evaluated in accordance to ASTM C672 using cylindrical specimens mm x mm (in x in).
Four samples per curing type were made, to determine the average mass loss per freezing
and thawing cycle.
To start a four-day testing cycle, the samples were soaked in a 3% salt water
solution for 48 hours prior to placing into a freezer for 48 hours. The first 24 hours of
soaking took place on a shelf in the laboratory. The second day of soaking took place in
the pre-cooler which was set to 0° ± 1° C (32° ± 1.8° F). The purpose of the pre-cooling
was to smooth out the freezing period during the phase change by allowing the internal
heat energy of the sample to release prior to freezing. Without this pre-cooling, there was
a temperature spike of approximately 2.8° C (5° F) that occurred just after the start of the
phase change (-2.78° C or 27° F for 3% salt water solutions). This was due to the rapid
release of heat energy by the sample into the water. This spike in temperature would
occur over a 15-20 minute period, but it would take approximately 12 hours for the
temperature to lower back down and for the phase change to finish.
After the samples had been in the pre-cooler for 24 hours, they were moved into
the freezer with the cooling rate set to reach -14.4° ± 1° C (6° ± 1.8° F) at an elapsed time
of 24 hours. Then freezer cooling rate was reset to maintain the temperature for the next
24 hours. At the end of the freezing cycle, samples were removed and placed outside at
room temperature for the first 24 hours of thawing cycle.

49
Figure 2-16 shows the typical trend for temperature as a function of freezing and
thawing cycles. The spike at 24 hours is due to moving the samples from the cooler to
the freezer. Figures 2-17 and 2-18 show the pre-cooler and the freezer respectively.
Figure 2-16: Typical Trend for the Cooling of the Freeze/Thaw Samples
-10
0
10
20
30
40
50
60
70
80
0 6 12 18 24 30 36 42 48 54 60 66 72
Tem
pera
ture
(F)
Time (Hrs)
Air Sample Water
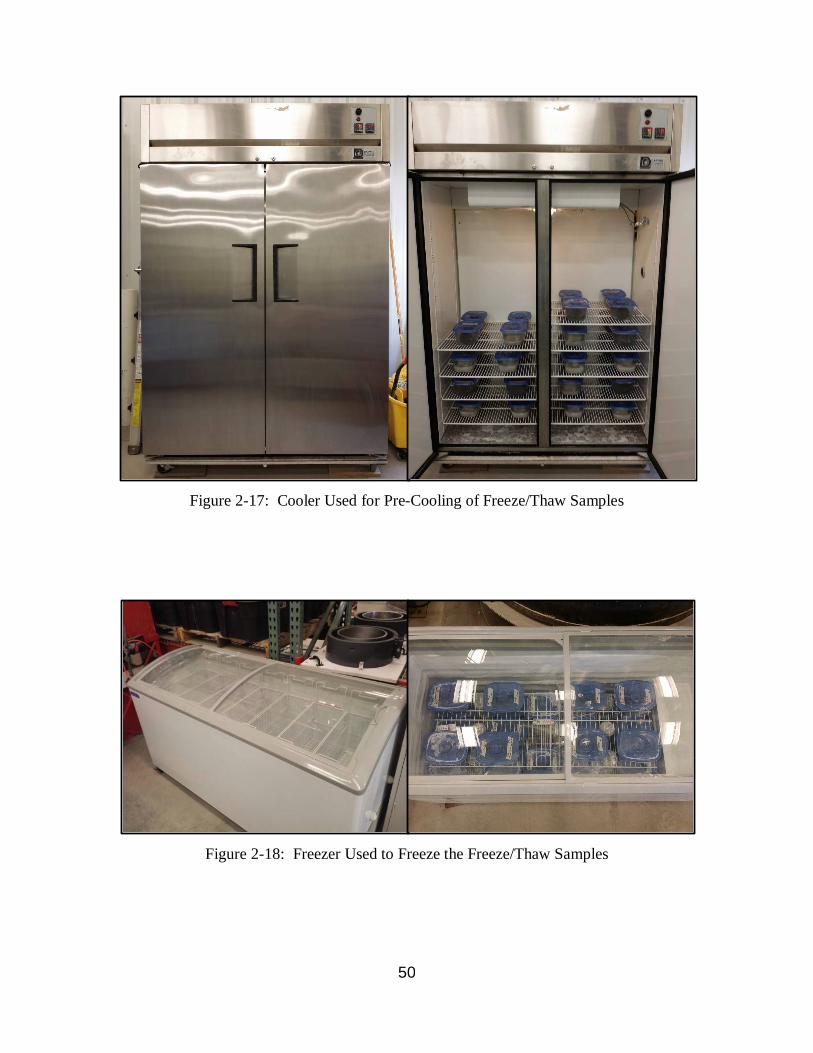
50
Figure 2-17: Cooler Used for Pre-Cooling of Freeze/Thaw Samples
Figure 2-18: Freezer Used to Freeze the Freeze/Thaw Samples

51
2.5 Summary of Experimental Program
Table 2-4 shows the high early-age strength concrete testing program with respect
to test performed, curing ages investigated for each test, and air-entrainment.
Table 2-4: Experimental Program
Properties
Test Without Air-Entrainment
With Air-Entrainment
Fresh
Flow
Setting Time Air Content
Unit Weight
Hydration Heat
Mechanical Compression OT – 24H - 28D OT – 24H - 28D
Flexure OT – 24H - 28D
Volume Change Dry Shrinkage OT – 24H - 28D
Transport
Absorption OT – 24H - 28D OT – 24H - 28D
Water Permeability 24H - 28D RCPT 24H - 28D 24H - 28D
RMT 24H - 28D 24H - 28D
Corrosion of Steel 24H - 28D
Durability Abrasion Resistance 24H - 28D Freeze / Thaw w/ Salt 24H - 28D

52
Chapter 3 Fresh Properties of High Early-Age Strength Concretes
Chapter 3 presents the results of the fresh properties for the studied high early-age
strength concretes. The required HRWR to maintain a uniform workability, workability,
time of setting, air content and unit weight, and heat of hydration are discussed for
concretes made with different cement factors of ASTM Types V and III Portland cement,
Rapid Set, and blended cements.
3.1 Required HRWR to Maintain Uniform Workability
Table 3-1 presents the results of the required HRWR to attain uniform workability
for the studied high early-age strength concretes. In order to achieve target workability
of 102 ± 25mm (4 ± 1 in.), the amount of HRWR varied amongst the studied concrete
while remaining below the maximum allowable dosage of 3.24 kg/m3 (12 fl. Oz./100 lb.
cement wt.) recommended by the manufacturer.
When 386 kg/m3 (650 lb/yd3) cement factor was used, the amount of HRWR
remained the same for both air-entrained and non-air-entrained concretes. When using
air-entrainment with the other three Type V cement factors, a reduction of HRWR was
needed in order to maintain a uniform workability.
For high early-age strength Type III cement concrete, the higher Blain Fineness
combined with the low water-to-cement ratio (w/c) of 0.275 resulted in having to exceed
the HRWR manufacturer’s recommended dosage in order to maintain the target
workability. Subsequently, the w/c for Type III Portland cement was increased to 0.35.

53
The demand for HRWR decreased with increasing Type III cement factor and use of air-
entraining admixture.
For the Rapid Set cement concrete, the manufacturer recommends a minimum w/c
of 0.40 due to its high demand for mixing water. As shown in Table 3-1, an increase in
HRWR was needed with increasing Rapid Set cement factor. A decrease is shown when
comparing air-entrained with non-air-entrained concrete made with a similar cement
factor.
In addition to the above-mentioned three cement types, two blended cements were
also used. Both the 50/50 cement (50% Type V and 50% Rapid Set) and the 75/25
cement (75% Type V and 25% Rapid Set) produced slump values of 165-191 mm (6½ –
7½ in.) for both air-entrained and non-air-entrained concrete. This slump was accepted
as it provided adequate working time required when using Rapid Set cement. However,
the increased working time delayed setting and hardening of Type V cement.
3.2 Workability
Table 3-1 also documents the slump values for the studied high early-age strength
concretes. It was observed, through physical batching and noting the time, that the
window of workability for these concretes was approximately 13 ± 1 minutes. This
period reflects the available time to properly cast and densify the studied concretes. As
can be seen, the target workability (slump value) was kept fairly uniform for each cement
type and selected water-to-cement ratio used in this study. As alluded to in Section 3.1,
the amount of HRWR varied in order to attain the target workability.
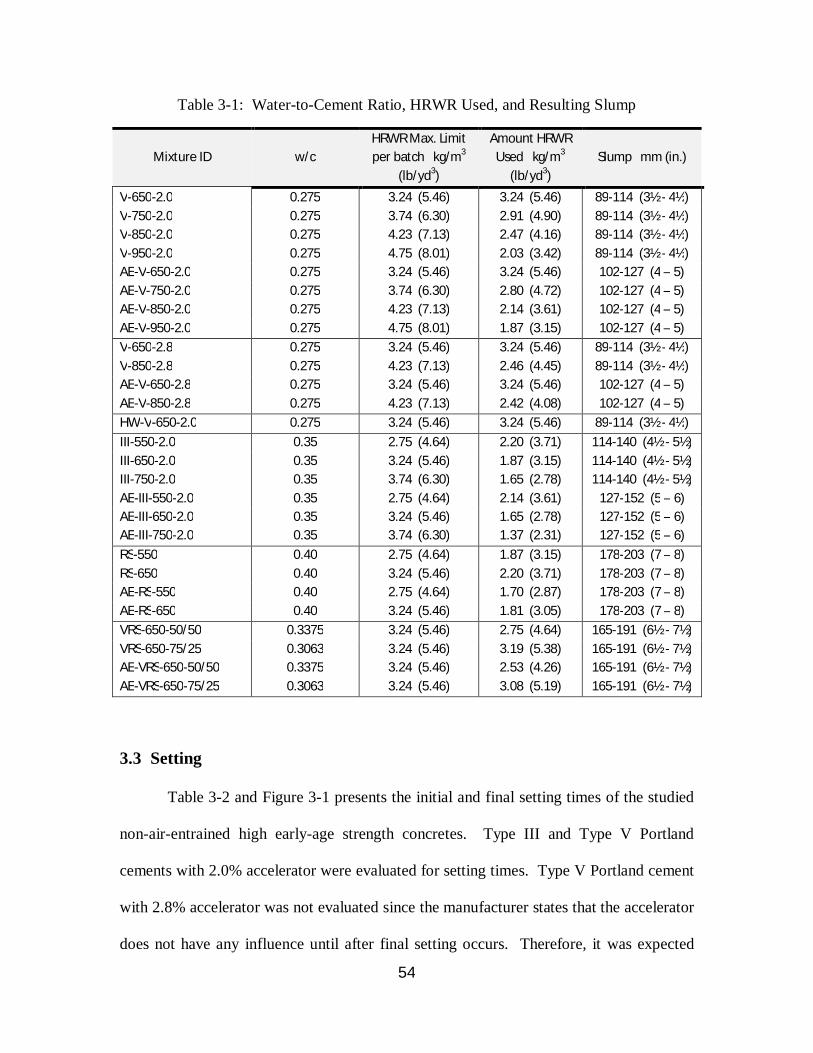
54
Table 3-1: Water-to-Cement Ratio, HRWR Used, and Resulting Slump
Mixture ID w/c HRWR Max. Limit per batch kg/m3
(lb/yd3)
Amount HRWR Used kg/m3
(lb/yd3) Slump mm (in.)
V-650-2.0 0.275 3.24 (5.46) 3.24 (5.46) 89-114 (3½ - 4½) V-750-2.0 0.275 3.74 (6.30) 2.91 (4.90) 89-114 (3½ - 4½) V-850-2.0 0.275 4.23 (7.13) 2.47 (4.16) 89-114 (3½ - 4½) V-950-2.0 0.275 4.75 (8.01) 2.03 (3.42) 89-114 (3½ - 4½) AE-V-650-2.0 0.275 3.24 (5.46) 3.24 (5.46) 102-127 (4 – 5) AE-V-750-2.0 0.275 3.74 (6.30) 2.80 (4.72) 102-127 (4 – 5) AE-V-850-2.0 0.275 4.23 (7.13) 2.14 (3.61) 102-127 (4 – 5) AE-V-950-2.0 0.275 4.75 (8.01) 1.87 (3.15) 102-127 (4 – 5) V-650-2.8 0.275 3.24 (5.46) 3.24 (5.46) 89-114 (3½ - 4½) V-850-2.8 0.275 4.23 (7.13) 2.46 (4.45) 89-114 (3½ - 4½) AE-V-650-2.8 0.275 3.24 (5.46) 3.24 (5.46) 102-127 (4 – 5) AE-V-850-2.8 0.275 4.23 (7.13) 2.42 (4.08) 102-127 (4 – 5) HW-V-650-2.0 0.275 3.24 (5.46) 3.24 (5.46) 89-114 (3½ - 4½) III-550-2.0 0.35 2.75 (4.64) 2.20 (3.71) 114-140 (4½ - 5½) III-650-2.0 0.35 3.24 (5.46) 1.87 (3.15) 114-140 (4½ - 5½) III-750-2.0 0.35 3.74 (6.30) 1.65 (2.78) 114-140 (4½ - 5½) AE-III-550-2.0 0.35 2.75 (4.64) 2.14 (3.61) 127-152 (5 – 6) AE-III-650-2.0 0.35 3.24 (5.46) 1.65 (2.78) 127-152 (5 – 6) AE-III-750-2.0 0.35 3.74 (6.30) 1.37 (2.31) 127-152 (5 – 6) RS-550 0.40 2.75 (4.64) 1.87 (3.15) 178-203 (7 – 8) RS-650 0.40 3.24 (5.46) 2.20 (3.71) 178-203 (7 – 8) AE-RS-550 0.40 2.75 (4.64) 1.70 (2.87) 178-203 (7 – 8) AE-RS-650 0.40 3.24 (5.46) 1.81 (3.05) 178-203 (7 – 8) VRS-650-50/50 0.3375 3.24 (5.46) 2.75 (4.64) 165-191 (6½ - 7½) VRS-650-75/25 0.3063 3.24 (5.46) 3.19 (5.38) 165-191 (6½ - 7½) AE-VRS-650-50/50 0.3375 3.24 (5.46) 2.53 (4.26) 165-191 (6½ - 7½) AE-VRS-650-75/25 0.3063 3.24 (5.46) 3.08 (5.19) 165-191 (6½ - 7½)
3.3 Setting
Table 3-2 and Figure 3-1 presents the initial and final setting times of the studied
non-air-entrained high early-age strength concretes. Type III and Type V Portland
cements with 2.0% accelerator were evaluated for setting times. Type V Portland cement
with 2.8% accelerator was not evaluated since the manufacturer states that the accelerator
does not have any influence until after final setting occurs. Therefore, it was expected

55
that it would produce similar results as the Type V Portland cement with 2.0%
accelerator.
The initial setting of high early-age strength concrete containing Type III Portland
cement remained fairly uniform around 69 minutes as the cement factor increased from
550 to 750 lb/yd3. The final setting time marginally varied from 120 to 130 minutes as
the cement factor increased from 550 to 750 lb/yd3.
When Type V Portland cement was used, the initial setting time of high early-age
strength concretes remained independent of cement factor at approximately 85 minutes,
whereas the final setting time steadily decreased from 169 minutes for 650 lb/yd3 to 151
minutes for cement factor of 950 lb/yd3.
The reduction in setting times in Type III when compared to Type V Portland
cement is due to Type III cement having an increased C3S content and higher Blain
Fineness (see Table 1-10). It is well established that an increase in water-to-cement ratio
leads to an increase in setting times. Since the studied concretes made with Type III
Portland cement had a higher water-to-cement ratio, it would suggest that its C3S and
Blain Fineness had greater influence on setting time than water-to-cement ratio.
high early-age strength concretes containing Rapid Set cement were not evaluated
for setting times since the manufacturer assigned 20 minutes for initial setting and 30
minutes for final setting. This uniformity in setting times when Rapid Set concrete is
used, including the blended cements (50/50 and 75/25), is also reflected in the results
obtained for heat of hydration as discussed in Section 3.5.

56
Table 3-2: Initial and Final Setting Times for Type III and Type V Cement Concretes
Cement Type Cement Factors (lb/yd3) Type III 550 650 750 850 950
Initial Setting Time 68 70 68 Final Setting Time 130 129 120 Type V Initial Setting Time 87 86 84 85
Final Setting Time 167 158 154 151
Times are in minutes.
Figure 3-1: Initial and Final Setting Times for Type III and Type V
0
20
40
60
80
100
120
140
160
180
550 650 750 850 950
Sett
ing
Tim
es (
min
)
Cement Factor (lb/yd3)
Initial Setting Type V Final Setting Type V
Initial Setting Type III Final Setting Type III

57
3.4 Air Content and Unit Weight
Table 3-3 presents the results of the air content for both non-air-entrained and air-
entrained high early-age strength concretes. The target air content for air-entrained
concretes was 6 ± 1 %. The air content of studied air-entrained concretes ranged from
5.8 to 6.8 %.
It is important to note that the concretes made with Rapid Set cement, and the two
blended cements, required unusually low dosages of air-entrainment admixtures 0.055 –
0.165 L/m3 (0.01 – 0.03 gal/yd3) to achieve the targeted air-content. Figure 3-2 shows
the air content of Rapid Set cement as a function of air-entraining admixture dosage for
concrete containing 650 lb/yd3. The trend shows that Rapid Set cement concrete was
extremely sensitive to air-entrainment.
With respect to unit weight, as shown in Table 3-3, the range for non-air-
entrained concretes was 158.4 - 154.2 lb/ft3 and for air-entrained mixtures was 156.1 –
148.4 lb/ft3. It can also be seen that both entrained and non-entrained high early-age
strength Type V Portland cement concretes had the highest unit weights, whereas Rapid
Set cement concretes exhibited the lowest unit weights amongst the studied mixtures.
3.5 Heat of Hydration
The results of heat of hydration of the studied high early-age strength concrete are
presented in Table 3-4 and Figure 3-3. Table 3-4 provides hydration temperature at
opening time, as well as maximum heat of hydration and the elapsed time corresponding
to peak temperature. Figure 3-3 shows the heat of hydration reached at opening time.
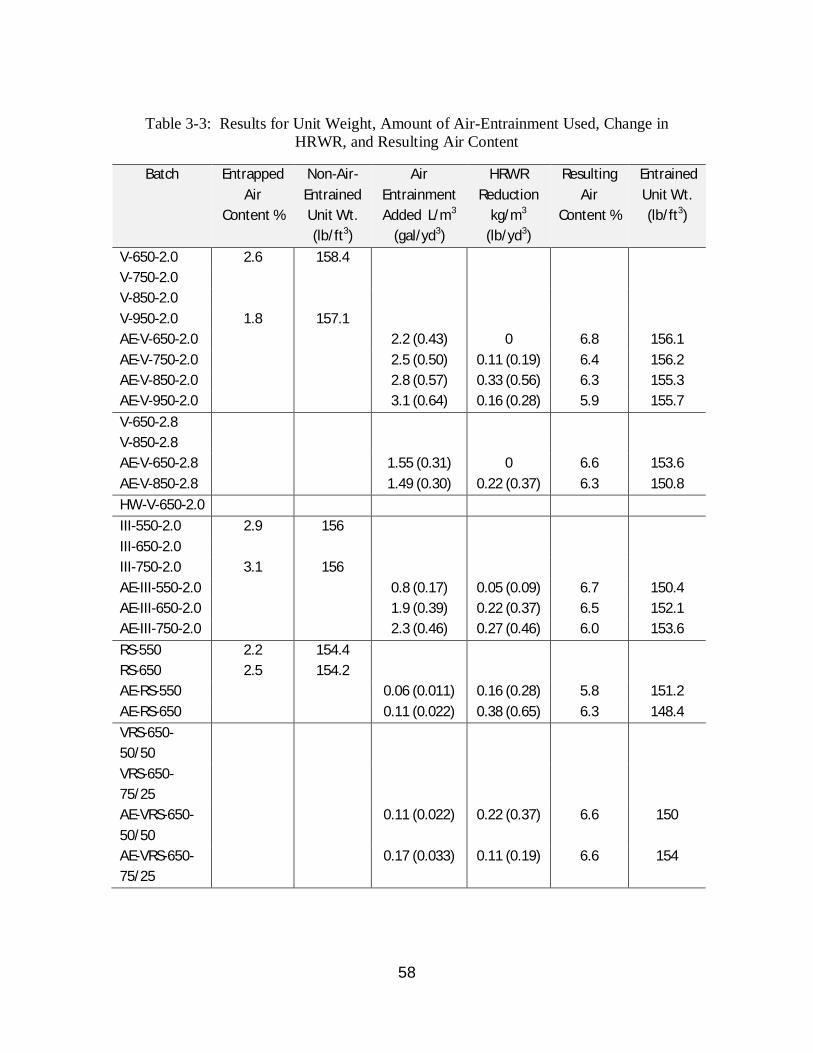
58
Table 3-3: Results for Unit Weight, Amount of Air-Entrainment Used, Change in
HRWR, and Resulting Air Content
Batch Entrapped Air
Content %
Non-Air-Entrained Unit Wt. (lb/ft3)
Air Entrainment Added L/m3
(gal/yd3)
HRWR Reduction
kg/m3 (lb/yd3)
Resulting Air
Content %
Entrained Unit Wt. (lb/ft3)
V-650-2.0 2.6 158.4 V-750-2.0 V-850-2.0 V-950-2.0 1.8 157.1 AE-V-650-2.0 2.2 (0.43) 0 6.8 156.1 AE-V-750-2.0 2.5 (0.50) 0.11 (0.19) 6.4 156.2 AE-V-850-2.0 2.8 (0.57) 0.33 (0.56) 6.3 155.3 AE-V-950-2.0 3.1 (0.64) 0.16 (0.28) 5.9 155.7 V-650-2.8 V-850-2.8 AE-V-650-2.8 1.55 (0.31) 0 6.6 153.6 AE-V-850-2.8 1.49 (0.30) 0.22 (0.37) 6.3 150.8 HW-V-650-2.0 III-550-2.0 2.9 156 III-650-2.0 III-750-2.0 3.1 156 AE-III-550-2.0 0.8 (0.17) 0.05 (0.09) 6.7 150.4 AE-III-650-2.0 1.9 (0.39) 0.22 (0.37) 6.5 152.1 AE-III-750-2.0 2.3 (0.46) 0.27 (0.46) 6.0 153.6 RS-550 2.2 154.4 RS-650 2.5 154.2 AE-RS-550 0.06 (0.011) 0.16 (0.28) 5.8 151.2 AE-RS-650 0.11 (0.022) 0.38 (0.65) 6.3 148.4 VRS-650-50/50
VRS-650-75/25
AE-VRS-650-50/50
0.11 (0.022) 0.22 (0.37) 6.6 150
AE-VRS-650-75/25
0.17 (0.033) 0.11 (0.19) 6.6 154

59
Figure 3-2: Air Content of Rapid Set concrete as a Function of Air-Entraining
Admixture, Cement Factor 650 lb/yd3
3.5.1 Opening Time Heat of Hydration
As can be seen from Figure 3-3 and Table 3-4, the opening time heat of hydration
increased with an increase in cement factor. For non-air-entrained Type V-2.0 cement
concretes, the heat of hydration ranged from 102.1° F at 6 ½ hours to 112.2° F at 5.0
hours. It can also be seen that the Type V-2.0 cement air-entrained concrete followed a
similar trend with temperatures of 101.1° F at 8 ½ hours to 118.9° F at 7 hours. For the
Type V-2.8 cement concretes without air entrainment, the heat of hydration ranged from
103.5° F at 5 ½ hours to 105.4° F at 4 ½ hours. Type V-2.8 cement air-entrained
concretes followed a similar trend with temperatures of 102.3° F at 7 ½ hours to 111.7° F
at 6 ½ hours.
0
0.0285
0.0356
0.1
0.205
0.5
0
1
2
3
4
5
6
7
8
9
10
11
0 0.1 0.2 0.3 0.4 0.5
Air-
Entr
ainm
ent
(%)
Percent of Admixture per cwt (Values Show in Plot)
AE RS 650

60
When high early-age strength Type III cement concretes without air entrainment
were evaluated, heat of hydration at opening time ranged from 106.0° F at 5 ½ hours to
114.0° F at 4 ½ hours. Air-entrained Type III cement concretes displayed opening time
heat of hydration temperatures of 109.5° F at 6 ½ hours to 120.1° F at 5 ½ hours.
The studied concretes containing Rapid Set cement had a constant opening time
of 1 hour and showed a higher heat of hydration at opening time with increasing cement
factor. The non-air-entrained mixtures showed 118.1° F to 126.4° F, whereas the air-
entrained concretes produced 116.8° F to 120.9° F.
High early-age strength concretes made with blended cements of 75% Type V and
25% Rapid Set (75/25) produced a slightly higher hydration temperature of 106.9° F at
opening time when compared to the concretes containing 50% Type V and 50% Rapid
Set cements (50/50) which produced 105.9° F at opening time. However, their opening
times were noticeably different with 75/25 concrete at 5.5 hours and only 1 hour for the
50/50 concrete. The air-entrained 50/50 blended cement concretes produced higher heat
of hydration in a shorter time span with 110.5° at 1 ½ hours as compared to 106.7° at 6 ½
hours for the air-entrained concrete containing 75/25 blended cement.
Figure 3.4 and 3.5 present a typical heat of hydration over a 24-hour period for
non air-entrained and air-entrained concretes, respectively, made with cement factor of
650 lb/yd3. Type III cement concrete began its main hydration phase sooner than the
Type V cement mixtures and a higher temperature over the course of 24 hours. The
studied concretes made with Rapid Set cement had an immediate and steep slope,
indicating its main hydration phase occurred quickly and proceeded at an extremely fast
pace. For the two blended cement mixtures, it can be seen that as the amount of Rapid

61
Set cement was decreased, the slope of the main hydration phase also decreased and the
peak temperature took place at the higher elapsed time.
Table 3-4: Heat of Hydration at Opening Time and Maximum Heat of Hydration
Including Elapsed Time
Heat @ OT
Opening Maximum Heat
Elapsed Time Time Type V-2.0 °F (hrs) °F (hrs)
650 102.1 6.5 103.1 7.2 AE-650 101.1 8.5 101.6 7.9
HW-650 102.4 6.5 105.0 8.1 750 105.1 6.0 108.9 7.8
AE-750 109.2 8.0 109.6 8.1 850 103.5 5.5 115.4 8.1
AE-850 113.6 7.5 114.5 8.2 950 112.2 5.0 122.4 7.7
AE-950 118.9 7.0 119.7 7.9 Type V-2.8 650 103.5 5.5 104.5 6.3
AE-650 102.3 7.5 102.3 7.2 850 105.4 4.5 110.3 6.5
AE-850 111.7 6.5 112.1 6.8 Type III 550 106.0 5.5 110.2 7.4
AE-550 109.5 6.5 110.9 7.5 650 111.9 5.0 117.8 7.4
AE-650 116.2 6.0 119.0 7.9 750 114.0 4.5 124.0 7.3
AE-750 120.1 5.5 124.8 7.6 RS 550 118.1 1.0 119.8 1.5
AE-550 116.8 1.0 121.3 1.8 650 126.4 1.0 130.7 1.5
AE-650 120.9 1.0 126.0 1.6 VRS 50/50 105.9 1.0 111.6 1.8
AE-50/50 110.5 1.5 110.9 1.6 75/25 106.9 5.5 107.0 5.5
AE-75/25 106.7 6.5 107.1 6.5

62
In summary, the opening time hydration temperatures for the blended cement
mixtures were higher than those of Type V-2.0 and V-2.8 cement concretes, but lower
than those of concrete containing 100% Rapid Set cement.
3.5.2 Maximum Heat of Hydration
The maximum hydration temperature and the elapsed time corresponding to peak
temperature are given in Table 3-4 and Figure 3-6.
When examining maximum heat of hydration with respect to cement content, it is
noticed that hydration temperature increased with increases in cement factor. This is
explained by the increased availability of cementitious materials for hydration reaction.
In addition, as cement factors exceeded 750 lb/yd3, the maximum heat of hydration of the
air-entrained concretes exceeded those of the companion non-air-entrained concretes. It
is suspected that the air-entrainment may have some heat retention properties. However,
taking into consideration the high-low bars, the differences between non-air-entrained
and air-entrained remained negligible in many cases.
For Type V-2.0 cement concretes without air-entrainment, 650 lb/yd3 cement
factor had the peak temperature of 103.1° F. When cement factor was increased to for
950 lb/yd3, the peak temperature increased to 122.4° F. For the same concrete group, the
addition of air-entrainment resulted in an increased heat of hydration of 18.1° F when the
cement factor increased from 650 to 950 lb/yd3. An increase of accelerator admixture
raised peak heat of hydration for the 650 lb/yd3 cement factor, but not for cement factor
of 850 lb/yd3. With respect to non-air-entrained Type V-2.8 cement concretes, they
produced hydration temperatures of 104.5° and 110.2° F for the 650 lb/yd3 and 850 lb/yd3
cement factors, respectively. Air-entrained Type V-2.8 cement concretes produced
63
maximum hydration heat of 102.3° F and 112.1° F for the 650 lb/yd3 and 850 lb/yd3
cement factors, respectively.
For the Type III cement concretes without air entrainment, the maximum heat
ranged from 110.2° F for 550 lb/yd3 cement factor to 124.0° F for 750 lb/yd3 cement
factor. It can also be seen that air-entrained Type III cement mixtures produced peak heat
of hydration of 110.9° F and 124.8° F for cement factors of 550 and 750 lb/yd3,
respectively.
The maximum heat of hydration increased drastically when the studied high
early-age strength concretes contained Rapid Set cement. The peak hydration
temperature for the non-air-entrained mixtures was 119.8° F when 550 lb/yd3 cement
factor was used. It increased to 130.7° F when cement factor was increased to 650 lb/yd3.
The maximum hydration temperature for air-entrained Rapid Set cement concretes
containing 550 and 650 lb/yd3 cement factors was 121.3° F and 126.0° F, respectively.
When comparing blended cement concretes made with cement factor of 650
lb/yd3, heat of hydration temperatures were comparable between non-air-entrained and
air-entrained mixtures. High early-age strength 50/50 blended cement concretes
generated maximum temperatures of 111.6° F and 110.9° F, respectively. For high early-
age strength 75/25 blended cement mixtures, the non-air-entrained concrete had a
maximum hydration temperature of 107.0° F and air-entrained concrete reached a
maximum hydration temperature of 107.1° F.

64
Figure 3-3: Heat of Hydration at Opening Time
650 AE-650 HW-650 750 AE-750 850 AE-850 950 AE-950 650 AE-650 850 AE-850 550 AE-550 650 AE-650 750 AE-750 550 AE-550 650 AE-650 50/50 AE-
50/50 75/25 AE-75/25
Type V-2.0 Type V-2.8 Type III RS VRS
Ave. 102.1 101.1 102.4 105.1 109.2 103.5 113.6 112.2 118.9 103.5 102.3 105.4 111.7 106.0 109.5 111.9 116.2 114.0 120.1 118.1 116.8 126.4 120.9 105.9 110.5 106.9 106.7
High 102.3 101.2 102.8 105.8 109.2 104.3 113.7 112.7 119.1 103.7 103 105.7 112.1 106.7 111.5 113.1 116.9 116.7 120.7 118.2 116.9 127.2 121.3 106.3 110.6 107 107.3
Low 101.8 101 102 104.3 102.7 113.5 111.7 118.7 103.2 101.5 105 111.3 105.2 108.6 110.6 115.4 110.1 119.5 118 116.6 125.5 120.4 105.5 110.4 106.7 106.1
Ave.
102
.1
Ave.
101
.1
Ave.
102
.4
Ave.
105
.1
Ave.
109
.2
Ave.
103
.5
Ave.
113
.6
Ave.
112
.2
Ave.
118
.9
Ave.
103
.5
Ave.
102
.3
Ave.
105
.4
Ave.
111
.7
Ave.
106
.0
Ave.
109
.5
Ave.
111
.9
Ave.
116
.2
Ave.
114
.0
Ave.
120
.1
Ave.
118
.1
Ave.
116
.8
Ave.
126
.4
Ave.
120
.9
Ave.
105
.9
Ave.
110
.5
Ave.
106
.9
Ave.
106
.7
95
100
105
110
115
120
125
130
95.0
100.0
105.0
110.0
115.0
120.0
125.0
130.0
Tem
pera
ture
(F)
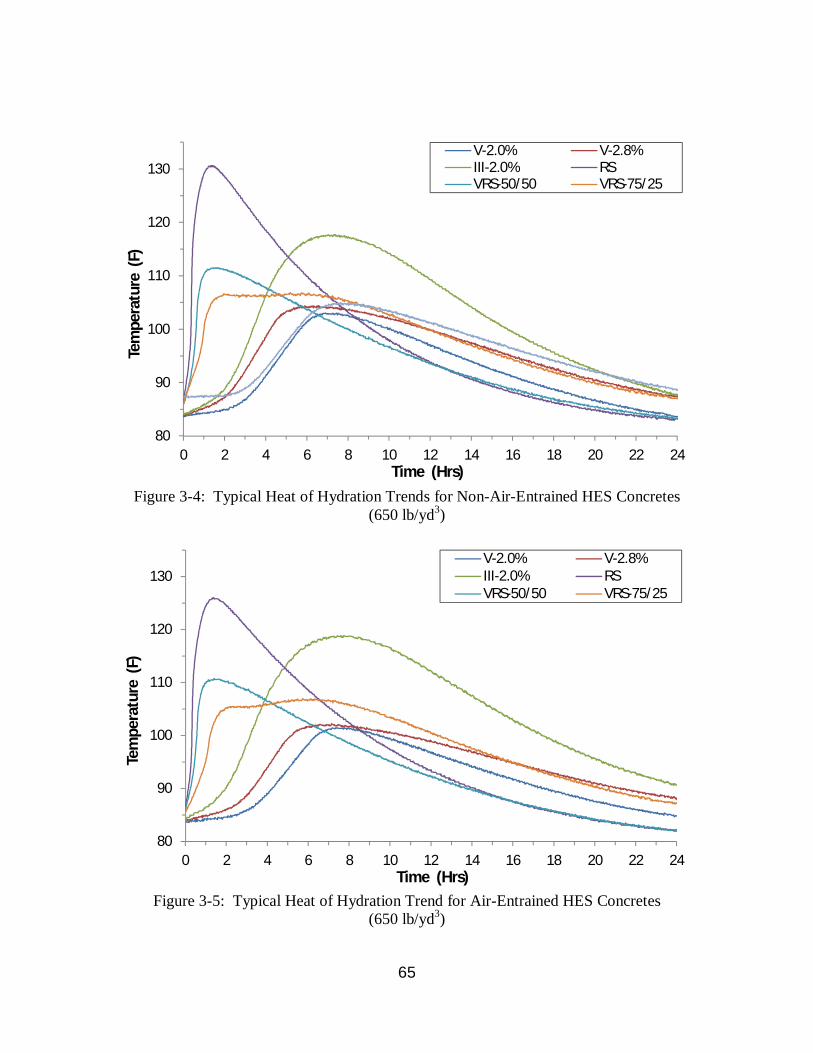
65
Figure 3-4: Typical Heat of Hydration Trends for Non-Air-Entrained HES Concretes
(650 lb/yd3)
Figure 3-5: Typical Heat of Hydration Trend for Air-Entrained HES Concretes
(650 lb/yd3)
80
90
100
110
120
130
0 2 4 6 8 10 12 14 16 18 20 22 24
Tem
pera
ture
(F)
Time (Hrs)
V-2.0% V-2.8%III-2.0% RSVRS-50/50 VRS-75/25
80
90
100
110
120
130
0 2 4 6 8 10 12 14 16 18 20 22 24
Tem
pera
ture
(F)
Time (Hrs)
V-2.0% V-2.8%III-2.0% RSVRS-50/50 VRS-75/25
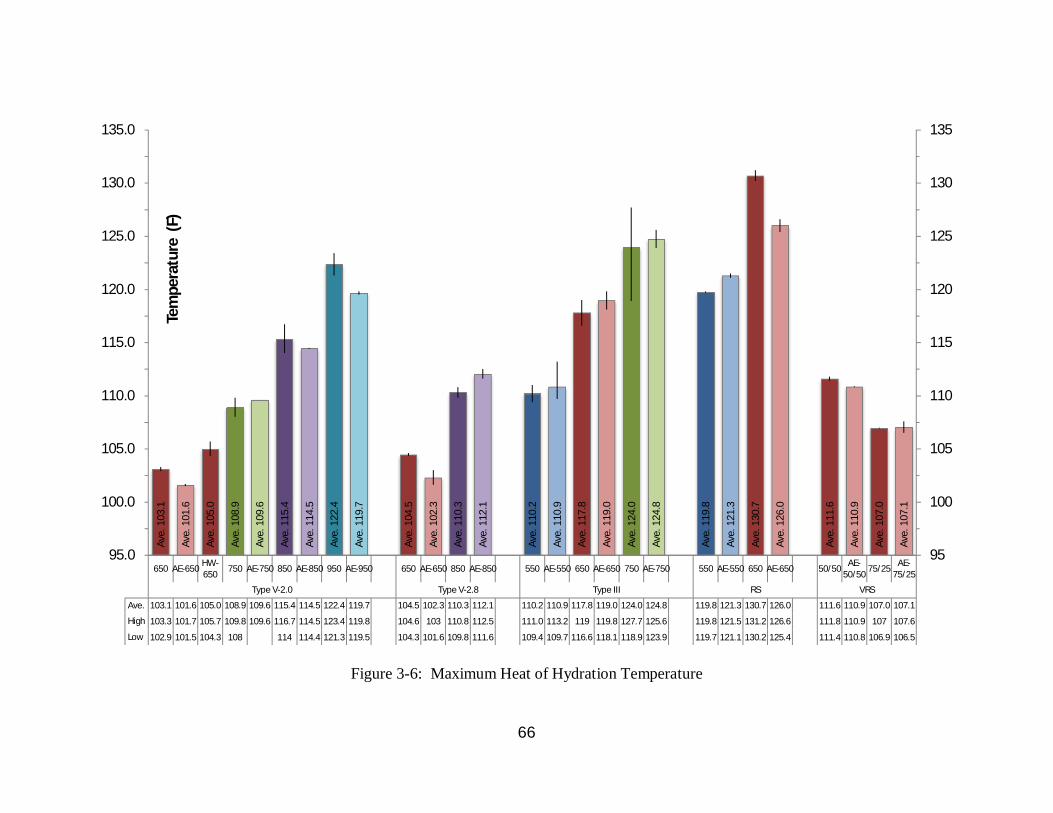
66
Figure 3-6: Maximum Heat of Hydration Temperature
650 AE-650 HW-650 750 AE-750 850 AE-850 950 AE-950 650 AE-650 850 AE-850 550 AE-550 650 AE-650 750 AE-750 550 AE-550 650 AE-650 50/50 AE-
50/50 75/25 AE-75/25
Type V-2.0 Type V-2.8 Type III RS VRS
Ave. 103.1 101.6 105.0 108.9 109.6 115.4 114.5 122.4 119.7 104.5 102.3 110.3 112.1 110.2 110.9 117.8 119.0 124.0 124.8 119.8 121.3 130.7 126.0 111.6 110.9 107.0 107.1
High 103.3 101.7 105.7 109.8 109.6 116.7 114.5 123.4 119.8 104.6 103 110.8 112.5 111.0 113.2 119 119.8 127.7 125.6 119.8 121.5 131.2 126.6 111.8 110.9 107 107.6
Low 102.9 101.5 104.3 108 114 114.4 121.3 119.5 104.3 101.6 109.8 111.6 109.4 109.7 116.6 118.1 118.9 123.9 119.7 121.1 130.2 125.4 111.4 110.8 106.9 106.5
Ave.
103
.1
Ave.
101
.6
Ave.
105
.0
Ave.
108
.9
Ave.
109
.6
Ave.
115
.4
Ave.
114
.5
Ave.
122
.4
Ave.
119
.7
Ave.
104
.5
Ave.
102
.3
Ave.
110
.3
Ave.
112
.1
Ave.
110
.2
Ave.
110
.9
Ave.
117
.8
Ave.
119
.0
Ave.
124
.0
Ave.
124
.8
Ave.
119
.8
Ave.
121
.3
Ave.
130
.7
Ave.
126
.0
Ave.
111
.6
Ave.
110
.9
Ave.
107
.0
Ave.
107
.1
95
100
105
110
115
120
125
130
135
95.0
100.0
105.0
110.0
115.0
120.0
125.0
130.0
135.0
Tem
pera
ture
(F)
67
Chapter 4 Hardened Properties of High Early-Age Strength Type V Portland Cement Concretes
4.1. Introduction
The first phase of this study dealt with evaluation of different properties of high
early-age strength Type V Portland cement concretes. The five different variables
considered for this phase of study were as follows:
• Cement factor (cement content):
Influences of four different cement contents of 650, 750, 850 and 950 lb/yd3 on
properties of high early-age strength Type V cement concretes were studied.
• Accelerator dosage:
Effects of accelerator dosage on hardened properties of high early-age strength
Type V cement concretes were studied using two different accelerator dosages of
2 and 2.8% by weight of cement.
• Use of air-entraining admixture:
In order to assess effects of air-entrainment on hardened properties of high early-
age strength Type V cement concretes, the designed concretes were made with
and without air-entraining admixture.
• Use of hot water for mixing:
In order to assess effects of using hot water (120 °F) for mixing on the properties
of high early-age strength Type V cement concretes, one of the designed concrete

68
mixtures was also made using hot water (mixture with cement content of 650
lb/yd3 and accelerator dosage of 2%).
• Curing age:
Effects of curing age on the properties of high early-age strength Type V cement
concretes were studied by testing hardened concretes at their opening time (a
minimum compressive strength of 3000 psi), 24 hrs, and 28 days.
4.2. Results and Discussion
A comprehensive experimental program was devised to assess hardened
properties of high early-age strength Type V cement concretes including mechanical
properties (compressive and flexural strengths), transport properties (absorption, water
permeability, rapid chloride penetration, and rapid chloride migration), durability
properties (frost resistance, chloride induced corrosion, and resistance to wear), and
dimension stability (drying shrinkage). As mentioned earlier, three testing times,
depending on the property tested, were considered at opening time, 24 hrs, and 28 days.
4.2.1. Compressive Strength
Table 4.1 presents results of compressive strength test for the studied high early-
age strength Type V cement concretes at different curing ages including opening time, 24
hrs and 28 days. Table 4.2 documents the opening times (time to reach a minimum
compressive strength of 3000 psi) and range of compressive strengths at opening times.
Effects of dominant variables on the compressive strength and opening time of the
studied concretes are discussed below.
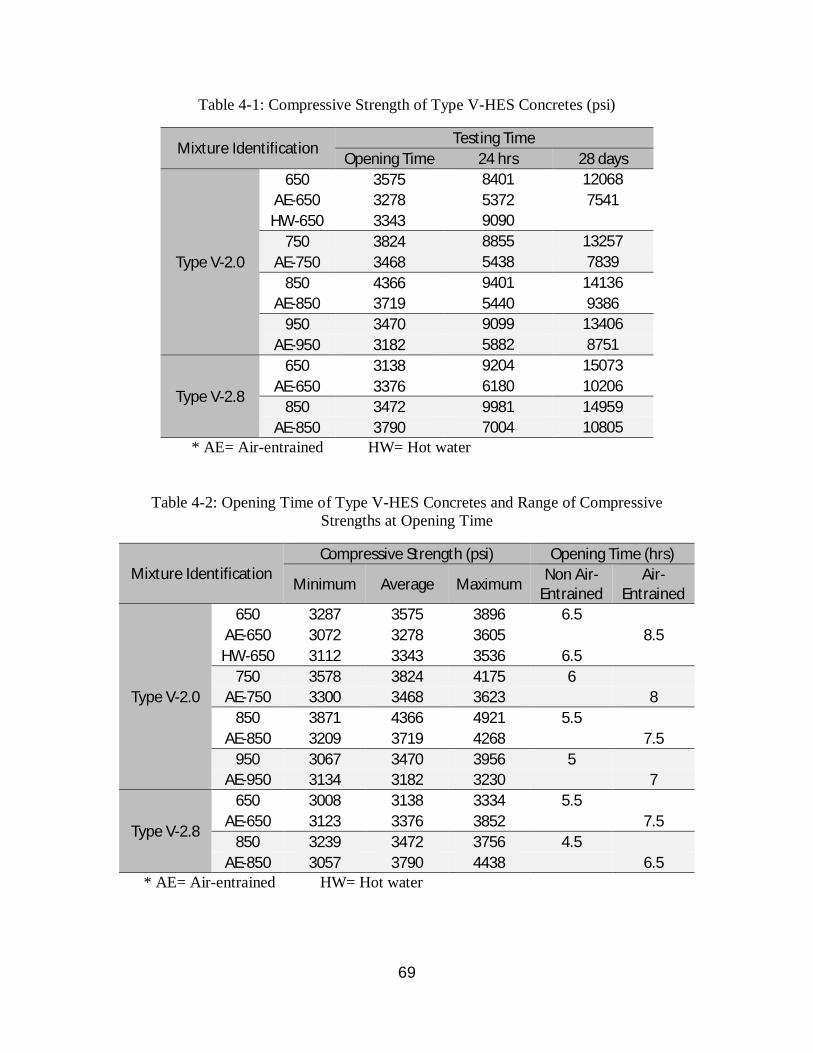
69
Table 4-1: Compressive Strength of Type V-HES Concretes (psi)
Mixture Identification Testing Time
Opening Time 24 hrs 28 days
Type V-2.0
650 3575 8401 12068 AE-650 3278 5372 7541 HW-650 3343 9090
750 3824 8855 13257 AE-750 3468 5438 7839
850 4366 9401 14136 AE-850 3719 5440 9386
950 3470 9099 13406 AE-950 3182 5882 8751
Type V-2.8
650 3138 9204 15073 AE-650 3376 6180 10206
850 3472 9981 14959 AE-850 3790 7004 10805
* AE= Air-entrained HW= Hot water
Table 4-2: Opening Time of Type V-HES Concretes and Range of Compressive
Strengths at Opening Time
Mixture Identification Compressive Strength (psi) Opening Time (hrs)
Minimum Average Maximum Non Air-Entrained
Air-Entrained
Type V-2.0
650 3287 3575 3896 6.5 AE-650 3072 3278 3605 8.5 HW-650 3112 3343 3536 6.5
750 3578 3824 4175 6 AE-750 3300 3468 3623 8
850 3871 4366 4921 5.5 AE-850 3209 3719 4268 7.5
950 3067 3470 3956 5 AE-950 3134 3182 3230 7
Type V-2.8
650 3008 3138 3334 5.5 AE-650 3123 3376 3852 7.5
850 3239 3472 3756 4.5 AE-850 3057 3790 4438 6.5
* AE= Air-entrained HW= Hot water
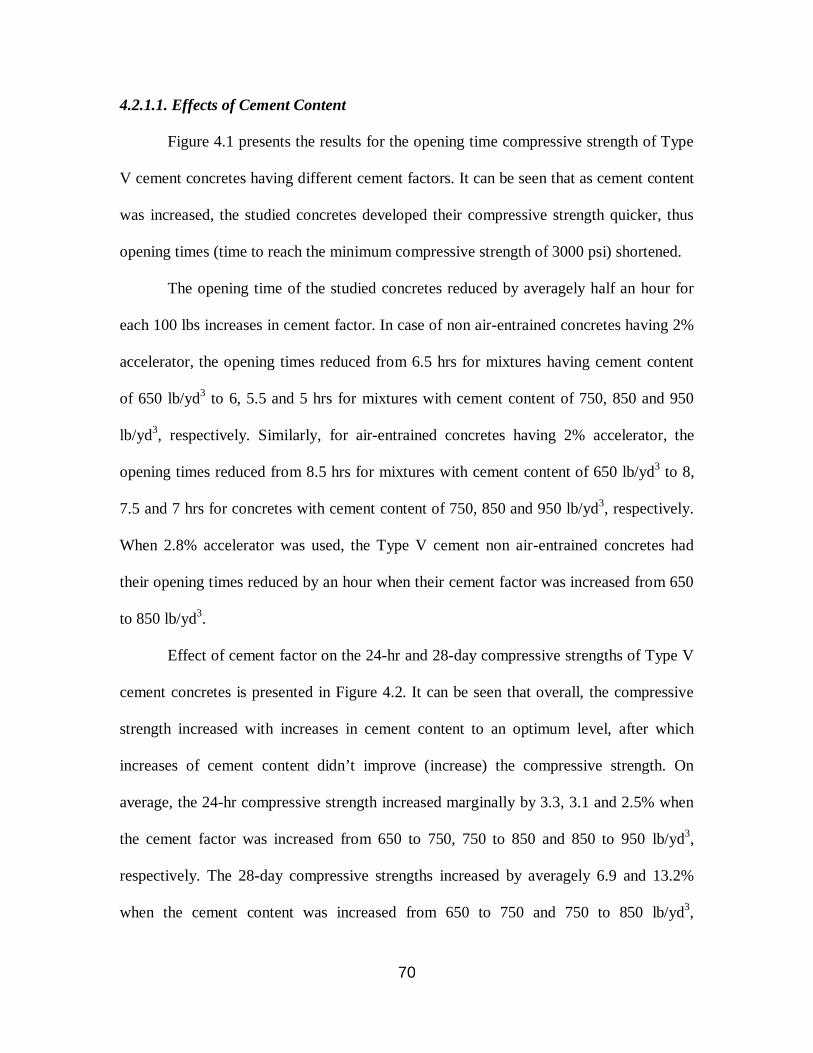
70
4.2.1.1. Effects of Cement Content
Figure 4.1 presents the results for the opening time compressive strength of Type
V cement concretes having different cement factors. It can be seen that as cement content
was increased, the studied concretes developed their compressive strength quicker, thus
opening times (time to reach the minimum compressive strength of 3000 psi) shortened.
The opening time of the studied concretes reduced by averagely half an hour for
each 100 lbs increases in cement factor. In case of non air-entrained concretes having 2%
accelerator, the opening times reduced from 6.5 hrs for mixtures having cement content
of 650 lb/yd3 to 6, 5.5 and 5 hrs for mixtures with cement content of 750, 850 and 950
lb/yd3, respectively. Similarly, for air-entrained concretes having 2% accelerator, the
opening times reduced from 8.5 hrs for mixtures with cement content of 650 lb/yd3 to 8,
7.5 and 7 hrs for concretes with cement content of 750, 850 and 950 lb/yd3, respectively.
When 2.8% accelerator was used, the Type V cement non air-entrained concretes had
their opening times reduced by an hour when their cement factor was increased from 650
to 850 lb/yd3.
Effect of cement factor on the 24-hr and 28-day compressive strengths of Type V
cement concretes is presented in Figure 4.2. It can be seen that overall, the compressive
strength increased with increases in cement content to an optimum level, after which
increases of cement content didn’t improve (increase) the compressive strength. On
average, the 24-hr compressive strength increased marginally by 3.3, 3.1 and 2.5% when
the cement factor was increased from 650 to 750, 750 to 850 and 850 to 950 lb/yd3,
respectively. The 28-day compressive strengths increased by averagely 6.9 and 13.2%
when the cement content was increased from 650 to 750 and 750 to 850 lb/yd3,

71
respectively. The 28-day compressive strength reduced by averagely 6.0% when the
cement factor was increased from 850 to 950 lb/yd3.
Figure 4-1: Opening Time of Type V-HES Concretes
0
1
2
3
4
5
6
7
8
9
650 750 850 950 650 850
Type V-2.0 Type V-2.8
Ope
ning
Tim
e (h
rs)
Cement Factor (lb/yd3) and Accelerator Dosage (%)
OT - No AE AE - OT HW - OT

72
Figure 4-2: Compressive Strength of Type V-HES Concretes at 24 Hrs and 28 Days
4.2.1.2. Effects of Accelerator Dosage
Figure 4.1 and Table 4.2 also document the opening times of Type V cement
concretes made with different accelerator dosages. It can be seen that the opening times
of the studied concretes reduced as accelerator dosage was increased.
The opening times of the studied concretes reduced by averagely an hour when
accelerator dosage was increased from 2 to 2.8%. In the case of non air-entrained
concretes, increases in accelerator dosage reduced the opening times from 6.5 to 5.5 and
4000
6000
8000
10000
12000
14000
16000
650 750 850 950 650 850
Type V-2.0 Type V-2.8
Com
pres
sive
Str
engt
h (p
si)
Cement Factor (lb/yd3) and Accelerator Dosage (%)
24 H - No AE 28 D - No AE AE - 24 H
AE - 28 D HW - 24 H
73
5.5 to 4.5 hrs for mixtures made with the cement contents of 650 and 850 lb/yd3,
respectively. Similarly for air-entrained concretes, increases in accelerator dosage
reduced the opening times from 8.5 to 7.5 and 7.5 to 6.5 hrs for the concretes containing
cement contents of 650 and 850 lb/yd3, respectively.
Effect of accelerator dosage on the compressive strength of Type V cement
concretes was also examined and the results are also shown in Figure 4.2. It can also be
seen that overall, the compressive strength increased with increases in the dosage of
accelerator. On average, the 24-hr and 28-day compressive strengths of non air-entrained
concretes increased by 7.9 and 15.4% when accelerator dosage was increased from 2 to
2.8%, respectively. A similar increase in accelerator dosage led to 21.9 and 25.2%
increases in the 24-hr and 28-day compressive strengths of air-entrained concretes,
respectively.
4.2.1.3. Effects of Air-Entraining Admixture
Figure 4.1 and Table 4.2 show effects of air-entraining admixture on the opening
time of Type V cement concretes. It can be seen that the opening times increased when
air-entraining admixture was added to the mixtures.
The opening times of air-entrained concretes were averagely 2 hrs more than
those of non air-entrained concretes. In the case of concretes with 2% accelerator, when
air-entraining admixture was added to the mixtures, their opening times increased from
6.5 to 8.5, 6 to 8, 5.5 to 7.5 and 5 to 7 hrs for cement factors of 650, 750, 850 and 950
lb/yd3, respectively. Similarly, for concretes with 2.8% accelerator and cement content of

74
650 and 850 lb/yd3, use of air-entraining admixture increased the opening times from 5.5
to 7.5 and 4.5 to 6.5 hrs, respectively.
Figure 4.2 also presents the effect of entrained air on compressive strength of the
studied concretes. It can be seen that the compressive strength significantly reduced when
air-entraining admixture was added to the mixtures.
In the case of concretes made with 2% accelerator, inclusion of air-entraining
admixture reduced the compressive strengths (at 24 hrs and 28 days) by averagely 36.8,
39.7, 37.9 and 35.0% for mixtures with cement factors of 650, 750, 850 and 950 lb/yd3,
respectively. For concretes made with 2.8% accelerator, addition of air-entraining
admixture resulted in averagely 32.6 and 28.8% reduction in the compressive strength of
concretes made with cement factors of 650 and 850 lb/yd3, respectively.
4.2.1.4. Effects of Hot Water Usage
In this study, effect of using hot water (120 °F) on the compressive strength of
Type V cement concrete was evaluated for one of the designed mixtures; non air-
entrained Type V cement concrete having cement factor of 650 lb/yd3 and accelerator
dosage of 2%. Its effects on the opening time and compressive strength are presented in
Figures 4.1 and 4.2, respectively. As can be seen, use of hot water didn’t improve
(reduce) opening time as the opening time of the studied mixture was similar (6.5 hrs)
with and without hot water. Use of hot water, instead of tap water with laboratory room
temperature, resulted in nearly 6% reduction in the compressive strength at opening time.
Its inclusion, however, increased the 24-hr compressive strength by nearly 8%.

75
4.2.1.5. Effects of Curing Age
Effect of curing age on the compressive strength of Type V cement concretes can
be seen in Table 4.1 and Figures 4.1 and 4.2. Due to the use of accelerator, the studied
concretes developed their compressive strengths quickly. On average, the opening time
and 24-hr compressive strengths of the studied Type V cement concretes were about 33
and 66% (1/3 and 2/3) of their 28-day compressive strengths, respectively.
4.2.2. Flexural Strength
Table 4.3 presents results of flexural strength for the studied high early-age
strength Type V cement concretes at different curing ages, including opening times, 24
hrs, and 28 days. These results are also shown in Figure 4.3. It can be seen that the
flexural strength of the studied concretes were in the range of 580 to 880 psi at their
opening times. All tested samples had flexural strengths of higher than 550 psi at their
opening times.
Similar to the results of compression test, the flexural strength increased with
increases in cement content to an optimum level, after which increases of the cement
content resulted in reduction of flexural strength. The 24-hr flexural strength of concretes
having 2% accelerator marginally increased by 3.1 and 4.0% when the cement factor was
increased from 650 to 750 and 750 to 850 lb/yd3, respectively. For similar concretes, the
same increases in cement content resulted in 2.3 and 2.7% increases in the 28-day
flexural strengths, respectively. For these concretes, further increases in cement factor
from 850 to 950 lb/yd3 reduced the 24-hr and 28-day flexural strengths by 7.1 and 3.3%,
respectively. In case of concretes having 2.8% accelerator, the 24-hr flexural strength
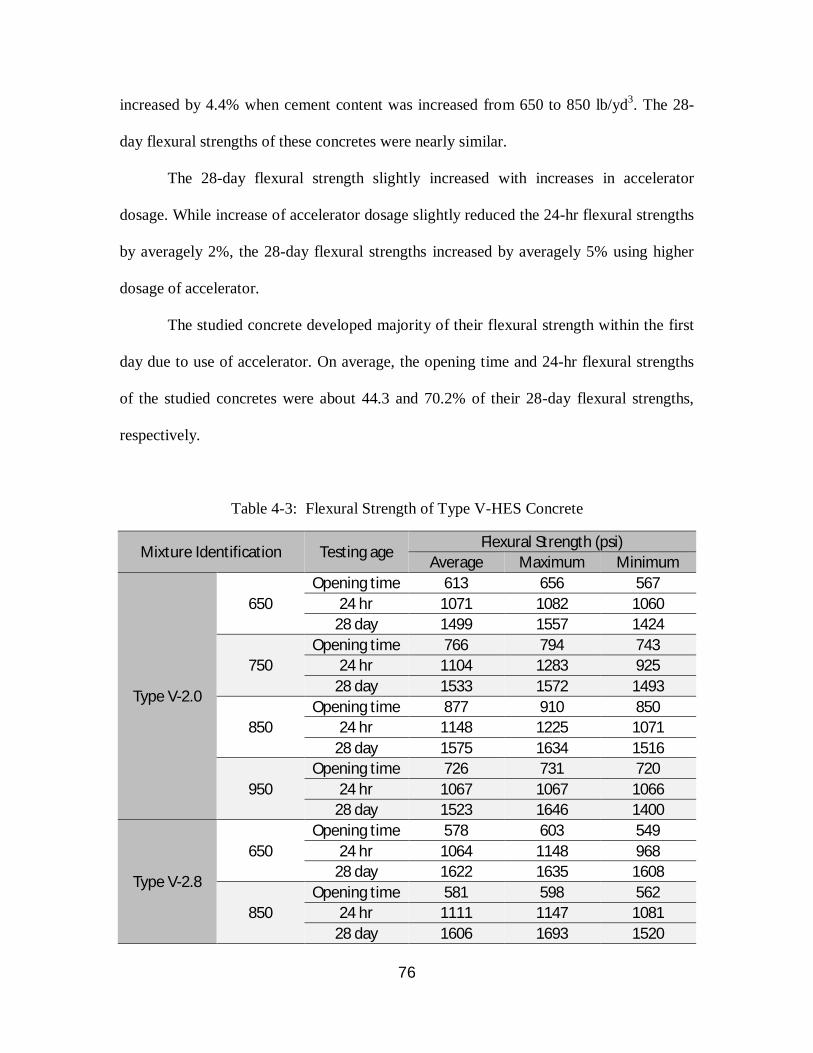
76
increased by 4.4% when cement content was increased from 650 to 850 lb/yd3. The 28-
day flexural strengths of these concretes were nearly similar.
The 28-day flexural strength slightly increased with increases in accelerator
dosage. While increase of accelerator dosage slightly reduced the 24-hr flexural strengths
by averagely 2%, the 28-day flexural strengths increased by averagely 5% using higher
dosage of accelerator.
The studied concrete developed majority of their flexural strength within the first
day due to use of accelerator. On average, the opening time and 24-hr flexural strengths
of the studied concretes were about 44.3 and 70.2% of their 28-day flexural strengths,
respectively.
Table 4-3: Flexural Strength of Type V-HES Concrete
Mixture Identification Testing age Flexural Strength (psi)
Average Maximum Minimum
Type V-2.0
650 Opening time 613 656 567
24 hr 1071 1082 1060 28 day 1499 1557 1424
750 Opening time 766 794 743
24 hr 1104 1283 925 28 day 1533 1572 1493
850 Opening time 877 910 850
24 hr 1148 1225 1071 28 day 1575 1634 1516
950 Opening time 726 731 720
24 hr 1067 1067 1066 28 day 1523 1646 1400
Type V-2.8
650 Opening time 578 603 549
24 hr 1064 1148 968 28 day 1622 1635 1608
850 Opening time 581 598 562
24 hr 1111 1147 1081 28 day 1606 1693 1520

77
Figure 4-3: Flexural Strength of Type V-HES Concretes
4.2.3. Absorption and Volume of Permeable Voids
Tables 4.4 and 4.5 present results of absorption test for the studied high early-age
strength Type V cement concretes at different curing ages of opening times, 24 hrs and
28 days. The effects of the dominant variables on the absorption and volume of
permeable voids of the studied concretes are discussed below.
650 750 850 950 650 850 650 750 850 950 650 850 650 750 850 950 650 850
Type V-2.0 @ OT Type V-2.8@ OT Type V-2.0 @ 24H Type V-2.8
@ 24H Type V-2.0 @ 28DType V-2.8 @28D
Ave. 613 766 877 726 578 581 107 110 114 106 106 111 149 153 157 152 162 160High 656 794 910 731 603 598 108 128 122 106 114 114 155 157 163 164 163 169Low 567 743 850 720 549 562 106 925 107 106 968 108 142 149 151 140 160 152
0
300
600
900
1200
1500
1800Fl
exur
al S
tren
gth
(psi
)
Cement Factor (lb/yd3), Accelerator Dosage (%) and Curing Age

78
Table 4-4: Results of Absorption Test for Type V-HES Concretes Containing 2% Accelerator
Mixture Identification Testing time
Absorption After
Immersion (%)
Absorption After
Immersion & Boiling
(%)
Volume of Permeable Voids (%)
Type V-2.0
650 Opening time 2.61 2.88 7.27
24 hrs 1.95 2.52 6.29 28 days 1.05 1.31 3.31
AE - 650 Opening time 3.35 3.80 8.61
24 hrs 3.08 3.44 7.98 28 days 1.77 2.03 4.63
HW - 650 Opening time 3.44 3.61 8.88
24 hrs 3.05 3.23 8.05 28 days 1.57 1.71 4.17
750 Opening time 3.08 3.18 8.36
24 hrs 2.18 2.66 7.17 28 days 0.89 1.32 3.33
AE - 750 Opening time 3.76 4.41 9.72
24 hrs 3.42 4.02 8.98 28 days 1.84 2.12 4.73
850 Opening time 3.61 3.94 9.46
24 hrs 2.75 3.25 8.19 28 days 1.02 1.31 3.16
AE - 850 Opening time 4.36 4.80 10.81
24 hrs 3.77 4.09 9.50 28 days 1.77 2.02 4.80
950 Opening time 4.21 4.57 10.83
24 hrs 3.22 3.66 9.22 28 days 1.18 1.40 3.35
AE - 950 Opening time 5.24 5.22 12.34
24 hrs 4.59 4.63 11.01 28 days 2.06 2.30 5.29
* AE= Air-entrained HW= Hot water
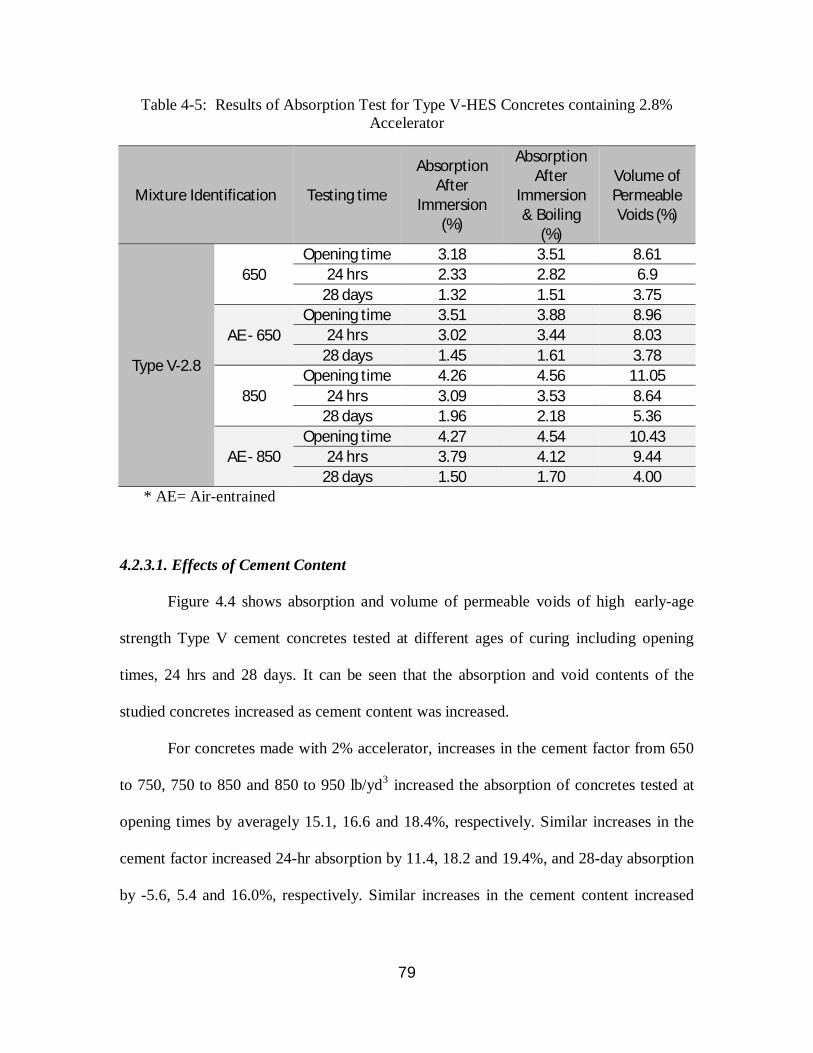
79
Table 4-5: Results of Absorption Test for Type V-HES Concretes containing 2.8% Accelerator
Mixture Identification Testing time
Absorption After
Immersion (%)
Absorption After
Immersion & Boiling
(%)
Volume of Permeable Voids (%)
Type V-2.8
650 Opening time 3.18 3.51 8.61
24 hrs 2.33 2.82 6.9 28 days 1.32 1.51 3.75
AE - 650 Opening time 3.51 3.88 8.96
24 hrs 3.02 3.44 8.03 28 days 1.45 1.61 3.78
850 Opening time 4.26 4.56 11.05
24 hrs 3.09 3.53 8.64 28 days 1.96 2.18 5.36
AE - 850 Opening time 4.27 4.54 10.43
24 hrs 3.79 4.12 9.44 28 days 1.50 1.70 4.00
* AE= Air-entrained
4.2.3.1. Effects of Cement Content
Figure 4.4 shows absorption and volume of permeable voids of high early-age
strength Type V cement concretes tested at different ages of curing including opening
times, 24 hrs and 28 days. It can be seen that the absorption and void contents of the
studied concretes increased as cement content was increased.
For concretes made with 2% accelerator, increases in the cement factor from 650
to 750, 750 to 850 and 850 to 950 lb/yd3 increased the absorption of concretes tested at
opening times by averagely 15.1, 16.6 and 18.4%, respectively. Similar increases in the
cement factor increased 24-hr absorption by 11.4, 18.2 and 19.4%, and 28-day absorption
by -5.6, 5.4 and 16.0%, respectively. Similar increases in the cement content increased
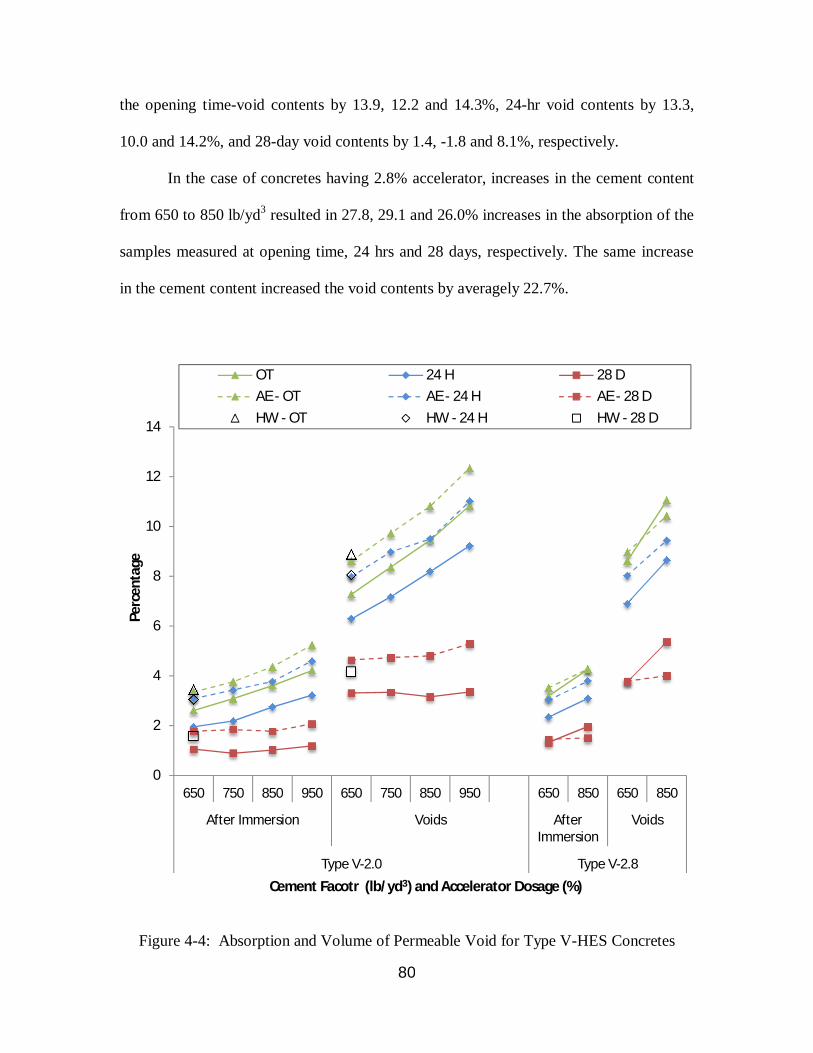
80
the opening time-void contents by 13.9, 12.2 and 14.3%, 24-hr void contents by 13.3,
10.0 and 14.2%, and 28-day void contents by 1.4, -1.8 and 8.1%, respectively.
In the case of concretes having 2.8% accelerator, increases in the cement content
from 650 to 850 lb/yd3 resulted in 27.8, 29.1 and 26.0% increases in the absorption of the
samples measured at opening time, 24 hrs and 28 days, respectively. The same increase
in the cement content increased the void contents by averagely 22.7%.
Figure 4-4: Absorption and Volume of Permeable Void for Type V-HES Concretes
0
2
4
6
8
10
12
14
650 750 850 950 650 750 850 950 650 850 650 850
After Immersion Voids AfterImmersion
Voids
Type V-2.0 Type V-2.8
Perc
enta
ge
Cement Facotr (lb/yd3) and Accelerator Dosage (%)
OT 24 H 28 DAE - OT AE - 24 H AE - 28 DHW - OT HW - 24 H HW - 28 D
81
4.2.3.2. Effects of Accelerator Dosage
Figure 4.4 also shows effects of accelerator dosage on the absorption and volume
of permeable voids of Type V cement concretes. It can be seen that the absorption and
void contents of non air-entrained concretes increased as accelerator dosage was
increased. An almost opposite trend was seen for air-entrained concretes.
When accelerator dosage was increased from 2 to 2.8%, the opening time, 24-hr
and 28-day void contents of non air-entrained concretes having cement content of 650
lb/yd3 increased by 18.4, 9.7 and 13.3%, respectively. For the same testing times, these
increases were 16.8, 5.5 and 69.6% for non air-entrained concretes with cement content
of 850 lb/yd3, respectively. When tested for the same durations, an increase in accelerator
dosage (from 2 to 2.8%) increased absorption of the studied concretes made with cement
content of 650 lb/yd3 by 21.8, 19.5 and 25.7%, and absorption of mixtures with cement
content of 850 lb/yd3 by 18.0, 12.4 and 92.2%, respectively.
In the case of air-entrained concretes, increases in accelerator dosage didn’t affect
their void contents at opening time and 24 hrs. Increase of accelerator dosage, however,
reduced the 28-day absorption and void contents of air-entrained concretes by averagely
16.7 and 17.5%, respectively.
4.2.3.3. Effects of Air-Entraining Admixture
Figure 4.4 also presents effects of air-entraining admixture on the absorption and
volume of permeable voids of Type V cement concretes. It can be seen that the
absorption and void contents significantly increased when air-entraining admixture was
added to the mixtures.

82
In the case of concretes made with 2% accelerator, inclusion of air-entraining
admixture resulted in averagely 23.9, 48.6 and 80.9% increases in the absorption of
concretes tested at opening time, 24 hrs and 28 days, respectively. For similar testing
days and the same concretes, the void contents increased by averagely 15.7, 21.9 and
47.9%, respectively, when air-entraining admixture was added. For concretes made with
2.8% accelerator, addition of air-entraining admixture resulted in averagely -0.8, 12.8 and
-12.3% increases in void contents of concretes tested at opening time, 24 hrs and 28 days,
respectively. A similar trend was seen for their absorption. At the same testing times, use
of air-entraining admixture increased the absorption value by 5.3, 26.1 and -6.8%,
respectively.
4.2.3.4. Effects of Hot Water Usage
Effect of using hot water was investigated for one of the studied mixtures; non
air-entrained Type V cement concrete having cement factor of 650 lb/yd3 and accelerator
dosage of 2%. Its effects on the absorption and void contents are presented in Figure 4.4.
As can be seen, use of hot water increased the absorption and void contents of the studied
concretes. For the samples tested at opening time, 24 hrs and 28 days, use of hot water
increased absorption by 31.8, 56.4 and 49.5%, and void contents by 22.1, 28.0 and
26.0%, respectively.
4.2.3.5. Effects of Curing Age
Effects of curing age on the absorption and void contents of the studied concretes
are also shown in Figure 4.4. It can be seen that the absorption and void contents reduced
as the curing age increased. On average, the absorption reduced by 18.1 and 51.5% when
curing age was extended from opening time (a few hours) to 24 hrs and 24 hrs to 28 days,

83
respectively. For similar extensions of curing age, the void contents reduced by averagely
12.7 and 50.7%, respectively.
4.2.4. Rapid Chloride Penetration Test
Table 4.6 and Figure 4.5 present results of rapid chloride penetration test (RCPT)
for the studied high early-age strength Type V cement concretes tested at two curing ages
of 24 hrs and 28 days. The effects of dominant variables on the RCPT passing charges
are discussed below.
Figure 4-5: Passing Charges of Type V-HES Concretes
0
1000
2000
3000
4000
5000
650 750 850 950 650 850
Type V-2.0 Type V-2.8
Colo
umbs
Pas
sed
Cement Factor (lb/yd3) and Accelerator Dosage (%)
24 H 28 D AE-24 H
AE-28 D HW-24 H HW-28 D

84
Table 4-6: Passing Charges of Type V-HES Concretes
Mixture Identification Testing Time Passing Charges (Coulombs)
Average Maximum Minimum
Type V-2.0
650 24 hrs 2709 2898 2464
28 days 1389 1685 1122
AE - 650 24 hrs 2552 2992 2163
28 days 1199 1340 1014
HW - 650 24 hrs 3536 4007 2484
28 days 1408 1618 1193
750 24 hrs 3064 3267 2904
28 days 1547 1775 1351
AE - 750 24 hrs 3009 3548 2637
28 days 1387 1759 1092
850 24 hrs 3606 3863 3183
28 days 1685 1724 1625
AE - 850 24 hrs 3606 3745 3376
28 days 1501 1843 1219
950 24 hrs 4385 5324 3308
28 days 1996 2125 1811
AE - 950 24 hrs 3921 5170 3171
28 days 1872 2203 1616
Type V-2.8
650 24 hrs 3267 3888 2538
28 days 1502 1790 1282
AE - 650 24 hrs 3191 3458 2964
28 days 1308 1555 975
850 24 hrs 4368 5250 3723
28 days 1904 2147 1624
AE - 850 24 hrs 4082 4508 2884
28 days 1644 1738 1468 * AE= Air-entrained HW= Hot water
4.2.4.1. Effects of Cement Content
Figure 4.5 shows effects of cement factor on the passing charges of Type V
cement concretes. It can be seen that the passing charges increased as cement content was
increased.
85
For concretes with 2% accelerator, the 24-hr passing charges increased by
averagely 15.5, 18.8 and 15.2% when the cement factor was increased from 650 to 750,
750 to 850 and 850 to 950 lb/yd3, respectively. Similar increases in the cement factor
increased the 28-day RCPT values of these concretes by 13.5, 8.6 and 21.6%,
respectively.
In the case of concretes having 2.8% accelerator, increases in the cement content
from 650 to 850 lb/yd3 resulted in averagely 30.8 and 26.2% increases in 24-hr and 28-
day passing charges, respectively.
4.2.4.2. Effects of Accelerator Dosage
Figure 4.5 also shows effects of accelerator dosage on the passing charges of
Type V cement concretes. It can be seen that the passing charges increased as accelerator
dosage was increased.
When accelerator dosage was increased from 2 to 2.8%, the 24-hr passing charges
increased by averagely 20.0%. Similar increases in accelerator dosage increased the 28-
day passing charges by averagely 9.9%.
4.2.4.3. Effects of Air-Entraining Admixture
Figure 4.5 also shows effects of air-entraining admixture on RCPT values of Type
V cement concretes. It can be seen that the passing charges reduced when air-entraining
admixture was added to the concrete mixtures.
When concretes contained 2% accelerator, inclusion of air-entraining admixture
resulted in averagely 4.5 and 10.3% reduction in the passing charges of concretes tested
at 24 hrs and 28 days, respectively. For concretes made with 2.8% accelerator, addition of
86
air-entraining admixture reduced the 24-hr and 28-day passing charges by averagely 4.4
and 13.3%, respectively.
4.2.4.4. Effects of Hot Water Usage
As mentioned earlier, effect of using hot water was evaluated for non air-
entrained Type V cement concrete having cement factor of 650 lb/yd3 and accelerator
dosage of 2%. Figure 4.5 presents effect of hot water usage on the passing charges as
well. It can be seen that the passing charges increased, marginally depending on concrete
age, when hot water was used for mixing instead of tap water with regular laboratory
room temperature. For the samples tested at 24 hrs and 28 days, hot water increased the
passing charges by 30.5 and 1.4%, respectively.
4.2.4.5. Effects of Curing Age
Figure 4.5 also shows effect of curing age on RCPT results. It can be seen that the
passing charges almost halved as curing age was increased from 24 hrs to 28 days. The
28-day passing charges of the studied concretes were 50 to 60% (with an average of
55%) lower than the 24-hr passing charges.
4.2.5. Rapid Chloride Migration Test
Table 4.7 and Figure 4.6 present results of rapid chloride migration test (RMT)
for the studied Type V cement concretes measured for two testing ages of 24 hrs and 28
days. The effects of dominant variables on the chloride penetration depth of the studied
concretes are discussed below.

87
Table 4-7: Chloride Penetration Depth of Type V-HES Concretes
Mixture Identification Testing Time Chloride Penetration Depth (in)
Average Maximum Minimum
Type V-2.0
650 24 hrs 1.52 1.55 1.50
28 days 0.57 0.59 0.56
AE - 650 24 hrs 1.26 1.31 1.22
28 days 0.59 0.65 0.52
750 24 hrs 1.23 1.23 1.23
28 days 0.52 0.53 0.51
AE - 750 24 hrs 1.34 1.35 1.32
28 days 0.60 0.66 0.52
850 24 hrs 1.14 1.19 1.09
28 days 0.56 0.57 0.55
AE - 850 24 hrs 1.32 1.36 1.27
28 days 0.59 0.62 0.54
950 24 hrs 1.09 1.14 1.07
28 days 0.53 0.54 0.52
AE - 950 24 hrs 1.34 1.39 1.28
28 days 0.59 0.61 0.58
Type V-2.8
650 24 hrs 1.43 1.47 1.38
28 days 0.61 0.63 0.57
AE - 650 24 hrs 1.72 1.77 1.63
28 days 0.64 0.69 0.59
850 24 hrs 1.27 1.29 1.25
28 days 0.57 0.58 0.57
AE - 850 24 hrs 1.53 1.57 1.48
28 days 0.57 0.57 0.53 * AE= Air-entrained HW= Hot water

88
Figure 4-6: Chloride Penetration Depth of Type V-HES Concretes
4.2.5.1. Effects of Cement Content
Figure 4.6 shows effects of cement factor on the chloride penetration depth of
Type V cement concretes. It can be seen that overall, the chloride penetration depth
slightly reduced as cement content was increased.
For concretes with 2% accelerator, the 24-hr chloride penetration depth reduced
by averagely 6.4, 4.4 and 1.4% when the cement factor was increased from 650 to 750,
750 to 850 and 850 to 950 lb/yd3, respectively. Similar increases in the cement factor
decreased the 28-day chloride penetration depths of these concretes by 3.5, -3.0 and
2.7%, respectively.
0.0
0.2
0.4
0.6
0.8
1.0
1.2
1.4
1.6
1.8
2.0
650 750 850 950 650 850
Type V-2.0 Type V-2.8
Pene
trat
ion
(in)
Cement Factor (lb/yd3), Acceleratopr Dosage (%) and Curing Age
24 H 28 D AE-24 H AE-28 D

89
In the case of concretes having 2.8% accelerator, increases in the cement content
from 650 to 850 lb/yd3 resulted in averagely 11.1 and 8.7% reduction in the chloride
penetration depth of concretes tested at 24 hrs and 28 days, respectively.
4.2.5.2. Effects of Accelerator Dosage
Figure 4.6 also presents effects of accelerator dosage on the chloride penetration
depth of Type V cement concretes. It can be seen that overall, the chloride penetration
depth increased when the dosage of accelerator was increased.
As accelerator dosage was increased from 2 to 2.8%, the 24-hr chloride
penetration depths increased by averagely 14.5%. Similar increases in accelerator dosage
increased the 28-day chloride penetration depths by averagely 3.5%.
4.2.5.3. Effects of Air-Entraining Admixture
Effects of air-entraining admixture on the chloride penetration depth of Type V
cement concretes are also presented in Figure 4.6. It can be seen that overall, the chloride
penetration depth increased as air-entraining admixture was added to the mixtures.
When concretes contained 2% accelerator, inclusion of air-entraining admixture
increased the 24-hr (to a larger extent) and 28-day (to a lesser extent) chloride penetration
depths by averagely 7.6 and 8.9%, respectively. For concretes made with 2.8%
accelerator, these increases were averagely 20.4 and 2.5%, respectively.

90
4.2.5.4. Effects of Curing Age
Figure 4.6 also shows effects of curing age on the chloride penetration depth of
the studied Type V cement concretes. It can be seen that the penetration depths
significantly reduced as curing age was extended from 24 hrs to 28 days. The 28-day
chloride penetration depths of the studied concretes were 51 to 63% (with an average of
57%) lower than the 24-hr chloride penetration depths.
4.2.6. Water Permeability
Figure 4.7 and Table 4.8 show results of water penetration depth for the studied
Type V cement concretes tested at the ages of 24 hrs and 28 days. It can be seen that the
depth of penetration increased as cement content and accelerator dosage were increased.
The depths of water penetration slightly increased with increases in the cement
factor. In the case of concretes made with 2% accelerator, the 24-hr water penetration
depths increased by 3.3, 0.8 and 3.2% when the cement content was increased from 650
to 750, 750 to 850 and 850 to 950 lb/yd3, respectively. Similar increases in the cement
factor increased the 28-day water penetration depths of these concretes by 2.5, 1.6 and
6.6%, respectively. For concretes made with 2.8% accelerator, the 24-hr and 28-day
water penetration depths of concretes made with cement content of 850 lb/yd3 were 8.0
and 6.5% higher than those having cement factor of 650 lb/yd3, respectively.
The depth of water penetration also increased with increases in accelerator
dosage. The 24-hr water penetration depth of concretes having cement factor of 650 and
850 lb/yd3 increased by 11.2 and 15.3% when accelerator dosage was increased from 2 to
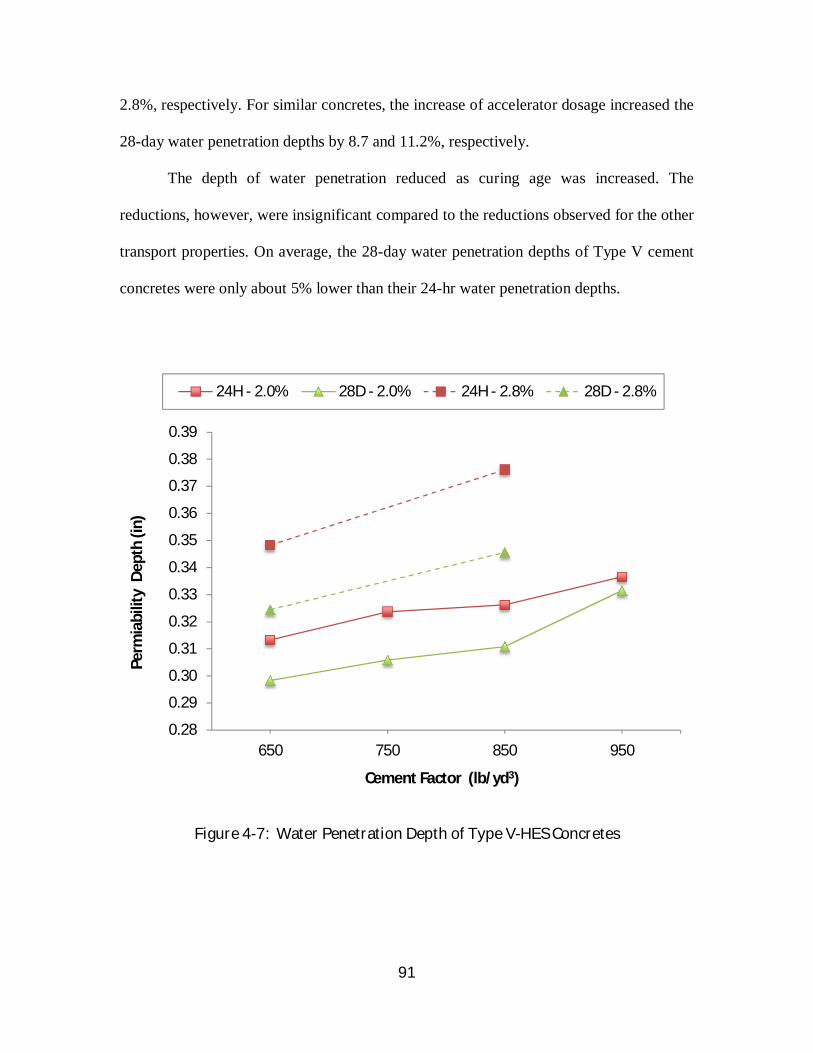
91
2.8%, respectively. For similar concretes, the increase of accelerator dosage increased the
28-day water penetration depths by 8.7 and 11.2%, respectively.
The depth of water penetration reduced as curing age was increased. The
reductions, however, were insignificant compared to the reductions observed for the other
transport properties. On average, the 28-day water penetration depths of Type V cement
concretes were only about 5% lower than their 24-hr water penetration depths.
Figure 4-7: Water Penetration Depth of Type V-HES Concretes
0.28
0.29
0.30
0.31
0.32
0.33
0.34
0.35
0.36
0.37
0.38
0.39
650 750 850 950
Perm
iabi
lity
Dep
th (i
n)
Cement Factor (lb/yd3)
24H - 2.0% 28D - 2.0% 24H - 2.8% 28D - 2.8%

92
Table 4-8: Water Penetration Depth of Type V-HES Concretes
Age
Accelerator (%) 2.0 2.8
Cement Content (lb/yd3) Cement Content (lb/yd3) 650 750 850 950 650 850
Water Penetration Depth (mm) 24 hrs 7.957 8.222 8.287 8.550 8.846 9.553
28 days 7.578 7.770 7.896 8.420 8.241 8.779
Water Penetration Depth (in) 24 hrs 0.3133 0.3237 0.3263 0.3366 0.3483 0.3761
28 days 0.2983 0.3059 0.3109 0.3315 0.3244 0.3456
4.2.7. Drying Shrinkage
Figures 4.8 through 4.10 show drying shrinkage of Type V cement concretes for
samples transferred to the shrinkage room at the ages of their opening time, 24 hrs, and
28 days, respectively. Effects of cement content, curing age, accelerator dosage, and hot
water usage were studied on the drying shrinkage of Type V cement concretes, which are
discussed in the following subsections.
4.2.7.1. Effects of Cement Content
Figures 4.8 through 4.10 present influences of cement factor on the drying
shrinkage of Type V cement concretes. It can be seen that the drying shrinkage increased
with increases in cement content.
Figure 4.11 presents the ultimate drying shrinkage of Type V cement concretes
kept in shrinkage room for a year. For concretes with 2% accelerator, the drying
shrinkage increased by averagely 13.1, 24.5 and 11.4% when the cement factor was
increased from 650 to 750, 750 to 850 and 850 to 950 lb/yd3, respectively. These

93
increases were 9.6, 37.3 and 9.5% for concretes transferred to shrinkage room at their
opening time; 20.6, 22.2 and 14.0% for 24-hr cured concretes; and 9.2, 14.0 and 10.6%
for 28-day cured concretes, respectively. When concretes contained 2.8% accelerator, the
drying shrinkage of concretes transferred to shrinkage room at the ages of opening time,
24 hrs and 28 days increased by 30.7, 33.6 and 17.3% when the cement factor was
increased from 650 to 850 lb/yd3, respectively.
Figure 4-8: Drying Shrinkage of Type V-HES Concretes Transferred to Shrinkage Room at Opening Time
0.00
0.01
0.02
0.03
0.04
0.05
0.06
0.07
0.08
0 1 2 3 4 5 6 7 8 9 10 11 12
Dry
ing
Shrin
kage
( %
)
Months
650-2.0 750-2.0 850-2.0
950-2.0 650-2.8 850-2.8
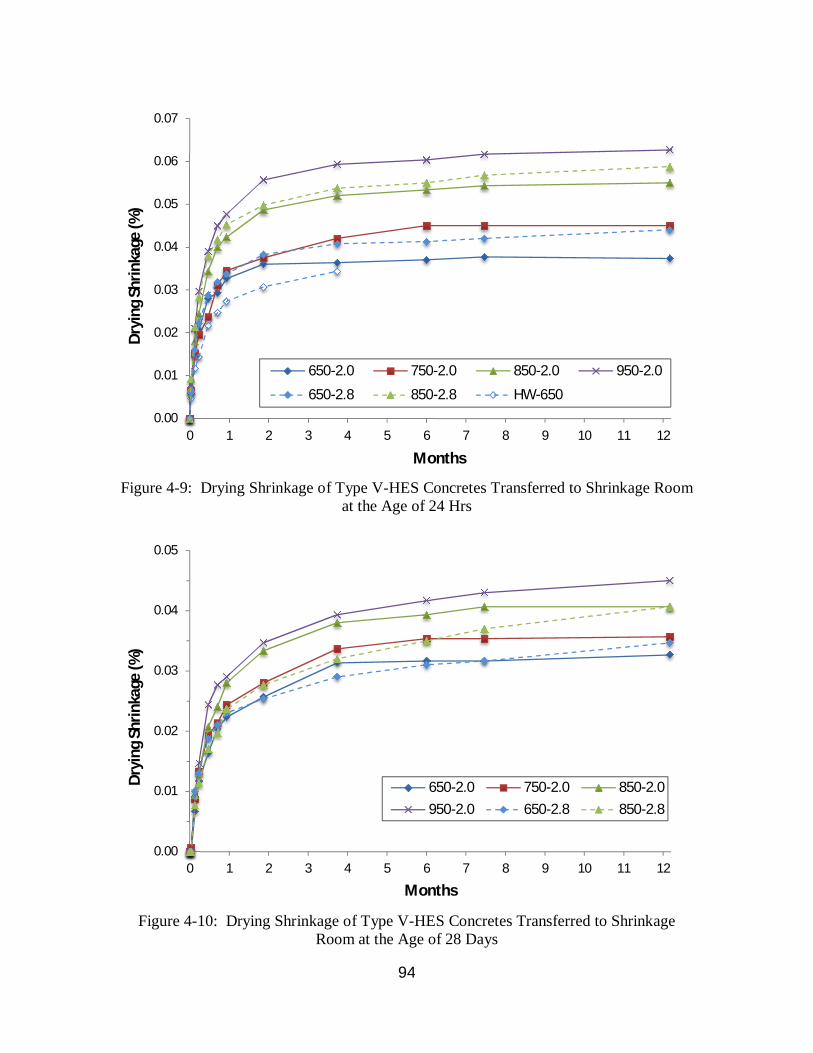
94
Figure 4-9: Drying Shrinkage of Type V-HES Concretes Transferred to Shrinkage Room
at the Age of 24 Hrs
Figure 4-10: Drying Shrinkage of Type V-HES Concretes Transferred to Shrinkage
Room at the Age of 28 Days
0.00
0.01
0.02
0.03
0.04
0.05
0.06
0.07
0 1 2 3 4 5 6 7 8 9 10 11 12
Dry
ing
Shrin
kage
(%)
Months
650-2.0 750-2.0 850-2.0 950-2.0
650-2.8 850-2.8 HW-650
0.00
0.01
0.02
0.03
0.04
0.05
0 1 2 3 4 5 6 7 8 9 10 11 12
Dry
ing
Shrin
kage
(%)
Months
650-2.0 750-2.0 850-2.0950-2.0 650-2.8 850-2.8
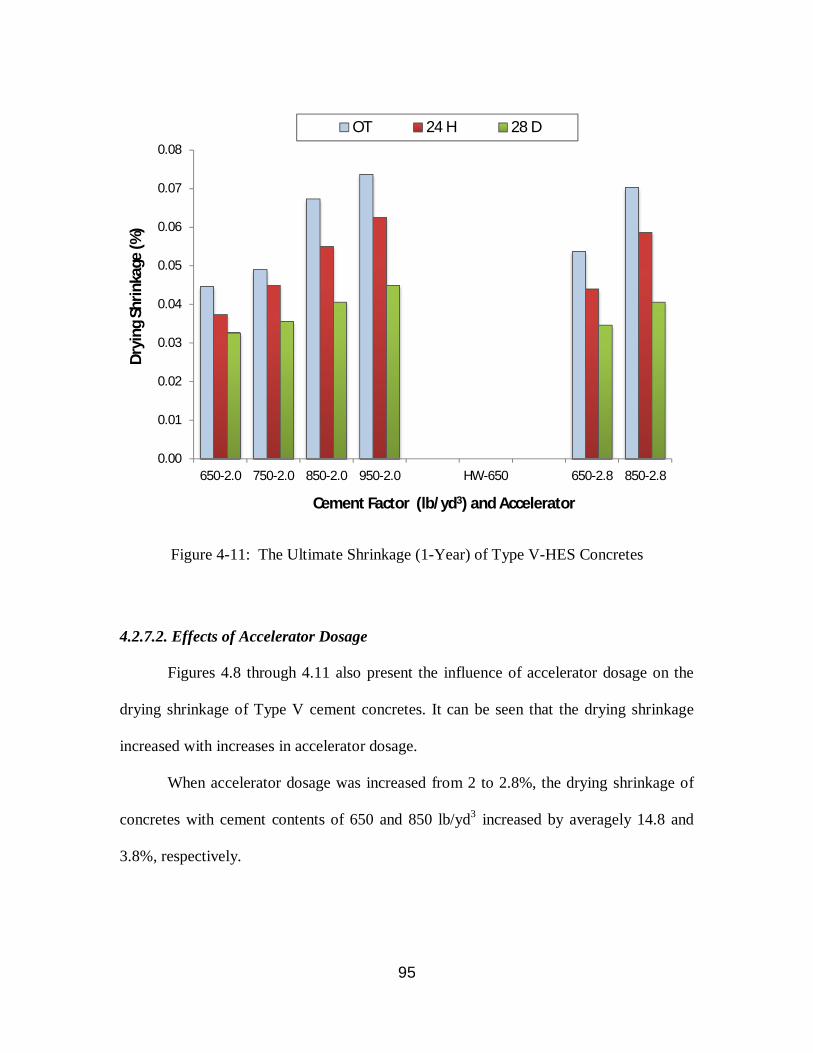
95
Figure 4-11: The Ultimate Shrinkage (1-Year) of Type V-HES Concretes
4.2.7.2. Effects of Accelerator Dosage
Figures 4.8 through 4.11 also present the influence of accelerator dosage on the
drying shrinkage of Type V cement concretes. It can be seen that the drying shrinkage
increased with increases in accelerator dosage.
When accelerator dosage was increased from 2 to 2.8%, the drying shrinkage of
concretes with cement contents of 650 and 850 lb/yd3 increased by averagely 14.8 and
3.8%, respectively.
0.00
0.01
0.02
0.03
0.04
0.05
0.06
0.07
0.08
650-2.0 750-2.0 850-2.0 950-2.0 HW-650 650-2.8 850-2.8
Dry
ing
Shrin
kage
(%)
Cement Factor (lb/yd3) and Accelerator
OT 24 H 28 D

96
4.2.7.3. Effects of Hot Water Usage
Effect of using hot water was evaluated only on 24-hr cured concrete and the
results are shown in Figure 4.9. It can be seen that the drying shrinkage reduced by about
5.5% when hot water was used for mixing instead of tap water with regular laboratory
room temperature.
4.2.7.4. Effects of Curing Age
Figure 4.11 also shows effect of curing age on the ultimate drying shrinkage. It
can be seen that the drying shrinkage reduced as curing age was increased. The drying
shrinkage of the studied concretes reduced by averagely 15.4 and 23.2% when curing age
was increased from opening time to 24 hrs and 24 hrs to 28 days, respectively.
4.2.7.5. Comparison with NDOT Specification
NDOT specification suggests a limitation on the drying shrinkage of concretes
kept in shrinkage room for 28 days. This limit is 0.06% shrinkage. Figure 4.12 shows the
drying shrinkage of concretes after 28 days in shrinkage room. It can be seen all the
studied concretes had lower shrinkage than the NDOT prescribed specification limit.

97
Figure 4-12: Drying Shrinkage of Type V-HES Concretes After 28 Days in Shrinkage Room
4.2.8. Corrosion Resistance
Table 4.9 and Figure 4.13 present failure time of the studied Type V cement
concretes in corrosion test. It can be seen that overall the corrosion resistance improved
(failure time increased) as cement content was increased. An increase of accelerator
dosage had only a positive influence on the corrosion resistance of concretes made with
cement factor of 650 lb/yd3.
The 24-hr corrosion resistance improved slightly with increases in the cement
factor. In the case of concretes made with 2% accelerator, the 24-hr failure time increased
by 13.0 and 3.8% when the cement content was increased from 650 to 750 and 750 to
0.00
0.01
0.02
0.03
0.04
0.05
0.06
650-2.0 750-2.0 850-2.0 950-2.0 HW-650 650-2.8 850-2.8
Dry
ing
Shrin
kage
(%)
Cement Factor (lb/yd3) and Accelerator Dosage (%)
OT 24 H 28 D

98
850 lb/yd3, respectively. Similar increases in the cement factor increased the 28-day
failure time of these concretes by 54.7 and 34.1%, respectively. Further increases in the
cement content from 850 to 950 lb/yd3 had no effect on 24-hr failure time and a negative
effect on the 28-day failure time (16.4% reduction). For concretes made with 2.8%
accelerator, increases in cement content from 650 to 850 lb/yd3 increased the 24-hr and
28-day failure times by 3.8 and 4.2%, respectively.
Increasing accelerator dosage had a positive influence on the failure time of
concrete with cement factor of 650 lb/yd3, whereas it had a negative effect on corrosion
resistance of concrete having cement factor of 850 lb/yd3. The 24-hr and 28-day failure
time of concretes with cement content of 650 lb/yd3 increased by 13 and 81% when
accelerator dosage was increased from 2 to 2.8%, respectively. A similar increase in
accelerator dosage reduced the 28-day failure time of concretes with cement content of
850 lb/yd3 by nearly 9%.
Table 4-9: Time to Failure for Type V-HES Concretes in Corrosion Test
Mixture Identification Curing Age Failure Time (days)
Type V-2.0
650 24 hrs 5.75
28 days 13.25
750 24 hrs 6.5
28 days 20.5
850 24 hrs 6.75
28 days 27.5
950 24 hrs 6.75
28 days 23
Type V-2.8 650
24 hrs 6.5 28 days 24.0
850 24 hrs 6.75
28 days 25.0
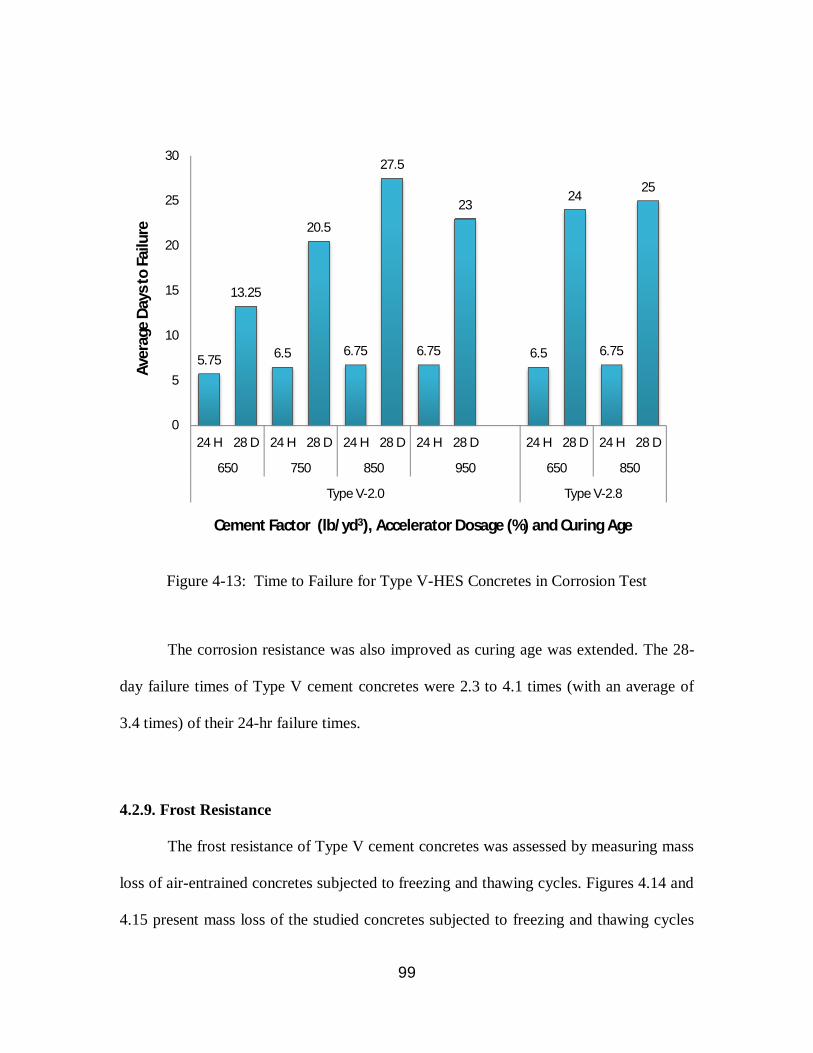
99
Figure 4-13: Time to Failure for Type V-HES Concretes in Corrosion Test
The corrosion resistance was also improved as curing age was extended. The 28-
day failure times of Type V cement concretes were 2.3 to 4.1 times (with an average of
3.4 times) of their 24-hr failure times.
4.2.9. Frost Resistance
The frost resistance of Type V cement concretes was assessed by measuring mass
loss of air-entrained concretes subjected to freezing and thawing cycles. Figures 4.14 and
4.15 present mass loss of the studied concretes subjected to freezing and thawing cycles
5.75
13.25
6.5
20.5
6.75
27.5
6.75
23
6.5
24
6.75
25
0
5
10
15
20
25
30
24 H 28 D 24 H 28 D 24 H 28 D 24 H 28 D 24 H 28 D 24 H 28 D
650 750 850 950 650 850
Type V-2.0 Type V-2.8
Aver
age
Day
s to
Failu
re
Cement Factor (lb/yd3), Accelerator Dosage (%) and Curing Age

100
at different ages of 24 hrs and 28 days, respectively. Figure 4.16 shows the ultimate mass
loss of these concretes after 25 freezing and thawing cycles (each cycle consisted of 2
days of freezing and 2 days of thawing). It can be seen that the frost resistance reduced as
cement factor and accelerator dosage were increased. It, however, improved (increased)
as curing age was extended.
As mentioned earlier, increasing cement content had a negative influence on the
frost resistance of Type V cement concretes. For concretes with 2% accelerator, the
ultimate mass loss of 24-hr tested mixtures increased by 57.6, 14.5 and 75.8% when the
cement content was increased from 650 to 750, 750 to 850 and 850 to 950 lb/yd3,
respectively. Similar increases in cement content of 28-day cured concretes resulted in
11.6, 37.7 and 11.7% increases in ultimate mass loss, respectively. A similar trend was
seen for concretes with 2.8% accelerator. As their cement content was increased from
650 to 850 lb/yd3, their ultimate mass loss increased by 53.5 and 34.7% for concretes
subjected to freeze and thaw cycles at the age of 24 hrs and 28 days, respectively.
It can also be seen that the mass loss increased (frost resistance reduced) when
higher dosage of accelerator was used. For concretes tested at 24 hrs, the ultimate mass
loss increased by 65.9 and 41.1% for mixtures with cement factors of 650 and 850 lb/yd3
when accelerator dosage was increased from 2 to 2.8%, respectively. These increases
were 68.0 and 57.1% for similar concretes cured for 28 days before subjecting to freezing
and thawing cycles, respectively.
It was also observed that the frost resistances of 28-day cured concretes were
higher than those of 24-hr cured concretes. On average, the ultimate mass loss of 28-day
cured concretes was about 26% lower than those only cured for 24 hrs.
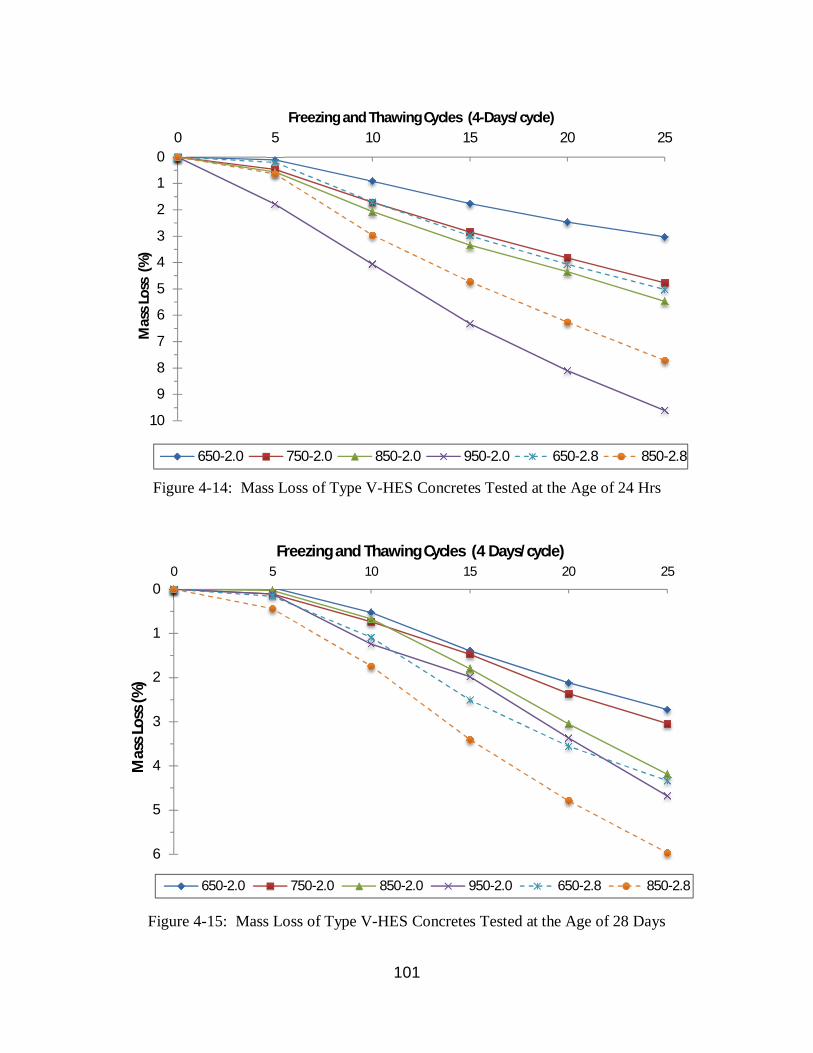
101
Figure 4-14: Mass Loss of Type V-HES Concretes Tested at the Age of 24 Hrs
Figure 4-15: Mass Loss of Type V-HES Concretes Tested at the Age of 28 Days
0
1
2
3
4
5
6
7
8
9
10
0 5 10 15 20 25M
ass L
oss
(%)
Freezing and Thawing Cycles (4-Days/cycle)
650-2.0 750-2.0 850-2.0 950-2.0 650-2.8 850-2.8
0
1
2
3
4
5
6
0 5 10 15 20 25
Mas
s Los
s (%
)
Freezing and Thawing Cycles (4 Days/cycle)
650-2.0 750-2.0 850-2.0 950-2.0 650-2.8 850-2.8

102
Figure 4-16: Ultimate Mass Loss of Type V-HES Concretes Subjected to 25 Freezing and Thawing Cycles
4.2.10. Abrasion
Table 4.10 documents results of abrasion test for the studied Type V cement
concretes. It can be seen that overall, the abrasion depth reduced when cement content,
accelerator dosage and curing age were increased.
The abrasion depth of concretes made with 2% accelerator reduced by averagely
3.2, 7.8 and 5.1% when cement content was increased from 650 to 750, 750 to 850 and
850 to 950 lb/yd3, respectively. In the case of concretes containing 2.8% accelerator, the
abrasion depths of mixtures with cement content of 850 lb/yd3 were averagely 10.5%
lower than those of concretes made with cement content of 650 lb/yd3.
0
1
2
3
4
5
6
7
8
9
10
650-2.0 750-2.0 850-2.0 950-2.0 650-2.8 850-2.8
Mas
s Los
s (%
)
Cement Factor (lb/yd3) and Accelerator Dosage (%)
24 H 28 D
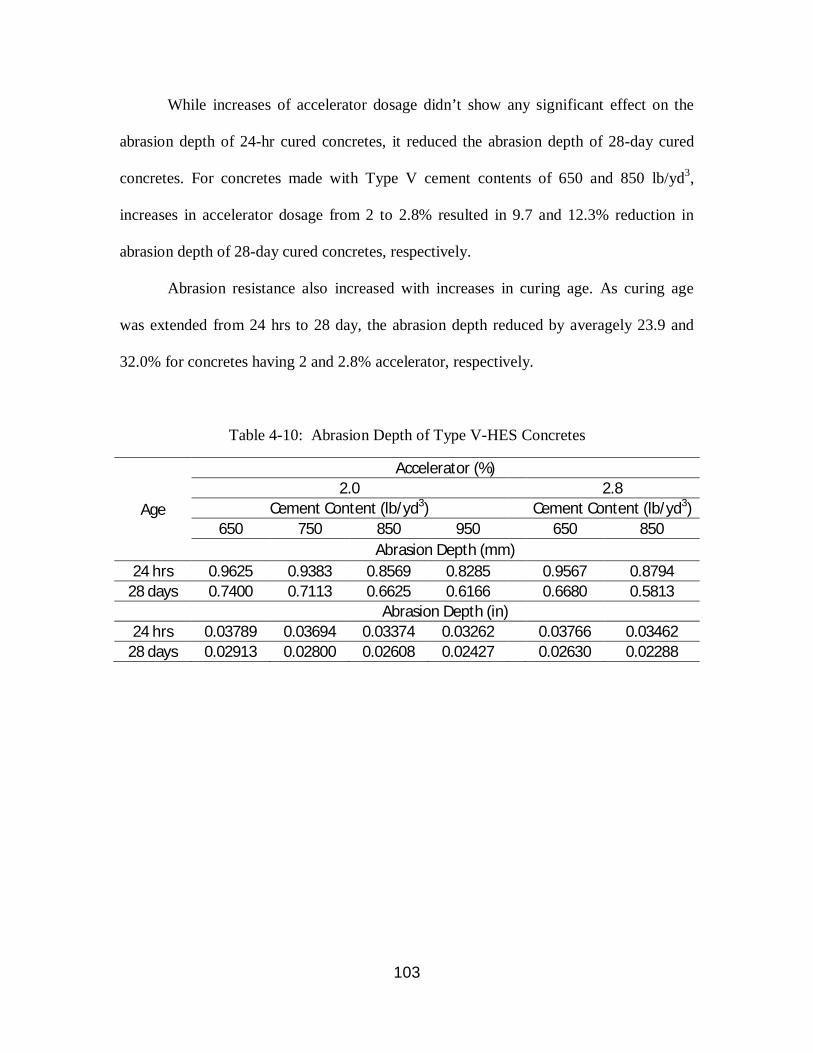
103
While increases of accelerator dosage didn’t show any significant effect on the
abrasion depth of 24-hr cured concretes, it reduced the abrasion depth of 28-day cured
concretes. For concretes made with Type V cement contents of 650 and 850 lb/yd3,
increases in accelerator dosage from 2 to 2.8% resulted in 9.7 and 12.3% reduction in
abrasion depth of 28-day cured concretes, respectively.
Abrasion resistance also increased with increases in curing age. As curing age
was extended from 24 hrs to 28 day, the abrasion depth reduced by averagely 23.9 and
32.0% for concretes having 2 and 2.8% accelerator, respectively.
Table 4-10: Abrasion Depth of Type V-HES Concretes
Age
Accelerator (%) 2.0 2.8
Cement Content (lb/yd3) Cement Content (lb/yd3) 650 750 850 950 650 850
Abrasion Depth (mm) 24 hrs 0.9625 0.9383 0.8569 0.8285 0.9567 0.8794
28 days 0.7400 0.7113 0.6625 0.6166 0.6680 0.5813
Abrasion Depth (in) 24 hrs 0.03789 0.03694 0.03374 0.03262 0.03766 0.03462
28 days 0.02913 0.02800 0.02608 0.02427 0.02630 0.02288
104
Chapter 5 Hardened Properties of High Early-Age Strength Type III Portland Cement Concretes
5.1. Introduction
The second phase of this study dealt with evaluation of different properties of high early-
age strength Type III Portland cement concretes. The three different variables considered
for this phase of study were as follows:
• Cement factor (cement content):
Influences of three different cement contents of 550, 650 and 750 lb/yd3 on properties of
high early-age strength Type III cement concretes were studied.
• Use of air-entraining admixture:
In order to assess effects of air-entrainment on hardened properties of high early-age
strength Type III cement concretes, the designed concretes were made with and without
air-entraining admixture.
• Curing age:
Effects of curing age on the properties of high early-age strength Type III cement
concretes were studied by testing hardened concretes at their opening time, 24 hrs, and 28
days.

105
5.2. Results and Discussion
Similar to the first phase, a comprehensive experimental program was devised to
assess hardened properties of high early-age strength Type III cement concretes including
mechanical properties (compressive and flexural strengths), transport properties
(absorption, water permeability, rapid chloride penetration, and rapid chloride migration),
durability properties (frost resistance, chloride induced corrosion, and resistance to wear),
and dimension stability (drying shrinkage). As mentioned earlier, three testing times
having different curing conditions as described in Chapter 2, depending on the property
tested, were considered at opening time, 24 hrs, and 28 days.
5.2.1. Compressive Strength
Table 5.1 presents results of compressive strength test for the studied high early-
age strength Type III cement concretes at different curing ages including opening time,
24 hrs and 28 days. Table 5.2 reports the opening times and range of compressive
strengths at opening times. Effects of dominant variables on the compressive strength and
opening time of the studied Type III cement concretes are discussed below.
5.2.1.1. Effects of Cement Content
Figure 5.1 presents the results for the opening time compressive strength of Type
III cement concretes having different cement factors. It can be seen that as cement
content was increased, the studied concretes developed their compressive strength
quicker, thus opening times shortened.

106
The opening time of the studied concretes reduced by averagely half an hour for
each 100 lbs increases in the cement factor. In the case of non air-entrained concretes, the
opening times reduced from 5.5 hrs for mixtures having cement content of 550 lb/yd3 to
5, and 4.5 hrs for mixtures with cement content of 650 and 750 lb/yd3, respectively.
Similarly, for air-entrained concretes, the opening times reduced from 6.5 hrs for
mixtures with cement content of 550 lb/yd3 to 6 and 5.5 hrs for mixtures with cement
content of 650 and 750 lb/yd3, respectively.
Effect of cement factor on the 24-hr and 28-day compressive strengths of Type III
cement concretes is presented in Figure 5.2. It can be seen that overall, the compressive
strength of Type III cement concretes with different cement factors were almost similar.
On average, the 24-hr compressive strength reduced by 1.7% when the cement factor was
increased from 550 to 650 lb/yd3 and increased by 1% as the cement factor was increased
from 650 to 750 lb/yd3. The 28-day compressive strength reduced by averagely 6.2%
when the cement content was increased from 550 to 650 lb/yd3 and increased by 0.6% as
the cement content was increased from 650 to 750 lb/yd3.
Table 5-1: Compressive Strength of Type III-HES Concretes (psi)
Mixture Identification Testing Time
Opening Time 24 hrs 28 days
Type III
550 3649 8661 12237 AE-550 3566 5896 8318
650 3421 8496 11826 AE-650 3770 5806 7571
750 3215 8117 11338 AE-750 3284 6176 7969
* AE: Air-entrained
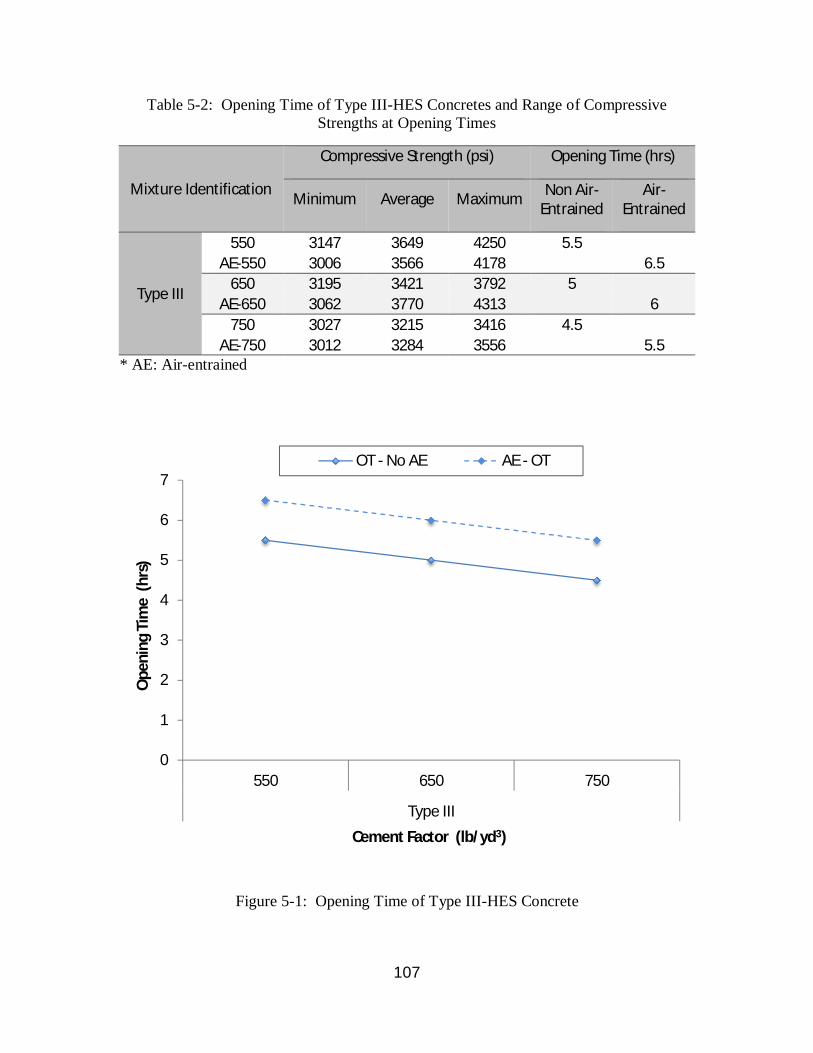
107
Table 5-2: Opening Time of Type III-HES Concretes and Range of Compressive Strengths at Opening Times
Mixture Identification
Compressive Strength (psi) Opening Time (hrs)
Minimum Average Maximum Non Air-Entrained
Air-Entrained
Type III
550 3147 3649 4250 5.5 AE-550 3006 3566 4178 6.5
650 3195 3421 3792 5 AE-650 3062 3770 4313 6
750 3027 3215 3416 4.5 AE-750 3012 3284 3556 5.5
* AE: Air-entrained
Figure 5-1: Opening Time of Type III-HES Concrete
0
1
2
3
4
5
6
7
550 650 750
Type III
Ope
ning
Tim
e (h
rs)
Cement Factor (lb/yd3)
OT - No AE AE - OT

108
Figure 5-2: Compressive Strength of Type III-HES Concretes at 24 Hrs and 28 Days
5.2.1.2. Effects of Air-Entraining Admixture
Figure 5.1 shows effects of air-entraining admixture on the opening time of Type
III cement concretes. It can be seen that the opening times increased when air-entraining
admixture was added to the mixtures.
The opening times of air-entrained concretes were averagely 1 hr more than those
of non air-entrained concretes. When air-entraining admixture was added to the mixtures,
the opening times increased from 5.5 to 6.5, 5 to 6, and 4.5 to 5.5 hrs for cement factors
of 550, 650 and 750 lb/yd3, respectively.
0
2000
4000
6000
8000
10000
12000
14000
550 650 750
Type III
Com
pres
sive
Str
engt
h (p
si)
Cement Factor (lb/yd3)
24 H - No AE 28 D - No AE AE - 24 H AE - 28 D
109
Figure 5.2 presents the effect of entrained air on compressive strength of the
studied Type III cement concretes. It can be seen that the compressive strength
significantly reduced when air-entraining admixture was added to the mixtures. Inclusion
of air-entraining admixture reduced the 24-hr compressive strengths by 31.9, 31.7 and
23.9% for mixtures with cement factors of 550, 650 and 750 lb/yd3, respectively.
Similarly, addition of air-entraining admixture resulted in averagely 32.0, 36.0 and 29.7%
reduction in the 28-day compressive strength of concretes made with cement factors of
550, 650 and 750 lb/yd3, respectively.
5.2.1.3. Effects of Curing Age
Effect of curing age on the compressive strength of Type III cement concretes can
be seen in Table 5.1 and Figure 5.2. Overall, the strength development was quick due to
use of accelerator and high blain of Type III cement. On average, the opening time and
24-hr compressive strengths of the studied Type III cement concretes were about 37 and
73% of their 28-day compressive strengths, respectively.
5.2.2. Flexural Strength
Table 5.3 presents results of flexural strength for the studied high early-age
strength Type III cement concretes at different curing ages, including opening times, 24
hrs and 28 days. These results are also shown in Figure 5.3. It can be seen that the
flexural strength of the studied concretes were in the range of 460 to 620 psi at their
opening times. All the tested samples had flexural strengths of higher than 440 psi at their
opening times.

110
The flexural strength reduced with increases in cement content. The 24-hr flexural
strengths reduced by 8.2 and 8.3% when the cement factor was increased from 550 to 650
and 650 to 750 lb/yd3, respectively. For similar concretes, the same increases in cement
content resulted in 4.9 and 6.6% reduction in the 28-day flexural strengths, respectively.
The studied concretes developed majority of their flexural strength within the first
day due to use of accelerator and high blain of Type III cement. On average, the opening
time and 24-hr flexural strengths of the studied Type III cement concretes were about 40
and 70% of their 28-day flexural strengths, respectively.
Table 5-3: Flexural Strength of Type III-HES Concretes
Mixture Identification Testing Age Flexural Strength (psi)
Average Maximum Minimum
Type III
550 Opening time 622 660 583
24 hr 1043 1136 979 28 day 1444 1506 1382
650 Opening time 545 575 507
24 hr 957 1011 905 28 day 1373 1451 1207
750 Opening time 466 485 441
24 hr 878 933 848 28 day 1282 1346 1187

111
Figure 5-3: Flexural Strength of Type III-HES Concretes
5.2.3. Absorption and Volume of Permeable Voids
Tables 5.4 presents results of absorption test for the studied high early-age
strength Type III cement concretes at different curing ages of opening times, 24 hrs and
28 days. The effects of dominant variables on the absorption and volume of permeable
voids of the studied concretes are discussed below.
550 650 750 550 650 750 550 650 750Type III @ OT Type III @ 24 H Type III @ 28 D
Ave. 622 545 466 1043 957 878 1444 1373 1282High 660 575 485 1136 1011 933 1506 1451 1346Low 583 507 441 979 905 848 1382 1207 1187
0
200
400
600
800
1000
1200
1400
1600
0
200
400
600
800
1000
1200
1400
1600Fl
exur
al S
tren
gth
(psi)
Cement Factor (lb/yd3) and Curing Type

112
Table 5-4: Results of Absorption Test for Type III-HES Concretes
Mixture Identification Testing Age Absorption
After Immersion (%)
Absorption After
Immersion & Boiling (%)
Volume of Permeable Voids (%)
Type III
550 Opening time 3.42 3.52 8.70 24 hrs 2.93 3.13 7.75 28 days 1.36 1.51 3.72
AE - 550 Opening time 3.79 4.17 9.45 24 hrs 3.49 3.91 8.82 28 days 1.70 1.93 4.50
650 Opening time 3.83 4.10 9.95 24 hrs 3.69 3.82 9.37 28 days 1.50 1.68 4.16
AE - 650 Opening time 4.21 4.50 10.28 24 hrs 3.78 4.23 9.62 28 days 1.99 2.22 5.08
750 Opening time 5.01 5.21 12.35 24 hrs 4.56 4.69 11.20 28 days 2.01 2.14 5.19
AE - 750 Opening time 4.93 5.28 11.82 24 hrs 4.65 5.00 11.26 28 days 2.76 3.05 6.89
* AE: Air-entrained
5.2.3.1. Effects of Cement Content
Figure 5.4 shows absorption and volume of permeable voids of high early-age
strength Type III cement concretes tested at different ages of curing including opening
times, 24 hrs and 28 days. It can be seen that the absorption and void contents of the
studied concretes increased as cement content was increased.
For non air-entrained concretes, increases in the cement factor from 550 to 650
and 650 to 750 lb/yd3 increased the absorption of concretes tested at opening times by
averagely 12.0 and 30.8%, respectively. Similar increases in the cement factor increased

113
24-hr absorption by 25.9 and 23.6%, and 28-day absorption by 10.3 and 34.0%,
respectively. Similar increases in the cement content increased the opening time-void
contents by 14.4 and 24.1%, 24-hr void contents by 20.9 and 19.5%, and 28-day void
contents by 11.8 and 24.8%, respectively.
In the case of air-entrained concretes, increases in the cement content from 550 to
650 and 650 to 750 lb/yd3 increased opening time absorption by 11.1 and 17.1%, 24-hr
absorption by 8.3 and 23.0%, and 28-day absorption by 17.1 and 38.7%, respectively.
The same increases in the cement content increased the void contents by 8.8 and 15% at
opening time, 9.1 and 17% for 24-hr tested samples, and 12.9 and 35.6% for 28-day
cured samples, respectively.
Figure 5-4: Absorption and Volume of Permeable Voids of Type III-HES Concretes
0
2
4
6
8
10
12
14
550 650 750 550 650 750
After Immersion Voids
Type III
Perc
enta
ge
Cement Factor (lb/yd3)
OT 24 H 28 DAE - OT AE - 24 H AE - 28 D
114
5.2.3.2. Effects of Air-Entraining Admixture
Figure 5.4 also shows effects of air-entraining admixture on the absorption and
volume of permeable voids of Type III cement concretes. It can be seen that the
absorption and void contents increased when air-entraining admixture was added to the
mixtures.
Inclusion of air-entraining admixture resulted in averagely 6.4, 7.8 and 31.7%
increases in the absorption of concretes tested at opening time, 24 hrs and 28 days,
respectively. For similar testing days and the same concretes, the void contents increased
by averagely 2.5, 5.7 and 25.3%, respectively, when air-entraining admixture was added.
5.2.3.3. Effects of Curing Age
Effects of curing age on the absorption and void contents of the studied concretes
are also shown in Figure 5.4. It can be seen that the absorption and void contents reduced
as the curing age was increased. On average, the absorption reduced by 8.5 and 51.4%
when curing age was extended from opening time to 24 hrs and 24 hrs to 28 days,
respectively. For similar extensions of curing age, the void contents reduced by averagely
7.3 and 49.4%, respectively.
5.2.4. Rapid Chloride Penetration Test
Table 5.5 and Figure 5.5 document results of rapid chloride penetration test
(RCPT) for the studied high early-age strength Type III cement concretes tested at two
curing ages of 24 hrs and 28 days. The effects of dominant variables on the RCPT
passing charges are discussed below.

115
Table 5-5: Passing Charge of Type III-HES Concretes
Mixture Identification Testing Time Passing Charges (Coulombs)
Average Maximum Minimum
Type III
550 24 hrs 2556 2950 2242
28 days 1604 1938 1292
AE - 550 24 hrs 2427 3015 2038
28 days 1298 1486 1107
650 24 hrs 3178 3805 2558
28 days 2016 2336 1661
AE - 650 24 hrs 2791 3360 2268
28 days 1565 1880 1217
750 24 hrs 3592 4320 2841
28 days 2210 2545 1721
AE - 750 24 hrs 3432 3642 3048
28 days 1940 2120 1718 * AE: Air-entrained
Figure 5-5: Passing Charge of Type III-HES Concretes
0
500
1000
1500
2000
2500
3000
3500
4000
550 650 750
Type III
Coul
ombs
Pas
sed
Cement Factor (lb/yd3)
24 H 28 D AE-24 H AE-28 D
116
5.2.4.1. Effects of Cement Content
Figure 5.5 shows effects of cement factor on the passing charges of Type III
cement concretes. It can be seen that the passing charges increased as cement content was
increased.
In the case of non air-entrained concretes, the 24-hr passing charges increased by
averagely 24.3 and 13.0% when the cement factor was increased from 550 to 650 and
650 to 750 lb/yd3, respectively. Similar increases in the cement factor increased the 28-
day RCPT values of these concretes by 25.7 and 9.6%, respectively.
In the case of air-entrained concretes, increases in the cement content from 550 to
650 and 650 to 750 lb/yd3 resulted in averagely 15.0 and 23.0% increases in the 24-hr
passing charges, and 20.6 and 24% increases in the 28-day passing charges, respectively.
5.2.4.2. Effects of Air-Entraining Admixture
Figure 5.5 also presents effects of air-entraining admixture on passing charges of
Type III cement concretes. It can be seen that the passing charges reduced when air-
entraining admixture was added to the concrete mixtures.
Inclusion of air-entraining admixture resulted in averagely 5.0, 12.2 and 4.5%
reduction in the 24-hr passing charges of concretes having cement contents of 550, 650
and 750 lb/yd3, respectively. For similar cement factors, addition of air-entraining
admixture reduced the 28-day passing charges by 19.1, 22.4 and 12.2%, respectively.
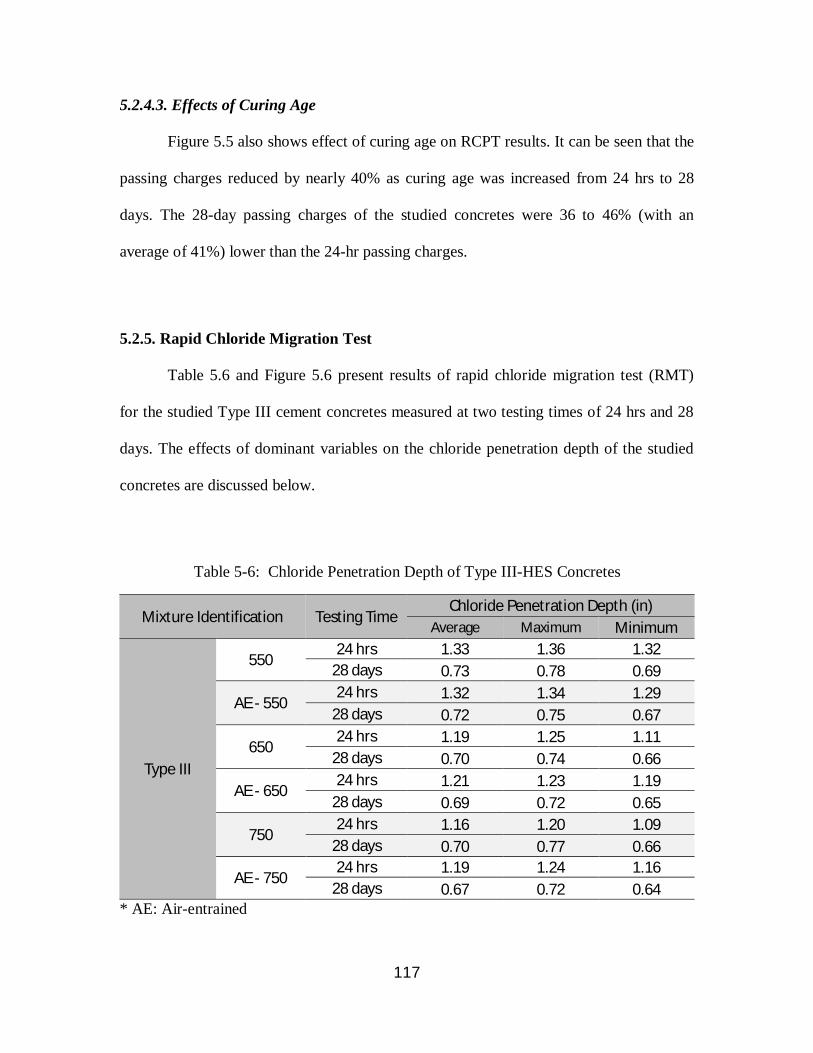
117
5.2.4.3. Effects of Curing Age
Figure 5.5 also shows effect of curing age on RCPT results. It can be seen that the
passing charges reduced by nearly 40% as curing age was increased from 24 hrs to 28
days. The 28-day passing charges of the studied concretes were 36 to 46% (with an
average of 41%) lower than the 24-hr passing charges.
5.2.5. Rapid Chloride Migration Test
Table 5.6 and Figure 5.6 present results of rapid chloride migration test (RMT)
for the studied Type III cement concretes measured at two testing times of 24 hrs and 28
days. The effects of dominant variables on the chloride penetration depth of the studied
concretes are discussed below.
Table 5-6: Chloride Penetration Depth of Type III-HES Concretes
Mixture Identification Testing Time Chloride Penetration Depth (in)
Average Maximum Minimum
Type III
550 24 hrs 1.33 1.36 1.32
28 days 0.73 0.78 0.69
AE - 550 24 hrs 1.32 1.34 1.29
28 days 0.72 0.75 0.67
650 24 hrs 1.19 1.25 1.11
28 days 0.70 0.74 0.66
AE - 650 24 hrs 1.21 1.23 1.19
28 days 0.69 0.72 0.65
750 24 hrs 1.16 1.20 1.09
28 days 0.70 0.77 0.66
AE - 750 24 hrs 1.19 1.24 1.16
28 days 0.67 0.72 0.64 * AE: Air-entrained

118
Figure 5-6: Chloride Penetration Depth of Type III-HES Concretes
5.2.5.1. Effects of Cement Content
Figure 5.6 shows effects of cement factor on the chloride penetration depth of
Type III cement concretes. It can be seen that overall, the chloride penetration depth
slightly reduced as cement content was increased.
In the case of non air-entrained concretes, the 24-hr chloride penetration depth
reduced by averagely 10.5 and 2.5% when the cement factor was increased from 550 to
650 and 650 to 750 lb/yd3, respectively. Similar increases in the cement factor marginally
decreased the 28-day chloride penetration depths of these concretes by 4.1 and 0%,
respectively.
0.4
0.6
0.8
1.0
1.2
1.4
550 650 750
Type III
Pene
trat
ion
(in)
Cement Factor (lb/yd3)
24 I 28 D AE-24 I AE-28 D
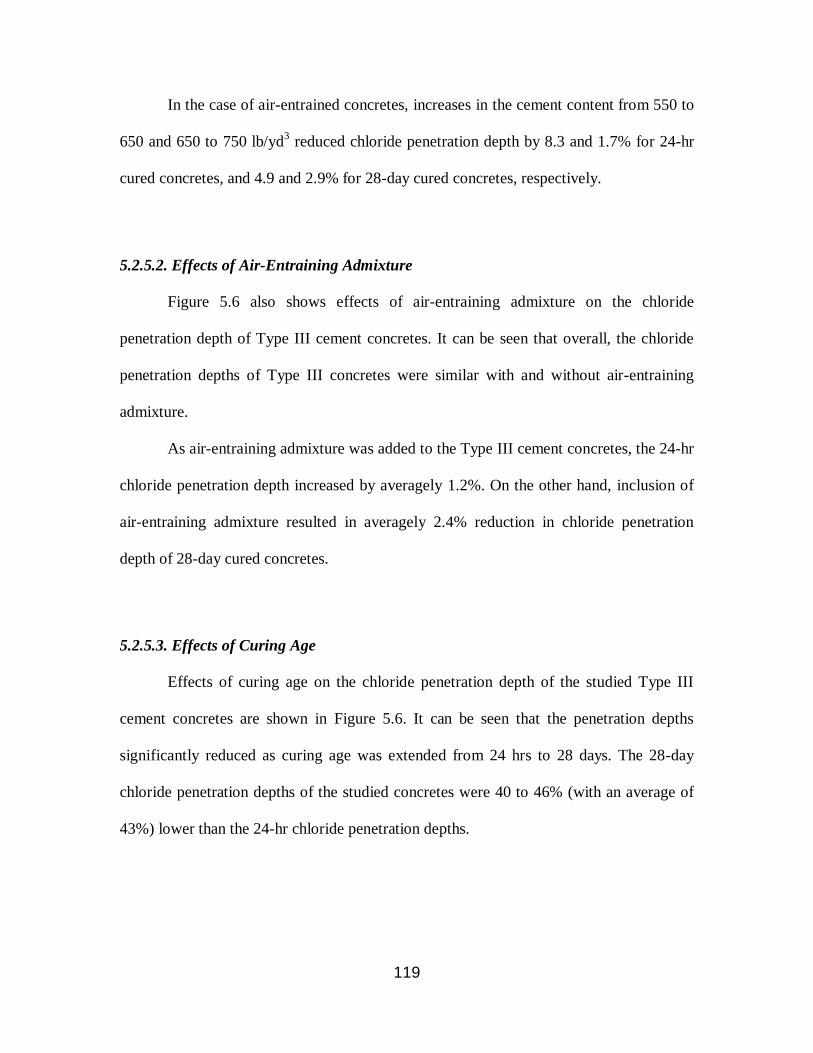
119
In the case of air-entrained concretes, increases in the cement content from 550 to
650 and 650 to 750 lb/yd3 reduced chloride penetration depth by 8.3 and 1.7% for 24-hr
cured concretes, and 4.9 and 2.9% for 28-day cured concretes, respectively.
5.2.5.2. Effects of Air-Entraining Admixture
Figure 5.6 also shows effects of air-entraining admixture on the chloride
penetration depth of Type III cement concretes. It can be seen that overall, the chloride
penetration depths of Type III concretes were similar with and without air-entraining
admixture.
As air-entraining admixture was added to the Type III cement concretes, the 24-hr
chloride penetration depth increased by averagely 1.2%. On the other hand, inclusion of
air-entraining admixture resulted in averagely 2.4% reduction in chloride penetration
depth of 28-day cured concretes.
5.2.5.3. Effects of Curing Age
Effects of curing age on the chloride penetration depth of the studied Type III
cement concretes are shown in Figure 5.6. It can be seen that the penetration depths
significantly reduced as curing age was extended from 24 hrs to 28 days. The 28-day
chloride penetration depths of the studied concretes were 40 to 46% (with an average of
43%) lower than the 24-hr chloride penetration depths.

120
5.2.6. Water Permeability
Table 5.7 and Figure 5.7 show results of water penetration depth for the studied
Type III cement concretes tested at the ages of 24 hrs and 28 days. It can be seen that the
depth of penetration increased as cement content was increased.
The depths of water penetration slightly increased with increases in the cement
factor. The 24-hr water penetration depths increased by 16.1 and 24.3% when the cement
content was increased from 550 to 650 and 650 to 750 lb/yd3, respectively. Similar
increases in the cement factor increased the 28-day water penetration depths of these
concretes by 12.3 and 8.0%, respectively.
The depth of water penetration reduced as curing age was increased. The
reductions, however, were insignificant compared to the reductions observed for the other
transport properties. On average, the 28-day water penetration depths of Type III cement
concretes were about 19% lower than their 24-hr water penetration depths.
Table 5-7: Water Penetration Depth of Type III-HES Concretes
Age Cement Factor (lb/yd3)
550 650 750 Water Penetration Depth (mm)
24 hrs 10.264 11.919 14.817 28 days 8.877 9.970 10.770 Water Penetration Depth (in)
24 hrs 0.4041 0.4693 0.5833 28 days 0.3495 0.3925 0.4240
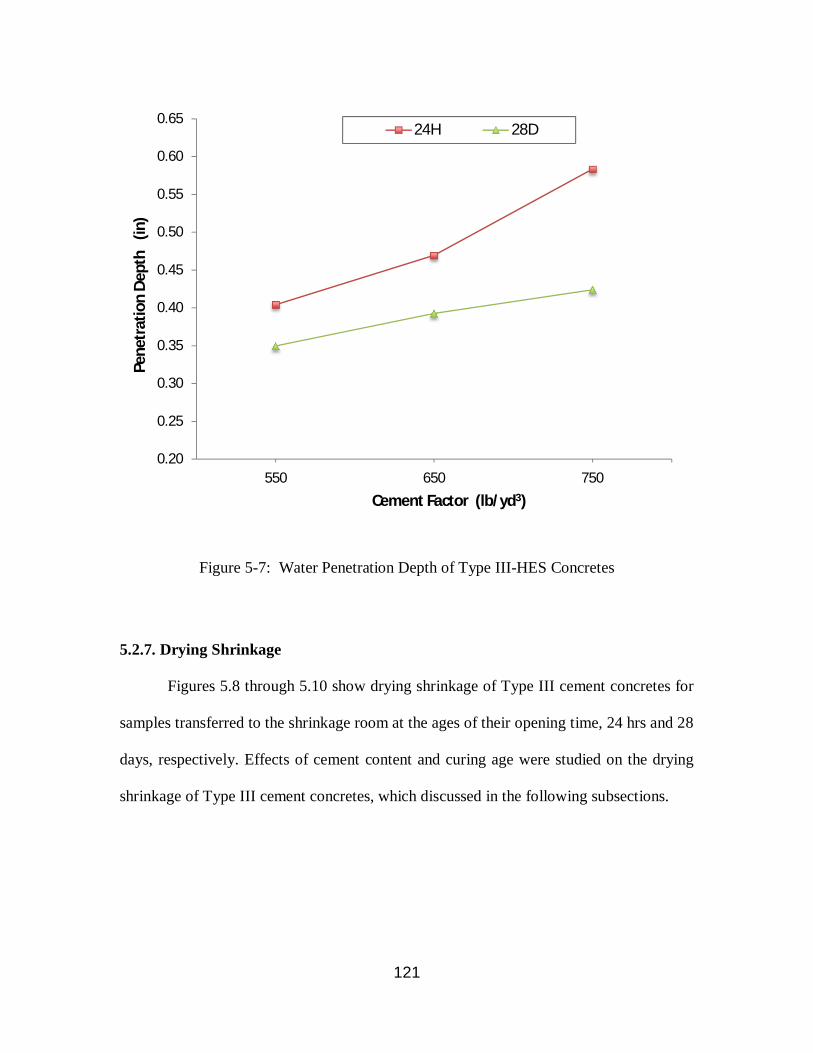
121
Figure 5-7: Water Penetration Depth of Type III-HES Concretes
5.2.7. Drying Shrinkage
Figures 5.8 through 5.10 show drying shrinkage of Type III cement concretes for
samples transferred to the shrinkage room at the ages of their opening time, 24 hrs and 28
days, respectively. Effects of cement content and curing age were studied on the drying
shrinkage of Type III cement concretes, which discussed in the following subsections.
0.20
0.25
0.30
0.35
0.40
0.45
0.50
0.55
0.60
0.65
550 650 750
Pene
trat
ion
Dep
th
(in)
Cement Factor (lb/yd3)
24H 28D

122
5.2.7.1. Effects of Cement Content
Figures 5.8 through 5.10 present effects of cement factor on the drying shrinkage
of Type III cement concretes. It can be seen that the drying shrinkage increased with
increases in cement content.
Figure 5.11 presents the ultimate drying shrinkage of Type III cement concretes
kept in shrinkage room for 7.5 months. The drying shrinkage increased by averagely 22.1
and 17.0% when the cement factor was increased from 550 to 650 and 650 to 750 lb/yd3,
respectively. These increases were 24.1 and 18.3% for concretes transferred to shrinkage
room at their opening time; 28.0 and 15.0% for 24-hr cured concretes; and 14.1 and
17.8% for 28-day cured concretes, respectively.
Figure 5-8: Drying Shrinkage of Type III-HES Concretes Transferred to Shrinkage Room at Opening Time
0.00
0.01
0.02
0.03
0.04
0.05
0.06
0.07
0 1 2 3 4 5 6 7 8
Dry
ing
Shrin
kage
(%)
Months
550 650 750

123
Figure 5-9: Drying Shrinkage of Type III-HES Concretes Transferred to Shrinkage Room at the Age of 24 Hrs
5.2.7.2. Effects of Curing Age
Figure 5.11 shows effect of curing age on the ultimate (7.5 months) drying
shrinkage of Type III cement concretes. It can be seen that the drying shrinkage reduced
as curing age was increased. The drying shrinkage of the studied concretes reduced by
averagely 16.3 and 15.2% when curing age was increased from opening time to 24 hrs
and 24 hrs to 28 days, respectively.
0.00
0.01
0.02
0.03
0.04
0.05
0.06
0 1 2 3 4 5 6 7 8
Dry
ing
Shrin
kage
(%)
Months
550 650 750
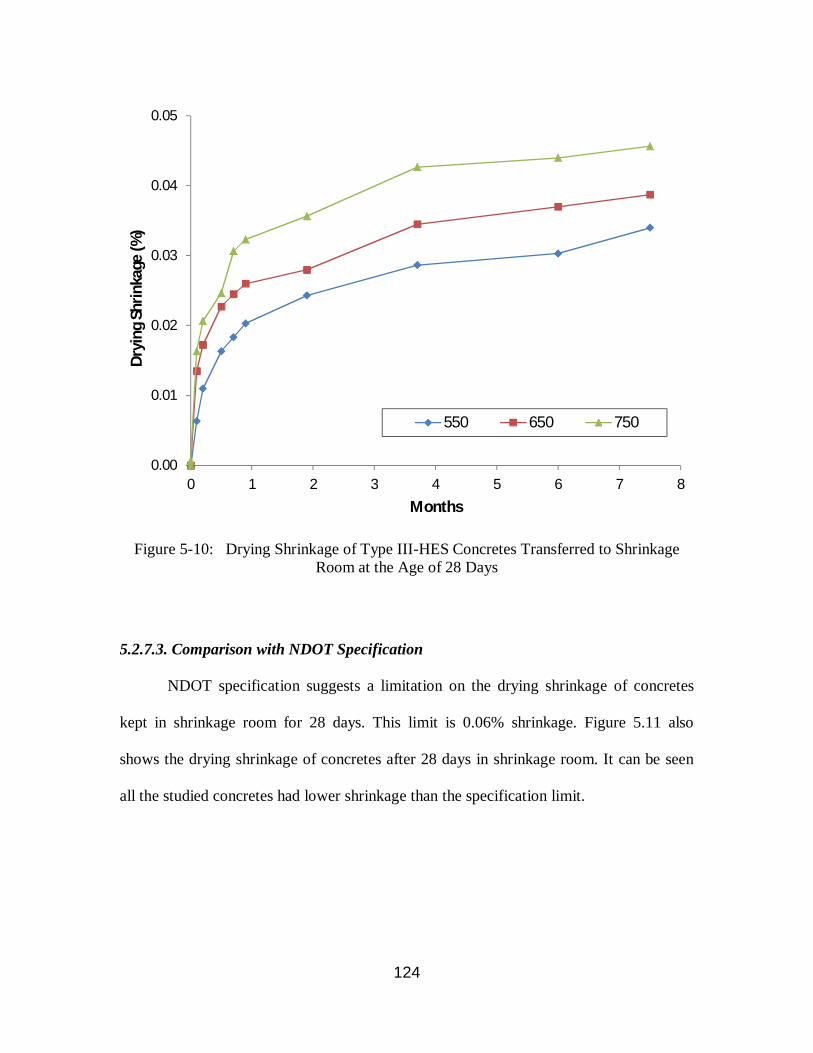
124
Figure 5-10: Drying Shrinkage of Type III-HES Concretes Transferred to Shrinkage Room at the Age of 28 Days
5.2.7.3. Comparison with NDOT Specification
NDOT specification suggests a limitation on the drying shrinkage of concretes
kept in shrinkage room for 28 days. This limit is 0.06% shrinkage. Figure 5.11 also
shows the drying shrinkage of concretes after 28 days in shrinkage room. It can be seen
all the studied concretes had lower shrinkage than the specification limit.
0.00
0.01
0.02
0.03
0.04
0.05
0 1 2 3 4 5 6 7 8
Dry
ing
Shrin
kage
(%)
Months
550 650 750

125
Figure 5-11: The Drying Shrinkage of Type III-HES Concretes After 28 Days and 7.5 Months in Shrinkage Room
5.2.8. Corrosion Resistance
Table 5.8 and Figure 5.12 present failure time of the studied Type III cement
concretes in corrosion test. It can be seen that overall the corrosion resistance improved
(failure time increased) as cement content was increased.
The 24-hr corrosion resistance improved by nearly 23% with each 100 lbs
increases in cement content. The 24-hr failure time increased from 4 to 5 days (25%) and
5 to 6 days (20%) when the cement content was increased from 550 to 650 and 650 to
750 lb/yd3, respectively. Similar increases in the cement factor increased the 28-day
0.00
0.01
0.02
0.03
0.04
0.05
0.06
0.07
550 650 750 550 650 750
@ 28-Days @ 224-Days (7.5 Months)
Dry
ing
Shrin
kage
(%)
Cement Factor (lb/yd3)
OT 24 H 28 D
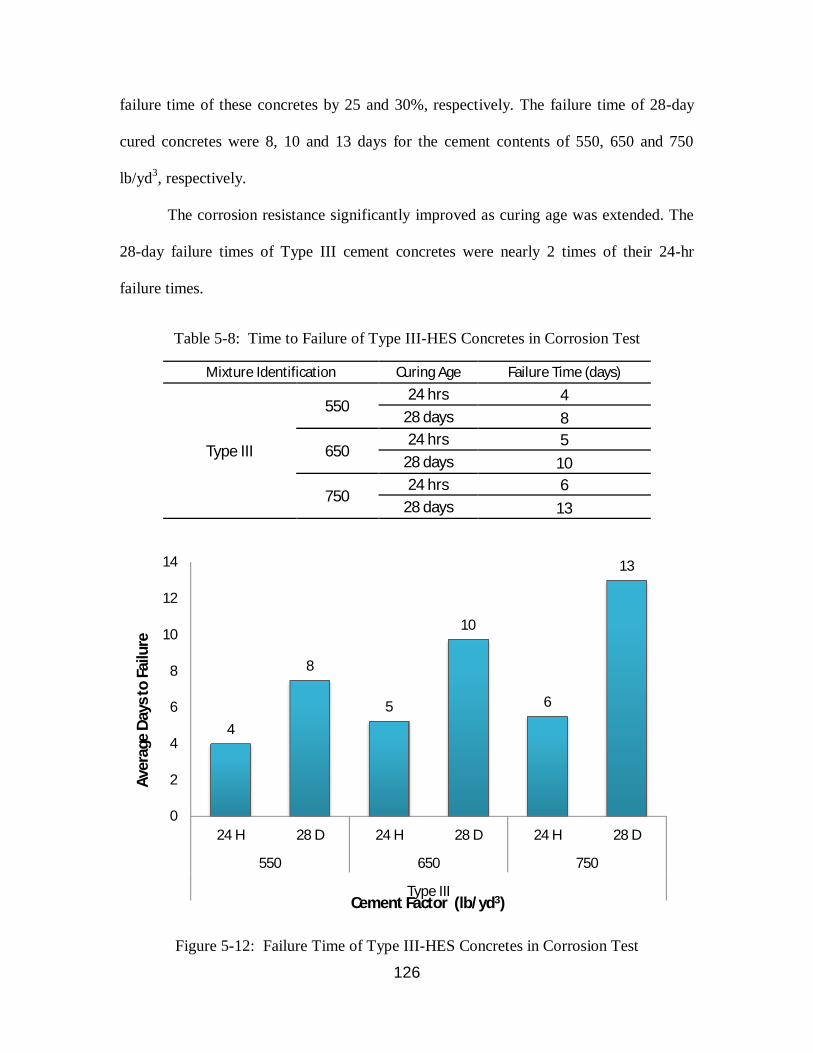
126
failure time of these concretes by 25 and 30%, respectively. The failure time of 28-day
cured concretes were 8, 10 and 13 days for the cement contents of 550, 650 and 750
lb/yd3, respectively.
The corrosion resistance significantly improved as curing age was extended. The
28-day failure times of Type III cement concretes were nearly 2 times of their 24-hr
failure times.
Table 5-8: Time to Failure of Type III-HES Concretes in Corrosion Test
Mixture Identification Curing Age Failure Time (days)
Type III
550 24 hrs 4
28 days 8
650 24 hrs 5
28 days 10
750 24 hrs 6
28 days 13
Figure 5-12: Failure Time of Type III-HES Concretes in Corrosion Test
4
8
5
10
6
13
0
2
4
6
8
10
12
14
24 H 28 D 24 H 28 D 24 H 28 D
550 650 750
Type III
Aver
age
Day
s to
Failu
re
Cement Factor (lb/yd3)

127
5.2.9. Frost Resistance
The frost resistance of Type III cement concretes was assessed by measuring mass
loss of air-entrained concretes subjected to freezing and thawing cycles. Figures 5.13 and
5.14 present mass loss of the studied concretes subjected to freezing and thawing cycles
at different ages of 24 hrs and 28 days, respectively. Figure 5.15 shows the ultimate mass
loss of these concretes after 25 freezing and thawing cycles (each cycle consisted of 2
days of freezing and 2 days of thawing). It can be seen that the frost resistance reduced as
cement factor was increased. It, however, improved (increased) as curing age was
extended.
Increases in cement content negatively influenced the frost resistance of Type III
cement concretes. For 24-hr tested mixtures, the ultimate mass loss increased by 5.6 and
7.1% when the cement content was increased from 550 to 650 and 650 to 750 lb/yd3,
respectively. Similar increases in cement content of 28-day cured concretes resulted in
4.6 and 42.4% increases in ultimate mass loss, respectively.
It was also observed that the frost resistances of 28-day cured concretes were
superior to those of 24-hr cured concretes. The ultimate mass losses of 28-day cured
concretes were lower than those of 24-hr cured concretes by 34.6, 35.2 and 13.8% for
cement contents of 550, 650 and 750 lb/yd3, respectively.

128
Figure 5-13: Mass Loss of Type III-HES Concretes tested at the Age of 24 Hrs
Figure 5-14: Mass Loss of Type III-HES Concretes tested at the Age of 28 Days
0
1
2
3
4
5
6
0 5 10 15 20 25M
ass L
oss (
%)
Freezing and Thawing Cycles (4-Days/cycle)
550 650 750
0
1
2
3
4
5
0 5 10 15 20 25
Mas
s Los
s (%
)
Freezing and Thawing Cycles (4 Days/cycle)
550 650 750
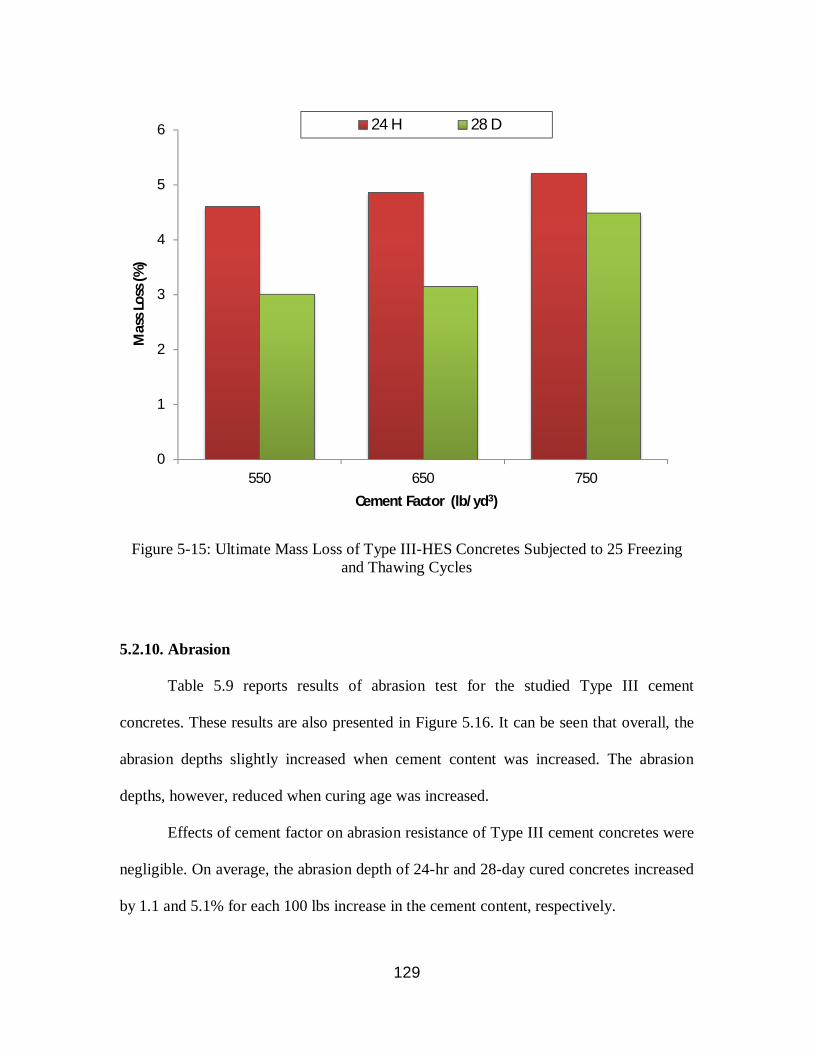
129
Figure 5-15: Ultimate Mass Loss of Type III-HES Concretes Subjected to 25 Freezing and Thawing Cycles
5.2.10. Abrasion
Table 5.9 reports results of abrasion test for the studied Type III cement
concretes. These results are also presented in Figure 5.16. It can be seen that overall, the
abrasion depths slightly increased when cement content was increased. The abrasion
depths, however, reduced when curing age was increased.
Effects of cement factor on abrasion resistance of Type III cement concretes were
negligible. On average, the abrasion depth of 24-hr and 28-day cured concretes increased
by 1.1 and 5.1% for each 100 lbs increase in the cement content, respectively.
0
1
2
3
4
5
6
550 650 750
Mas
s Los
s (%
)
Cement Factor (lb/yd3)
24 H 28 D

130
Abrasion resistance increased with increases in curing age. As curing age was
extended from 24 hrs to 28 day, the abrasion depth reduced by 19.4, 16.4 and 12.9% for
concretes with cement factors of 550, 650 and 750 lb/yd3, respectively.
Table 5-9: Abrasion Depth of Type III-HES Concretes
Age Cement Factor (lb/yd3)
550 650 750 Abrasion Depth (mm)
24 hrs 0.8165 0.8255 0.8343 28 days 0.6578 0.6903 0.7269 Abrasion Depth (in) 24 hrs 0.0321 0.0325 0.0328 28 days 0.0259 0.0272 0.0286
Figure 5-16: Abrasion Depth of Type III-HES Concretes
0.50
0.55
0.60
0.65
0.70
0.75
0.80
0.85
0.90
550 650 750
Abra
sion
Dep
th
(mm
)
Cement Factor (lb/yd3)
24I 28D
131
Chapter 6 Hardened Properties of High Early-Age Strength Rapid Set Cement Concretes
6.1. Introduction
The third phase of this study dealt with evaluation of different properties of high
early-age strength Rapid Set cement concretes. The three different variables considered
for this phase of study were as follows:
• Cement factor (cement content):
Two different cement contents of 550 and 650 lb/yd3 were considered for this
phase of study.
• Use of air-entraining admixture:
In order to assess effects of air-entrainment on hardened properties of high early-
age strength Rapid Set cement concretes, the designed concretes were made with
and without air-entraining admixture.
• Curing age:
Effects of curing age on the properties of high early-age strength Rapid Set
cement concretes were studied by testing hardened concretes at their opening
time, 24 hrs, and 28 days.

132
6.2. Results and Discussion
Similar to the first and second phases of this study, a comprehensive experimental
program was devised to assess hardened properties of high early-age strength Rapid Set
cement concretes including mechanical properties (compressive and flexural strengths),
transport properties (absorption, water permeability, rapid chloride penetration, and rapid
chloride migration), durability properties (frost resistance, chloride induced corrosion,
and resistance to wear), and dimension stability (drying shrinkage). As mentioned earlier,
three testing ages, depending on the property tested, were considered at opening time, 24
hrs, and 28 days.
6.2.1. Compressive Strength
Table 6.1 presents results of compressive strength test for the studied high early-
age strength Rapid Set cement concretes at different curing ages including opening time,
24 hrs and 28 days. Table 6.2 reports the opening times and range of compressive
strengths at opening times. Effects of dominant variables on the compressive strength and
opening time of the studied Rapid Set cement concretes are discussed below.
6.2.1.1. Effects of Cement Content
Figure 6.1 presents the opening time of Rapid Set cement concretes. It can be seen
that the opening time of Rapid Set cement concretes was not affected by the cement
factor. The opening time of the studied concretes (with and without air entrainment) were
similar and equal to an hour for both cement contents of 550 and 650 lb/yd3.

133
Effect of cement factor on the 24-hr and 28-day compressive strengths of Rapid
Set cement concretes is presented in Figure 6.2. It can be seen that overall, the
compressive strength of Rapid Set cement concretes marginally reduced with increases in
cement content. On average, the 24-hr and 28-day compressive strength reduced by 4.2
and 2.0% when the cement factor was increased from 550 to 650 lb/yd3, respectively.
Table 6-1: Compressive Strength of Rapid Set HES Concretes (psi)
Mixture Identification Testing Time
Opening Time 24 hrs 28 days
Rapid Set
550 4768 8736 10970 AE-550 4051 7286 8133
650 4737 8768 10724 AE-650 3603 6641 7988
* AE: Air-entrained
Table 6-2: Opening Time of Rapid Set HES Concretes and Range of Compressive Strengths at Opening Times
Mixture Identification Compressive Strength (psi) Opening Time (hrs)
Minimum Average Maximum Non Air-Entrained
Air-Entrained
Rapid Set
550 4253 4768 5230 1 AE-550 3797 4051 4235 1
650 4278 4737 5108 1 AE-650 3348 3603 3797 1
* AE: Air-entrained

134
Figure 6-1: Opening Time of Rapid Set HES Concretes
Figure 6-2: Compressive Strength Rapid Set HES Concretes at 24 Hrs and 28 Days
0
0.2
0.4
0.6
0.8
1
1.2
550 650
Rapid Set
Ope
ning
Tim
e (h
rs)
Cement Factor (lb/yd3)
OT - No AE AE - OT
0
2000
4000
6000
8000
10000
12000
550 AE-550 650 AE-650
Rapid Set
Com
pres
sive
Str
engt
h (p
si)
Cement Factor (lb/yd3)
24 H 28 D
135
6.2.1.2. Effects of Air-Entraining Admixture
Figure 6.1 also shows effects of air-entraining admixture on the opening time of
Rapid Set cement concretes. It can be seen that the opening times didn’t change when air-
entraining admixture was added to the mixtures. The opening times of all concretes with
and without air-entrainment were similar and equal to an hour.
Figure 6.2 presents the effect of air entrainment on the compressive strength of
the studied Rapid Set cement concretes. It can be seen that the compressive strength
significantly reduced when air-entraining admixture was added to the mixtures. Inclusion
of air-entraining admixture reduced the 24-hr compressive strengths by 16.6 and 24.3%
for mixtures with cement factors of 550 and 650 lb/yd3, respectively. Similarly, addition
of air-entraining admixture resulted in averagely 25.9 and 25.5% reduction in the 28-day
compressive strength of concretes made with cement factors of 550 and 650 lb/yd3,
respectively.
6.2.1.3. Effects of Curing Age
Effect of curing age on the compressive strength of Rapid Set cement concretes
can also be seen in Figure 6.2. Overall, the strength developments of Rapid Set cement
concretes were quick due to the nature of this cement. On average, the opening time and
24-hr compressive strengths of the studied Rapid Set cement concretes were about 46 and
84% of their 28-day compressive strengths, respectively.
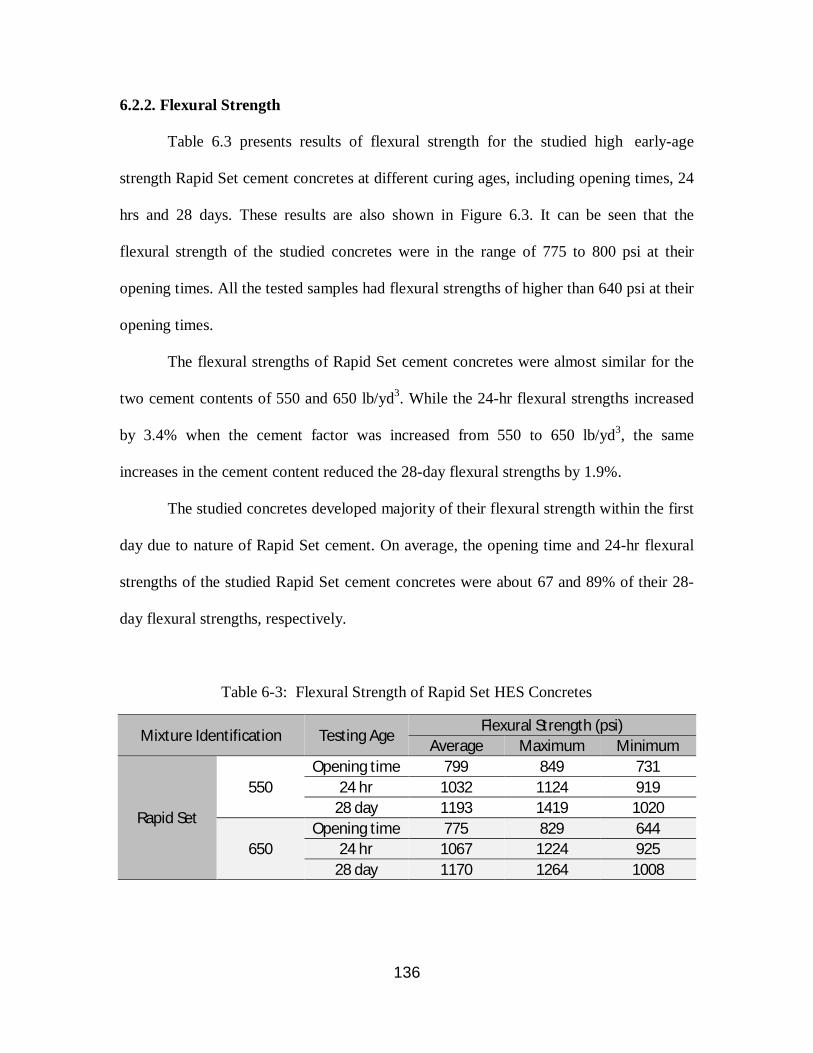
136
6.2.2. Flexural Strength
Table 6.3 presents results of flexural strength for the studied high early-age
strength Rapid Set cement concretes at different curing ages, including opening times, 24
hrs and 28 days. These results are also shown in Figure 6.3. It can be seen that the
flexural strength of the studied concretes were in the range of 775 to 800 psi at their
opening times. All the tested samples had flexural strengths of higher than 640 psi at their
opening times.
The flexural strengths of Rapid Set cement concretes were almost similar for the
two cement contents of 550 and 650 lb/yd3. While the 24-hr flexural strengths increased
by 3.4% when the cement factor was increased from 550 to 650 lb/yd3, the same
increases in the cement content reduced the 28-day flexural strengths by 1.9%.
The studied concretes developed majority of their flexural strength within the first
day due to nature of Rapid Set cement. On average, the opening time and 24-hr flexural
strengths of the studied Rapid Set cement concretes were about 67 and 89% of their 28-
day flexural strengths, respectively.
Table 6-3: Flexural Strength of Rapid Set HES Concretes
Mixture Identification Testing Age Flexural Strength (psi)
Average Maximum Minimum
Rapid Set
550 Opening time 799 849 731
24 hr 1032 1124 919 28 day 1193 1419 1020
650 Opening time 775 829 644
24 hr 1067 1224 925 28 day 1170 1264 1008

137
Figure 6-3: Flexural Strength of Rapid Set HES Concretes
6.2.3. Absorption and Volume of Permeable Voids
Table 6.4 presents results of absorption test for the studied high early-age strength
Rapid Set cement concretes. The effects of dominant variables on the absorption and
volume of permeable voids of the studied concretes are discussed below.
550 650 550 650 550 650Rapid Set @ OT Rapid Set @ 24 H Rapid Set @ 28 D
Ave. 799 775 1032 1067 1193 1170High 849 829 1124 1224 1419 1264Low 731 644 919 925 1020 1008
0
200
400
600
800
1000
1200
1400
1600
0
200
400
600
800
1000
1200
1400
1600Fl
exur
al S
tren
gth
(psi
)
Cement Factor (lb/yd3) and Curing Age

138
Table 6-4: Results of Absorption for Rapid Set HES Concretes
Mixture Identification Testing Age
Absorption After
Immersion (%)
Absorption After
Immersion & Boiling
(%)
Volume of Permeable Voids (%)
Rapid Set
550
Opening time 3.75 3.98 9.59 24 hrs 3.90 4.05 9.75 28 days 3.23 3.35 8.08
AE - 550
Opening time 4.20 4.47 10.39 24 hrs 4.17 4.44 10.32 28 days 3.83 4.00 9.26
650
Opening time 4.83 4.61 10.96 24 hrs 4.39 4.57 10.62 28 days 3.77 3.90 9.33
AE - 650
Opening time 5.16 5.47 12.46 24 hrs 4.85 5.14 11.77 28 days 4.08 4.27 9.82
* AE: Air-entrained
6.2.3.1. Effects of Cement Content
Figure 6.4 shows absorption and volume of permeable voids of high early-age
strength Rapid Set cement concretes tested at different ages of curing including opening
times, 24 hrs and 28 days. It can be seen that the absorption and void contents of the
studied concretes increased as cement content was increased.
For non air-entrained concretes, increases in the cement factor from 550 to 650
lb/yd3 increased the absorption of concretes tested at opening time, 24 hrs and 28 days by
28.8, 12.6 and 16.7%, respectively. A similar increase in cement content led to 14.3, 8.9

139
and 15.5% increases in voids contents of concretes tested at opening time, 24 hrs and
28days, respectively.
In the case of air-entrained concretes, increases in the cement content from 550 to
650 lb/yd3 increased opening time, 24-hr and 28-day absorptions by 22.9, 16.3 and 6.5%,
respectively. A similar increase in cement content of these concretes resulted in 19.9,
14.1 and 6.0% increases in opening time, 24-hr and 28-day void contents, respectively.
Figure 6-4: Absorption and Volume of Permeable Voids Rapid Set HES Concretes
0
2
4
6
8
10
12
14
550 650 550 650
After Immersion Voids
Rapid Set
Perc
enta
ge
Cement Factor (lb/yd3)
OT 24 H 28 D
AE - OT AE - 24 H AE - 28 D

140
6.2.3.2. Effects of Air-Entraining Admixture
Figure 6.4 also presents effects of air-entraining admixture on the absorption and
volume of permeable voids of Rapid Set cement concretes. It can be seen that the
absorption and void contents increased when air-entraining admixture was added to the
mixtures.
Inclusion of air-entraining admixture increased absorption of Rapid Set cement
concretes by averagely 9.4, 8.7 and 13.4% for concretes tested at opening time, 24 hrs
and 28 days, respectively. For similar testing ages and the same concretes, the void
contents increased by averagely 11.0, 8.3 and 9.9%, respectively, when air-entraining
admixture was added.
6.2.3.3. Effects of Curing Age
Effects of curing age on the absorption and void contents of the studied concretes
are also shown in Figure 6.4. It can be seen that the absorption and void contents reduced
as the curing age was increased. This was particularly seen when the curing age was
extended to 28 days. On average, the absorption reduced by 3.0 and 13.8% when curing
age was extended from opening time to 24 hrs and 24 hrs to 28 days, respectively. For
similar extensions of curing age, the void contents reduced by averagely 1.9 and 14.0%,
respectively.
6.2.4. Rapid Chloride Penetration Test
Table 6.5 and Figure 6.5 document results of rapid chloride penetration test
(RCPT) for the studied high early-age strength Rapid Set cement concretes tested at two

141
curing ages of 24 hrs and 28 days. The effects of dominant variables on the passing
charges are discussed below.
Table 6-5: Passing Charge of Rapid Set HES Concretes
Mixture Identification Testing Time Passing Charges (Coulombs)
Average Maximum Minimum
Rapid Set
550 24 hrs 1345 1489 1227
28 days 577 628 494
AE - 550 24 hrs 1576 1901 1419
28 days 548 579 524
650 24 hrs 1568 1742 1304
28 days 723 826 627
AE - 650 24 hrs 1882 2216 1683
28 days 662 737 559 * AE: Air-entrained
Figure 6-5: Passing Charge of Rapid Set HES Concretes
0
200
400
600
800
1000
1200
1400
1600
1800
2000
550 AE - 550 650 AE - 650
Rapid Set
Culo
mbs
Pas
sed
Cement Factor (lb/yd3)
24 H 28 D

142
6.2.4.1. Effects of Cement Content
Figure 6.5 presents effects of cement factor on the passing charges of Rapid Set
cement concretes. It can be seen that similar to the other cement types, the passing
charges increased as cement content was increased.
For non air-entrained concretes, the 24-hr and 28-day passing charges increased
by 16.6 and 25.3% when the cement factor was increased from 550 to 650 lb/yd3,
respectively. In the case of air-entrained concretes, a similar increase in the cement factor
resulted in 19.4 and 20.8% increases in the 24-hr and 28-day passing charges,
respectively.
6.2.4.2. Effects of Air-Entraining Admixture
Figure 6.5 also presents effects of air-entraining admixture on the passing charges
of Rapid Set cement concretes. It can be seen that the passing charges of 24-hr cured
concretes increased when air-entraining admixture was added to the concrete mixtures,
whereas an opposite trend was seen for 28-day cured concretes.
For concretes with cement contents of 550 and 650 lb/yd3, air entrainment
resulted in 17.2 and 20% increases in the 24-hr passing charges, respectively. For similar
cement factors, addition of air-entraining admixture reduced the 28-day passing charges
by 5.0 and 8.4%, respectively.
6.2.4.3. Effects of Curing Age
Figure 6.5 also shows effect of curing age on the results of RCPT test. It can be
seen that the passing charges significantly reduced as curing age was increased from 24
hrs to 28 days. The 28-day passing charges of Rapid Set cement concretes were 54 to
65% (with an average of 60%) lower than their 24-hr passing charges.
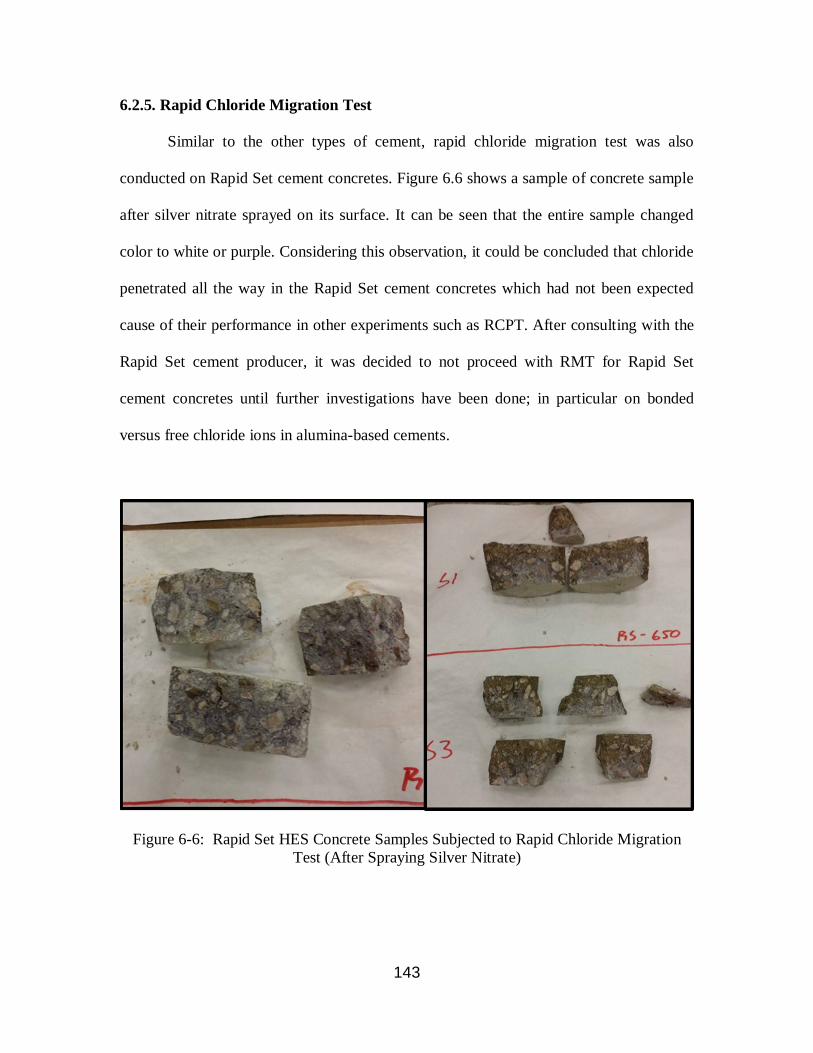
143
6.2.5. Rapid Chloride Migration Test
Similar to the other types of cement, rapid chloride migration test was also
conducted on Rapid Set cement concretes. Figure 6.6 shows a sample of concrete sample
after silver nitrate sprayed on its surface. It can be seen that the entire sample changed
color to white or purple. Considering this observation, it could be concluded that chloride
penetrated all the way in the Rapid Set cement concretes which had not been expected
cause of their performance in other experiments such as RCPT. After consulting with the
Rapid Set cement producer, it was decided to not proceed with RMT for Rapid Set
cement concretes until further investigations have been done; in particular on bonded
versus free chloride ions in alumina-based cements.
Figure 6-6: Rapid Set HES Concrete Samples Subjected to Rapid Chloride Migration Test (After Spraying Silver Nitrate)

144
6.2.6. Water Permeability
Table 6.6 and Figure 6.7 show results of water penetration depth for the studied
Rapid Set cement concretes tested at the ages of 24 hrs and 28 days. It can be seen that
the depth of penetration slightly increased as cement content was increased. When
cement content was increased from 550 to 650 lb/yd3, the 24-hr and 28-day water
penetration depths increased by 2.0 and 6.8%, respectively.
The depth of water penetration considerably reduced as curing age was increased.
On average, the 28-day water penetration depths of Rapid Set cement concretes were
about 77% lower than their 24-hr water penetration depths.
Table 6-6: Water Penetration Depth of Rapid Set HES Concretes
Age Cement Factor (lb/yd3)
550 650 Water Penetration Depth (mm)
24 hrs 16.322 16.648 28 days 3.604 3.848 Water Penetration Depth (in) 24 hrs 0.6426 0.6554 28 days 0.1419 0.1515

145
Figure 6-7: Water Penetration Depth of Rapid Set HES Concretes
6.2.7. Drying Shrinkage
Figures 6.8 through 6.10 show drying shrinkage of Rapid Set cement concretes
for samples transferred to the shrinkage room at the ages of their opening time, 24 hrs
and 28 days, respectively. Effects of cement content and curing age were studied on the
drying shrinkage of Rapid Set cement concretes, which discussed in the following
subsections.
0.0
0.1
0.2
0.3
0.4
0.5
0.6
0.7
RS-550 RS-650
Rapid Set
Wat
er P
enet
ratio
n D
epth
(in
)24 H 28 D

146
6.2.7.1. Effects of Cement Content
Figures 6.8 through 6.10 present effects of cement factor on the drying shrinkage
of Rapid Set cement concretes. Figure 6.11 presents the ultimate drying shrinkage of
Rapid Set cement concretes kept in shrinkage room for 7.5 months. It can be seen that
increases in cement content increased the drying shrinkage of concretes transferred to
shrinkage room at their opening time, whereas a contrary was seen for concretes
transferred to shrinkage room at the ages of 24 hrs and 28 days.
For concretes transferred to shrinkage room at their opening time, the drying
shrinkage increased by about 23% when the cement factor was increased from 550 to 650
lb/yd3. On the other hand, a similar increase in cement content resulted in about 13 and
15% reduction in the drying shrinkage of 24-hr and 28-day cured concretes, respectively.
Figure 6-8: Drying Shrinkage of Rapid Set HES Concretes Transferred to Shrinkage
Room at Opening Time
0.000
0.005
0.010
0.015
0.020
0.025
0.030
0 1 2 3 4 5 6 7 8
Dry
ing
Shrin
kage
(%
)
Months
550 650

147
Figure 6-9: Drying Shrinkage of Rapid Set HES Concretes Transferred to Shrinkage
Room at the Age of 24 Hrs
Figure 6-10: Drying Shrinkage of Rapid Set HES Concretes Transferred to Shrinkage
Room at the Age of 28 Days
0.000
0.002
0.004
0.006
0.008
0.010
0.012
0.014
0.016
0.018
0 1 2 3 4 5 6 7 8
Dry
ing
Shrin
kage
(%
)
Months
550 650
-0.002
0.000
0.002
0.004
0.006
0.008
0.010
0 1 2 3 4 5 6 7 8
Dry
ing
Shrin
kage
(%
)
Months
550 650

148
Figure 6-11: The Drying Shrinkage of Rapid Set HES Concretes After 28 Days and 7.5
Months in Shrinkage Room
6.2.7.2. Effects of Curing Age
Figure 6.11 also shows effect of curing age on the drying shrinkage of Rapid Set
cement concretes. It can be seen that the drying shrinkage reduced as curing age was
increased. The drying shrinkage of 28-day cured concretes were averagely 45.7 and
70.5% lower than the drying shrinkage of concretes transferred to shrinkage room at 24
hrs and opening time, respectively.
0.000
0.005
0.010
0.015
0.020
0.025
0.030
0.035
550 650 550 650
@ 28-Days @ 224-Days (7.5 Months)
Dry
ing
Shrin
kage
(%
)
Cement Factor (lb/yd3)
OT 24 H 28 D

149
6.2.7.3. Comparison with NDOT Specification
The drying shrinkage of Rapid Set cement concretes were also compared with
NDOT specification limit of 0.06% (after 28 days in shrinkage room). This comparison is
also shown in Figure 6.11. It can be seen all the studied concretes had significantly lower
drying shrinkage than the specification limit. The highest drying shrinkage of Rapid Set
cement concretes is about 1/3 (one-third) of the specification limit.
6.2.8. Corrosion Resistance
Table 6.7 and Figure 6.12 present failure time of the studied Rapid Set cement
concretes in corrosion test. It can be seen that overall the corrosion resistance reduced
(failure time reduced) as cement content was increased. The 24-hr and 28-day failure
time reduced by 7.1 and 17.6% when the cement factor was increased from 550 to 650
lb/yd3, respectively.
The corrosion resistance slightly improved as curing age was extended. The 28-
day failure times of Rapid Set cement concretes were 21.4 and 7.6% more than their 24-
hr failure times for mixtures with cement contents of 550 and 650 lb/yd3, respectively.
Table 6-7: Time to Failure of Rapid Set HES Concretes in Corrosion Test
Mixture Identification Curing Age Failure Time (days)
Rapid Set
550 24 hrs 3.5
28 days 4.25
650 24 hrs 3.25
28 days 3.5

150
Figure 6-12: Time to Failure of Rapid Set HES Concretes in Corrosion Test
6.2.9. Frost Resistance
The frost resistance of Rapid Set cement concretes was assessed by measuring
mass loss of air-entrained concretes subjected to freezing and thawing cycles. Figures
6.13 and 6.14 present mass loss of the studied concretes subjected to freezing and
thawing cycles at different ages of 24 hrs and 28 days, respectively. Figure 6.15 shows
the ultimate mass loss of these concretes after 25 freezing and thawing cycles (each cycle
consisted of 2 days of freezing and 2 days of thawing).
3.5
4.25
3.253.5
0
0.5
1
1.5
2
2.5
3
3.5
4
4.5
24 H 28 D 24 H 28 D
550 650
RS
Aver
age
Day
s to
Failu
re
Cement Factor (lb/yd3)

151
It can be seen that the frost resistance reduced as cement factor was increased.
The ultimate mass loss of 24-hr and 28-day cured concretes increased by 11.0 and 11.3%
when the cement content was increased from 550 to 650 lb/yd3, respectively.
It was also observed that the frost resistances of 28-day cured concretes were
superior to those of 24-hr cured concretes. The ultimate mass loss of 28-day cured
concretes was averagely 31.5% lower than those of 24-hr cured concretes.
Figure 6-13: Mass Loss of Rapid Set HES Concretes Tested at the Age of 24 Hrs
0
5
10
15
20
25
30
35
0 5 10 15 20 25
Mas
s Los
s (%
)
Freezing and Thawing Cycles (4-Days/cycle)
RS-550 RS-650

152
Figure 6-14: Mass Loss of Rapid Set HES Concretes Tested at the Age of 28 Days
Figure 6-15: Ultimate Mass Loss of Rapid Set HES Concretes Subjected to 25 Freezing
and Thawing Cycles
0
5
10
15
20
25
0 5 10 15 20 25M
ass L
oss (
%)
Freezing and Thawing Cycles (4-Days/cycle)
RS-550 RS-650
0
4
8
12
16
20
24
28
32
36
RS-550 RS-650
Mas
s Los
s (%
)
Cement Factor (lb/yd3)
24 H 28 D

153
6.2.10. Abrasion
Table 6.8 documents results of abrasion test for the studied Rapid Set cement
concretes. These results are also presented in Figure 6.16. It can be seen that the abrasion
depths of concretes with different cement factors were almost similar. In fact, effects of
cement factor on abrasion resistance of Rapid Set cement concretes were negligible.
When the cement content was increased from 550 to 650 lb/yd3, the abrasion depth of 24-
hr and 28-day cured concretes reduced by 0.4 and 2.1%, respectively.
The abrasion depth significantly reduced with increases in curing age. As curing
age was extended from 24 hrs to 28 day, the abrasion depth reduced (abrasion resistance
increased) by averagely about 44%.
Table 6-8: Abrasion Depth of Rapid Set HES Concretes
Age Cement Factor (lb/yd3)
550 650 Abrasion Depth (mm)
24 hrs 1.1129 1.1080 28 days 0.6306 0.6175
Abrasion Depth (in) 24 hrs 0.0438 0.0436
28 days 0.0248 0.0243
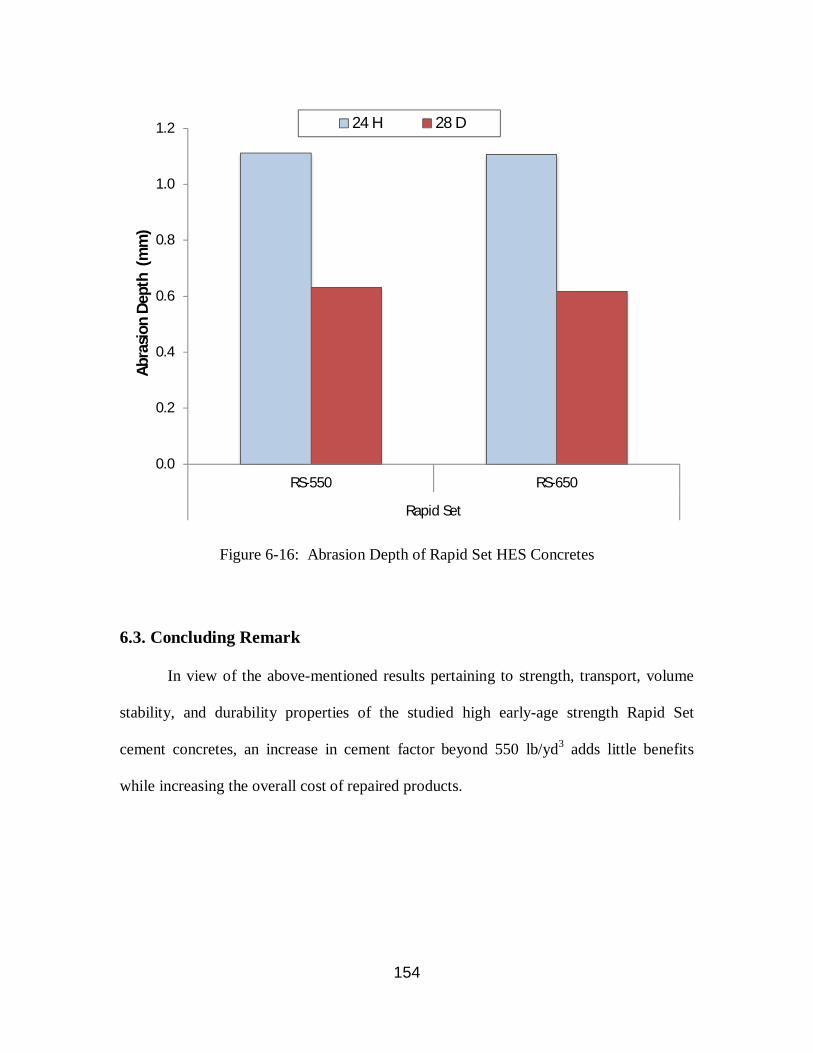
154
Figure 6-16: Abrasion Depth of Rapid Set HES Concretes
6.3. Concluding Remark
In view of the above-mentioned results pertaining to strength, transport, volume
stability, and durability properties of the studied high early-age strength Rapid Set
cement concretes, an increase in cement factor beyond 550 lb/yd3 adds little benefits
while increasing the overall cost of repaired products.
0.0
0.2
0.4
0.6
0.8
1.0
1.2
RS-550 RS-650
Rapid Set
Abra
sion
Dep
th (
mm
)24 H 28 D
155
Chapter 7 Comparison of High Early-Age Strength Concretes
7.1. Introduction
This chapter aims to compare the hardened properties of high early-age strength
concretes made with different types of cement and a similar cement content of 650 lb/yd3.
As discussed in previous chapters, high early-age strength concretes were designed with
an objective of reaching a minimum compressive strength of 3000 psi in a shortest
possible opening time (OT) while maintaining the manufacturer limit for admixture usage
(particularly for accelerator dosage). For this reason, coupled with obligations related to
workability and setting, different types of high early-age strength concretes had to be
made with different water-to-cement ratio (w/c), thus confining the comparison to
ranking orders. Table 7.1 presents high early-age strength concretes selected from each
type of cement and their key elements of mixture design. The cement factor of 650 lb/yd3
was selected for the purpose of comparison due to two main reasons: (1) results of survey
showed cement factor of 600 to 700 lb/yd3 as the most common and preferable cement
content, and (2) 650 lb/yd3 was the common cement factor used in all studied high early-
age strength concretes, including Type V, Type III and Rapid Set cement concretes. Two
additional mixtures were also produced and included for the comparative studies. These
concretes were blended cement concretes made with different proportions of Type V and
Rapid Set Cements. One of them (50/50 blend) contained 50%-50% combination of Type
V and Rapid Set cement, while the other one (75/25 blend) had 75% Type V cement and
25% Rapid Set cement. The studied hardened properties included mechanical properties

156
(compressive and flexural strengths), transport properties (absorption, water permeability,
rapid chloride penetration, and rapid chloride migration), durability properties (frost
resistance, chloride induced corrosion, and resistance to wear), and dimensional stability
(drying shrinkage).
Table 7-1: Key Elements of Mixture Design, Fresh Properties, and Opening Time of the Selected HES Concretes
Mixture Identification w/c Accelerator
Dosage (%)
Initial Setting Time (min)
Final Setting Time (min)
Opening Time (hrs)
Compressive Strength at
Opening Time (psi)
Portland Cement
V-2.0 0.275 2.0 87 167 6.5 3575
AE-V-2.0 0.275 2.0 - - 8.5 3278
V-2.8 0.275 2.8 - - 5.5 3138
AE-V-2.8 0.275 2.8 - - 7.5 3376
III 0.35 2.0 70 129 5.0 3421
AE-III 0.35 2.0 - - 6.0 3770
CSA Cement
RS 0.40 - 20* 30* 1.0 4737
AE-RS 0.40 - 20* 30* 1.0 3603
Type V PC / CSA
Blend
50/50 0.338 - 20* 30* 1.0 3801
AE-50/50 0.338 - 20* 30* 1.5 3569
75/25 0.306 - 20* 30* 5.5 3330
AE-75/25 0.306 - 20* 30* 6.5 3324 * Setting times of Rapid Set cement was provided by manufacturer ** AE: Air –entrained *** All the selected concretes had cement factor of 650 lb/yd3

157
7.2. Properties
7.2.1. Compressive strength
Table 7.1 presents opening time of the selected high early-age strength concretes.
It can be seen that Rapid Set cement concretes reached their opening time significantly
faster than Type III and Type V cement concretes. While they reached opening times
within an hour, the opening time of Type III and V cement concretes ranged from 5 to 8.5
hrs. The opening times of Type III cement concretes were slightly shorter than those of
Type V cement concretes. The opening time of Type III cement concretes were 0.5 and
1.5 hrs lower than those of Type V cement concretes contained 2.8 and 2% accelerator,
respectively. The opening time of 50/50 blended cement concrete was close to the
opening time of Rapid Set cement concretes, whereas the opening time of 75/25 blended
cement concrete was close to that of Type V cement concrete. While the opening time of
50/50 blended cement concretes was averagely 0.25 hr (15 minutes) more than that of
Rapid Set cement concretes, the opening time of 75/25 blended cement concretes was
averagely 5 hrs more than that of Rapid Set cement concretes.
The 24-hr and 28-day compressive strength of the selected high early-age strength
concretes are shown in Figures 7.1 and 7.2, respectively. It can be seen that at both ages,
type V cement concretes contained 2.8% accelerator produced the highest compressive
strength. At 24 hrs, the order of compressive strength from the highest to the lowest were
Type V-2.8% accelerator, Rapid Set cement, Type III-2% accelerator, Type V-2%
accelerator, 50/50 blended cement, and 75/25 blended cement. As Rapid Set cement
concrete developed majority of its strength within the first day (almost 84%), they had
the lowest 28-day compressive strengths. At this age, the order, from the highest to the

158
lowest, was Type V-2.8% accelerator, Type III-2% and Type V-2% accelerator, 75/25
blended cement, 50/50 blended cement, and Rapid Set cement.
Figure 7-1: Compressive Strength of the Selected HES Concretes at 24 hrs
Figure 7-2: Compressive Strength of the Selected HES Concretes at 28 Days
0
1000
2000
3000
4000
5000
6000
7000
8000
9000
10000
V-2.0 V-2.8 III RS VRS-50/50 VRS-75/25
Portland Cement CSA Cement Type V / CSA Blend
Com
pres
sive
Str
engt
h (p
si)
Non-AE AE
0
2000
4000
6000
8000
10000
12000
14000
16000
V-2.0 V-2.8 III RS VRS-50/50 VRS-75/25
Portland Cement CSA Cement Type V / CSA Blend
Com
pres
sive
Str
engt
h (p
si)
Non-AE AE

159
7.2.2. Flexural strength
Figure 7.3 shows results of flexural strength for the selected high early-age
strength concretes at different curing ages including opening time, 24 hrs and 28 days. It
can be seen that similar to the compressive strength test, Rapid Set cement concretes
developed its strength quickly, thus producing the highest flexural strengths at opening
time and 24 hrs. As their strength development considerably diminished after 24 hrs, they
produced the lowest 28-day flexural strength. The orders of 28-day flexural strengths
were as follows:
Opening time: Rapid Set> Type V-2.0>75/25 Blended> Type V-2.8> Type III> 50/50
Blended
24 hours: Rapid Set, Type V-2.0 and Type V-2.8> Type III> 75/25 Blended> > 50/50
Blended
28 days: Type V-2.8> Type V-2.0, 50/50 Blended and 75/25 Blended> Type III> Rapid
Set
Figure 7-3: Flexural Strength of the Selected HES Concretes
V-2.0 V-2.8 III RS VRS-50/50 VRS-75/25Portland Cement CSA Cement Type V / CSA Blend
OT 613 578 545 775 423 59524H 1071 1064 957 1067 801 90028D 1499 1622 1373 1170 1474 1486
0
200
400
600
800
1000
1200
1400
1600
1800
Flex
ural
Str
engt
h (p
si)

160
7.2.3. Absorption and Volume of Permeable Voids
Table 7.2 presents results of absorption test for the selected high early-age
strength concretes at different curing ages of opening time, 24 hrs and 28 days. The void
contents of these concretes are also shown in Figure 7.4.
It can be seen that Rapid Set cement concretes had the highest absorption and
void contents within all the studied types of high early-age strength concretes. The
absorption and void contents of Rapid Set cement concretes were 1.5 to 3.6 times (with
an average of 2.1 times) and 1.3 to 2.8 times (with an average of 1.8 times) of absorption
and void contents of Type V cement concretes, respectively. Additionally, their
absorption and void contents were averagely 1.6 and 1.5 times of those of Type III
cement concretes, respectively. It can also be seen that Type III cement concretes had
higher void contents, with an average of nearly 24%, than Type V cement concretes. The
blended cement concretes had absorption and void contents between Type V and Rapid
Set cement concretes. The higher was the portion of Rapid Set cement in blended cement
concretes, the higher was their absorption and void contents.

161
Table 7-2: Results of Absorption Test for the Selected HES Concretes
Property Mixture Identification Testing Time
Opening Time 24 hrs 28 days
Absorption After
Immersion (%)
Portland Cement
V-2.0 2.61 1.95 1.05
AE-V-2.0 3.35 3.08 1.77
V-2.8 3.18 2.33 1.32
AE-V-2.8 3.51 3.02 1.45
III 3.83 3.69 1.5
AE-III 4.21 3.78 1.99
CSA Cement RS 4.83 4.39 3.77
AE-RS 5.16 4.85 4.08
Type V PC / CSA Blend
VRS-50/50 3.98 3.17 3.02
AE-VRS-50/50 3.33 2.92 2.82
VRS-75/25 3.31 3.25 2.42
AE-VRS-75/25 2.66 2.68 1.69
Void Contents
(%)
Portland Cement
V-2.0 7.27 6.29 3.31
AE-V-2.0 8.61 7.98 4.63
V-2.8 8.61 6.9 3.75
AE-V-2.8 8.96 8.03 3.78
III 9.95 9.37 4.16
AE-III 10.28 9.62 5.08
CSA Cement RS 10.96 10.62 9.33
AE-RS 12.46 11.77 9.82
Type V PC / CSA Blend
VRS-50/50 10.19 8.42 7.77
AE-VRS-50/50 8.87 8.66 7.3
VRS-75/25 8.72 8.44 6.34
AE-VRS-75/25 7.36 7.34 4.82 * AE: Air-entrained

162
Figure 7-4: Void Contents of the Selected HES Concretes
7.2.4. Rapid Chloride Penetration Test
Figure 7.5 shows results of rapid chloride penetration test (RCPT) for the selected
high early-age strength concretes. It can be seen that Rapid Set cement concretes had the
lowest charges passed. Their passing charges were averagely 46 and 52% lower than
those of Type V and Type III cement concretes, respectively. Type V cement concretes
had slightly lower RCPT values than Type III cement concretes. Both blended cement
concretes had lower RCPT values than Type V and Type III cement concretes. Overall,
the order of the selected concretes in this test, from the best performed to the worst
performed, was as follows:
Rapid Set> 75/25 Blended> 50/50 Blended> Type V-2.0>Type V-2.8 and Type III
0
2
4
6
8
10
12
14
V-2.
0
AE-V
-2.0
V-2.
8
AE-V
-2.8 III
AE-II
I
RS
AE-R
S
VRS-
50/5
0
AE-V
RS-5
0/50
VRS-
75/2
5
AE-V
RS-7
5/25
Portland Cement CSA Cement Type V / CSA Blend
Void
con
tent
s (%
)OT 24 H 28 D

163
Figure 7-5: Passing Charges of the Selected HES Concretes
7.2.5. Rapid Chloride Migration Test
Figure 7.6 presents results of rapid chloride migration test (RMT) for the selected
high early-age strength concretes. Since it wasn’t possible to report results of this test for
Rapid Set cement concretes, this section only compares results of RMT for the remaining
types of high early-age cement concretes.
It can be seen that at both ages of testing, blended cement concretes had the
lowest chloride penetration depths. At the age of 24-hr, 75/25 blended cement concrete
had averagely 20.1 and 34.7% lower penetration depths than Type III and Type V
concretes, respectively. At the ages of 28 days, this blended concrete had 36.7 and 45.3%
lower penetration depths than Type III and Type V concretes, respectively. The 50/50
0
500
1000
1500
2000
2500
3000
3500
V-2.
0
AE-V
-2.0
V-2.
8
AE-V
-2.8
III-2
.0
AE-II
I-2.0 RS
AE-R
S
50/5
0
AE-5
0/50
75/2
5
AE-7
5/25
Portland Cement CSA Cement Type V / CSA Blend
Coul
ombs
Pas
sed
24 H 28 D

164
blended cement concrete had almost similar chloride penetration depth to the other types
of the studied concretes. It was also observed that chloride penetrated deeper in Type V
cement concretes than Type III cement concrete at the age of 24 hrs, whereas an opposite
trend was seen for 28-day cured concretes. This can be related to the higher reactivity of
Type III cement at early ages in comparison with Type V cement due to its high Blain.
Overall, the order of the selected high early-age strength concretes in rapid chloride
migration test, from the best performed to the worst performed, was as follows:
24 hours: 75/25 Blended> Type III> Type V-2.0>Type V-2.8
28 days: 75/25 Blended> 50/50 Blended, Type V-2.0 and Type V-2.8 > Type III
Figure 7-6: Chloride Penetration Depth of the Selected HES Concretes
0.0
0.2
0.4
0.6
0.8
1.0
1.2
1.4
1.6
1.8
2.0
V-2.
0
AE-V
-2.0
V-2.
8
AE-V
-2.8 III
AE-II
I
RS
AE-R
S
50/5
0
AE-5
0/50
75/2
5
AE-7
5/25
Portland Cement CSA Cement Type V / CSA Blend
Chlo
ride
Pene
trat
ion
Dep
th (
in)
24 H 28 D

165
7.2.6. Water Permeability
Figure 7.7 shows results of water penetration depth for the selected high early-age
strength concretes. Two different trends were observed for the concretes tested at 24 hrs
and 28 days. While Rapid Set cement concrete performed the worst at the age of 24 hrs, it
had the best performance between 28-day cured concretes. At both ages of testing, Type
V cement concretes performed better than Type III cement concretes. The performance of
blended cement concretes were between the performance of Rapid Set and Type V
cement concretes. The water penetration depth of 75/25 blended cement concrete was
almost similar to that of Type V concretes.
Figure 7-7: Water Penetration Depth of Selected HES Concretes
V-2.0 V-2.8 III RS VRS-50/50 VRS-75/25Portland Cement CSA Cement Type V / CSA Blend
24H 0.3133 0.3483 0.4693 0.6554 0.5208 0.342128D 0.2983 0.3244 0.3925 0.1515 0.3833 0.3106
0.0
0.1
0.2
0.3
0.4
0.5
0.6
0.7
Wat
er P
enet
ratio
n D
epth
(in
)
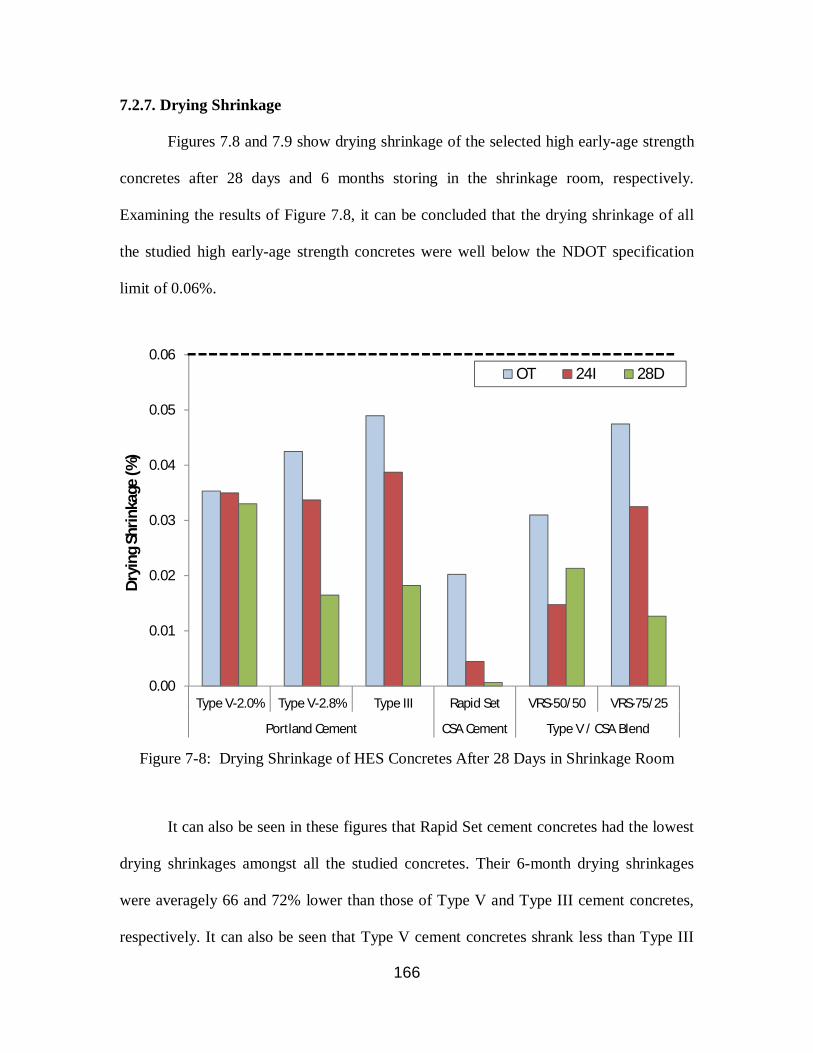
166
7.2.7. Drying Shrinkage
Figures 7.8 and 7.9 show drying shrinkage of the selected high early-age strength
concretes after 28 days and 6 months storing in the shrinkage room, respectively.
Examining the results of Figure 7.8, it can be concluded that the drying shrinkage of all
the studied high early-age strength concretes were well below the NDOT specification
limit of 0.06%.
Figure 7-8: Drying Shrinkage of HES Concretes After 28 Days in Shrinkage Room
It can also be seen in these figures that Rapid Set cement concretes had the lowest
drying shrinkages amongst all the studied concretes. Their 6-month drying shrinkages
were averagely 66 and 72% lower than those of Type V and Type III cement concretes,
respectively. It can also be seen that Type V cement concretes shrank less than Type III
0.00
0.01
0.02
0.03
0.04
0.05
0.06
Type V-2.0% Type V-2.8% Type III Rapid Set VRS-50/50 VRS-75/25
Portland Cement CSA Cement Type V / CSA Blend
Dry
ing
Shrin
kage
(%)
OT 24I 28D

167
cement concretes. The drying shrinkage of blended cement concretes was overall closer
to Type V cement concretes than Rapid Set cement concrete.
Figure 7-9: Drying Shrinkage of HES Concretes After 7.5 Months in Shrinkage Room
7.2.8. Corrosion Resistance
Figure 7.10 presents failure time of the selected high early-age strength concretes
in corrosion test. It can be seen that Rapid Set cement concretes had the weakest
performance in corrosion test with the shortest failure times. The failure times of 24-hr
Rapid Set cement concretes were 35 and 47% shorter than Type III and Type V cement
concretes, respectively. For the concretes tested at the age of 28 days, Rapid Set cement
concrete failed 65 and 80% faster than Type III and Type V cement concretes,
0.00
0.01
0.02
0.03
0.04
0.05
0.06
0.07
Type V-2.0% Type V-2.8% Type III Rapid Set VRS-50/50 VRS-75/25
Portland Cement CSA Cement Type V / CSA Blend
Dry
ing
Shrin
kage
(%)
OT 24I 28D

168
respectively. From these results, it can also be concluded that Type V cement concretes
were slightly more resistant to corrosion than Type III cement concretes. The blended
cement concretes showed two different behaviors for the curing ages of 24 hrs and 28
days. While the 24-hr blended cement concretes performed weak, the 28-day cured
blended cement concretes had the highest corrosion resistances.
Figure 7-10: Failure Time of HES Concretes in Corrosion Test
7.2.9. Frost Resistance
The frost resistance (ultimate mass loss after 25 freezing and thawing cycles with
deicing salt) of the selected high early-age strength concretes is shown in Table 7.3 and
Figure 7.11. It can be seen that Rapid Set cement concretes performed considerably weak
in frost resistance test. While mass losses of Rapid Set cement concretes were in the
5.75
13.25
6.5
24
5
10
3.25 3.52
21.75
6
33.5
0
5
10
15
20
25
30
35
40
24 H 28 D 24 H 28 D 24 H 28 D 24 H 28 D 24 H 28 D 24 H 28 D
V-2.0 V-2.8 III RS 50/50 75/25
Portland Cement CSA Cement Type V / CSA Blend
Aver
age
Day
s to
Failu
re
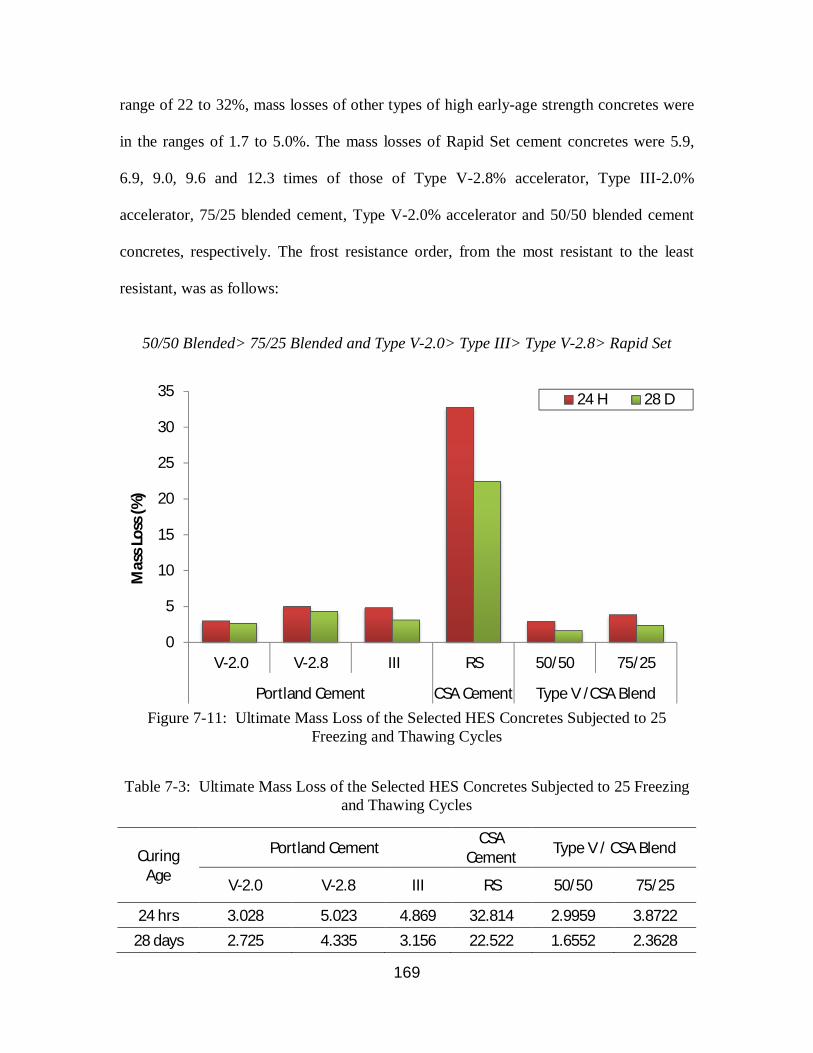
169
range of 22 to 32%, mass losses of other types of high early-age strength concretes were
in the ranges of 1.7 to 5.0%. The mass losses of Rapid Set cement concretes were 5.9,
6.9, 9.0, 9.6 and 12.3 times of those of Type V-2.8% accelerator, Type III-2.0%
accelerator, 75/25 blended cement, Type V-2.0% accelerator and 50/50 blended cement
concretes, respectively. The frost resistance order, from the most resistant to the least
resistant, was as follows:
50/50 Blended> 75/25 Blended and Type V-2.0> Type III> Type V-2.8> Rapid Set
Figure 7-11: Ultimate Mass Loss of the Selected HES Concretes Subjected to 25
Freezing and Thawing Cycles
Table 7-3: Ultimate Mass Loss of the Selected HES Concretes Subjected to 25 Freezing
and Thawing Cycles
Curing Age
Portland Cement CSA Cement Type V / CSA Blend
V-2.0 V-2.8 III RS 50/50 75/25
24 hrs 3.028 5.023 4.869 32.814 2.9959 3.8722 28 days 2.725 4.335 3.156 22.522 1.6552 2.3628
0
5
10
15
20
25
30
35
V-2.0 V-2.8 III RS 50/50 75/25
Portland Cement CSA Cement Type V /CSA Blend
Mas
s Los
s (%
)
24 H 28 D

170
7.2.10. Abrasion
Table 7.12 presents results of abrasion test for the selected high early-age strength
concretes. It can be seen that while overall performance of Type III, Type V and Rapid
Set cement concretes were close in this test, the blended cement concretes showed the
worst performances. The abrasion resistance order of high early-age strength concretes
was as follows:
24 hrs: Type III> Type V-2.0 and Type V-2.8> Rapid Set> 75/25 Blended> 50/50
Blended
28 days: Rapid Set> Type V-2.8> Type III> 75/25 Blended> Type V-2.0> 50/50 Blended
Figure 7-12: Abrasion Depth of the Selected HES Concretes
V-2.0 V-2.8 III RS VRS-50/50 VRS-75/25Portland Cement CSA Cement Type V / CSA Blend
24H 0.9625 0.9567 0.8255 1.1080 1.4564 1.203228D 0.7400 0.6680 0.6903 0.6175 1.0389 0.7089
0.0
0.2
0.4
0.6
0.8
1.0
1.2
1.4
1.6
Abra
sion
Dep
th (m
m)

171
7.3. Concluding Remarks
Table 7.4 shows ranking (in ascending order of 1 through 6 with 1 meaning "best"
and 6 representing "worse" performing mixtures) of the selected high early-age strength
concretes for different properties.
It can be seen that overall it’s not possible to categorize one type of concrete as
the best type of high early-age strength high-performance concrete. In view of opening
time, drying shrinkage, RCPT and water permeability; Rapid Set cement concretes had
the best results. However, its performance in frost resistance and corrosion tests was
really weak. Additionally, it wasn’t the best concrete in abrasion and absorption tests.
Type V cement concretes had the longest opening times. Their performance in other tests
were reasonable and usually amongst the first 3 options. Type III cement concretes had
reasonable opening times, but they were not amongst the best performed concretes in
drying shrinkage, transport properties, corrosion and frost resistance. The blended cement
concretes didn’t have the best abrasion resistance and the performance of their 24-hr
cured samples was weak in corrosion test. Altogether, selection of the most suitable high
early-age high-performance concrete for rapid repair is contingent upon an optimum
combination of properties to meet specific design requirements.

172
Table 7-4: Ranking of the Selected HES Concretes for Different Properties
Properties Test Testing Age Portland Cement CSA
Cement Type V/ CSA
Blend V-2.0 V-2.8 III RS 50/50 75/25
Opening Time
Compressive Strength -- 6 5 3 1 2 4
Mechanical
Compressive Strength
24 hrs 4 1 3 1 5 5 28 days 2 1 2 5 5 2
Flexural Strength
24 hrs 1 1 4 1 6 5 28 days 2 1 5 6 2 2
Volume Stability
Dry Shrinkage
Opening time 2 4 5 1 3 6
24 hrs 3 4 5 1 2 5
28 days 3 3 6 1 5 2
Transport
Absorption and Void Contents
Opening time, 24 hrs & 28 days
1 2 4 6 4 3
Water Permeability
24 hrs 1 2 4 6 5 2 28 days 2 2 5 1 5 2
RCPT 24 hrs & 28 days 4 5 5 1 3 2
RMT 24 hrs 3 4 2 NA NA 1 28 days 2 2 5 NA 2 1
Durability
Corrosion of Steel
24 hrs 2 1 4 5 6 2 28 days 4 2 5 6 3 1
Abrasion Resistance
24 hrs 2 2 1 4 6 5 28 days 5 2 3 1 6 4
Frost Resistance
24 hrs 1 5 4 6 1 3 28 days 3 5 4 6 1 2
NA: Not applicable

173
References ASCE (2013). ASCE Report Card, American Society of Civil Engineers, Reston, VA.
ASCE (2009). ASCE Report Card, American Society of Civil Engineers, Reston, VA.
ASCE (2005). ASCE Report Card, American Society of Civil Engineers, Reston, VA.
ASCE (2001). ASCE Report Card, American Society of Civil Engineers, Reston, VA.
ASCE (1998). ASCE Report Card, American Society of Civil Engineers, Reston, VA.
American Concrete Pavement Association (ACPA), (Not Dated). Concrete Paving Technology: Fast-Track Concrete Pavements.
American Society for Testing and Materials (ASTM). (2014). “Standard Test Method for Sieve Analysis of Fine and Coarse Aggregates.” C 136, West Conshohocken, Pa.
American Society for Testing and Materials (ASTM). (2013). “Standard Specification for Concrete Aggregates.” C 33, West Conshohocken, Pa.
American Society for Testing and Materials (ASTM). (2015). “Standard Test Method for Density, Relative Density (Specific Gravity), and Absorption of Fine Aggregate.” C 128, West Conshohocken, Pa
American Society for Testing and Materials (ASTM). (2015). “Standard Test Method for Slump of Hydraulic-Cement Concrete.” C 143, West Conshohocken, Pa
American Society for Testing and Materials (ASTM). (2008). “Standard Test Method for Time of Setting of Concrete Mixtures by Penetration Resistance.” C 1403, West Conshohocken, Pa
American Society for Testing and Materials (ASTM). (2014). “Standard Test Method for Air Content of Freshly Mixed Concrete by the Pressure Method.” C 231, West Conshohocken, Pa
American Society for Testing and Materials (ASTM). (2015). “Standard Test Method for Heat of Hydration of Hydraulic Cement.” C 186, West Conshohocken, Pa
American Society for Testing and Materials (ASTM). (2012). “Standard Test Method for Compressive Strength of Cylindrical Concrete Specimens.” C 39, West Conshohocken, Pa.
American Society for Testing and Materials (ASTM). (2016). “Standard Test Method for Flexural Strength of Concrete (Using Simple Beam with Third-Point Loading).” C 78, West Conshohocken, Pa

174
American Society for Testing and Materials (ASTM). (2008). “Standard Test Method for Length Change of Hardened Hydraulic-Cement Mortar and Concrete.” C 157, West Conshohocken, Pa
American Society for Testing and Materials (ASTM). (2013). “Standard Test for Density, Absorption, and Voids in Hardened Concrete.” C 642, West Conshohocken, Pa.
American Society for Testing and Materials (ASTM). (2012). “Standard Test Method for Electrical Indication of Concrete’s Ability to Resist Chloride Ion Penetration.” C 1202-12, West Conshohocken, Pa.
American Society for Testing and Materials (ASTM). (2012). “Standard Test Method for Abrasion Resistance of Horizontal Concrete Surfaces.” C 779, West Conshohocken, Pa
American Society for Testing and Materials (ASTM). (2012). “Standard Test Method for Scaling Resistance of Concrete Surfaces Exposed to Deicing Chemicals.” C 672, West Conshohocken, Pa
Ansari, F., Luke, A., Vitillo, N. P., Blank, N., Turhan, I. (1997, May). Developing Fast Track Concrete for Pavement Repair. Concrete International. pp. 24-29
Bescher, E. P.,(2014). Calcium Sulfoaluminate-Belite Concrete: Structure, Properties, Practice. PowerPoint presentation. http://www.cptechcenter.org/ncc/Sp2015%20NCC/03%20Wed%20Bescher-Calcium%20Sulfoaluminate-Belite%20Concrete.pdf (Retrieved January 2017)
Buch, N., Van Dam, T. J., Peterson, K., Sutter, L. (2006 – online). Evaluation of High-Early Strength PCC Mixtures Used in Full Depth Repairs. Construction and Building Materials. Vol. 22, pp. 162-174. Science Direct (2008).
European Committee for Standardization (CEN). (2000). “Testing hardened concrete –Part 8: Depth of penetration of water under pressure.” EN 12390-8:2000, Brussels.
Florida Department of Transportation (FDOT), (2000). “Florida Method of Test for an Accelerated Laboratory Method for Corrosion Testing of Reinforced Concrete Using Impressed Current.” FM 5-522, Florida.
Ghafoori, N., Diawara, H., Beasley, S. (2008) Resistance to External Sodium Sulfate Attack for Early-Opening-to-Traffic Portland Cement Concrete. Cement and Concrete Composites. Vol. 30, pp. 444-454. Science Direct
Grove, J. D., Jones, K. B., Bharil, K. S., Calderwood, W. (1989). Fast Track and Fast Track II. Transportation Research Record 1282. Transportation Research Board. National Research Council. Washington, DC. pp. 1-7
Hall,M. J., (1993). Wisconsin Fast-Track Paving Experiences. Proceedings of the 4th Materials Engineering Conference on Materials for the New Millennium. Vol.1 (pp. 456-465) New York, NY: American Society of Civil Engineers.
175
Jones, K. B. (1988, June). Special Cements for Fast Track Concrete. Final Report MLR-87-4. Iowa Department of TRansportion – Highway Division.
Knutson, M., Riley, R. (1987, January). Fast-Track Concrete Paving Opens the Door to Industry Future. Concrete Construction. pp. 19-22
Kosmatka, S. H., Kerkhoff, B., Panarese, C. (1994). The Design and Control of Concrete Mixtures (14th ed.)., Skokie, Illinois: Portland Cement Association
Kumar, M. K., Rao, P. S., Swamy, (2012). High Early Strength Concrete without Steam Curing. International Journal of Engineering and Innovative Technology. Vol. 2, No. 1, pp. 228-233. (ISSN: 2277-3754)
Mehta, P. K., Monteiro, P. J. M. (1992). Concrete Structures, Properties, and Materials, 2nd Ed.
Min, T. B., Cho, I. S., Park, W. J., Choi, H. K., Lee, H. S. (2014). Experimental Study on the Development of Compressive Strength of Early Concrete Age Using Calcium-Based Hardening Accelerator and High Early Strength Cement. Construction and Building Materials. Vol. 64, pp. 208-214. Science Direct.
Mindess, S., Young, J. F., & Darwin, D. (2003). Concrete (2nd ed.). Upper Saddle River, New Jersey: Prentice Hall.
Nordtest. (1999). “Chloride Migration Coefficient from Non-Steady-State Migration Experiments.” NT Build 492, Espoo, Finland.
Ohio Department of Transportation (ODOT), (2007, May). High Early Strength Concrete Overlays. Departmental Report. Ohio Department of Transportation: Office of Materials Management, Cement and Concrete Section.
Ozyildirim, C. (1993, January). High-Performance Concrete for Transportation Structures. Concrete International. pp. 33-38
Pearson, R. I. (1988, August) Fast Track Paving, Concrete International. pp. 33-35
Pera, J., Ambroise, J. (2004). New Applications of Calcium Sulfoaluminate Cement. Cement and Concrete Research. Vol. 34, pp. 671-676. Science Direct.
Soutsos, M. N., Barnett, S. J., Bungey, J. H., Millard, S. G. (Not Dated). Fast Track Construction with High-Strength Concrete Mixes Containing Ground Granulated Furnace Slag. Report Number SP-228-19.
Sprinkel, M. M., (1988,September). High Early Strength Latex Modified Concrete. Concrete Construction. pp. 831-836
Tays, M. W. (2002). Matthew Tays “Abrasion Resistance of Fast-Track Portland Cement Concrete” master’s thesis, Tennessee Technological University, 2002.

176
Todd, N. T. (2015). Todd Nathan, “Assessing Risk Reduction of High Early Strength Concrete Mixtures” master’s thesis, Purdue University, 2015, ProQuest (10062227)
Wenzlick, J. D.(2006). Evaluation of Very High Early Strength Latex Modified Concrete Overlays. Organizational Results Research Report RI04-005. Missouri Department of Transportation.
Whiting, D., Nagi, M., Okamato, P. A. (1994, December). Early Strength Gain of Rapid Highway Repair Concrete. Concrete International. pp. 28-35
Zhu, P., Zhongguo, J. M.(2010, November). Selection of Durable Closure Pour Materials for Accelerated Bridge Construction. ASCE Journal of Bridge Engineering. Vol. 15, No. 6, pp. 695-704. (ISSN: 1084-0702)
www.cbpp.org/research/state-budget-and-tax/its-time-for-states-to-invest-in-infrastructure (retrieved 5/22/16)
www.mapofusa.net/usa-map.jpg (retrieved 5/12/16)
www.RapidSet.com
177
Appendix A
Survey Results
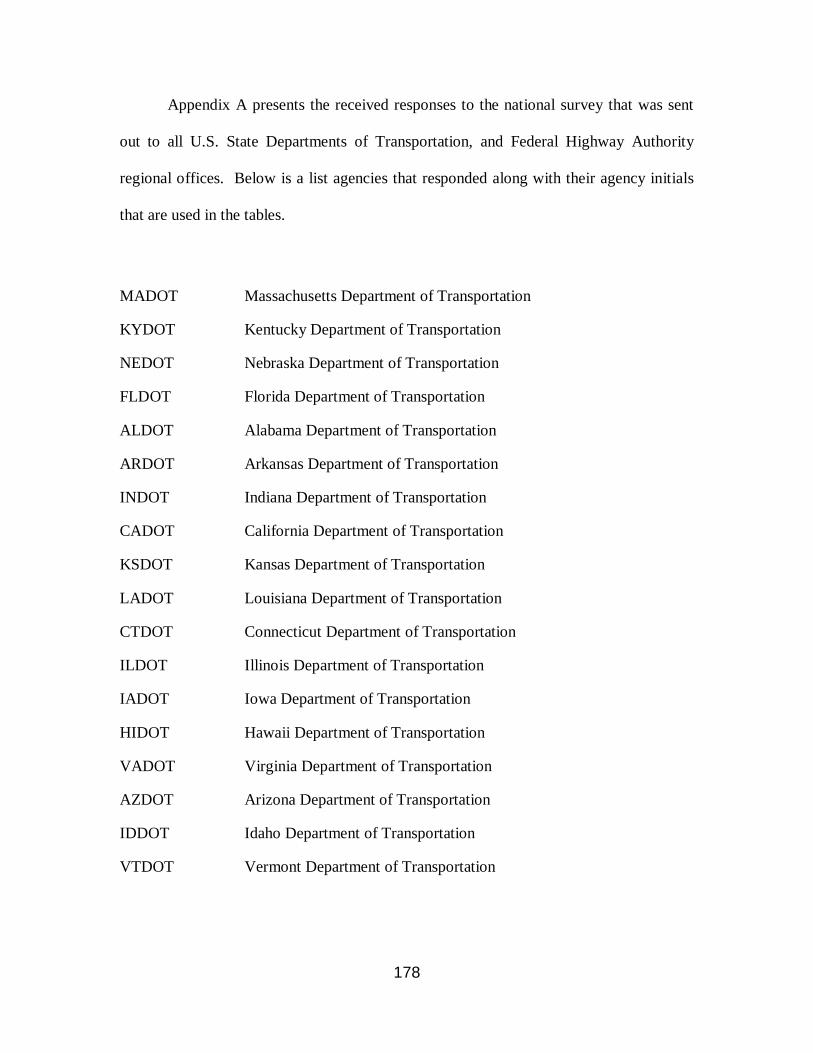
178
Appendix A presents the received responses to the national survey that was sent
out to all U.S. State Departments of Transportation, and Federal Highway Authority
regional offices. Below is a list agencies that responded along with their agency initials
that are used in the tables.
MADOT Massachusetts Department of Transportation
KYDOT Kentucky Department of Transportation
NEDOT Nebraska Department of Transportation
FLDOT Florida Department of Transportation
ALDOT Alabama Department of Transportation
ARDOT Arkansas Department of Transportation
INDOT Indiana Department of Transportation
CADOT California Department of Transportation
KSDOT Kansas Department of Transportation
LADOT Louisiana Department of Transportation
CTDOT Connecticut Department of Transportation
ILDOT Illinois Department of Transportation
IADOT Iowa Department of Transportation
HIDOT Hawaii Department of Transportation
VADOT Virginia Department of Transportation
AZDOT Arizona Department of Transportation
IDDOT Idaho Department of Transportation
VTDOT Vermont Department of Transportation

179
Table A- 1: Survey Responses for Massachusetts, Kentucky, Nebraska, and Florida

180
Table A- 2: Survey Responses for Massachusetts, Kentucky, Nebraska, and Florida
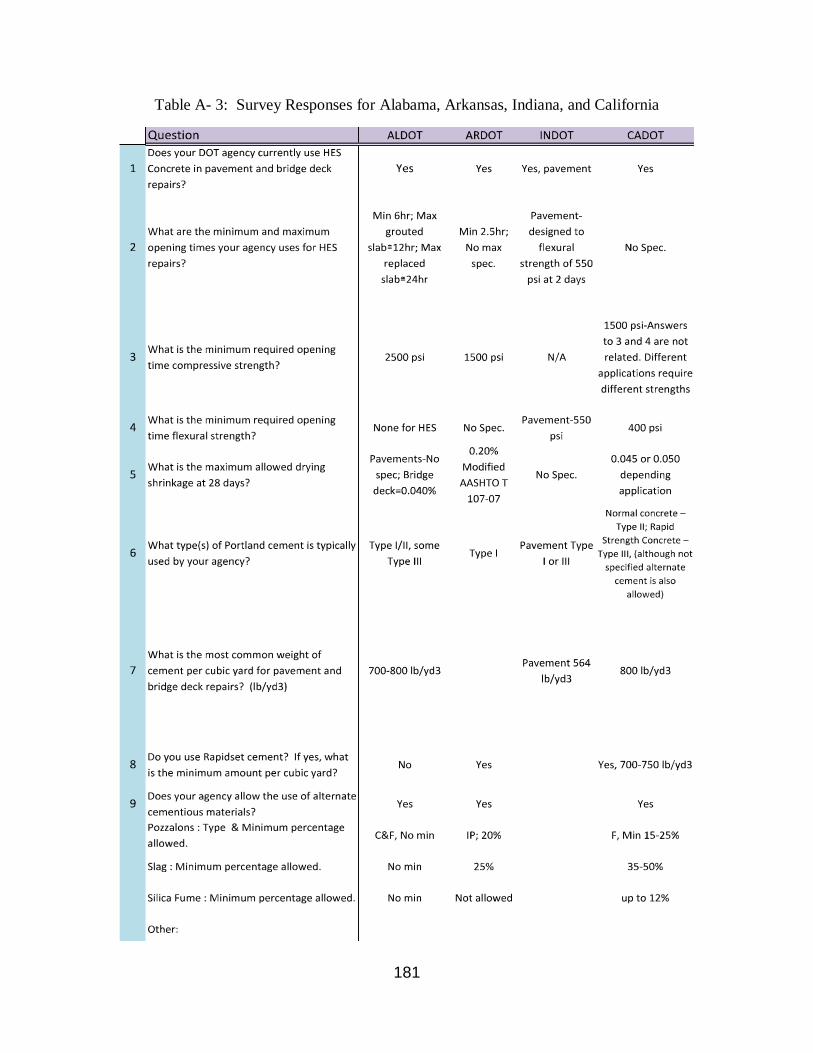
181
Table A- 3: Survey Responses for Alabama, Arkansas, Indiana, and California

182
Table A- 4: Survey Responses for Alabama, Arkansas, Indiana, and California

183
Table A- 5: Survey Responses for Kansas, Louisiana, Connecticut, and Illinois

184
Table A- 6: Survey Responses for Kansas, Louisiana, Connecticut, and Illinois
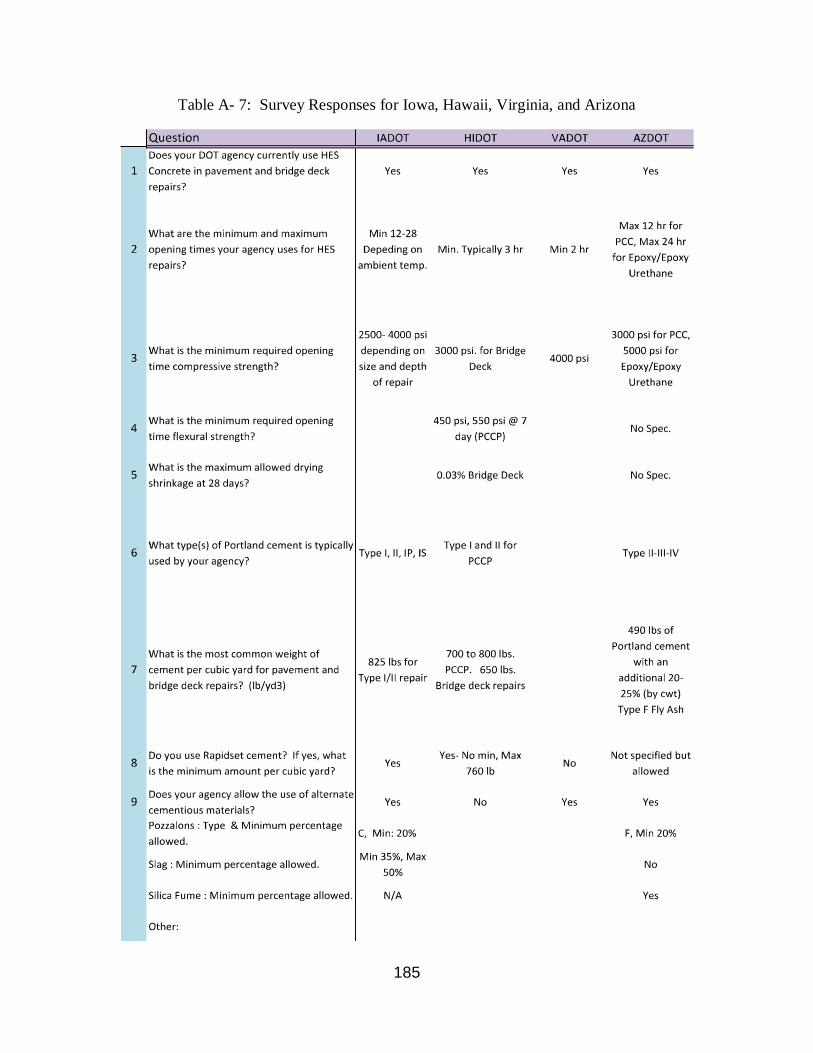
185
Table A- 7: Survey Responses for Iowa, Hawaii, Virginia, and Arizona

186
Table A- 8: Survey Responses for Iowa, Hawaii, Virginia, and Arizona

187
Table A- 9: Survey Responses for Idaho and Vermont

188
Table A- 10: Survey Responses for Idaho and Vermont