solubility behaviour of petroleum oils in water behaviour of petroleum oils in water . by . mark ......
TRANSCRIPT
/:?. C) fl)(
SOLUBILTY BEHAVIOUR OF PETROLEUM OILS IN WATER
by
Mark Bobra Consultchem
P.O. Box 4472, Station E Ottawa, Ontario K1S SGB
Funding for this study was provided by the United States .Minerals Management Service and Emergencies Science Division of Environment Canada.
This report has not undergone detailed technical review by the Environmental Protection Directorate and the content does not necessarily reflect the views and policies of Environment Canada. Mention·· of trade names. or commercial products does not constitute endorsement for use.
This unedited version is undergoing a limited distribution to transfer the information to people working in related studies. This distribution is not intended to signify publication and, if the report is referenced, the author should cite it as an unpublished report of the Directorate indicated below.
Any comments concerning its content should be directed to:
Environment Canada Environmental Protection Directorate River Road Environmental Technology Centre Ottawa K1A OH3
EE-130 May 1992


I
ABSTRACT
The effect of water-to-oil volume ratio on the apparent solubility of oil in water is
examined for six different petroleum oils. It is shown that the water-to-oil ratio used during
the preparation of water . soluble fractions (WSF) has a significant influence on the
concentration and composition of the WSF produced. The general dissolution behaviour that
emerges is that at low water-to-oil ratios, the more soluble compounds present in the oil are
the doininant WSF components and the total WSF concentration is relatively high. As the
water-to-oil ratio increases, the concentration of these compounds and the total WSF
concentration decreases, and the less soluble compounds in the oil constitute a larger
portion of the WSF.
RESUME
L'effet du rapport eau/hydrocarbures (en volume) sur la solubilite
apparente du petrole dans l'eau a ete examine pour six petroles differents. II a ete
constate que le rapport eau/hydrocarbures utilise dans la preparation des fractions
hydrosolubles influe considerablement sur la concentration et la composition de ces
fractions. En general, aux faibles rapports eau/hydrocarbures, les composes plus
solubles du petrole dominent dans !es fractions produites et la concentration totale de
ces fractions est relativement elevee. Quand le rapport augmente, la concentration de
ces composes et la concentration totale des fractions hydrosolubles diminuent, et.Jes.
composes moins solubles du petrole sont plus abondants dans les fractions hydrosolubles.

iii
TABLE OF CONTENTS
ASTRA CT I
RESUME ii
LIST OF FIGURES iv
LIST OF TABLES v
ACKNOWLEDGEMENTS VI
1.0 INTRODUCTION 1
2.0 LITERATURE REVIEW 2
3.0 EXPERIMENTAL SECTION 4 Materials 4 Preparation of Water Soluble Fractions 5 Analyses of Water Soluble Fractions 6
4.0 RESULTS AND DISCUSSION 8
5.0 CONCLUSIONS 21
REFERENCES 22
APPENDIX 26
iv
LIST OF FIGURES
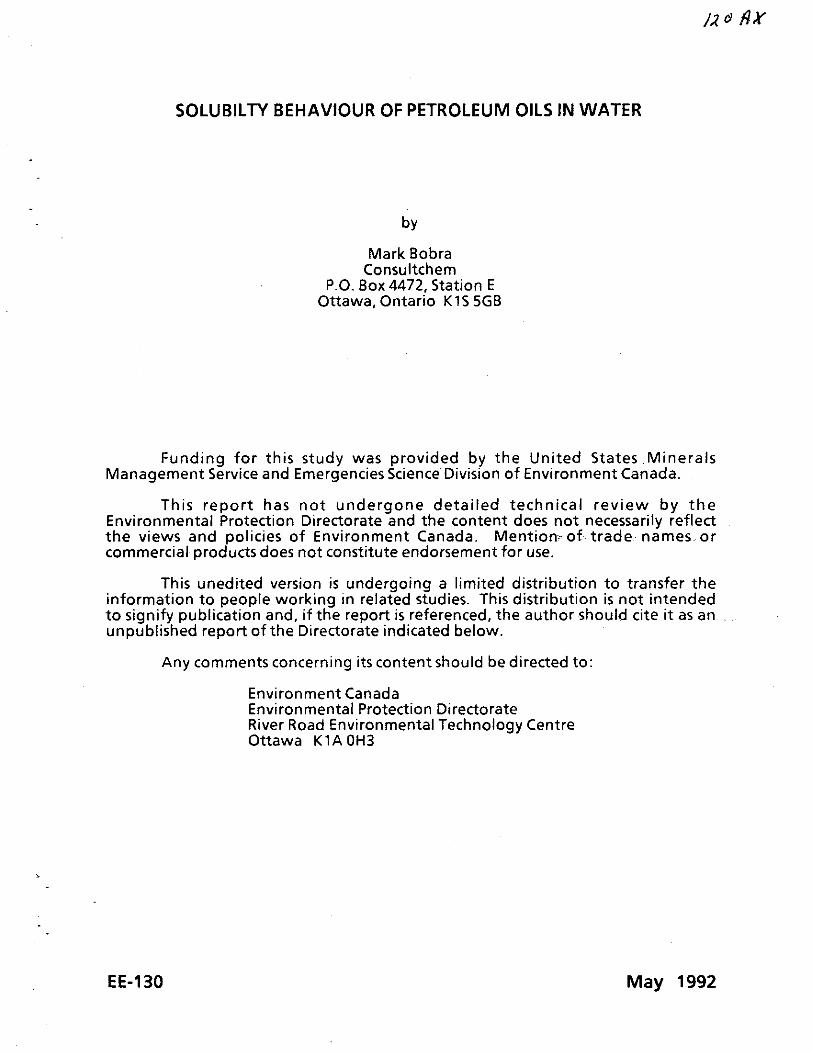
Figure 1: Concentration of Water-Soluble Components versus Water-to-Oil Ratio. Western Sweet Mixed Blend Crude Oil. 9
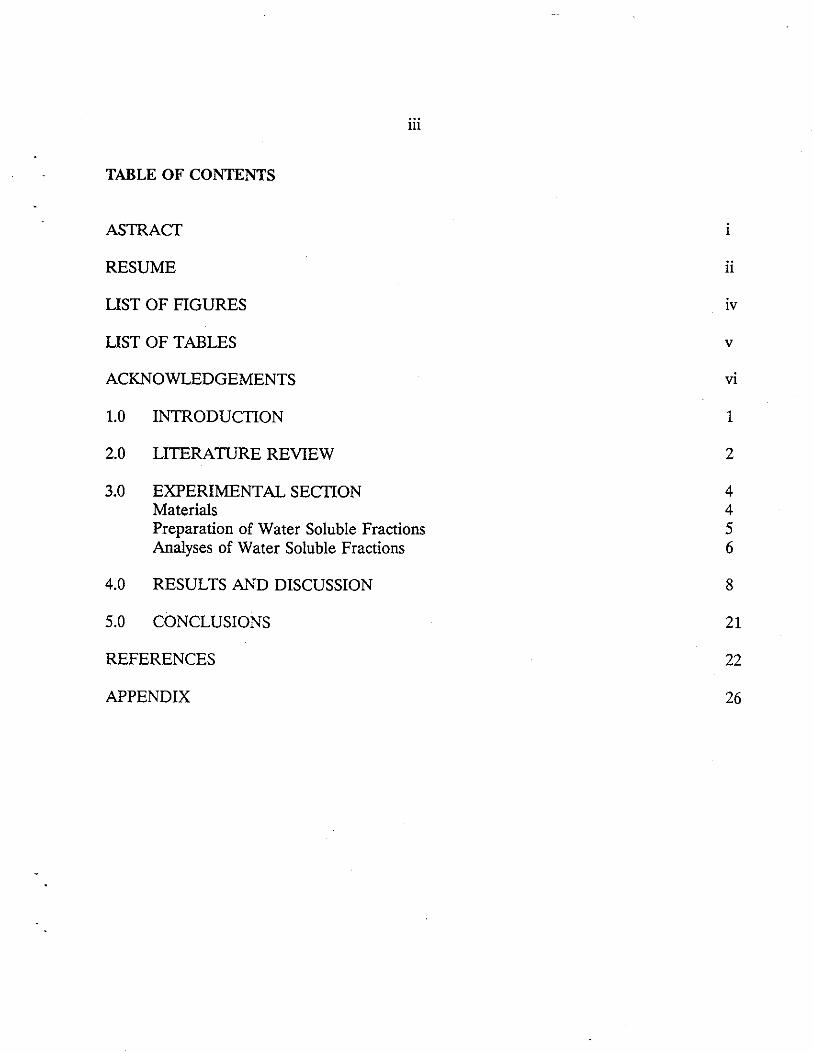
Figure 2: Concentration of Water-Soluble Components versus Water-to-Oil Ratio. South Louisiana Crude Oil. 10
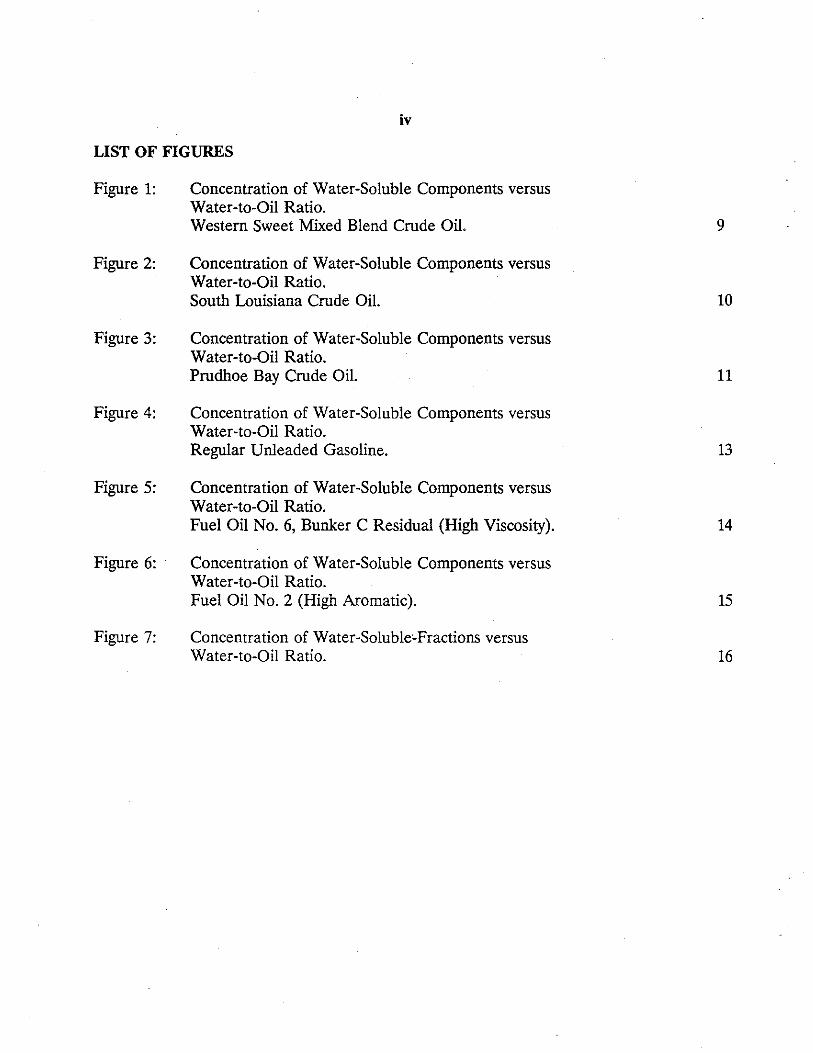
Figure 3: Concentration of Water-Soluble Components versus Water-to-Oil Ratio. Prudhoe Bay Crude Oil. 11
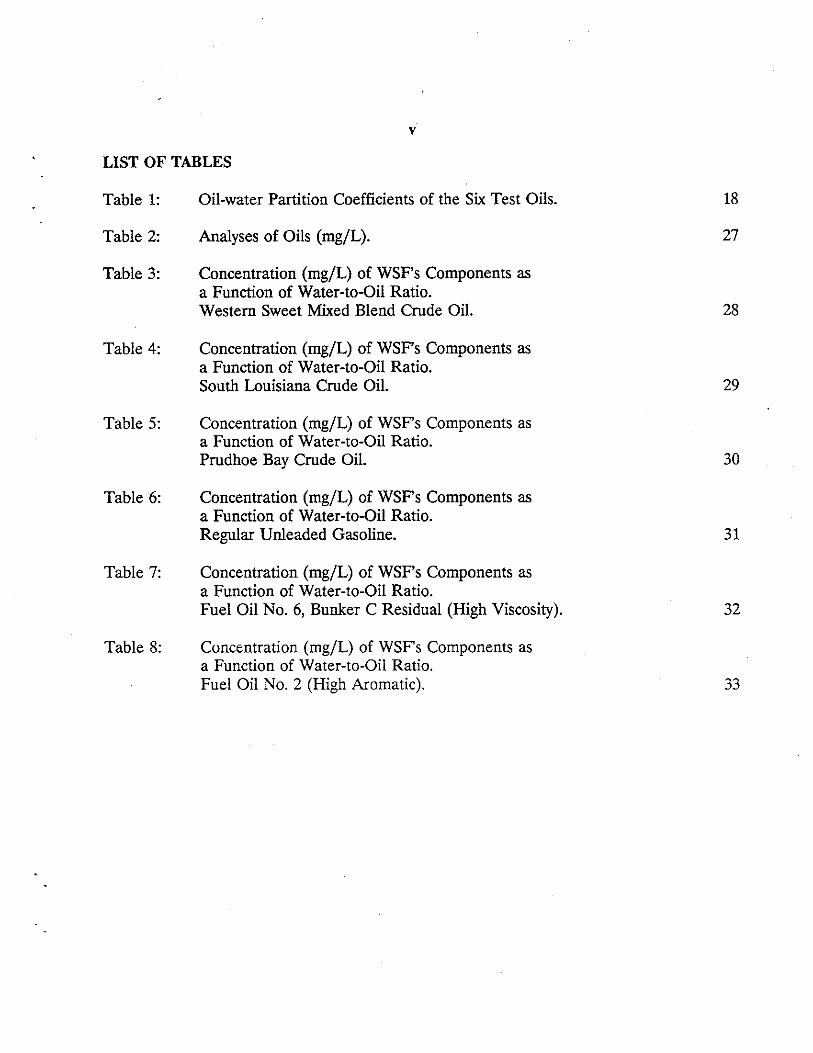
Figure 4: Concentration of Water-Soluble Components versus Water-to-Oil Ratio. Regular Unleaded Gasoline. 13
Figure 5: Concentration of Water-Soluble Components versus Water-to-Oil Ratio. Fuel Oil No. 6, Bunker C Residual (High Viscosity). 14
Figure 6: Concentration of Water-Soluble Components versus Water-to-Oil Ratio. Fuel Oil No. 2 (High Aromatic). 15
Figure 7: Concentration of Water-Soluble~Fractions versus Water-to-Oil Ratio. 16
v
LIST OF TABLES
Table 1: Oil-water Partition Coefficients of the Six Test Oils. 18
Table 2: Analyses of Oils (mg/L}. 27
Table 3: Concentration (mg/L} of WSF's Components as a Function of Water-to-Oil Ratio. Western Sweet Mixed Blend Crude Oil. 28
Table 4: Concentration (mg/L) of WSF's Components as a Function of Water-to-Oil Ratio. South Louisiana Crude Oil. 29
Table 5: Concentration (mg/L} of WSF's Components as a Function of Water-to-Oil Ratio. Prudhoe Bay Crude Oil. 30
Table 6: Concentration (mg/L) of WSF's Components as a Function of Water-to-Oil Ratio. Regular Unleaded Gasoline. 31
Table 7: Concentration (mg/L) of WSF's Components as a Function of Water-to-Oil Ratio. Fuel Oil No. 6, Bunker C Residual (High Viscosity). 32
Table 8: Concentration (mg/L} of WSF's Components as a Function of Water-to-Oil Ratio. Fuel Oil No. 2 (High Aromatic). 33

vi
ACKNOWLEDGEMENTS
This project was funded by the Environmental Emergencies Technology Division of
Environment Canada. Mr. M. Fingas was the Scientific Authority.
1
INTRODUCTION
Dissolution is one of the fundamental mass transfer processes that occurs when oil
is spilled on water. Although the fraction of oil that dissolves into water is relatively small
when compared to the total mass of oil, it is this fraction that intimately contacts aquatic
organisms and thus is an important determinant of oil toxicity.
Oil is a complex mixture of compounds and each compound will partition differently
between the aqueous and oil phases. Components with relatively high aqueous solubilities
will tend to transfer to the water phase while the insoluble components will stay in the oil.
Thus, the composition of the aqueous mixture is usually very different from the original oil.
The term "water soluble fraction" (WSF) is commonly used to describe the aqueous solution
which is formed when oil and water are brought into contact. By definition, a WSF is a
single phase solution comprised of individually dissolved molecules and is free of any
dispersed oil-in-water emulsions or colloidal emulsions. WSF's are commonly prepared in
the laboratory as the exposure media for aquatic toxicity testing. WSF's are the preferred
medium for these tests because dissolved chemicals have the most intimate contact with
marine biota and in comparison to oil-in-water dispersions, WSF's can be prepared with
good reproducibility and are more stable. The composition and concentration of the WSF
depends upon several factors such as the composition of the oil, the properties of the water,
temperature and the method of preparation.
A recent significant finding is that the composition and concentration of WSF's can
be extremely sensitive to the water-to-oil volume ratio used during WSF preparation (Smith
and Harper, 1981; Lockhart et al., 1984; Maijanen et al., 1984). The focus of this study was
to examine how the WSF composition and concentration of various petroleum oils depend
upon the water-to-oil ratio.

2
LITERATURE REVIEW
Comprehensive lists of solubility data for pure hydrocarbon compounds have been
compiled by a number of researchers Whitehouse (1984, 1985), Brookman, Flanagan and
Kebe (1985), Price (1976), and McAuliffe (1966). A thorough review of the factors affecting
the. solubility of single compounds is presented by Brookman, Flanagan and Kebe (1985).
Billington et al. ( 1988) examine the kinetics of dissolution and current laboratory techniques
employed for determining solubility.
It has been established that aromatic hydrocarbon compounds are far more soluble
than alkanes of the same carbon number (molecular weight). Cycloalkanes tend to be
slightly more soluble than normal alkanes. As the carbon number increases within a
homologous series of compounds, there is a marked decrease in solubility. Dissolved
electrolytes are known to "salt out" hydrocarbon solutes, therefore, solubility values in sea
water are lower than in distilled water.
Studies on the solubility behaviour of simple, solid hydrocarbon mixtures showed that
the equilibrium concentration of each solute component was generally equal to the
concentration of the pure compound's solubility (Eganhouse and Calder, 1976; Banerjee,
1984). Liquid hydrocarbon mixtures however, have very different thermodynamic behaviour
than solid hydrocarbon mixtures.
The solubility behaviour of simple, liquid hydrocarbon mixtures have been studied
by a number of researchers (Burris, 1985; Burris and Macintyre, 1985, 1986a, 1986b;
Leinonen, 1972; Leinonen and Mackay, 1973; Leinonen, Mackay and Phillips, 1971; Mackay
and Shiu, 1975). At equilibrium the aqueous concentration of any component of the mixture
(Cw) is related to its pure compound solubility (C.w), the mole fraction of the component
in the hydrocarbon mixture (xH), and its activity coefficient in the hydrocarbon phase ( y H):
Cw= XH c·w Ytt

3
Ideal solubility behaviour occurs when Yi(hl is unity. Component interactions within the
organic phase result in deviations from ideality. Mixtures of structurally similar compounds
such as mixtures containing only aromatics or only alkanes, exhibit near ideal solution
behaviour. Mixtures containing compounds that are different in structure such as mixtures
containing both aromatics and alkanes together, deviate from ideality. The deviation can be
either positive or negative, and for binary mixtures, it can be as great as a factor of 2.5
(Burris, 1985).
Different aspects of the dissolution behaviour of complex multi-component
hydrocarbon mixtures, such as crude and refined petroleum oils, have been studied by
various researchers (Bobra, Mackay and Shiu, 1979; Boehm and Quinn, 1973; Burris and
Macintyre, 1986; Coleman et al., 1984; Hamam et al., 1987; Lu and Polak, 1976; Mackay,
Bobra and Shiu, 1980; Mackay and Shiu, 1976; Mackay et al., 1985; Maijanen et al., 1984;
McAuliffe, 1987; Milhailova, 1986; Murray, Lockhart and Webster, 1984; Payne et al., 1987;
Price, 1976; Shiu et al., 1988; Smith and Harper, 1981; Winters and Parker, 1977). It has
been shown that the composition and concentration of the WSF depends upon several
factors including the composition of the oil, the properties of the water, temperature and
the method of preparation. The preparation and use of petroleum WSF's for bioassay
purposes has been discussed by Andersen et al., (1987), Benville et al. (1981), Lockhart et
al. (1984), Maher (1982); Ostgard and Jensen (1983); Vandermeulen, Foda and Stuttard
(1985). A recent finding of importance is that the composition and concentration of WSF's
are a function of the water-to-oil volume ratio used during preparation (Lockhart et al.,
1984; Maijanen et al., 1984; Smith and Harper, 1981).

4
EXPERIMENTAL SECTION
Materials
The following six oils were used in this study:
Prudhoe Bay Crude Oil - API/EPA standard reference oil; South Louisiana Crude Oil - API/EPA standard reference oil; Fuel Oil No.2 (high aromatic) - API/EPA standard reference oil; Fuel Oil No.6, Bunker C (high viscosity) - API/EPA standard reference oil; Western Sweet Blend Crude Oil - EPS standard oil for dispersant testing; Regular Unleaded Gasoline - purchased in Halifax, Nova Scotia.
The water used was distilled in glass, filtered and degassed prior to use. The water
conforms to ASTM D1193 Type II reagent grade water specifications. The vessels used to
prepare the WSFs were 60 mL amber glass Hypo-vials (Pierce catalogue number: 12970)
which were crimp sealed with teflon/silicone septa (Pierce catalogue number: 12720). Prior
to use, all glassware was soaked in dichromate-sulfric acid for 6 hours, then well rinsed with
distilled water, and dried in a 300°C oven for at least 12 hours. All syringes used were
Hamilton Series 1000 Gastight Syringes. A New Brunswick Scientific Company Model G-27
Psychrotherm was used for equilibration. All chemicals used as standards and for calibration
were frqm Aldrich Chemical Company and were 99 + % pure.

5
Preparation of Water Soluble Fractions
WSFs were prepared at 25°C using water-to-oil volume ratios from 5:1 to 10,000:1.
Oil was slowly injected through a 10 cm long, 20 gauge or smaller needle into an inverted,
sealed Hypo-vial which was completely filled with water. Water displaced by the injected oil
flowed out through a second (0.64 cm long, 26 gauge) needle. After injection, the needles
were withdrawn and the vial was inspected for the presence of air bubbles. If bubbles were
detected, the vial was not used. Vials were continuously maintained in the inverted position
after the oil was injected. Vials were placed on a gyratory shaker table within a
psychrotherm and mixed at 30 RPM. This speed does not supply sufficient mixing energy
to cause a major deformation of the oil/water interphase. The oil/water system was allowed
to equilibrate for at least 20 days. A minimum of two samples were prepared at each of the
water-to-oil ratios.
This method of preparing WSFs resulted in solutions of excellent reproducibility
(standard deviations of < 3%) and avoided two common difficulties encountered during
WSF preparation: (i) loss of compounds by volatilization and (ii) formation of oil-in-water
emulsions.

6
Analyses of Water Soluble Fractions
Water samples were withdrawn from the vials using a syringe equipped with a 3.8 cm
long, 18 gauge needle and a Mininert valve. An 8.9 cm long, 17 gauge needle was also fully
inserted into the vial in order that when water was withdrawn, air could enter through this
needle without disturbing the oil/water interface. The syringe was rinsed out with 2 portions -
of the sample and then completely filled by slowly withdrawing the plunger in order to avoid
creating a vacuum headspace within the syringe barrel. Samples were then immmediately
analysed.
Aqueous samples were analysed by a purge-and-trap/GC technique, using a Tekmar
Model 4000 Dynamic Headspace Concentrator coupled to a cyrofocusing Tekmar Model
1000 Capillary Interphase and a temperature programmed Hewlett-Packard Model 5890 Gas
Chromatograph equipped with a flame-ionization-detector and a SPB-1 fused silica capillary
column (0.53 mm ID X 30 m long). Calibration and compound identification were
performed using aqueous solutions saturated with pure, single hydrocarbons.
The purge vessel was thoroughly cleaned and baked between samples. Water blanks
were analyzed between each sample run. Calibration standards were run daily. A minimum
of 3 analyses were performed for each WSF ratio.

7
Purge conditions:
Purge: 40 mL/min for 11 minutes Dry Purge: 40 mL/min for 3 minutes Trap: Tenax Desorb: 180°C for 4 minutes Bake: 225°C for 10-20 minutes
Chromatographic conditions:
Carrier gas: helium Column: Supelco Fused Silica Capillary
SPB-1 bonded phase 30m X 0.53 mm ID 1.5 µm film thickness
Temperature programming: 40°C for 10 minutes 5°C/min to 200°C 2000C for 10 minutes
Detector temperature: 350°C

8
RESULTS AND DISCUSSION
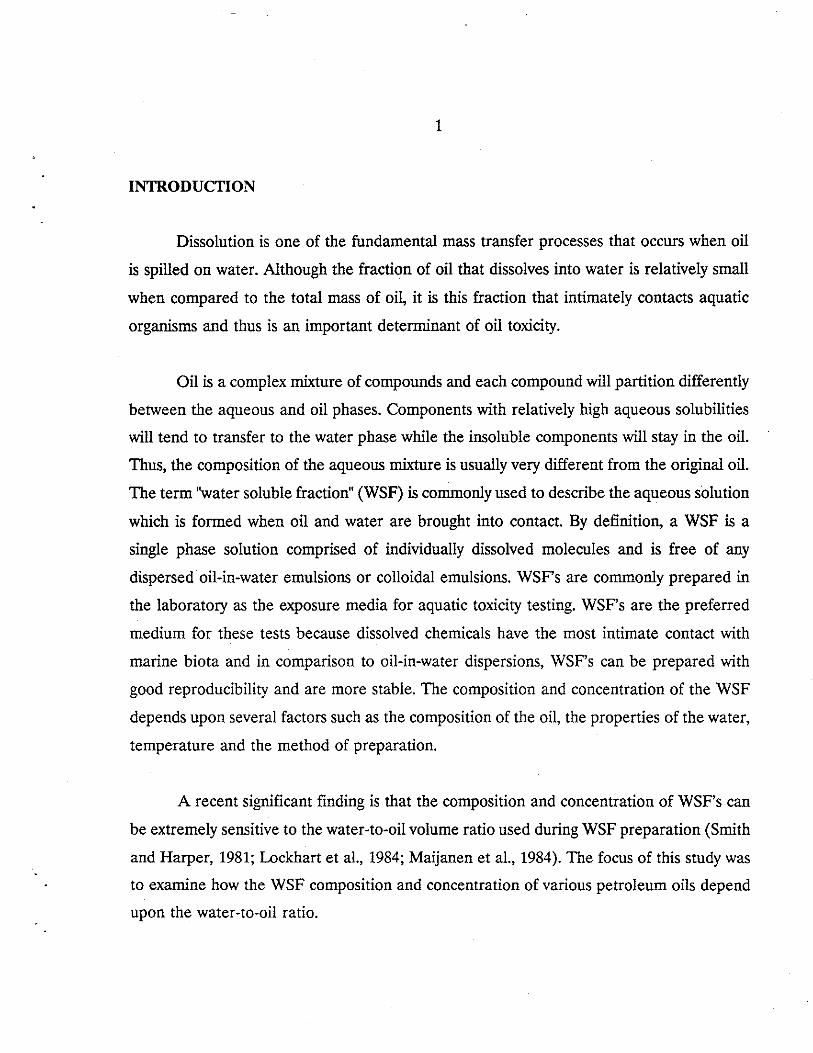
Figures 1 to 6 show the change in WSF concentration as a function of water-to-oil
ratio for the six test oils. Each figure shows the total WSF concentration and the
concentrations of major WSF components. Numerical tables are provided in the appendix.
Figures 1, 2 and 3 show the concentration curves for WSF's produced by the crude
oils, Western Sweet Blend, South Louisiana and Prudhoe Bay. The general dependence of
the WSF's on the water-to-oil ratio are very similar for the three crudes with only minor
differences in the relative abundance of some compounds. As the figures illustrate, the
concentration of the WSF decreases as the water-to-oil ratio increases and, more
importantly, the composition of the WSF changes as the ratio changes. At low water-to-oil
ratios, the WSFs are mainly comprised of benzene, toluene, ethylbenzene and xylenes. At
a water-to-oil ratio of 5, these components account for about 80% of the total WSF. As the
water-to-oil ratio increases, these compounds become less important and account for a
smaller proportion of the dissolved compounds. At a water-to-oil ratio of 10,000, these
compounds account for only 15 to 30% of the total WSF. There is thus a change in the
dominant characteristic hydrocarbons found in the solubilized fraction. At low water-to-oil
ratios ( < 100), benzene is the predominant hydrocarbon species in the WSF but at higher
ratios (100 to 1000) toluene becomes the predominant component. As the ratio is increased
further (e.g. up to 10,000), no single compound accounts for a significant portion of the total
but instead the WSF is composed of many compounds, each accounting for only a small
fraction of the WSF's composition. The concentration of less soluble compounds, such as
highly alkylated benzenes and naphthalenes, is far less dependent upon the water-to-oil ratio
than the more soluble compounds. Their concentration remained relatively constant over
the range of water-to-oil ratios tested while the concentration of the more soluble
compounds showed a dramatic decrease as the ratio increased.

36
•34+ 0 Pentane & Lighter I
32+ !:!. Benzene• D Toluene
so+ "'1 Ethyl benzene & Xylenes
20+ • x C3 benzenes <> Naphthalene
26+ • Total 24+ •
c 22 0 ·ri
•..., 20 I ...,,~ :J "tc Ol QJ E 16 -r "' o-c
1411:!.8 !:!. • T!:!.12
t!:!. • 10+ D D D De-r
•~ s+ D
•'1 '1 'V '1 D 4+ '1 'V* !:!. [Sil0 2+ 9 9 x 9 9 9 S{ ~ 0 <> <> <> <> <> <> <> <> ~ ~ @
10 100 1000 10000
Water-to-Oil Volume Ratio (log scale)
Figure 1: Concentration of Water-Soluble Components versus Water-to-Oil Ratio ' '
vies tern sweet Mixed Blend Crude Oil
40,-- -I ----- I
• ' '
• +
I
I 36 0 Pentane & Lighter I"i .
• 6 Benzene D Toluene
34 t..,.. 321 'V Ethyl benzene & Xylenes I
.J...' 30-r- x C3 benzenes <> Naphthalene I
2BT • TTotal
26f T§ 24 • t .... 22T • Tra ~ (. ...J 20 .µ ...... c Cl QJ E 1B u~
c 16 0 u 14
• T I
6. 6 T ;- 0
6 6 • • T I
TD D D:~ D T
• T
D tsT ~
6 D'V 'V 'V
4t 'V 'V 'V 0 * !YI •0 0 0 0 0 f2+ 0
o ¢ ~ ¢ ~ ¢ ¢ ~ ~ ~ @ ~ ----!------------------ f
10 100 1000 10000
Water-to-Oil Volume Ratio (log scale)
Figure 2: Concentration of Water-Soluble Components versus Water-to-Oil Ratio South Louisiana Crude Oil

Figure 3: Concentration of Water-Soluble Components versus Water-to-Oil Ratio Prudhoe Bay Crude Oil.
40l • -36
36-t
34+
• •
0 !::,.
0
Pentane Benzene Toluene
& Lighter
32+ 'V Ethyl benzene & Xylenes
30+
26r
• •
x 0
• C3 benzenes Naphthalene Total
-+
26
c 0 24
•rl .µ 22 ro ~ (.. _J .µ'c Cl Ql E u~
c
20
16
16
!::,. !::,. •
± ...... .....
0 u
14 !::,.
• 12
10+ 0 D 0
!::,.
0 ~ • •
6+
e+
4-j
2-t
o-t
'V
g 'V
g 10
'V
g 'V
g 'V
g -f--
100
0
x:x
8 0
~ ~ ~
~ ~ +
1000
•
~
• @
I
+_J 10000
Water-to-Oil Ratio (log scale)

12
Figure 4 shows the composition and concentration of WSFs prepared from gasoline.
The general form of the curves are similar to those of the crude oils except the
concentrations of the volatile aromatics are significantly higher and the less volatile
materials (above naphthalene) are absent.
Figure 5 shows the dissolution behaviour of Bunker C Fuel Oil. The WSF's of Bunker
Clack the presence of volatile aromatics which were predominant in the WSFs of the crude
oils and gasoline. These WSF's contain a larger number of compounds and a large
proportion of less-soluble, non-volatile compounds.
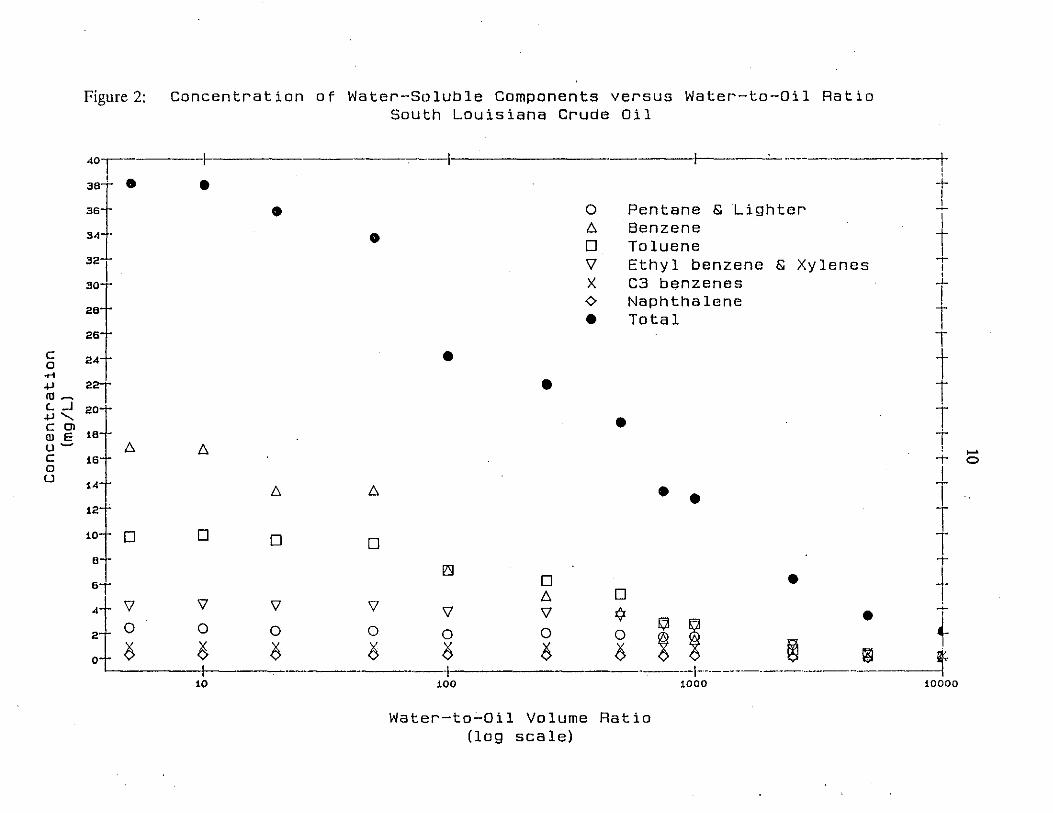
The solubility behaviour of Fuel Oil No.2 presented in Figure 6 shows that the total
concentration changes dramatically as the water-to-oil ratio is increased, especially at ratios
less than 100. This dependence is primarily due to the large concentration of pentane and
lighter compounds present in the WSF at these low water-to-off ratios. The WSF's of the
fuel oil contain significantly more compounds than those of the crude oils or those of
gasoline, and they have a relatively high proportion of non-volatile compounds.
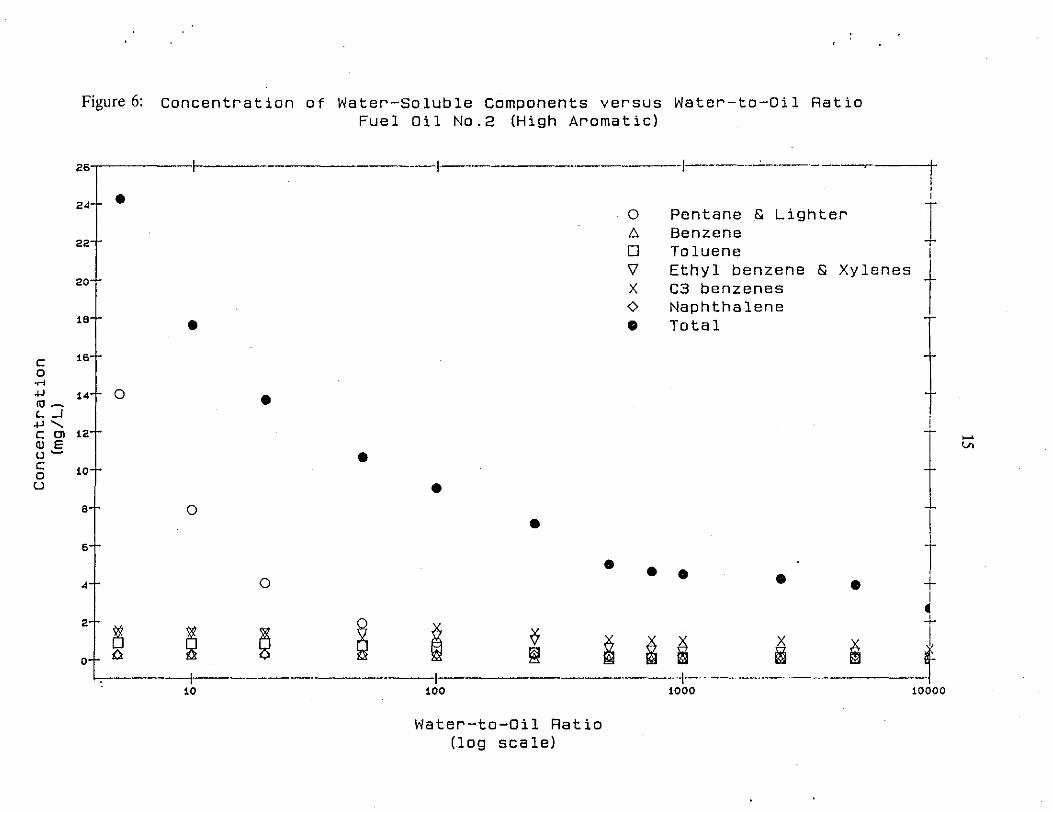
Total WSF concentration as a function of water-to-oil ratio for the six oils tested are
presented in Figure 7.
The results show that the water-to-oil volume ratio used during oil and water
equilibration can significantly influence the concentration and composition of the WSF
produced. The general dissolution behaviour is that at low water-to-oil ratios, the more
soluble compounds present in the oil are the predominant WSF components and the total
WSF concentration is relatively high. As the water-to-oil ratio increases, the concentration
of these compounds and the total WSF concentration decreases, and the less soluble
compounds make up a larger portion of the WSF. Maijanen et al. (1984) described this
behaviour as a "depletion effect"; the oil becomes depleted of water soluble material as the
water-to-oil ratio is increased thus causing the apparent "solubility" to fall.

260 I I
0 Pentane & Lighter2AOT 8 • • • lti Benzene D Toluene
220-t'V Ethyl benzene & Xylenes
• x C3 benzenes 200-t
<> Naphthalene Total
1eoT •
•160 c a ·rl .µ 1AO m~
(.. ..J ~ .µ" • ..... c Ol 120 + VJ ID E u-
• •c ti tia 1001 tiu ti D
BO D D D ~
D
•so+ D
ti D •AOT D
20+ 'V 'V 'V 'V 'V v v 6
x lZ0 0 0 0 0 0 0 0 0
\:/ @o-r 0 0 0 0 0 0 0 0 0 ~
I 10 100 1000 10000
Water-to-Oil Volume Ratio (log scale)
Figure 4: Concentration of Water-Soluble Components versus Water-to-Oil Ratio Regular Unleaded Gasoline

1.1 t--- I 0 Pentane & Lighter
1.0-t- • +6. Benzene D Toluene I
' ..(..0. 9-j- • •
I/ Ethyl benzene & Xylenes ' x C3 benzenes I !
• I I
I• 0 Naphthaleneo.a-r ~
Total
0.71 • t I
Ic •0 I ·rl ..L0.6 .µ ro ~ c.. _J .µ'-. c Ol ,.... QJ E
•u~
• ""'" c
0.4''f • I 0 (J
+ I
0.3-j
• I 0.2;
~ 13 ~ g i lit"
0.1-r 6. ~ 6. /:; D v ~ • +
8 ~,,e__: 8 e 8 ~ ~ ~ ~ !i _J
t
• !-·-····---.
10 100 1000 10000
Water-to Oil Ratio (log sea le)
Figure 5: Concentration of Water-Soluble Components versus Water-to-Oil Ratio Fuel Oil No. 6, Bunker c Residual (High Viscosity)
-/----·--'----·--~26 f- I
I' 24+ •
0 Pentane & Lighter ' /:; Benzene I
22-r D Toluene ' I \l Ethyl benzene & Xylenes
20-t x C3 benzenes 0 Naphthalene
• • t
18T Total
16 c 0 ·rl...,
14 co '- _J...,, c Cl 12 Ql E u~
c 100 u
0 • i
......
• 1 Vl
• a+ 0
• I 6+
4+ 0 • • • • • '
T I
j•'
2+ ~ § § ~ io+ (). ~ v i ~ a ~
x i ·----+-··· --·- -·-· ·--··
10 100 1000 10000
Water-to-Oil Ratio (log scale)
Figure 6: Concentration of Water-Soluble Components versus Water-to-Oil Ratio Fuel Oil No.2 (High Aromatic)
280-r-~~~~~-+~~~~~~~~~~~~~~~-i-~~~~~~~~~~~~~~~-t-~~~~~~~~~~~~~~~-t-
••••t:,..... Bunker c Fue 1 Oil2~0-r ~ e ~ -J:l- Fuel Oil No. 2 ~ Regular Unleaded Gasoline
220 ~' ....0 ... Prudhoe Bay crude Oil ---x---- south Lou is iana Crude Oil
200 --a-- Western Sweet Blend Crude Oil
180
180c: 0 -rl .µRI~ 1~0 (. ..J+''c: ClGI E 120 u .....c: 0 °' 100(.)
BO '~ 80
~o
.. ----~ -~----"'=---......_ "--· ""6 H --••"-- "8-----• "•ff·~···~·---..~--- ..~~ .....,.,,,,.,,c.,_ U20
or-=- - __ - - ...··~:". ·&·.......:·~....". ::::Z;:c···:·~t'.C~.c,, ...~:..."---------_,,___ -------- ··········· A ....... --- 'It-- ......e,, ...•• ·~ ........ ",o;A.•••"•••••••' •,o;A.•••••••••:~ ........0
10 100 1000 10000
Water-to-Oil Volume Ratio (log sea le)
Figure 7: Concentration of Water-Soluble-Fractions versus Water-to-Oil Ratio

17
Calculated oil-water partition coefficients for selected hydrocarbons are presented
in Table 1. The form of the equation fitted to the experimental data was that proposed by
Shiu et al (1988). This theoretical equation based upon a simplified mass balance predicts
that the concentration of any individual component in the water phase will be:
Cw = Cw0/(1 + (Q/K))
where: K is the oil-water partition coefficient Q is the water-to-oil volume ratio Cwo is the concentration of the component in the water phase at Q = 0.
Cwo was determined by extrapolating the concentration to a water-to-oil ratio of 0. All fitted
equations gave correlation coefficient values of at least 0.985.
The oil-water partition coefficients presented in Table 1 provide a numerical
indication of the sensitivity of water soluble components to the water-to-oil ratio. From the \
equation Cw = Cwo / (1 + (Q/K)), it can be seen that when the water-to-oil ratio (Q) equals
the partition coefficient (K), the concentration of that component will be half of the value
of Cwo· Therefore, components with low partition coefficients are most sensitive to the
water-to-oil ratio. The calculated values in Table 1 also show that partition coefficients are
extremely dependent upon the oil matrix. How an individual compound partitions itself
between the oil and water phases will depend upon its concentration in the oil and its
interactions with other solutes in both the oil and water phases.

Table 1 Oil-Water Partition Coefficients of Test Oils
Component \.lestern Sweet Blend crude
South Louisiana crude
Prudhoe Bay crude
Gasoline Fuel Oil no. 6
Fuel Oil no. 2
pentane &lighter 1883 1556 1043 2420 40 11 benzene 121 106 75 228 72 80 toluene 386 382 249 934 207 161 ethylbenzene &xylenes 1105 1248 895 4758 568 524 naphthalene 2126 1975 1947 5986 1178 2319 methyl naphthalenes - - - - 3930 5160 dimethyl naphthalenes - - - - n16 42351
-00
19
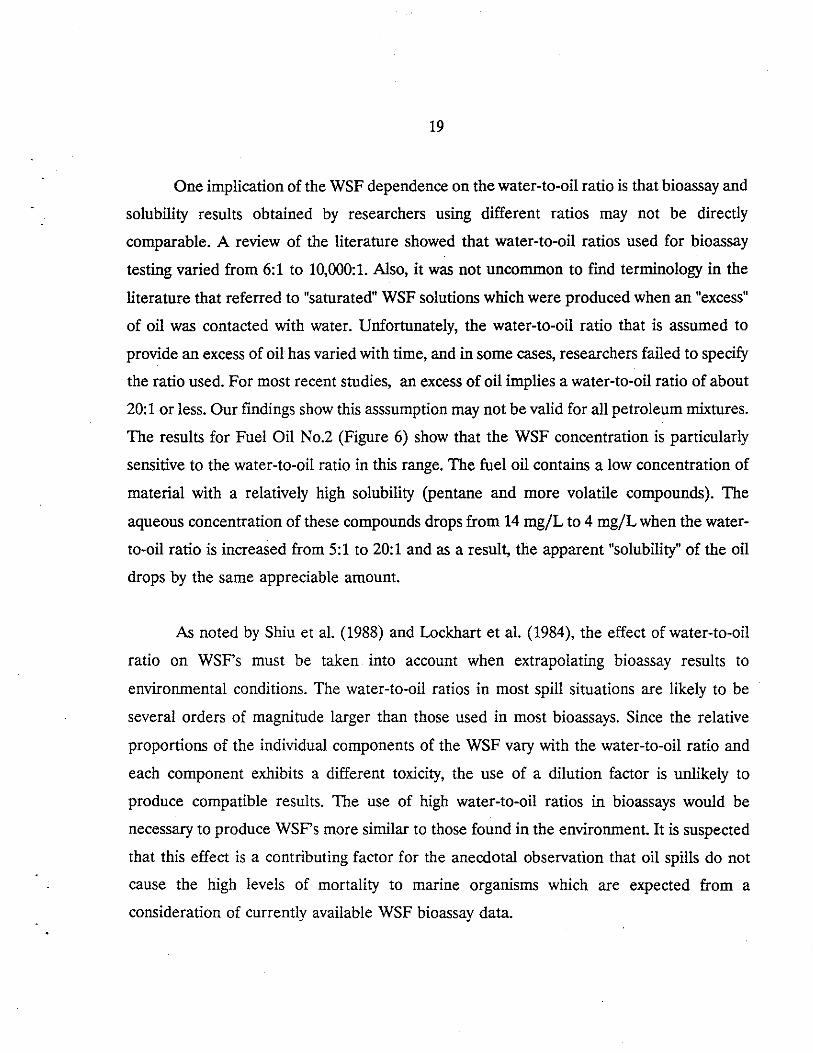
One implication of the WSF dependence on the water-to-oil ratio is that bioassay and
solubility results obtained by researchers using different ratios may not be directly
comparable. A review of the literature showed that water-to-oil ratios used for bioassay
testing varied from 6:1 to 10,000:1. Also, it was not uncommon to find terminology in the
literature that referred to "saturated" WSF solutions which were produced when an "excess"
of oil was contacted with water. Unfortunately, the water-to-oil ratio that is assumed to
provide an excess of oil has varied with time, and in some cases, researchers failed to specify
the ratio used. For most recent studies, an excess of oil implies a water-to-oil ratio of about
20:1 or less. Our findings show this asssumption may not be valid for all petroleum mixtures.
The results for Fuel Oil No.2 (Figure 6) show that the WSF concentration is particularly
sensitive to the water-to-oil ratio in this range. The fuel oil contains a low concentration of
material with a relatively high solubility (pentane and more volatile compounds). The
aqueous concentration of these compounds drops from 14 mg/L to 4 mg/L when the water
to-oil ratio is increased from 5:1 to 20:1 and as a result, the apparent "solubility" of the oil
drops by the same appreciable amount.
As noted by Shiu et al. (1988) and Lockhart et al. (1984), the effect of water-to-oil
ratio on WSFs must be taken into account when extrapolating bioassay results to
environmental conditions. The water-to-oil ratios in most spill situations are likely to be
several orders of magnitude larger than those used in most bioassays. Since the relative
proportions of the individual components of the WSF vary with the water-to-oil ratio and
each component exhibits a different toxicity, the use of a dilution factor is unlikely to
produce compatible results. The use of high water-to-oil ratios in bioassays would be
necessary to produce WSFs more similar to those found in the environment. It is suspected
that this effect is a contributing factor for the anecdotal observation that oil spills do not
cause the high levels of mortality to marine organisms which are expected from a
consideration of currently available WSF bioassay data.
20
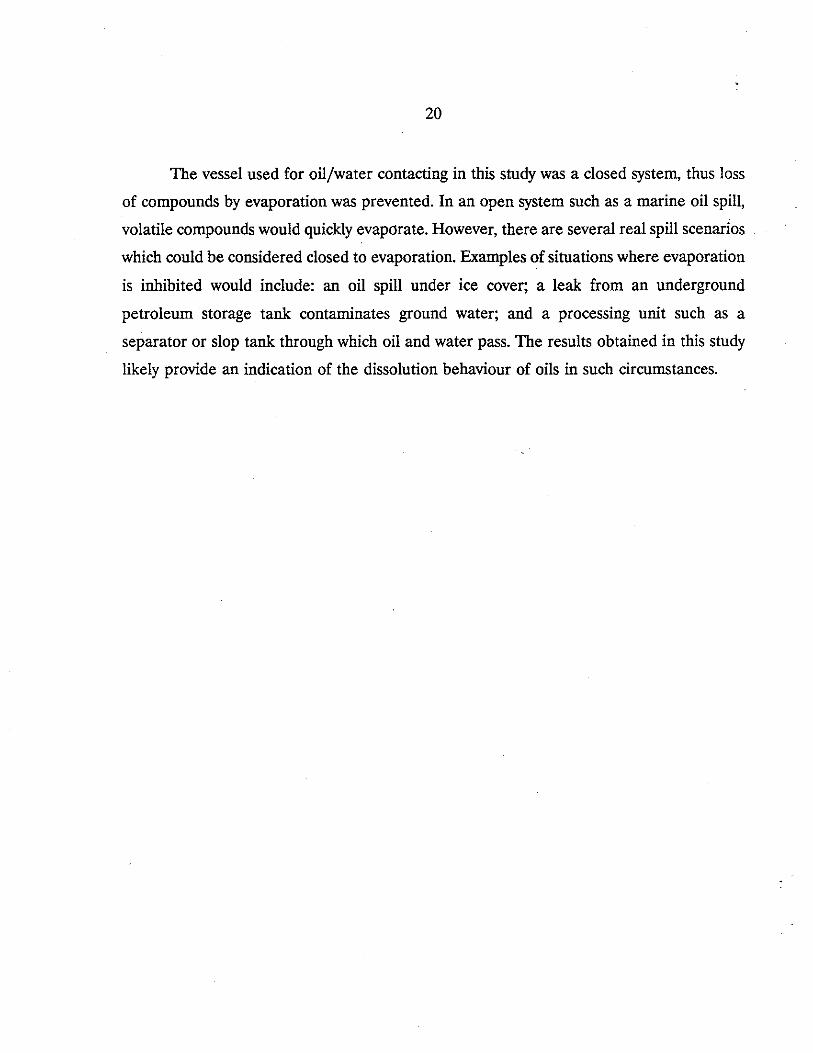
The vessel used for oil/water contacting in this study was a closed system, thus loss
of compounds by evaporation was prevented. In an open system such as a marine oil spill,
volatile compounds would quickly evaporate. However, there are several real spill scenarios
which could be considered closed to evaporation. Examples of situations where evaporation
is inhibited would include: an oil spill under ice cover; a leak from an underground
petroleum storage tank contaminates ground water; and a processing unit such as a
separator or slop tank through which oil and water pass. The results obtained in this study
likely provide an indication of the dissolution behaviour of oils in such circumstances.
21
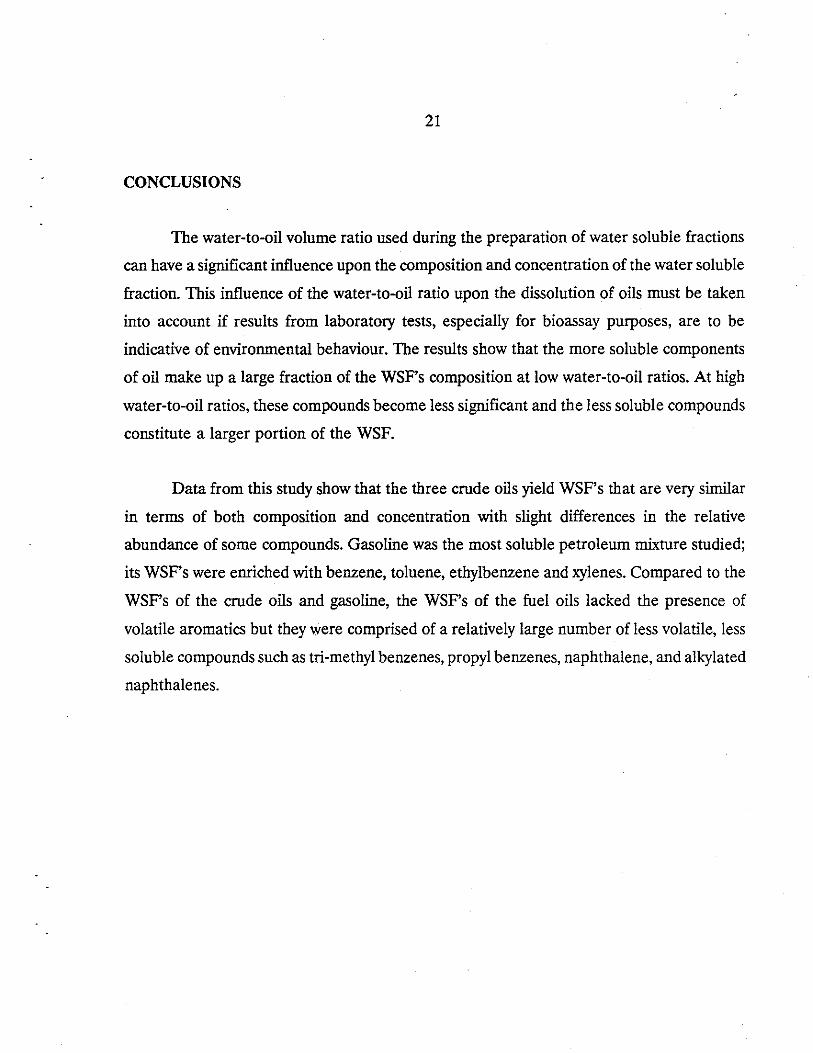
CONCLUSIONS
The water-to-oil volume ratio used during the preparation of water soluble fractions
can have a significant influence upon the composition and concentration of the water soluble
fraction. This influence of the water-to-oil ratio upon the dissolution of oils must be taken
into account if results from laboratory tests, especially for bioassay purposes, are to be
indicative of environmental behaviour. The results show that the more soluble components
of oil make up a large fraction of the WSFs composition at low water-to-oil ratios. At high
water-to-oil ratios, these compounds become less significant and the less soluble compounds
constitute a larger portion of the WSF.
Data from this study show that the three crude oils yield WSFs that are very similar
in terms of both composition and concentration with slight differences in the relative
abundance of some compounds. Gasoline was the most soluble petroleum mixture studied;
its WSFs were enriched with benzene, toluene, ethylbenzene and xylenes. Compared to the
WSF's of the crude oils and gasoline, the WSF's of the fuel oils lacked the presence of
volatile aromatics but they were comprised of a relatively large number of less volatile, less
soluble compounds such as tri-methyl benzenes, propyl benzenes, naphthalene, and alkylated
naphthalenes.

22
REFERENCES
Anderson, J.W., Riley, R., Kiesser, S., and Gurtisen, J., 'Toxicity of Dispersed and Undispersed Prudhoe Bay Crude Oil Fractions to Shrimp and Fish", proceedings 1987 Oil Spill Conference, pp. 235-240, 1987.
Banerjee, S., "Solubility of Organic Mixtures in Water", Environ. Sci. Technol., vol.18, no.8, pp.587-591, 1984.
Benville, P.E, Yocom, T.G., Nunes, P., and O'Neil, J.M., "Simple Continuous-Flow Systems for Dissolving the Water-soluble Components of Crude Oil into Sea-water for Acute or Chronic Exposure of Marine Organisms", Water Res., vol.15, pp.1197-1204, 1981.
Billington, J.W., Huang, G., Szeto, F., Shiu, W.Y., and Mackay, D., "Preparation of aqueous Solutions of Sparingly Soluble Organic Substances: I. Single Component Systems", Environ. Tox. and Chem., vol.7, pp.117-124, 1988.
Bobra, A, Mackay, D., and Shiu, W.Y., "Distribution of Hydrocarbons Among Oil, Water, and Vapor Phases During Oil Dispersant Toxicity Testing", Bull. Environm. Contam. Toxicol., vol.23, pp.558-565, 1979.
Boehm, P.D. and Quinn, J.G., "Solubilization of Hydrocarbons by the Dissolved Organic Matter in Sea Water", Geochimica et Cosmochimica Acta, vol.37, pp.2459-2477, 1973.
Brookman, G.T., Flanagan, M., and Kebe, J.O., "Literature Survey: Hydrocarbon Solubilities and Attenuation Mechanisms", report prepared for the American Petroleu:n Institute, August, 1985.
Burris, D.R., "Thermodynamics and Kinetics of Aqueous Solutions of Liquid Hydrocarbon Mixtures", Ph.D Thesis, The Faculty of the School of Marine Science, The College of William and Mary in Virginia, 1985.
Burris, D.R. and Macintyre, W.G., "Water Solubility Behaviour of Binary Hydrocarbon Mixtures", Environ Tox. and Chem., vol.4, pp.371-377, 1985.
Burris, D.R. and Macintyre, W.G., "Water Solubility Behaviour of Hydrocarbon Mixtures Implications for Petroleum Dissolution", in Oil in Freshwater: Chemistry, Biology, Countermeasure Technology proceedings of the Symposium on Oil Pollution in Freshwater, Edmonton, pp.85-94, 1986.
Burris, D.R. and Macintyre, W.G., "Solution of Hydrocarbons in a Hydrocarbon-Water System with Changing Phase Composition Due to Evaporation", Environ. Sci. Technol., vol.20, no.3, pp.296-299, 1986.

23
Coleman, W.E, Munch, J.W., Streicher, R.P., Ringhand, P., and Kopfler, F.C., ''The Identification and Measurement of Components in Gasoline, Kerosene, and No.2 Fuel Oil that Partition Into the Aqueous Phase After Mixing", Arch. Environ. Contam. Toxicol., vol.13, pp.171-178, 1984.
. Eganhouse, R.P. and Calder, J.A, ''The Solubility of Medium Molecular Weight Aromatic Hydrocarbons and the Effects of Hydrocarbon Co-solutes and Salinity", Geochimica et Cosmochirnica Acta, vol.40, pp.555-561, 1976.
Hamam, S.E., Hamada, M.F., Shaban, H.I., and Kilani, A.S., "Crude Oil Dissolution in Saline Water", Water, Air and Soil Pollution, vol.37, no.1-2, pp.55-64, 1987.
Leinonen, P.J., ''The Solubility of Hydrocarbons in Water", M.ASc. Thesis, Department of Chemical Engineering and Applied Chemistry, University of Toronto, 1972.
Leinonen, P.J. and Mackay, D., ''The Multicomponent Solubility of Hydrocarbons in Water", Can. J. Chem. Eng., vol.51, pp.230-233, 1973.
Leinonen, P.J., Mackay, D., and Phillips, C.R., "A Correlation for the Solubility of Hydrocarbons in Water", Can. J. Chem. Eng., vol.49, pp.288-290, 1971.
Lockhart, W.L., Murray, D.AJ., Danell, R.A. and Metner, D.A, "Aspects of the Chemistry of the Water Soluble Fraction of Oils", in proceedings of the seventh annual Arctic and Marine Oilspill Program technical seminar, pp.75-81, 1984.
Lu, B.C. and Polak, J., "A Study of the Solubility of Oil in Water", Environment Canada Technology Development Report EPS-4-EC-76-1, 1976.
Mackay, D., Bobra, A., and Shiu W.Y., "Relationship Between Aqueous Solubility and Octanol-Water Partition Coefficients", Chemosphere, vol.9, pp.701-711, 1980.
Mackay, D. and Shiu, W.Y., ''The Determination of the Solubility of Hydrocarbons in Aqueous Sodium Chloride Solutions", Can. J. Chem. Eng., vol.53, pp.239-242, 1975.
Mackay, D. and Shiu, W.Y., "Aqueous Solubilities of Weathered Northern Crude Oils", Bull. Environ. Contamin. Toxico., vol.15, no.1, pp.101-109, 1976.
Mackay, D., Shiu, W.Y., Chau, A., Southwood, J. and Johnson, C.I., "Environmental Fate of Diesel Fuel Spills on Land", report for the Association of American Railroads, Washington , D.C., 1985.
Maher, W.A., "Preparation and Characterization of Water-soluble Fractions of Crude and Refined Oils for Use in Toxicity Studies'', Bull.Environm.Contam.Toxicol., vol.29, pp.268-272, 1982.
24
Maijanen, A, Ng, A., Shiu, W.Y. and Mackay, D., 'The Preparation and Composition of Aqueous Solutions of Crude Oils and Petroleum Products", report prepared for the Petroleum Association for the Conservation of the Canadian Environment, 1984.
McAuliffe, C., "Solubility in Water of Paraffin, Cycloparaffin, Olefin, Acetylene, Cycloolefin, and Aromatic Hydrocarbons", J. Phy. Chem., vol.70, no.4, pp.1267-1275, 1966.
McAuliffe, C., "Evaporation and Solution of Cz to C10 Hydrocarbons from Crude Oils on the Sea Surface", in Fate and Effects of Petroleum Hydrocarbons in Marine Organisms and Ecosystems, D.A Wolfe, Ed., Pergamon Press, pp.363-372, 1977.
McAuliffe, C., "Organism Exposure to Volatile/Soluble Hydrocarbons from Crude Oil Spills - A Field and Laboratory Comparison", proceedings 1987 Oil Spill Conference, pp.275-288, 1987.
Milhailova, L.V., "Characteristics of the Behaviour of the Water-soluble Fraction of Oil in Model Experiments", Water Res., vol.13, no.2, pp.197-205, 1986.
Murray, D.AJ., Lockhart, M.W.L. and Webster, G.R.B., "Analysis of the Water-soluble Fraction of Crude Oils and Petroleum Products by Gas Chromatography", Oil and Petrochemical Pollution, vol.2, no.I, pp.39-46, 1984.
Ostgard, K. and Jensen, A, "Preparation of Aqueous Petroleum Solutions for Toxicity Testing", Environ. Sci. Technol., vol.17, no.9, pp.548-553, 1983.
Payne, J.R., McNabb, G.D., Hachmeister, L.E., Kirstein, B.E., Clayton, J.R., Phillips, C.R., Redding, R.T., Clary, C.L., Smith, G.S. and Farmer, G.H., "Development of a Predictive Model for the Weathering of Oil in the Presence of Sea Ice", Outer Continental Shelf Environmental Assessment Program, contract No. 84-ABC-00121, 1987.
Peak, E. and Hodgson, G.W., "Alkanes in Aqueous Systems", The Journal of the American Oil Chemists' Society, vol.43, pp.215-222, 1966.
Price, L.C., "Aqueous Solubility of Petroleum as Applies to Its Origin and Primary Migration", Am. Ass. Pet. Geo!. Bull., vol.60, no.2, pp.213-244, 1976.
Shiu, Y.W., Maijanen, A., Ng, AL.Y. and Mackay, D., "Preparation of Aqueous Solutions of Sparingly Soluble Organic Substances: II. Multiple Component System - Hydrocarbon Mixtures and Petroleum Products", Environ. Toxicol. Chem., vol.7, pp.125-137, 1988.
Smith, J.H. and Harper, J.C., "Behaviour of Hydrocarbon Fuels in Aquatic Systems", Air Force Aerosp. Med. Res. Lab., (Tech. rep.) AFAMRL-TR (US) 1982, AFAMRL-TR-81-149, Proc. Conf. Environ. Toxicol. 12th, pp.336-53, 1981.
25
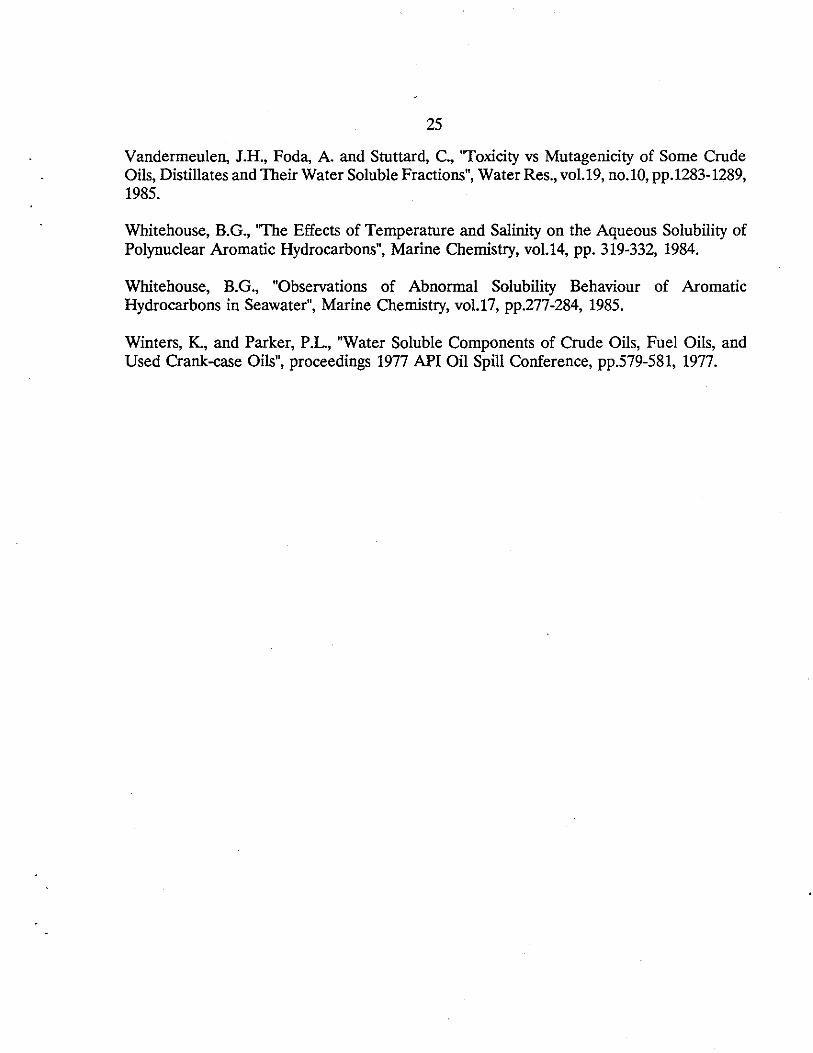
Vandermeulen, J.H., Foda, A. and Stuttard, C., ''Toxicity vs Mutagenicity of Some Crude Oils, Distillates and Their Water Soluble Fractions", Water Res., vol.19, no.10, pp.1283-1289, 1985.
Whitehouse, B.G., ''The Effects of Temperature and Salinity on the Aqueous Solubility of Polynuclear Aromatic Hydrocarbons", Marine Chemistry, vol.14, pp. 319-332, 1984.
Whitehouse, B.G., "Observations of Abnormal Solubility Behaviour of Aromatic Hydrocarbons in Seawater", Marine Chemistry, vol.17, pp.277-284, 1985.
Winters, K., and Parker, P.L, "Water Soluble Components of Crude Oils, Fuel Oils, and Used Crank-case Oils", proceedings 1977 API Oil Spill Conference, pp.579-581, 1977.

26
APPENDIX
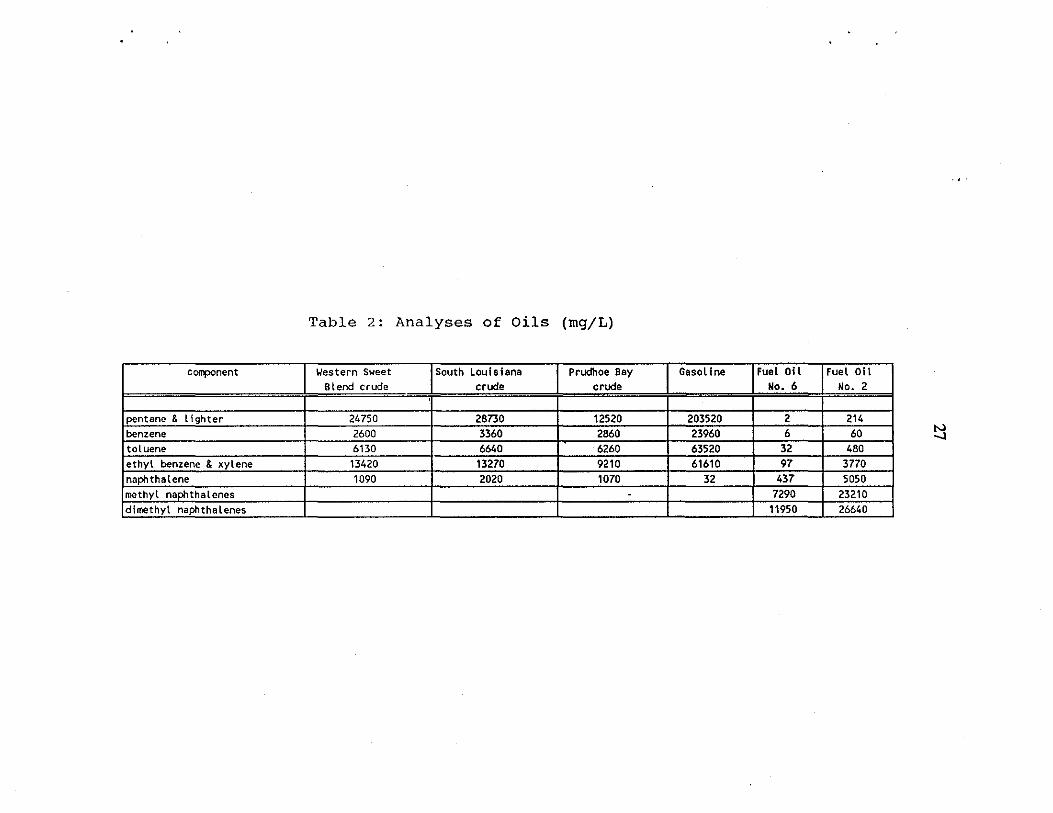
Table 2: Analyses of Oils (mg/L)
component Western Sweet South Louisiana Prudhoe Bay Gasoline Fuel Oil Fuel Oil Blend crude crude crude No. 6 No. 2
'
pcntane & lighter 24750 28730 12520 203520 2 214 benzene 2600 3360 2860 23960 6 60 toluene 6130 6640 6260 63520 32 480 ethyl benzene &xylene 13420 13270 9210 61610 97 3770 naphthalene 1090 2020 1070 32 437 5050 methyl naOhthalenes - 7290 23210 dimethyl naphthalenes 11950 26640
~

Table 3: Concentration (mg/L) of WSFs Components as a Function of Water-to-Oil Ratio
Western Sweet Blend Crude Oil
~ater -to-otl ratio I 5 10 20 ' 50 100 250 500 750 1000 2500 5000 10000
I ~,:,:,;.;~.;.;,:-,.;.;.;>.;N:::::,:,:,:,:::::,::m::::::,::m::_.;,:::,:,:::,;,:,:,~~,.:,:..:.»:«,..:w,:,:,
2.40 2.30 2.40 2.30 2.40 2.40 1.90 1.60 1.40 0.81 0.77 0.53
13.40 12.90 12.40 10.30 7.10 4.50 2.80 1.20 0.69 0.23 0.16 0.12
9.30 9.30 9.20 8.70 7.80 6.30 4.80 2.60 1.50 0.55 0.42 0.27
4.70 4.70 4.80 4.80 4.70 4.30 3.70 2.80 2.30 1.10 0.75 o. 38 '1.60 1.60 1.60 1.60 1.70 1.60 1.50 1.40 1.30 0.90 0.60 0.42
0.21 0.20 0.20 o. 21 0.21 0.19 0.18 0.16 0.13 0.09 0.06 0.05 4.39 4.50 4.40 4.19 4.59 4.71 4.32 4.14 4.08 3.12 2.34 2 .13
35.50 35.00 32.10 28.50 24.00 19.20 13.90 11.40 6.80 5.10 3.90
I
N 00

Table 4: Concentration (mg/L) of WSF's Components as a Function of Water-to-Oil Ratio
South Louisiana Crude Oil
Uater •to·otl ratio I 5 10 20 50 100 250 500 .750 1000 2500 5000 10000
I 0.210
»>:'.-:-:-:.:.:,:,"«·'>''-<-=·:;.,:,:,:,:,:,:,:,:-.,~:,:::,:,:::,:,~,:,-....:::,:::::::::::::m
2.50 2.42 2.29 2.26 1.96 2.09 1. 96 1. 78 1.78 1.09 0.470
16.89 16.71 13.40 13.44 7.11 5.06 3.76 1.64 1.53 0.31 0.150 0.077 9.74 9.86 9.49 9.24 7.10 6.25 5.20 2.89 2.75 0.69 0.290 0.110 4.23 4.33 4.26 4.24 3.73 3.66 3.45 2.69 2.59 1.13 0.480 0.210 0.96 0.98 0.96 0.97 0.90 0.92 0.90 0.84 0.83 0.57 0.340 o. 210
0.32 0.32 0.32 0.32 0.31 0.28 0.28 0.24 0.23 0.13 0.065 0.041 3.45 3.31 5.10 3.21 3.05 3.63 3.34 3.27 3.06 2.48 1. 685 1. 332
37.93 35.82 33.68 24.16 21.89 18.89 13.35 12.77 6.40 3.480 2.190
IN \0

Table 5: Concentration (mg/L) of WSFs Components as a Function of Water-to-Oil Ratio
Prudhoe Bay Crude Oil
~ater ·to·of l ratio 5 10 20 50 100 250 500 750 1000 2500 5000 10000
:<,,_,.,_,,,,_,_,.,.,,~_,.,.,_WM-.'."«-».~~.,,_,..,..,,.;,_,.,,,_,,».'<<~-:>:.;.;.;«o»:O:-w.-;.
1.52 17.72 10.93 4.03 0.94 0.26 3.74
1.38 16.70 10.74 4.00 0.93 0.26 4.36
1.42 14.91 10.43 3.98 0.94 0.26 3.50
1.33 11.15 9.14 3.74 0.90 0.25 3.27
1.58 8.98 8.77 3.78 0.93 0.25 3.75
1.13 3.21 5.20 3.06 0.75 0.23 3.52
1.06 1.86 3.50 2.59 0.83 0.21 3.34
0.86 1.20 2.39 2.10 0.73 0.18 3.04
0.74 1.20 2.41 2.08 0.78 0.18 2.94
0.44 0.39 0.85 1. 03 0.54 0.11 2.31
0.290 0.230 0.460 0.590 0.380 0.069 1.870
0.110 0.130 0.290 0 • 320 I
0.230 I0.049 1.180
39.16 37.62 35.44 29.78 28.04 17.10 13.43 10.50 10.33 5.67 3.890 2.310
..., 0

Table 6: Concentration (mg/L) of WSF's Components as a Function of Water-to-Oil Ratio
Regular Unleaded Gasoline
~ater·to·oll ratio 5 10 20 50 100 250 I 500 I 750 I 1000 I 2500 I 5000 I 10000 I I I I I %'J!lttB,? ;~ ~ ~ t.\.~:s. •.· .•. ·~.-.v,' • w.• '' •. •'~t*""lfi~m1ttit1i'.mlW 14 30 13.80 14.90 14.50 14.20 11.50 11.20 10.50 9.40 6.70 5.90 4.20'9m 'i\fu'ii,!iw®.4¥1 • 99.20 99.10 90.00 72.40 46.40 29.10 16.40 18.70 7.70 4.60 2.60,;~..,. ~~ii\Aiitflk1L .·• ·1 o o • 1 oFf%lf'fol\-IH~··1U%1!"1 18 2 o 79.30 81.00 83.90 76.10 66.50 51.60 36.80 38.40 18.80 11. 90 6.70
23.50 24.00 25.10 24.30 24.60 22.60 21.70 19.80 13.90 9.90 6. 40 I2.70 2.70 2.90 2.80 3.00 2.70 3.40 2.90 2.70 2.80 2 • 00 I
0.13 0.13 0.13 0.13 0.13 0.13 0.12 o.·12 0.09 0.06 0.17 20.37 18.17 20.47 13.37 13.57 10.37 11.48 9.36 8.58 9.59 8.22 •:::::~:
rnntnwntm!Rtl!Hlfilfll!k240.10 239.oo 240.00 231.00 203.30 165.10 121.10 loo.4o 98.68 58.47 44.75 30.29
I
..,,-
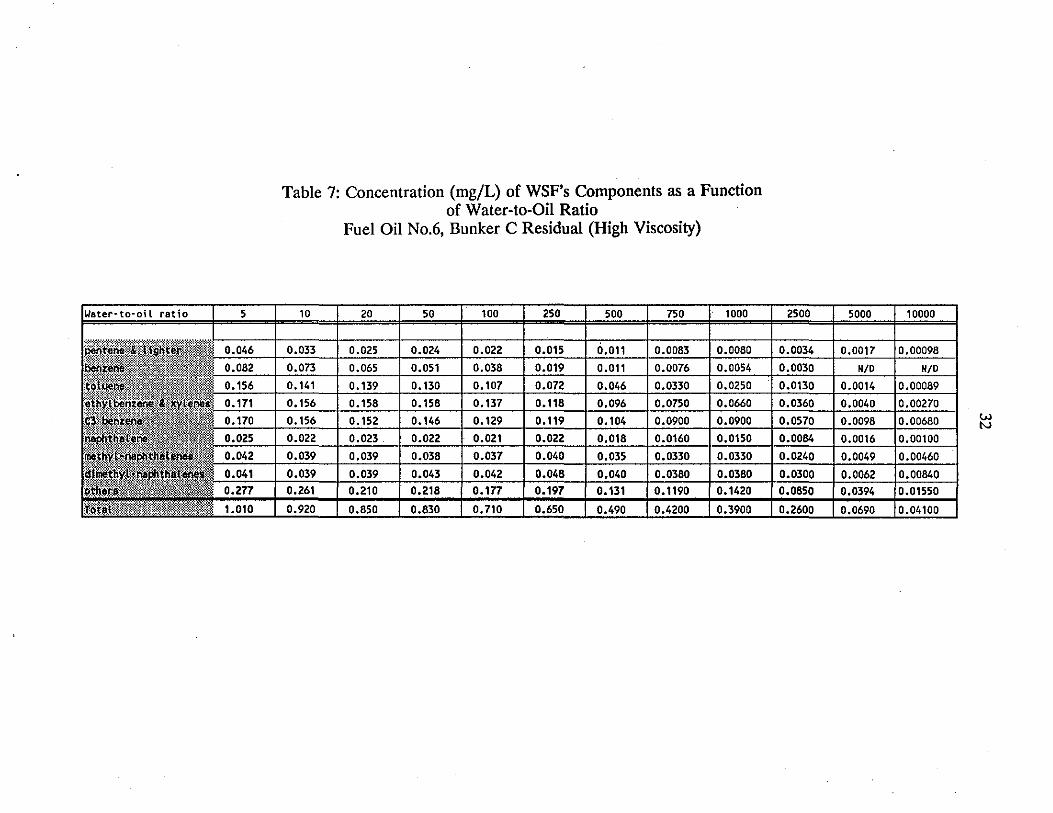
Table 7: Concentration (mg/L) of WSFs Components as a Function of Water-to-Oil Ratio
Fuel Oil No.6, Bunker C Residual (High Viscosity)
luster-to-oil ratio I 5 10 20 50 100 250 500 750 1000 2500 5000
0.0017
I 10000
0.00098 0.046 0.033 0.025 0.024 0.022 0.015 0.011 0.0083 0.0080 0.0034
0.082 0.073 0.065 0.051 0.038 0.019 0.011 0.0076 0.0054 0.0030 N/0 N/0 0.156 0.141 0.139 0.130 0.107 0.072 0.046 0.0330 0.0250 0.0130 0.0014 0.00089 0.171 0.156 0.158 0.158 0.137 0.118 0.096 0.0750 0.0660 0.0360 0.0040 0.00270 0.170 0.156 0.152 0.146 0.129 0.119 0.104 0.0900 0.0900 0.0570 0.0098 0.00680 0.025 0.022 0.023 0.022 0.021 0.022 0.018 0.0160 0.0150 0.0084 0.0016 0.00100 0.042 0.039 0.039 0.038 0.037 0.040 0.035 0.0330 0.0330 0.0240 0.0049 0.00460 0.041 0.039 0.039 0.043 0.042 0.048 0.040 0.0380 0.0380 0.0300 0.0062 0.00840 0.277 0.261 0.210 0.218 0.177 0.197 0.131 0.1190 0.1420 0.0850 0.0394 0.01550
lj~~i~Ut.1tfu11llifill~Ht@fil& 1. 01 o 0.920 0.850 0.830 0.710 0.650 0.490 0.4200 0.3900 0.2600 0.0690 0.04100
I w N

Table 8: Concentration (mg/L) of WSF's Components as a Function of Water-to-Oil Ratio
Fuel Oil No.2 (High Aromatic)
Water ·to·otl ratfo I 5 10 20 50 100 250 500 750 1000 2500 5000 10000 I
~..•.......~........~·--~----13.98 7.88 4.03 1.90 0.89 0.350 0.200 0.130 0.090 0.053 0.031 0.019 0.30 0.27 0.37 0.25 0.18 0.055 0.019 0.018 0.018 0.014 0.013 0.006 0.85 0.82 0.80 0.72 0.61 0.340 0.110 0.074 0.053 0.058 0.073 0.030 1.37 1.37 1. 35 1.33 1.24 1.010 0.590 0.460 0.390 0.370 0.340 0.140 1.53 1.47 0.27 0.28 0.68 0.66 0.34 0.34
M 4.95 4.83 17.62
1.40 0.27 0.61 0.34 4.51
13. 68
1.10 0.27 0.66 0.36 4.08
. 10. 67
1.64 1.350 1.010 0.970 0.950 0.27 0.250 0.190 0.170 0.160 0.63 0.610 0.540 0.520 0. 510 0.35 0.390 0.340 0.340 0.340 3.22 2.805 2.011 1.978 1.999 9.03 7.160 5.010 4.660 4.510
0.950 0.780 0.50010.140 0.160 0.058 0.500 0.430 0.290 0.270 0.350 0.260 1.885 1. 763 1. 377 4.240 3.940 2.680
...,,...,,