solution overview
DESCRIPTION
Solution OverviewTRANSCRIPT

Investment ManagementOverview and Integration
Solution Management ERP FinancialsSAP AG

Legal Disclaimer
This presentation is a preliminary versionand not subject to your licenseagreement or any other agreement withSAP. This document contains onlyintended strategies, developments, andfunctionalities of the SAP® product and isnot intended to be binding upon SAP toany particular course of business,product strategy, and/or development.Please note that this document is subjectto change and may be changed by SAP atany time without notice. SAP assumes noresponsibility for errors or omissions inthis document.

© SAP AG 2009. All rights reserved. / Page 3
Integration & Process ModelAppropriation Requests: Planning, alternativesCapital Investment Cost ProgramInvestment measure processing and settlementInformation system / Corporate IM – SEMPlanned developmentsUseful Information
Table of Content

Overall Sequence of Events in IM
Maintenanceand use
Retirement
Replacementinvestment
Implementation
Settlement andcapitalization
ApprovalBudgetingPlanning
Investment program
Production Administration Maintenance
MeasureApp.req.Idea: canteen
restructuring

Integration Investment Management
Business Area 1
Capital Investment ProgramBudget:Distributed:Plan:
AppropriationRequest
Plan: 100
Budget:Distributed:Plan:
Business Area 28070100
100100120
20
20
Budget:Distributed:Plan:
Investment Measure(Order / WBS)
Plan: 100Budget: 70
Actuals
AuCMM FIPP
InternalActivities Materials Acquisitions
Fixed Assets
Cost Center
PlanActuals
DepreciationSimulation
FI-AA
CO

EquipmentFixedAssets
Cost Centers
Internal OrdersPM Orders
InvestmentProgram
Settlement
Planning and Budgeting Actual Values Settlement
Maintenance
InvestmentProjects
AppropriationRequests
Plan &Budget
Plan & Automat.Generation
Maintenance
Plan
Direct capitalization
Flow of Values in Investment Management
Assetu. Const.
Settle-ment
PeriodicSettlement
Planning with (Capital) Appropriation Requests

Appropriation Request Process
"Wishlist"
InterestedPeople
Comments
Options forimplementation
Documents
ROI
Print forms
Criteria
Workflow
Classification
Roles
Investment Program
AutomaticCreationIdea Approval
ProcessApp.Request
WBS /Internal order:Leasebuildings
•Plan values•Description•Organiz. Units•Assign.•Deprec. sim. data
•Plan values•Description•Organiz. Units•Assign.•Deprec. sim. data
Replace the appropriation requestby the measure?

Creating Appropriation Requests via Internet
Creating the appropriationrequest via Internet byusing a Web Browser(without gui installation)
Investment ideain subsidiary
Total Investments
EuropeAmericas
Administration Production
AppropriationRequest
Plan values
AppropriationRequest
Plan values
Assignment
Subsidiary:no R/3 system
Head office:R/3 Systemwith InvestmentProgram
Approval inhead office

Internet
Anforderungsart
Role:
Project Accountant
Standard
Appr. Req. type 30
Simplified
Appr. Req. type 30
Role: CapitalInvestmentManager
Screen Layout
Payback periodAssetOrder type...
Input HidelDisp. HiLiReq.
Influencing Fields
User
Customizing Approp. Req. Type 30
Transaction Tablayout
Standard : SAP
Simplified : SAPP
Internet :SAPWTransaction
Different Views on the same AppropriationReq.

App. 12000:3.500
App. 32000:5.000
EnterPlanvalues
Overview Planning
Version 0 / 2000
App. 1: 3.000
App. 2: 2.000
App. 3: 4.500
ChangePlanvalues- 500
App. 22000:2.500
EnterPlanvalues
Subsidiaries
Head Office
Overview Planning for Appropriation Request

# CostsM 10 pc 2190M 10 pc 8130...E 5 h 300Processor 1000 MHz
Processor 700 MHz
Easy Cost Planning for Appropriation Requests
Appr. Req. 1
IT Procurement
Hard disk: 8Monitor: 19Processor:Amount: 10
Hard disk8 GByteHard disk16 GByte
Monitor 19”Monitor 21”
...
Installation:30 Minutes/PCActivity Type 1410Price: 60 EUR/Std.
MaterialMaster
219 EUR
813 EUR

# CostsM 10 pc 2190M 10 pc 8130E 5 h 300...
Internal Order 1
IT Procurement
Hard disk: 8Monitor: 19Processor: 700Amount: 10
GenerationafterApproval
Easy Cost Planning and Easy ExecutionServices
# CostsM 10 pc 2190M 10 pc 8130E 5 h 300...
Appr. Req. 1
IT Procurement
Hard disk: 8Monitor: 19Processor: 700Amount: 10
Creation ofpurchase req. /purchase orders/...
Post internalactivity allocation ...
CopyCopy

Master data with distributable attributes
© SAP AG 2010. All rights reserved. / Page 14
App.Request 01New Production building
Requesting Cost Center:
Responsible Cost Center: 4711
%
Cost center responsible for construction
Cost centers, which willuse the new assetsafter construction
Cost Center Percentage
4712
4713 40 %
60 %
Division: %
Material Group: %

Appropriation Requests: Variants
BenefitsBenefits
AssessmentAssessment
Plan valuesPlan values
Payback periodPayback period
Appropriation request - expanding production facilities
Investment programDepreciation simulation
Variant 1:New construction
State-of-the-art
Good
5,000,000
3 years
Variant 2:Rentals
Tax benefits
Satisfactory
3,000,000
2 years
Variant 3:Ext. procurement
Increased capacity
Not satisfactory
1,500,000
1 year
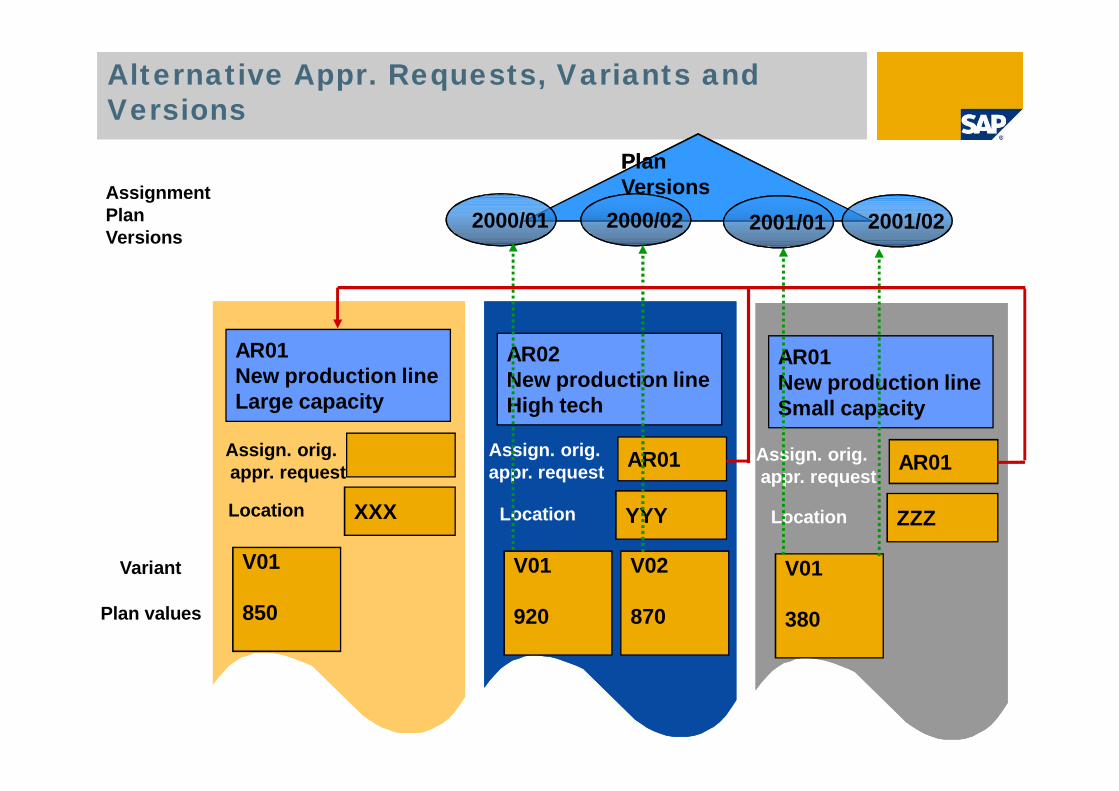
Alternative Appr. Requests, Variants andVersions
AR01New production lineLarge capacity
XXX
V01
850
Location
Assign. orig.appr. request
Variant
Plan values
Assign. orig.appr. request
AR02New production lineHigh tech
AR01
YYY
V01
920
Location
V02
870
Assign. orig.appr. request
Assign. orig.appr. request
AR01New production lineSmall capacity
AR01
ZZZ
V01
380
Location
Assign. orig.appr. request
PlanPlanVersionsAssignment
PlanVersions
2000/01 2000/02 2001/01 2001/02

Costs and Revenues on AppropriationRequests
Costs RevenueInvestment costs Overhead costs
Overall200120022003
Net present value and discounted cash flow rate,internal rate of return and payback period
Reference interest rates
Calculation of preinvestmentanalysis figure
Combined costs
160.00030.000
120.000
23.00015.0008.000 150.000
75.000
183.00045.000
128.000

Recalculate preinvestment analysis figures
Appr. Request 1
Costs Revenue2001 100.000 50.0002002 10.000 80.000
Net present value: 13.497Reference Date: 25.05.2001
Appr. Request 2
Costs Revenue2001 60.0002002 70.000
Net present value: 3.468Reference Date: 07.01.2001
Recalculationof preinvestmentanalysis figures
Reference Date:01.07.2001
Appr. Request 1
Costs Revenue2001 100.000 50.0002002 10.000 80.000
Net present value: 13.632Reference Date: 01.07.2001
Appr. Request 2
Costs Revenue2001 60.0002002 70.000
Net present value: 3.635Reference Date: 01.07.2001
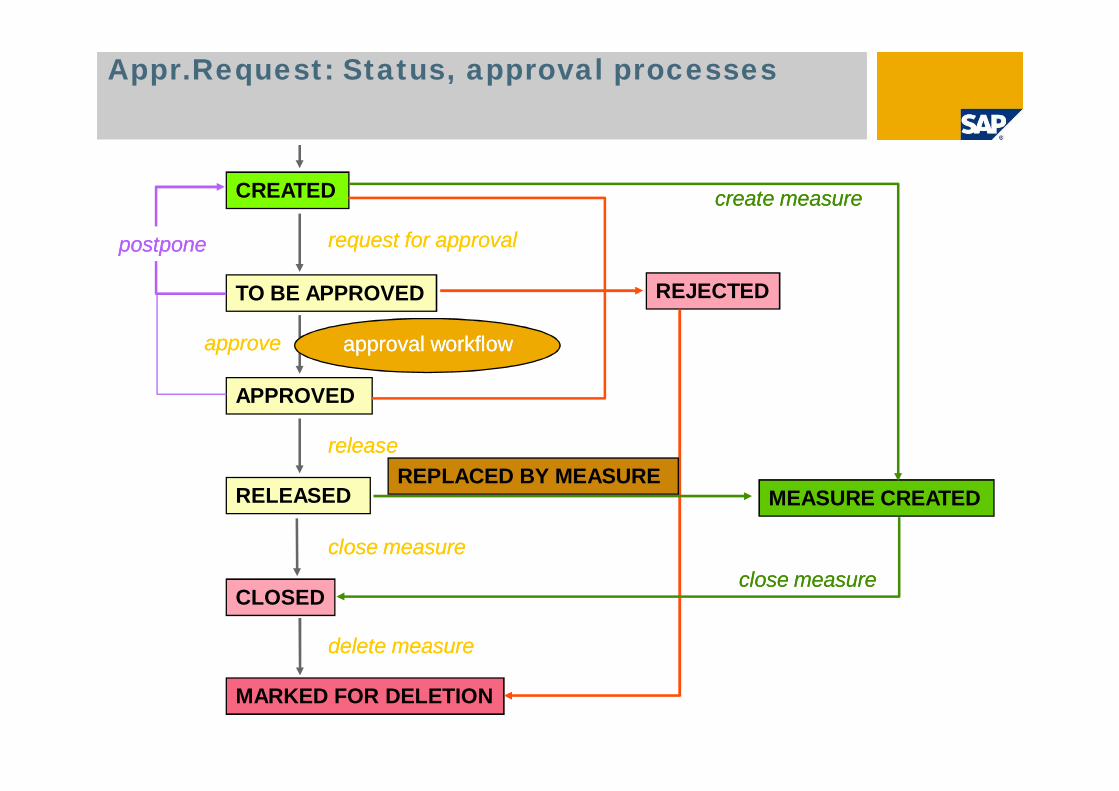
Appr.Request: Status, approval processes
CREATED
APPROVED
REJECTEDTO BE APPROVED
RELEASED MEASURE CREATED
CLOSED
MARKED FOR DELETION
request for approvalrequest for approval
approveapprove
releaserelease
close measureclose measure
delete measuredelete measure
postponepostpone
create measurecreate measure
close measureclose measure
approval workflowapproval workflow
REPLACED BY MEASURE

Planning and Budgeting within the CapitalInvestment Cost Program

Invest
- 1
- 1.11.1.1
1.1.3.1
1.1.2
1.1.3.2
1.1.3
1.1.3.3
-
---
1.2
1.2.11.2.21.2.3
Program Structure
Program DefinitionProgram TypeKeyDescriptionApproval Year. . .
Program PositionOrg.AssignmentResponsible PersonReason for InvestmentPriorityDepr.-Sim.Data. . .
Investment Program
Master Data for Investment Program

Investment ProgramInvestment Program
Total InvestmentsTotal Investments
EuropeEuropeAmericasAmericas
AdministrationAdministration ProductionProduction
Cost Center /Profit CenterHierarchy
Cost Center /Profit CenterHierarchy
Enterprise OrganizationEnterprise Organization
Enterprise OrganizationEnterprise Organization
EuropeEuropeAmericasAmericas
Production 1Production 1 Production 2Production 2
Investment Program in the EnterpriseOrganization
Connect the Investment Programto the Enterprise Organization (EO).All changes in the EO are transferredto the Investment Program.
It is also possible to connect the EOto the Cost Center Hierarchy.

Order OR03
Investment Cost Program: Planning bottom-up
Total InvestmentsPlan Budget Distrib.
Business Area 1 Business Area 2 Business Area 3
Northern Region Southern Region Eastern Region
Plan Budget AllottedPlan Budget Distrib. AllottedProject PR02
Project PR2.1 Project PR2.2
Appr.Request AR01
Plan
200200 150150250250
7070 8080 5050
400400500500
15001500
RollRoll--upup 600600
12001200

Position 1 budget900
Position 1.1360
Position 1.1450
budget
Takeover Plan to Budget
Position 1 plan1000
Position 1.1400
Position 1.1500
Capital InvestmentProgram
plan
takeovere.g.budget =plan - 10%

Order OR03
Investment Cost Program: Budgeting top-down
Total InvestmentsPlan Budget Distrib.
Business Area 1 Business Area 2 Business Area 3
Northern Region Southern Region Eastern Region
Plan Budget AllottedPlan Budget Distrib. AllottedProject PR02
Project PR2.1 Project PR2.2
Appr.Request AR01
Plan
200200 150150250250
7070 8080 5050
600600 400400500500
15001500 12001200
10001000
300300 400400 300300350350
100100 100100 1501509090
5050 4040
2020
40

Approval Year 2000
Plan Version01170
Plan Version02130
Approval Year 2001
Plan Version01160
Plan Version02130
Variant 01Variant 01
90
Variant 02Variant 02
80
Appr. Request AR01
Planversion01
80
Planversion02
50
Project PR01
Cyclical Plan Versions: Appr. Requests,Measures

Capital InvestmentAdministration
. . .
CustomizingVersion Authorizations:
000000010002
User: T. Eckert
Auth.level: 1Resp: EckertActivity: Planning
Authorizations:User: S. Noack
Auth.level: 1 + 2Resp:Activity:
Resp: Noack
Investment Program 2000Plan Budget Distrib.
NoackPlanning
A.level Lock ind.321
X
Hardware FixturesResp: Eckert
Authorization Levels for Plan Versions

Closed
Cfwd0 280
Curr.
Position
M1
Cfwd200 300
Curr.
M1 (old)
M2
M3
M2 (old) 100
100100
100
80
Program 2000 Program 2001
PositionFunction"Open new approval year"
BudgetBudget
X Copy programstructure
X Carry forwardmeas./app.req.
X Carry forwardbudget values
X Carry forwardplan values
M4
M5
150
150
newlyapprovedin 2001after"Open new
approval year"
Open New Approval Year

Function"Close Old Approval Year"(optional)
Closed
Cfwd0 280
Curr.
Position
M1
Cfwd0 500
Curr.
M2
M3
M2 100
100100
100
80
Program 2000
100
Program 2001
PositionBudgetBudget
M4
M5
150
150
X Carry forwardmeas./app.req.
X Carry forwardbudget values
X Carry forwardplan values
M1
M2
100
100
Can no longer bepocessed directlyfrom Program 2000
M1
Close Old Approval Year

Overall and annual values
Budgetdistributionpossible
Position1100
overallplan
1100overall
7502000
2502001
budget
2502001
8002000
Capital Investment Cost program 2000
Roll-uppossible
500 300 200Measure 1
300 200 50Measure 2
300 300300 0Measure 3 300 0
500 250 200
300 200 50

Measure 1 assigned to Investment ProgramPosition
Program2000
Approvedin 2000
...for2000
...for2001
BudgetOriginalForwardReturnsSupplementsCurrent
350 300 50
Measure 1
Budget
Actuals
Commitment
Overall 2000 2001
300 280 10
170
20

Program2001
Approvedin 2001
...for2001
...for2002
BudgetOriginalForwardReturnsSupplementsCurrent
Open New Approval Year
Program2000
Approvedin 2000
...for2000
...for2001
BudgetOriginalForwardReturnsSupplementsCurrent
Measure 1
Budget
Actuals
Commitment
Overall 2000 2001
350 300 50
170
20
300
300 10
280 10
Reporting

New Measures / new Budget for 2001
Program2000
Approvedin 2000
...for2000
...for2001
BudgetOriginalForwardReturnsSupplementsCurrent
Measure 1
Budget
Actuals
Commitment
Overall 2000 2001
350 300 50
300 280 10
170
20
Program2001
Approvedin 2001
...for2001
...for2002
BudgetOriginalForwardReturnsSupplementsCurrent
Measure 2
Budget
Actuals
Commitment
Overall 2001 2002
400 300 80
Reporting
500 10040010300

Commitment Carried Forward for Measure
Program2000
Approvedin 2000
...for2000
...for2001
BudgetOriginalForwardReturnsSupplementsCurrent
Measure 1
Budget
Actuals
Commitment
Overall 2000 2001
350 300 50
300 280 10
170
20
Program2001
Approvedin 2001
...for2001
...for2002
BudgetOriginalForwardReturnsSupplementsCurrent
500 400 100
Measure 2
Budget
Actuals
Commitment
Overall 2001 2002
400 300 80
10300
20

Budget Carry Forward for Measure
Program2000
Approvedin 2000
...for2000
...for2001
BudgetOriginalForwardReturnsSupplementsCurrent
Measure 1
Budget
Actuals
Commitment
Overall 2000 2001
350 300 50
300 280 10
170
20
Program2001
Approvedin 2001
...for2001
...for2002
BudgetOriginalForwardReturnsSupplementsCurrent
500 400 100
Measure 2
Budget
Actuals
Commitment
Overall 2001 2002
400 300 80
10300
110

More distributed to Measures than on ProgramPosition!
Program2000
Approvedin 2000
...for2000
...for2001
BudgetOriginalForwardReturnsSupplementsCurrent
Measure 1
Budget
Actuals
Commitment
Overall 2000 2001
350 300 50
300 170 120
170
20
Program2001
Approvedin 2001
...for2001
...for2002
BudgetOriginalForwardReturnsSupplementsCurrent
500 400 100
Measure 2
Budget
Actuals
Commitment
Overall 2001 2002
400 300 80
10300
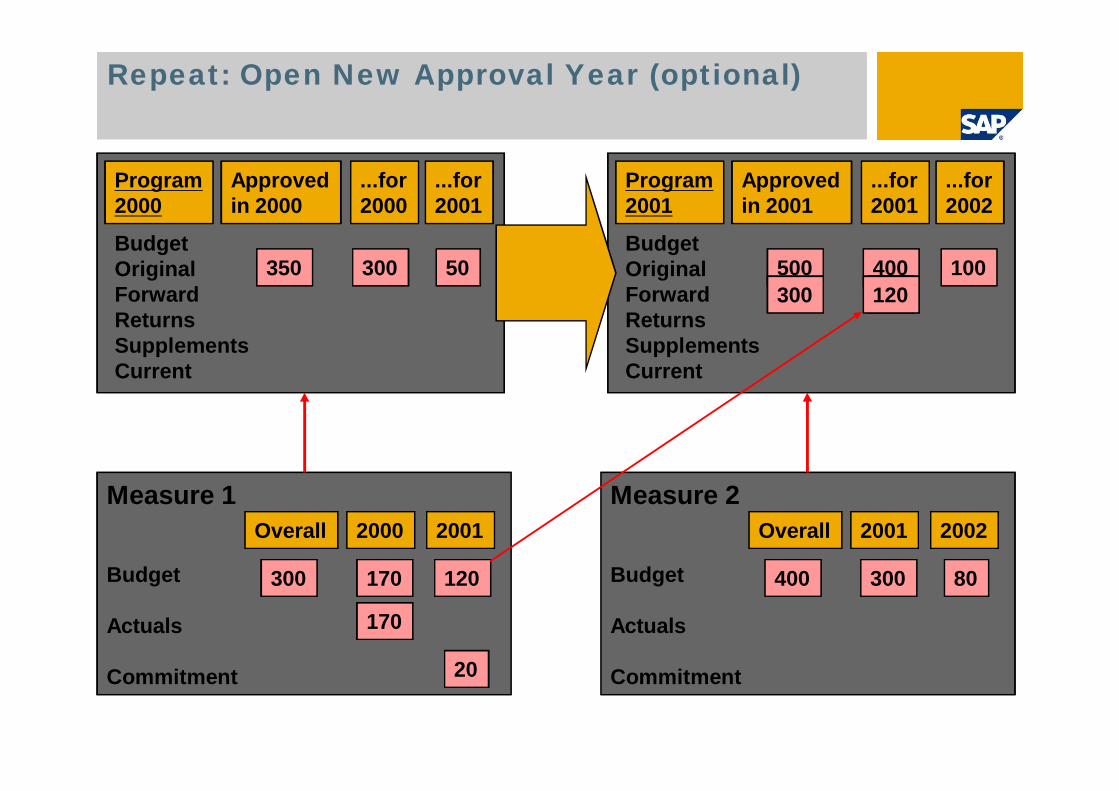
Repeat: Open New Approval Year (optional)
Program2000
Approvedin 2000
...for2000
...for2001
BudgetOriginalForwardReturnsSupplementsCurrent
Measure 1
Budget
Actuals
Commitment
Overall 2000 2001
350 300 50
300 170 120
170
20
Program2001
Approvedin 2001
...for2001
...for2002
BudgetOriginalForwardReturnsSupplementsCurrent
500 400 100
Measure 2
Budget
Actuals
Commitment
Overall 2001 2002
400 300 80
300 10120

Investment Program Budget Carryforward
Program2000
Approvedin 2000
...for2000
...for2001
BudgetOriginalForwardReturnsSupplementsCurrent
Measure 1
Budget
Actuals
Commitment
Overall 2000 2001
350 300 50
300 170 120
170
20
Program2001
Approvedin 2001
...for2001
...for2002
BudgetOriginalForwardReturnsSupplementsCurrent
500 400 100
Measure 2
Budget
Actuals
Commitment
Overall 2001 2002
400 300 80
300 10120-130
170130180
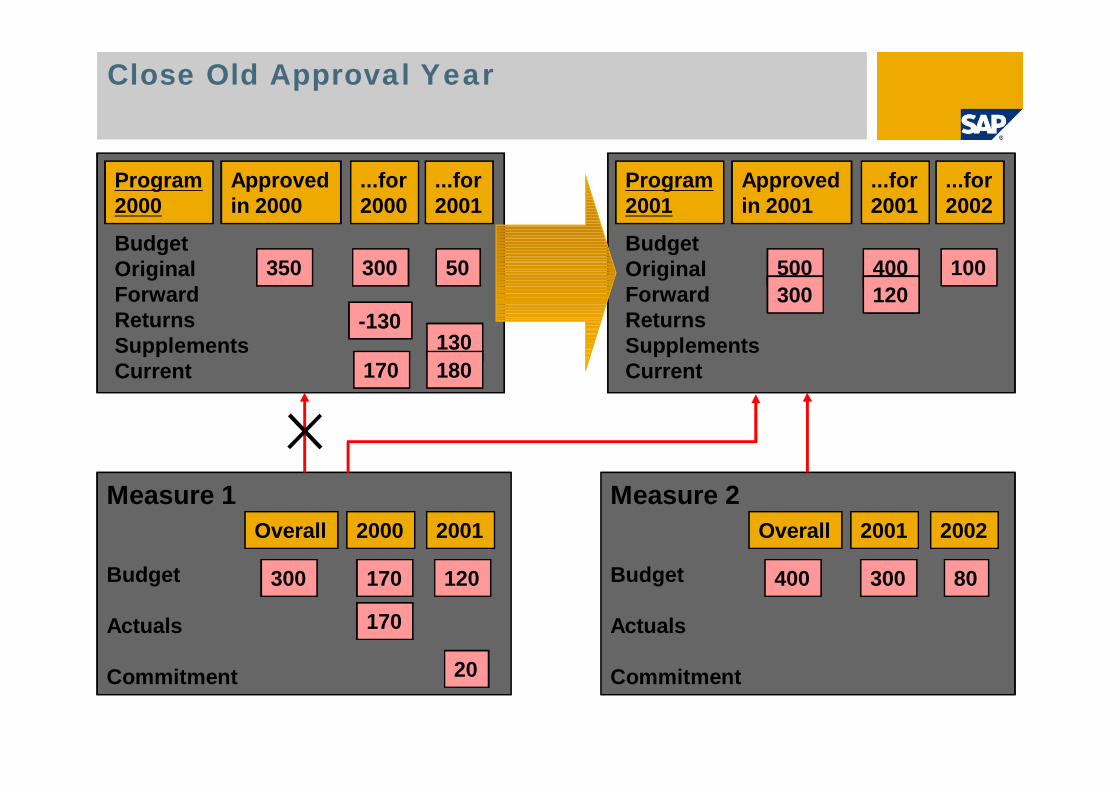
Close Old Approval Year
Program2000
Approvedin 2000
...for2000
...for2001
BudgetOriginalForwardReturnsSupplementsCurrent
Measure 1
Budget
Actuals
Commitment
Overall 2000 2001
350 300 50
300 170 120
170
20
Program2001
Approvedin 2001
...for2001
...for2002
BudgetOriginalForwardReturnsSupplementsCurrent
800 520 100
Measure 2
Budget
Actuals
Commitment
Overall 2001 2002
400 300 80
-130
170130180

Assigning a Measure to Several ProgramPositions
Position 1budget
4000
InvestmentProgramInvestmentProgram
Position1.1
budget1500
Position1.2
budget2000
30%30% 100%100%70%70%
Reporting
budget actualPosition 1
Position 1.1Measure 1
Position 1.2Measure 1Measure 2
40001500
20001400
6001000
1800700
1100
Measure 1budget
2000actual
700
300
1000
Measure 2budget
1000actual
800
800

Budget Categories in the Investment Program
Budget Categories
(used for planvalues rollup only)
Position capital1900
budgetexpense
600
Reporting
budget actualPosition
measure19001600
700700
(1) capital
(2) expensebudget actual
Positionmeasure
600400
300300
budget actualPosition
measure25002000
10001000
(3) independent of budget category80%80% 20%20%
Program definition
Measure 2000
Cost Center
Fixed AssetFixed Asset
actuals1000+
700-300-
Investment Measures

Order/WBS- EIement
Planned Values
Cap. InvestmentProgram
Budget
Commitments
Actual Values
Controllinginformationsystem
Invoice
PurchaseOrder
Assets
Direct Capitalization with Statistical update
Statistical Update

Internal order/
project
Asset under construction withstatistical update in order or project
Internal activity
AdvantageP&L is not inflated by line items that will becapitalized
DisadvantageTwo objects to be maintained andcontrolled
Statistical updateStatistical updateExternal procurement
Cost center
Periodicsettlement
AssetAsset
line items /summary
Finalsettlement
Asset underconstruction

Asset(s) underconstruction
Investmentmeasure
Internal OrderWBS element
Project ProfileOrder Type
Asset class
Investment Measure and Asset UnderConstruction
Reference Order
Investmentprofile
Create AuCautomatically?Asset class for AuC
Default values forassetsMaintenance of theasset only viaWBS/Order
automatically

Investment Measure with internal AuC
Investment measure
Advantages:Distribution along cost elements or lineitemsOnly one object to maintainProof of origin on cost elements or lineitems depending on the settlement method.
Disadvantage:All items are posted through the P&Lstatement although most of them will becapitalized later on.
Asset under constructionAsset under construction
Order / Project
External procurement Internal activity
summary orline item settlement
Finalsettlement
AssetAsset
preliminarysettlement
Cost centerCost center
Periodicsettlement
=
+

Investment Measure: Budgeting & Planning
Capital Investment Measure
Order/WBS- EIement
AuC
Planned ValuesPlanned Values Cost CenterCost Center Actual ValuesActual Values
Cap. InvestmentProgram
Budget
Planned Values
Commitments
Actual Values
Depr. simulationCost planning

Investment Measure: Construction(Acquisition)
Capital Investment Measure
Order/WBS- EIement
AuC
Planned ValuesPlanned Values Cost CenterCost Center Actual ValuesActual Values
Cap. InvestmentProgram
Budget
Planned Values
Commitments
Actual Values
Purchase OrderDown paymentInvoiceInternal Activity
Transactions duringconstructionTransactions duringconstruction
Depr. simulationCost planning

Investment Measure: Periodic Settlement
Capital Investment Measure
Order/WBS- EIement
AuC
Planned ValuesPlanned Values Cost CenterCost Center Actual ValuesActual Values
Cap. InvestmentProgram
Budget
Planned Values
Commitments
Actual Values
Periodic settlement
Asset historysheet
Purchase OrderDown paymentInvoiceInternal Activity
Transactions duringconstructionTransactions duringconstruction
Depr. simulationCost planning

Periodic & Preliminary Settlement
Capital Investment Measure
Order/WBS- Element
AuC
1 Cst.elem.1 2,500
2 Cst.elem.2 8,000
3 Cst.elem.3 2,500
4 Cst.elem.4 3,500
5 Cst.elem.5 8,500
6 Cst.elem.6 9,700
7 Cst.elem.7 6,700
Settlement tocontrolling
Remaining itemsare assigned toAuC
CO-receivers,e. g.cost-centers,internal orders,WBS-elements,...
CO-receivers,e. g.cost-centers,internal orders,WBS-elements,...

Capital Investment Measure
Order/WBS- EIement
AuC
Budget
Planned Values
Commitments
Actual Values
Periodic settlement
Investment Measure: Final Settlement
Asset 1
Asset 2
Asset 3
Fina
lse
ttlem
entPurchase Order
Down paymentInvoiceInternal Activity
Transactions duringconstructionTransactions duringconstruction
Planned ValuesPlanned Values Cost CenterCost Center Actual ValuesActual Values
Depr. simulationCost planning
Asset historysheet
Cap. InvestmentProgram

Maintain Settlement Rule: Overview
Default distribution rules
Cat Settlement Receivs. Receiver-short text % Equivalence no. Settlement type
CTR 1000 Corporate Services 30 PREFXA 4162 New Building 100 AUCFXA 300002 Building K17 1 FULFXA 300003 Building K18 1 FUL
Order /Project
Actuals100
30CTR 1000: 30
70AUC 4162: 70Fixed Asset 300002: 35Fixed Asset 300002: 35
Fixed Asset 300003: 35Fixed Asset 300003: 35
FinalSettlement
PeriodicSettlement
Settlement type

Capital Investment Measure
Investment Measure: Down Payments
Order/WBS- EIement
AuC
1. CoEle. Down payments: 2.000
2. CoEle. 400000: 10.000
3. CoEle. Down payments: 2.000 -
Periodic settlement
1. Down payment: 2.000
2. Ext. acquisition: 10.000
3. Settlement.Down payment: 2.000 -
1. Down payment1. Down payment
2. Final bill:CoE. 4000002. Final bill:CoE. 400000
3. Clearing downpayment3. Clearing downpayment
Asset 1
Asset 2
Asset 3
Fina
lse
ttlem
ent
ALWAYSTOGETHER!ALWAYSTOGETHER!

Asset creation from orders / WBS elements
External asset numberReference assetAsset class
Asset textCost centerPlantBusiness areaLocation
Number of records to be created
Distributionrules for finalsettlement toFixed Asset
Equivalencenumber
InvestmentOrder /WBSelement
SettlementRules

Settlement to Affiliated Company Code
Investment Order / WBS element
Organizational assignment
Responsiblecompany code
Asset underconstruction
0001
Requestingcompany code 0002
Company code 0002
Cost collectingcompany code(Here is donethe construction)
Final Asset
Company code 0002
Balance sheetcompany code(Here is where theasset will be usedonce it is finished)
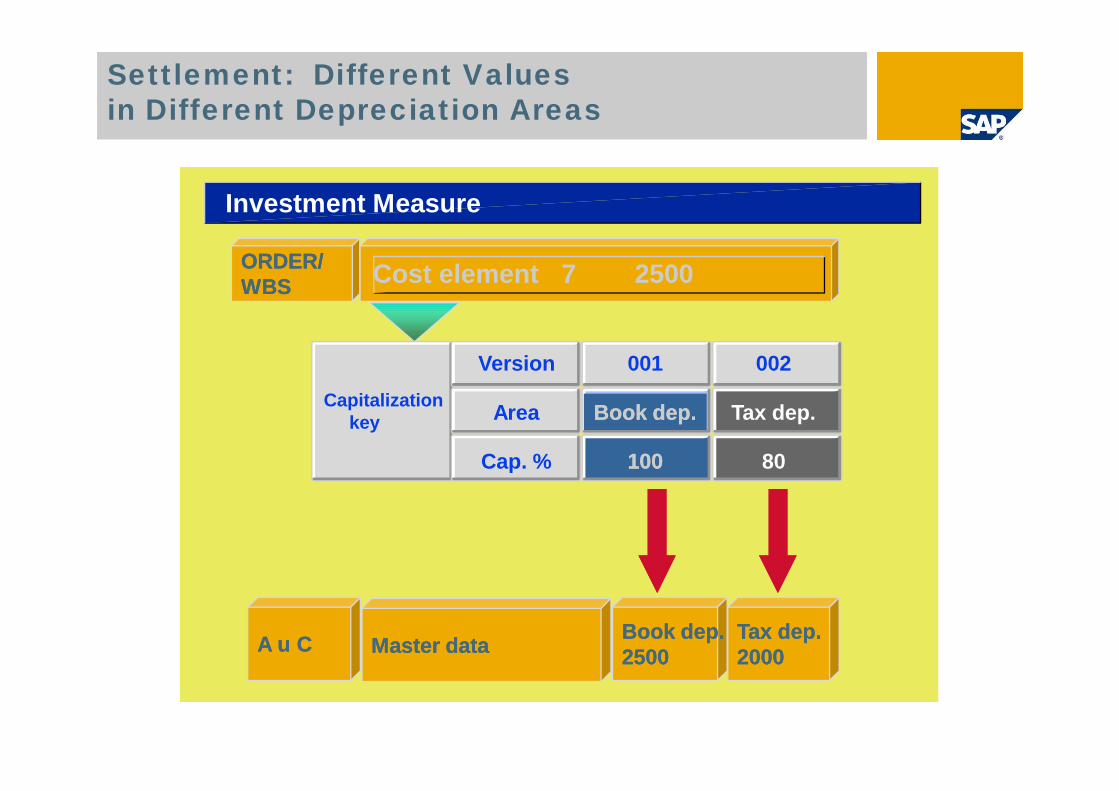
Settlement: Different Valuesin Different Depreciation Areas
Investment Measure
ORDER/ORDER/WBSWBS Cost element 7 2500
A u CA u C Master dataMaster data Book dep.Book dep.25002500
Tax dep.Tax dep.20002000
Capitalizationkey
Version 001 002
Area Book dep.Book dep. Tax dep.
Cap. % 100100 80

Summary / line item settlement
Nr. Costelement
Amount
1 400 1000
2 400 4000
415 3000
615 2000
Investment MeasureInvestment MeasureXYXY
3
4
Asset 1:700
2.8003.0006.500
Asset 1:700
2.8003.0006.500
Asset 2:300
1.2002.0003.500
Asset 2:300
1.2002.0003.500
Asset 3:700
4.0003.0007.700
Asset 3:700
4.0003.0007.700
Asset 4:300
2.0002.300
Asset 4:300
2.0002.300
Asset 3 100%
Asset 3 70%Asset 4 30%
Asset 3 60%Asset 4 40%
Asset 1 100%
Asset 2 100%
Asset 1 70%Asset 2 30%
Summary Settlement Line Item Settlement
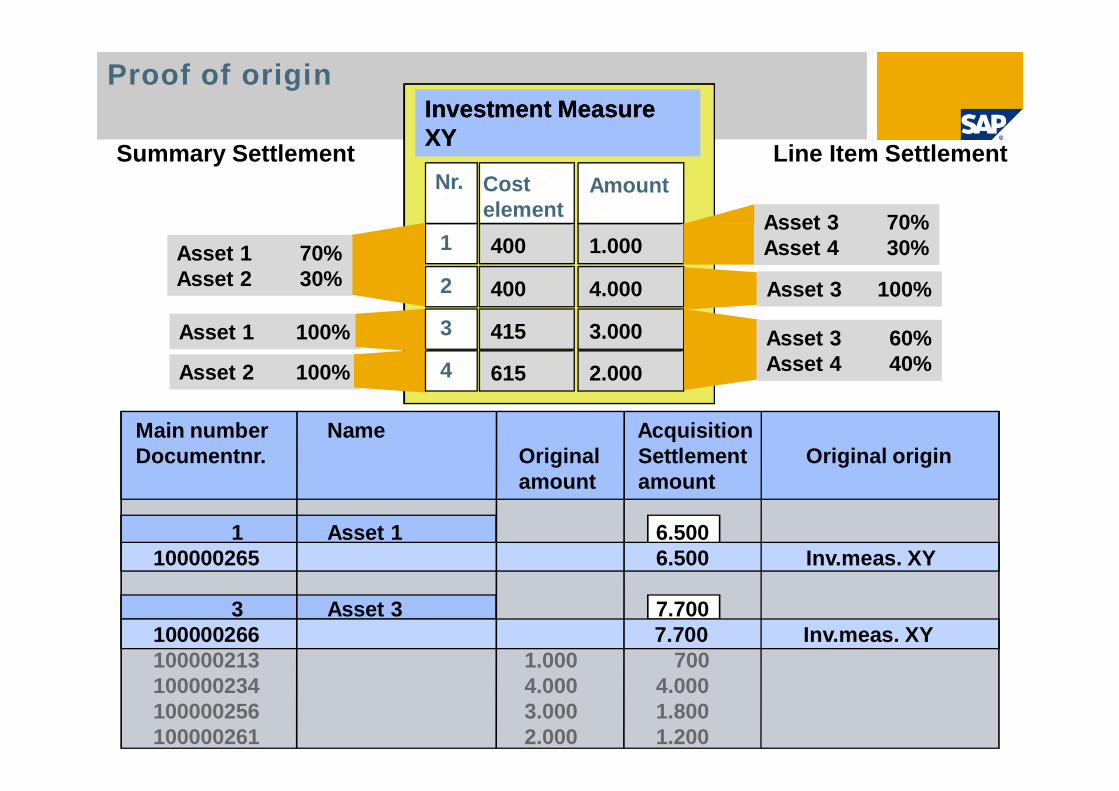
Proof of origin
Nr. Costelement
Amount
1 400 1.000
2 400 4.000
415 3.000
615 2.000
Investment MeasureInvestment MeasureXYXYSummary Settlement Line Item Settlement
Asset 1 100% 3
Asset 2 100% 4
Asset 3 70%Asset 4 30%
Asset 3 100%
Asset 3 60%Asset 4 40%
Main number Name AcquisitionDocumentnr. Original Settlement Original origin
amount amount
1 Asset 1 6.500100000265 6.500 Inv.meas. XY
3 Asset 3 7.700100000266 7.700 Inv.meas. XY100000213 1.000 700100000234 4.000 4.000100000256 3.000 1.800100000261 2.000 1.200
Asset 1 70%Asset 2 30%
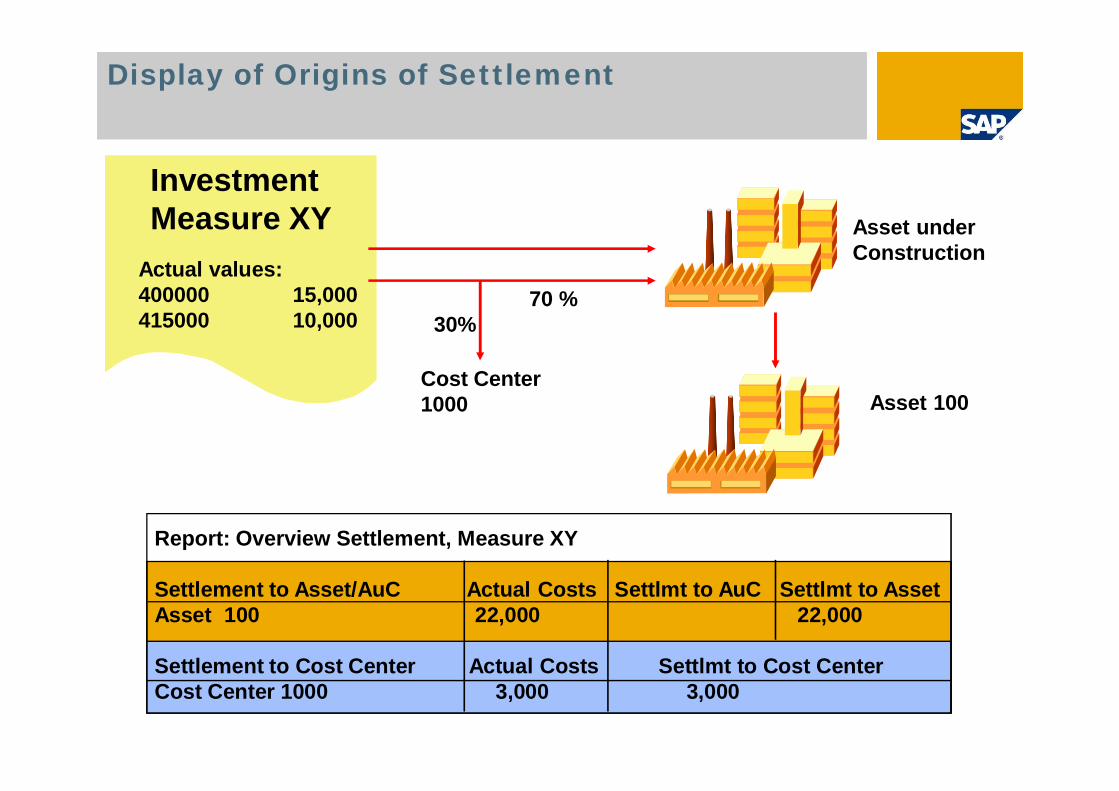
Display of Origins of Settlement
InvestmentMeasure XY
Actual values:400000 15,000415000 10,000
Asset underConstruction
Cost Center1000 Asset 100
Report: Overview Settlement, Measure XY
Settlement to Asset/AuC Actual Costs Settlmt to AuC Settlmt to AssetAsset 100 22,000 22,000
Settlement to Cost Center Actual Costs Settlmt to Cost CenterCost Center 1000 3,000 3,000
70 %30%

Interest During Construction
Capital Investment Measure
Order/WBS- Element
Interest structure 1
AuC
No. Date Amount Int.01 Int.02
1 01/01 2,500 150 1752 07/01 10,000 300 3503 10/01 12,500 188 219
BookDeprec.
Taxdeprec.
Interest structure 1
Comp.interestafter
3 mth 6 mth
% 6% 7%
Rate 01 Rate 02
Costelement A B

Investment Program Position 112
Plan/Budget100
Distrib.30
Avail-able70
Dep. SimulationandCost Planning
Asset 3219
Take asset valuesas of fiscal yearstart
IT Equipment
Plan/Budget30
Actual10
Avail.20
NewIT Equipment(PCs)
Investment Measure / Approp. Request
Acquisitioncosts10
Pentium PC 120
Depreciation Simulation andCost Planning
Reduce basis ofdeprec. simulationfor plannedinvestments byamount alreadycapitalized
Depreciation simulationin Asset Accounting

Offsetting Actual Values with DepreciationData
Deprec. Simulation Distributions
Class Cost cent. Cap. date Percent Amount3000 1000 07/01/2000 60.00 90,0003100 1000 01/01/2000 40.00 60,000
Total: 100.00 150,000
Actual Settlement
Class Cost cent. Posting date Amount Offset Open actual3000 1000 10/01/2000 25,000 25,000 0
Total: 25,000 25,000 0
Only these values are simulatedper the asset class
Offset Open plan25,000 65,000
0 60,000
25,000 125,000

Information SystemInvestment Management

IM Reporting Tools
Drill down reporting for investment programHierarchy of program positionsAssigned appropriation requestsAssigned orders and directly assigned WBS elements
Drill down reporting for summarization data base
Drill down reporting for appropriation requestsIncluding assigned orders / WBS elements
BW (Business information Warehouse)
Corporate Investment Management - SEM

Summary Reporting
Enti-ties
Values
Export tofile:
(entities)
current
values
Values
Summarydatabase
(Summary
Values)
Importfrom file:
Values
(Entities)
Cross system reporting in central system is possible!
Top
Central
Local
In your ownclient
copy
program
summarize
values
copy
entities
Program
Values
Entities
Summarydatabase
SummaryReporting
Reporting
Local SystemCentral System
Top
Central
Local
SummaryReporting
Reporting

IM in BW
Info ObjectsProgram definitionProgram positionsAppropriation requests (2.0)Assigned orders and directly assigned WBS elements
Info SourcesPlanned costs and budget from program positionsAssignment of orders / WBS elements to program positions (1.2B) and appropriation
requests (2.0)Assignment of Appr.requests to program positions (2.0)Distributable attributes of appropriation requests (2.0)

SAP BW Architecture Overview

Relationship Global System Local Systems
Global Local 1
Local 2
IntersectionPosition
IntersectionPosition

Relationship Global System Local Systems
Global Local 1
Local 2

Relationship Global System Local Systems
Global Local 1
Local 2

Global and Local Systems
Group
BA1
BA1-C1
BA1-C1-1
BA1-C1-2
BA1-C2
BA1-C1-3
* * *
BA2
BA2-C1
BA2-C1-1
BA2-C1-2
BA2-C2
BA2-C1-3
* * *
C1
BA1-C1
BA1-C1-1
* * *
BA1-C1-2
* * *
AR / Pro
UB Company BucketGroup
Global Local
BA1-C1-3
* * *
BA2-C1
BA2-C1-1
* * *
BA2-C1-2
* * *
BA2-C1-3
* * *
AR / Pro
AR / Pro
AR / Pro
AR / Pro
AR / Pro

Global and Local Systems
Global = SEM Local 1 = R/3
Local 2 = R/3

Global and Local Planning: Playing Together
Global SEM & BW Local 1 ( R/3 )
Local 2 ( R/3 )OPERATIONAL
Company Data
Extractor
Extractor1
1
Group Data
STRATEGIC SEM BPS
# ##
#43 5
UpdateIntersectionPositions
2
3

Appropriation Requests and Projects
Global SEM & BW Local 1 ( R/3 )
OPERATIONAL
Company Data
Extractor1
Group Data
STRATEGIC SEM BPS
43 5
2
Local ( R/3 )
ar1
ar2
AR3
pro1
pro2
PRO3
* * *
* * *
ar4
pro4
ar5
pro5
AR6
PRO6
AR3
PRO3
AR6
PRO6
* * *
* * *
# # # ## # #
# #AR3 #
# PRO3AR6 PRO6
5
Updatebig ARsand PROs
# # # ## # #
# #
3

BW: Reporting Locals
ActBudgPlan
Local 1
ActBudgPlan
Local 2OPERATIONAL
Company Data

BW: Reporting Global
OPERATIONAL
Company Data
Group Data
STRATEGIC
BusArea Company Plan Act# #
#
#
Global

BW: Report-Report-Interface
OPERATIONAL
Company Data
Group Data
STRATEGIC
BusArea Company Plan Act# #
#
#
Global
ActBudgPlan
Local 2

© SAP AG 2009. All rights reserved. / Page 80
Thank you!

Copyright 2010 SAP AGAll Rights Reserved
No part of this publication may be reproduced or transmitted in any form or for any purpose without the express permission of SAP AG. The information contained hereinmay be changed without prior notice.
Some software products marketed by SAP AG and its distributors contain proprietary software components of other software vendors.
Microsoft, Windows, Excel, Outlook, and PowerPoint are registered trademarks of Microsoft Corporation.
IBM, DB2, DB2 Universal Database, System i, System i5, System p, System p5, System x, System z, System z10, System z9, z10, z9, iSeries, pSeries, xSeries, zSeries,eServer, z/VM, z/OS, i5/OS, S/390, OS/390, OS/400, AS/400, S/390 Parallel Enterprise Server, PowerVM, Power Architecture, POWER6+, POWER6, POWER5+,POWER5, POWER, OpenPower, PowerPC, BatchPipes, BladeCenter, System Storage, GPFS, HACMP, RETAIN, DB2 Connect, RACF, Redbooks, OS/2, Parallel Sysplex,MVS/ESA, AIX, Intelligent Miner, WebSphere, Netfinity, Tivoli and Informix are trademarks or registered trademarks of IBM Corporation.
Linux is the registered trademark of Linus Torvalds in the U.S. and other countries.
Adobe, the Adobe logo, Acrobat, PostScript, and Reader are either trademarks or registered trademarks of Adobe Systems Incorporated in the United States and/or othercountries.
Oracle is a registered trademark of Oracle Corporation.
UNIX, X/Open, OSF/1, and Motif are registered trademarks of the Open Group.
Citrix, ICA, Program Neighborhood, MetaFrame, WinFrame, VideoFrame, and MultiWin are trademarks or registered trademarks of Citrix Systems, Inc.
HTML, XML, XHTML and W3C are trademarks or registered trademarks of W3C®, World Wide Web Consortium, Massachusetts Institute of Technology.
Java is a registered trademark of Sun Microsystems, Inc.
JavaScript is a registered trademark of Sun Microsystems, Inc., used under license for technology invented and implemented by Netscape.
SAP, R/3, SAP NetWeaver, Duet, PartnerEdge, ByDesign, SAP Business ByDesign, and other SAP products and services mentioned herein as well as their respective logosare trademarks or registered trademarks of SAP AG in Germany and other countries.
Business Objects and the Business Objects logo, BusinessObjects, Crystal Reports, Crystal Decisions, Web Intelligence, Xcelsius, and other Business Objects products andservices mentioned herein as well as their respective logos are trademarks or registered trademarks of Business Objects S.A. in the United States and in other countries.Business Objects is an SAP company.
All other product and service names mentioned are the trademarks of their respective companies. Data contained in this document serves informational purposes only.National product specifications may vary.
These materials are subject to change without notice. These materials are provided by SAP AG and its affiliated companies ("SAP Group") for informational purposes only,without representation or warranty of any kind, and SAP Group shall not be liable for errors or omissions with respect to the materials. The only warranties for SAP Groupproducts and services are those that are set forth in the express warranty statements accompanying such products and services, if any. Nothing herein should be construedas constituting an additional warrant.