son preference, the family-building process and child ...pdf.usaid.gov/pdf_docs/pnact461.pdf · son...
TRANSCRIPT
~ EAST·WEST CENTER
?N-ACL- 4& IEAST-WEST CENTER WORKING PAPERS
PopuladoD Series
No. 85, August 1996
Son Preference, theFamily-Building Processand Child Mortalityin IndiaFred Arnold, Minja Kim Choe, and T. K. Roy
Fred Arnold is a Senior Population Specialist at MacroInternational, Calverton, Maryland.
Minja Kim Choe is a Fellow in the Program on Population,
East-West Center, Honolulu, Hawaii
T. K. Roy is a Professor and Head of the Department of
Population Policies and Programmes, Intemational Instimtefor Population Sciences, Mumbai, India.
East-West Center Working Papers: Population Series are an
unreviewed and unedited prepublication series r<porting on
research in progress. Please direct orders and I<qUeslS to the
East·West Center's Publication Sales Office. Single copies "'"
available at no charge by surface post while supplies last.Charges for additional copies are SI.OO each. Charges for ainnaildelivery are SI.50 each within the United States and its
territories and $4.00 each elsewhere.
The Pr_ 011 PopaJadoa was established in 1969 as a unit
of the East-West Center to develop and disseminate knowledge
in the field of population. It conducts research and offersprofessional education focusing on population issues, withemphasis on the analysis of demographic and hwnan-resoun:e
trends, their social and economic causes and consequences, andtheir policy iroplications in As~ the Pacific, and the United
States.
The OffIce of PopaWIoa of tile Ullhed S_ Apaey forIlIterIIatIoaaI Developmeat IUSAlDI provided support for thispublication under a cooperative ;;agreement with the Program onPopulation of the East-West Center.

SON PREFERENCE, THE FAMILY-BUILDING PROCESSAND CHILD MORTALITY IN INDIA
Fred ArnoldDemographic and Health Surveys
Macro International Inc.Calverton, Maryland 20705
USA
Minja Kim ChoeProgram on Population, East-West Center
Honolulu, Hawaii 96848-1601USA
T. K. RoyInternational Institute for Population Sciences
Govindi Station RoadDeonar. Mumbai 400-088
ABSTRACT
India is a country with a pervasive preference for sons and one of the highest levels of excess female
child mortality in the world (female child mortality exceeds male child mortality by 43 percent). In this
paper, data from the National Family Health Survey (NFHS) are used to test the hypothesis that son
preference influences parity progression and ultimately child mortality. In particular, the survival of
female children may be adversely affected by the fact that female births are more often followed by the
birth of a younger sibling, especially after a short birth interval. The effects of family composition are
estimated with hazard models. The results show that family composition affects fertility behavior in
every state examined. The effects of family composition on excess female child mortality are more
complex, but female children with older sisters are often subject to the highest risks of mortality
/-

""".......
INTRODUCTION
A preference for sons over daughters has been found in a large number of countries, but son preference
attitudes and behavior appear to be most widespread in an arc of countries ranging from East Asia,
through South Asia, to the Middle East and North Africa.! Son preference has important social and
economic implications and it can substantially influence patterns of fertility and mortality as well. This
article examines the impact of son preference on fertility and on sex differentials in child mortality in
India, a country with pervasive son preference and a low status of women.2
The calculus of preferences for children of a particular sex can be understood by extending the
concept of the value of children to the two sexes separately. If the net utility of having a male child
outweighs that of a female child, parents are likely to prefer sons to daughters. A complex interplay of
economic and sociocultural factors determines the benefits and costs of a child.3 Studies in India have
highlighted three dimensions of the utility of having a son. The first is the economic utility, which is
mainly based on assistance in agricultural production, wage earnings, and security in the case of illness
and during old age: The social utility stems from the kinship and descent system, the status and strength
provided to the family by sons, and the premium to be expected from having a son in the form of dowry
payments.S Finally, religious utility flows from the performance by sons of important religious functions.
! United Nations, Fertility Preferenus: Selected Findingsfrom the World Fertility Survey Data (New York: United Nations,1985); John Cleland, Jane Verrall and Martin Vaessen, 'Preferences for the Sex of Children and Their Influence on ReproductiveBehaviour', World Fertility Survey Comparative Studies No. 27, International Statistical Institute (Voorburg, Netherlands,1983); Fred Arnold, 'The effect of sex preference on fertility and family planning: Empirical evidence', Population Bulletin ofthe United Nations, 23-24 (1987), pp. 44-55; Nancy E. Williamson, Sons or Daughters: A Cross-Cultural Survey ofParentalPreferences (Beverly Hills, California: Sage Publications, 1976).
2 According to the Human Development Report of the United Nations Development Program, India faIls in the boltom quarter ofall countries on both measures that are used to rank countries on the basis of the status of women (United Nations, HumanDevelopment Report (New York: Oxford University Press, 1995).
3 Fred Arnold, Rodolfo A. BUlatao, Chalio Buripakdi, Betty Jamie Chung, James T. Fawcett, Toshio Iritani, Sung Jin Lee, andTsong-shien Wu, The Value ofChildren: A Cross-National Study: Introduction and Comparative Analysis, Volume I (Honolulu:East-West Centre, 1975); Robert A. Pollak, and Susan Cotts Watkins, 'CulturaI and economic approaches to fertility: Propermartiage or mesalliance" Population and Development Review, 19 (3) (1993), pp. 467-496; Carol Vlasoff, 'The value of sons inan Indian village: How widows see it', Population Studies, 44 (I) (1990), pp. 5-20; Debra Friedman, Michael Hechter andSatoshi Kanazawa, 'A theory of the value of children', Demography, 31 (3) (1994), pp. 375-401; Rodolfo A. Bulatao, 'Valuesand disvalues of children in successive childbearing decisions', Demography, 18 (I) (1981), pp. 1-25; Thomas J. Espenshade,'The value and cost of children', Population Bulletin, 32 (I) (1977), pp. 3-47; Michael Viasoff, 'Labour demand and economicutility of children: A case study of rural Jndia', Population Studies, 33 (3) (1979), pp. 415-428.
4 A1aka M. Basu, 'Is discrimination in food really necessary for explaining sex differentials in childhood morta1ity?', PopulationStudies, 43 (2) (1989), pp. 193-210; Pranab K. Bardhan, 'Sex disparity in child survival in rural India', in T.N. Srinivasan andP.K. Bardhan (eds.), Rural Poverty in South India (OXford: Oxford University Press, 1988), pp. 472-482; M. Mamdsni, TheMyth ofPopulation Control (London: Monthly Review Press, 1972); Barbara D. Miller, The Endangered Sex: The Neglect ofFemale Children in Rural North India (Ithaca: Cornell University Press, 1981).
S Tim Dyson and Mick Moore, 'On kinship structure, female antonomy and demographic balance', Population and DevelopmentReview, 9 (I) (1983), pp. 35-60; K.M. Kapadia, Marriage and Family in India, 3rd edition (Bombay: Oxford University Press,1966); I. Karve, Kinship Organization in India (Bombay: Asia Publishing House, 1965); John C. Caldwell, P.H. Reddy and Pat
2

According to Hindu tradition, sons are needed for the cremation of deceased parents because only sons
(or, in their absence, grandsons or other male family members) can light the funeral pyre. Sons also help
in the salvation of the souls of dead parents by performing pind daan (offering food and clothing to
Brahmins and the poor) during certain times of the year.
Girls are often considered to be an economic liability because of the dowry system, as well as the
high cost of weddings, especially in higher-caste families.6 After marriage, a girl typically becomes a
member of her husband's family and her connection with the natal family is severed to a large extent
Also, it is often humiliating for parents if a suitable marriage partner cannot be found for their daughter
at an early age. Additional care needs to be taken in the case of a female child when she reaches
adolescence, because chastity is considered crucial for her marriage and to protect the honor of the
family. Hindu tradition does, however, provide some encouragement for a couple to have a daughter,
since it is a sacrament to selflessly give a daughter away in marriage (the practice of kanya daan, which
earns religious merit).
A strong preference for sons is often assumed to be a significant barrier to fertility reduction, but
the evidence concerning this link in India and elsewhere is quite mixed.7 On the one hand, parents may
exceed their overall desired family size if they have not achieved their desired combination of sons and
daughters, thereby supporting the continuation of high fertility. On the other hand, there is ample
evidence of substantial fertility decline in populations where son preference remains pervasive (for
Caldwell, The Causes ofDemographit: Change: ExperimenJal Research in South India (Madison: University of WISCOOSin Press,1989).
6 Sunita Kishor. "Gender differentials in child monality: A review of the evidence". in Monica Das Gupta., Lincoln C. Chen andT.N. Krishnan (005.), Women's Heallh in India: Risk and Vulnerability (Bombay: Oxford University Press, 1995), pp. 19-54.
7 Narayan Das, 'A simulation made110 study the effect of sex preference on current fertility', Demography India. 18 (1&2)(1989), pp. 49-72; Narayan Das, 'Sex preference and fertility bebaviour: A study ofrecenllndian data', Demography, 24 (4)(1987), pp. 517-530; Fred Arnold, 'Sex preference and its demographic and health implications',InteT7Ul1iontJJ Family PlanningPerspectives, 18 (3) (1992), pp. 93-101; Arnold, 1987,loc. cit. in In. I; Micbael A. Koenig andGi1Iian H.c. Foo, 'Patriarcby,women's status and reproductive bebaviour in rura1 North India', Demography India. 21 (2) (1992), pp. 145-166; RadbesbyamBairagi and Ray L. Langsten, 'Sex preference for children and its implications for fertility in rura1 Bangladesb', Srudhs in FamilyPlanning, 17 (6) (1986), pp. 193-210; Prem Po Talwar, 'Effect of desired sex composition in families on the birth!2te', JoumalofBiosocial Science, 7 (2) (1975), pp. 133-139; D.V.N. Sarma and Anrudb K. Jain. 'Preference about sex of cbildren and nse ofcontraception among women wanting no more children in India', Demography India. 3 (1) (1974), pp. 81-101; SuIabbaParasuraman, T.K. Roy and S. Sureender, 'Sex composition of children and fertiIity behaviour in rura1 Mabarasbtra', in K.B.Pathak, u.P. Sinha and Arvind Pandey (005.), Dynamics ofPopulation and Family Welfan (Bombay: Himalaya PublishingHonse, 1994); Chai Bin ParI<, 'How many births are attributable to preference for sex of children? A simulation analysis.' Paperpresented at the Annual Meeting of the Population Association of America, San Francisco, 3-5 Apri11986; MM. Kent and A.Larson, 'Family size preferences: Evidence from the World Fertility Surveys', Reports on the World Fertility Survey No.4(Washington, D.C.: Population Reference Bureau, 1982); Fred Arnold and Liu Zhaoxiang, 'Sex preference, fertility and familyplanning in China. Population and Development Review, 12 (2) (1986), pp. 221-246.
3

._~._._._------------- -- - - -- --- -- - - ---
example, Korea and China, as well as Indian states such as Punjab). In high-fertility societies, strong son
preference attitudes may not have much of an effect on fertility behavior since contraceptive use is low
'and most couples continue to have children irrespective of the number of sons and daughters they have
already had. Even if they do limit their family size to some extent, their childbearing decisions will
probably be independent of their mix of living sons and daughters since they are likely to have had their
minimum desired number of sons and daughters by sheer biological chance before they exceed their
desired family size. Theoretically, the impact of sex preference should increase as fertility falls. In very
low-fertility societies, however, the influence of son preference would again become muted since few
couples would have more than one or two children even if they did not have their ideal number of sons
and daughters. The effect of son preference on fertility, then, can be expected to be most evident in
countries like India where the fertility transition is well under way, but far from complete.
A preference for children of a particular sex may also affect the treatment of sons and daughters
and even their chances of survival. Son preference is believed to be the principal cause of excess female
mortality that is often manifest during childhood. Research studies suggest that parents with strong son
preference consider their daughters to be less valuable and provide inferior care in terms of food
allocation, prevention of diseases and accidents, and treatment of sick children.8 A strong preference for
sons may also lead to the practice of female feticide or infanticide.· Information on female infanticide in
8 Anne R. Pebley and Sajeda Amin, 'The impact of a public-health intervention on sex differentials in childhood mortality inrural Punjab, India', Health Transition Review, 1 (2) (1991), pp. 143-169; Basu, 1989,loc. cit. in fn. 4; Kishor, op. cit. in fn. 6;V. Paveau, M.A. Koenig and B. Wojtyniak, 'Excess female deaths among rural Bangladeshi children: An examlnation of causespecific mortality and morbidity', International Journal ofEpidemiology, 20 (3) (1991), pp. 729-735; Lincoln C. Chen,Emdadul Huq and Stan D'Souza, 'Sex bias in the family allocation of food and health care in rural Bangladesh', Population andDevelopment Review, 7 (1) (1981), pp. 55-70; Amfried A. Kielmann, Cecile DeSweemer, William Blot,lnder S. Uberoi, A.Douglas Robertson and Carl E. Taylor, 'Impact of child growth, nutrition and psychomotor development', in A.A KieImann andAssociates (eds.), Child and Maternal Health Services in Rural India: The Narangwal Experiment, Vol. 1 (Baltimore: JohnsHopkins University Press, 1983); Jocelyn Kynch and Amarlya Sen, 'Indian women: Well-being and survival', CambridgeJoumal ofEconomics, 7 (~), September-December (1983); Monica Das Gupta, 'Selective discrimination against femalechildren In rural Punjab, India', Population and Development Review, 13 (1) (1987), pp. 77-100; Michael A. Koenig and StanD'Souza, 'Sex differentials in childhood mortality in Bangladesh', Social Science and Medicine, 22 (1) (1986), pp. 15-22.Pradip K. Muhuri and Samuel H. Preston, 'Effects of family composition on mortality differentials by sex among children inMatlab, Bangladesh, Population and Development Review, 17 (3) (1991), pp. 415-434; M. Nag, 'Sex preference in Bangladesh,India and Pakistan and its effect on fertility, DemographY India, 20 (1991), pp. 163-185; James P. Philips, T.K. LeGrand, M.A.Koenig, and J. Chakraborty, 'The effect of a maternal and child health-family-planning project on infant and child mortality inMatlab, Bangladesh.' Paper presented at the Annual Meeting of the Population Association of America, Chicago, 30 April- 2May 1987; Amartya K. Sen and Sunil Sengopta, 'Malnutrition of rural children and the sex bias', Economic and PoliticalWeekly, Annual Number, May (1983); T. Nadarajah, 'The transition from higher female to higher male mortality in Sri Lanka',Population and Development Review, 19 (2) (1983), pp. 317-325.
9 M. Kaur, 'Pemale feticide - A sociological perspective', Journal ofFamily Welfare, 39 (1) (1993), pp. 40-43; Madhu Kishwar,'Abortion of female fetuses: Is legislation the answer?' Reproductive Health Matters, No.2, November (1993), pp. 113-115;Lakshmi Lingam, 'Sex detection tests and female feticidal discrimination before birth, Indian Journal ofSocial Work, 3 (1)(1991), pp. 13-19; Vibhuti Patel, 'Sex discrimination and sex pre-selection tests: Abuse of advanced technologies', in RehanaGhadiaUy (ed.), Women in Indian Society (New Delhi: Sage Publications, 1988).
4

India is very sketchy, however, and evidence of the use of sex-selective abortions is generally based
solely on institutional births, often for a single hospital. Such estimates may be seriously biased because
nearly three-quarters of all births in India still take place at home.10 When all births are taken into
account, regardless of the place of delivery, the NFHS does not support the contention that the sex ratio
of births in India has been rising dramatically over time. In fact, the sex ratio at birth for five-year periods
remained virtually constant at 106.3-106.6 males per 100 females throughout the two decades before the
1992-93 survey.ll This finding is consistent with Visaria's conclusion that 'the impact of amniocentesis
and such sex detection tests on increasing the masculinity of the Indian population is highly exagger
ated' .12 On the other hand, Das Gupta and Mari Bhat (1996) cite statistics that suggest that more than one
million additional girl§ 'went missing' between 1981 and I991 (over and above the number of missing
girls already implied by the skewed sex ratios in the 1981 Census) and that most of the shortage may be
attributable to either sex-selective abortions or unreported female infanticide.13
The impact of son preference on excess female child mortality is likely to vary with the overall
level of fertility. Das Gupta and Mari Bhat (1996) distinguish two effects that act in opposite directions
as fertility falls. 14 The first effect is the parity effect. Since high-parity female children (especially those
with older sisters) face particularly high risks of mortality, daughters should benefit when parents avoid
high-parity births. However, the authors conclude that in India the intensification effect, which entails
increased discrimination against girls at lower levels offertility, more than offsets the positive influence
of the parity effect as fertility falls. Others have argued that excess female child mortality should fall as
fertility declines since parents with few children should be better able to provide adequate nutrition and
proper medical care to all of their children, regardless of their sex. Tabutin and Willems (1995) cite
evidence to support this argument in developing countries, but for the 19705 and 19805 they found that
excess female child mortality only disappears at very low levels of mortality.15
10 International Institute for Population Sciences (lIPS), National Family Heahh Survey (MeH and Family Planning). India1992-93 (Bombay: lIPS, 1995), Table 9.5.
\I lIPS,op. ciL in in. 10, Table D.4.
12 Leela Visaria, 'Deficit of women, son preference and demographic transition in !ndia.' Paper presented at the InIemationa1Symposinm on Issues Related to Sex Preference for Children in the Rapidly Changing Demographic Dynamics ofAsia. SeouI.21-24 November 1994, p. 7.
13 Monica Das Gupta and P.N_· Ma"riBbal, 'Intensified gOnder bias in India: A consequence of fertility decline.' Paper presentedat the Annual Meeting of the Population Association of America, New Orleans, 9-11 May 1996.
14 Das Gupta and Mati Bbal, Ioc. cit. in fit. 13_
IS Dominique Tabutiu and Micbel Willems, 'Excess female child mortality in the developing world during the 1970. and 1980s',Populalion Bulletin ofthe United Nations, 39 (1995), pp. 45-78_
5

~ ~~·~"~-__- '''" 'W_MU,".." ....... n '_"'m ,=="'~._ ...~.. ~.~~~~ ..~.._",.~ .. ,.,.,,,,",,,.. ~ _
In addition to the direct mortality effect of the preferential treatment of sons, son preference can
result in excess female child mortality through a couple's family-building behavior. There are two
principal mechanisms through which family-building processes can adversely affect the survival chances
of daughters. First, female children may experience increased mortality because their birth is more likely
to be followed after a short interval by the birth of a younger sibling. Mortality risks during childhood
have consistently been found to be positively related to short birth intervals.16 At the national level in
India, the median birth interval following a female birth is one month shorter than the median birth
interval following a male birth, and very short birth intervals are slightly more common following a
female birth. 17 The second effect of the family-building process on female child survival is a conse
quence of the emploYIllent of stopping rules in childbearing decisions. If a couple keeps having children
until they have a son (or in some cases two sons, to allow for the uncertainty caused by high childhood
mortality), female children wil1, on average, have more siblings than male children.IS The larger size of
their families, in turn, may result in an environment where there is more competition for the available
resources and where infectious diseases ate spread more easily. Therefore, some of the excess female
mortality that has been observed during childhood may be an inadvertent consequence offamily-building
processes that are based on a strong underlying preference for sons.
The levels of mortality and household income are additional factors that ate expected to
influence the interrelationships between son preference, the family-building process, and excess female
child mortality. A recent study in Bangladesh, Egypt, and South Korea found that in Bangladesh and
Egypt, where mortality is high, family-building behavior is a rather weak predictor of excess female child
mortaiity.I9 In South Korea, however, the family-building process explains excess female mortality
16 Pavalavalli Govindasamy, M. Kathryn Stewart, Shea O. Rutstein, J. Ties Boorma and A. Elisabeth Sommerfelt, 'High-riskBirths and Maternity Care', DHS Comparative Studies No.8 (Columbia, MaI)'land: Macro International, 1993); J. Hobcraft,J.W. McDonald and S.O. Rutstein, 'Demographic determinants of infant and early childhood mortality: A comparative analysis',Population Studies, 39 (3) (1985), pp. 363-386; Robert D. Retherford, Minja Kim Choo, Shyam Thapa and Bhakta B. GUbhaju,'To what extent does breastfeeding explain birth-interval effects on early childhood mortality?' Demography, 26 (3) (1989), pp.439-450; Pradip K. Muhuri and Jane A. Menken, 'Excess mortality of young girls in rural Bangladesh: An investigation of thecircumstances of greatest jeopardy.' Paper presented at the Anonal Meeting of the Population Association of America,Cincinnati, 1-3 Aprlll993; A Palloni and S. Millman, 'Effects of inter-birth intervals and breastfeeding on infant and earlychildhood mortality, Population Studies, 40 (1986), pp.215-236.
17 lIPS, op. cit. in fn. 10, Table 5.14.
IS Chai Bin Park and N.-H. Cho, 'Consequences of son preference in low-fertility countries in East Asia: Rising imbalance of sexratio at birth', Population and Development Review, 21 (I) (1995), pp. 59-84; Kazuo Yamaguchi, 'A formal theory for malepreferring stopping rules on childbearing: Sex differences in birth order and in the number of siblings', Demography, 26 (3)(1989), pp. 451-465.
19 Minja Kim Choo, Ian Diamond, Fiona Alison Steele, and Seung Kwon Kim, 'Son preference, family building process, andchild mortality', in United Nations, Too Young to Die: Genes or Gender? (New York: United Nations, 1996, forthcoming).
6

almost entirely. Presumably, in South Korea, high income and small family size allow parents to afford
high-quality child care for both daughters and sons even though son preference is pronounced. In Egypt
and Bangladesh, however, where parents are more constrained by limited resources, the preference for
males may cause parents to allocate resources preferentially to their sons.
In this article, we test the hypothesis that son preference influences parity progression and
ultimately child mortality, and that the impact of son preference varies according to the overall levels of
fertility and mortality. In particular, the analysis estimates the effect of the sex of the last child and the
sex composition of other surviving children on the probability ofhaving another child, controlling for the
survival status of the last child and other demographic and socioeconomic characteristics of women. The
model used for analyzing child mortality is similar to the above model except that fertility behavior is
included as an additional predictor.
India provides an ideal situation for exploring these relationships within the borders of a single
country. Son preference is culturally imbedded in Indian society, but its strength varies substantially from
one part of the country to another. Variations in fertility and mortality (as well as sex differentials in
infant and child mortality) are equally impressive. Below-replacement level fertility is found in two
states, but fertility remains high in many regions of the country. Similarly, infant and child mortality rates
are several times as high in some states as in other states. Another advantage of focusing on India is the
availability of a recently completed national survey that provides high-quality, up-to-date information on
all of the key variables required for the analysis, separately for eacb of the major states. The data set is
described in more detail in the next section. The following sections describe differences among states in
female and male mortality, the reasons for selecting particular states for this study, a profile of the
selected states, and the methods used in the study. The results of the multivariate analysis are then
discussed and the policy implications of the findings are outlined in the final section
SOURCE OF DATA
The data analyzed in this article come from the 1992-93 National Family Health Survey of India
(NFHS). The NFHS is a nationally representative sample survey, which was conducted in 25 states that
include more than 99 per cent of India's population. Interviews were conducted with 89,777 ever-married
women age 1349 in 88,562 households. The households covered in the survey included more than
500,000 residents. The sample selection was based on a systematic, multistage, stratified sample design.
The samples for Orissa, Uttar Pradesh, and Haryana are weighted; the samples for the other Stales
7

.~--~----_._._~~..•.._.._.•.•_._----_.•_ _ ,. ,.,. _.
included in this article are self-weighting.20 The NFHS project was initiated by the Ministry of Health
and Family Welfare and coordinated by the International Institute for Population Sciences in Bombay.
Overall, 30 organizations were involved in the survey, including 18 Population Research Centres and 7
private-sector survey research companies. Macro International and the East-West Center provided
technical assistance for the NFHS, which was funded by the U.S. Agency for International Development.
The questionnaires for the NFHS were based on the core questionnaires from the Demographic
and Health Surveys, modified to meet Indian conditions and the needs of policy makers and programme
planners. The major topics covered in the survey include fertility, marriage patterns, family size
preferences, the level of unwanted fertility, knowledge and practice of family planning, the potential
demand for contraception, use of antenatal care services, breastfeeding and food-supplementation
practices, child health and nutrition, vaccinations, and infant and child mortality. In addition, state
specific questions were added in most states on topics of interest to policy makers and researchers. These
included such topics as AIDS awareness, dowry, child marriage, sex preference for children, sex
preselection, and international migration.
SEX DIFFERENTIALS IN MORTALITY
In most populations at almost all ages, males have higher mortality than females.21 However, in South
Asia, female mortality has typically been fonnd to be higher than male mortality in many age groupS.22
The National Family Health Survey found higher age-specific mortality rates for females than males in
every five-year age group from age 0-4 through age 30-34 for 1991_92.23 This pattern is consistent with
the fmdings of the Sample Registration System (SRS) for the same years for every age group except age
30-34. Overall, the crude death rate was slightly higher for males than for females in the NFHS (10.0 vs.
9.4 per 1,000) and the same for males and females in the SRS (10.0 per 1,000). According to the SRS, the
life expectancy at birth was slightly higher for males than females in 1970-80, but female life expectancy
'" Tables for Orissa, Uttar Pradesh, and Haryaoa use sample weights, except for the hazard analysis tables, which are unweightedfor all stales.
21 L. Heligman, 'Patterns of sex differentials in mortality in less developed countries', in A.D. Lopez and L.T. Ruzicka (eds.), SexDifferentials in Mortality: Trends, Detenninants and Conseqwmces (Canberra: The Australian National University, 1983), pp.7-32.
22 Samuel H. Preston, 'Mortality in India' , in International Union for the Scientific Study of Population (IUSSP), IntemotionalPopulation Conference, New Delhi. 1989,4 (Liege: IUSSP, 1990), pp. 81-86; Shanti Ghosh, 'The female child in India: Astruggle for survival', Bulletin ofthe Nutrition Foundation ofIndia, 8 (4) (1987); Pebley and Amin,loc. cit. in fo. 8.
23 UPS, Ope cit. in fo. 10, Table 8.3.
8

exceeded male life expectancy for the first time in 1981-90.24
Sex differentials in mortality are of particular interest for children under five years of age. The
NFHS estimates slightly higher infant mortality rates for males (89 per 1,000 births) than for females (84
per 1,000 births), but the mortality disadvantage for males in the neonatal period turns into a mortality
disadvantage for females in the postneonatal period (see Figure 1). The female survival disadvantage
increases dramatically for children age 1-4 years. Child mortality for females (42.0 per 1,(00) is 43 per
cent higher than child mortality for males (29.4 per 1,(00). The magnitude of the sex differential in child
mortality is striking when compared to the usual pattern in less-developed countries. It is, in fact,
common for female child mortality to exceed male child mortality in less-developed countries but the
differences are usually very small (on average, only 2-3 per cent). Out of 46less-developed countries for
which we have comparable information from the Demographic and Health Surveys, 26 countries have
higher child mortality for females than for males, but only two countries (Egypt and Pakistan) exhibit a
more lopsided survival disadvantage for girls in that age groUp.2S
Moreover, the situation is much more serious in Northern India than in Southern India. Table 1
shows sex differentials in child mortality for the 19 NFHS states with samples of more than 2,500
women. Only two states (Kerala and Tamil Nadu) have higher child mortality for males than for females.
In every other state, female child mortality exceeds male child mortality by at least 11 per cent. Excess
female child mortality exceeds 50 per cent in eight states, which are mostly in the Northern Region. The
worst case is Haryana, where female child mortality is nearly 2-1/2 times as high as male child mortality.
The regional averages, shown in Figure 2, indicate that excess female child mortality is most pronounced
in the Northern Region and is also extremely high in the Eastern and Central Regions. On the other hand,
no state in Southern, Western, or Northeastern India has a level ofexcess female child mortality higher
than the national average.
24 Office of the Registrar General, India (ORGI), 'SRS Based Abridged Life Tables - 1986-90', Occasional Paper No. 1of 1994(New Delhi, 1994).
25 Jeremiab M. Sullivan, Shea Oscar Rutstein, and George T. Bicego, 'Infant and Chi1d Mortality', Demograpltic and HealthSurveys Comparative Studies No. 15 (Calverton, Maryland: Macro InternationaI, 1994); unpuhlished DHS data; In a review oflife tables for 30 more developed COlDltrieS, the United Nations did not find any countries with higher female than male childmortality (United Nations Secretariat, 'Sex differentials in life expectancy and mortality in developed countries: An analysis byage groups and causes of death from recent and historical data', Population Bulletin ofthe United Nations, 25 (1988), pp. 65107).
9

---~---------_.._-------_._._ .
Table 1. Child mortality by sex
Excess femaleState Male Female child mortality (% )
India 29.4 42.0 43
NorthDelhi 13.6 21.2 56Haryana 18.4 43.2 135Himachal Pradesh 17.6 25.3 44Jammu Region of J&K 14.5 24.5 69Punjab 12.7 23.0 81Rajasthan 26.5 42.2 59
CentralMadhya Pradesh 46.7 56.8 22Uttar Pradesh 38.5 65.6 70
EastBihar • 34.5 53.5 55Orissa 16.1 23.4 45West Bengal 21.7 35.4 63
NortheastAssam 52.9 59.6 13
WestGoa 7.5 8.3 11Gujarat 27.1 38.6 42Maharashtra 19.1 23.6 24
SouthAndhra Pradesh 21.5 27.6 28Karnataka 25.6 33.4 30Kerala 10.0 9.4 -6Tamil Nadu 29.0 23.2 -25
STATE PROFILES
Indian states vary dramatically on the key variables included in this article. Eight states, comprising 40
per cent of India's population, have been selected for the analysis. These states were selected to represent
a wide range of conditions on the basis of their fertility and mortality levels, the strength of son
preference attitudes and behavior, and the level ofexcess female child mortality.
Basic demographic and health indicators for these states are shown in Table 2. The degree of
heterogeneity on all of the variables examined is striking. All of the states have predominantly rural
populations, but the percentage of the population living in urban areas varies from only 13 per cent in
Orissa to 41 per cent in Goa. Several measures of education demonstrate the high level of female
illiteracy in most states and continuing discrimination against school-age girls in the utilization of
10

70
1·~eJ I6057 .Female
50
40
~ 30~
~20
10
0Neonatal Postneonatal Child
«I month) (I-U months) (1-4 years)
Figure 1. Infant and child mortality by sex of child
100
80 74
60
40
20
oNonhIndia
EastIndia
CentralIndia
WestIndia
Lessdevelopedcountries
Figure 2. Average excess female child mortality by region
11

Table 2. State profJIes
Tamil UttarGoa KeraIa Nadu Punjab Orissa Haryana Rajasthan Pradesh
Percent urban (1991) 41 26 34 30 13 25 23 20
Percent of EMW illiterate 34 16 50 53 67 64 82 76
Percent illiterate (PIM) 2.30 1.75 1.91 1.41 1.88 1.95 1.88 1.88
Percent in school (p1M) 0.98 1.00 0.92 0.93 0.81 0.86 0.55 0.63
Percent not exposed to 15 21 22 35 61 40 70 65media
Infant mortality rate 32 24 68 54 112 73 73 100Total fertility rate 1.9 2.0 2.5 2.9 2.9 4.0 3.6 4.8Percent of women age 7 19 36 15 46 57 70 64
20--24 married beforeage 18
SMAM for females 25.1 22.1 20.5 21.\ 20.7 18.4 18.4 18.6
CPR 48 63 50 59 36 50 32 20
Sex preferred for next 2.0 1.6 1.7 10.5 5.3 9.6 8.5 5.0child (boy/girl)
Ideal boys/ideal girls 1.3 1.2 1.3 1.7 1.4 1.6 1.7 1.5Wants no more (2B/2G) 1.5 1.\ 1.3 4.0 2.3 9.9 8.6 3.3Using FP (2BI2G) 1.2 1.1 1.3 2.0 2.6 2.5 5.9 2.8Fully vaccinated (GIB) 1.01 0.95 0.91 0.79 0.90 0.88 0.79 0.76Prevalence of three 0.87 0.85 1.00 0.84 0.95 0.83 0.95 0.91
diseases (GIB)
Percent of children taken 1.03 0.92 0.94 0.98 0.86 0.96 0.81 0.93to health facility (GIB)
Median duration of 1.25 0.91 1.08 0.91 1.04 0.81 0.83 0.93breastfeeding (GIB)
Percent undernourished 0.95 0.99 1.\3 1.05 0.99 1.\5 0.92 0.93(GIB)
Percent severely under- 0.83 1.33 1.30 1.10 1.05 1.45 1.05 0.94nourished (GIB)
BMW = ever-married women, F = female, M = male. SMAM = singulate mean age at maniage,CPR= contraceptive prevalence rate, B = boy, G = girl, FP = fantily planning
educational services. The majority of ever-married women in their childbearing years are illiterate in all
states except Kerala and Goa. Female literacy is particularly low in Rajasthan and Uttar Pradesh, where
more than three-quarters of respondents are illiterate. Past discrimination in education is evident from a
comparison of female and male literacy rates for the population age 6 and above. In every state, illiteracy
12

is much higher for females than for males. In six of the eight states, the ratio of female to male illiteracy
varies within the narrow range of 1.75-1.95. The unusually high differential in Goa should be interpreted
in light of the fact that overall literacy levels for both males and females are quite high in Goa.
All states have experienced considerable progress in literacy and educational attainment over
time, but equality has still not been achieved in most states. The Indian constitution set a goal of
providing free and compulsory education to all children below age 15 within 10 years, but most states are
still far from achieving that objective. In fact, more than one-third of school-age children in India do not
attend school.26 Moreover, a substantial gap between female and male school attendance still exists in
most of the states (Table 2). In Kerala and Goa, female school attendance rates are similar to the rates for
males, and females are only slightly behind in Punjab and Tamil Nadu. At the other end of the spectrum.
female school attendance rates are only about half as high as male rates in Rajasthan and the situation is
not much better in Uttar Pradesh. Not surprisingly, these two states also have unusually high levels of son
preference.
Mass media can also provide an educational function and can be used to disseminate messages
about health and family planning, but the reach of mass media is very limited in some states. In
Rajasthan, Uttar Pradesh, and Orissa, more than 60 per cent of women are not regularly exposed to the
electronic mass media (radio, television, or movies). Since a large majority of women in those states are
also not literate, they cannot be reached through the print media either. Exposure to electronic mass
media is relatively high in Goa and in the southern states of Kerala and Tamil Nadu.
Infant mortality rates are several times as high in Orissa and Uttar Pradesh as in Goa and Kerala.
In the remaining states, infant mortality rates are moderate, with 5-7 per cent of children dying before
their first birthday.
Variations in fertility levels are also large. Two states, Kerala and Goa, have already achieved
below-replacement fertility, and Tamil Nadu is well on its way to reaching that goal. On the other hand,
in the highest-fertility state, Uttar Pradesh, women can be expected to have an average of nearly five
children by the end of their childbearing years. Fertility is also relatively high in Haryana and Rajasthan.
It is interesting to note that high fertility rates and high infant-mortality rates go hand-in-hand. The only
exception is Orissa, which has achieved a below-average level of fertility despite the fact that the state
has had the highest level of infant mortality in India for many years. A recent study of the causes of high
26llPS,op. cil. in fu. 10, Table 3.10.
13

infant mortality in Orissa attributed the large number of infant deaths to poverty, illiteracy, superstitious
attitudes, and a number of environmental factors.27
Fertility has been declining over time throughout India, even in high-fertility states such as Uttar
Pradesh. This reduction has been spurred by a rapid increase in the use of effective family planning
methods and a substantial increase in the average age at marriage. Marriages at very young ages are
becoming rare in India, but a substantial proportion of women still marry below the legal minimum
marriage age of 18 years. Well over half of all women in the 20-24 age group were married before age
18 in the high-fertility Hindi-belt states of Rajasthan, Uttar Pradesh, and Haryana. The singulate mean
age at marriage (SMAM) for females is also relatively low (18.4-18.6 years) in these three st3tes. The
SMAM is 2-4 years higher in Tamil NOOu, Orissa, Punjab, and Kerala. Goa stands out as having the
highest age at marriage in India. Women in Goa marry, on average, at age 25, and men in Goa are
typically more than 30 years old when they marry for the first time. Because of its particularly old age at
marriage, Goa has managed to achieve very low fertility with only a moderately high level of
contraceptive use. The contraceptive prevalence rate is around 60 per cent in Kerala and Punjab and 50
per cent in Tamil NOOu, Haryana, and Goa The low levels of contraceptive prevalence in Uttar Pradesh
and Rajasthan are notable in view of India's history of large-scale family planning efforts over a period of
more than four decades.
A persistent preference for sons throughout India can been seen by examining the NFHS data on
the stated attitudes of respondents, their fertility and family planning behavior, and their treatment of
sons and daughters (Table 2). Women who want another child are much more likely to opt for a son than
a daughter in all of the states. The ratio of the number who prefer a son to the number who prefer a
daughter is high (1.6-2.0) in Kerala, Tamil Nadu, and Goa, much higher (around 5) in Uttar Pradesh and
Orissa, and remarkably high (8.5-10.5) in the remaining three states. The preference for sons is
corroborated by the responses to a question on how many girls and boys a woman would want if she
could start over and have just the number ofchildren she wanted. The ideal number of sons exceeds the
ideal number of daughters by 20-70 per cent in every state, but the preference for sons is once again
relatively low in Kerala, Goa, and Tamil Nadu. FmaIIy, son preference can be measured by the extent to
which the desire for more children depends on the current sex composition of a couple's living children.
In Table 2, this measure is simplified by focusing on women with exactly two living children, and
comparing those with two sons and two daughters. As expected. women with two sons are much less
n Institute for Research in Medical Statistics (IRMS), Causes 0/Infant DeoJhs in Orissa: Project Repon (New Delhi: IRMS,Indian Council of Medical Research, 1993).
14

---,-~------~~~"~.. --_•.•.._----_._-_ _- .
likely to want to have at least one more child than women with two daughters. On all three measures of
attitudes, Haryana, Rajasthan, and Punjab stand out as having the strongest son-preference attitudes. Son
preference can also affect family planning behavior. In every state, women with two sons are more likely
to use contraception than women with two daughters. According to this measure, son preference is
relatively weak among women in Kerala, Goa, and Tamil Nadu, and is most influential in Rajasthan.
The strong preference for sons in many states can ultimately lead to discrimination against
female children. The NFHS contains a considerable amount of information on the treatment of young
children according to their sex. All of the sex discrimination measures shown in Table 2 are measured as
ratios of the estimate for female children divided by the estimate for male children. Medical care and
feeding practices are the two areas that have received the most attention as determinants of sex
differentials in infant and child mortality. In India as a whole, male children have a slight, but consistent,
advantage over female children in immunization coverage for each of six major vaccine-preventable
childhood diseases. In Goa, among children age 12-23 months, girls and boys are equally likely to have
received all of the recommended vaccinations. Some discrimination against girls is evident in all of the
other seven states, but the disadvantage is particularly striking in Uttar Pradesh, Punjab, and Rajasthan
where full vaccination coverage for girls is less than 80 per cent as high as the coverage for boys.
Health care for children was also assessed by measuring the prevalence and treatment of
childhood diseases. Mothers were asked if each of their children under age 4 was sick with a cough
accompanied by rapid breathing (symptoms of acute respiratory infection), fever, or diarrhea in the two
weeks before the survey. Girls were reported to be less likely to suffer from each of these conditions,
although questions can always be raised about whether mothers recognize these problems in their
daughters as readily as they do in their sons. When girls do become ill, however, they are less likely than
boys to be taken to a medical facility or medical practitioner for treatment in every state except Goa.
Discrimination against girls in medical treatment is particularly evident in Rajasthan and Orissa.
It has been amply demonstrated that in South Asia boys are often given preference in the amount
and quality of food they consume. Although a complete assessment of feeding practices for girls and
boys is beyond the scope of this analysis, Table 2 contains a relative measure of the median duration of
breastfeeding for girls and boys. Girls are breastfed longer than boys in three states and shorter in the
rest. The length of breastfeeding is much shorter for girls than for boys in Haryana and Rajasthan.
Poor nutritional intake and the persistence of untreated diseases can take their toll on the growth
and development of children. In the NFHS, children under age 4 were weighed and measured to assess
their nutritional status. Three standard measures of nutritional status were used to assess the prevalence
15

of chronic and acute undernutrition-height-for-age, weight-for-age, and weight-for-height. The
distribution of Indian children on these three measures was compared to an International Reference
Population recommended by the World Health Organization.28 This reference population has been found
to be applicable to Indian children.29 Children who fall more than 2 standard deviations below the median
of the International Reference Population are considered to be moderately undernourished, and those
who fall more than 3 standard deviations below the median are defined as severely undernourished..In
general, children who are moderately undernourished are three times as likely to die as well-nourished
children, and for those who are severely undernourished the risk of mortality is eight times as high.30 The
overall levels of undernutrition in India are among the highest in the world?' Among the states, girls in
Tamil Nadu and Harylllla are much more likely than boys to be moderately and severely under
nourished.32 Girls are also somewhat disadvantaged in Punjab and they are much more likely than boys to
be severely undernourished in Kerala. It should be noted that Tamil Nadu and Kerala have very low
proportions of severely undernourished children so that the sex differentials appear exaggerated in
comparison with those of other states.
Based on the indicators in Table 2, it is possible to divide the eight states loosely into three
groups. Kerala and Goa are marked by relatively high literacy and media exposure, low fertility and
mortality, a high age at marriage, a weak preference for sons, and fairly equal treatment ofboys and girls.
Tamil Nadu is approaching these states in many respects and for most purposes should be included in the
same group. At the opposite extreme, Rajasthan and Uttat Pradesh are characterized by low literacy and
media exposure, high fertility and mortality, a young age at marriage, a strong preference for sons, and
discrimination against girls. The remaining states (Haryana, Orissa, and Punjab) fall in the middle.
28 MJ. Dibley, J.B. Goldsby, N.W. Staebling and F.L. Trowbridge, 'Development ofnonnalized curves for the intematiooalgrowth reference: Historical and technical considerations', American JoumtJ! ofClinical Nutrition, 46 (5) (l987a), pp. 736-748;MJ. Dibley, N.W. Staehling, P. Neiburg and F.L. Trowbridge, 'Interpretation of z·score anthropometric indicators derived fromthe internatiooal growth reference', American JoumtJ! ofClinkaJ Nutrition, 46 (5) (19ll7b), pp. 749-762.
29 K.N. Agarwal, D.K. Agarwal, D.G. Benakappa, S.M. Gupta, P.C. Khanduja, S.P. Khatua, K. Ramachandran. PM. Udani andC. Gopalan, Growth Perfonnonce ofAffluent Indian Children (Under·jives): Growth Standardfor Indian Children (New Delhi:Nutrition Foundation of 1ndia, 1991).
30 UNICEF, The Progress ofIndian States: 1995 (New Delhi, 1995).
31 lIPS, op. cit. in fn. 10; A. Elisabeth Sommerfelt and M. Kathryn Stewart, 'Children's Nutritiooal SIalUS', DHS ComparativeStudies No. 12 (Calverton, Maryland: Macro International, 1994).
32 In Tamil Nadu, where children's height was not measured, undernutrition is based only on the weight·for-age measure. In allother states, the estimates are based on average levels of undernutrition on all three measures (height-for-age, weight-for-age, andweight-for-height).
16

Punjab is similar to Tamil Nadu in many respects, but it has been placed in the middle group because of
its distinctly higher level of son preference.
MULTIVARIATE ANALYSIS METHODS
In this article, the effects of family composition on parity progression and child mortality are estimated
with hazard models. The questions we ask are: (I) After the birth of a child, does the probability of
having an additional child within five years depend on the sex of the previous child and the sex
composition of other older siblings? and (2) Is a child's probability of dying between ages 1 and 5
affected by the child's sex and the sex composition of older siblings in the family? We answer these
questions by comparing the monthly probabilities of having an additional child and the probabilities of a
child dying for women with children of a given sex composition relative to the probabilities of the
reference group.
Children are classified into three groups by the total number of surviving children in the family at
the time of their birth: one, two, and three or more. For the fertility analysis, the number of classifications
in high-fertility states is extended to four or five, depending on the overall level of fertility in each state.
For each family size, a theoretically desirable sex combination of children is chosen as the reference
groUp.33 For women with one child, one son is the reference; for women with two children, one daughter
followed by a son is the reference; and for women with three or more children, the reference group is a
family whose last child is a son and whose other children include both boys and girls. For each group of
children, two models are estimated. The gross-effects model includes only the sex of the last child and
the sex combination of siblings. The net-effects model includes additional factors likely to have a strong
effect on fertility and child mortality. We limit the factors to those that are commonly relevant in all of
the states we analyze. These are mother's place of residence, mother's literacy, year of birth of the last
child, maternal age, preceding birth interval, and birth order. For the analysis of parity progression, the
experience of child death is also included. This is coded as a time-dependent step function changing its
value from 0 to 1 at 12 months after the death of any child. For the analysis of child mortality, the birth
of a younger sibling is added to the model. This is coded as a time-dependent step function changing its
value at the time of birth of the sibling. For the reference groups, the probability of having another child
33 The reference groups do not necessarily represent the sex composition that is empirically found to be most desirable. Theselection of reference groups is arbitrary and does not affect the adjusted percentages that are analysed in the following sections.
17

within five years and of child mortality are both estimated by a life-table method applied to the group.
The relative risks estimated by the hazard models are applied to the probabilities of the reference group
to provide estimated parity progression rates and child mortality rates for the remaining groups.
PARITY PROGRESSION
The effects offamily composition on parity progression are summarized in Table 3. The table shows the
adjusted percentages of children who experience the birth of a younger sibling within five years.
controlling for the effects of other factors (Appendix Tables AI-A8 show more detailed results of the
fertility and mortality analyses.) In states with a total fertility rate ofless than 3.0. the analysis is
combined for farnilies-with three or more children. In Haryana and Rajasthan. which have total fertility
rates of about four children. farnilies with four or more children are shown separately. In Uttar Pradesh.
with a total fertility rate of nearly five. one additional group is included in the analysis. It is important to
include the larger family size groups in high-fertility states since the impact of sex preference may be
somewhat muted at low parities in those states because a large majority of couples continue childbearing
regardless of the sex composition of their children. The full effect of sex preference in those states may
not appear until the higher parities.
The effects of family composition on parity progression are statistically significant in all of the
states. In general. women who have no sons are more likely to proceed to have an additional child than
those with at least one son. Kerala is the only state that does not exhibit son preference at any parity.
Among women with two children in Kerala, parity progression is higher for women with two boys or two
girls than for women with one boy and one girl. indicating a desire for at least one child of each sex.
In every state. the large majority of women with one child go on to have another child within the
five-year period irrespective of the sex of the first child. For women with two children. substantial sex
differences in parity progression are evident At that parity. in every state except Kerala, women with two
daughters are much more likely to have another child than women with any other sex combination of
children. In the five northernmost states. women with two sons are least likely to have another child,
confirming the perceived importance of having at least two male children in those states. With the
exception of Punjab. these are also the five states with the highest under-five mortality rates.34 High
mortality rates in these states undoubtedly add to the desire of couples to have more than one son to
insure the survival of at least one son into their old age.
34 lIPS. op. cit. in fn. 10, Table 8.8.
18

-~--,------- ---,
Table 3. Adjusted percentage of children who experience the birth of a younger sibling before age5, by sex oflast child and sex composition of older siblings (net effects)
Number of cblldrenl Tamil Uttar
Sex composition Goa Kerala Nadu Punjab Orissa Haryana Rajastban Pradesh
Onecblld77 78 83 93 83 91 86 90
M with no sibling 82 78 85 94 87 91 90 92F with no sibling
Two childrenM with a male sibling 53 49 59 53 70 71 77 80M with a female sibling 50 41 64 70 78 81 84 83F with a male sibling 50 35 54 71 74 84 82 84F with a female sibling 72 48 77 81 86 89 88 89
Three or more childrena
M with all male siblings 33 39 45 38 50 43 57 72
M with male and female siblings 30 34 33 30 45 42 61 72
M with all female siblings 49 36 40 55 61 70 75 78F with all male siblings 24 36 30 28 47 47 55 71F with male and female siblings 41 39 35 55 55 70 73 81F with all female siblings 59 44 56 74 72 80 81 84
Four or more childrenb
M with all male siblings 51 52 66M with male and female siblings 41 50 67M with all female siblings 69 69 72
F with all male siblings 48 46 64
F with male and female siblings 59 58 72
F with all female siblings 90 77 79
Five or more childrenM with all male siblings 68M with male and female siblings 64M with all female siblings 83F with all male siblings 67F with male and female siblings 69F with all female siblings 72
Note: Adjustments are made by proportional hazard models using sex of last child, number and sex composition of siblings,urban residence, mother's literacy, year of birth of last child, mother's age, child death, previous birth interval (when applicable),and birth order as covatiates. The BMDP2L program was used for the estimation.
aExactly three children for Haryana, Rajasthan, and Uttar Pradesh
bExactly four children for Uttar Pradesh
At third and higher parities. ,women with no sons are most likely to continue childbearing in
every state. Women with at least two sons are generally least likely to continue. However, in no state are
women with all sons the most likely group to stop bearing children. This suggests that there is at least a
modicum of interest in having a mix of sons and daughters among one's children. In most cases, the
second highest parity-progression ratios are for women who had a son as their fIrst child, followed by a
19

string of daughters. This is yet another indication of the importance of having at least two sons in many
families.
Overall, the effects of family composition on parity progression are strongest in Punjab and
Haryana, which are the states with the strongest son-preference attitudes. The effects of family
composition are least evident in Kerala, Tamil Nadu, and Uttar Pradesh. In general, there is a tendency
for the effect of sex preference on parity progression to be strongest in states with a moderate level of
fertility, but the paf:lem is not sufficiently consistent to establish definitively a U-shaped relationship with
the level offertility.
Although the other predictors in the hazard models are not the main focus of this article, their
influence on parity progression is generally statistically significant, consistent across stales, and in the
expected direction. In particular, wom~n are generally much less likely to continue childbearing if they
are literate, older, and live in urban areas (see Table A.S). They are also less likely to have another child
if they have had a recent birth and much more likely to continue childbearing if they have experienced a
child death.3s
CHILD MORTALITY
The effects of family composition on child mortality are summarized in Table 4 in terms of adjusted
child-mortality rates. In Goa, Kerala, and Punjab, because of the very low level of child mortality
coupled with relatively low fertility, there were not enough deaths to estimate the effects separately by
number of children, and the estimation had to be based on combined family sizes. For Goa and Kerala all
family sizes are combined, and for Tamil Nadu women with one child and two children are combined.36
"The effect ofchild mortality is estimated by using a time dependent dummy variable indicating lbe experience of death of anyof lbe cbiJdren wbo were surviving at !be time ofbirth of lbe last child, including !be last (index) cbiJd. We also calculatedmodels wilb two dummy variables, one indicating !be death of lbe index cbiJd and one indicating !be death of any of !be oldersiblings. The second model sbowed !bat most of !be effect of child death is associate wilb !be death of !be index cbiId; !be deathof an older sibling has only weak effects !bat are often not statistically significanL Most of !be cbiJdren wbo died are also !beindex cbiJdren. For example, among women wilb five or more surviving cbiJdren in Uttar Pradesh, 14 per cent experienced !bedeath of a cbiJd during !be five yean; after the birth of !be last child, and 79 per cent of !be deaths were among !be fifth cbiJdren.Estimates of lbe effects ofother covariates from two models were nearly identicaL
36 In these cases, adjusted child mortality in Table 4 is calculated by applying lbe same factors for male-female differences at eachrelevant parity, but using different mortality estimates for the reference category from Table A3.
20

----,------------------_.
Table 4. Adjusted child mortality by sex of last child and sex composition of older siblings (neteffects)
Number of childreol Tamil UttarSex composition Goa Kerala Nadu Punjab Orissa Haryana Rajasthan Pradesh
One childM with no sibling 8 2 8 7 10 18 26 34F with no sibling 6 2 16 9 11 28 30 47
Two childrenM with a male sibling 5 12 20 15 17 19 18 38M with a female sibling 5 12 13 15 10 16 17 30F with a male sibling 4 10 14 19 34 25 41 53F with a female sibling 4 10 13 19 18 47 31 48
Three or more children 14 16 17 15 9 26 26 39Mwith all male siblings 14 16 27 21 18 13 23 31Mwith male aod female siblings 14 16 27 16 16 10 14 29M with all female siblings10 13 7 29 18 27 27 66F with all male sibliogs 10 13 30 19 30 34 30 69F with male aod female siblings10 13 33 46 37 30 48 39F with all female siblings
Note: Adjustments are made by proportional hazard models using sex of last child, sex composition of siblings, urban residence,mother's literacy, year of birth of last child, mother's age, previous death of a sibling, short preceding birth interval, birth order,and birth of next child. The BMDP2L program was used for the estimation.
In three states (Goa, Kerala, and Tamil Nadu), there is no significant effect of sex composition
on child mortality. Furthermore, in Kerala and Goa, male child mortality is slightly higher than female
child mortality after adjustments (as observed in most low-mortality populations). Considering that there
was no evidence of son preference in fertility behavior in Kerala, the pattern of child mortality found in
that state may represent the natural pattern in the absence of son preference. However, the small number
of child deaths in the Kerala data requires that these results should be interpreted cautiously.
In Punjab, Rajasthan, Uttar Pradesh, and Haryana, we observe clear excess female mortality.
Female children experience higher child mortality in general, and the excess mortality is more severe in
families with more children. In general, excess female child mortality tends to increase with the number
of female children in the family. This result is consistent with earlier findings that discriminatory
practices are concentrated in families with several girls?7 A notable exception is found in Uttar Pradesh
among women with three or more children. There, female children with older brothers have higher
mortality than those with no brothers.'s Uttar Pradesh is among the poorest states in India. It is possible
37 Dag Gupta, 1987, loco cit. in fit. 8; Mohuri and Preston, loco cit. in fn. 8.
38 This pattern is consistent with the findings of an earlier survey in two rural districts of Uttar Pradesh, where girls with an olderbrother (but not those with an older sister) had a greater risk of dying (see George B. Simmons, Celeste Smucker, Stan Bernstein
21

that a girl with no brothers is less likely to be subject to increased mortality because there are no 'higher
status' competitors for limited resources. Immunological factors may also contribute to this finding. Aaby
et al. (1986) argue that for immunological reasons a child is more likely to become infected with measles
from an opposite-sex sibling than from a same-sex sibling.39 Significantly, Uttar Pradesh has the lowest
vaccination coverage of children for measles among the states included in this analysis.
In Orissa, there is also some evidence of net excess female child mortality. Among women with
two children, female children with an older brother have much higher child mortality than others. For
women with three or more children, girls in general have higher mortality than boys. The lowest
mortality is found not for the reference group but for boys with no sisters. Compared to this group, girls
with older female siblings have significantly higher child mortality. It should be noted that Orissa shows
an unusual pattern of age-specific mortality rates. Although the infant mortality rate in Orissa is the
highest among the states in India, the level of child mortality is quite low. The reasons for this unusual
pattern deserve more study but are not pursued here.
With the exception of Punjab, where excess female child mortality is very high, the general
pattern is that higher levels of fertility and mortality are associated with higher excess female child
mortality. In Uttar Pradesh, where the effect of family composition on fertility is moderate, its effect on
excess female child mortality is very strong. Whether states such as Uttar Pradesh and Rajasthan will
ultimately follow the pattern of Punjab (where excess female child mortality persists) or that of Tamil
Nadu (where there is no excess female mortality) is an interesting subject for further research.
ROLE OF DIFFERENTIAL PARITY PROGRESSION IN EXPLAININGEXCESS FEMALE CHILD MORTALITY
Our analysis shows that in states where excess female mortality is observed, parity progression is higher
after a female child. This raises the question: Can some of the excess female child mortality be explained
by the fact that daughters are more likely to be followed by a younger sibling after a very short interval?
We try to answer this question by comparing the effects offamily composition on child mortality with
and without controlling for the effect of the birth of the next child. The effect of family composition is
and Eric Jensen, 'Post-neonatal mortality in tural India: Implications of an economic model', Demography, 19 (3) (1982), pp.371-389).
" P. Aaby, et ai., 'Cross-sex transmission of infection and increased mortality due to measles', Review ofInfectious Diseases. 8(1) (1986). pp. 138-143.
22

almost unchanged at the fIrst and second parities in any state. At the third and higher parities, however,
the effect of family composition is reduced when the birth of the next child is introduced as a factor in
Orissa and Haryana (and to a smaller extent in Rajasthan and Punjab), namely in states with moderate or
low levels of child mortality (see Appendix Tables A7 and A8). In Uttar Pradesh, which has high levels
of both fertility and mortality, the effect did not change much. Little change was also registered in the
low-mortality states of Goa, Kerala, and Tamil Nadu. Overall, the mediating role of parity progression on
sex differentials in child mortality appears to be weak.
Our analyses show that the sex composition of children in the family affects subsequent fertility
behavior in every state examined. In seven out of the eight states, the results of the parity progression
hazard models indicate that there is a pronounced preference for sons. Because the effect is strongest in
the states with a moderate level of fertility, the overall effect is likely to increase in the short run as
fertility continues to fall in the popUlous northern states. The effects of family composition on excess
female child mortality are more complex. Female children with older sisters are often (but not always)
subject to the highest risks of mortality. Moreover, although excess female child mortality is generally
smaller in states with low levels of mortality, there are substantial variations. Overall, the analysis
suggests that son preference fundamentally affects demographic behavior. The patterns observed,
however, are by no means uniform throughout India, and they can be expected to continue in a state of
flux as fertility and mortality levels continue to decline.
POLICY IMPLICATIONS
The preference for sons that has been observed to varying degrees in every part of India has been shown
to adversely affect both fertility behavior and sex differentials in child mortality. The desire for sons
discourages some couples from discontinuing childbearing after reaching their desired number of
children because they have not yet had their minimum desired number of sons. It is difficult to quantify
the effect of son preference on fertility and family planning precisely, but a measure developed by
Arnold (1985) can be used to estimate this effect.40 In the case of contraceptive use, for example, the
measure assumes that in the absence of sex preference, all women at a given parity would use contra
ception to the same extent as women at that same parity with the most desirable sex composition of
children (Le., those with the highest contraceptive prevalence rate). According to this measure, the
national contraceptive prevalence rate would increase modestly, from its current level of 40.6 per cent to
40 Fred Arnold, 'Measuring the effect of sex preference on fertility: The case of Korea', DelTWgraphy. 22 (2) (1985), pp. 28(}.288.
23

45.5 per cent in the complete absence of sex preference. Although moderate, even an increase of this
magnitude would be a boon to the family welfare programme. Similarly, the unusually high degree of
excess female child mortality in almost all Indian states suggests that the strong preference for sons is
substantially diminishing the chances of survival of girls between one and four years of age. For these
reasons, a concerted effort to reduce son preference and increase the status of women is essential. Such
efforts would be admirable in their own right, but their potential demographic benefits provide a further
rationale for placing relevant policies and programmes at the top of the government's agenda
Any programme designed to effect changes of this nature will have to deal with the fact that the
preference for sons is deeply entrenched in India's cultural, religious, and social traditions. Nevertheless,
some key programmes can be suggested to promote equality.
The literacy gap between men and women has been closing over time, but women are still much
less likely than men to be literate and to have completed each level of education. Moreover, school-age
girls (age 6-14) are still much less likely to attend school than boys of the same age (59 per cent of girls
attend school compared with 76 per cent of boys). The NFHS has demonstrated that even basic literacy
for women can result in substantial improvements in the demographic and health situation.'1 Renewed
efforts are needed to close the female-male literacy gap and to fulfill the constitutional promise of
universal compulsory education for all of India's children. Because many parents are reluctant to send
their daughters to school even when adequate educational facilities are accessihle, achieving the goal of
educational equality will require not only the availability of school huildings and adequate personnel, but
also the expansion of innovative programmes such as the provision of free lunches at school, free
textbooks and school uniforms for children from poor families, and educational savings accounts for
girls. These types of programmes may increase the motivation of parents to send their daughters to school
or at least reduce the barriers to their attendance. The further expansion of adult female literacy
programmes should also be encouraged.
41 It should be noted, however, that the relationship between female litenlCy and excess female child mortality has not beendefinitively established in other studies. Several analysts have found that female literacy significantly reduces the femaledisadvantage in child survival in India (Mamta Murthi, Anne-Catherine Guio, and Jean Dreze, 'Mortality, fertility, and geoderbias in India', Population and Development Review, 21 (4) (1995), pp. 745-782; K. Bourne and G.M. Walker, 'The differentialeffect of mother's edocation on mortality ofboys and girls in India', Population Studies, 45 (2) (1991), pp. 203-219; S. Amin,'The effect of women's staluS on sex differentials in infant and child mortality in South Asia', Genus, 46 (3-4) (1990), pp. 55-{i9;Simmons et al., loco cit. in fn. 38). But an equal number of studies in the region have found weaker or contmy results (DasGupta, 1987, loco cit. in fn.8; A. Bhuiya and K. Streatfield, 'Mother's education and survival of female children in a rura1 area ofBangladesh', Population Studies, 45 (2) (1991), pp. 253-264; Alaka M. Basu. Culture, the Status o/Women and DemogroplJiJ:Behaviour (Oxford; Clarendon Press, 1992); Caldwell, Reddy, and Caldwell, op. cit in fn. 5).
24

-~--,---------
Although female children receive unfavorable treatment in many respects in particular states, at
the national level there is no evidence in the NFHS of systematic discrimination against girls in terms of
feeding practices or the nutritional status of young children. Girls are slightly less likely than boys to
have received all ofthe recommended childhood vaccinations, but the differences are not large (at age
12-23 months, when the basic series of immunizations should have been completed, 37 per cent of boys
and 34 per cent of girls have been fully vaccinated). With respect to childhood diseases, boys are slightly
rrwre likely to have been sick with each of the three conditions included in the survey (fever, diarrhea,
and acute respiratory infection) during the two weeks preceding the survey. The most substantial sex
difference in the care of children is in the treatment that children receive when they become ill. For each
of the three childhooddiseases mentioned above, boys are substantially more likely than girls to have
been taken to a health facility or health provider and to have received appropriate medical treatment.
These differences are undoubtedly an important factor underlying the excess female child mortality that
is documented in the NFHS and other data sources. The difference in medical treatment cannot be
explained simply by a lack of available health facilities, since parents are able to obtain medical
treatment for a large majority of their sons. Once again, the solution to this problem requires creative
approaches to encourage parents to seek medical care for their daughters on a par with their sons,
including the design of appropriate educational and motivational programmes.
A number of other beneficial policies or programmes could be recommended, but initiating and
implementing them will be difficult in the context of high levels of illiteracy, a lack of contact with the
mass media (half of women are not regularly exposed to any type of electronic mass media), the relative
isolation of women (more than three-quarters of women do not work outside the home), and a lack of
political will to tackle some of these seemingly intractable problems. Community-based programmes,
such as those in Indonesia or 'mothers' clubs' in South Korea, can overcome many of these barriers. In
addition, some laws which could improve the situation are already on the books, such as the minimum
legal age of marriage of 18 for women and laws against dowry, but enforcement efforts are negligible.
Son preference is likely to persist in India for some time, particularly in North India. It remains to
be seen how quickly the states with a strong son preference will move in the direction of the Southern
Indian states, which are characterized by a relative lack of son preference and a relatively weak impact of
son preference on demographic behavior. Leela Visaria cites some evidence of a general decline in son
preference and also notes that: 'There is evidence of inter-generational tensions and coIiflicts such that
some elderly are beginning to feel that daughters rather than sons are more dependable for emotional and
25

even financial support' .42 If these types of changes in the instrumental value of daughters and sons
become more widespread, son preference may become weaker even in Northern India, and the
demographic consequences of son preference highlighted in this article may become less important in the
future.
ACKNOWLEDGMENT
This is a revised version of a paper presented at the Annual Meeting of the Population Association of
America, 9-11 May 1996, New Orleans. We would like to express our appreciation to the United States
Agency for International Development, which provided funding for both the National Family Health
Survey and the research on which this article is based. Computer assistance provided by Lixia Qu and
Jonathan Chow, East-West Center, is gratefully acknowledged.
42 Visaria, Ioc. cit. in fn. 12. p.l7).
26
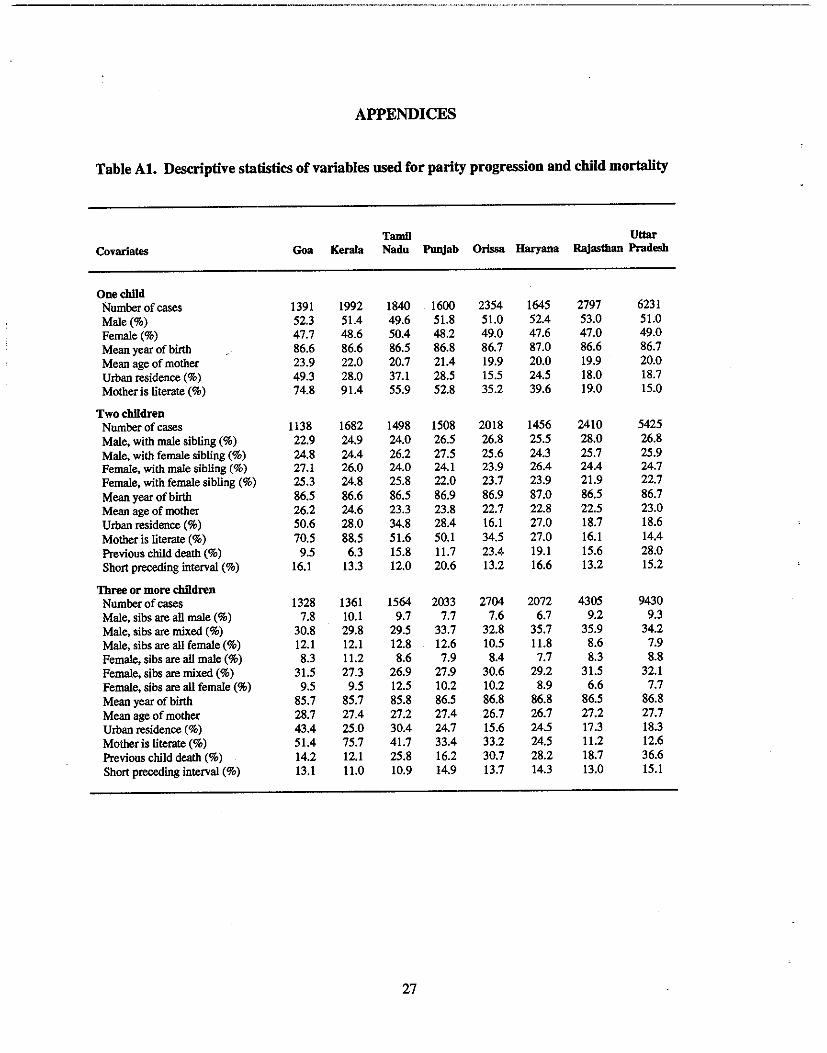
._--------------
APPENDICES
Table At. Descriptive statistics of variables used for parity progression and child mortality
Tamll UttarCovariates Goa Korala Nadu Punjab Orissa Haryana Rajasthan Pradesh
OnochildNumber of cases 1391 1992 1840 1600 2354 1645 2797 6231Male (%) 52.3 51.4 49.6 51.8 51.0 52.4 53.0 51.0Female(%) 47.7 48.6 50.4 48.2 49.0 47.6 47.0 49.0Mean year of birth 86.6 86.6 86.5 86.8 86.7 87.0 86.6 86.7Mean age of mother 23.9 22.0 20.7 21.4 19.9 20.0 19.9 20.0Urban residence (%) 49.3 28.0 37.1 28.5 15.5 24.5 18.0 18.7Motheris literate (%) 74.8 91.4 55.9 52.8 35.2 39.6 19.0 15.0
Two cblldronNumber of cases 1138 1682 1498 1508 2018 1456 2410 5425Male, with male sibling (%) 22.9 24.9 24.0 26.5 26.8 25.5 28.0 26.8Male, with female sibling (%) 24.8 24.4 26.2 27.5 25.6 24.3 25.7 25.9Female, with male sibling (%) 27.1 26.0 24.0 24.1 23.9 26.4 24.4 24.7Female, with female sibling (%) 25.3 24.8 25.8 22.0 23.7 23.9 21.9 22.7Mean year of birth 86.5 86.6 86.5 86.9 86.9 87.0 86.5 86.7Mean age of mother 26.2 24.6 23.3 23.8 22.7 22.8 22.5 23.0Urban residence (%) 50.6 28.0 34.8 28.4 16.1 27.0 18.7 18.6Mother is literate (%) 70.5 88.5 51.6 50.1 34.5 27.0 16.1 14.4Previous child death (%) 9.5 6.3 15.8 11.7 23.4 19.1 15.6 28.0Short preceding interval (%) 16.1 13.3 12.0 20.6 13.2 16.6 13.2 15.2
Three or more cblldrenNumber of cases 1328 1361 1564 2033 2704 2072 4305 9430Male, sibs are all male (%) 7.8 10.1 9.7 7.7 7.6 6.7 9.2 9.3Male, sibs are mixed (%) 30.8 29.8 29.5 33.7 32.8 35.7 35.9 34.2Male, sibs are all female (%) 12.1 12.1 12.8 12.6 10.5 11.8 8.6 7.9Female, sibs are all male (%) 8.3 11.2 8.6 7.9 8.4 7.7 8.3 8.8Female, sibs are mixed (%) 31.5 27.3 26.9 27.9 30.6 29.2 31.5 32.1Female, sibs are all female (%) 9.5 9.5 12.5 10.2 10.2 8.9 6.6 7.7Mean year of birth 85.7 85.7 85.8 86.5 86.8 86.8 86.5 86.8Mean age of mother 28.7 27.4 27.2 27.4 26.7 26.7 27.2 27.7Urban residence (%) 43.4 25.0 30.4 24.7 15.6 24.5 17.3 18.3Mother is literate (%) 51.4 75.7 41.7 33.4 33.2 24.5 11.2 12.6Previous child death (%) 14.2 12.1 25.8 16.2 30.7 28.2 18.7 36.6Short preceding interval (%) 13.1 11.0 10.9 14.9 13.7 14.3 13.0 15.1
27

Table A2. Life table estimates of percentage of cbildren who experience the birth of a yonngersibling before age 5
Number of children!Sex composition
TamD UttarGoa Kerala Nadn Punjab OrIssa Haryana Rajasthan Pradesh
One child, male 77 78 83 93
Two children, male with female 50 41 64 70sibling
Three or more children,' male with 30 34 33 30both male and female siblings
Four or more children,b male withboth male and female siblings
Five or more children, male withboth male and female siblings
'Exactly three children for Haryana, Rajasthan, and Uttar Pradesh"Exactly foUr children for Uttar Pradesh
Table A3. Life table estimates of cbild mortality
83
78
45
91
81
42
41
86
84
61
50
90
83
72
67
64
Nnmber ofchildren!Sex composition
Tamil UttarGoa Kerala Nadu Punjab Orissa Haryana Rajasthan Pradesh
One child, male 8 2 18 7 10 18 26 34Two children, male with 5 12 13 15 10 16 17 30
a female sibling
Three or more children, 14 16 27 21 18 13 23 31male with both maleand female siblings
28

-----------_.__.._..__----_ __ _..
Table A4. Gross effects (relative risks) ofsex oflast child and sex combination of older siblings onparity progression, estimated by hazard models
Number ofcbildrenlSex composition Goa
TamilKerala Nadn
UttarPunjab Orissa Haryana Rajasthan Pradesh
OnecbildMaleFemale
Two childrenMale, with male siblingMale. with female siblingFemale. with male sibling'Female, with female sibling
Three or more cbildrena
Male, sibs are ail maleMale, sibs are mixedMale, sibs are ali femaleFemale, sibs are all maleFemale. sibs are mixedFemale, sibs are ail female
Fonr or more cbildrenb
Male, sibs are all maleMale, sibs are mixedMale. sibs are ail femaleFemale, sibs are all maleFemale, sibs are mixedFemale, sibs are ail female
Flve or more cbildrenMale, sibs are ail maleMale. sibs are mixedMale, sibs are all femaleFemale, sibs are all maleFemale, sibs are mixedFemale, sibs are all female
0.88* 0.98 0.95 0.97 0.87** 0.99 0.88** 0.92**(ref) (ref) (ref) (ref) (ref) (ref) (ref) (ref)
1.01 1.35** 0.85 0.68** 0.79** 0.77** 0.82** 0.92*(ref) (ref) (ref) (ref) (ref) (ref) (ref) (ref)0.97 0.87 0.74** 1.03 0.92 1.16 0.94 1.051.47** 1.29** 1.38** 1.43** 1.25** 1.42** 1.18** 1.25**
1.19 1.03 1.44** 1.50** 1.27** 1.23 0.90 1.04(ref) (ref) (ref) (ref) (ref) (ref) (ref) (ref)1.62** 0.89 1.26 2.01** 1.58** 1.98** 1.41** 1.20*0.81 0.83 1.02 1.12 1.12 1.24 0.85 1.031.40** 1.17 1.06 2.25** 1.34** 2.25** 1.46** 1.36**2.20** 1.10 1.96** 4.25** 2.25** 3.01** 1.84** 1.53**
1.49 1.14 0.94(ref) (ref) (ref)1.67** 1.60** 1.180.95 0.97 1.031.62** 1.30** 1.19**3.26** 2.17** 1.52**
1.12(ref)1.69**1.131.101.21
Note: The effects are estimated by proportional hazard models using the BMDP2L program.(ref): Reference group*p<O.lO**p < 0.05•Exactly three children for Haryana, Rajasthan, and Uttar PradeshbExactly four children for Uttar Pradesh
29

Table AS. Net effects (relative risks) of sex of last child and sex combination of older siblings onparity progression, estimated by hazard models
TamD UttarCovarlates Goa Kerala Nadu Punjab OrIssa Haryana Rajasthan Pradesh
One childMale 0.87 1.01 0.94 0.97 0.86" 0.98 0.87*' 0.92"Female (ref) (ref) (ref) (ref) (ref) (ref) (ref) (ref)Urban residence 0.89' 1.13" 0.99 0.93 1.07 0.97 0.97 1.09*'Mother is literate 0.89' 0.72*· 1.04 1.01 1.23·· 1.03 1.02 U16Year of birth 0.95" 0.95" 0.98" 0.98" 0.97" 1.00 0.96" 0.98**Mother's age 0.90*' 0.96" 0.96" 0.96*· 0.95" 0.95" 0.98" 0.96"Child death' . 1.60*' 1.47" 1.34·· 1.32" 1.20*' 1.25·· 1.21" 131··
Two childrenMale, with male sibling 1.10 1.29" 0.88 0.62" 0.80*' 0.74" 0.80*' 0.91"Male, with female sibling (ref) (ref) (ref) (ref) (ref) (ref) (ref) (ref)Female, with male sibling 1.00 0.82 0.75" 1.03 0.89 1.12 0.94 1.05Female, with female sibling 1.83" 1.24' 1.44·· 1.39" 1.31" 1.32" 1.14' 1.24··Urban residence 0.85' 0.89 0.87 0.81" 0.92 0.85·· 0.82·· 0.79*'Mother is literate 0.81" 0.57" 0.84" 0.67" 1.01 0.74" 0.75" 0.95Year of birth 0.93" 0.90*' 0.95" 0.97** 0.95" 0.94·· 0.93" 0.96"Mother's age 0.90*' 0.90*' 0.92" 0.93" 0.93" 0.94" 0.96·· 0.94··Child death' 1.89" 1.70" 1.37" LSI" 1.47" 1,60*' 1.23·· 1.37*'Short preceding interval 1.10 0.89 1.01 1.15' 1.04 0.98 1,09 1.04
Three or more children"Male, sibs are all male 1.14 1.19 1.48' 1,33' 1.17 1.04 0.90 1.00Male, sibs are mixed (ref) (ref) (ref) (ref) (ref) (ref) (ref) (ref)Male, sibs are all female 1,89" 1.09 1.26 2.26" 1.59*' 2.20*' 1.49*' 1.20*'Female, sibs are all male 0.78 1.09 0.90 0.93 1.05 1.15 0.84 0.97Female, sibs are mixed 1.46·· 1.19 1.08 223·· 1.34·· 2.24" 1.40" 1.32"Female, sibs are all female 2.48" 1.41' 2.03" 3.79" 2.13" 3.00*' 1,76" 1.45"Urban residence 0.76" 0.80' 1.05 0.84" 0.82" 0.88 0.90 0.78*'Mother is literate 0.80" 0.79" 0.73" 0.58" 0.92 0.57" 0.67" 0.82"Year of birth 0.92' 0.95" 0.88·· 0.96" 0.94·· 0.95" 0.92" 0.95"Mother's age 2.91·· 0.8S·· 0.95·· 0.92·· 0.94"'· 0.94·· 0.91·· 0.95··Child death' 1,76" 1,65" 1.73" 1.54·· 1.71' 1.66" 1.67*' 1.48··Shnrt preceding interval 1.03 1.04 LSI" 1.08 1.02 1.03 1.35" 1.22"Birth order 0.99 1.56" 1.02 0.99 0.98
30

Table AS. Continued.
Covariates GoaTamlI
Kerala NaduUttar
Punjab Orissa Haryaua Rajastbau Pradesh
Four or more chlldrenc
Male, sibs are all maleMale, sibs are mixedMale, sibs are all femaleFemale, sibs are all maleFemale, sibs are mixedFemale, sibs are all femaleUrban residenceMother is literateYear of birthMother's ageChild death'Short preceding intervalBirth order
Five or more childrenMale. sibs are all maleMale, sibs are mixedMale, sibs are all femaleFemale, sibs are all maleFemale, sibs are mixedFemale, sibs are all femaleUrban residenceMother is literateYear of birthMother's ageChild death'Short preceding intervalBirth order
1.37(ref)2.21**1.251.71**4.35**0.78**0.39**0.96**0.97**1.51**1.200.97
1.05(ref)1.69**0.901.26**2.14**0.910.55**0.93**0.97**1.71**1.101.02
0.98(ref)1.160.911.16**1.42**0.82**0.76**0.94**0.94**1.45**1.18**
1.13(ref)1.74**1.091.15**1.240.900.76**0.96**0.94**1.62**1.131.21**
Note: The effects are estimated by proportional hazard models using the BMDPZL program.(ref): Reference group*p<O.1O**p<O.OS'Child death is a time dependent dummy variable indicating the death of any child among those who were surviving at the time ofbirth of the index child with a 12 months lag.'Exactly three children for Haryana, Rajasthan, and Uttar Pradesh'Exactly four chiidren for Uttar Pradesh
31

Table A6. Gross effects (relative risks) of sex oflast child and sex combination ofolder siblingson child mortality, estimated by hazard models
Number of children! TamH UttarGoa" KeraJa' •Sex composition Nadn Punjab OrIssa Haryana Rajaslban Pradesh
One childMale 1.37 I.l7 I.l2 0.75 0.89 0.65 0.87 0.73"Female (ref) (ref) (ref) (ref) (ref) (ref) (ref) (ref)
Two childrenMale, with male sibling ne nc 1.48 ne 1.47 1.25 1.04 1.24Male, with female sibling (ref) (ref) (ref) (ref) (ref) (ref) (ref) (ref)Female, with male sibling nc nc 1.08 ne 3.04· 1.43 2.38·· 1.80*.Female, with female sibling nc nc 1.02 ne 1.90 3.12· 1.91 1.66··
Three or more childrenMale, sibs are all male ne nc 0.73 0.74 0.43 1.85 I.l6 1.34Male, sibs are mixed (ref) (ref) (ref) (ref) (ref) (ref) (ref) (ref)Male, sibs are all female nc nc I.lI 0.67 0.93 0.74 0.65 0.97Female, sibs are all male nc ne 1.26 1.70 I.l2 2.14 I.lS 2.43·'Female, sibs are mixed nc ne 1.24 0.93 1.80 3.67·· 1.34 238··Female, sibs are all female nc nc 1.43 2.64·· 2.20 3.00a· 2.20". 136
Note: The effects are estilQ3led by proportional bazanl models using the BMDP2L program.(ref): Reference groupDC: The estimation procedure did not converge.•p < 0.10··p<0.05"Models for Goa and Keral. include all births of order.1-6.bThe first model for Punjab is for 1-2 children combined.
32

Table A7. Net effects (relative risks) of sex oflast child and sex combination of older siblings onchild mortality estimated by hazard models, not controlling for the birth of the next child
Tamil UttarGoa'
, bCovarlates Kerala Nadu Punjab Orissa Haryana Rajasthan Pradesh
OuechlldMale 1.38 1.19 1.12 0.75 0.88 0.65 0.87 0.72**Female (ref) (ref) (ref) (ref) (ref) (ref) (ref) (ref)Urban residence 0.74 0.52 0.47 1.20 0.91 0.80 0.34** 0.51**Mother is literate 0.83 0.51* 0.50 0.23** 0.23** 0.68 0.49 0.81Year of birth 0.94 0.91 0.84** 1.07 0.99 0.94 1.01 0.93**Mother's age 0.95 0.95 0.85** 1.07 1.04 0.94 0.98 0.93**Previous child death 0.81 0.57 3.20*Short preceding interval 2.09 0.52 2.38*Birth order 1.28 1.58** 0.57
TwochlldrenMale, with male sibling nc nc 1.51 nc 1.59 1.24 1.07 1.25Male, with female sibling (ref) (ref) (ref) (ref) (ref) (ref) (ref) (ref)Female, with male sibling nc nc 1.07 nc 3.39** 1.52 2.45** 1.82**Female. with female sibling nc nc 1.03 nc 1.93 2.88** 1.89 1.65**Urban residence nc nc 0.87 nc 1.27 0.66 0.49 0.68*Mother is literate nc nc 0.42** nc 0.27** 0.11** 0.12** 0.70Year of birth nc nc 1.05 nc 1.07 0.94 1.02 0.96**Mother's age nc nc 0.93 nc 0.85** 1.10* 0.96 0.93**Previous child death nc nc 1.53 nc 0.62 0.53 2.12** 1.44**Short preceding interval nc nc 0.61 nc 2.10* 4.24** 1.32 1.36*
Three or more chlldrenMale, sibs are all male nc nc 0.70 0.69 0.50 1.99 1.10 1.24Male, sibs are mixed nc nc (ref) (ref) (ref) (ref) (ref) (ref)Male, sibs are all female nc nc 1.06 0.75 0.94 0.85 0.64 0.93Female, sibs are all male nc nc 0.23 1.39 1.03 2.32 1.18 2.19**Female. sibs are mixed nc nc 1.19 0.88 1.82 3.65** 1.35 2.31**Female, sibs are all female nc nc 1.41 2.30* 2.33* 3.26* 2.25** 1.29Urban residence nc nc 0.74 0.92 0.56 1.08 0.49* 0.37**Mother is literate nc nc 0.61 0.59 0.65 0.30** 0.66 0.57**Year of birth nc nc 0.85** 0.95** 1.08 1.01 0.96* 0.94**Mother's age nc nc 1.00 0.90** 1.01 0.92 0.97 0.99Previous child death nc nc 1.21 1.39 1.92* 1.38 2.35** 1.32*Short preceding interval nc nc 1.21 1.97* 3.30** 2.20** 1.49 2.64**Birth order nc nc 0.92 1.07 0.86 1.28 1.03 0.92
Note: The effects are estimated by proportional hazard models using the BMDP2L program. Blank entries indicate that thecovariate is not included in the estimation modelnc: The estimation procedure did not converge.*p<O.lO**P < 0.05
'Models for Goa and Kerala include all births of order 1-6.bThe first model for Punjab is for 1-2 children combined.
33

Table AS. Net effects (relative risks) ofsex of last child and sex combination of older siblings onchild mortality estimated by hazard models, controlling for the birth of the next child
Tanill Uttar• • •Covarlates Goa KeraIa Nadu l'w\Iab Orissa Haryana~ Pr3desh
One childMale 1.37 1.19 1.12 0.78 0.92 0.65 0.88 0.72*Female (ref) (ref) (ref) (ref) (ref) (ref) (ref) (ref)Urban residence 0.73 0.52 0.47 1.23 0.88 0.80 0.34·· 0.49**Mother is literate 0.82 0.52* 0.50 0.23** 0.22* 0.68 0.49 0.81Year ofbirtb 0.94 0.96 0.85*· 1.00 1.00 0.94 1.02 0.93··Mother's age 0.95 0.96 0.85** 1.08 1.05 0.94 0.98 0.94··Previous child death 1.12 0.55 3.01*Short preceding interval 2.09 0.52 2.T1*Birth order 1.29 1.59** 0.59,Birtb of next child 0.66 1.71 1.24 2.35* 2.36 0.53 1.61 1.52**
TwochildreuMale, with male sihling nc nc 1.53 nc 1.72 1.22 1.10 1.26Male, with female sibling (ref) (ref) (ref) (ref) (ref) (ref) (ref) (ref)Female, with male sibling nc nc 1.10 nc 3.45** 1.54 2.46" 1.80**Female, with female sibling nc nc 1.00 nc 1.83 2.98** 1.85 1.61**Urban residence nc nc 0.86 nc 1.29 0.66 0.49 0.69*Mother is literate nc nc 0.43* nc 0.28** 0.11** 0.12** 0.70Year of birtb nc nc 1.05 nc 1.09 0.95 1.03 0.97**Mother's age nc nc 0.93 nc 0.86** 1.09* 0.96 0.93··Previous child death nc nc 1.53 nc 0.63 0.53 2.100* 1.42**Short preceding interval nc nc 0.60 nc 1.95 4.22·· 1.31 1.35,Birtb of next child nc nc 1.58 nc 3.03*· 0.51 2.000* 1.60**
Three or more childrenMale, sibs are all male nc nc 0.64 0.69 0.50 2.02 1.12 1.25Male. sibs are mixed nc nc (ref) (ref) (ref) (ref) (ref) (ref)Male, sibs are all female nc nc 1.00 0.75 0.90 0.74 0.61 0.93Female, sibs are all mille nc nc 0.24 1.39 1.01 2.29 1.18 2.18**Female, sibs are mixed nc nc 1.13 0.88 1.70 3.02** 1.31 2.T/**Female, sibs are all female nc nc 1.21 2.23** 2.06 2.60 2.11** 1.26Urban residence nc nc 0.72 0.92 0.57 1.09 0.49* 0.37**Mother is literate nc nc 0.65 0.59 0.64 0.35** 0.69 0.58--Year of birth nc nc 0.87* 0.96·· 1.10 1.01 0.97 0.94··Mother's age nc nc 1.01 0.90*- 1.03 0.92- 0.97 1.00Previous child death nc nc 1.20 1.39 1.93-* 1.28 2.28*- 1.28*Short preceding interval nc nc 1.07 1.97* 3.27·· 2.OS·· 1.47 2.52"Birtb order nc nc 0.90 1.07 0.84 1.32 1.04 0.93,
1.96**Birtb of next child nc nc 4.000* 1.21 2.68-- 3.84** 1.74··
Notes: The effects are estimated by proportional hazard models using the BMDP2L program. Blank enlries mean that thecovariate is not included in the estimation modelnc: The estimation procedure did not converge.*p < 0.10**p<0.05•Models for Goa and Kerala include all birtbs of order 1-6.bThe first model for Punjab is for 1-2 children combined.
c Birtb of next child is a time-dependent dummy variable.
34